Submitted:
16 July 2024
Posted:
17 July 2024
You are already at the latest version
Abstract
Keywords:
1. Introduction
2. Materials and Methods
2.1. Adsorbent and Materials
2.2. Inverse Gas Chromatography
2.3. Thermodynamic Methods
2.3.1. Dispersive and Polar Energies, and Lewis’s Acid-Base Parameters
2.3.1. London Dispersive Surface Energy, and Lewis’s Acid-Base Surface Energies
3. Results
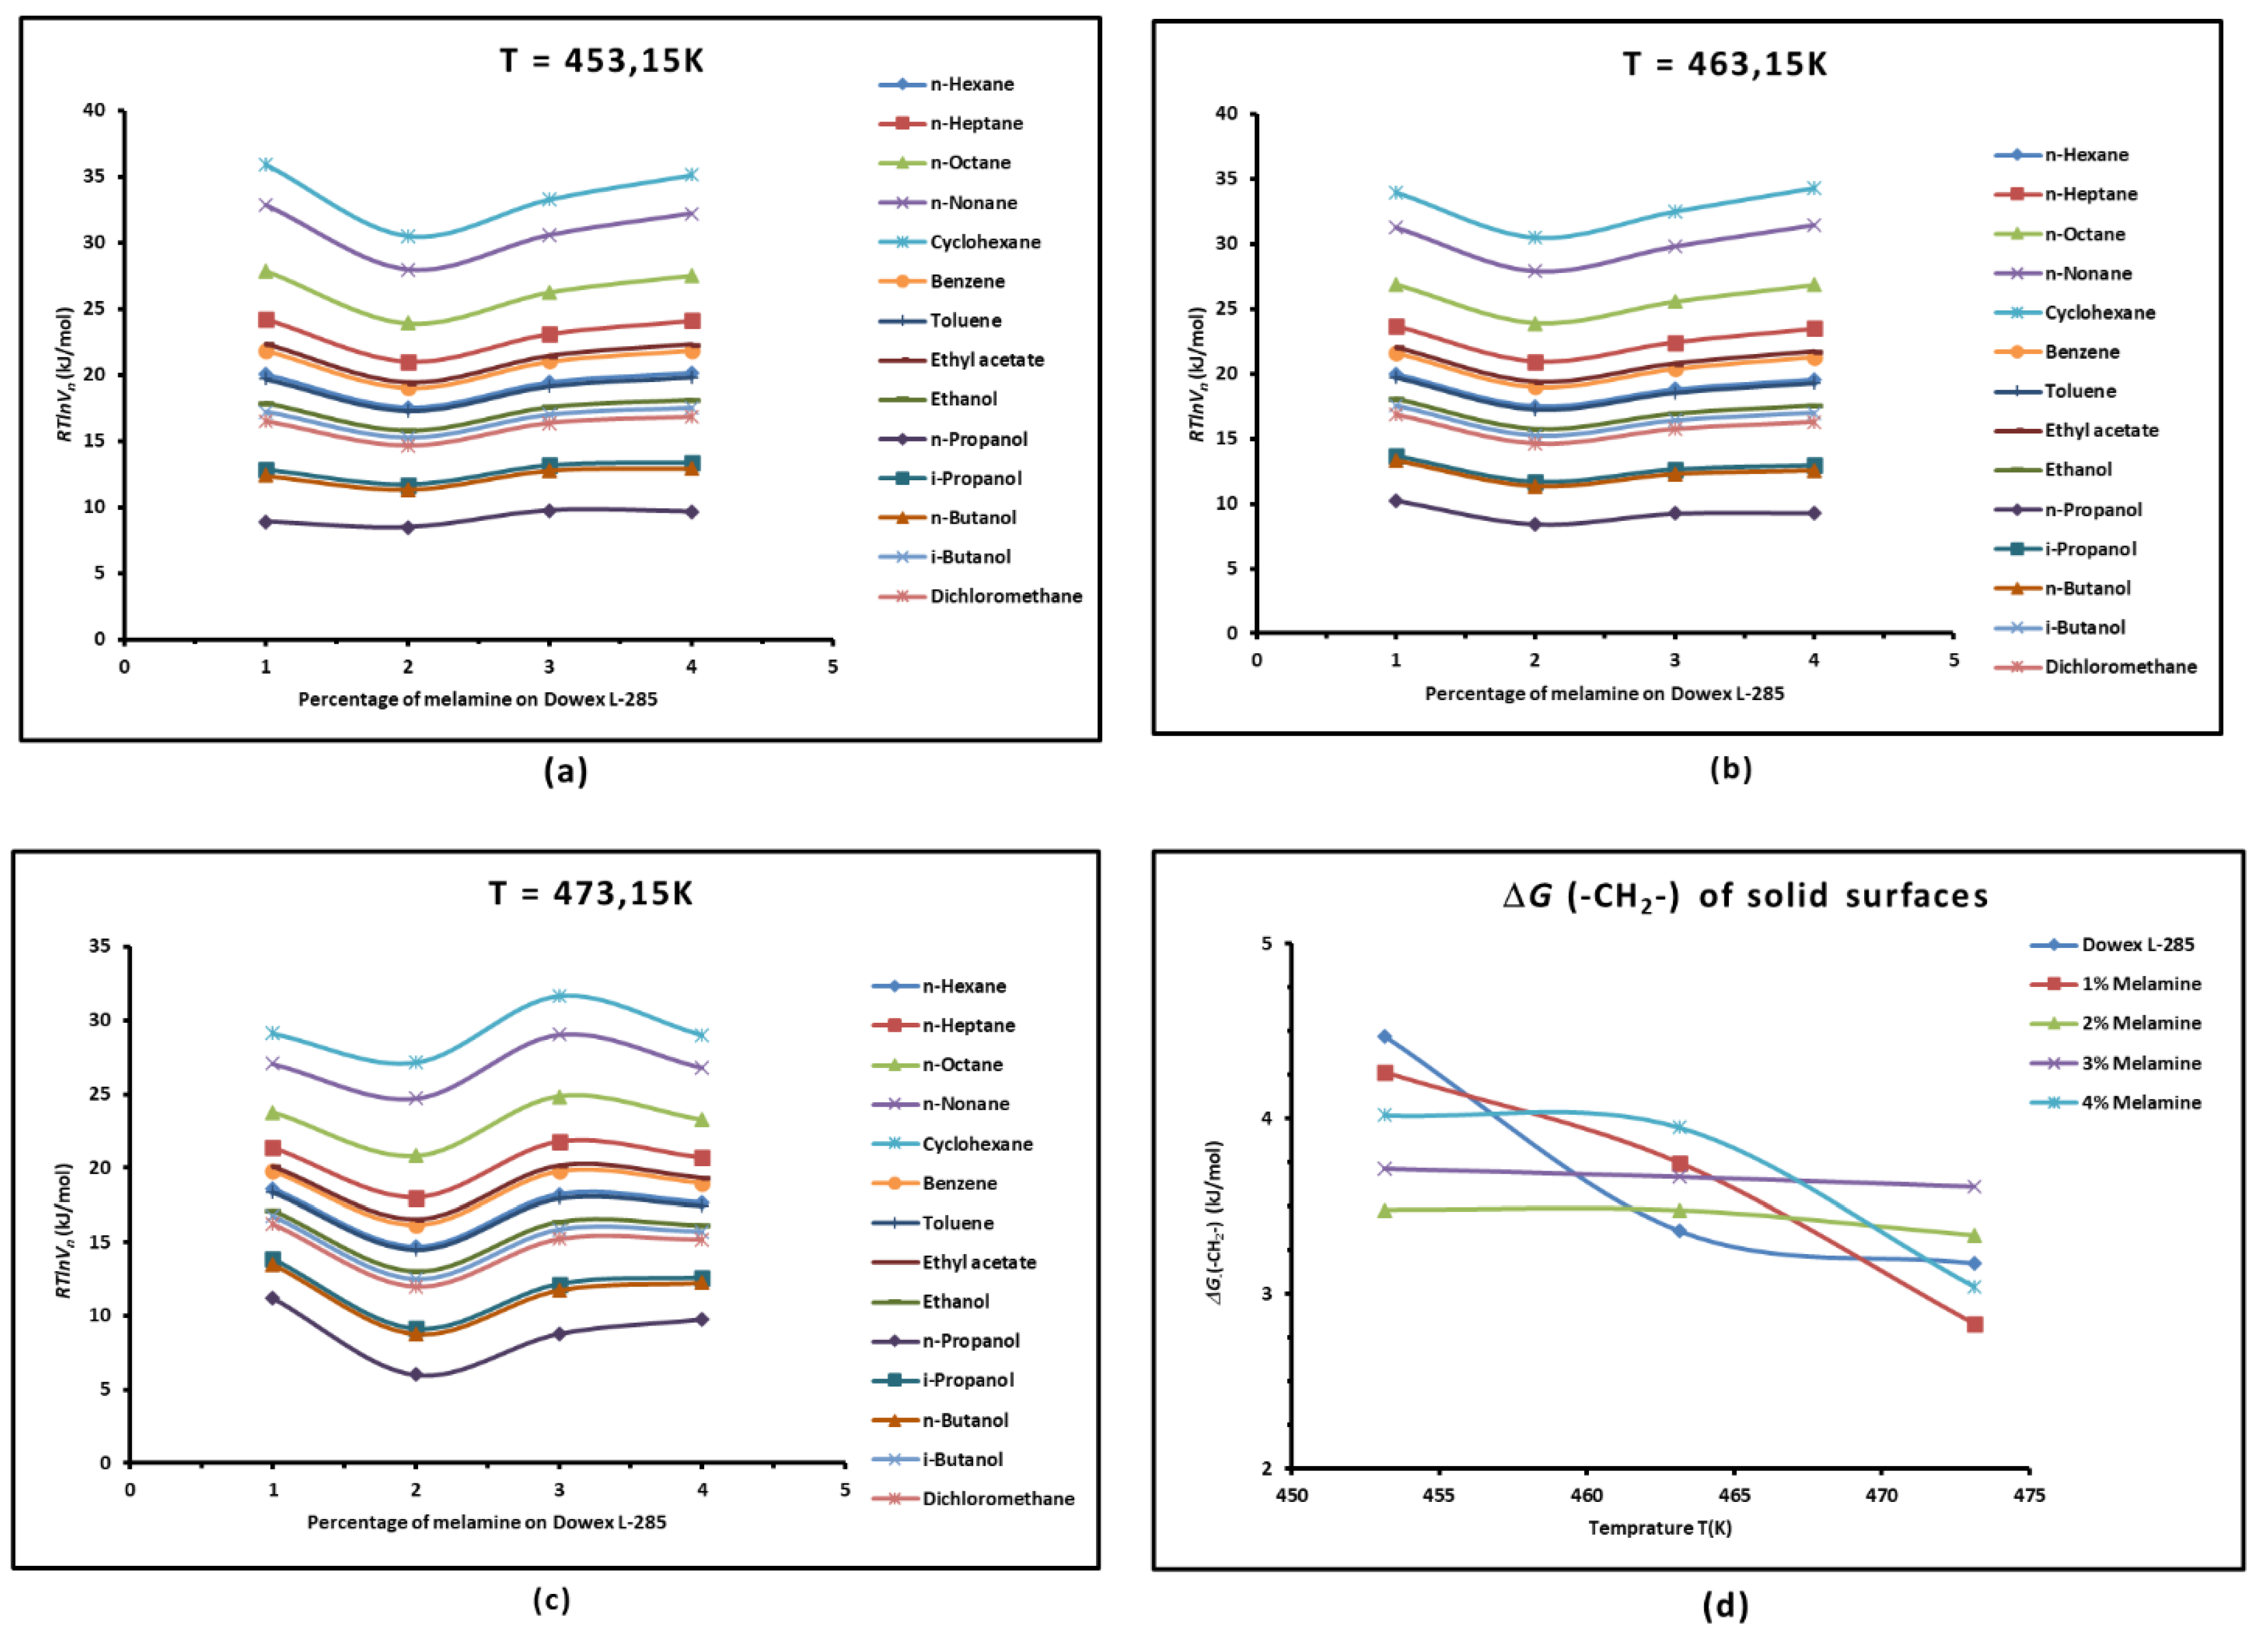
3.1. Variations of of Adsorbed Probes against the Temperature
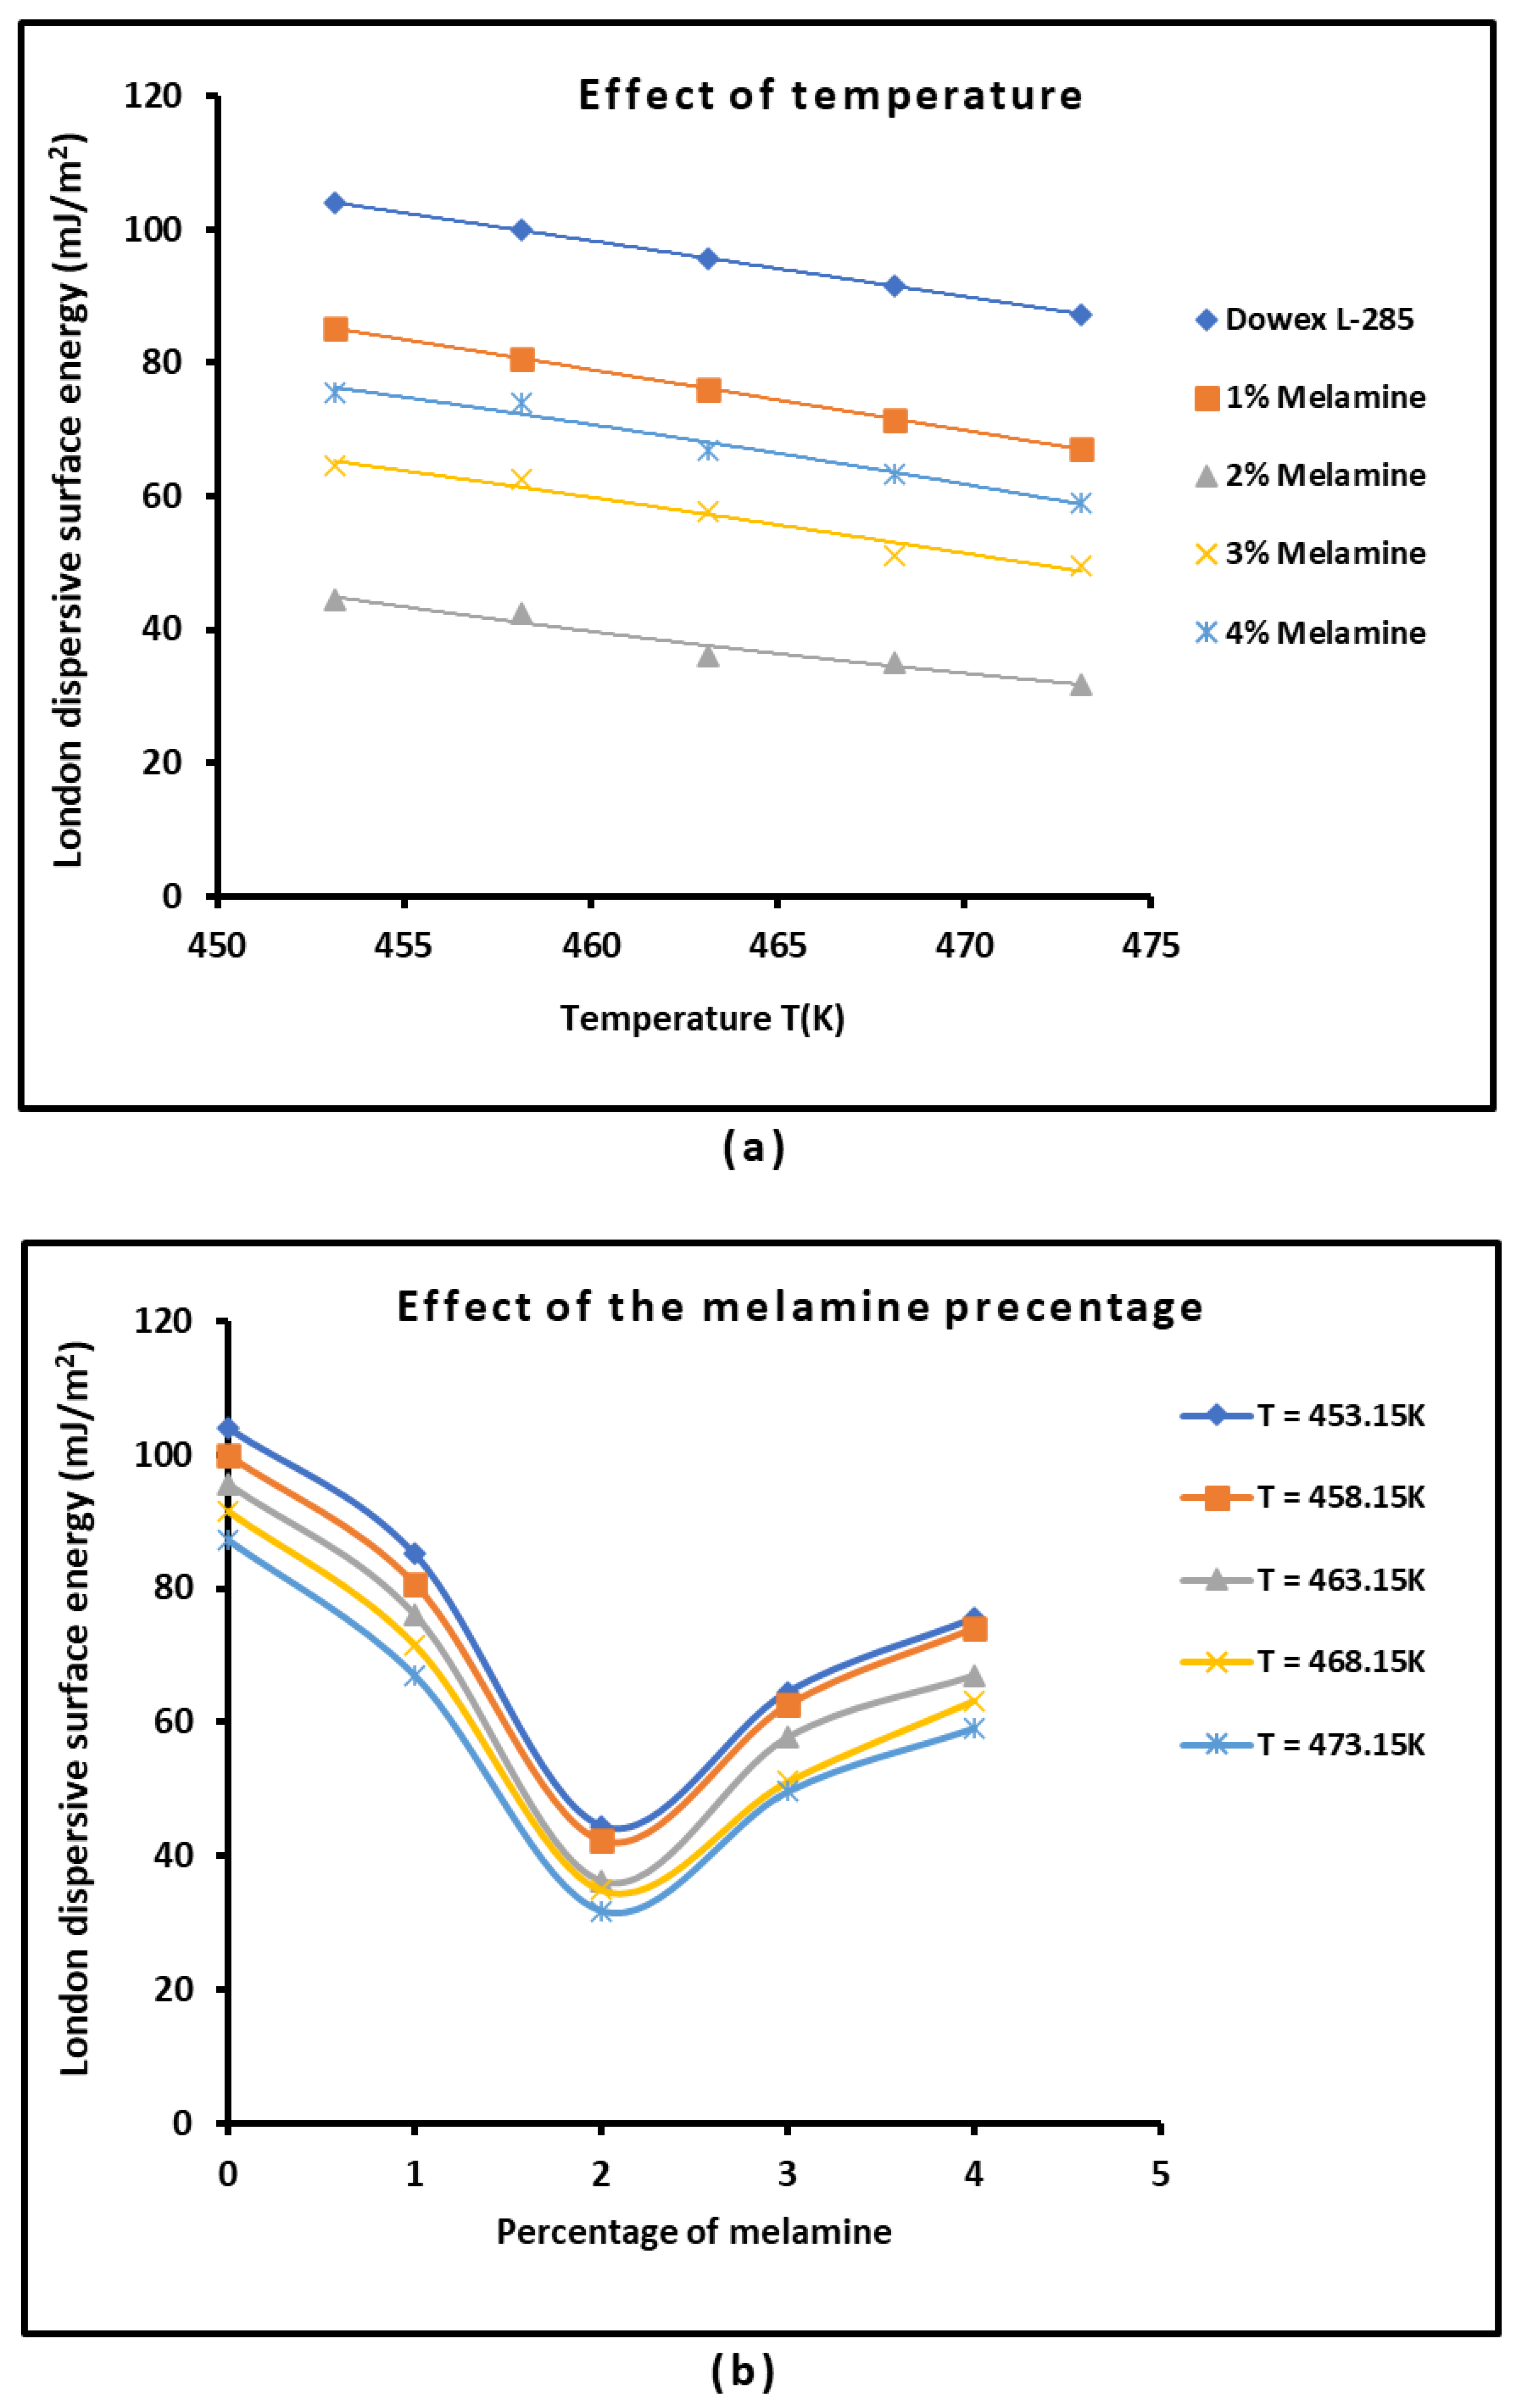
3.2. London Dispersive Surface Energy of Dowex L-285 with Different Melamine Percentages
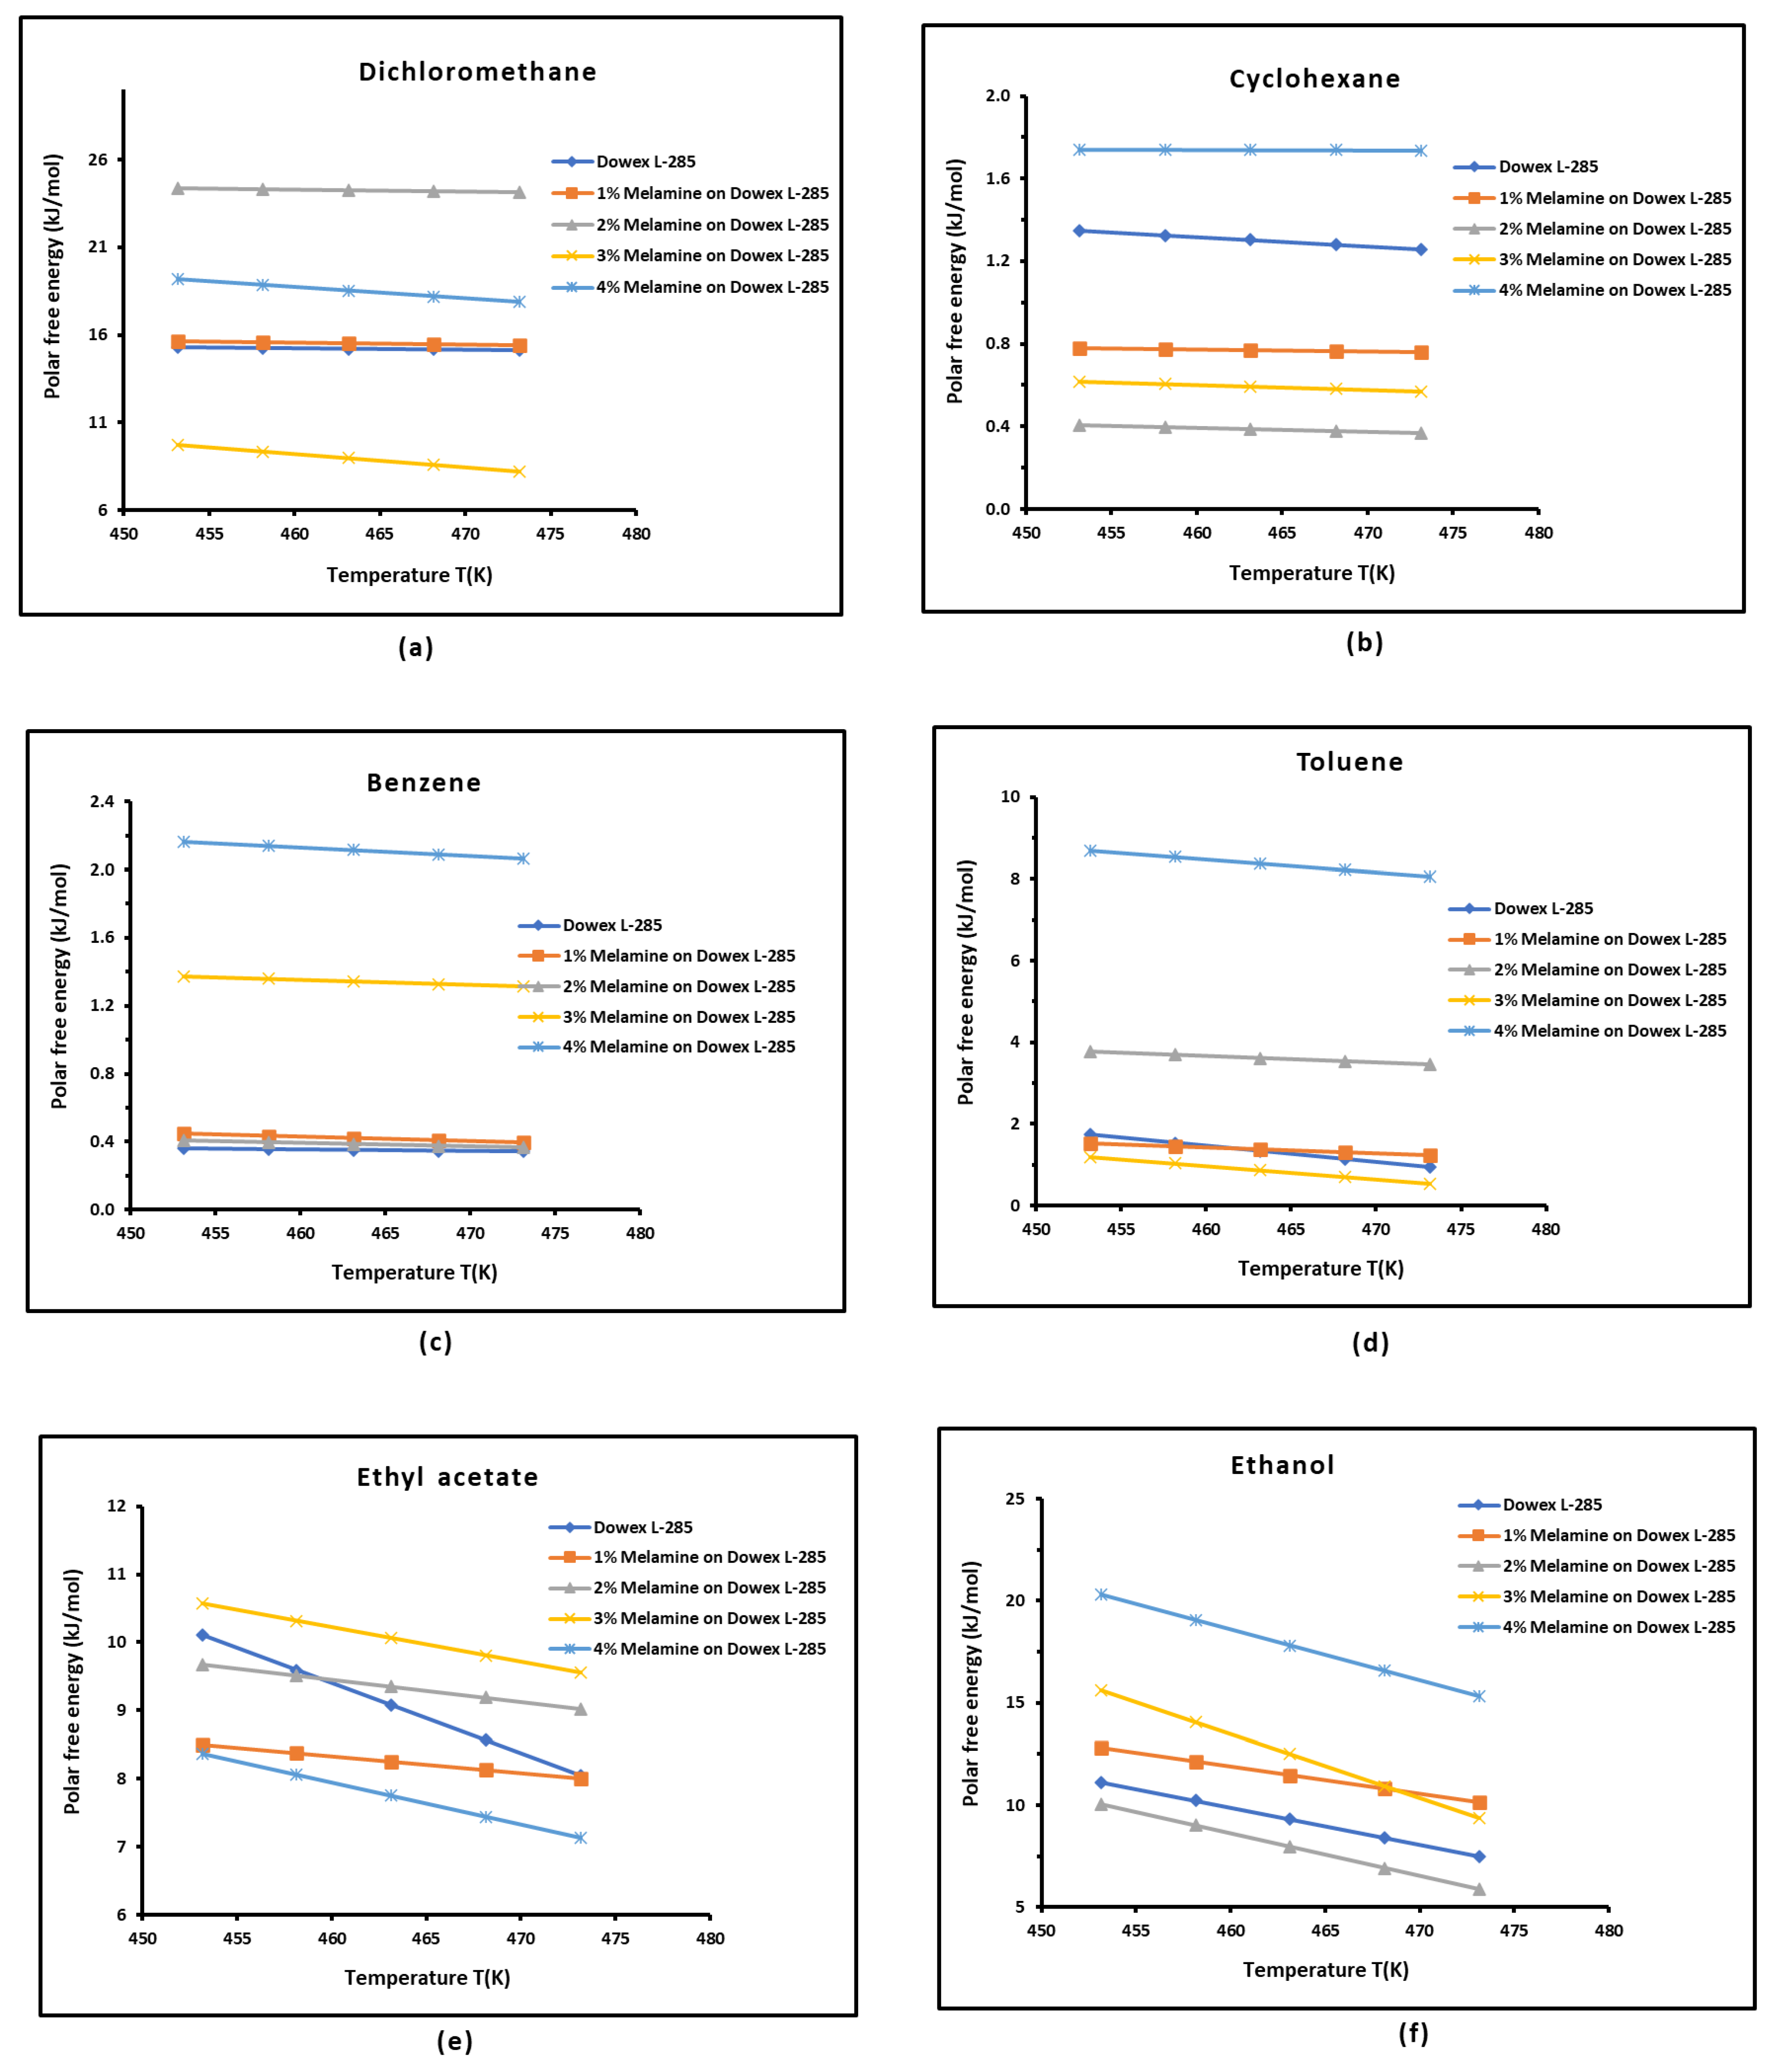
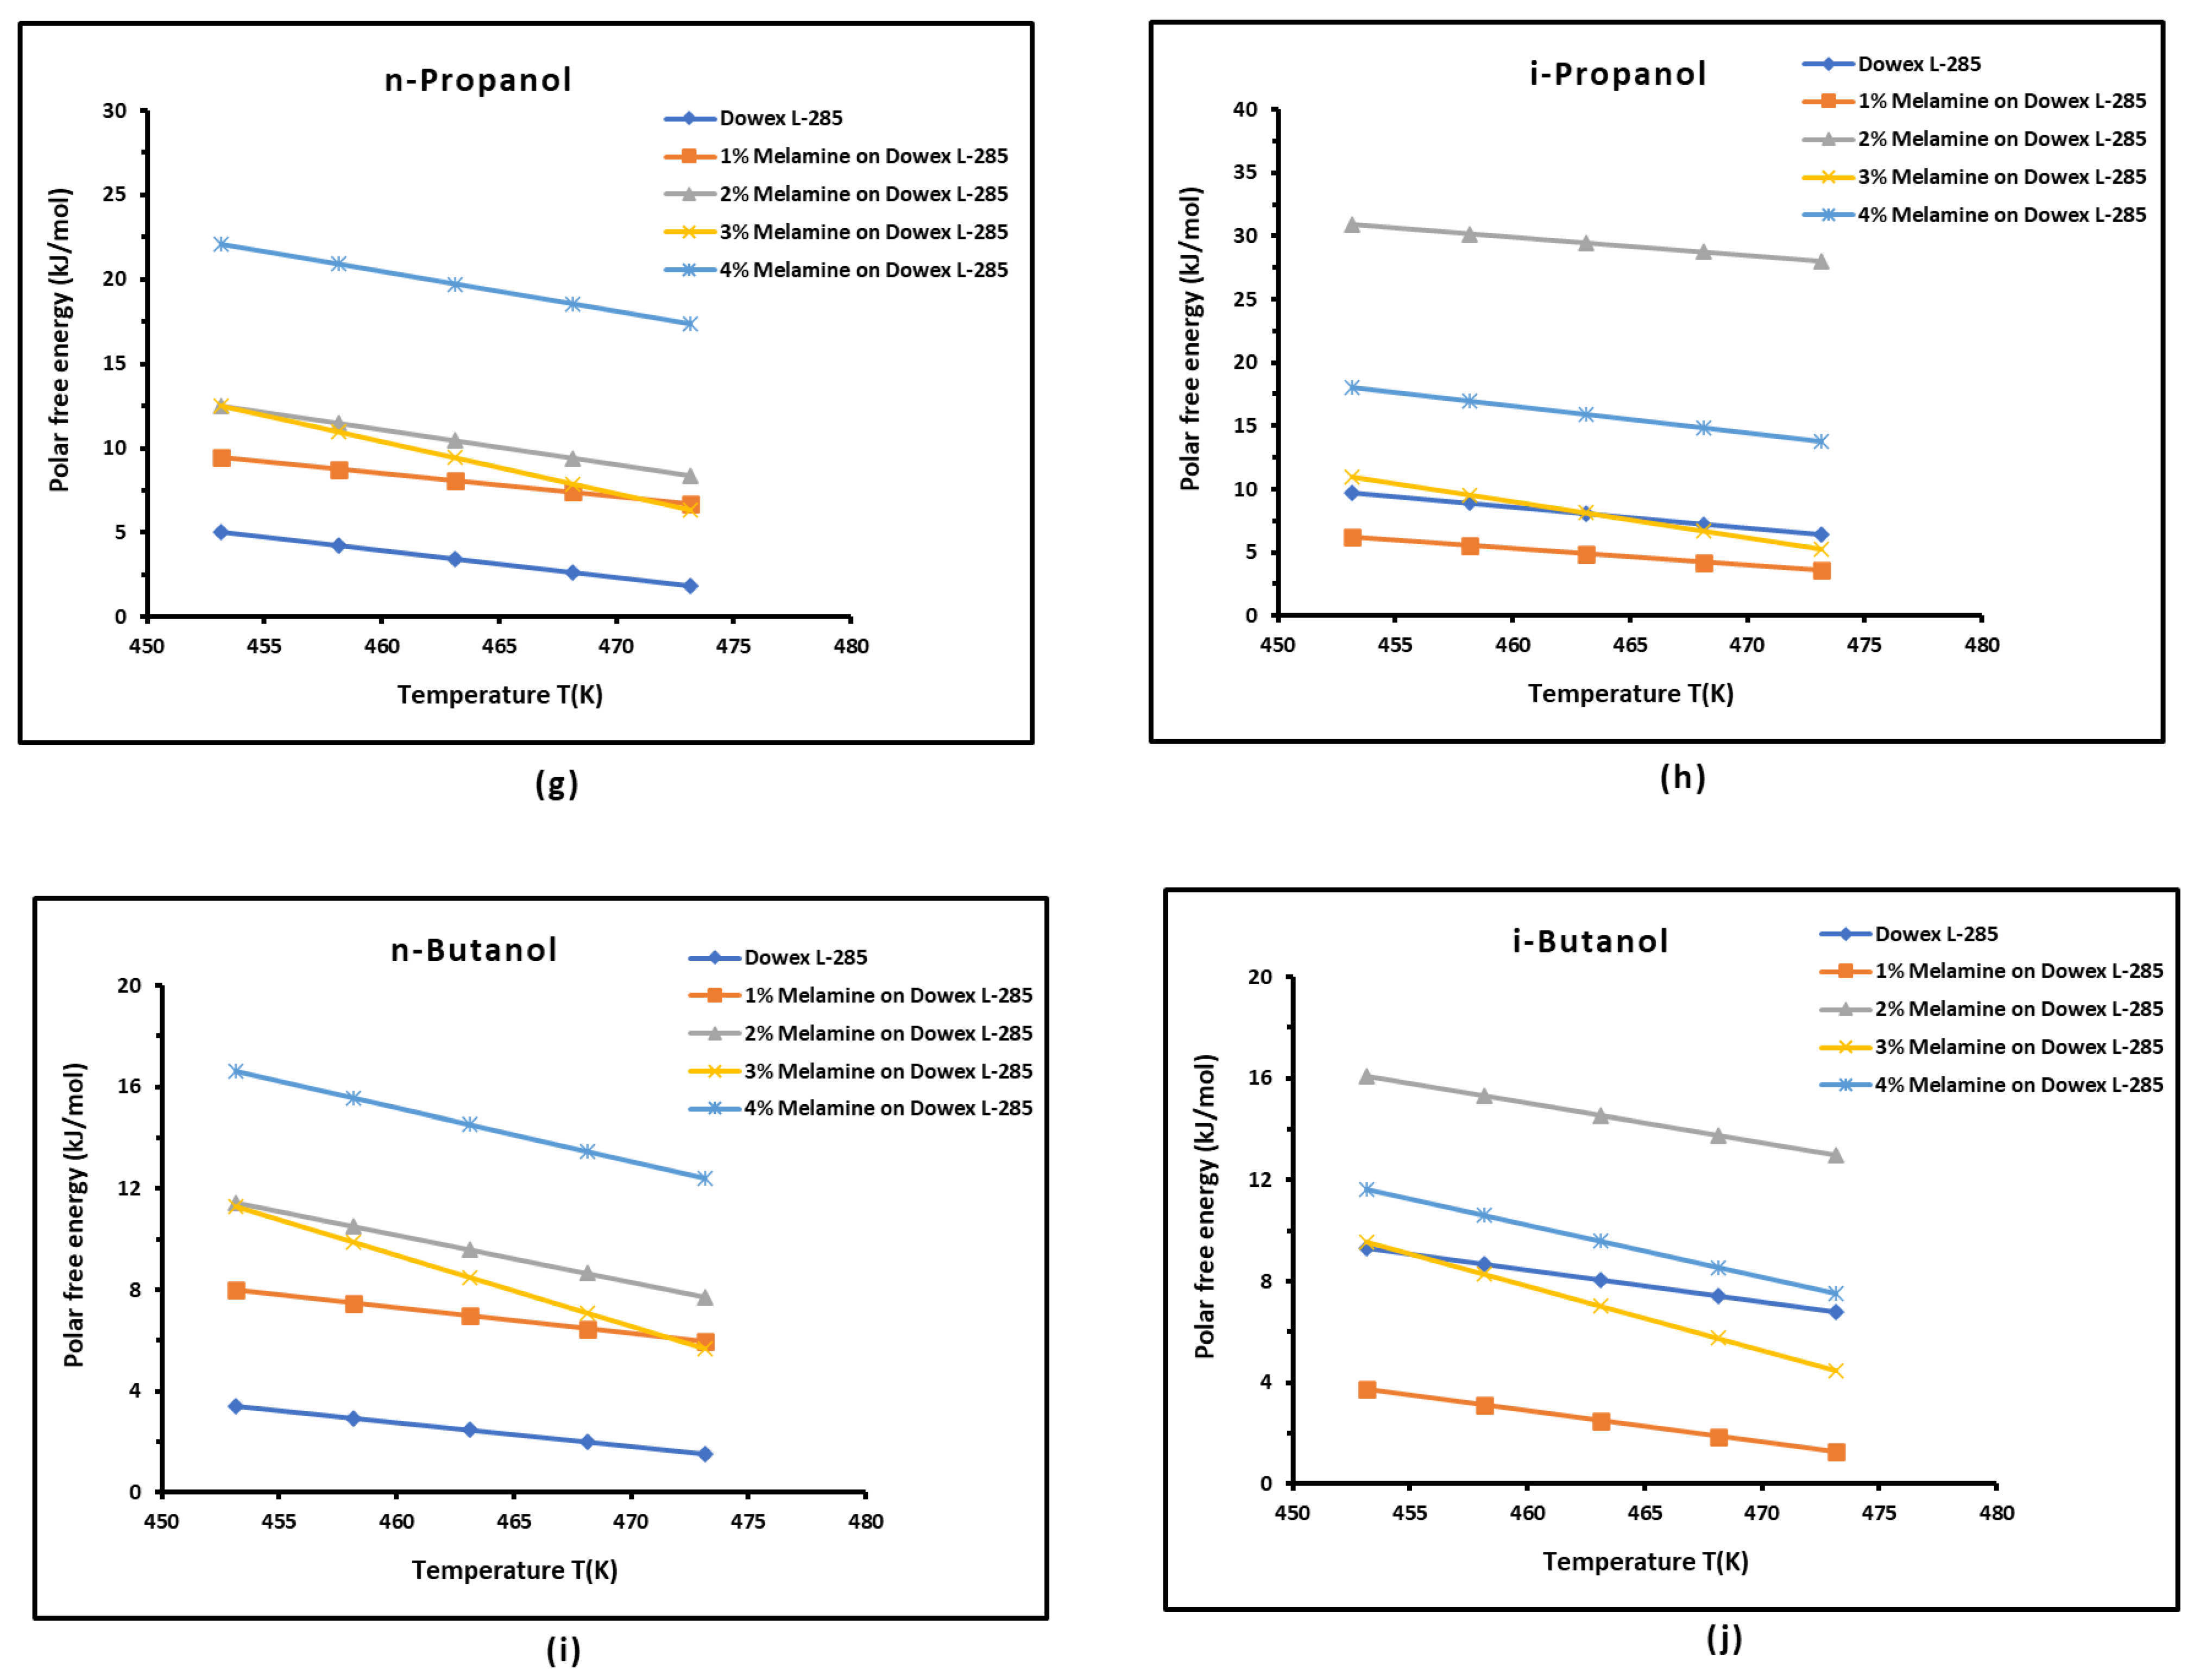
3.3. Polar Free Interaction Energy of Dowex L-285 Modified by Melamine with the Polar Probes
- -
-
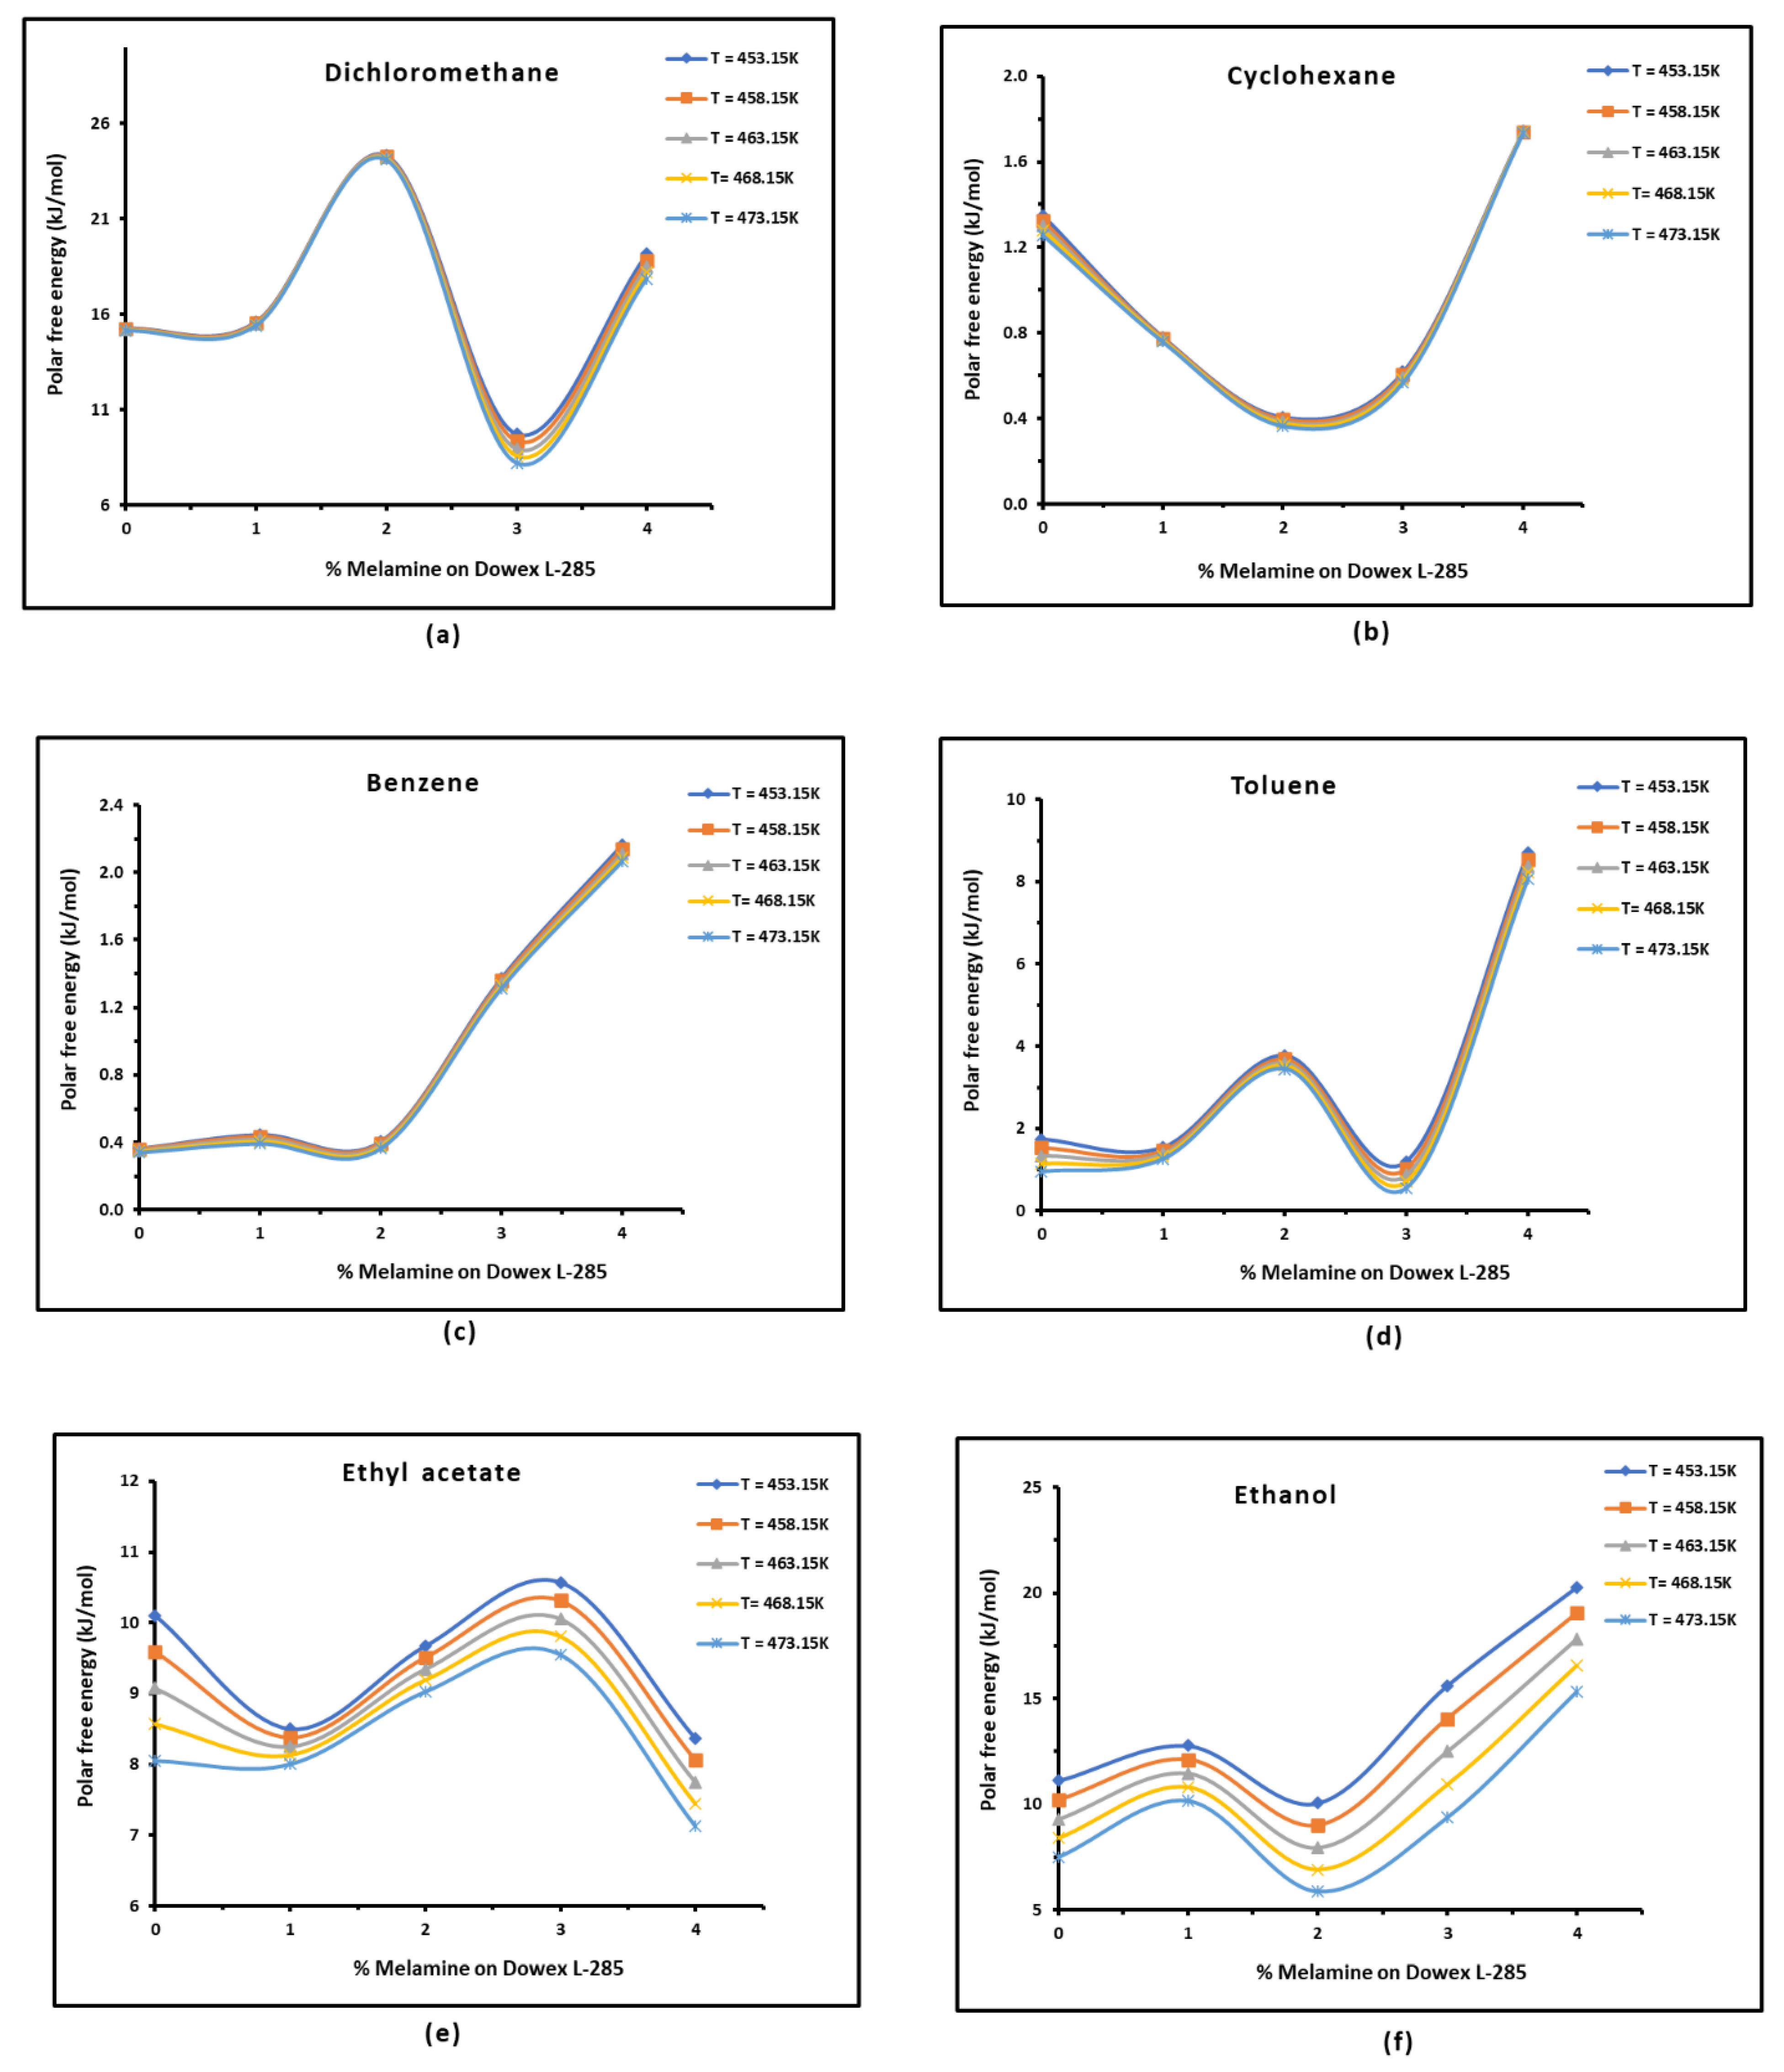
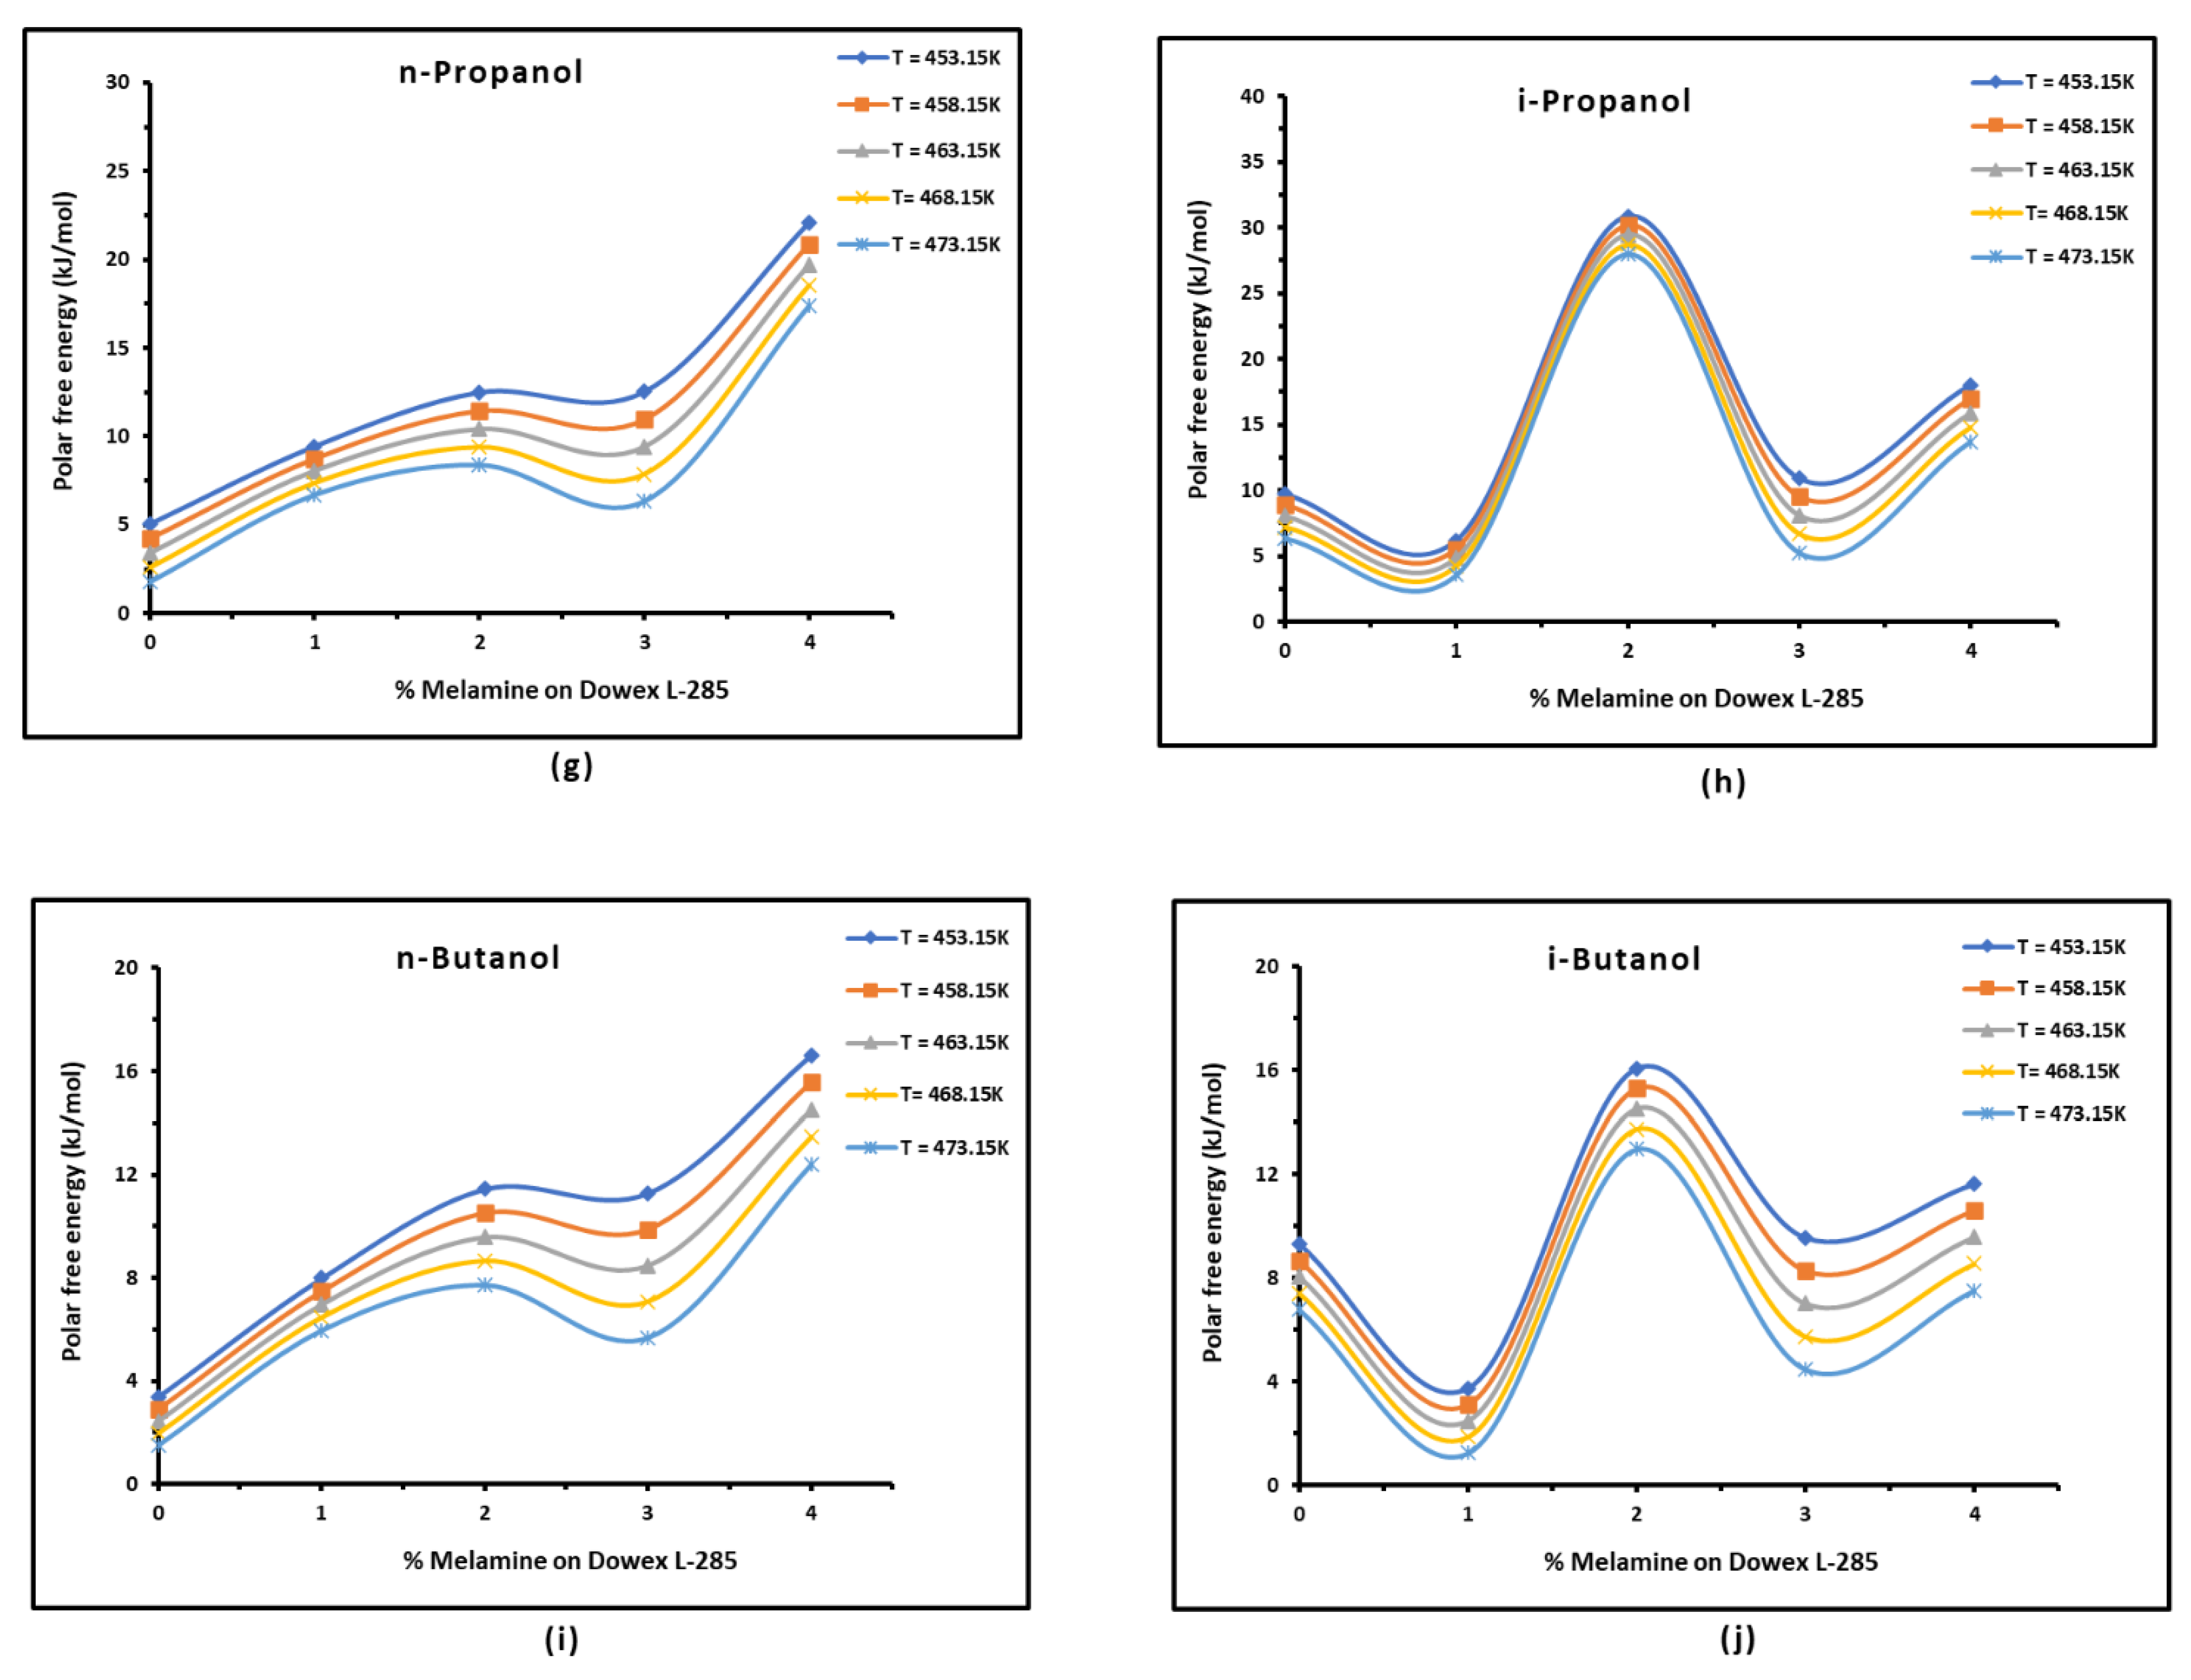
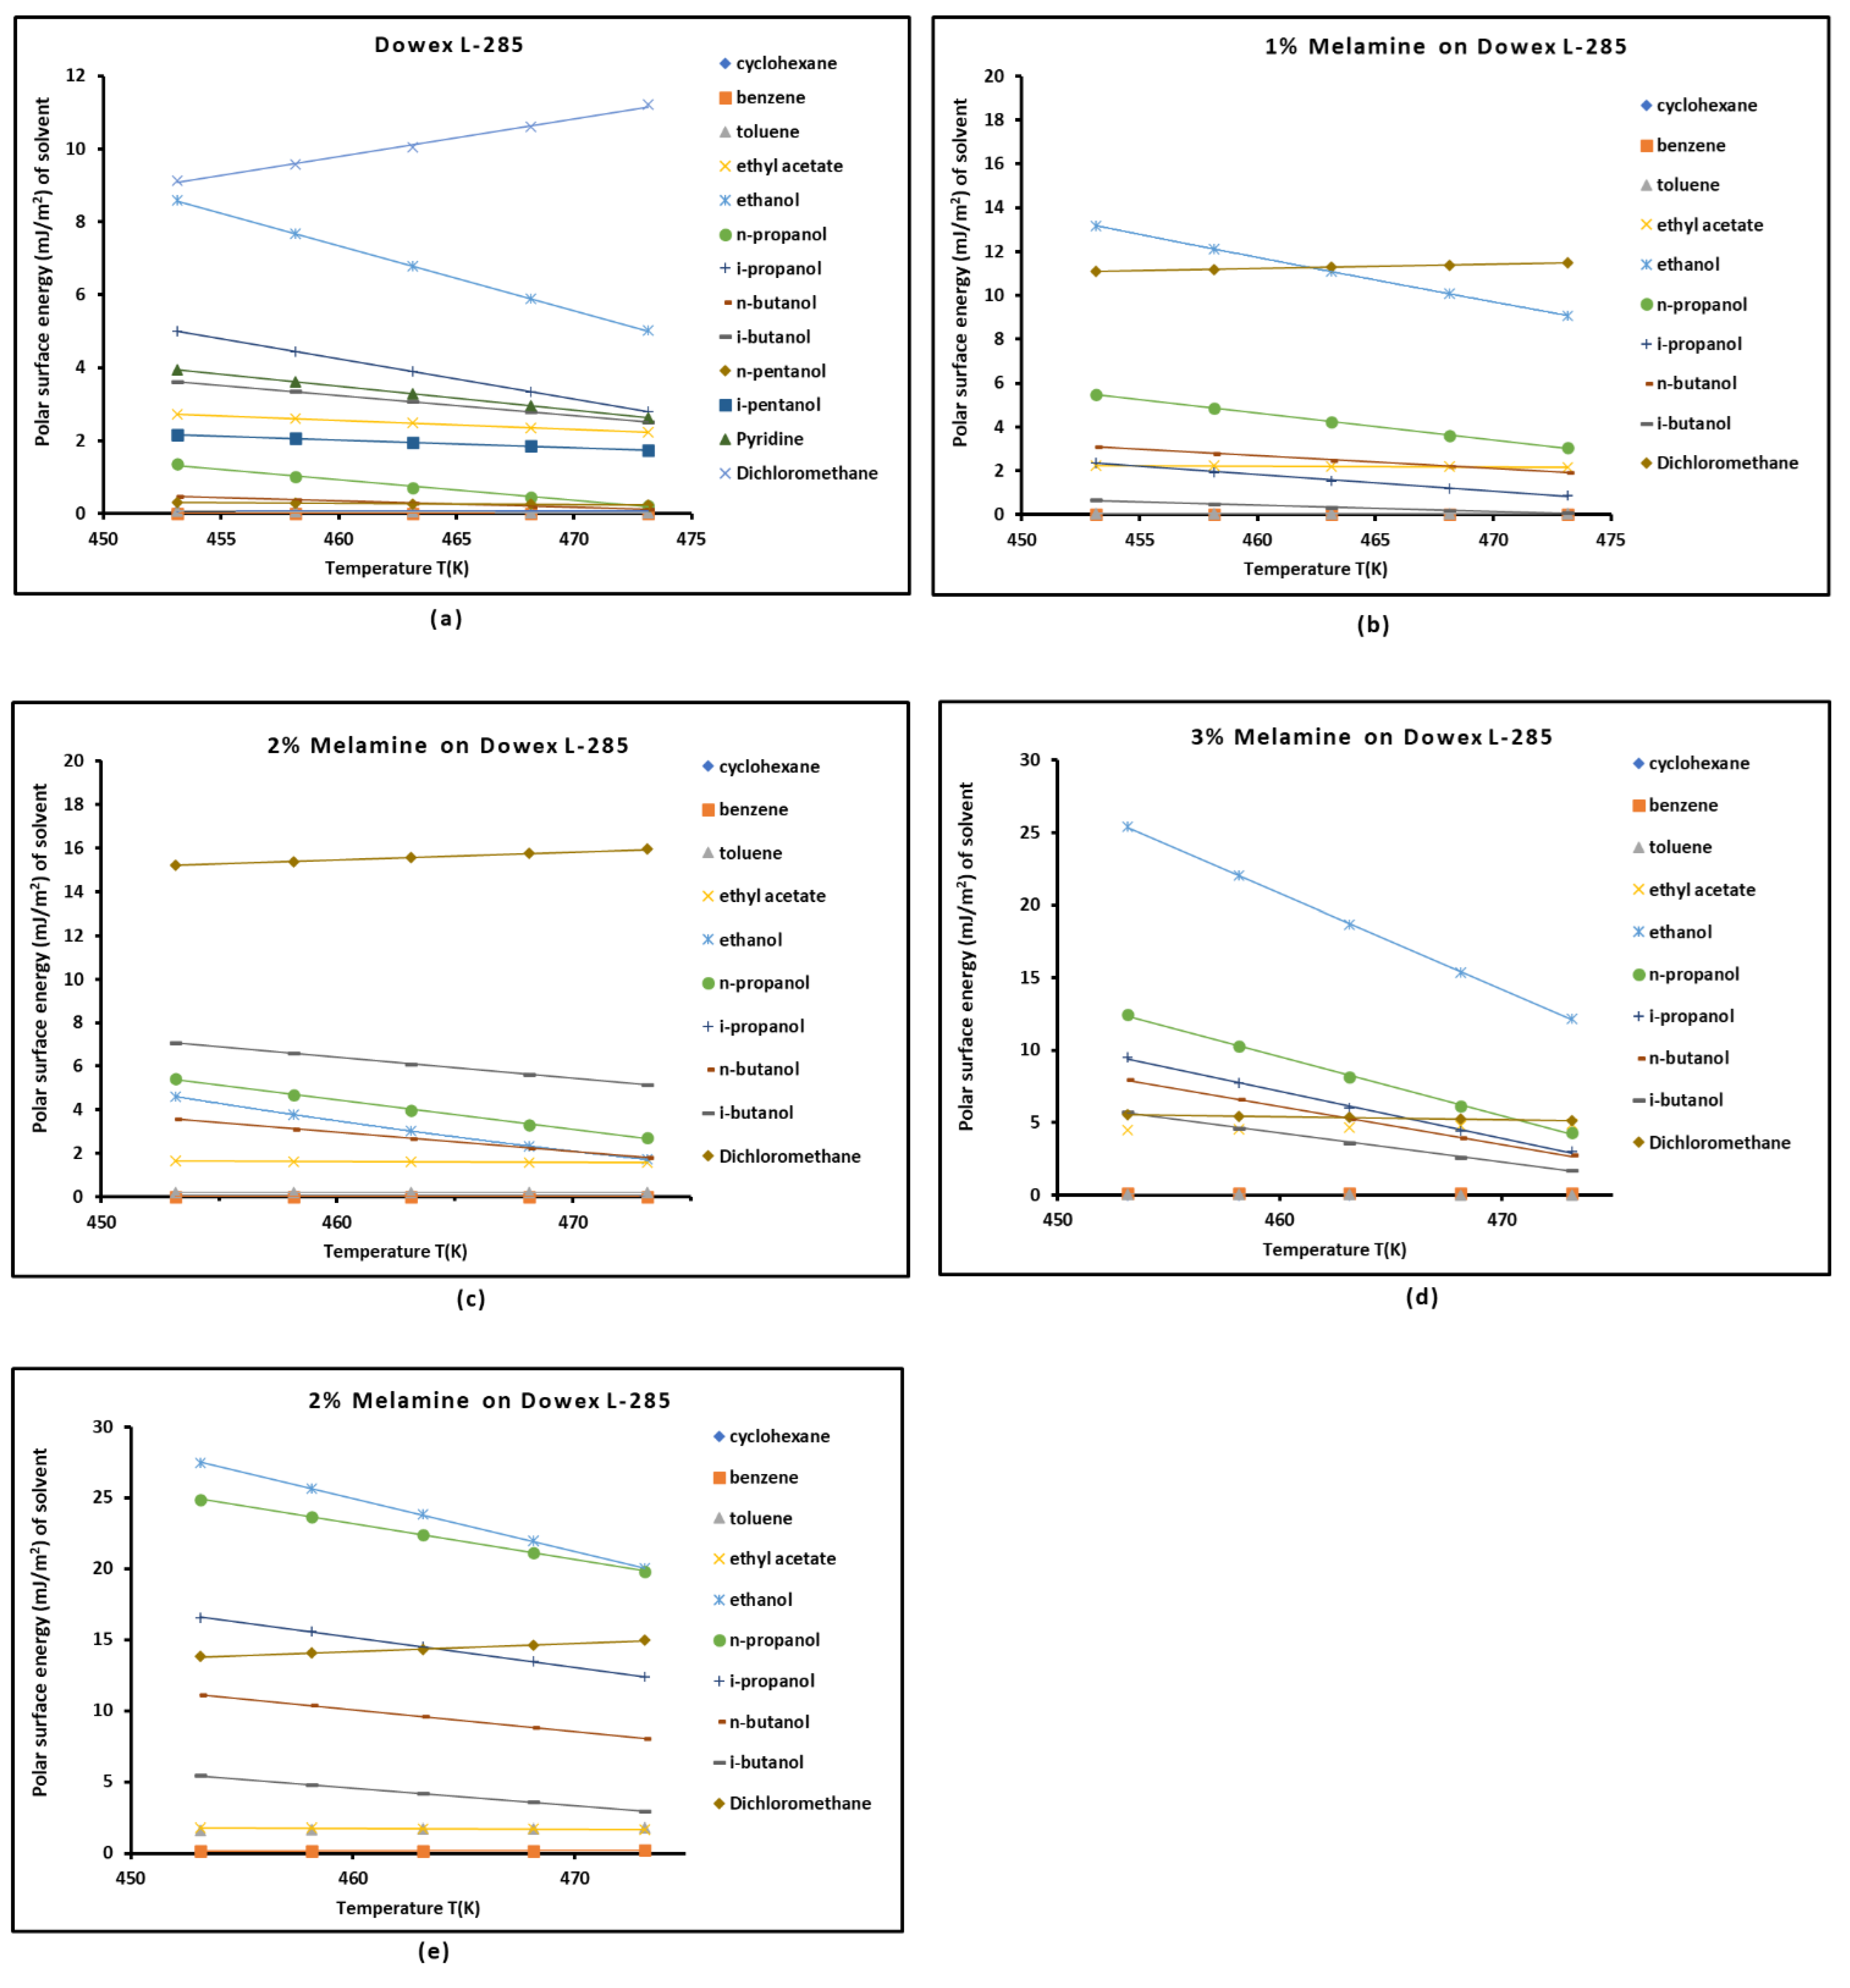
It was observed that the free polar energies of interaction between the solids and the organic solvents can be globally classified in increasing order of interaction energy with the various polar probes at all temperatures as follows:cyclohexane < benzene < toluene < ethyl acetate < i-butanol < n-butanol < ethanol < n-propanol < dichloromethane < i-propanol.
- -
-
The highest free interaction energy was obtained for 4% melamine on Dowex L-285 for the following polar molecules in increasing order:cyclohexane < benzene < toluene < n-butanol < ethanol < n-propanol.
- -
- However, a maximum of free interaction energy was observed for 2% melamine on Dowex L-285 for the other polar solvents such as dichloromethane, i-propanol, and i-butanol.
- -
- It was proved that the alcohol molecules exchanged the maximum free interaction energy with the various solid surfaces, and especially, with 4% melamine, while the minimum interaction was observed in the case of adsorption on Dowex L-285.
- -
- The above results showed that the modification of the copolymer Dowex L-285 by melamine increased the polar free interaction.
3.4. Polar Enthalpy and Entropy of Adsorption, and Lewis Acid-Base Parameters of Dowex L-285 Modified by Melamine
2.3. Polar Acid-Base Surface Energies of Dowex L-285 Modified by Melamine
2.4. Determination of the Average Separation Distance H
4. Conclusions
Supplementary Materials
Author Contributions
Funding
Institutional Review Board Statement
Informed Consent Statement
Data Availability Statement
Conflicts of Interest
References
- Gus´kov, V.Y.; Bilalova, R.V.; Kudasheva, F.K. Adsorption of organic molecules on a melamine-modified porous polymer. Russ Chem Bull, 2017, 66, 857–861. [CrossRef]
- Zaitsev, S.Yu.; Vereschetin, V.P.; Gromov, S.P.; Fedorova, O.A.; Alfimov, M.V.; Huesmann, H.; Möbius, D. Photosensitive supramolecular systems based on amphiphilic crown ethers, Supramolecular Science, 1997, 4 (3-4), 519-524, . [CrossRef]
- Sukhareva, D.A.; Gus´kov, V.Y.; Karpov, S.I.; Kudasheva, F. Kh. Adsorption of organic molecules on the highly ordered MCM-41 sorbent modified by different amounts of melamine. Russ Chem Bull 66, 958–962 (2017). [CrossRef]
- Gainullina, Y.Y.; Gus’kov, V.Y.; Timofeeva, D.V. Polarity of Thymine and 6-Methyluracil-Modified Porous Polymers, According to Data from Inverse Gas Chromatography. Russ. J. Phys. Chem. 93, 2477–2481 (2019). [CrossRef]
- Gus’kov, Vladimir Yu., Yulia F. Shaihitdinova, R. A. Zil’berg, Vladimir A Kraikin and Valery N. Maistrenko. “Intermolecular interactions between polyarylenephthalides surface and organic compounds of different nature by inverse gas chromatography data, 2019, 19 (2), 229-236. Corpus ID: 145851861, . [CrossRef]
- Gus’kov, V.Y., Ivanov, S.P., Khabibullina, R.A. et al. Gas chromatographic investigation of the properties of a styrene-divinylbenzene copolymer modified by 5-hydroxy-6-methyluracil. Russ. J. Phys. Chem. 86, 475–478 (2012). [CrossRef]
- J.-M. Lehn, Supramolecular Chemistry. Concepts and Perspectives, VCH, Weinhiem, 1995, 271 pp., . [CrossRef]
- Guo, Fang, Eugene Y. Cheung, Kenneth D. M. Harris and Venkateswara Rao Pedireddi. “Contrasting Solid-State Structures of Trithiocyanuric Acid and Cyanuric Acid.” Crystal Growth & Design, 2006, 6, 846-848. [CrossRef]
- U. P. Singh, S. Kashyap, H. J. Singh, B. K. Mishra, P. Roy, A. Chakraborty, Effect of adenosine on the supramolecular architecture and activity of 5-fluorouracil, J. Mol. Struct., 2012, 1014, 47-56, . [CrossRef]
- Gus'kov, V. Y., Gainullina, Y. Y., & Kudasheva, F. K. Razdelenie enantiomerov mentola, kamfena i kamfory na 5-gidroksi-6-metiluratsile v usloviyakh gazovoi khromatografii. Analitika i kontrol, 2014, 18(2), 178-181.
- Breckenridge, W. H.; Ayles, V. L.; Wright, T. G. Evidence for Emergent Chemical Bonding in Au+−Rg Complexes (Rg = Ne, Ar, Kr, and Xe), The Journal of Physical Chemistry A, 2008, 112 (18), 4209-4214, . [CrossRef]
- Gus’kov, V. Y.; Ivanov, S. P.; Khabibullina, R. A.; Garafutdinov, R. R.; Kudasheva, F. K. Gas chromatographic investigation of the properties of a styrene-divinylbenzene copolymer modified by 5-hydroxy-6-methyluracil, Russian Journal of Physical Chemistry A, 2012, 86, 475-478.
- Gus’kov, V. Y.; Gainullina, Y. Y.; Ivanov, S. P.; Kudasheva, F. K. Properties of the surface of a porous polymer modified with 5-fluorouracil, according to data of gas chromatography. Russian Journal of Physical Chemistry A, 2014, 88, 1042-1046.
- Gus’kov, V. Y.; Gainullina, Y. Y.; Ivanov, S. P.; Kudasheva, F. K. Porous polymer adsorbents modified with uracil. Prot. Met. Phys. Chem. Surf., 2014, 50, 55-58.
- Gus’kov, V. Y.; Ivanov, S. P.; Kudasheva, F. K. Sorbts. Khromat. Protsessy [Sorption and Chromatographic Processes], 2012, 12, 916 (in Russian).
- Godlewski, S.; Tekiel, A.; Piskorz, W. ; Zasada, F.; Prauzner-Bechcicki, J. S.; Sojka, Z.; Szymonski, M. Supramolecular ordering of PTCDA molecules: The key role of dispersion forces in an unusual transition from physisorbed into chemisorbed state. ACS Nano. 2012, 6 (10), 8536-8545. [CrossRef]
- Dorris, G.M.; Gray, D.G. Adsorption of n-alkanes at zero surface coverage on cellulose paper and wood fibers. J. Colloid Interface Sci. 1980, 77, 353–362.
- Schultz, J.; Lavielle, L.; C. Martin, C. Propriétés de surface des fibres de carbone déterminées par chromatographie gazeuse inverse, J. Chim. Phys., 1987, 84 (2), 231-237.
- Hamieh, T. Study of the temperature effect on the surface area of model organic molecules, the dispersive surface energy and the surface properties of solids by inverse gas chromatography. J. Chromatogr. A 2020, 1627, 461372.
- Hamieh, T.; Ahmad, A.A.; Roques-Carmes, T.; Toufaily, J. New approach to determine the surface and interface thermodynamic properties of H-β-zeolite/rhodium catalysts by inverse gas chromatography at infinite dilution. Sci. Rep. 2020, 10, 20894.
- Hamieh, T. New methodology to study the dispersive component of the surface energy and acid–base properties of silica particles by inverse gas chromatography at infinite dilution. J. Chromatogr. Sci. 2022, 60, 126–142. [CrossRef]
- Hamieh, T. Inverse Gas Chromatography to Characterize the Surface Properties of Solid Materials. Chem. Mater. 2024, 36, 5, 2231–2244. [CrossRef]
- Hamieh, T. Some Irregularities in the Evaluation of Surface Parameters of Solid Materials by Inverse Gas Chromatography. Langmuir 2023, 39, 17059–17070. [CrossRef]
- Hamieh, T. New Progress on London Dispersive Energy, Polar Surface Interactions, and Lewis’s Acid–Base Properties of Solid Surfaces. Molecules 2024, 29, 949. [CrossRef]
- Hamieh, T. London Dispersive and Lewis Acid-Base Surface Energy of 2D Single-Crystalline and Polycrystalline Covalent Organic Frameworks. Crystals 2024, 14, 148. [CrossRef]
- London, F. The general theory of molecular forces. Trans. Faraday Soc. 1937, 33, 8–26. [CrossRef]
- Conder, J. R.; Young, C. L. Physical measurements by gas chromatography. Eds: John Wiley & Sons, Chichester, New York, 1979, 632 pages.
- Sawyer, D.T.; Brookman, D.J. Thermodynamically based gas chromatographic retention index for organic molecules using salt-modified aluminas and porous silica beads, Anal. Chem. 1968, 40, 1847-1850. [CrossRef]
- Dorris, G.M.; Gray, D.G. Adsorption of n-alkanes at zero surface coverage on cellulose paper and wood fibers, J. Colloid Interface Sci. 1980, 77, 353-362.
- Fowkes, F.M. in: Surface and interfacial aspects of biomedical polymers, Vol. I, pp. 337-372, Ed: J. D. Andrade, Plenum Press, New York, 1985.
- Schultz, J.; Lavielle, L.; Martin, C. The role of the interface in carbon fibre-epoxy composites. J. Adhes. 1987, 23, 45-60.
- Saint-Flour, C.; Papirer, E. Gas-solid chromatography. A method of measuring surface free energy characteristics of short glass fibers. 1. Through adsorption isotherms, Ind. Eng. Chem. Prod. Res. Dev. 1982, 21, 337-341, . [CrossRef]
- Saint-Flour, C.; Papirer, E. Gas-solid chromatography: method of measuring surface free energy characteristics of short fibers. 2. Through retention volumes measured near zero surface coverage, Ind. Eng. Chem. Prod. Res. Dev. 1982, 21, 666-669, . [CrossRef]
- Donnet, J.-B.; Park, S.; Balard, H. Evaluation of specific interactions of solid surfaces by inverse gas chromatography, Chromatographia. 31 (1991) 434–440.
- Chehimi, M.M.; Pigois-Landureau, E. Determination of acid–base properties of solid materials by inverse gas chromatography at infinite dilution. A novel empirical method based on the dispersive contribution to the heat of vaporization of probes, J. Mater. Chem. 4 (1994) 741–745.
- Brendlé, E.; Papirer, E. A new topological index for molecular probes used in inverse gas chromatography for the surface nanorugosity evaluation, 1. Method of Evaluation, J. Colloid Interface Sci. 194 (1997) 207–216.
- Brendlé, E.; Papirer, E. A new topological index for molecular probes used in inverse gas chromatography for the surface nanorugosity evaluation, 2. Application for the Evaluation of the Solid Surface Specific Interaction Potential, J. Colloid Interface Sci. 194 (1997) 217–2224.
- Przybyszewska, M.; Krzywania, A.; Zaborski, M.; Szynkowska, M.I. Surface properties of zinc oxide nanoparticles studied by inverse gas chromatography, J. Chromatogr. A, 2009, 1216, 5284-5291.
- Bakaoukas, N.; Sevastos, D.; Kapolos, J.; Koliadima, A.; Karaiskakis, G. Characterization of polymeric coatings in terms of their ability to protect marbles and clays against corrosion from sulfur dioxide by inverse gas chromatography, Int. J. Polym. Anal. Charact., 2013, 18, 401-4013.
- Rückriem, M.; Inayat, A.; Enke, D.; Gläser, R.; Einicke, W-D.; Rockmann, R. Inverse gas chromatography for determining the dispersive surface energy of porous silica. Colloids Surf A Physicochem. Eng. Asp. 2010, 357, 21–26.
- Gutmann, V. The Donor-acceptor Approach to Molecular Interactions, Plenum. Publisher: Springer New York, NY, 1978, 279 pages.
- Riddle, F.L.; Fowkes, F.M. Spectral shifts in acid-base chemistry. Van der Waals contributions to acceptor numbers, Spectral shifts in acid-base chemistry. 1. van der Waals contributions to acceptor numbers. J. Am. Chem. Soc. 1990, 112 (9), 3259-3264, . [CrossRef]
- Fowkes, F.M. in: Surface and interfacial aspects of biomedical polymers, Vol. I, pp. 337-372, Ed: J. D. Andrade, Plenum Press, New York, 1985.
- Van Oss, C.J.; Good, R.J.; Chaudhury, M.K. Additive and nonadditive surface tension components and the interpretation of contact angles. Langmuir 1988, 4, 884. [CrossRef]
- Gus’kov, V. Y., Gainullina, Y. Y.; Gabdulmanova, A. F.; Gareeva. A. N. Dispersive surface free energy of adsorbents modified by supramolecular structures of heterocyclic compounds.” Chimica Techno Acta (2024), Guskov, Corpus ID: 269795422, . [CrossRef]
- Yamamoto, O; Kambe, H. Thermal conductivity of cross-linked polymers. A comparison between measured and calculated thermal conductivities, Polymer Journal, 1971, 2 (5), 623-628.
- Hamieh, T. Thermal Surface Properties, London Dispersive and Polar Surface Energy of Graphene and Carbon Materials Using Inverse Gas Chromatography at Infinite Dilution. Molecules, 29(12), 2871. [CrossRef]

| Solid material |
(mJ/m2) |
R² |
(mJ m−2 K−1) |
(mJ/m2) |
(mJ/m2) |
(K) |
|---|---|---|---|---|---|---|
| Dowex L-285 | = -0.835T + 482.43 | 0.9980 | -0.835 | 482.43 | 233.47 | 577.8 |
| 1% Melamine | = -0.907T + 496.21 | 0.9972 | -0.907 | 496.21 | 225.79 | 547.1 |
| 2% Melamine | = -0.656T + 341.59 | 0.9590 | -0.656 | 341.59 | 146.12 | 521.0 |
| 3% Melamine | = -0.827T + 439.96 | 0.9608 | -0.827 | 439.96 | 193.51 | 532.3 |
| 4% Melamine | = -0.876T + 473.64 | 0.9735 | -0.876 | 473.64 | 212.40 | 540.6 |
| Material | KA | KD | KD/KA | KA+KD | R2 | 10−3ωA | 10−3ωD | ωD/ωA | 10−3 (ωA+ ωD) | R2 |
|---|---|---|---|---|---|---|---|---|---|---|
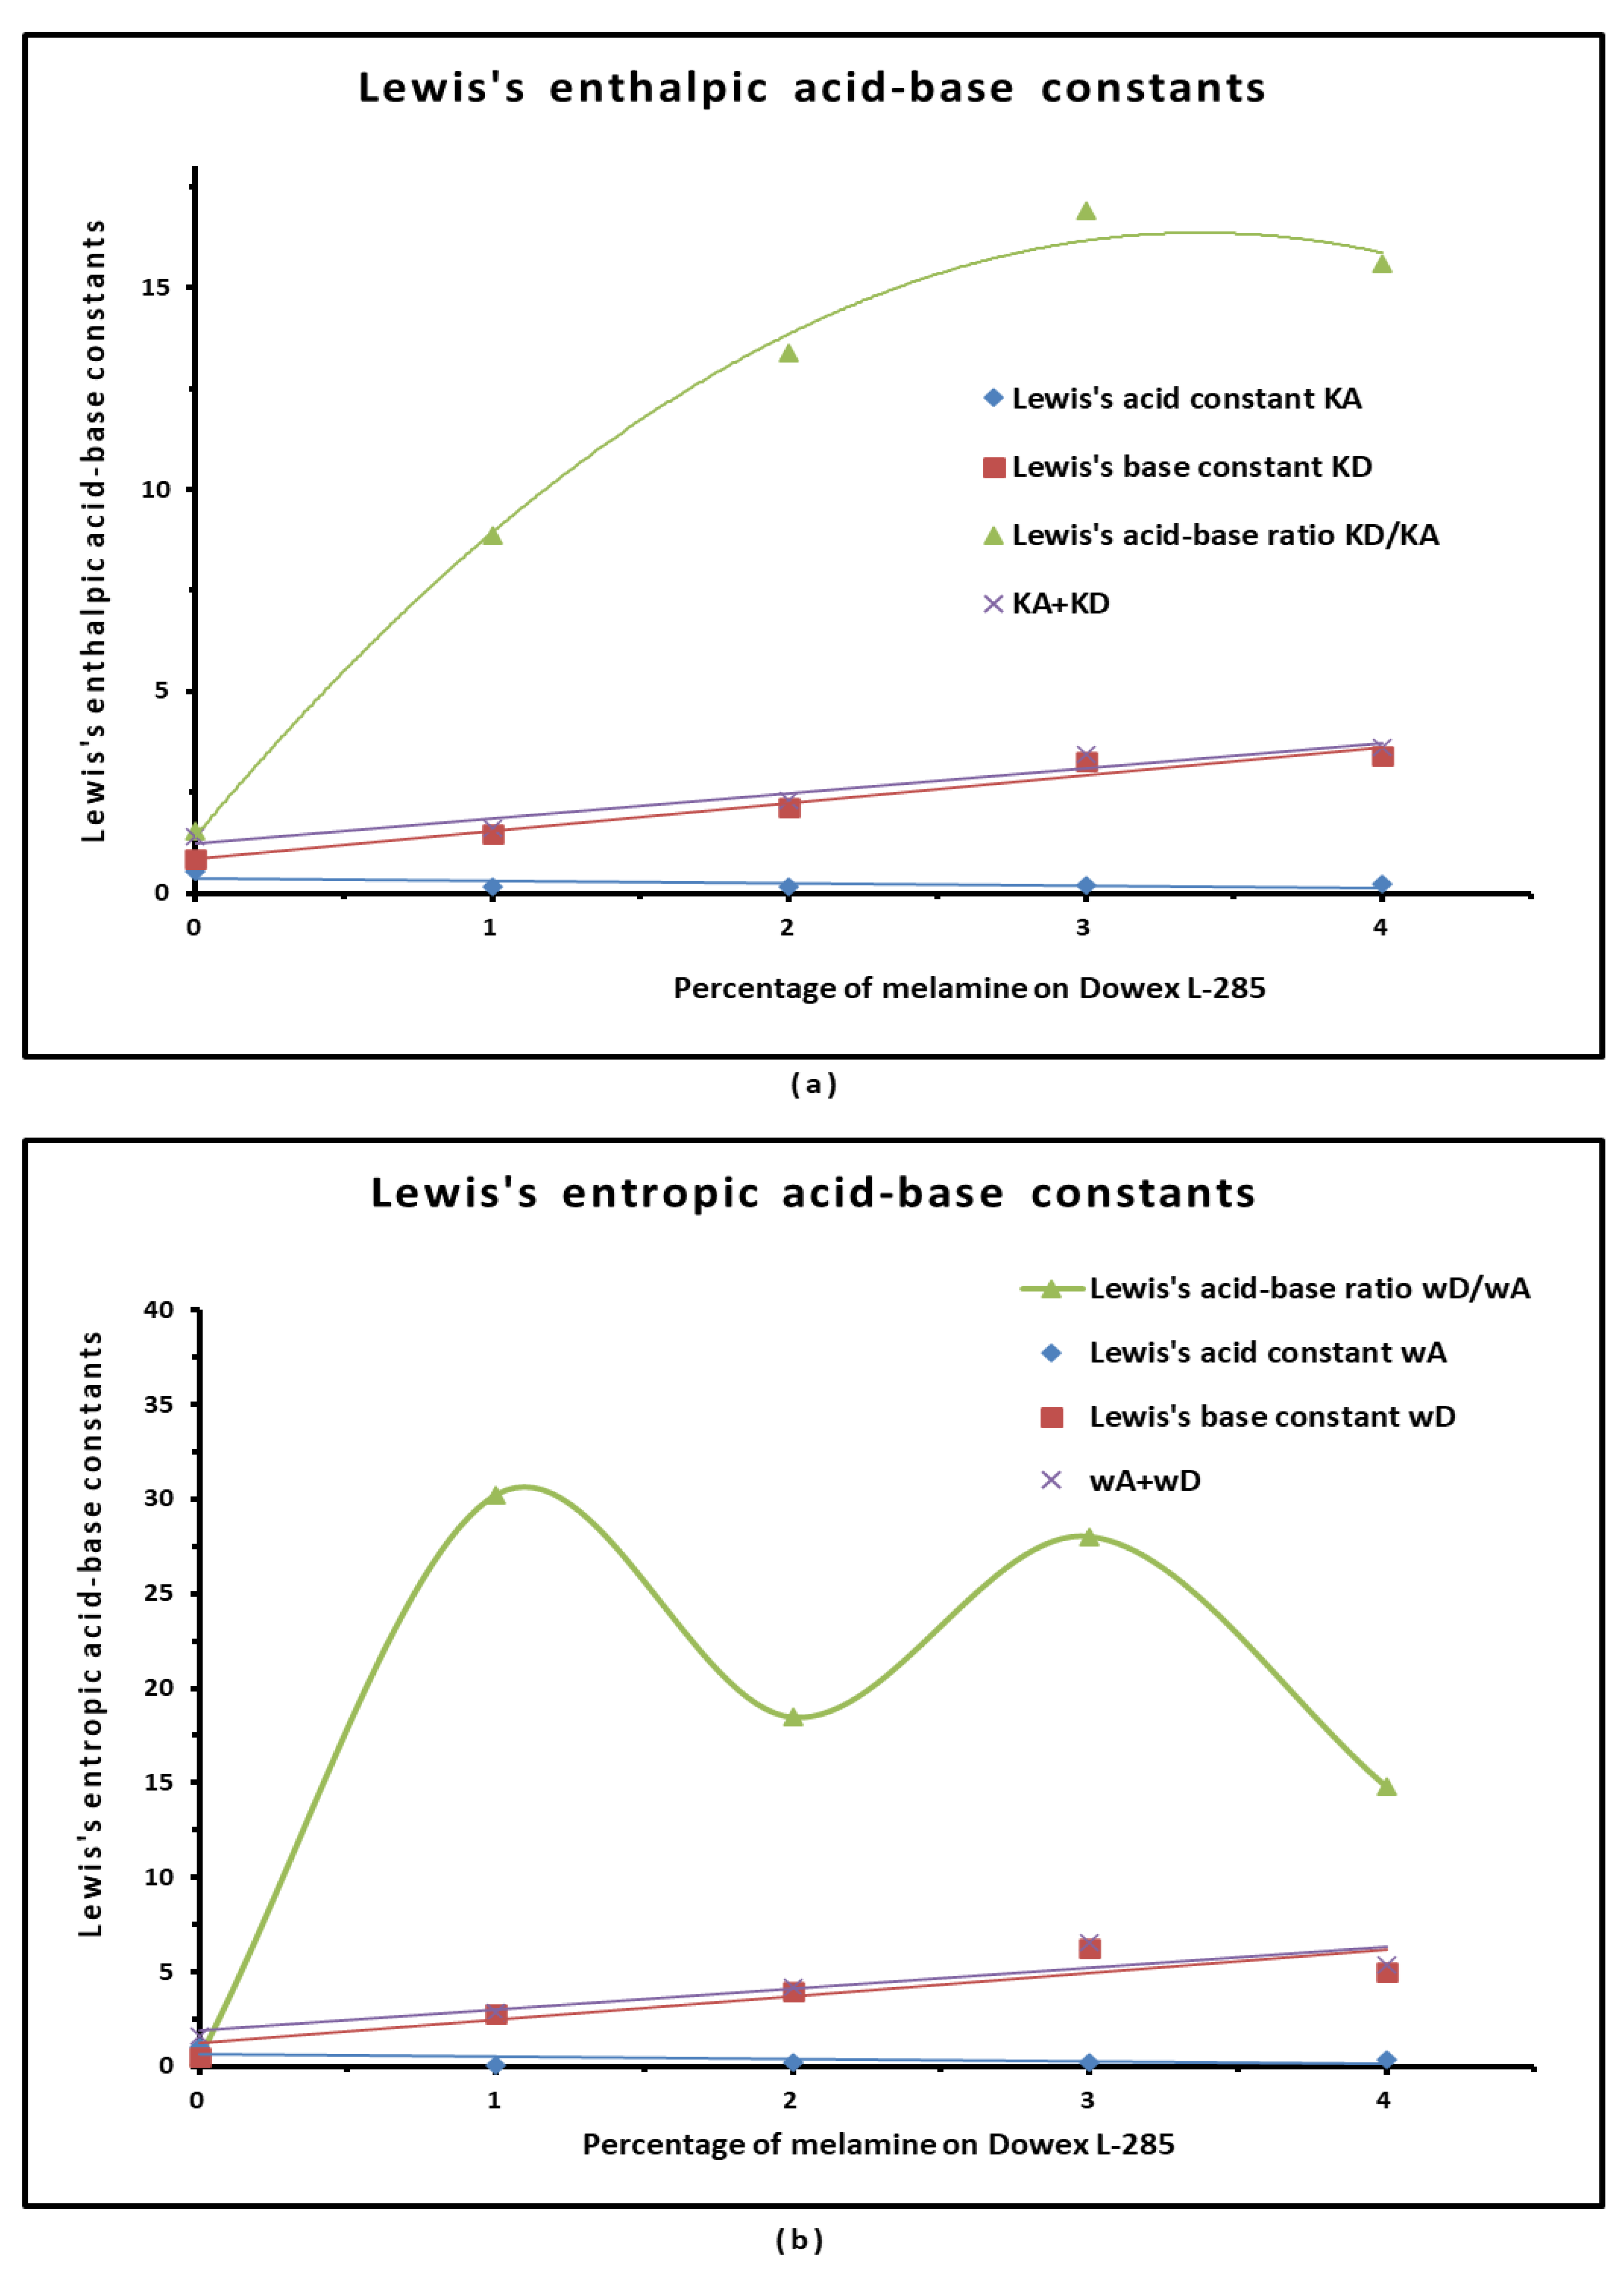
| Dowex L-285 | 0.550 | 0.844 | 1.53 | 1.393 | 0.999 | 1.05 | 0.55 | 0.5 | 1.59 | 0.9968 |
| 1% Melamine on Dowex L-285 | 0.164 | 1.455 | 8.85 | 1.620 | 0.9783 | 0.09 | 2.81 | 30.2 | 2.90 | 0.9316 |
| 2% Melamine on Dowex L-285 | 0.160 | 2.137 | 13.38 | 2.297 | 0.9989 | 0.22 | 4.00 | 18.5 | 4.21 | 0.9520 |
| 3% Melamine on Dowex L-285 | 0.193 | 3.263 | 16.90 | 3.456 | 0.9938 | 0.22 | 6.30 | 28.0 | 6.52 | 0.9695 |
| 4% Melamine on Dowex L-285 | 0.218 | 3.401 | 15.58 | 3.619 | 0.9276 | 0.34 | 5.00 | 14.8 | 5.34 | 0.9702 |
| Dichloromethane | |||||
| T(K) | Dowex L-285 | 1% Melamine | 2% Melamine | 3% Melamine | 4% Melamine |
| 453.15 | 15.274 | 15.609 | 24.349 | 9.737 | 16.294 |
| 458.15 | 15.239 | 15.559 | 24.294 | 9.352 | 16.452 |
| 463.15 | 15.204 | 15.509 | 24.239 | 8.967 | 16.012 |
| 468.15 | 15.169 | 15.459 | 24.184 | 8.582 | 15.989 |
| 473.15 | 15.134 | 15.409 | 24.129 | 8.197 | 12.318 |
| Ethyl acetate | |||||
| T(K) | Dowex L-285 | 1% Melamine | 2% Melamine | 3% Melamine | 4% Melamine |
| 453.15 | 10.106 | 8.503 | 9.667 | 10.567 | 39.887 |
| 458.15 | 9.593 | 8.378 | 9.507 | 10.314 | 38.842 |
| 463.15 | 9.079 | 8.253 | 9.347 | 10.060 | 37.077 |
| 468.15 | 8.566 | 8.128 | 9.187 | 9.807 | 35.814 |
| 473.15 | 8.052 | 8.003 | 9.027 | 9.553 | 30.163 |
Disclaimer/Publisher’s Note: The statements, opinions and data contained in all publications are solely those of the individual author(s) and contributor(s) and not of MDPI and/or the editor(s). MDPI and/or the editor(s) disclaim responsibility for any injury to people or property resulting from any ideas, methods, instructions or products referred to in the content. |
© 2024 by the authors. Licensee MDPI, Basel, Switzerland. This article is an open access article distributed under the terms and conditions of the Creative Commons Attribution (CC BY) license (http://creativecommons.org/licenses/by/4.0/).


