1. Introduction
Bridge rails are important roadside safety devices used to protect errant vehicles, and their occupants, from catastrophes. Commonly used bridge rails include concrete bridge rails, metal bridge rails, and hybrid bridge rails (i.e., metal rails anchored onto a concrete parapet). While concrete bridge rails have higher rigidity than metal bridge rails, they have higher initial and repair costs. Bridge rails are considered longitudinal barriers and like all other roadside safety devices, they must be tested to pass the safety requirements issued by the American Association of State Highway and Transportation Officials (AASHTO).
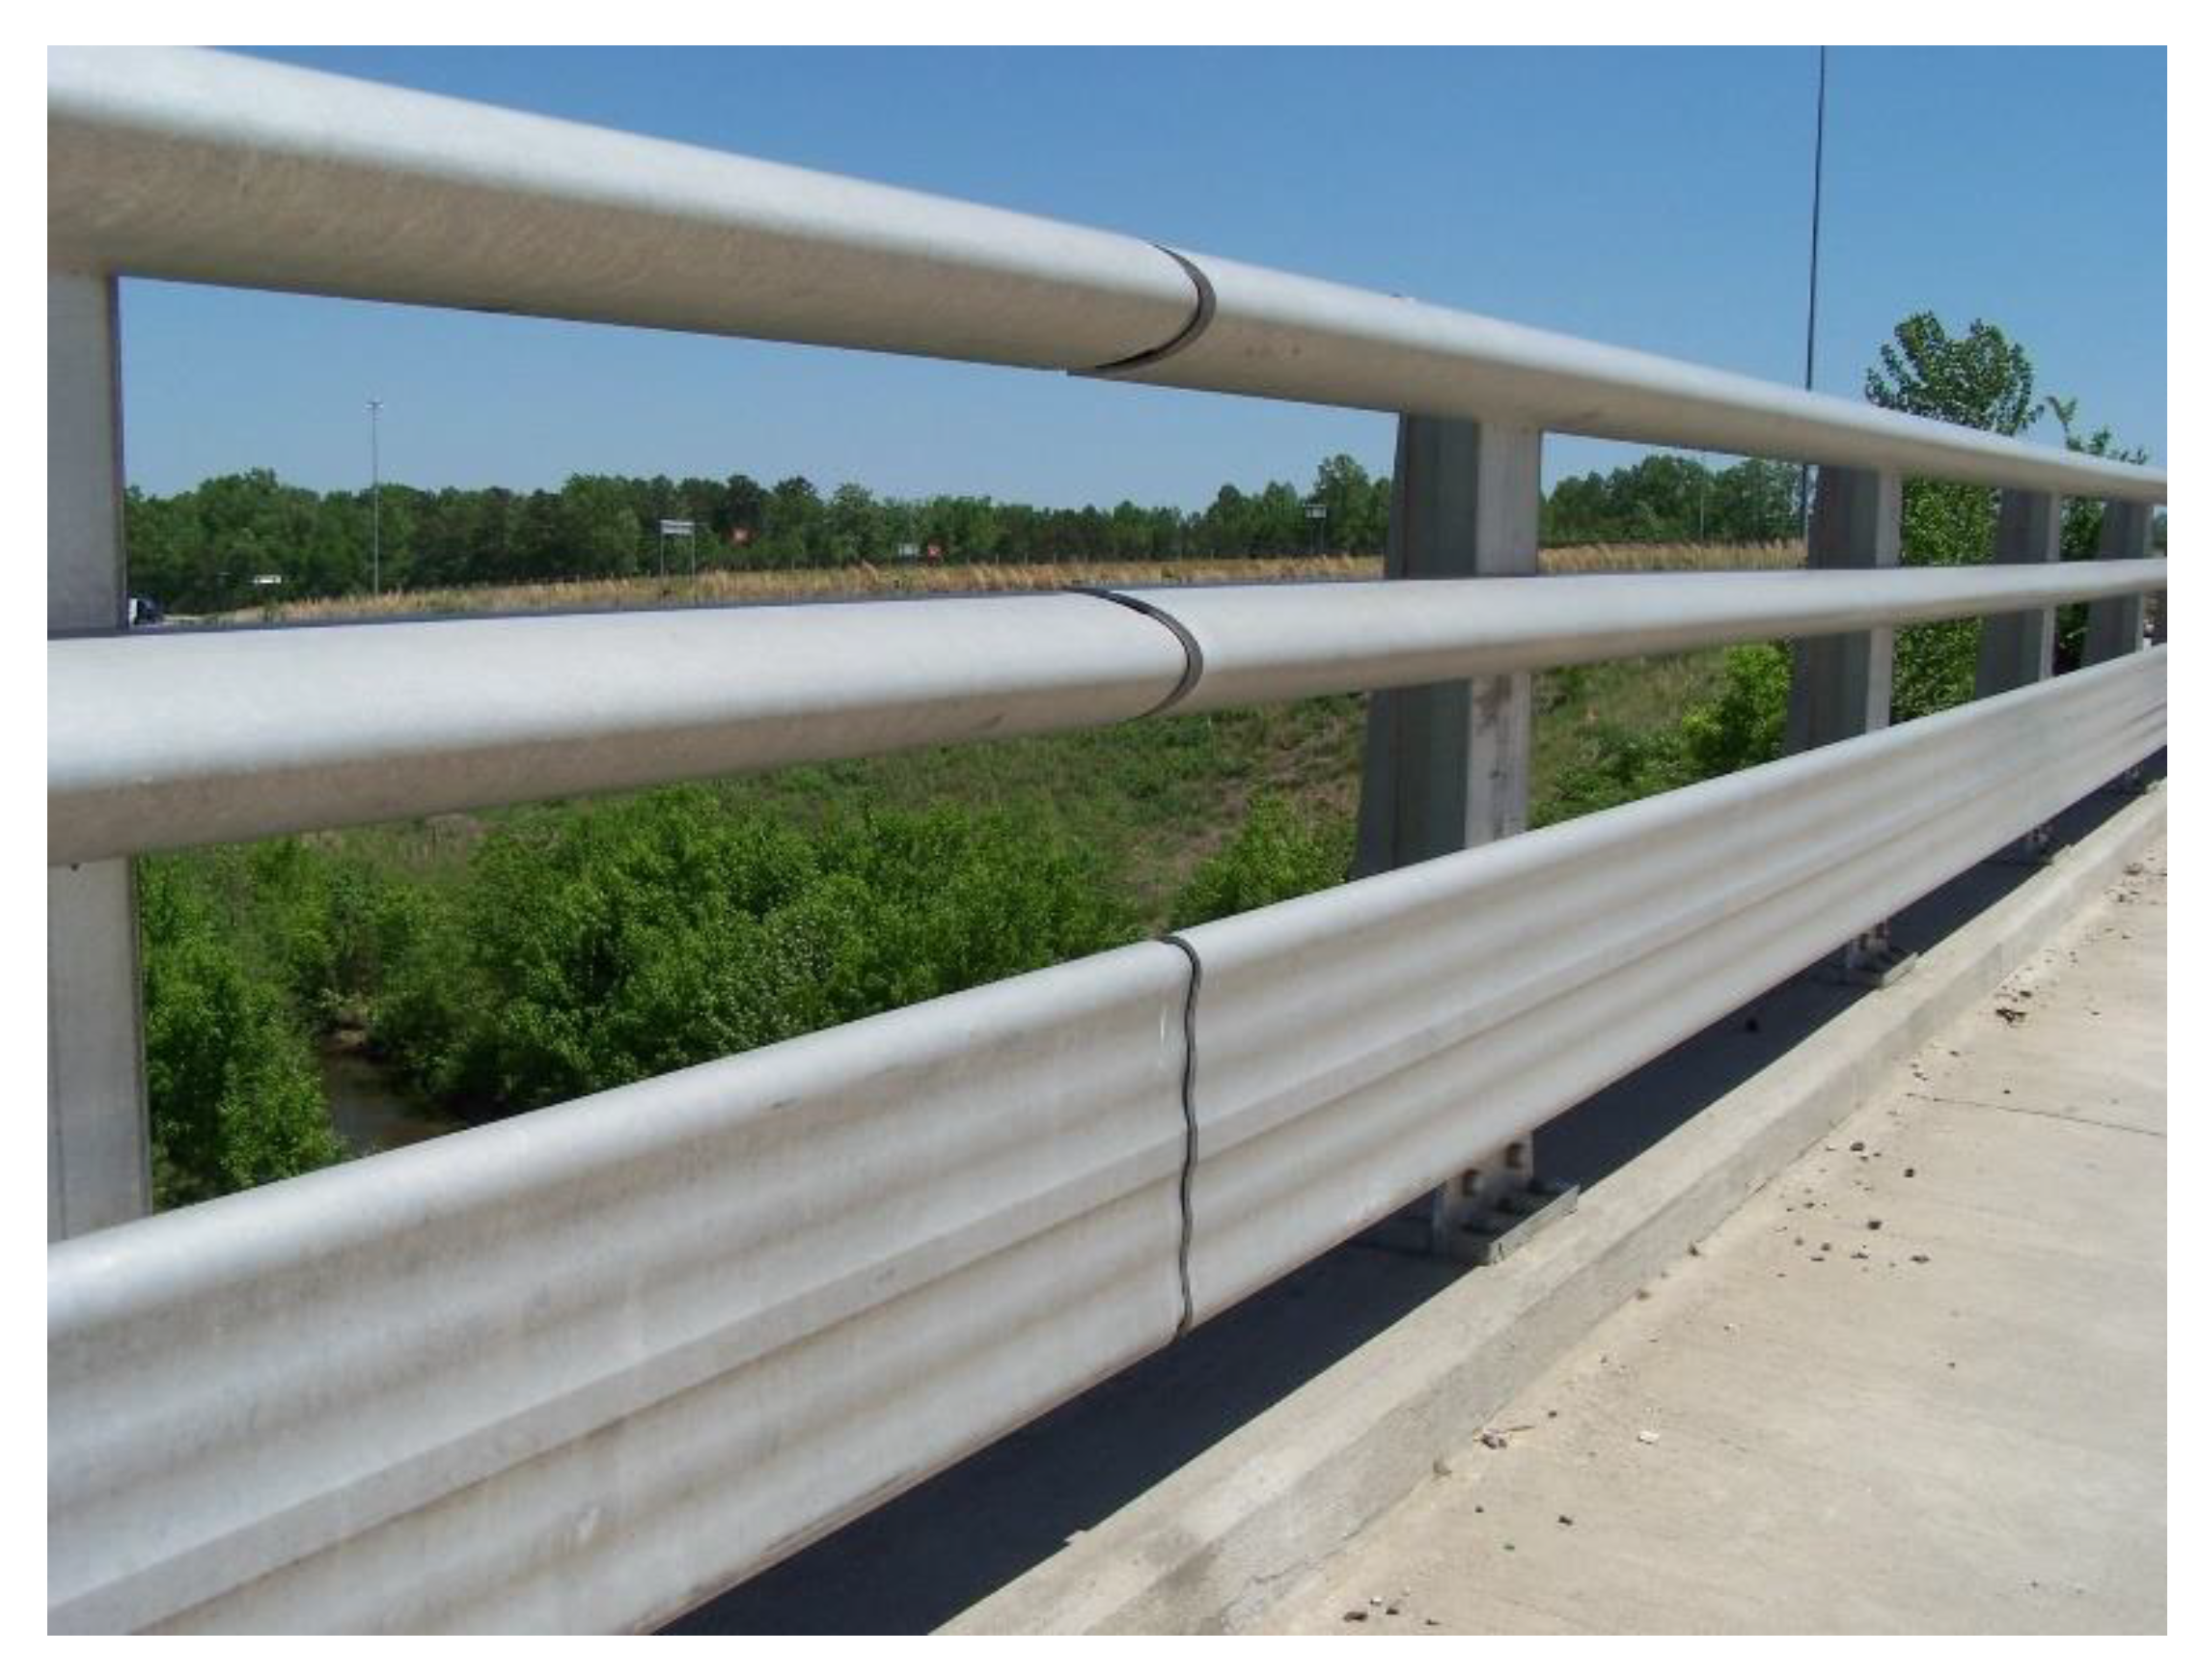
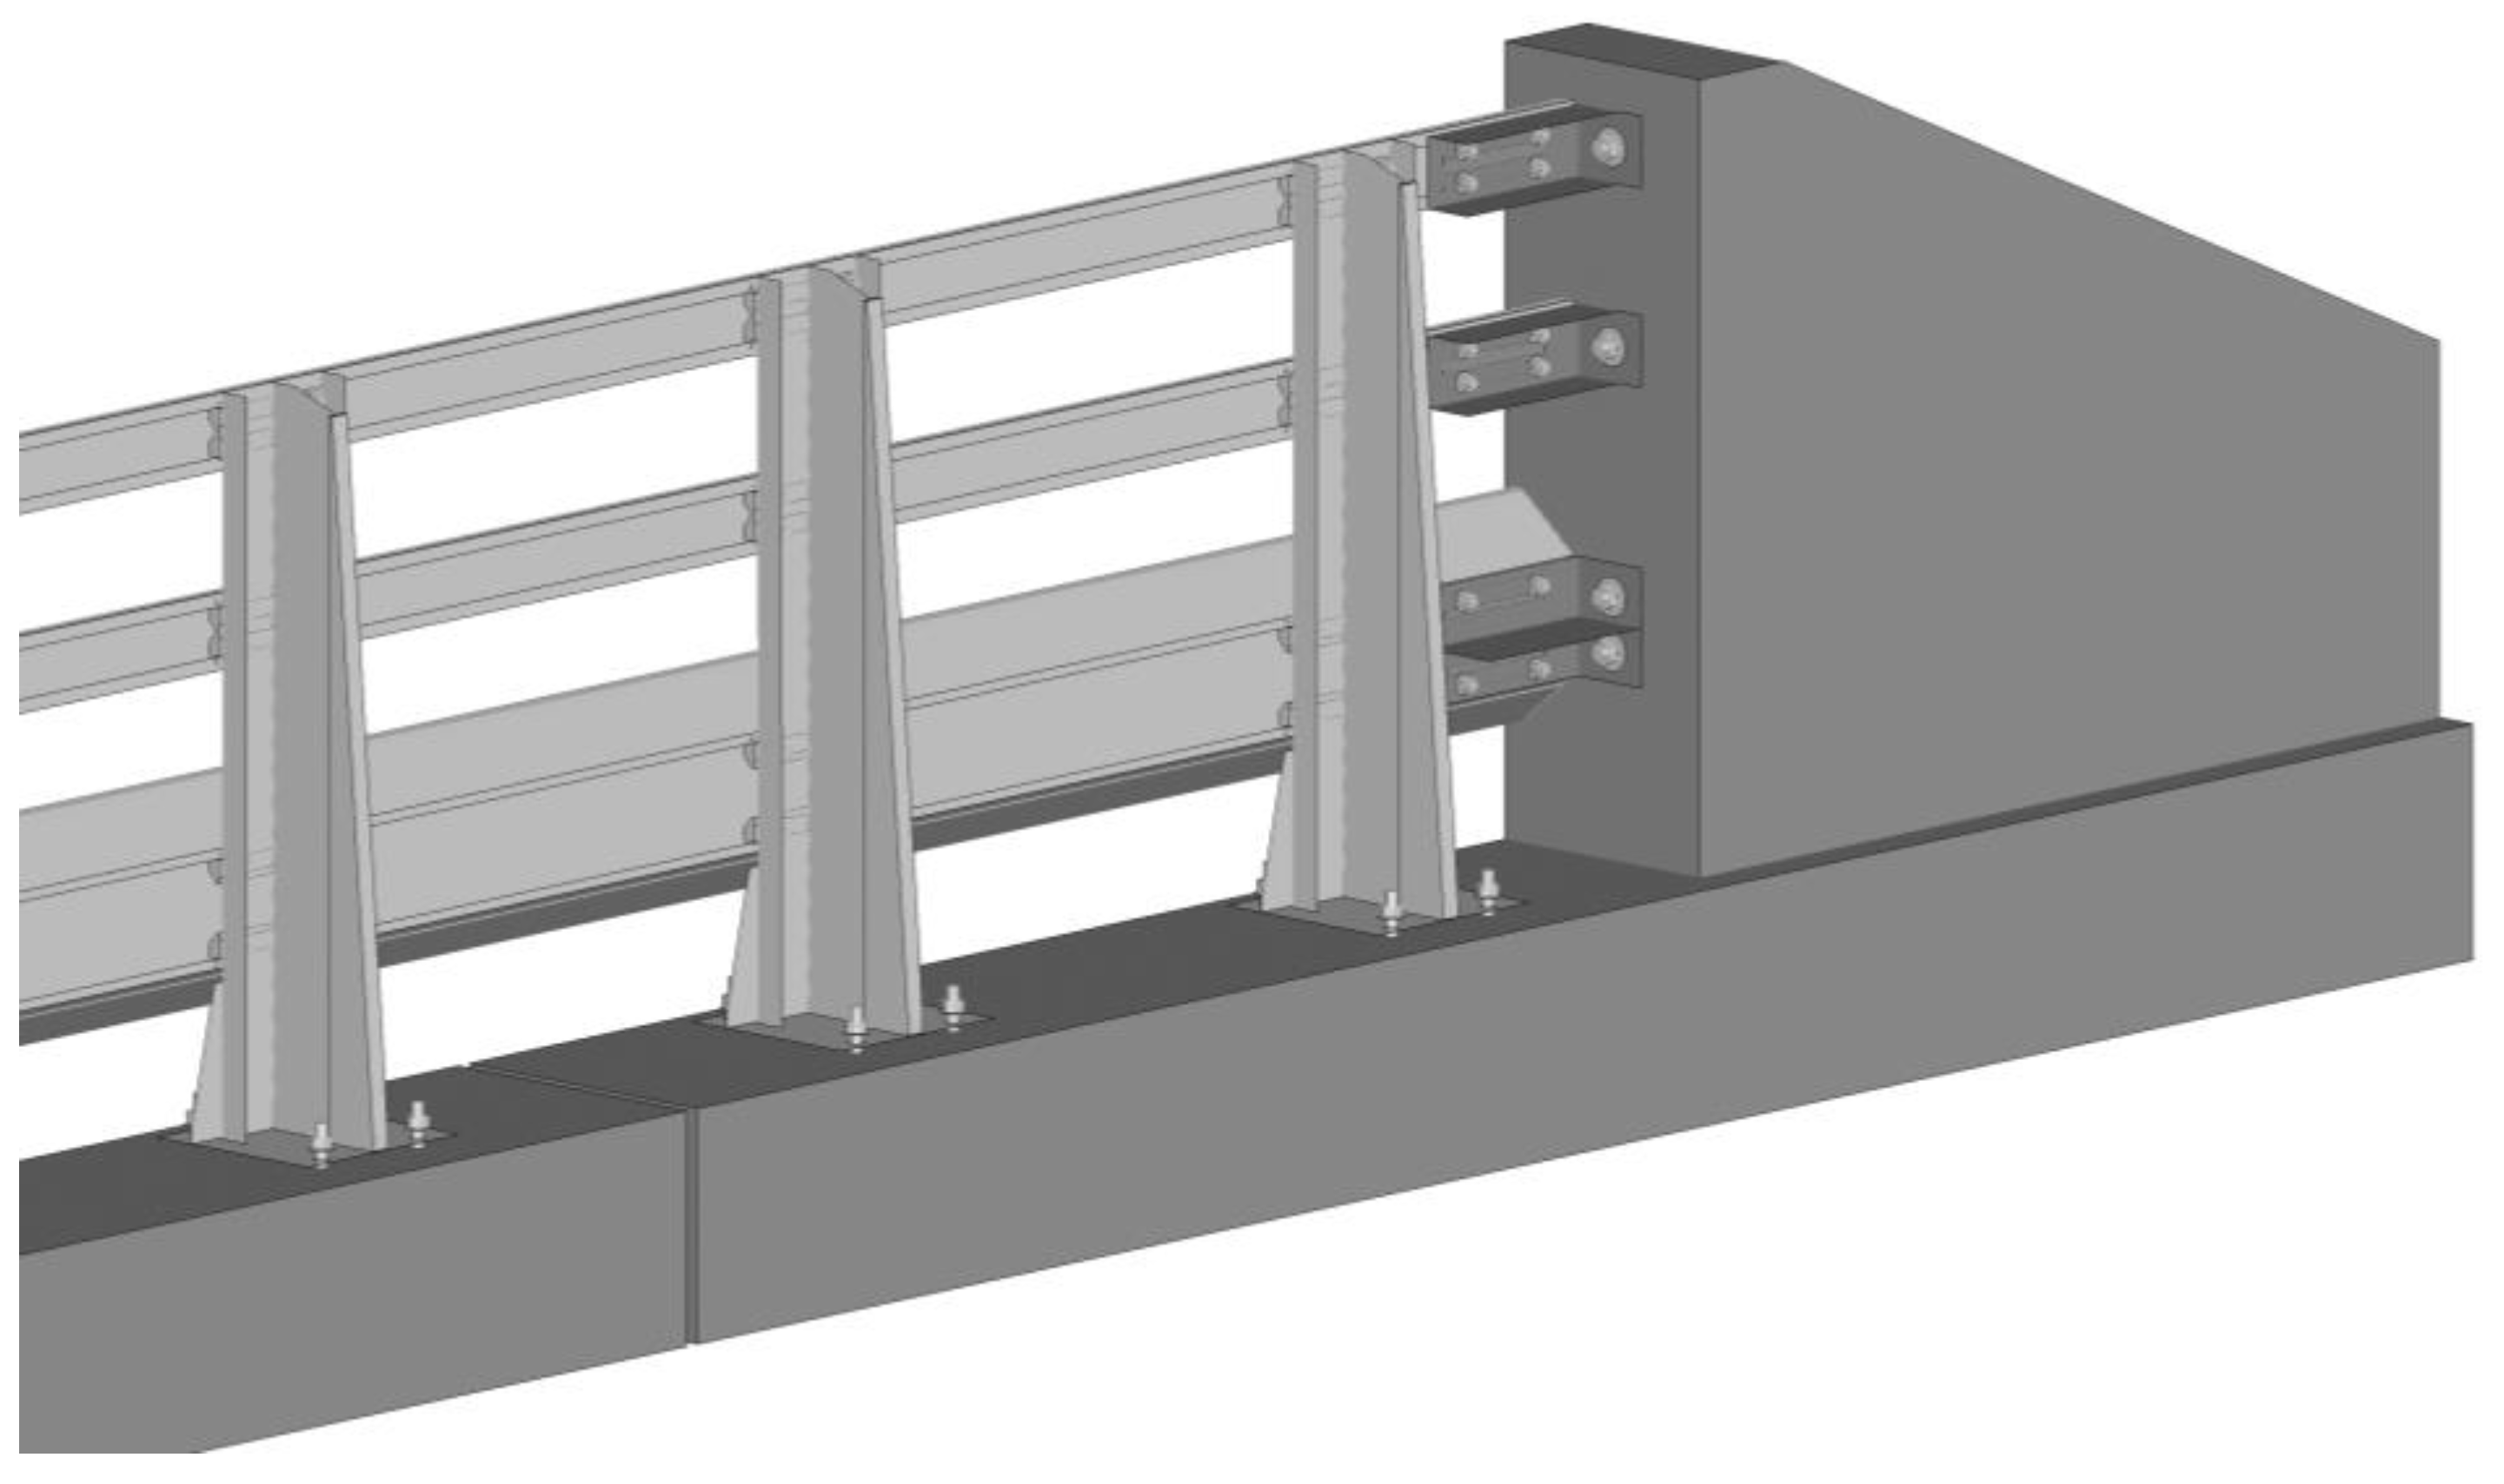
Figure 1 shows a Three-bar Metal Bridge Rail (TMBR) adopted by the North Carolina Department of Transportation (NCDOT). This bridge rail has two oval-shaped rails and one flat rail, all made of aluminum and constrained to metal posts that are affixed to the concrete footings along the edges of the bridge deck.
The TMBR was originally tested and passed the safety requirements of the National Cooperative Highway Research Program (NCHRP) Report 350 [
2], which was later replaced by the new AASHTO standards, Manual for Assessing Safety Hardware (MASH) 2016 [
3]. With the issuance of the new standards, the performance of the TMBR should be re-evaluated to provide guidance for usage, design improvements, and physical crash testing.
Bridge rail evaluations began in the early 1960s with physical crash tests as the primary method to study bridge structure performance [
4]. Since then, full-scale crash testing has been the predominant approach for design validation and performance assessment. Over the years, a variety of bridge rails have been tested across different states, such as the California Type 9 [
5] and Type 115 [
6] bridge rails, the Wyoming tube-type bridge rail [
7], two types of Texas bridge rails [
8], Texas T-1F bridge rail [
9] and T202 bridge rail [
10], the Tennessee bridge rail [
11], and many other bridge rails [
12,
13,
14,
15,
16,
17,
18,
19,
20]. Most of these bridge rails were crash tested using a small passenger car as well as a pickup truck. Over the years, many bridge rails were also tested under more severe crash conditions such as impacts by a single-unit truck [
21,
22,
23,
24,
25,
26,
27]. All these crash tests provided valuable data and insights into bridge rail designs and performance under vehicular crashes. However, full-scale physical tests are extremely expensive and time-consuming to conduct. Although they are useful for design validation; they are prohibitively expensive for design exploration when many different designs/options are to be evaluated.
Since the early 1990s, the use of computer modeling and simulation in transportation safety has dramatically increased [
28,
29,
30]. Significant effort was put into model development, particularly on vehicle models [
31,
32,
33,
34,
35], to improve the fidelity of numerical simulations. In the past few decades, computer modeling and simulations for vehicular crashes have seen significant growth in modeling capabilities and model complexity, attributed to the technological advancement of computing hardware and numerical codes. Full-scale crash simulations have been used on a variety of roadside safety devices and infrastructures such as cable barriers [
36,
37,
38,
39,
40,
41,
42], W-beam and Thrie-beam guardrails [
43,
44,
45,
46,
47,
48,
49,
50,
51,
52], concrete barriers [
53,
54,
55,
56,
57], crush cushions [
58,
59,
60,
61], bus shelters and cluster mailboxes [
62], and various bridge rails [
63,
64,
65,
66,
67]. Numerical modeling and simulations, specifically finite element analysis (FEA), have provided alternative and viable means for studying the crash mechanisms and performance of highway safety devices.
In the work by Wekezer et al. [
63], they used LS-DYNA simulations to study the safety performance of Florida beam-and-post reinforced concrete bridge barriers under the Test Level 3 (TL-3) impact of a Chevy pickup truck according to the NCHRP Report 350 [
2]. The study revealed severe snagging of the vehicle and provided input for retrofit recommendations. Ray et al. [
64] performed FEA on an extruded aluminum truss-work bridge railing subject to TL-3 and Test Level 4 (TL-4) impacts specified in the NCHRP Report 350. An AASHTO LRFD analysis conducted in the study confirmed the results of LS-DYNA simulations, and the bridge rail design was found to have comparable strength to other F-shaped bridge railings in terms of structural rigidity. Atahan and Cansiz [
65] used FEA to study a concrete bridge rail-to-guardrail transition that failed to pass the TL-3 requirements of NCHRP Report 350. After validating the simulations using qualitative and quantitative comparisons, an examination of the physical test and simulation results was performed. It was determined that the W-beam height of 685 mm was the main cause of vehicle rollover. It was suggested to modify the W-beam height to 810 mm and subsequent simulation results predicted that the modified design contained and stably redirected the impacting vehicle without wheel snagging. Atahan [
66] subsequently performed FEA on the modified bridge rail-to-guardrail transition and determined that the vehicle trajectory, occupant risk, guardrail displacements, and vehicle redirections matched well with the results from a similar transition previously tested under TL-4 conditions specified in NCHRP Report 350. Atahan [
67] later studied a high containment level rail (i.e., under impacts of tractor-trailers) for bridges and viaducts using LS-DYNA simulations and a physical crash test. The numerical simulation results were validated using test data, and the rail was determined to meet the EN1317 Standard [
68].
Bocchieri and Kirkpatrick [
69] used LS-DYNA simulation combined with the design of experiments to identify the critical modeling parameters on several bridge railing designs impacted by a Chevrolet C2500 truck. By evaluating the effect of parameter variation on bridge railing performance, they selected the best bridge rail design choice, and a second experimental design was used to determine the bounds of the predicted performance. Abu-Odeh [
70] used LS-DYNA simulation to study the T501 steel-reinforced concrete bride rail under a 2268-kg bogie’s impact at different. The study evaluated the usability of three LS-DYNA material models and suggested the use of small-scale material tests such as triaxial tests to improve the predictability of these material models. Thanh and Itoh [
71] used FEA to study the performance of curved steel railings subjected to collisions of trucks at large impact angles. Their simulation results showed that curved railings absorbed less energy than straight railing under the same impact conditions, but they were still capable of guiding the truck’s subsequent movements as long as the initial impact angles were within the limit by the design specification. They also pointed out that the impact angle at curved bridge sites sometimes might be larger than the 15° allowable impact angle, meaning that the curved railing would not be capable of guiding the truck back to the travel lane.
Fang et al. [
72] evaluated an NCDOT two-bar metal bridge rail using both FEA and physical crash tests of two vehicles, i.e., a 2010 Toyota Yaris passenger car and a 2014 Chevy Silverado pickup truck. Their finite element (FE) models were validated using test data. The study confirmed the validity of simulation results and high fidelity of FE models of both the vehicles and the two-bar metal rail.
A characteristic feature of full-scale crash tests is that roadside barriers are typically evaluated under predefined impact conditions specified by relevant standards. However, questions remain regarding how these barriers will perform under different, untested impact conditions. To address this issue, this study aimed to evaluate the safety performance of the TMBR under MASH standard Test Level 2 (TL-2) and TL-3 impact conditions, as well as under real-world in-service conditions.
The research plan assumed the use of FE models of the two validated vehicle models from Fang et al. [
72] (
Section 3.2). Having reliable FE models, simulations of the test vehicles impacting the TMBR on flat terrain was performed under MASH TL-2 and TL-3 conditions (
Section 4.2 and
Section 4.3, respectively). Given that the TMBR was often installed behind sidewalks, the study evaluated its performance in this configuration. Specifically, the TMBR behind a sidewalk was assessed when impacted by a 2010 Toyota Yaris under MASH TL-3 conditions (
Section 4.4). The safety evaluation focused on the structural adequacy of the TMBR, the risks posed to vehicle occupants, and the trajectories of vehicles after impacts. These analyses aimed to identify potential issues and safety concerns related to barrier installations behind sidewalks, which have not been previously assessed in full-scale crash tests. The findings could contribute to future improvements in roadside barrier designs and crash test requirements. The findings from this research are expected to contribute significantly to roadside barrier designs and provoke necessary adjustments to crash testing requirements or standards.
All numerical simulations for this study were conducted using LS-DYNA. Consequently, the description of the FE models employs nomenclature consistent with this software to describe the types of finite elements and the material models used.
6. Conclusions
In this study, FE simulations of vehicles crashing into a Three-bar Metal Bridge Rail (TMBR) were performed. The FE models of two test vehicles were validated, and the FE model of TMBR was constructed. Vehicular crash simulations were performed per both MASH TL-2 and TL-3 requirements, and the performance of the TMBR was evaluated according to MASH criteria on structural adequacy, risks of occupants in the vehicle, and trajectories of vehicles after impacts. It is concluded that the TMBR met all evaluation criteria under MASH TL-2 impacts. However, the TMBR failed to pass all safety requirements under MASH TL-3 conditions, due to a large longitudinal OIV value and failure to stay within the exit box. The TMBR was also evaluated under in-service conditions, i.e., installed behind a 1.52-m wide sidewalk, when impacted by 1100C under MASH TL-3 conditions. The sidewalk reduced the impact severity on the TMBR, and the MASH Criterion N was met under the in-service conditions. Although the longitudinal OIV value still exceeded the MASH limit, the 3.93% over the limit was small enough to be considered within the error margins without serious safety concerns.
The simulation results should be interpreted for the general trends of vehicular responses and TMBR performance. The potential issues or safety concerns indicated by the simulation results should be considered in future designs and/or design improvement. However, definitive conclusions about TMBR performance under specific impact scenarios cannot be drawn solely from these simulations. Although full-scale crash tests are extremely valuable and indispensable, computer simulation has proven to be an effective tool for crashworthiness and transportation safety studies.
The simulation results provide insights into general trends of vehicular responses and TMBR performance but should not be used as definitive conclusions about its performance under specific impact scenarios. The potential issues or safety concerns identified in the simulations can guide future designs, improvements, and further testing. Full-scale crash tests are essential for validating simulation results and assessing real-world performance. Computer simulations have proven to be a valuable tool in crashworthiness and transportation safety studies, complementing physical tests by providing cost-effective ways to explore various design options for different crash scenarios.
Author Contributions
Conceptualization, H.F.; methodology, H.F.; software, E.P. and L.P.; validation, E.P., L.P. and D.W.; formal analysis, E.P. and L.P.; investigation, H.F., E.P. and Q.W.; resources, H.F.; data curation, E.P., L.P. and D.W.; writing—original draft preparation, H.F. and Q.W.; writing—review and editing, H.F., C.J., Q.W., E.P., L.P., D.W; visualization, E.P., Q.W. and L.P.; supervision, H.F.; project administration, H.F.; funding acquisition, H.F. All authors have read and agreed to the published version of the manuscript.
Figure 1.
A three-bar metal bridge rail [
1].
Figure 1.
A three-bar metal bridge rail [
1].
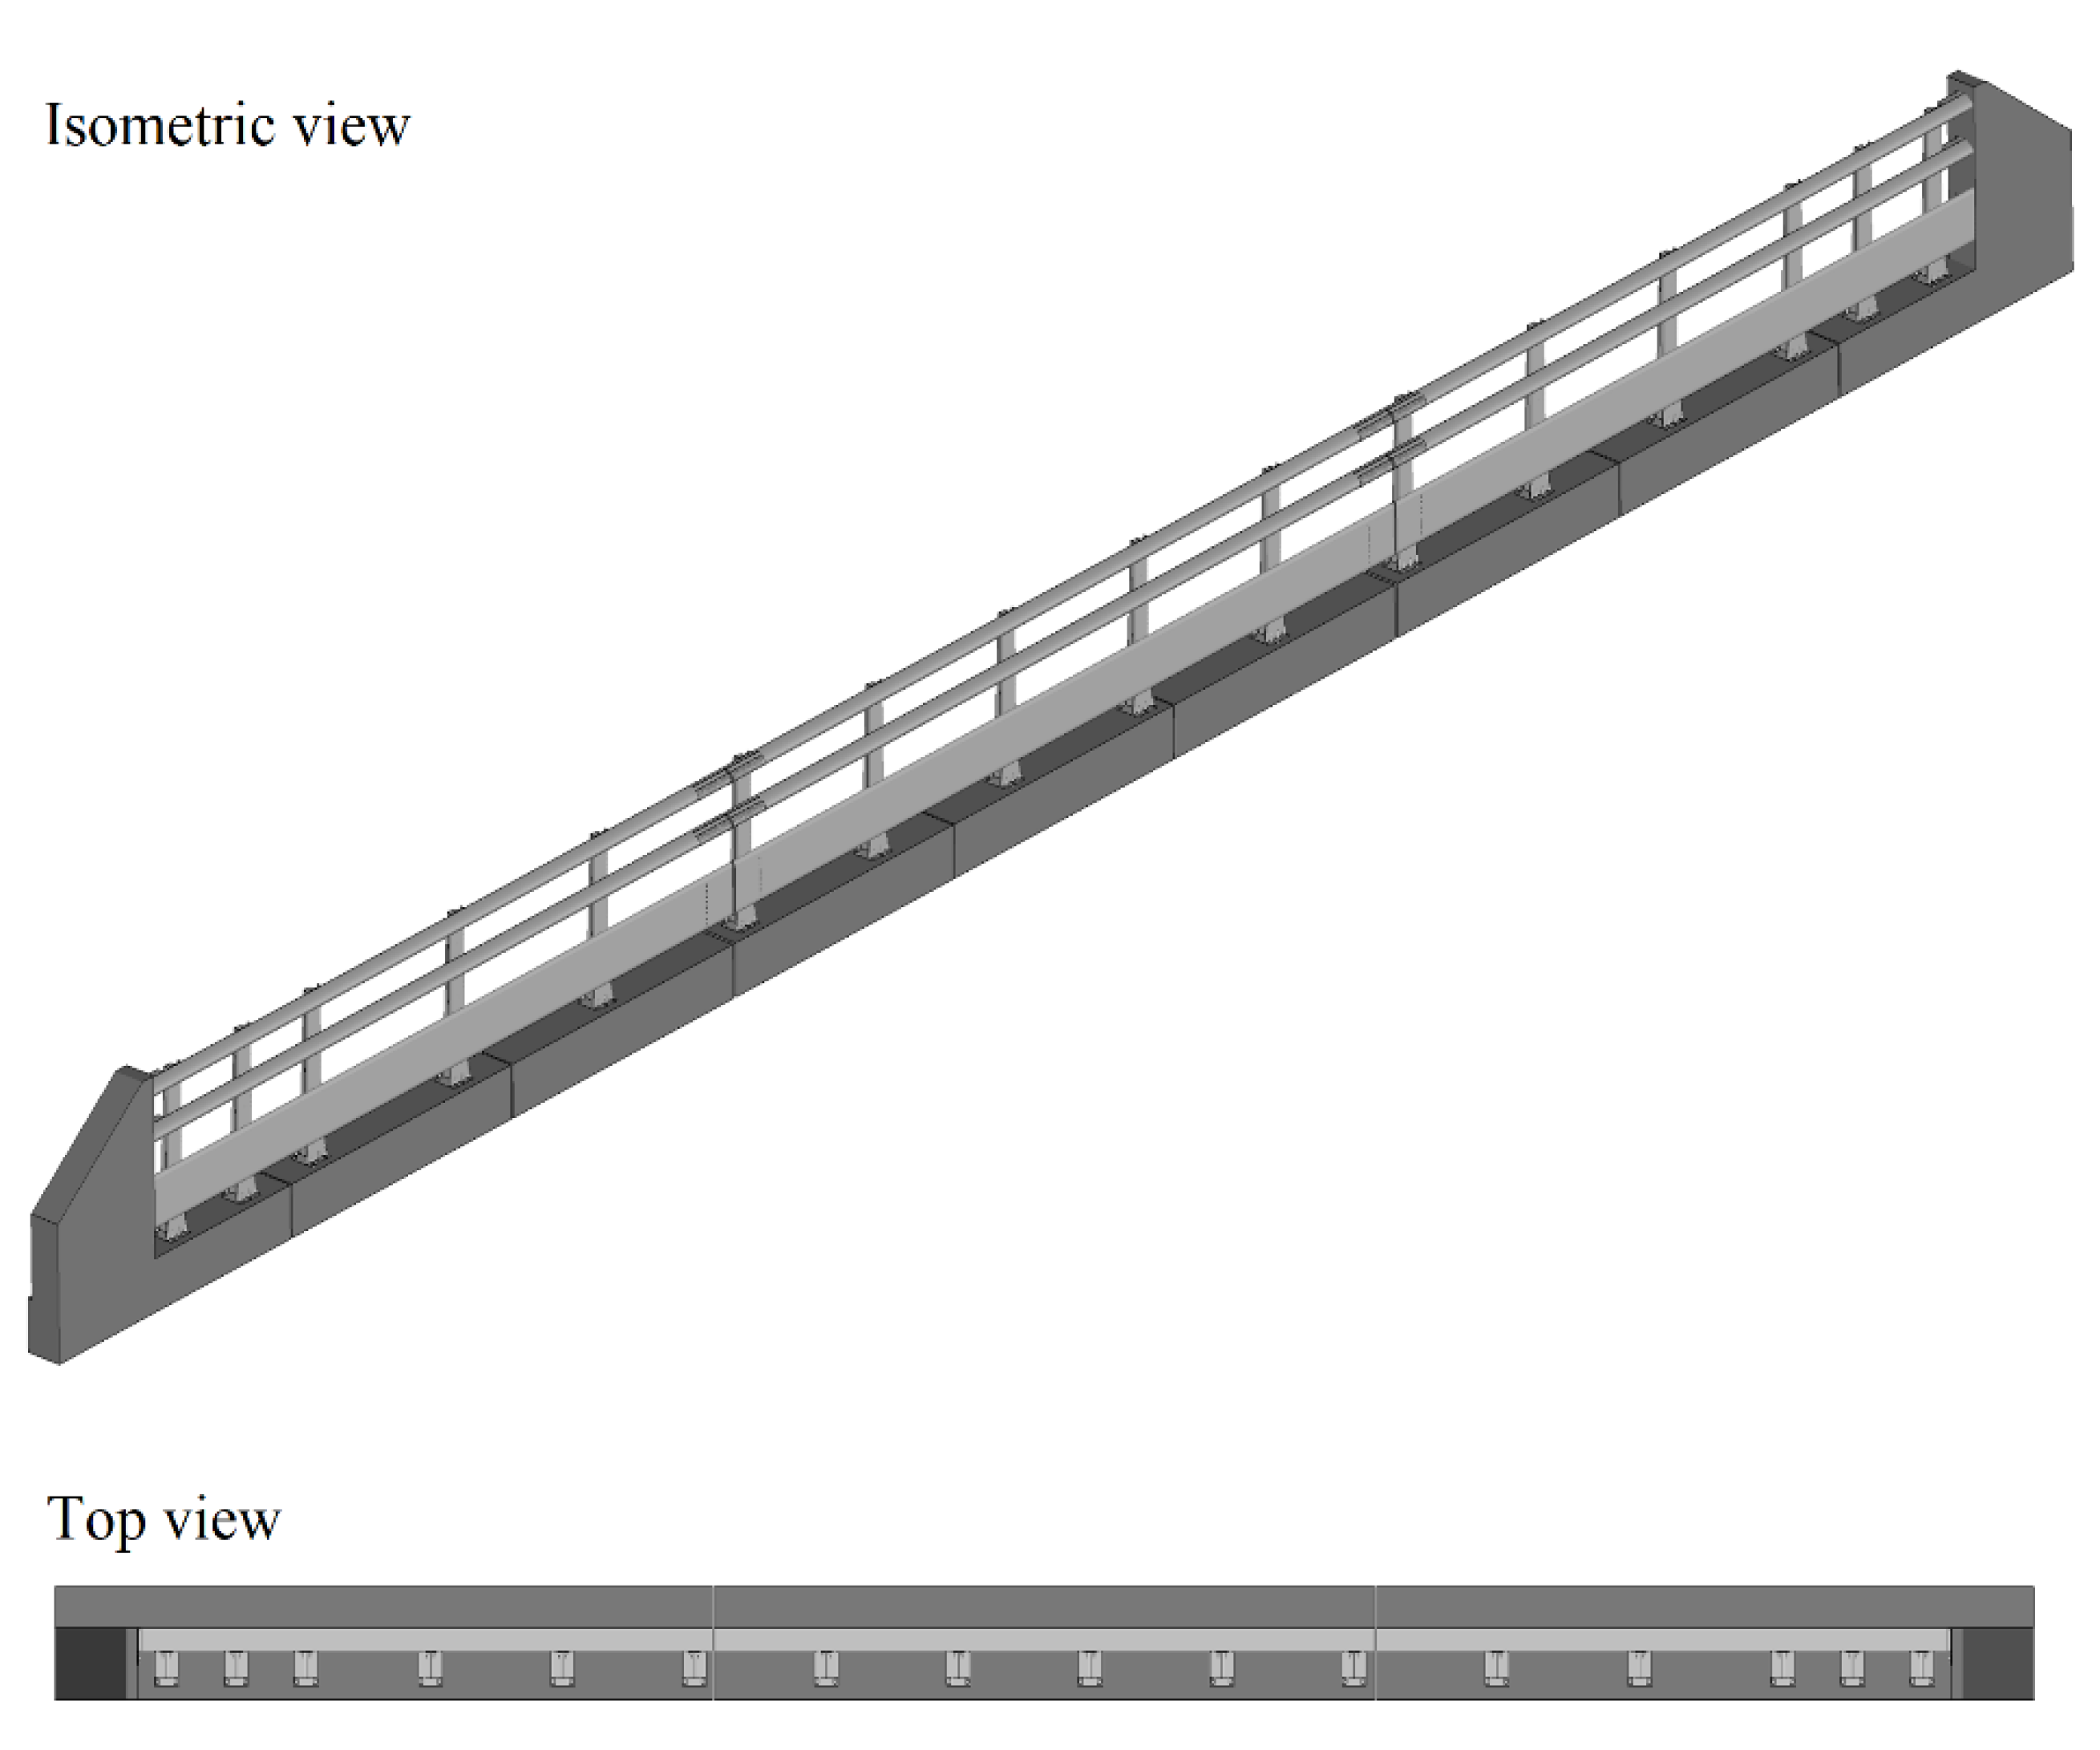
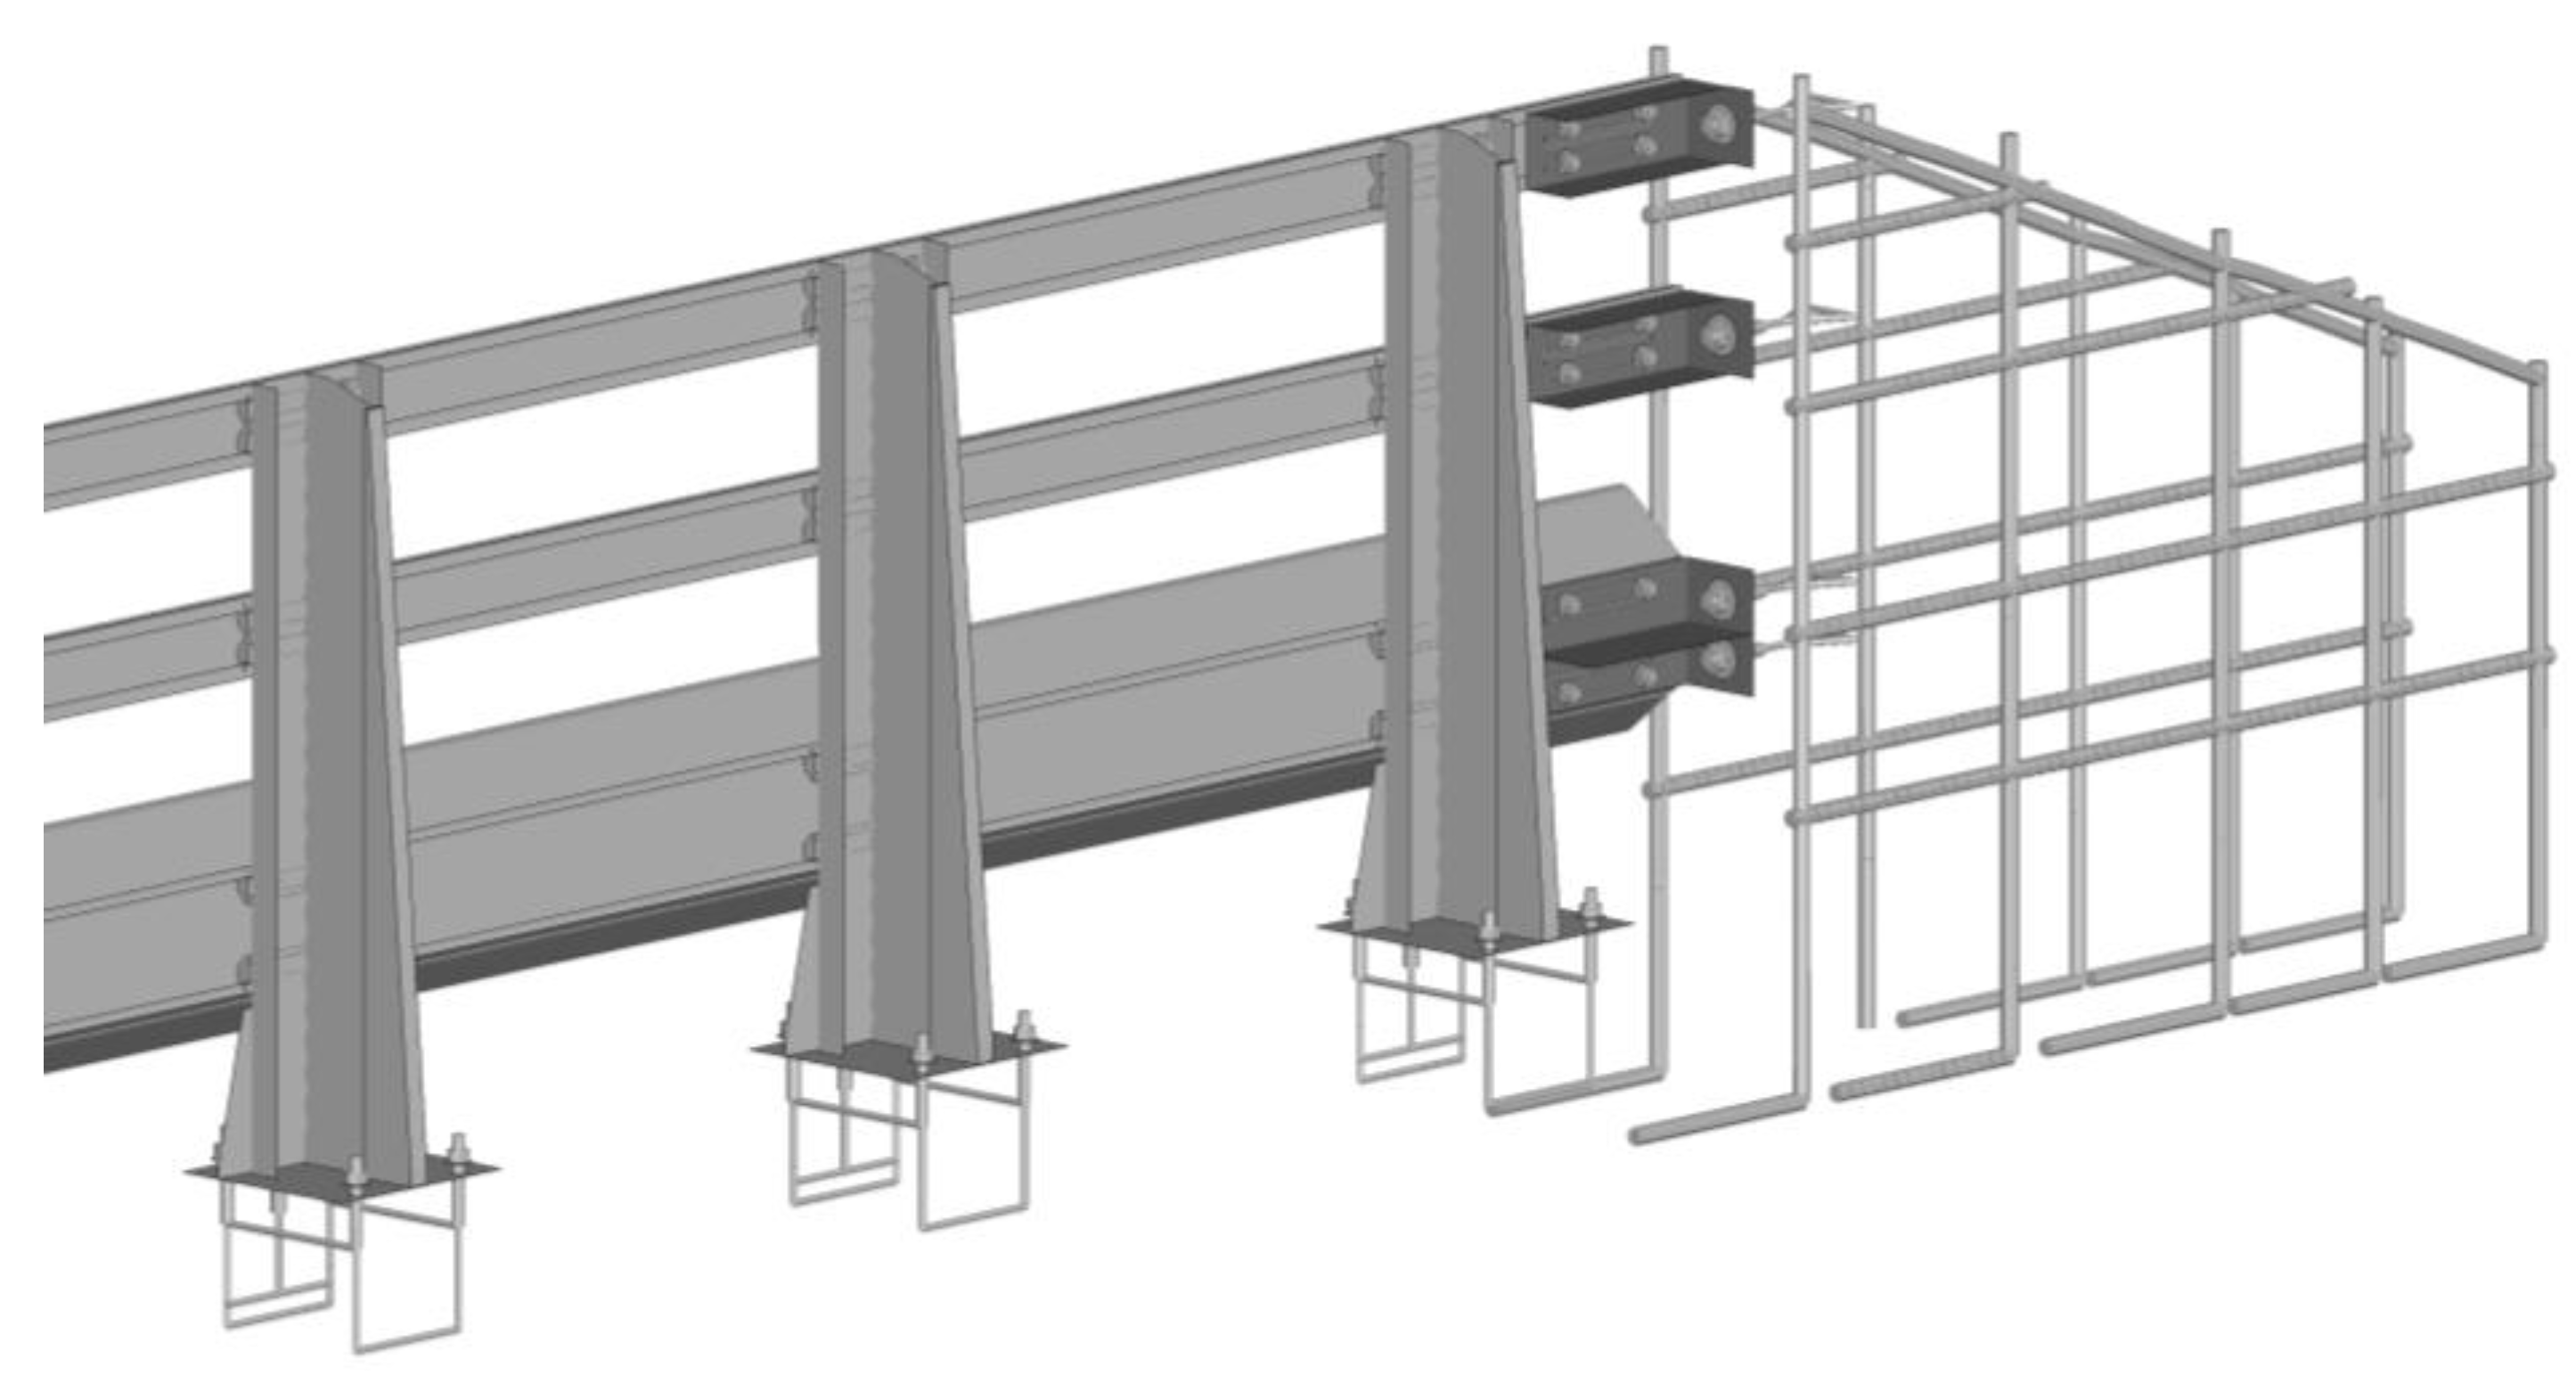
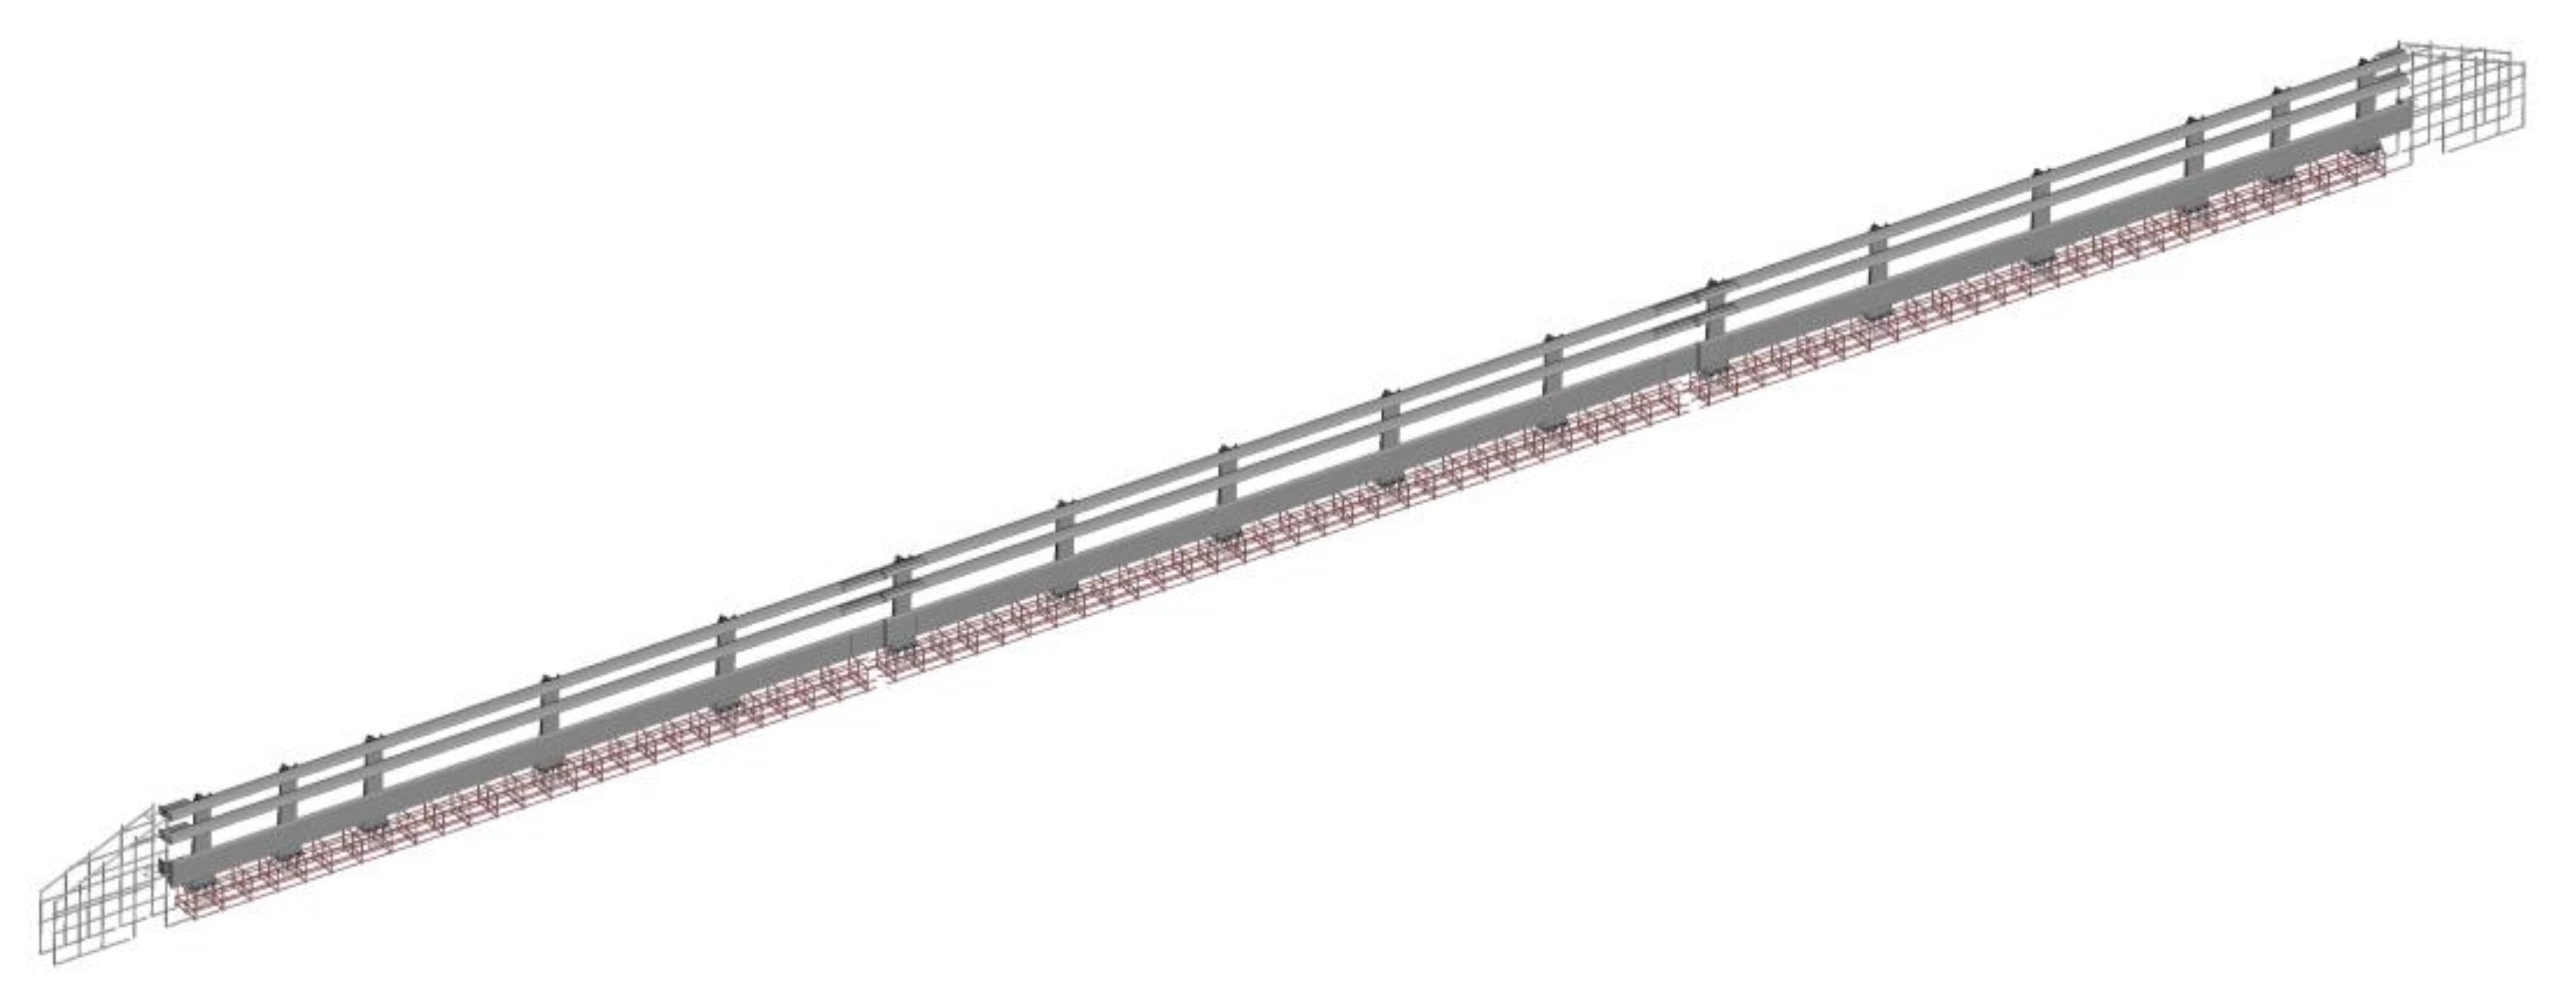
Figure 2.
FE model of the TMBR.
Figure 2.
FE model of the TMBR.
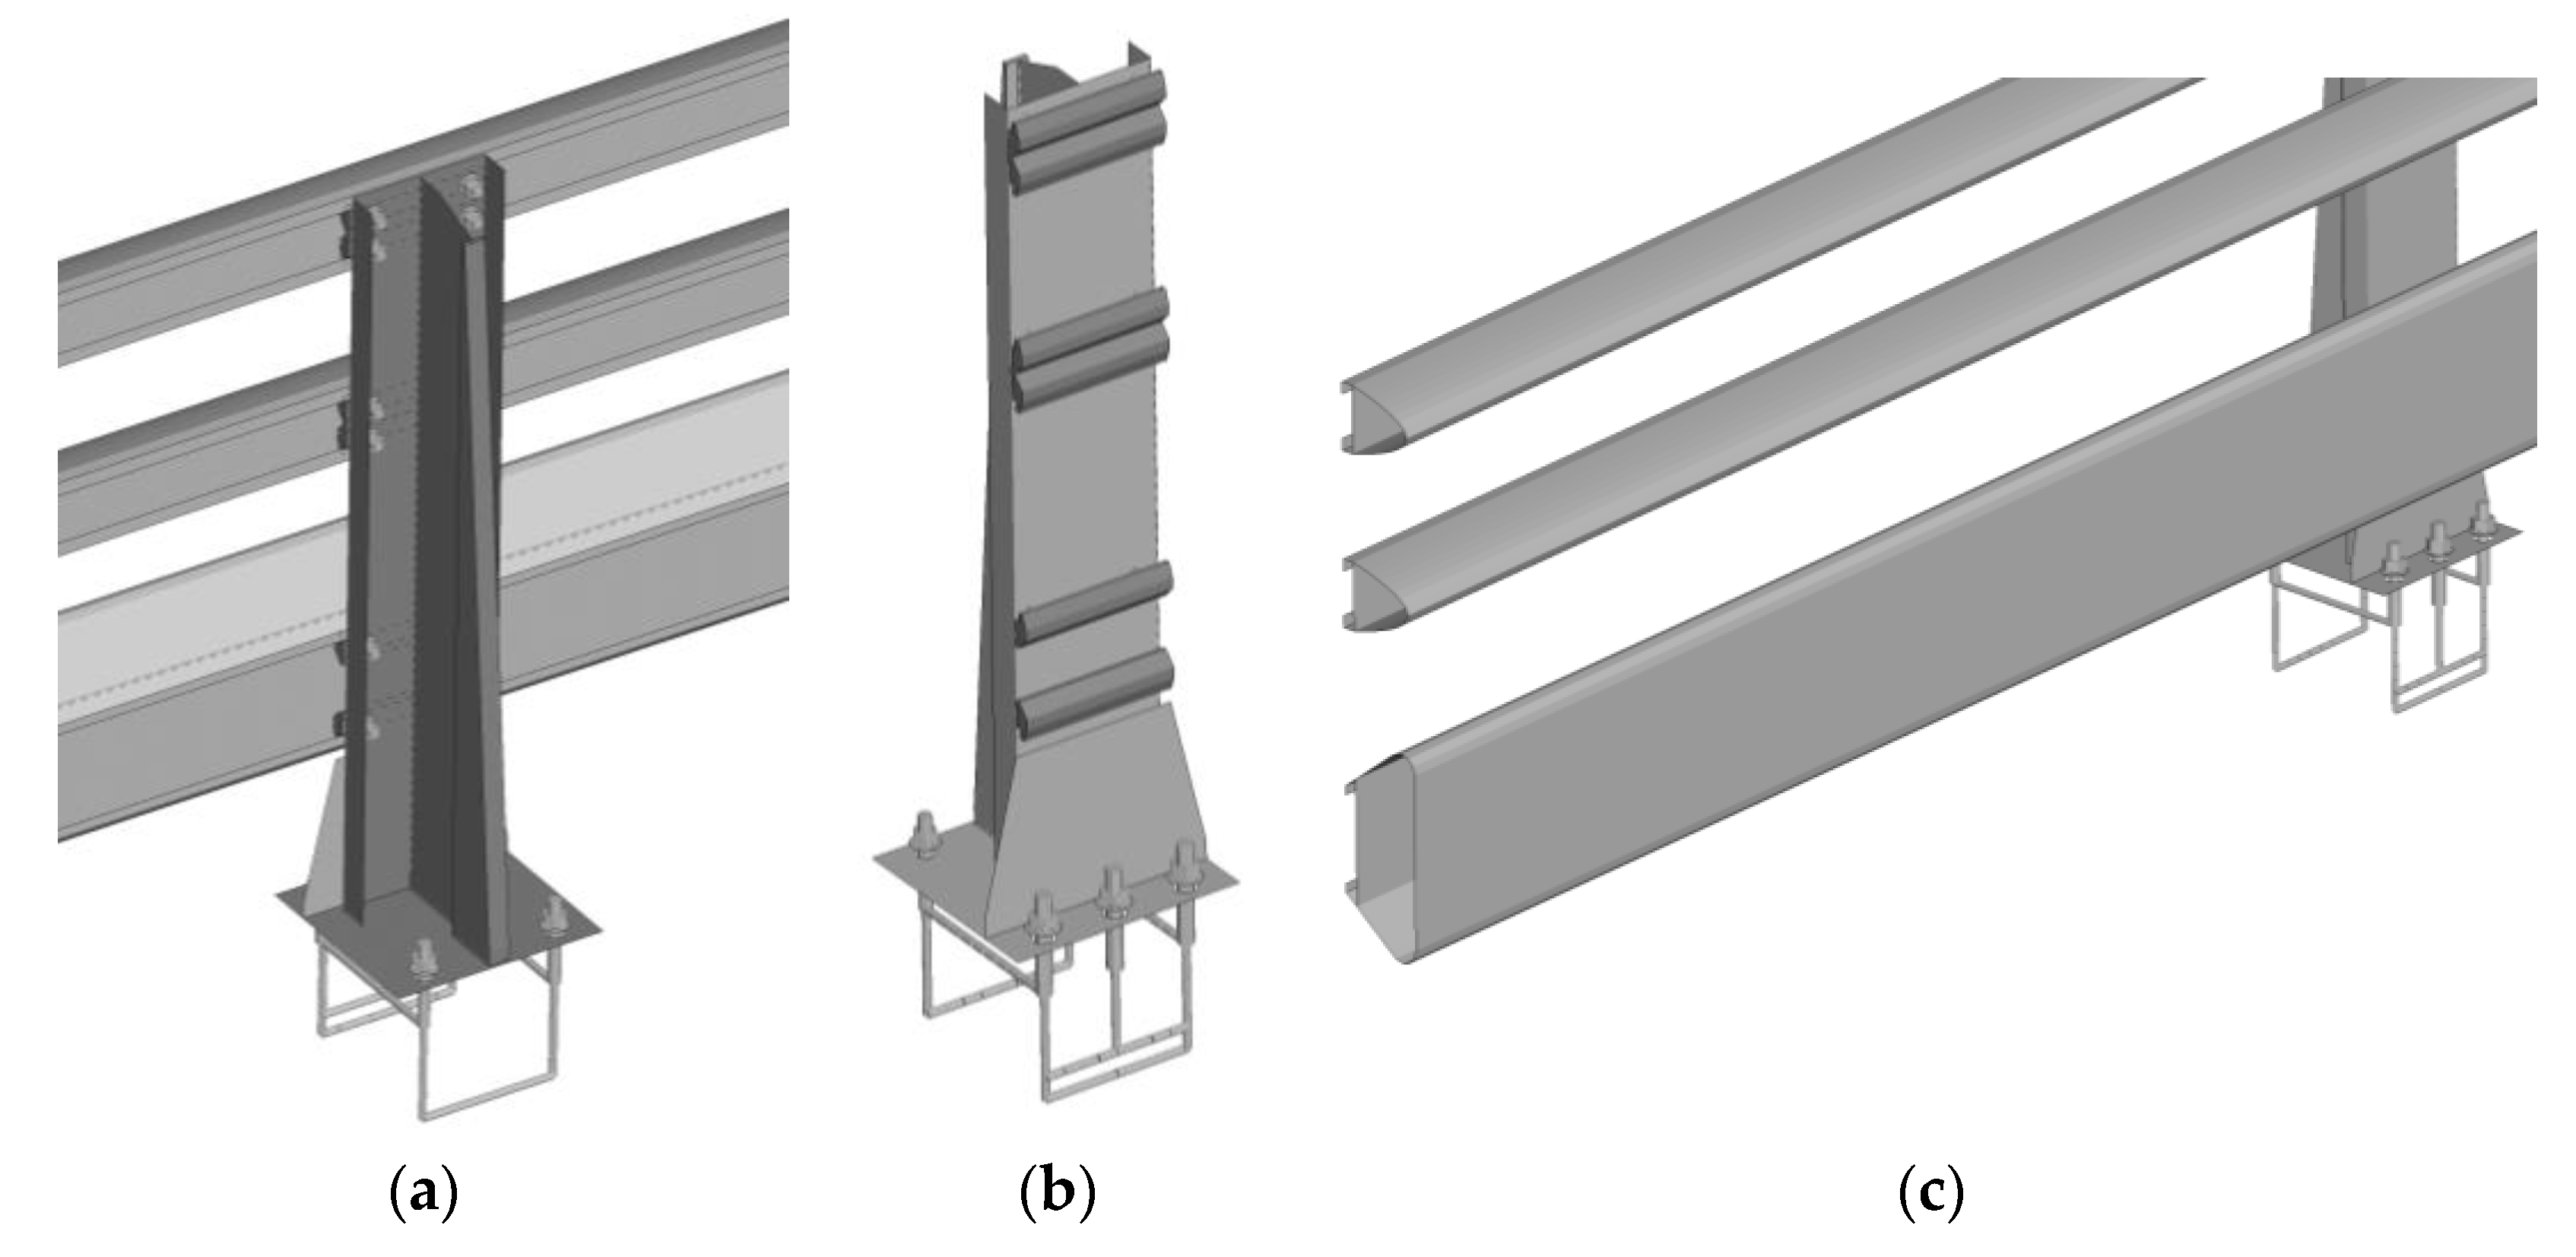
Figure 3.
Rail-post assembly of TMBR: (a) Rear view; (b) front view of the post without rails; (c) front view of rails.
Figure 3.
Rail-post assembly of TMBR: (a) Rear view; (b) front view of the post without rails; (c) front view of rails.
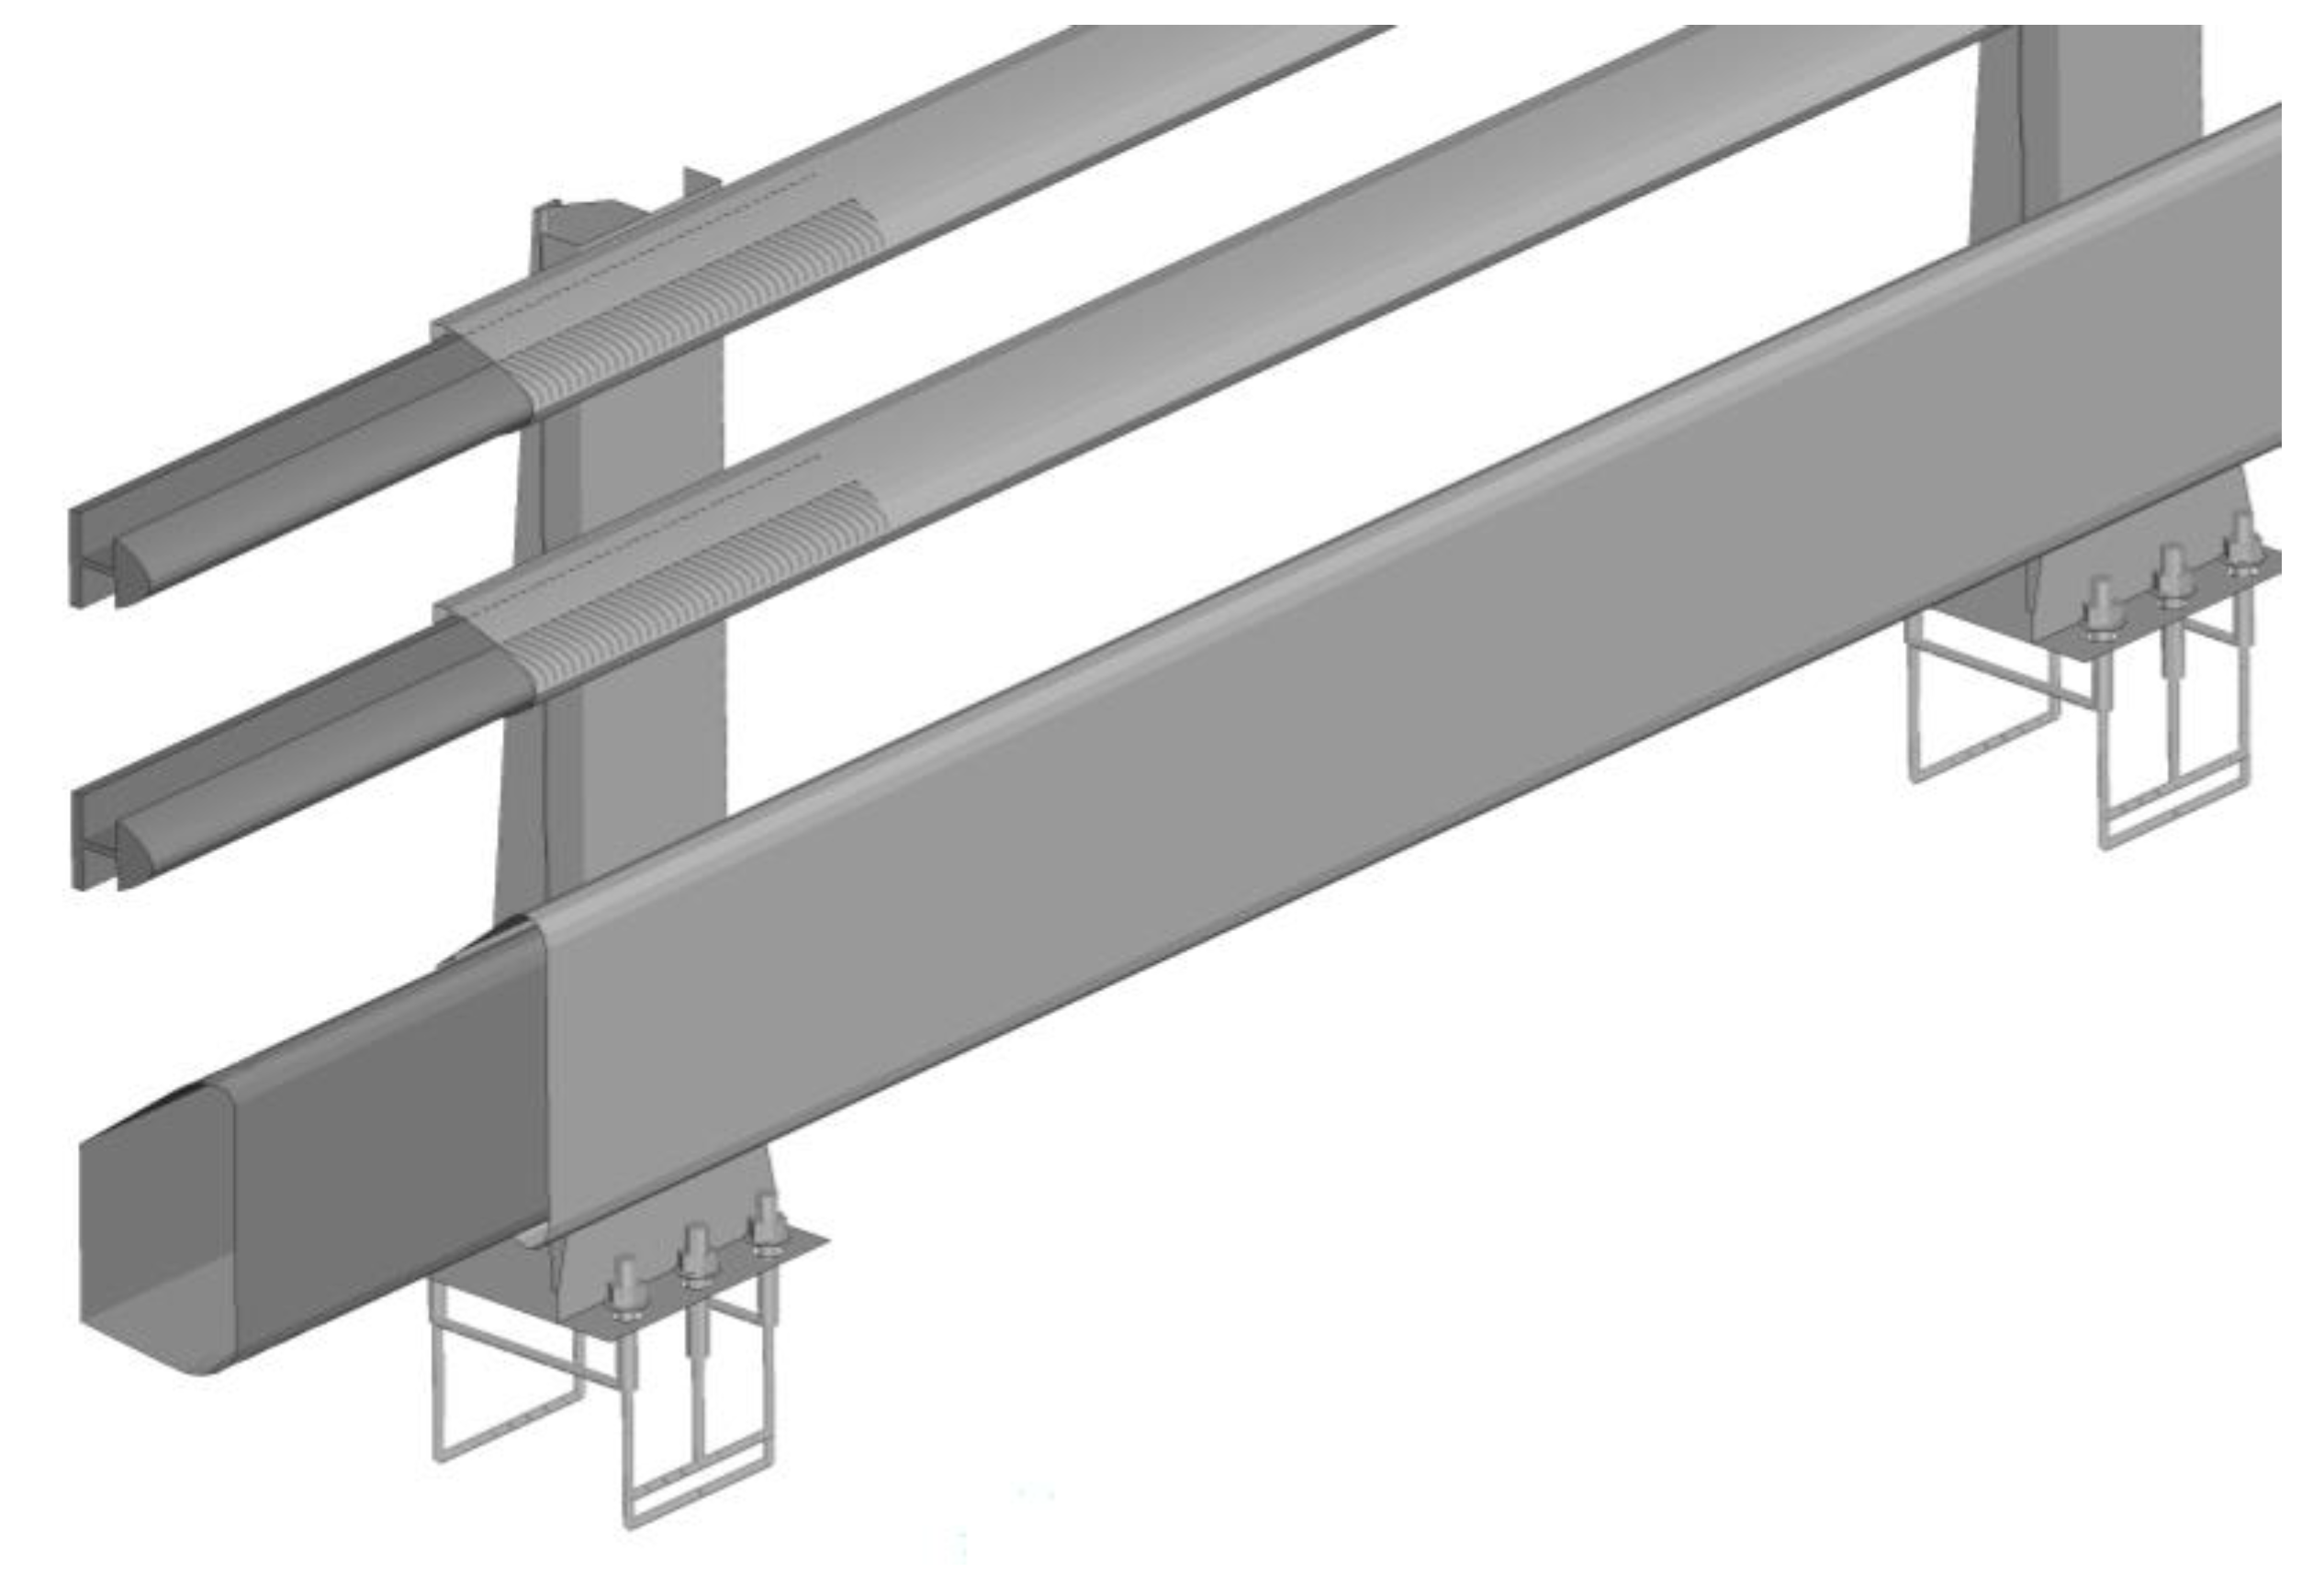
Figure 4.
Expansion joint of the TMBR.
Figure 4.
Expansion joint of the TMBR.
Figure 5.
Rail connections to the concrete parapet and terminal of the TMBR.
Figure 5.
Rail connections to the concrete parapet and terminal of the TMBR.
Figure 6.
Beam elements for the reinforcing bars embedded in a concrete terminal of the TMBR.
Figure 6.
Beam elements for the reinforcing bars embedded in a concrete terminal of the TMBR.
Figure 7.
Beam elements for the reinforcing bars embedded in the concrete parapet of the TMBR.
Figure 7.
Beam elements for the reinforcing bars embedded in the concrete parapet of the TMBR.
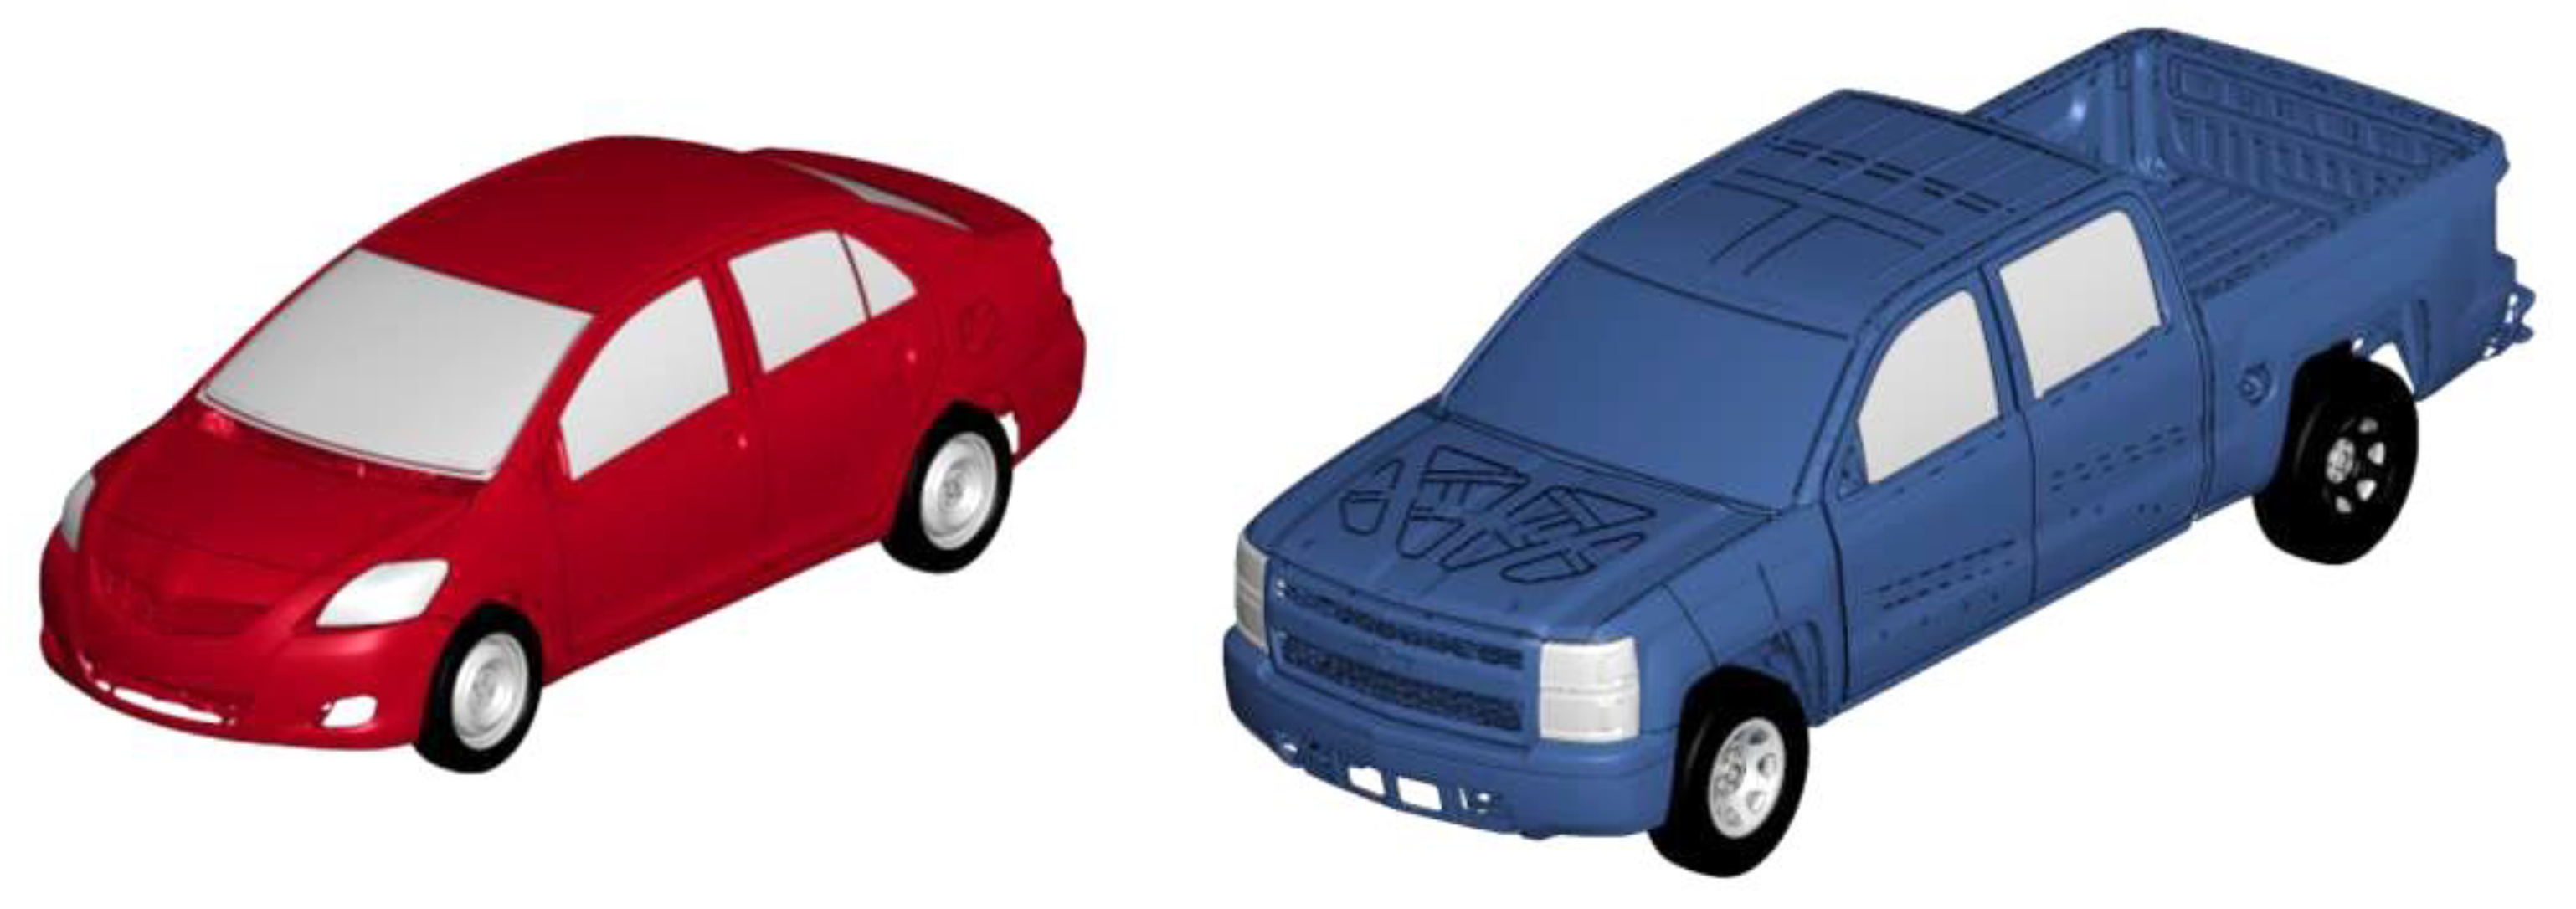
Figure 8.
Vehicle models of a 2010 Toyota Yaris (left) and a 2014 Chevy Silverado (right).
Figure 8.
Vehicle models of a 2010 Toyota Yaris (left) and a 2014 Chevy Silverado (right).
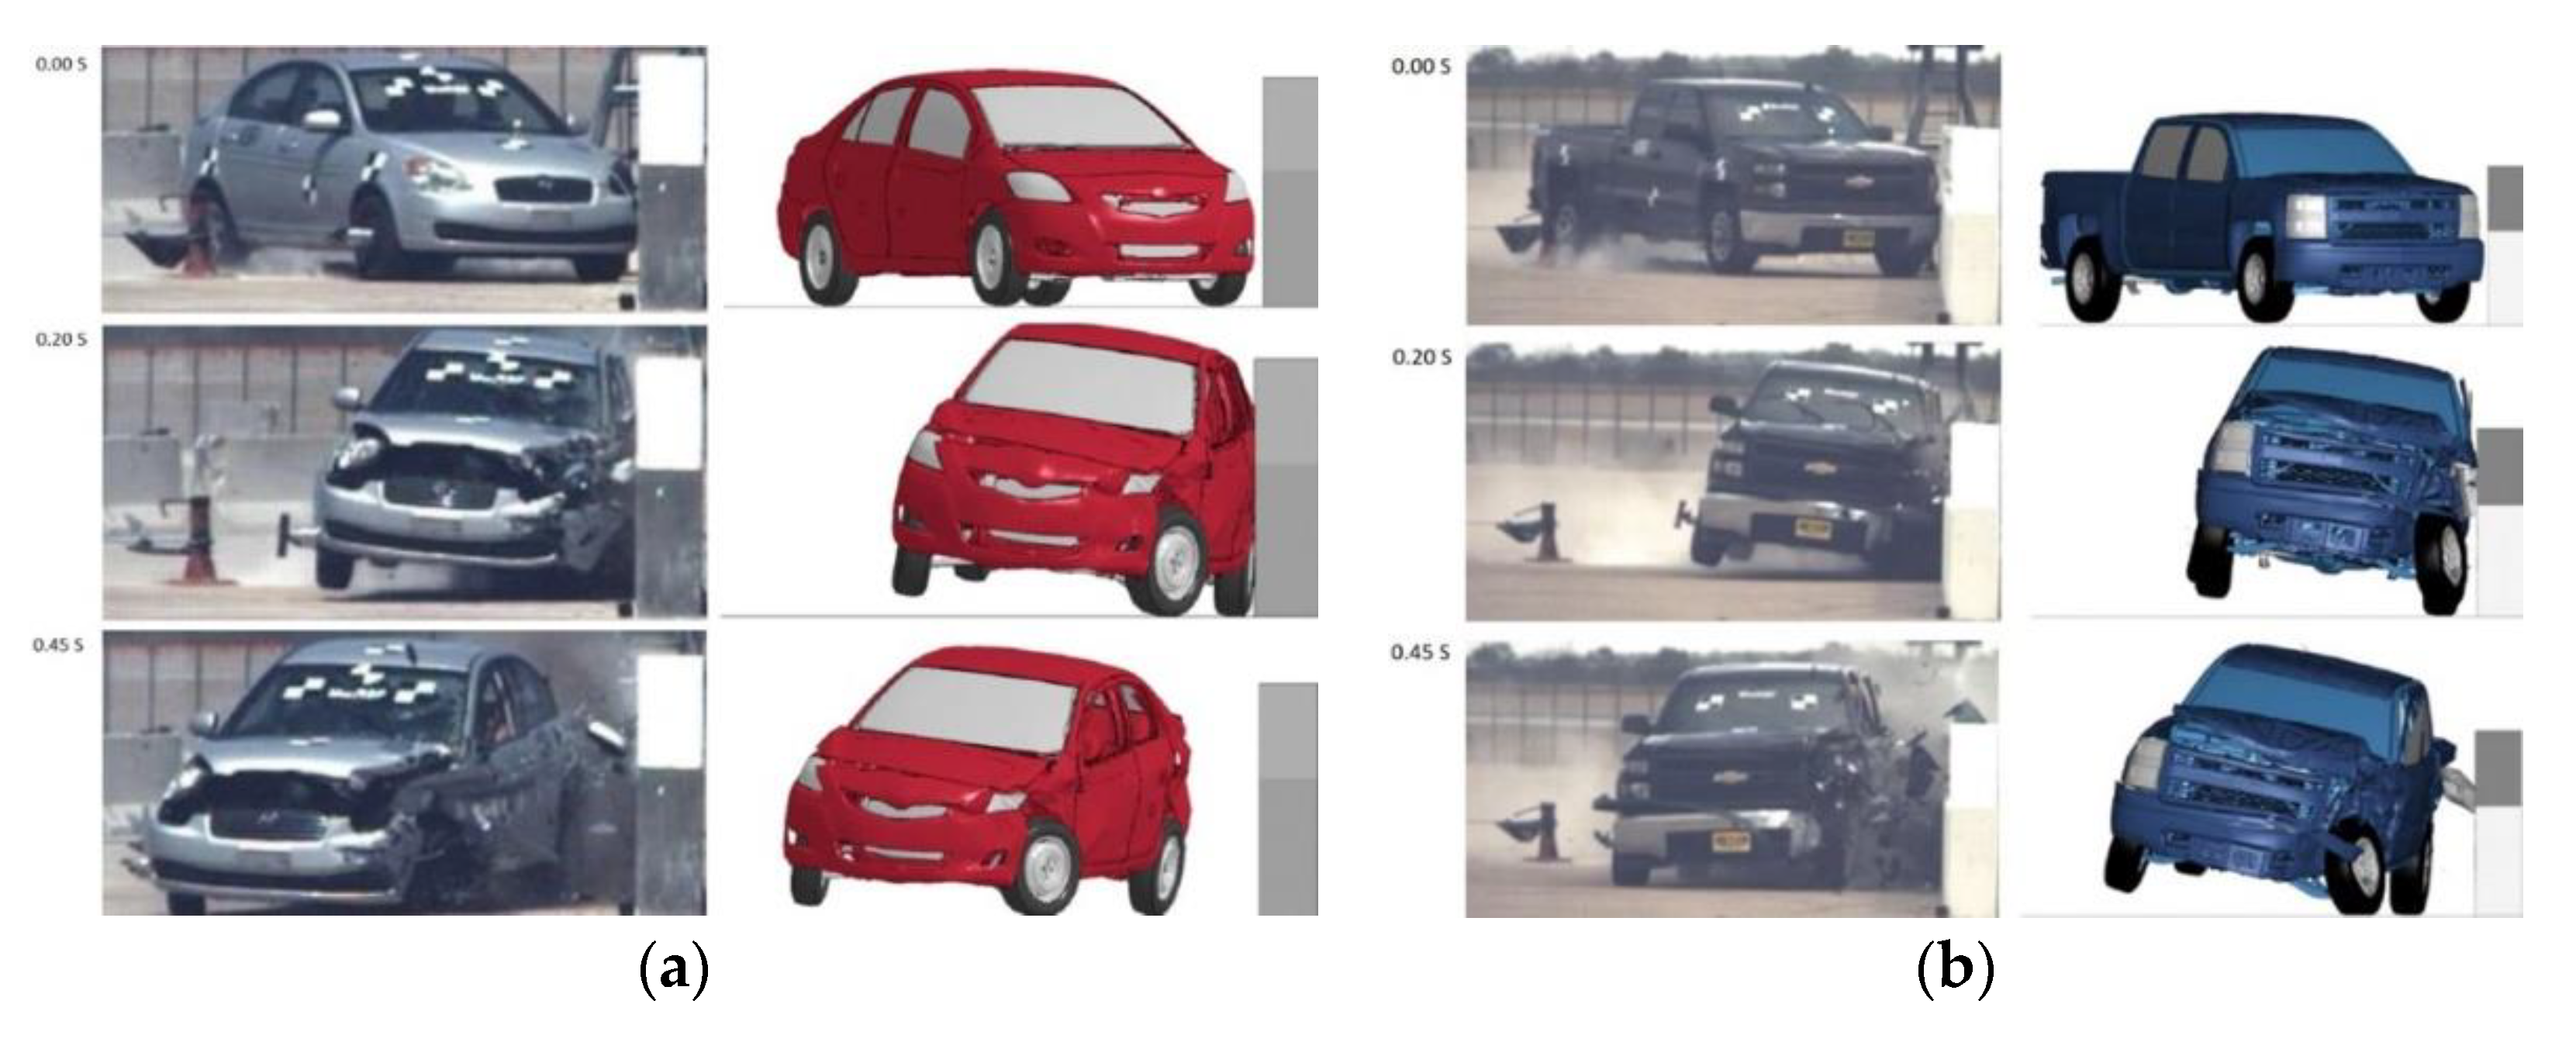
Figure 9.
Comparison of simulation results and physical tests at MASH TL-3 conditions [
72]: (
a) 2010 Hyundai Assent (test) and 2010 Toyota Yaris (simulation); (
b) 2015 Chevy Silverado (test) and 2014 Chevy Silverado (simulation).
Figure 9.
Comparison of simulation results and physical tests at MASH TL-3 conditions [
72]: (
a) 2010 Hyundai Assent (test) and 2010 Toyota Yaris (simulation); (
b) 2015 Chevy Silverado (test) and 2014 Chevy Silverado (simulation).
Figure 10.
Comparison of vehicle trajectories for the 1100C test vehicles: (
a) Crash test with 2010 Hyundai Accent [
73]; (
b) simulation with 2010 Toyota Yaris [
72].
Figure 10.
Comparison of vehicle trajectories for the 1100C test vehicles: (
a) Crash test with 2010 Hyundai Accent [
73]; (
b) simulation with 2010 Toyota Yaris [
72].
Figure 11.
Comparison of vehicle trajectories for the 2270P test vehicles: (
a) Crash test with 2015 Chevy Silverado [
73]; (
b) simulation with 2014 Chevy Silverado [
72].
Figure 11.
Comparison of vehicle trajectories for the 2270P test vehicles: (
a) Crash test with 2015 Chevy Silverado [
73]; (
b) simulation with 2014 Chevy Silverado [
72].
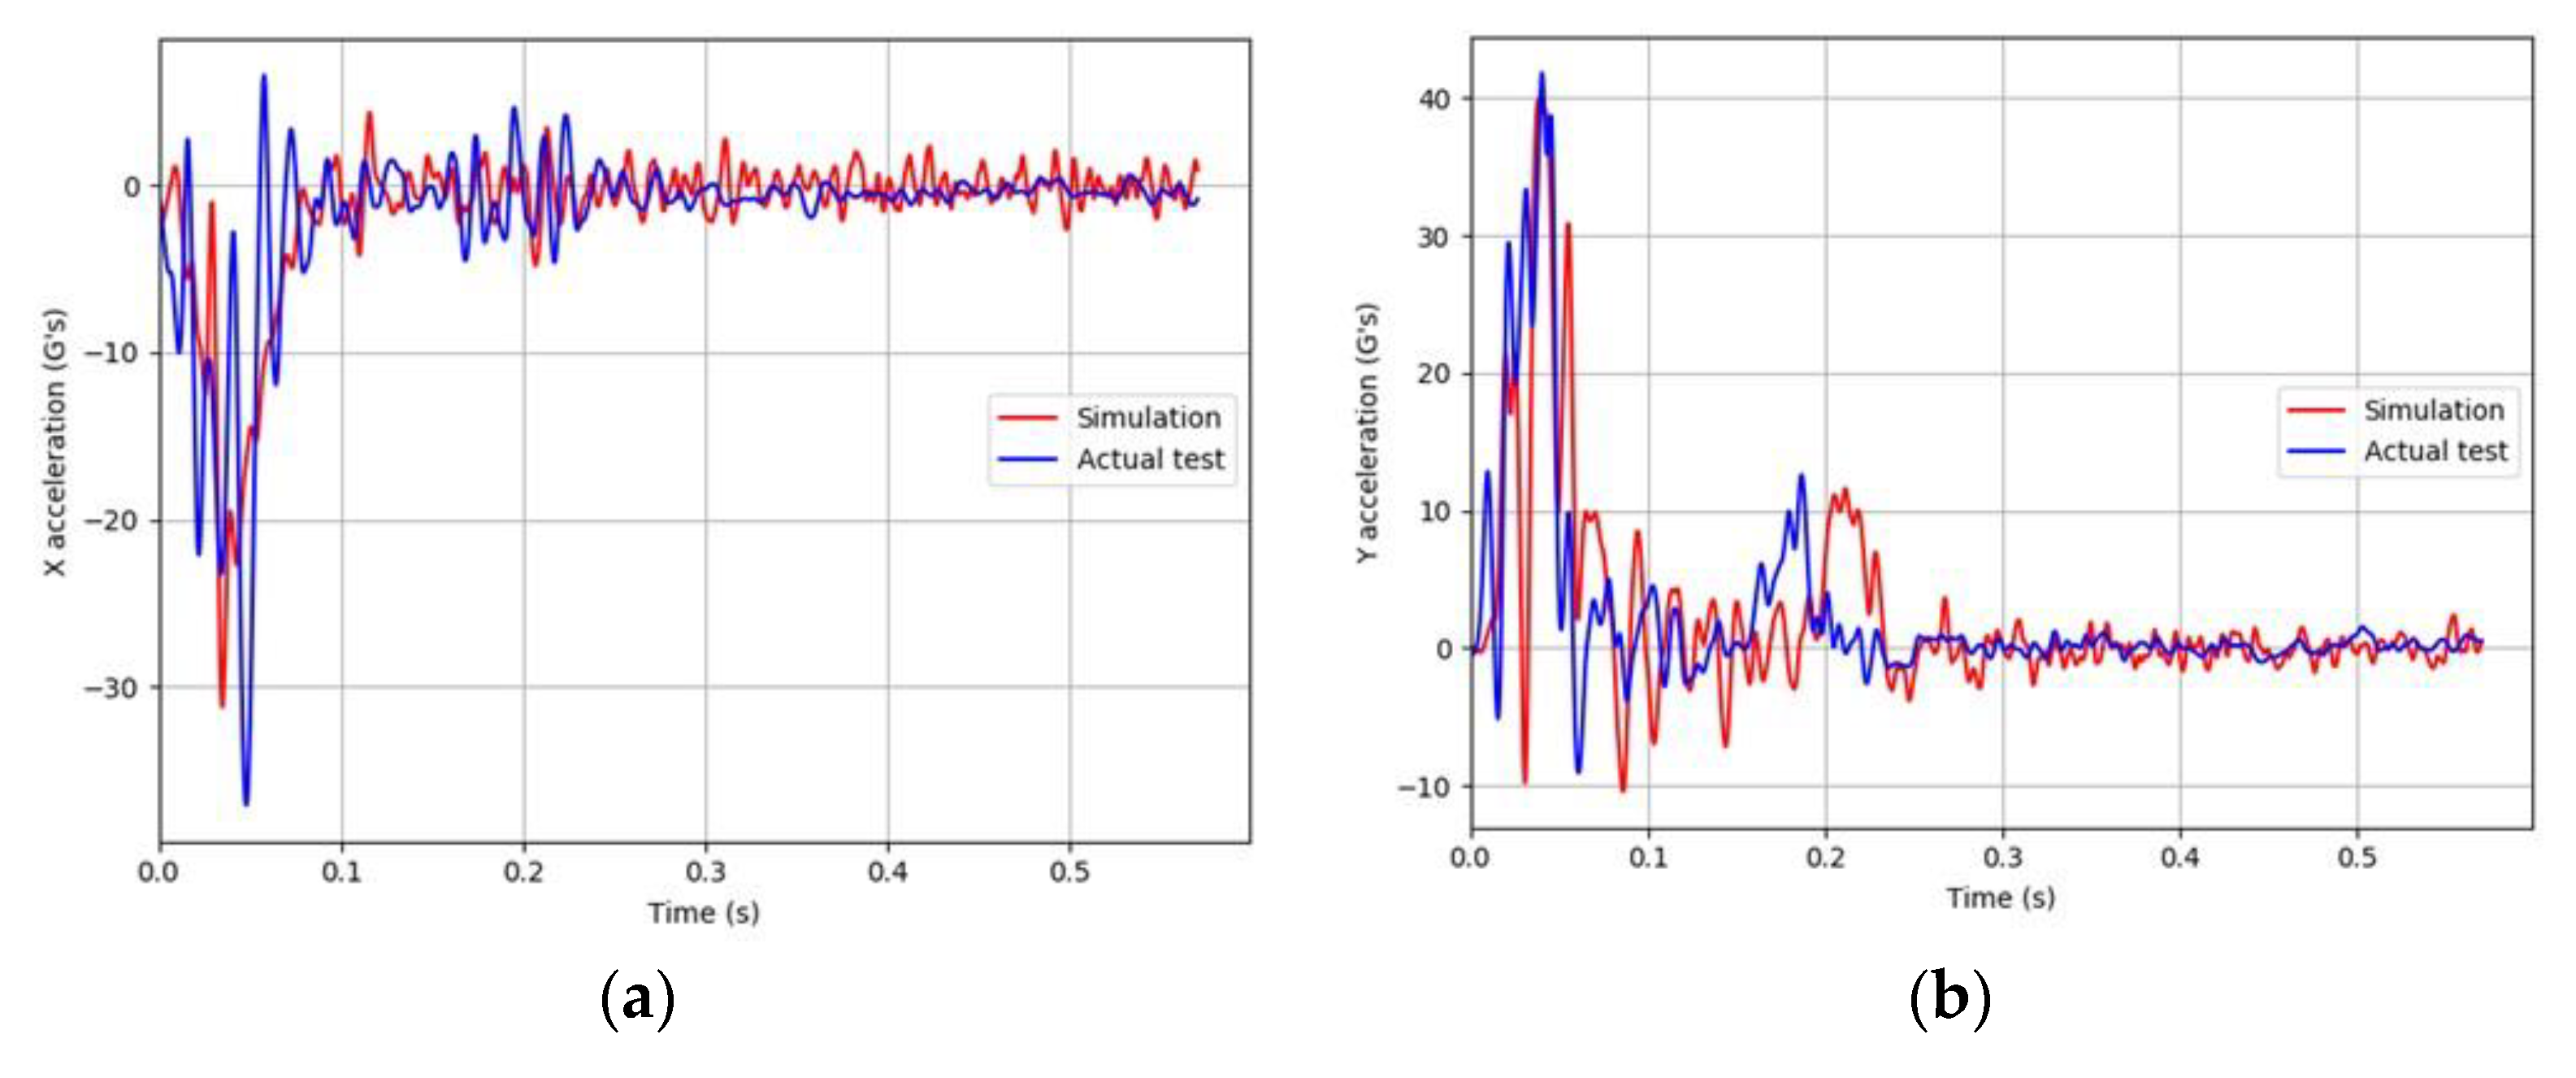
Figure 12.
Accelerations histories of the 2010 Hyundai Accent (test) and 2010 Toyota Yaris (simulation): (a) Longitudinal “x” acceleration; (b) Lateral “y” acceleration.
Figure 12.
Accelerations histories of the 2010 Hyundai Accent (test) and 2010 Toyota Yaris (simulation): (a) Longitudinal “x” acceleration; (b) Lateral “y” acceleration.
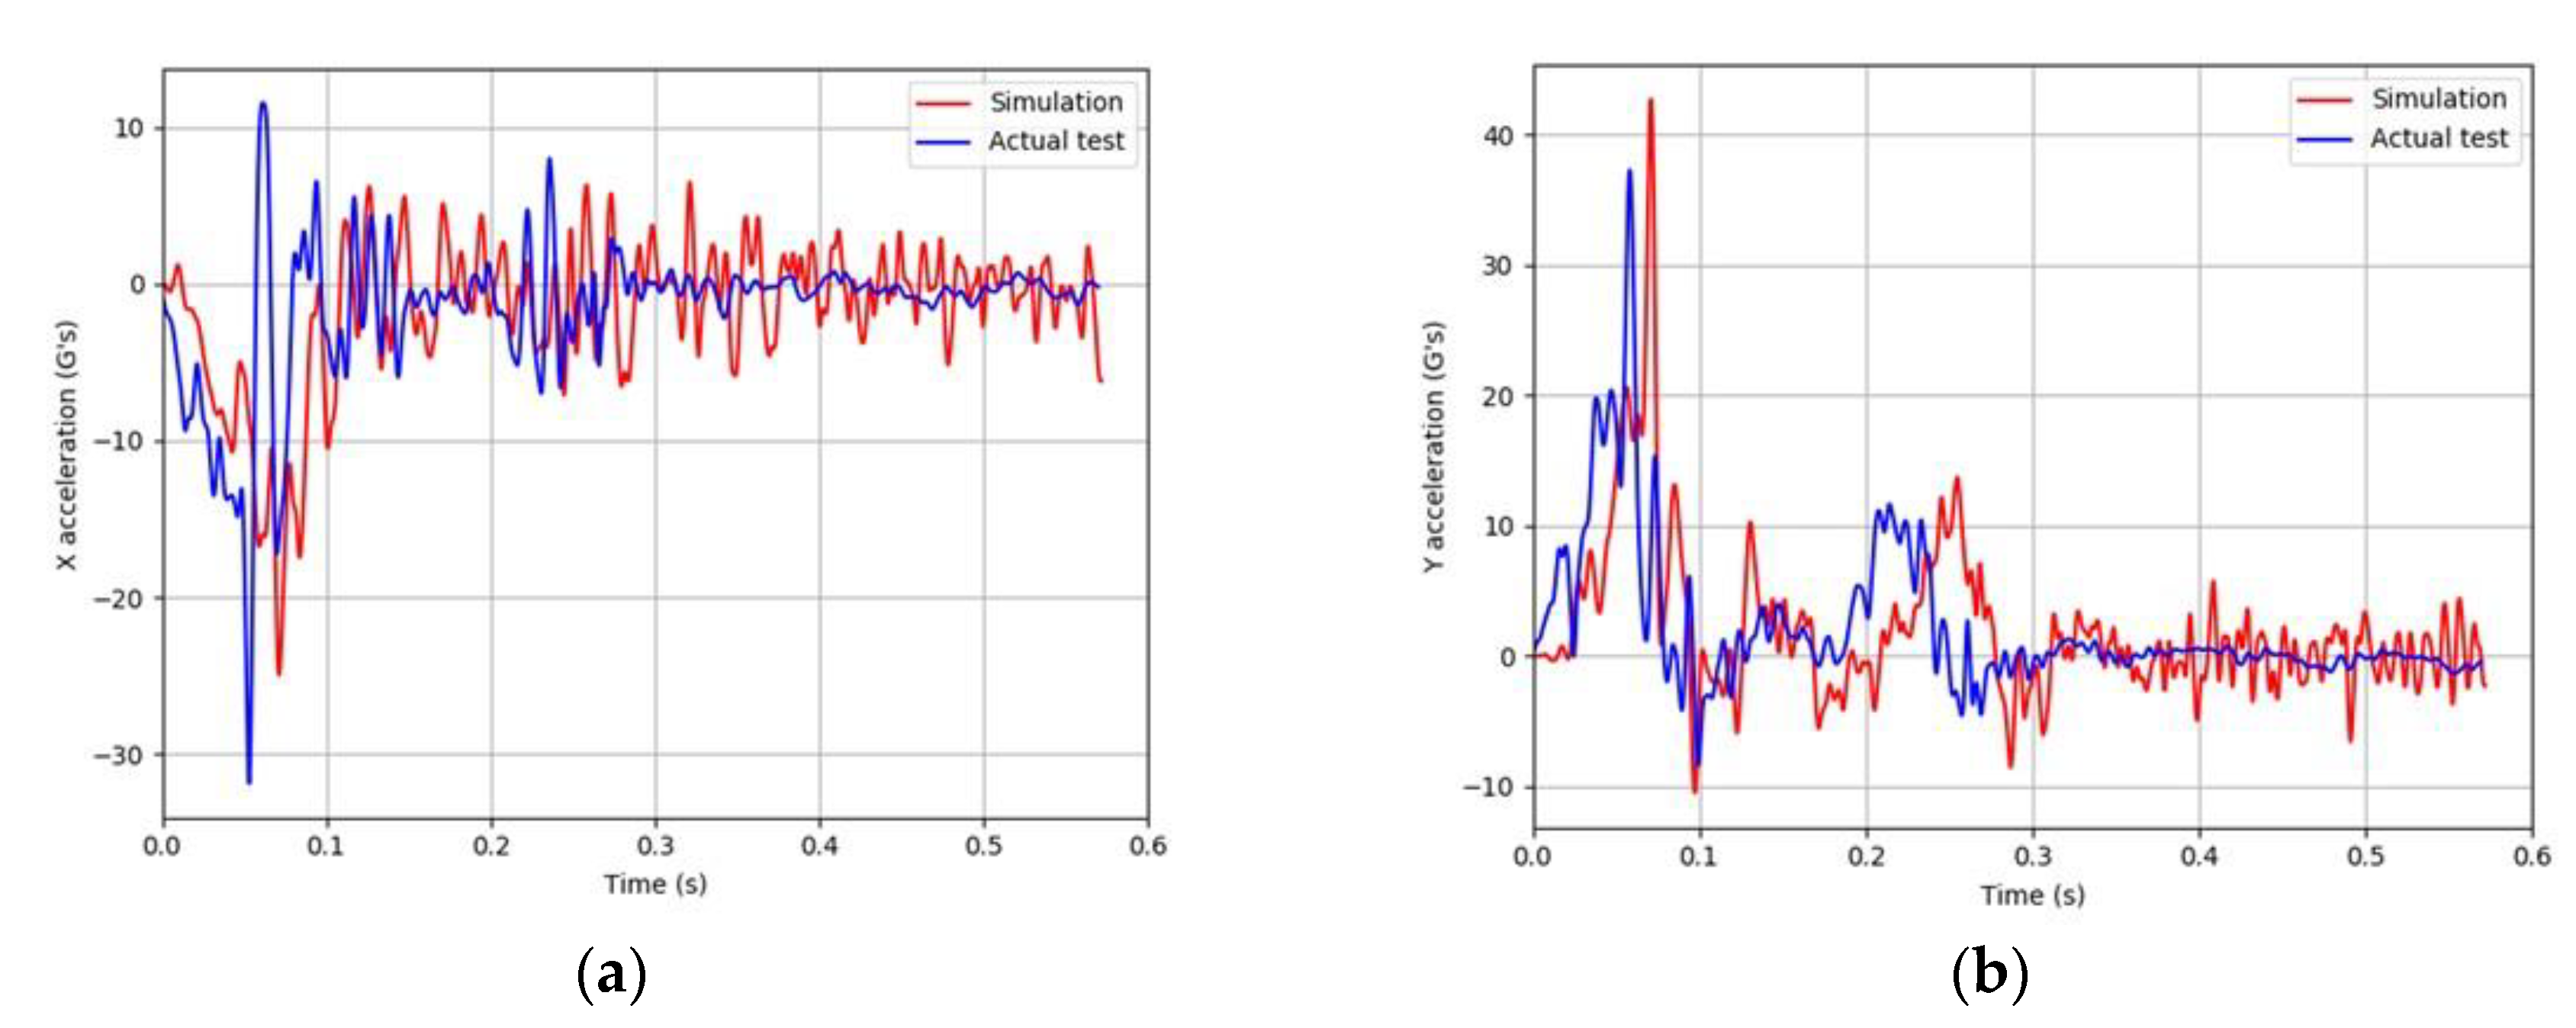
Figure 13.
Acceleration histories of 2015 Chevy Silverado (test) and 2014 Chevy Silverado (simulation): (a) Longitudinal “x” acceleration; (b) Lateral “y” acceleration.
Figure 13.
Acceleration histories of 2015 Chevy Silverado (test) and 2014 Chevy Silverado (simulation): (a) Longitudinal “x” acceleration; (b) Lateral “y” acceleration.
Figure 14.
Definition of the MASH exit-box criterion.
Figure 14.
Definition of the MASH exit-box criterion.
Figure 15.
Vehicle trajectories impacting the TMBR at MASH TL-2 conditions: (a) 1100C; (b) 2270P.
Figure 15.
Vehicle trajectories impacting the TMBR at MASH TL-2 conditions: (a) 1100C; (b) 2270P.
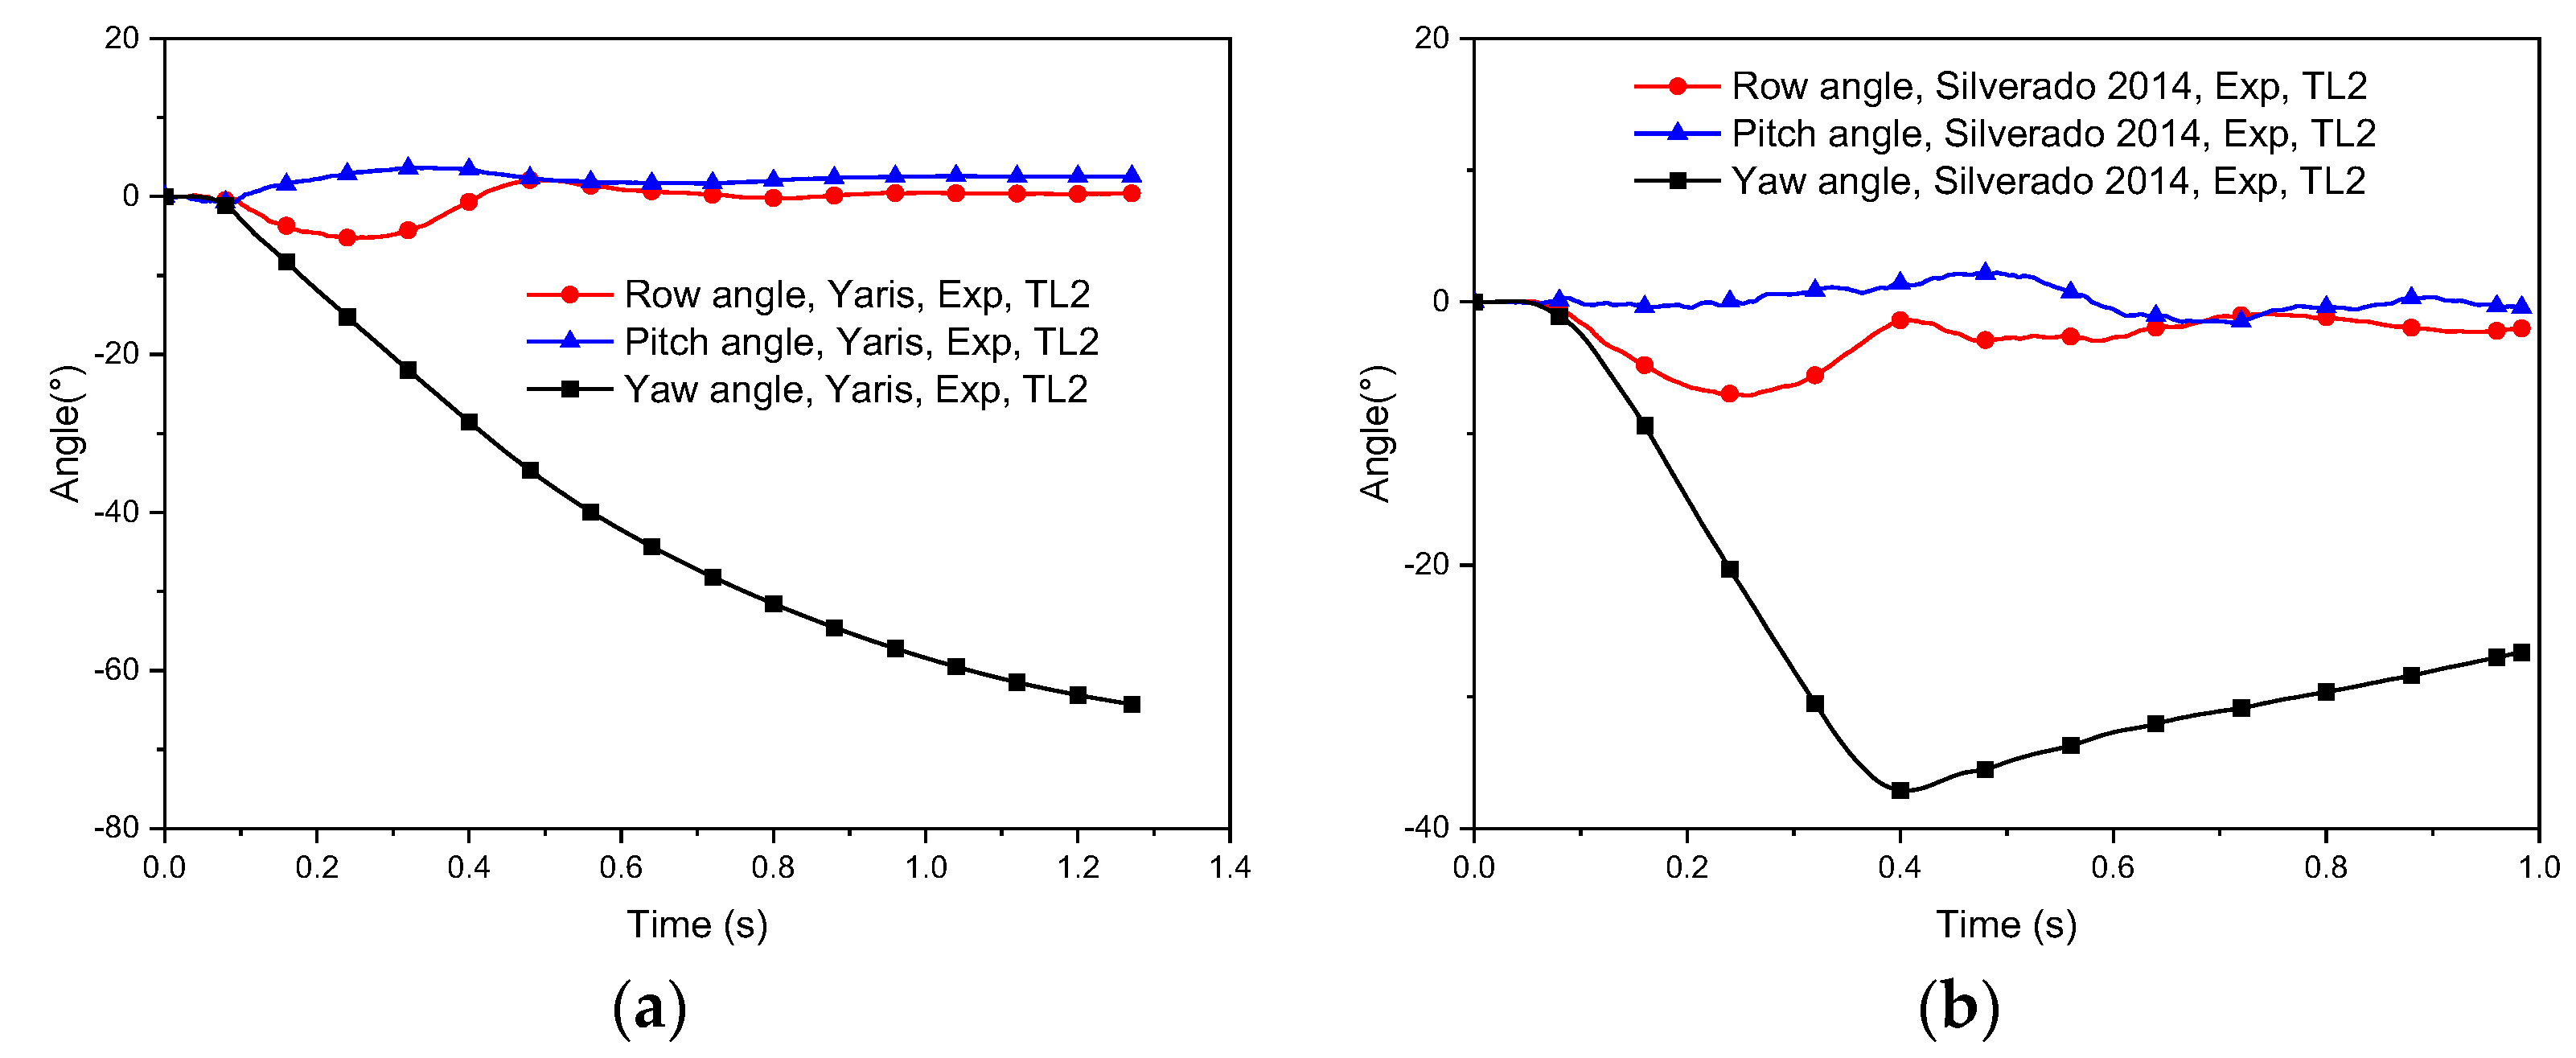
Figure 16.
Angular motion of test vehicles at MASH TL-2 conditions: (a) 1100C; (b) 2270P.
Figure 16.
Angular motion of test vehicles at MASH TL-2 conditions: (a) 1100C; (b) 2270P.
Figure 17.
Vehicle trajectories impacting the TMBR at MASH TL-3 conditions: (a) 1100C; (b) 2270P.
Figure 17.
Vehicle trajectories impacting the TMBR at MASH TL-3 conditions: (a) 1100C; (b) 2270P.
Figure 18.
Angular motion of test vehicles at MASH TL-3 conditions: (a) 1100C; (b) 2270P.
Figure 18.
Angular motion of test vehicles at MASH TL-3 conditions: (a) 1100C; (b) 2270P.
Figure 19.
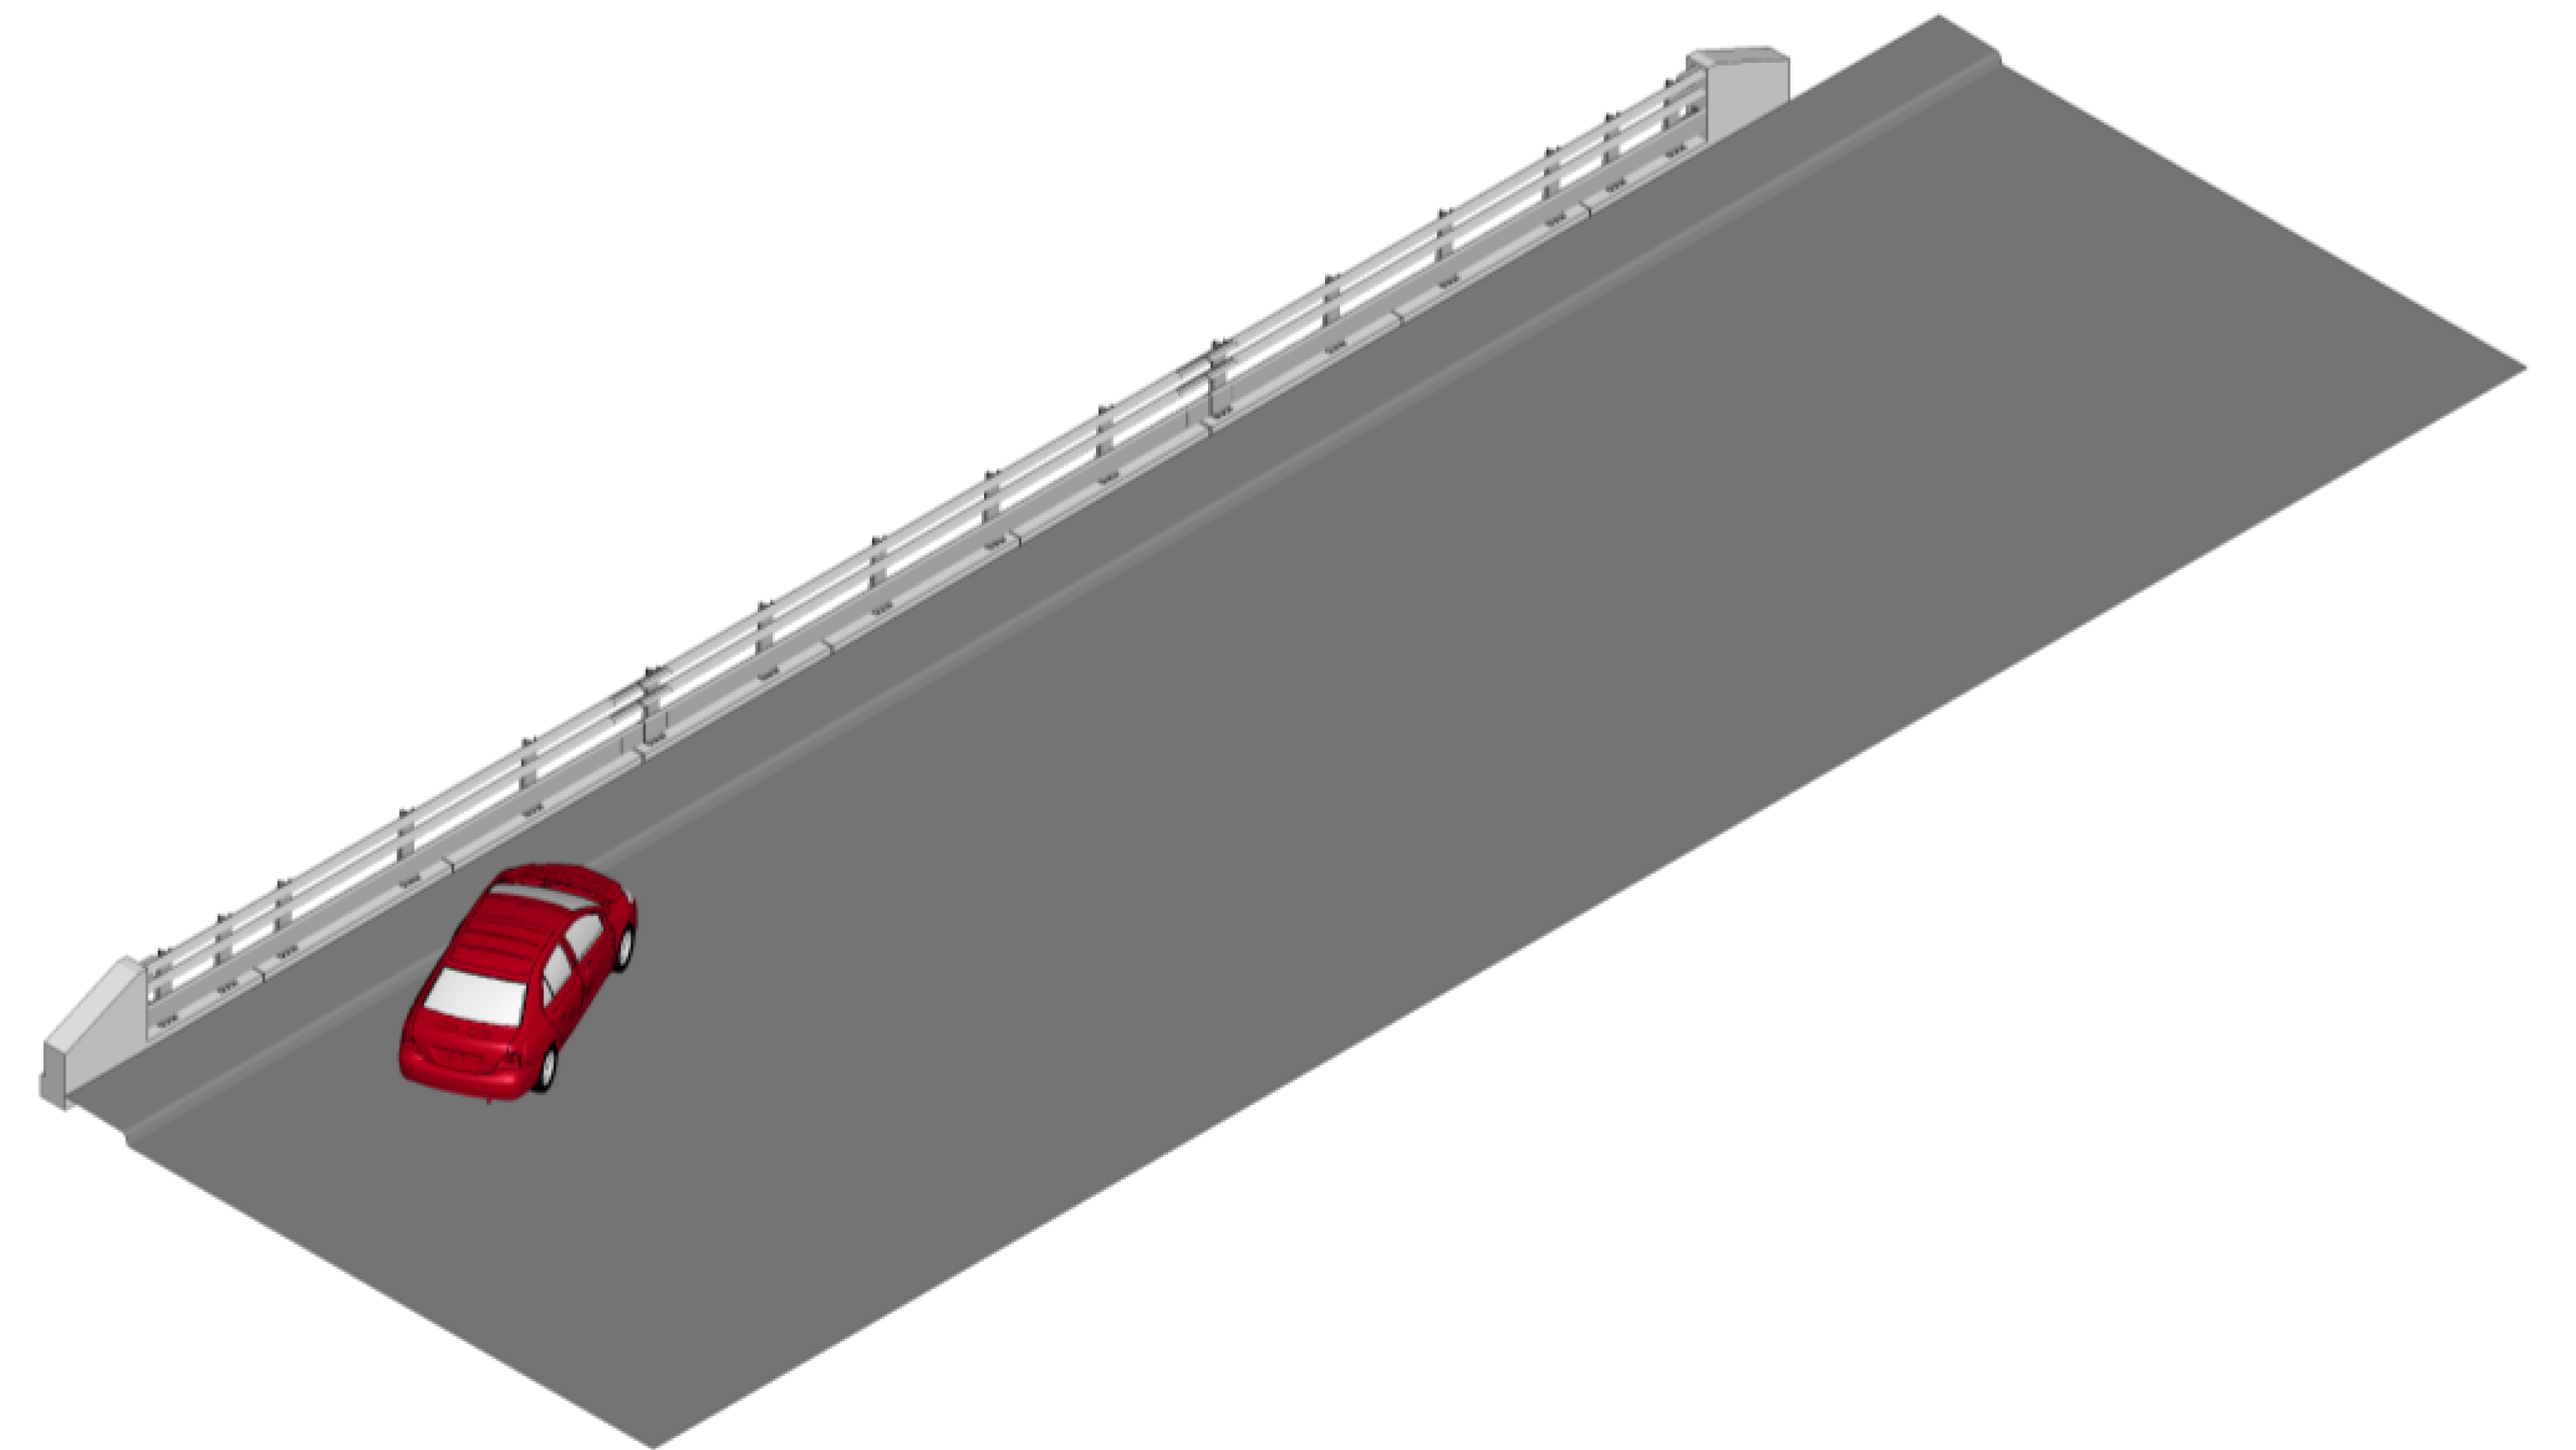
FE model of the TMBR with a (1.52-m) sidewalk under impact by a 2010 Toyota Yaris.
Figure 19.
FE model of the TMBR with a (1.52-m) sidewalk under impact by a 2010 Toyota Yaris.
Table 1.
This is a table. Tables should be placed in the main text near to the first time they are cited.
Table 1.
This is a table. Tables should be placed in the main text near to the first time they are cited.
| Model Attributes |
2010 Toyota Yaris |
2014 Chevy Silverado |
| Mass (kg) |
1,101.70 |
2,277.60 |
| Number of parts |
941 |
1,498 |
| Number of nodes |
1,488,671 |
2,809,787 |
| Number of solid elements |
259,803 |
284,286 |
| Number of shell elements |
1,254,993 |
2,654,053 |
| Number of beam elements |
4,802 |
22,403 |
| Number of discrete elements |
19 |
36 |
Table 2.
MASH TL-2 and TL-3 requirements for 1100C and 2270P test vehicles.
Table 2.
MASH TL-2 and TL-3 requirements for 1100C and 2270P test vehicles.
| Test Level |
Impact Speed |
Impact Angle |
CIP Distance to Reference Point |
| TL-2 |
70 km/h (44 mph) |
25° |
1100C: 1.01 m; 2270P: 0.80 m |
| TL-3 |
100 km/h (62 mph) |
25° |
1100C: 1.10 m; 2270P: 1.31 m |
Table 3.
MASH exit-box dimensions.
Table 3.
MASH exit-box dimensions.
| Vehicle Model |
A |
B |
| 2010 Toyota Yaris (1100C) |
5.16 m |
10.00 m |
| 2014 Chevy Silverado (2270P) |
4.58 m |
10.00 m |
Table 4.
Performance evaluation of TMBR by MASH TL-2 Criteria H and I.
Table 4.
Performance evaluation of TMBR by MASH TL-2 Criteria H and I.
| MASH Criteria |
Criteria H |
Criteria I |
| OIVx
|
OIVy
|
ORAx
|
ORAy
|
| Limit Values |
12.2 m/s |
12.2 m/s |
20.5 G |
20.5 G |
| 2010 Yaris |
9.57 m/s |
7.73 m/s |
2.44 G |
2.15 G |
| 2014 Silverado |
5.65 m/s |
5.37 m/s |
5.18 G |
4.86 G |
| Evaluation Result |
Met |
Met |
Met |
Met |
Table 5.
Performance evaluation of TMBR by MASH TL-2 Criterion A.
Table 5.
Performance evaluation of TMBR by MASH TL-2 Criterion A.
| MASH Criteria |
Criteria A |
| Permanent Deflection |
Dynamic Deflection |
Overriding |
Underriding |
Penetration |
| Limit Values |
/ |
/ |
/ |
/ |
/ |
| 2010 Yaris |
74.0 mm |
122.9 mm |
No |
No |
No |
| 2014 Silverado |
122.8 mm |
250.7 mm |
No |
No |
No |
| Evaluation Result |
Met |
Met |
Met |
Met |
Met |
Table 6.
Performance evaluation of TMBR by MASH TL-2 Criteria D, F, and N.
Table 6.
Performance evaluation of TMBR by MASH TL-2 Criteria D, F, and N.
| MASH Criteria |
Criteria D |
Criteria F |
Criteria N |
| Intrusion of Debris |
Maximum Roll Angle |
Maximum Pitch Angle |
Within Exit Box |
Exit Angle |
| Limit Values |
/ |
75° |
75° |
/ |
/ |
| 2010 Yaris |
No |
5.3° |
3.6° |
Yes |
20° |
| 2014 Silverado |
No |
7.1° |
2.2° |
Yes |
14° |
| Evaluation Result |
Met |
Met |
Met |
Met |
Met |
Table 7.
Performance evaluation of TMBR by MASH TL-3 Criteria H and I.
Table 7.
Performance evaluation of TMBR by MASH TL-3 Criteria H and I.
| MASH Criteria |
Criteria H |
Criteria I |
| OIVx
|
OIVy
|
ORAx
|
ORAy
|
| Limit Values |
12.2 m/s |
12.2 m/s |
20.5 G |
20.5 G |
| 2010 Yaris |
15.28 m/s |
9.87 m/s |
11.04 G |
5.75 G |
| 2014 Silverado |
9.93 m/s |
8.25 m/s |
8.55 G |
6.28 G |
| Evaluation Result |
Failed |
Met |
Met |
Met |
Table 8.
Performance evaluation of TMBR by MASH TL-3 Criterion A.
Table 8.
Performance evaluation of TMBR by MASH TL-3 Criterion A.
| MASH Criteria |
Criteria A |
| Permanent Deflection |
Dynamic Deflection |
Overriding |
Underriding |
Penetration |
| Limit Values |
/ |
/ |
/ |
/ |
/ |
| 2010 Yaris |
137.9 mm |
208.9 mm |
No |
No |
No |
| 2014 Silverado |
204.6 mm |
283.0 mm |
No |
No |
No |
| Evaluation Result |
Met |
Met |
Met |
Met |
Met |
Table 9.
Performance evaluation of TMBR by MASH TL-3 Criteria D, F, and N.
Table 9.
Performance evaluation of TMBR by MASH TL-3 Criteria D, F, and N.
| MASH Criteria |
Criteria D |
Criteria F |
Criteria N |
| Intrusion of Debris |
Maximum Roll Angle |
Maximum Pitch Angle |
Within Exit Box |
Exit Angle |
| Limit Values |
/ |
75° |
75° |
/ |
/ |
| 2010 Yaris |
No |
6.0° |
10.8° |
No |
18° |
| 2014 Silverado |
No |
5.0° |
4.1° |
Yes |
16° |
| Evaluation Result |
Met |
Met |
Met |
Failed |
Met |
Table 10.
Performance evaluation of TMBR with s sidewalk by MASH TL-3 Criteria H and I.
Table 10.
Performance evaluation of TMBR with s sidewalk by MASH TL-3 Criteria H and I.
| MASH Criteria |
Criteria H |
Criteria I |
| OIVx
|
OIVy
|
ORAx
|
ORAy
|
| Limit Values |
12.2 m/s |
12.2 m/s |
20.5 G |
20.5 G |
| 2010 Yaris |
12.68 m/s |
10.35 m/s |
10.50 G |
3.72 G |
| Evaluation Result |
Fail 1 |
Met |
Met |
Met |
Table 11.
Performance evaluation of TMBR with s sidewalk by MASH TL-3 Criterion A.
Table 11.
Performance evaluation of TMBR with s sidewalk by MASH TL-3 Criterion A.
| MASH Criteria |
Criteria A |
| Permanent Deflection |
Dynamic Deflection |
Overriding |
Underriding |
Penetration |
| Limit Values |
/ |
/ |
/ |
/ |
/ |
| 2010 Yaris |
11.25 mm |
14.9 mm |
No |
No |
No |
| Evaluation Result |
Met |
Met |
Met |
Met |
Met |
Table 12.
Performance evaluation of TMBR with s sidewalk by MASH TL-3 Criteria D, F, and N.
Table 12.
Performance evaluation of TMBR with s sidewalk by MASH TL-3 Criteria D, F, and N.
| MASH Criteria |
Criteria D |
Criteria F |
Criteria N |
| Intrusion of Debris |
Maximum Roll Angle |
Maximum Pitch Angle |
Within Exit Box |
Exit angle |
| Limit Values |
/ |
75° |
75° |
/ |
/ |
| 2010 Yaris |
No |
6.6° |
3.8° |
Yes |
15° |
| Evaluation Result |
Met |
Met |
Met |
Met |
Met |
