1. Introduction
Bayesian statistics, fundamentally a probability-based approach, leverage prior information (prior knowledge) and new observational data (posterior knowledge) to update our probability estimates of a parameter or event[
1,
2,
3,
4,
5]. The Bayesian statistical process involves three main steps: initially forming a prior distribution based on preliminary beliefs and collected data; secondly, obtaining a likelihood distribution from observed events; and finally, updating the prior distribution with the likelihood distribution to derive the posterior distribution. This iterative process allows for more precise and informed decision-making in quality control[
6,
7,
8,
9,
10].
As a burgeoning school of thought, Bayesian methods have been extensively applied in various domains. In medical research, Bayesian statistics play a crucial role in enhancing the precision of clinical trials and patient diagnoses[
11,
12,
13]. By integrating prior studies with real-time patient data, Bayesian methods enable the development of more nuanced and personalized treatment plans. This approach allows researchers to update their models as new data becomes available, leading to continuous improvement in patient care and treatment efficacy. For instance, in oncology, Bayesian models can be used to predict tumor growth and response to therapy, enabling oncologists to tailor treatments to individual patients' needs and improving outcomes[
14,
15,
16,
17].
In the realm of risk assessment, Bayesian methods provide a robust framework for decision-making under uncertainty. Industries such as finance and insurance leverage Bayesian approaches to update risk models with incoming data, allowing for better prediction and mitigation of potential risks[
18,
19,
20]. For example, in financial markets, Bayesian models can be used to forecast stock prices and assess investment risks by incorporating both historical data and current market trends. This dynamic updating process enhances the reliability of risk assessments and supports more informed decision-making.
Bayesian methods also significantly contribute to advancements in machine learning. By integrating prior knowledge about data distributions, Bayesian approaches improve the performance and reliability of predictive models[
21,
22]. This is particularly valuable in applications such as natural language processing (NLP) and image recognition, where understanding the underlying data structure can greatly enhance algorithm accuracy. For example, in NLP, Bayesian models can improve the understanding of context and semantics, leading to more accurate language translation and sentiment analysis[
23,
24]. Similarly, in image recognition, Bayesian methods can enhance the detection and classification of objects by effectively managing uncertainties in the data. In the field of engineering, Bayesian statistics also have become an indispensable tool for quality control of component parts. By continuously updating probability distributions of key parameters with new data, engineers can more accurately predict and manage product quality, ensuring higher reliability and performance[
25,
26,
27].
In summary, Bayesian statistics offer a powerful and flexible approach to data analysis across various fields. By continuously updating models with new data and incorporating prior knowledge, Bayesian methods provide more accurate and reliable results, driving improvements in clinical research, risk assessment, and machine learning. These applications demonstrate the versatility and effectiveness of Bayesian approaches in addressing complex problems and improving decision-making processes.
Carburizing heat treatment is a widely used surface hardening process essential for enhancing the wear resistance and fatigue strength of ferrous alloys[
28,
29,
30,
31,
32]. To ensure the dimensional accuracy of components, it is crucial to understand the distribution of dimensional changes post-treatment. The carburizing process typically involves heating the metal in a carbon-rich environment to allow carbon atoms to diffuse into the surface, followed by rapid quenching to lock the carbon in place. This process not only increases surface hardness but also can induce dimensional changes due to thermal expansion and phase transformations. Understanding these dimensional changes is critical for maintaining tight tolerances and ensuring the proper fit and function of treated parts. Bayesian statistical methods provide a robust framework for modeling these changes. By incorporating prior knowledge and real-time measurement data, engineers can develop accurate posterior distributions that reflect the true behavior of the components under heat treatment. This approach allows for precise prediction and control of dimensional changes, ultimately leading to higher-quality products and more efficient manufacturing processes. Bayesian statistics offer a sophisticated approach to address these challenges.
The torsion bar is a critical component in pneumatic clutch systems used in mining ball mills, where it is subjected to high rotational speeds and significant torque transmission. During operation, torsion bars endure complex stress states, including bending, wear, and shear forces. To ensure the smooth and reliable performance of clutches, torsion bars must exhibit excellent toughness and wear resistance, along with stringent dimensional and assembly precision. Achieving these properties typically involves using low-alloy steel combined with surface carburizing heat treatment. However, the carburizing process, followed by quenching, induces expansion and distortion, leading to potential dimensional deviations and affecting assembly precision. Therefore, accurately understanding the expansion and distortion patterns during the carburizing heat treatment process is crucial for coordinating the dimensional relationship between hot and cold processes and ensuring the assembly precision of torsion bars.
Bayesian statistics offer a powerful framework for incorporating prior knowledge and continuously updating beliefs with new data, making it particularly useful for complex and evolving systems. This paper leverages Bayesian methods to analyze the distortion behavior in torsion bars during carburizing heat treatment, providing a predictive control model for managing dimensional accuracy.
2. Fundamentals of Bayesian Theory
Bayesian statistics is a probabilistic approach to statistical inference, which provides a coherent framework for updating beliefs in the light of new data. It fundamentally differs from frequentist statistics by incorporating prior knowledge or beliefs into the analysis, leading to more refined and contextually relevant conclusions. When dealing with Bayesian statistics, a common practice is to use a conjugate prior distribution, which simplifies the computation of the posterior distribution. For a normal prior and likelihood, the resulting posterior distribution is also normal, a property that significantly eases analytical and computational efforts.
2.1. Basics of Bayesian Statistics
Bayesian statistics relies on Bayes' Theorem, which relates the conditional and marginal probabilities of random events. The theorem is expressed as:
where:
is the posterior probability, representing the updated belief about the parameter θ after observing data D.
is the likelihood, representing the probability of observing the data D given the parameter θ.
is the prior probability, representing the initial belief
about the parameter before observing the data.
is the marginal likelihood or evidence, which normalizes the posterior distribution and ensures that it sums to one.
2.2. Prior Distribution
The choice of the prior distribution is a crucial step in Bayesian analysis. Priors can be informative or non-informative. Informative priors incorporate specific prior knowledge about the parameter θ. For example, if previous studies provide strong evidence about the likely range of θ, this information can be encoded into the prior distribution. Non-informative priors or vague priors are used when little prior information is available, and they aim to exert minimal influence on the posterior distribution. Examples include uniform distributions or Jeffreys priors.
2.3. Likelihood Function
The likelihood function
quantifies how likely the observed data
D is given the parameter
θ. It is derived from the underlying statistical model of the data. For instance, if the data is assumed to follow a normal distribution with mean
θ and known variance
σ2, the likelihood function would be:
2.4. Posterior Distribution
The posterior distribution is obtained by combining the prior distribution with the likelihood function via Bayes' Theorem. The computation involves the following steps:
(1) Compute the likelihood: Determine the likelihood function based on the observed data and the assumed model.
(2) Multiply by the prior: Combine the likelihood with the prior distribution.
(3) Normalize: Divide by the marginal likelihood to ensure the posterior distribution integrates to one.
The posterior distribution is given by:
The denominator, , is the marginal likelihood and ensures the posterior distribution is a valid probability distribution.
3. Application of Bayesian Statistics in Predicting Carburizing Distortion
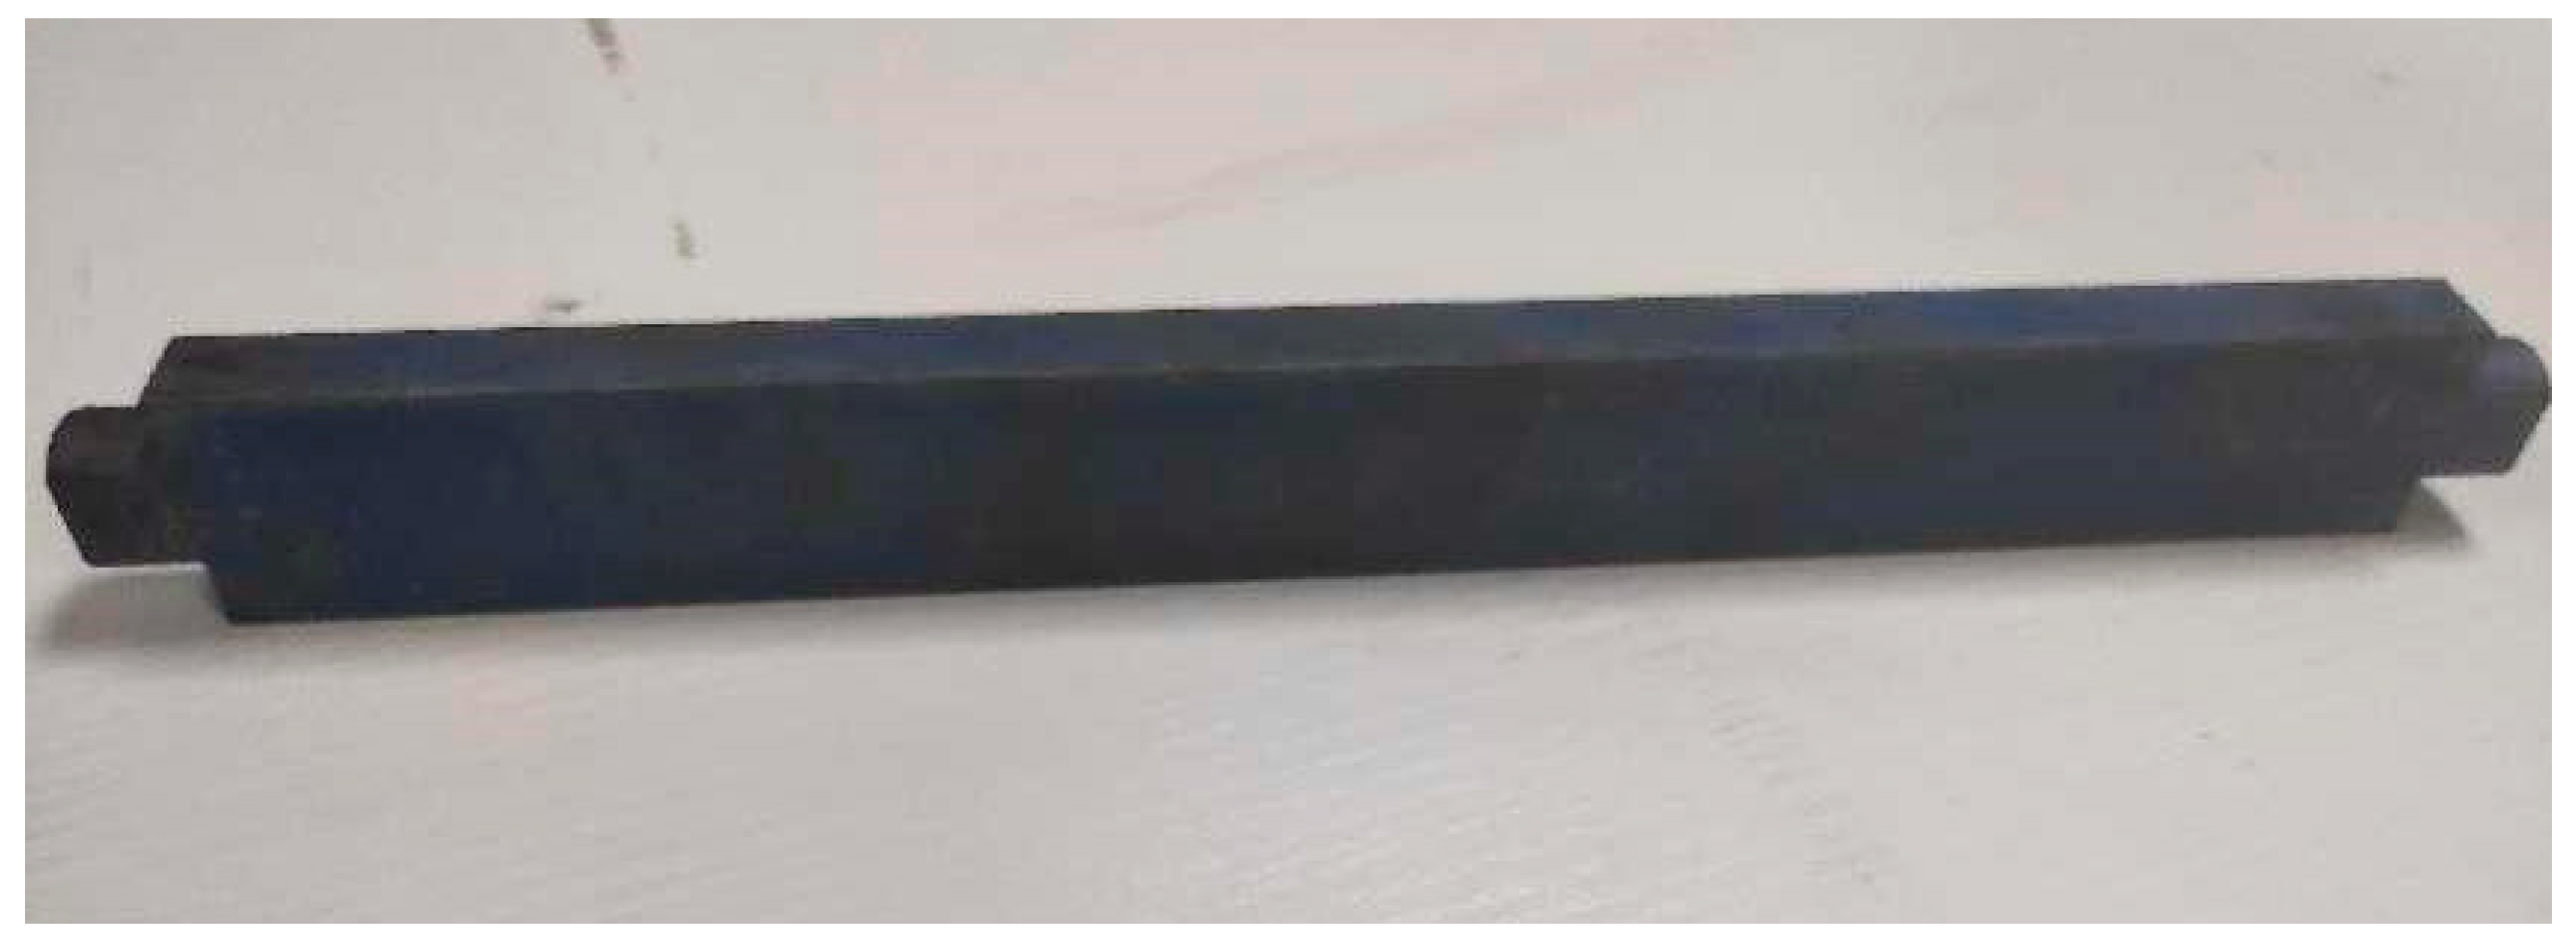
In this study, the components utilized are torsion bars fabricated from 20CrMnTi alloy steel, each with a designed length of 348 mm, as depicted in
Figure 1. Longth dimensional changes before and after the carburizing heat treatment were precisely measured using a vernier caliper. These measurements were foundational for the Bayesian statistical analysis conducted in this research.
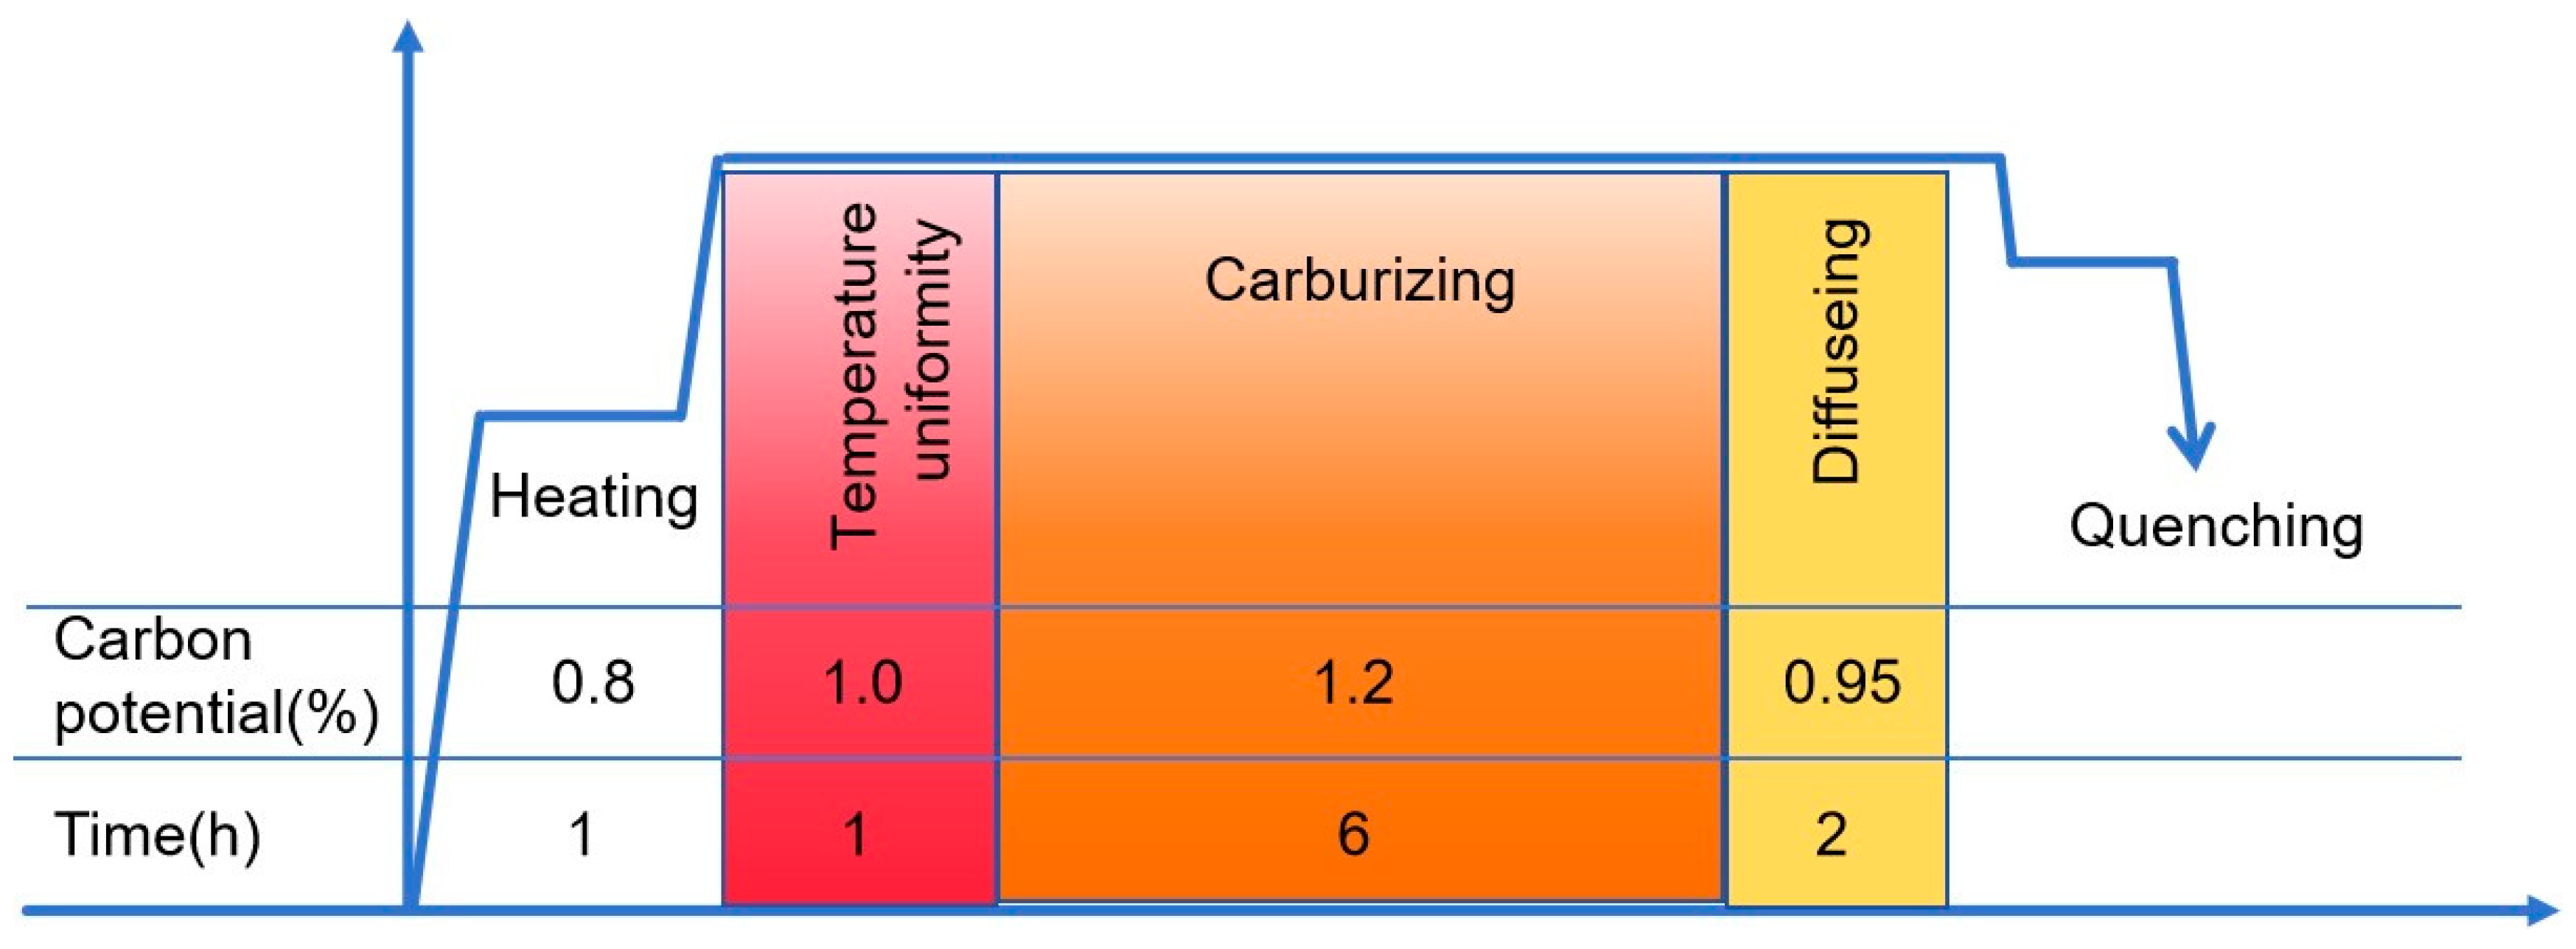
The carburizing heat treatment process was carried out at a controlled temperature, sustained for a specific duration to ensure adequate diffusion of carbon into the surface layer of the steel. Following the carburizing phase, the torsion bars underwent oil quenching to achieve the desired hardness and mechanical properties which is illustrated in
Figure 2.
3.1. Establishing a Dimensional Distribution Model Using Bayesian Statistics
Consider a simple case where data are drawn from a normal distribution with known variance σ2 and unknown mean θ. Assume a prior distribution for θ as a normal distribution with mean μ0 and variance τ2.
(1) Prior Distribution:
(2) Likelihood Function:
The likelihood function is:
(3) Posterior Distribution: The posterior distribution of
θ given
D is also a normal distribution, obtained by combining the prior and the likelihood:
Through some algebraic manipulation, it can be shown that:
where
is the sample mean of the data
D.
To apply Bayesian statistics for analyzing the dimensions
of torsion bars, it is essential to determine the prior distribution. A prior
distribution, such as a normal distribution, incorporates initial beliefs about
the parameters before observing any data. In this study, we assume that the
total length of the torsion bars follows a normal distribution before
carburizing. The average length of the torsion bars before carburizing is 347
mm according to the designed dimension, with a deviation not exceeding ±0.3 mm.
According to Bayesian theory, dividing this deviation (0.3 mm) by 6 yields a
prior standard deviation of 0.05 mm. Consequently, we adopt a normal
distribution

as the prior distribution
for Bayesian analysis.
After precision machining and carburizing heat treatment, the total lengths of the torsion bars were measured. These measurements are presented in
Table 1 and serve as the observed data for Bayesian statistical analysis. Assuming the observation samples follow a normal distribution, the likelihood function represents the probability of the observed data given the parameters.
Combining the prior distribution and the likelihood function via Bayes' Theorem yields the posterior distribution, which updates our belief about the parameter after observing the data. According to Bayesian theory, the posterior distribution of the torsion bar dimensions is proportional to the product of the prior distribution and the likelihood function. The conjugate normal posterior distribution provides a straightforward method to update our beliefs about a parameter when new data is observed. This is particularly useful in applications where parameters are continuously updated as more data becomes available, such as real-time quality control in manufacturing processes or iterative improvement in machine learning algorithms.
Using the sample standard deviation of 0.068 mm as the observational standard deviation in the likelihood function, we assume the likelihood follows a normal distribution with this standard deviation. Given a normal prior distribution, the resulting posterior distribution is also normal. Consequently, the Bayesian posterior distribution for the total length of the torsion bars before carburizing is calculated as N(347.405, 0.01222). For the dimensional distribution after carburizing, accounting for unavoidable dimensional expansion, we use a normal distribution N(348, 0.052) as the prior distribution. Under the same conditions as before carburizing, the posterior distribution of the total length after carburizing is N(347.973, 0.01122).
The Bayesian statistical distribution curves of the total lengths of the torsion bars before and after carburizing are shown in
Figure 3. The posterior distributions are notably more concentrated and have reduced deviations compared to the prior distributions. This improvement highlights the enhanced statistical credibility of Bayesian statistics, which integrates both prior experience and actual measurement data. With the increase in observed data, the precision of the posterior distribution further improves. By integrating Bayesian methods with machine learning and online quality monitoring systems, the control over the dimensional accuracy of torsion bars can be significantly enhanced. This synergy can lead to better prediction and management of carburizing-induced dimensional changes, ensuring higher assembly precision and product reliability. By employing Bayesian statistical methods, the study demonstrates the potential to achieve superior control over the dimensional properties of torsion bars, ultimately contributing to more reliable and efficient mechanical systems.
3.2. Establishing a distortion Model Using Bayesian Statistics
The relative expansion rates of torsion bars before and
after carburizing heat treatment were shown in
Table 1. Preliminary experimental results suggest that the prior knowledge of
the expansion rate (%) due to carburizing heat treatment falls within the range
of 0.1% to 0.3%. Based on the current data on the dimensional changes of the
torsion bars, we select a normal prior distribution

for the
expansion rate. Using the sample standard deviation of 0.02 as the
observational standard deviation for the likelihood function, the posterior
distribution for the relative expansion rate is calculated as

, as
shown in
Figure 4. The figure illustrates
that for a torsion bar with an average total length of 348 mm, the mean
relative expansion rate after carburizing heat treatment is 0.145%,
corresponding to an absolute expansion mean of 0.538 mm.
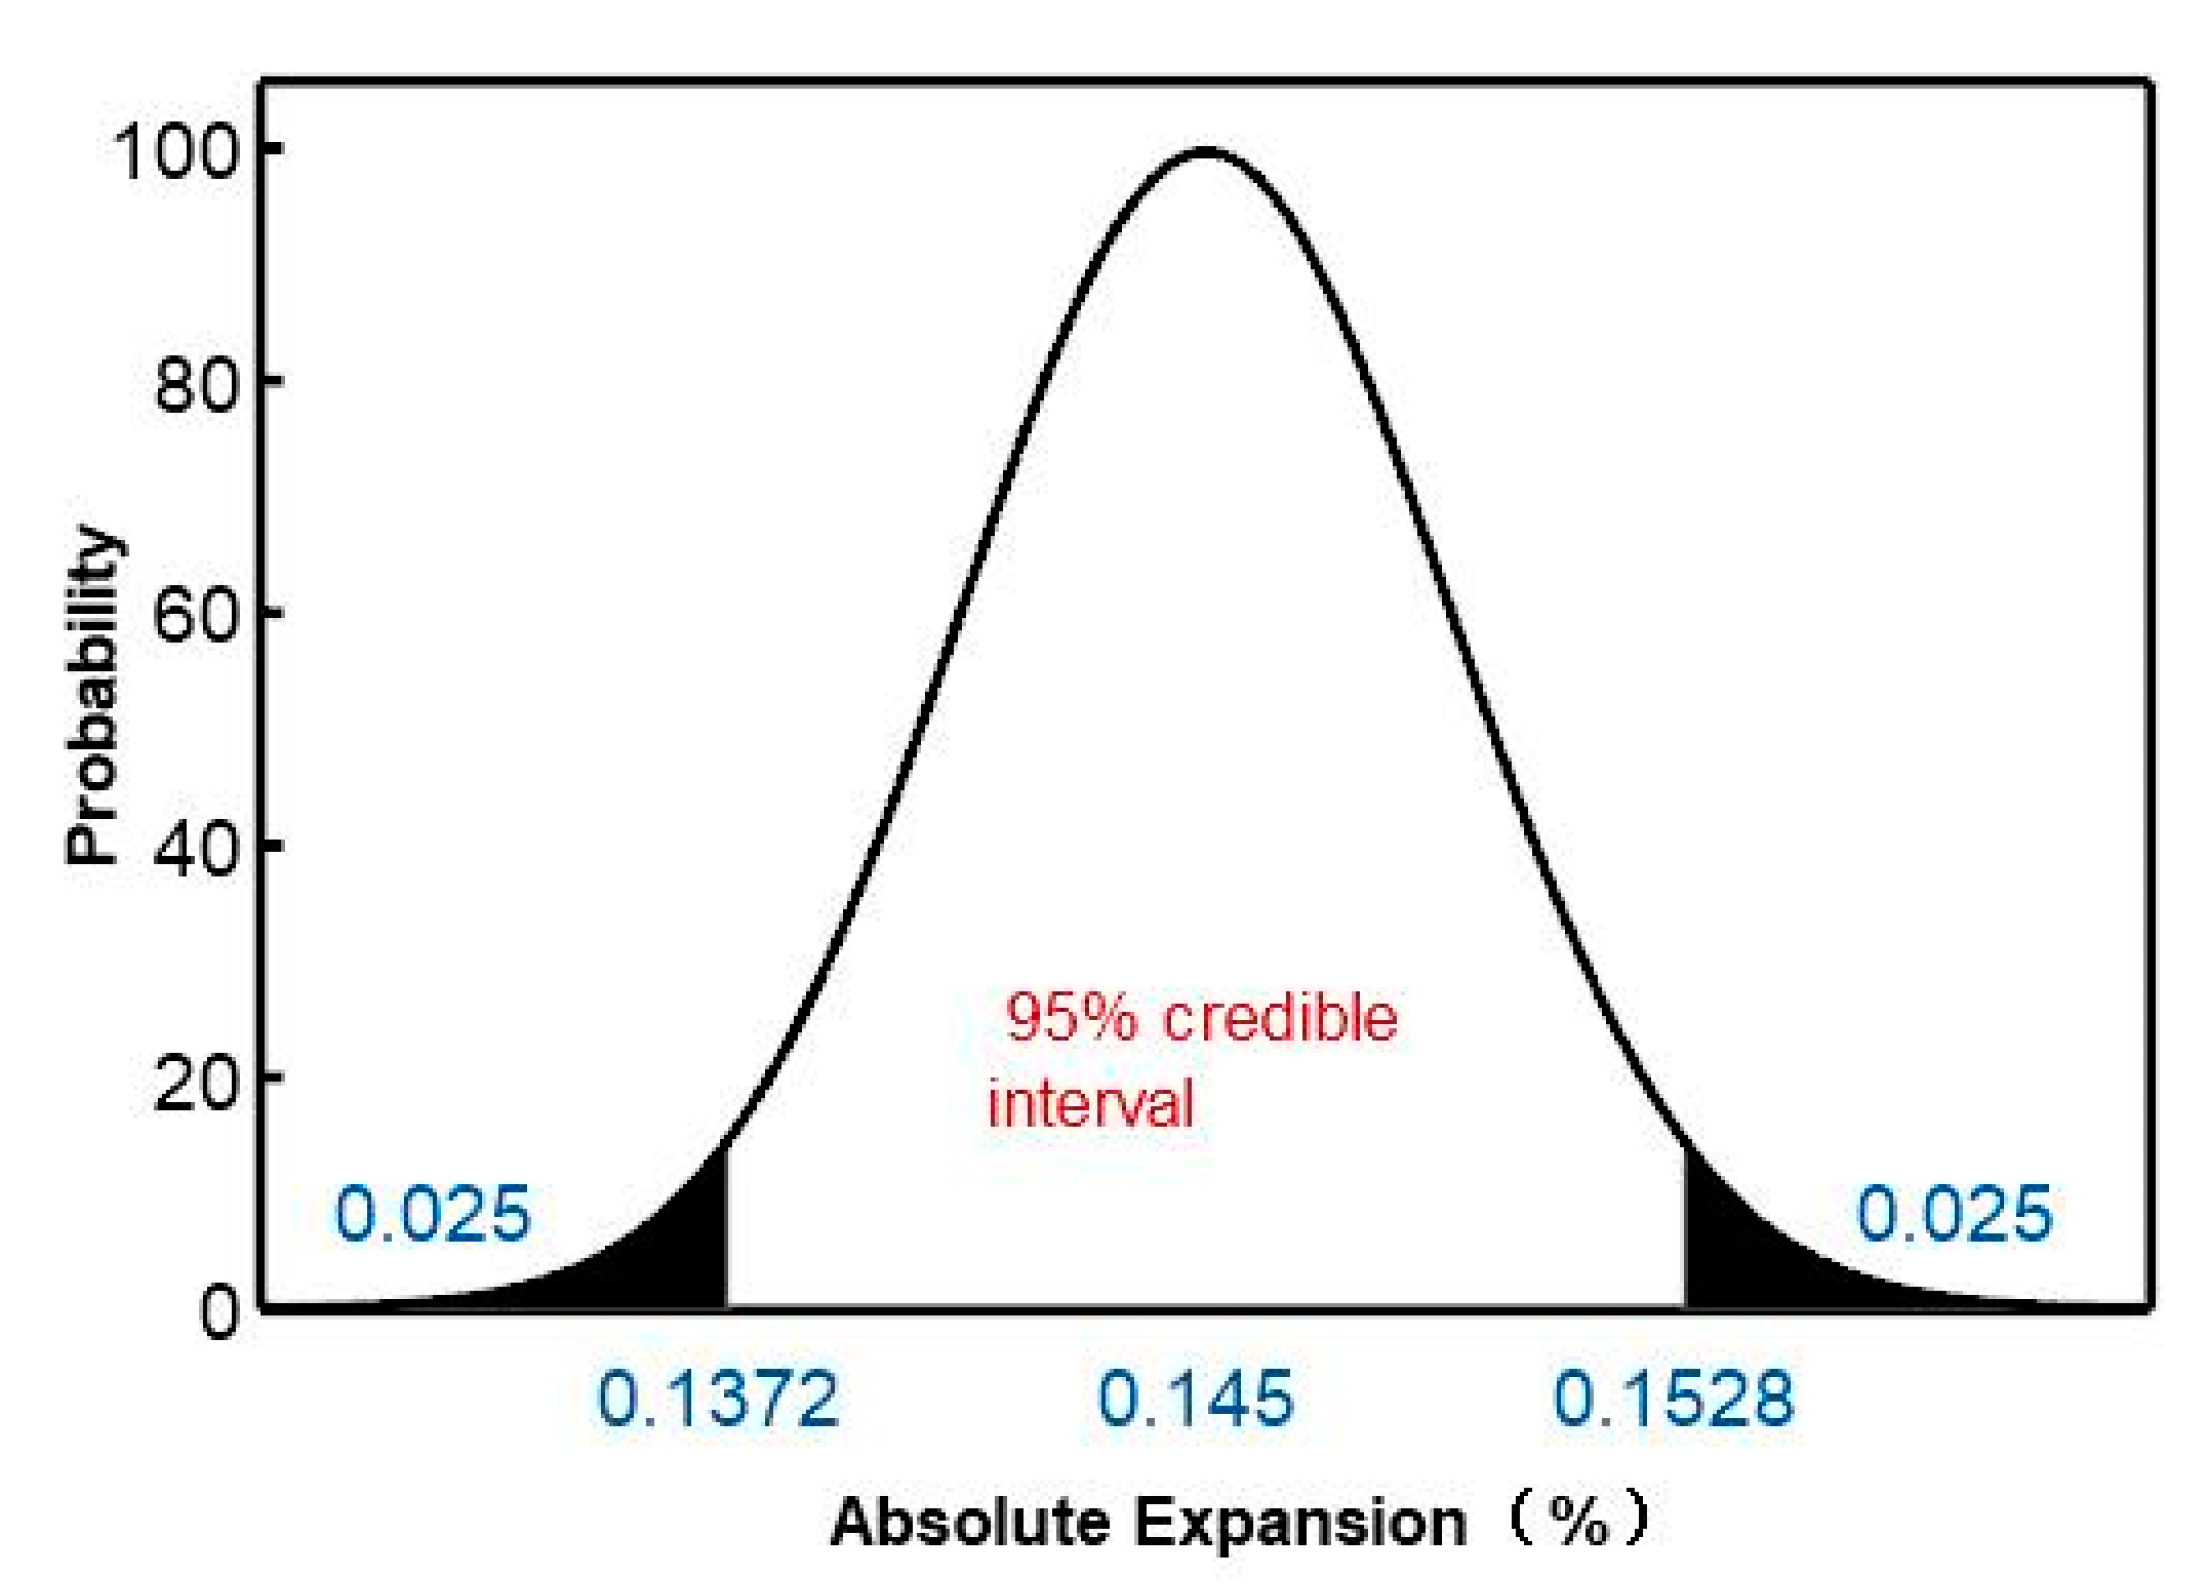
Using Bayesian statistical methods, we calculate the 95% credible interval for the relative expansion rate of the torsion bars after carburizing heat treatment as 0.1372% to 0.1528%, as shown in
Figure 5.
Additionally, Bayesian statistics can predict the distribution of future observations based on the results of past experiments, known as the predictive distribution. Suppose his predictive distribution also follows a normal distribution
N(m, s2), where
m is the posterior mean of the observed results, and
s2 is the sum of the posterior variance and the likelihood variance. Substituting the data, we establish the predictive distribution for the expansion rate of the next batch of torsion bars as
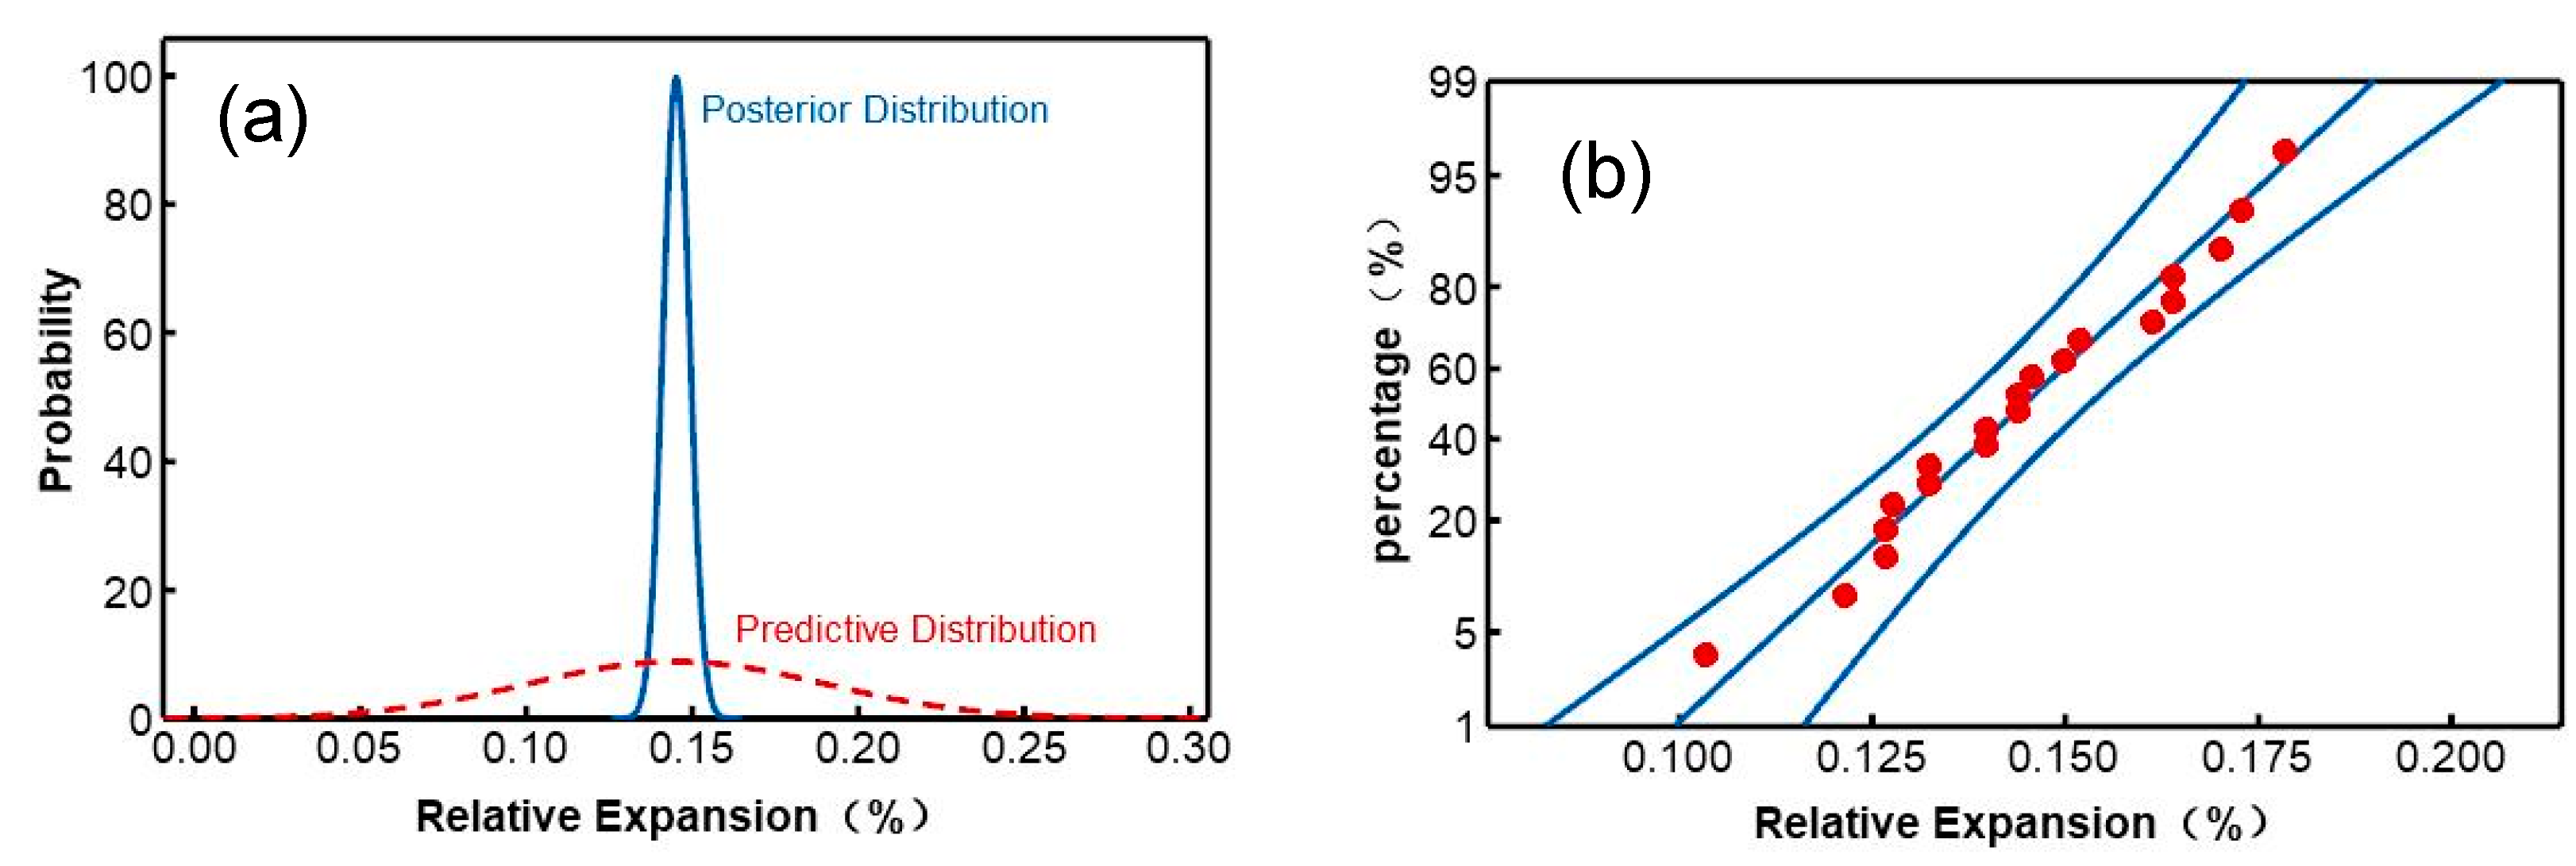
N(0.145, 0.0452). The credible interval and predictive distribution of the relative expansion rate are shown in
Figure 6. The distribution of expansion rates after carburizing heat treatment conforms to a normal distribution, with all data points falling within the fitted normal distribution curve which is shown in
Figure 6b.
This detailed Bayesian analysis provides robust predictions and credible intervals, ensuring high precision in understanding and controlling the dimensional changes due to carburizing heat treatment. By integrating prior knowledge and observed data, Bayesian statistics offer a powerful tool for predicting and managing manufacturing processes, leading to improved quality and performance of critical components such as torsion bars.
4. Conclusion
This study demonstrates the successful application of Bayesian statistical methods in analyzing and predicting the dimensional changes of torsion bars during carburizing heat treatment. By integrating prior knowledge and observed data, Bayesian statistics provide a powerful framework for understanding the expansion behavior of critical components under thermal processing conditions. This research not only contributes to the theoretical understanding of Bayesian applications but also offers tangible benefits for industrial practices, ensuring the production of high-quality components with consistent performance.
Acknowledgments
The authors acknowledge financial support from Kunlun Talent Project of Qinghai Province(2023-QLGKLYCZX-019).
Declaration of Competing Interest
The authors declare that they have no known competing financial interests or personal relationships that could have appeared to influence the work reported in this paper.
References
- Elsner, J.B.; Bossak, B.H. Bayesian Analysis of U.S. Hurricane Climate. Journal of Climate 2001, 14, 4341–4350. [Google Scholar] [CrossRef]
- Gigerenzer, G.; Hoffrage, U. How to improve Bayesian reasoning without instruction: Frequency formats. Psychological Review 1995, 102, 684–704. [Google Scholar] [CrossRef]
- Hooft, R.W.W.; Straver, L.H.; Spek, A.L. Determination of absolute structure using Bayesian statistics on Bijvoet differences. Journal of Applied Crystallography 2008, 41, 96–103. [Google Scholar] [CrossRef] [PubMed]
- Bartoszyński, R.; Lindley, D.V. Introduction to probability and statistics frorn a Bayesian viewpoint. Wiadomości Matematyczne 2017, 9. [Google Scholar] [CrossRef]
- Koch, K. Introduction to Bayesian Statistics. American Statistician 2007, 60, 98–99. [Google Scholar]
- Castelletti, F.; Consonni, G. Bayesian graphical modeling for heterogeneous causal effects. Statistics in medicine 2023, 42, 15–32. [Google Scholar] [CrossRef]
- Guo, J.; Riebler, A.; Rue, H. Bayesian bivariate meta-analysis of diagnostic test studies with interpretable priors. Statistics in Medicine 2017, 36. [Google Scholar] [CrossRef]
- Mccandless, L.C.; Gustafson, P.; Austin, P.C. Bayesian propensity score analysis for observational data. Statistics in Medicine 2010, 28, 94–112. [Google Scholar] [CrossRef]
- Zhou, Q.; Mcneal, C.; Copeland, L.A.; et al. Bayesian propensity score analysis for clustered observational data. Statistical Methods and Applications 2019. [Google Scholar] [CrossRef]
- Li, L.; Donnell, E.T. Incorporating Bayesian methods into the propensity score matching framework: A no-treatment effect safety analysis. Accident Analysis & Prevention 2020, 145, 105691. [Google Scholar]
- Sutton, A.J.; Abrams, K.R. Bayesian methods in meta-analysis and evidence synthesis. Statal Methods in Medical Research 2001, 10, 277–303. [Google Scholar] [CrossRef]
- Macnab, Y.C. On identification in Bayesian disease mapping and ecological-spatial regression models. Statistical Methods in Medical Research 2012, 23, 134–55. [Google Scholar] [CrossRef] [PubMed]
- Wada, K.; Watanabe, M.; Shinno, M.; et al. Development of Radiation Dermatitis Grading Method based on Bayesian Estimation using EfficientNet. Medical Imaging Technology 2022, 40, 48–58. [Google Scholar]
- Adamina, M.; Tomlinson, G.; Guller, U. Bayesian statistics in oncology: a guide for the clinical investigator. Cancer 2009, 115, 5371–5381. [Google Scholar] [CrossRef]
- Zhou, J.; Jiang, X.; Xia, H.A.; et al. Predicting outcomes of phase III oncology trials with Bayesian mediation modeling of tumor response. Statistics in Medicine 2022, 41, 751–768. [Google Scholar] [CrossRef]
- Ross RJ, H.; Baker, R.E.; Parker, A.; et al. Using approximate Bayesian computation to quantify cell-cell adhesion parameters in a cell migratory process. Npj Syst Biol Appl 2017, 3. [Google Scholar] [CrossRef]
- Johnston, S.T.; Simpson, M.J.; Mcelwain, D.L.S.; et al. Interpreting scratch assays using pair density dynamics and approximate Bayesian computation. Open Biology 2014, 4, 140097–140097. [Google Scholar] [CrossRef]
- Greenland, S. Bayesian perspectives for epidemiological research: I. Foundations and basic methods. International Journal of Epidemiology 2006, 35, 765. [Google Scholar] [CrossRef]
- Brand, K.P.; Small, M.J. Updating Uncertainty in an Integrated Risk Assessment: Conceptual Framework and Methods. Risk Analysis 2010, 15, 719–729. [Google Scholar] [CrossRef]
- Ahmed, S.; Li, T.; Huang, S.; et al. Dynamic and quantitative risk assessment of Cruise ship pod propulsion system failure: An integrated Type-2 Fuzzy-Bayesian approach. Ocean engineering 2023. [Google Scholar] [CrossRef]
- Vanitha, C.; Sathyamoorthy, M.; Dhanaraj, R.K.; et al. Optimized pollard route deviation and route selection using Bayesian machine learning techniques in wireless sensor networks. Comput. Networks 2022, 216, 109228. [Google Scholar] [CrossRef]
- Wakabayashi, Y.K.; Otsuka, T.; Krockenberger, Y.; et al. Machine-learning-assisted thin-film growth: Bayesian optimization in molecular beam epitaxy of SrRuO3 thin films. APL Materials 2019. [Google Scholar] [CrossRef]
- Cohen, S. Bayesian Analysis in Natural Language Processing. Synthesis Lectures on Human Language Technologies 2016, 9, 1–274. [Google Scholar]
- Valcamonico, D.; Baraldi, P.; Zio, A.L.R.L. Combining natural language processing and bayesian networks for the probabilistic estimation of the severity of process safety events in hydrocarbon production assets. Reliability engineering & system safety 2024, 241, 1–1. [Google Scholar]
- Pires, G.; Castelo-Branco, M.; Nunes, U. Visual P300-based BCI to steer a wheelchair: a Bayesian approach.. Conference proceedings: Annual International Conference of the IEEE Engineering in Medicine and Biology Society. IEEE Engineering in Medicine and Biology Society. Conference, 2008, 2008:658-661. https://doi.org/10.1109/IEMBS.2008.4649238. [CrossRef]
- Moradi, R.; Moradi, R.; Cofre-Martel, S.; et al. Integration of deep learning and Bayesian networks for condition and operation risk monitoring of complex engineering systems. Reliability Engineering & System Safety 2022, 222, 108433. [Google Scholar]
- Wu, R.; Liu, C.; Jiang, D. Unsupervised Bayesian change-point detection approach for reliable prognostics and health management of complex mechanical systems. Reliability engineering & system safety 2024, 245, 110037.1–110037.11. [Google Scholar]
- Xu, G.T.; Luo, J.; Lu, F.Q.; et al. Characterization of fracture toughness for surface-modified layer of 18CrNiMo7-6 alloy steel after carburizing heat treatment by indentation method. Engineering Fracture Mechanics 2022, 269. [Google Scholar] [CrossRef]
- Zhou, G.; Guo, J.; Zhao, J.; Tang, Q.; Hu, Z. Nanoindentation Properties of 18CrNiMo7-6 Steel after Carburizing and Quenching Determined by Continuous Stiffness Measurement Method. Metals 2020, 10, 125. [Google Scholar] [CrossRef]
- An, X.; Tian, Y.; Wang, H.; et al. Effect of Preheat Treatment on Microstructure and Properties of a Gear Steel for High-Temperature Carburizing. Steel research international 2020, 91. [Google Scholar] [CrossRef]
- Xu, G.; Cao, X.; Qiao, Y.; Sun, B.; Wang, G.; Zhao, M.; Li, Y. Anisotropic elastic–plastic properties of surface-modified layers of 18CrNiMo7-6 alloy steel after carburizing heat treatment determined by an indentation method - ScienceDirect. Journal of Materials Research and Technology 2022. [Google Scholar] [CrossRef]
- Tao, Y.; Yong-Tao, M.A.; Xin-Bin, Z.; et al. Experimental Study on Surface Modification Carburizing Alloy Steel of High Pressure Water Jet. Machinery Design & Manufacture 2018. [Google Scholar]
|
Disclaimer/Publisher’s Note: The statements, opinions and data contained in all publications are solely those of the individual author(s) and contributor(s) and not of MDPI and/or the editor(s). MDPI and/or the editor(s) disclaim responsibility for any injury to people or property resulting from any ideas, methods, instructions or products referred to in the content. |
© 2024 by the authors. Licensee MDPI, Basel, Switzerland. This article is an open access article distributed under the terms and conditions of the Creative Commons Attribution (CC BY) license (http://creativecommons.org/licenses/by/4.0/).
 as the prior distribution
for Bayesian analysis.
 for the
expansion rate. Using the sample standard deviation of 0.02 as the
observational standard deviation for the likelihood function, the posterior
distribution for the relative expansion rate is calculated as
  , as
shown in Figure 4. The figure illustrates
that for a torsion bar with an average total length of 348 mm, the mean
relative expansion rate after carburizing heat treatment is 0.145%,
corresponding to an absolute expansion mean of 0.538 mm.


