Preprint
Article

Preliminary Evaluation of Performance, Cost and Environmental Sustainability of a LH2‐Powered Narrow Body Aircraft

Altmetrics

Downloads

141

Views

61

Comments

0

Submitted:

18 July 2024

Posted:

18 July 2024

You are already at the latest version

Alerts
Abstract
The commercial aviation industry is constantly evolving, driven by technological innovation and the growing demand for more efficient and environmental friendly transportation solutions. In this context, the design and development of next-generation aircraft is a crucial task, with the goal of reducing environmental impact and improving flight efficiency while continuing to ensure passenger comfort and safety. This paper aims at evaluating the technical feasibility as well as economic and environmental viability of a narrow body aircraft powered by hydrogen for direct combustion. Notably, the paper offers innovative insights regarding the update of literature models for conceptual design, in order to consider the impact of hydrogen fuel on the sizing loop at aircraft level. Moreover, it also focuses on the evaluation of operating costs for the aforementioned aircraft class, highlighting the required model updates and considerations to properly match the effect on costs of the introduction of the innovative fuel. Ultimately, a preliminary analysis of upstream sustainability of the concept, considering fuel life cycle, is provided, in order to understand the overall competitiveness, not only in terms of monetary resources but also of environmental impact, beyond the pure operating life of the airplane.
Keywords: 
Subject: Engineering  -   Aerospace Engineering

1. Introduction

The commercial aviation industry is constantly evolving, driven by technological innovation and the growing demand for more efficient and environmental friendly transportation solutions. In this context, the design and development of next-generation aircraft are a current focus, with the goal of reducing environmental impact and improving efficiency while continuing to ensure passenger comfort and safety. Environmental sustainability is a wide topic, particularly for what concerns the analysis of the contribution of aviation sector, and several metrics can be used as reference indicators (e.g. CO2, CO, NOx, particulate matter emissions, as well as contrails, noise etc…). However, CO2 metrics are often considered as the main comparative means to assess the overall emissions impact. Notably, aviation currently contributes to 2.5 – 3% of manmade CO2 emissions [1], while the increase of CO2 emissions and pollutants by 2050 (after the COVID period) is estimated between 2 to 4 times the actual levels [2] if no mitigations are undertaken at aircraft technology, operations and sustainable fuel levels. Aviation decarbonization can be in fact progressively reached by means of different strategies and, as far as aircraft technologies and design are concerned, the exploitation of configurations characterized by more sustainable propulsion and propellant systems solutions shall be compulsory in the coming years. However, depending on the type of mission and on the category of the aircraft, peculiar architectures can be identified to reach this goal. As clearly summarized by [2], in a snapshot, short and medium range aircraft (80 – 250 passengers over 1000 – 3000 km missions) are responsible for almost 70% of CO2 emissions related to overall aircraft operations (data from 2018), long range widebodies contribute to less than 50%, and commuter as well as regional platforms are quite negligible. There is no one solution fitting all aviation need. Instead, the potential of dedicated innovations shall be investigated for each application. For example, looking at airport proximity operations, different solutions to tackle CO2 reduction are available. One the most promising is to re-configure commuters and aero-taxi services to use all electric battery-based propulsion, as well as to conceive regional platforms powered by hybrid-electric units (series/parallel hybrid motor-generators) [3,4]. Unfortunately, these concepts are not currently applicable to increasing power demands, since technology limitations in terms of batteries power density does not allow for huge scaling-up over the regional segment. In turn, narrow bodies family for short and medium range is well-positioned to be capable of hosting hydrogen-based powerplants, both in terms of direct combustion and for what concerns hydrogen-hybrid engines based on fuel cells architecture (see Section 2 for a short review on the available literature in the field). Actually, these configurations offer enough volume to store cryogenic and low-density propellants, while being capable of maintaining a high payload-range competitiveness. This may not hold true for long range widebodies where, even if the dimensions of the platform are quite significant, sometimes encompassing double decks architecture, the required range capability makes the use of hydrogen for direct combustion seriously marginal in terms of necessary quantity on-board, with detrimental impact on payload-range capability with reference to conventional competitors, while hybrid-hydrogen propulsion may exceed power limits of the technology due to the thrust class of the engines. Some interesting results are summarized in [5], where Eurocontrol analyses different long-range architectures, based on Airbus A380 platform, with the aim to highlight major shortcomings in case of use of alternative fuels (hydrogen, ammonia, methane etc…). Potentially, long range market can be a good spot for Sustainable Aviation Fuels (SAF), while hydrogen application may be an option after a validation in relevant environment for narrow bodies, once technology is mature, also as function of a potential change in travel needs [2] (smaller aircraft, with reference to current wide bodies architectures). Nevertheless, it is extremely important to say that in order to understand the actual reduction potential of a newly introduced solution in aviation, it is necessary to duly analyze the overall aircraft life-cycle [6,7]. For example, emissions during production of the fuels, if not properly controlled, can simply move (and in some case exacerbate) the problem at an earlier life cycle phase. In terms of CO2 emission, a peculiar example is related to the different types of hydrogen production processes (gray, blue, green etc…) [8,9], where, depending on the source of power used for the derivation of the pure chemical element and subsequent liquefaction, pollutant and greenhouse gas quantity shares can be considerable [10] and even comparable to fossil fuels. Moreover, economic sustainability of advanced powerplants, based on innovative fuels (cryogenic or SAF produced exploiting carbon capture technologies [8,9]), may also result more expensive to operate, especially in the short term, with a detrimental impact on social acceptance because of increased ticket price. This can be a major showstopper, notably in absence of clear prescriptions by regulations, potentially offering an advantage to conventional competitors. To complicate even more the scenario, water vapor emissions produced by hydrogen-based powerplant during flight (both in case of direct combustion and of fuel cells exploitation) is an additional issue to be tackled because of the impact on radiative forcing [11], as well as on public opinion, which often sees contrails and cirrus build-up as a negative aspect (most of the time due to wrong or non-scientific basis). Still, hydrogen application in transport sectors appears to be one of the best solutions to face the decarbonization challenge, at least in the long term, so technology development, supply chain strengthening and unbiased economic analysis early in the design stage of the products can leverage the positive outcome of its progressive entry-into-service.
In such a competitive environment, there is a urgent need of developing methodologies and tools to assess the technical feasibility and the economic and environmental sustainability of novel aircraft concepts, since the early design stages of the aircraft. This paper fits this challenge, by specifically developing methodologies and tools for the technical feasibility as well as economic and environmental viability of narrow body aircraft powered by hydrogen for direct combustion. In particular, from the environmental standpoint, while analytical formulations have been already developed to cover the emissions throughout the entire flights, the upstream emissions are still lacking of attention. Therefore, as far as emissions are concerned, this provides useful guidelines for the assessment of the emissions occurring during the propellant production phases. The objective is to develop a methodology and tool to assess the competitiveness of novel aircraft configurations with respect to competitors, complementing the operational capabilities and performance, with economic and sustainability analysis. Before presenting the methodology, Section 2 reports a literature review about current and past studies on hydrogen aircraft architectures, with particular focus on the European landscape, to better highlight strengths and weaknesses of the concept. Section 3 moves on with the conceptual design process of the aircraft, based on simplified literature approaches, disclosing specific upgrades to the formulations to consider the peculiarities of the case study. Section 4 is focused on the economic assessment, particularly in terms of operating costs, while in Section 5 the analysis of upstream emissions during hydrogen production is provided. Section 6 deals with the comparison between the reference aircraft and a kerosene-based competitor, both in terms of operating costs and of fuel life-cycle sustainability. Ultimately, Section 7 summarizes the obtained results, drawing major conclusions about the work and proposing future steps. Overall, the paper offers innovative insights regarding the update of literature models for conceptual design, in order to consider the impact of hydrogen fuel on the sizing loop at aircraft level. In fact, defining a flexible methodology taking into account peculiarities of cryogenic propellant in early stages of design is crucial to provide a consistent design solution for the case study. Moreover, the paper also focuses on the evaluation of operating costs for the aforementioned aircraft, highlighting the required updates and considerations to properly match the effect on costs of the introduction of the innovative fuel, ultimately providing a guideline to identify a reference cost-per-kg of the hydrogen at the delivery in order to make the aircraft competitive on the market. In conclusion, a preliminary analysis of upstream sustainability of the concept, considering fuel life cycle, can be an important added value for the readers, especially when comparing the results with conventional platforms, in order to understand the overall competitiveness, not only in terms of monetary resources but also of environmental impact, beyond the pure operating life of the airplane.

2. Studies on Hydrogen Aviation and the International Context

The exploitation of hydrogen in commercial aviation it is not a new concept. In fact, because of the experience gained in the space sector, some preliminary studies were funded decades ago to assess the technical feasibility and viability of both subsonic and high-speed commercial transports [12]. These design efforts became particularly attractive in the 1970’s, due to oil crisis and increase in prices of conventional fuels [13]. In these cases, the identified concepts were supposed to host a direct combustion of hydrogen (that was expected to be cheaper than conventional fuels) and several analyses were carried out in order to investigate fuel storage and distribution subsystems (with associated impact on aircraft configuration), together with more specific assessments on engine architecture and modifications needed for hydrogen conversion. However, the drivers pushing further the investigations in the field of hydrogen aviation were quite different for the various speed regimes. In fact, while for high-speed aircraft the use of propellant characterized by a higher energy content per unit mass is almost compulsory to reduce the amount of fuel required to accomplish the mission, the exploitation of cryogenic hydrogen for subsonic aircraft was mainly considered because of economic reasons, rather than for technical or sustainability assessments. As it often happens within the aerospace domain, the research topics associated to hydrogen cyclically appears in literature over the years. In the last years, hydrogen has reached a considerable peak of interest because of the worsening of the climate situation, which led the COP21 leaders to sign a legally binding treaty on climate change in 2015 (Paris Agreement [14]), aimed at limiting global warming to 1.5 °C by the end of the century. Even though aviation related emissions are marginal with reference to overall manmade CO2 emissions (Section 1), the sector has urged to take actions to limit its carbon footprint. The International Civil Aviation Organization (ICAO), through its Committee on Aviation Environmental Protection (CAEP) has recently published and updated its Long Term Aspirational Goal (LTAG) [1,15] to work closely and jointly with the Carbon Offsetting and Reduction Scheme for International Aviation (CORSIA) [16], identifying different potential scenarios to reach CO2 reduction up to -87% by 2050 through specific actions on technologies, operations and fuels. European Commission has also recently taken measures to support, in terms of regulatory framework, the entry into service of sustainable fuels and technologies, fixing specific milestones for the progressive introduction of SAF within aviation through the Refuel EU plan, with subsequent investments into hydrogen sector [17]. Moreover, it is actually within the research programs funded by the European Commission, as part of the strategy laying behind EU policy goals, such as Horizon 2020, Horizon Europe and previous FP funding schemes, that relevant studies have been funded. In terms of reference literature concepts (Figure 1), one of the most important studies is provided by the Cryoplane project [18], which started to analyze the hydrogen aircraft opportunity as potential candidate to reduce climate impact, looking at the problem not only from the technical side, but also from the socio-economic and environmental standpoints. In that case, the focus was devoted to a narrow body configuration, where the fuselage was modified in order to include dorsal hydrogen lobe tanks by maintaining the original cabin size, without impacting too much the payload-range capability of the original platform, considering direct combustion of hydrogen. This strategy for generation of primary power on-board, responsible of thrust generation, is largely preferred for platforms that are larger than regional jets and commuters, as summarized in [19] and demonstrated by studies such as HyLiner 2.0 [20] and FlyZero MidSize [21], all of which feature pure hydrogen turbofan technologies. Typically, the different concepts are characterized by a conventional aircraft configuration, even if some changes are introduced to improve hydrogen storage within non-integral tanks (larger fuselage, blended shapes in fuselage-wing interface) usually positioned at the back of the plane or under the cabin floor. However, also different configurations are explored for what concerns direct hydrogen combustion, as presented in [22], even though the aircraft is in this case conceived for long range. More recently, hydrogen-hybrid powerplant concepts, mixing direct combustion with parallel-hybrid fuel cells-based turbofan architectures are emerging as potential candidates to further improve flight efficiency and operability. Among the different studies, the most relevant is the Airbus ZEROe turbofan [23,24]. Also in this case, a conventional aircraft configuration hides the internal re-arrangement of volumes, where the cabin occupies the usual position, while the tanks are moved towards the aft fuselage compartment, causing the wing to move itself towards the second half of the aircraft because of weight and balance issues. This particular concept is expected to carry up to 200 passengers on a typical range of 3700 km. A Blended Wing Body (BWB) variant is also presented, with similar payload-range capability.
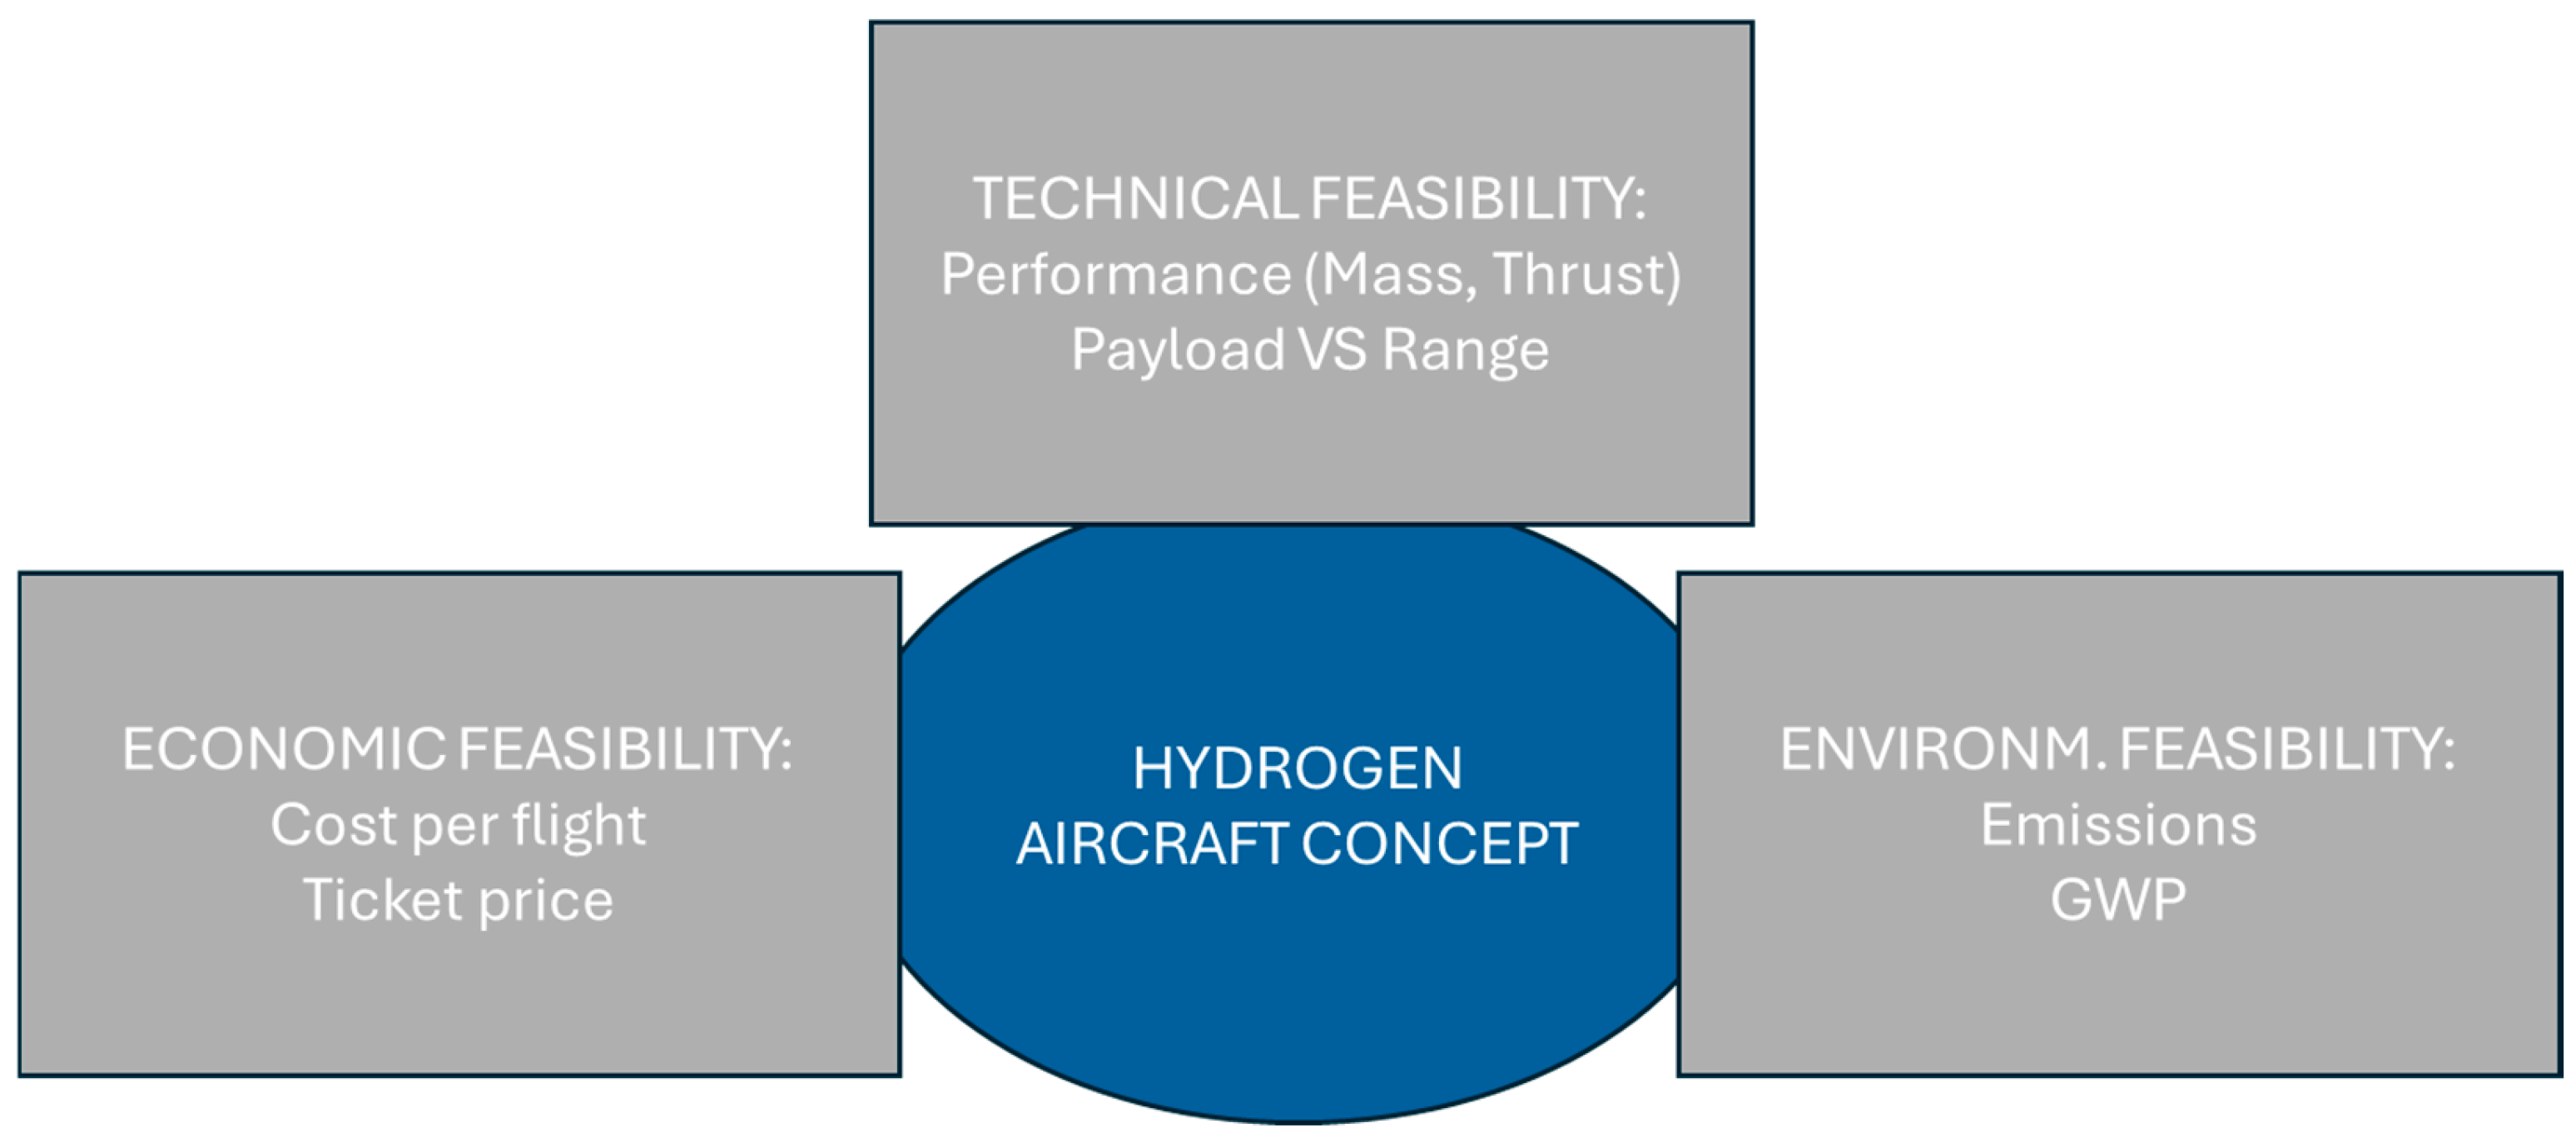
Currently, prototypes exploiting hybrid architectures and belonging to the family of commuters and turboprops are flying for tests, such as the concept by ZeroAvia, Universal Hydrogen [25] and smaller platforms, proving that the technology is maturing. Interesting insights concerning ground operations and support at airport level can be found in studies provided in [26,27] where impact on infrastructure is evaluated, especially in presence of different fuel and energy sources, together with a cost analysis, at delivery, of hydrogen for aviation. Considering the above mentioned studies on narrow bodies hydrogen-powered aircraft, this work aims at assessing performance, operational capabilities and economic viability (Figure 2) of a medium range aircraft, belonging to the same category, so to evaluate potential showstoppers with reference to conventional competitors. Section 3 thus describes the aircraft conceptual design process adopted, starting from the elicitation of high-level requirements.

3. Aircraft Conceptual Design Process

3.1. Aircraft High-Level Requirements

Considering that most of the relevant studies are based on conventional aircraft architectures, traditional layouts are considered in this paper to allow for a consistent comparison with direct competitors. Particularly, being characterized by a typical twin-engines configuration consisting of a circular cross-section shaped fuselage, low-mounted wings and a three-elements tail with one vertical and two horizontal stabilizers, the aircraft shall accommodate a maximum payload of 150 passengers and shall be capable of operating on routes with an overall distance of approximately 3000 km (with maximum payload), cruising at Mach 0.78 (typical, 0.82 maximum) at 10000 m. Ground infrastructure and take-off and landing distances shall be compatible with those used for similar aircraft, powered by kerosene fuels.

3.2. Identification of Reference Mission and Take-Off Mass Buildup

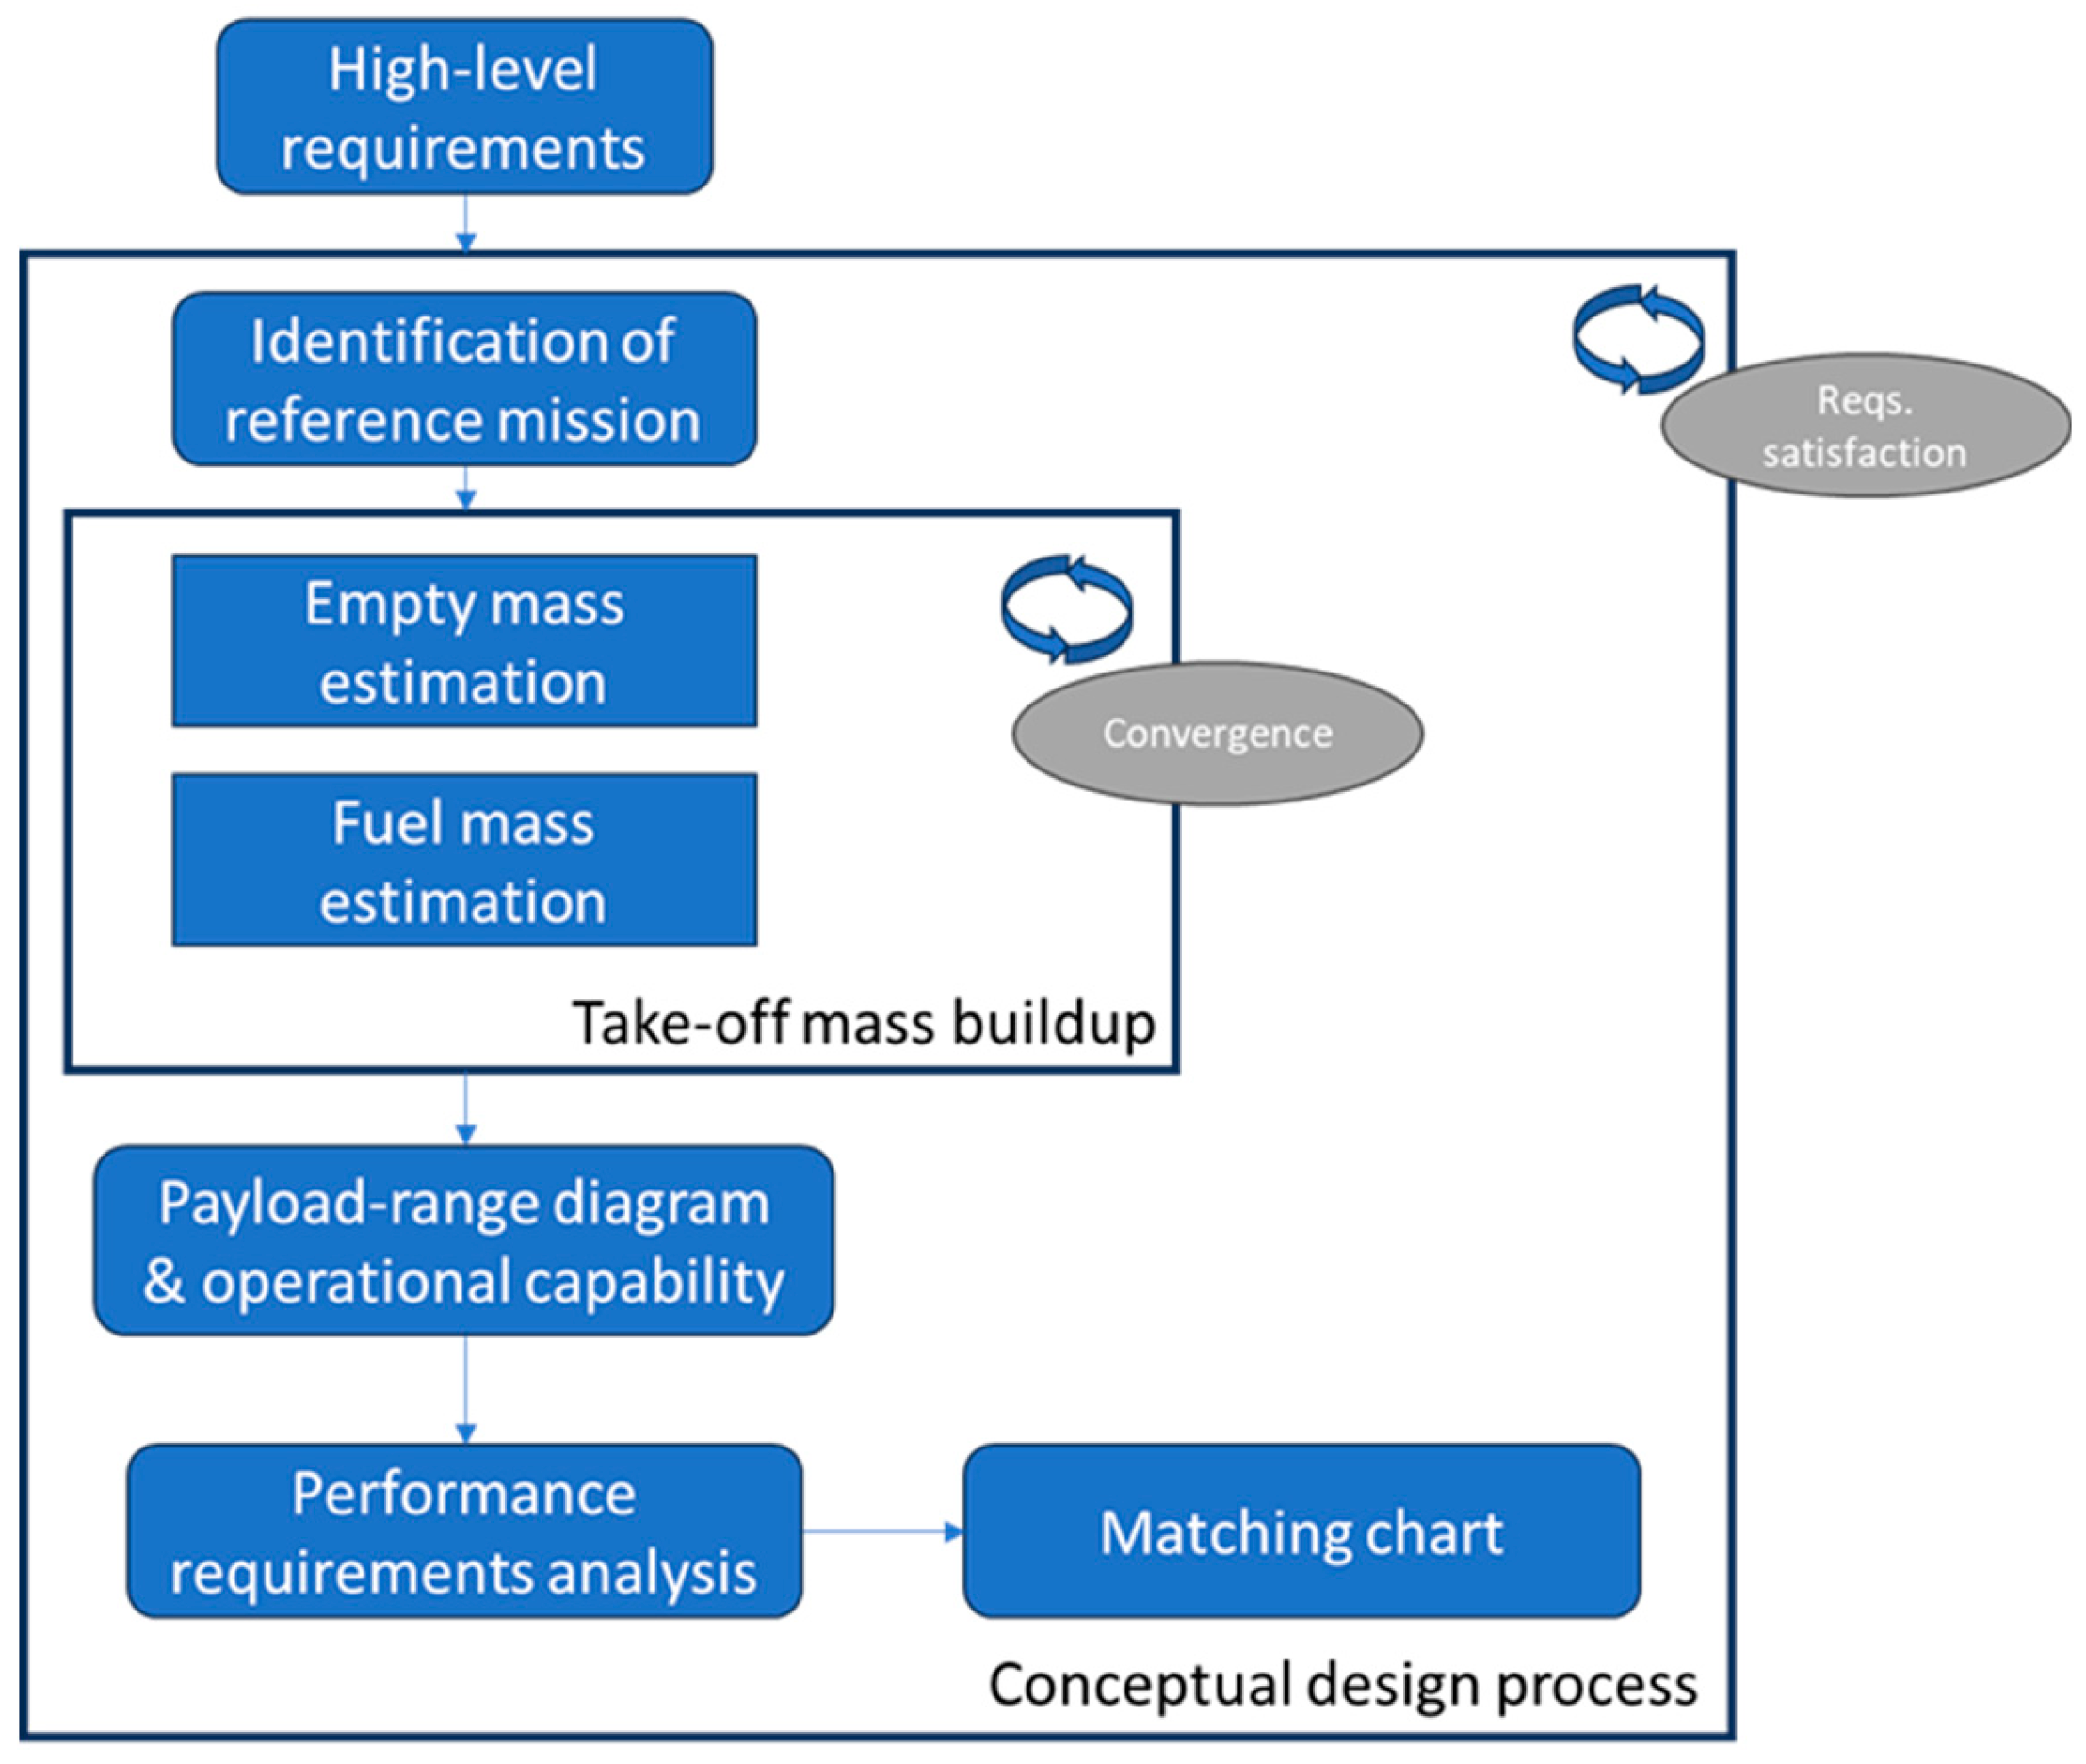
With the high-level requirements in place and the aircraft class identified, a sizing process has been implemented to determine the mass breakdown of the aircraft as well as the overall layout for a reference mission. The work was carried out using the method outlined in [28], taking into account also additional considerations due to the adoption of hydrogen as fuel. The overall process can be represented by the scheme reported in Figure 3. Notably, the aforementioned method is aimed at estimating the Maximum Take-Off Weight (MTOW) and the required amount of fuel. The design takeoff weight W T O can be broken down into crew weight W c r e w , payload weight (or passenger weight) W p a y l o a d , fuel weight W f u e l , and the empty weight W e m p t y (all expressed in kg), as specified in (1).
Considering 100 kg for each passenger (including baggage) and 85 kg for each crew member (considering two pilots and one flight attendant every 50 passengers), resulting values are reported in (2).
W T O = W c r e w + W p a y l o a d + W e m p t y + W f u e l
W c r e w = 425 k g ; W p a y l o a d = 15000 k g
Empty weight and fuel weight have to be determined and can be also re-arranged as fractions of the total takeoff weight, as in (3).
W T O = W c r e w + W p a y l o a d 1 W f u e l W T O W e m p t y W T O
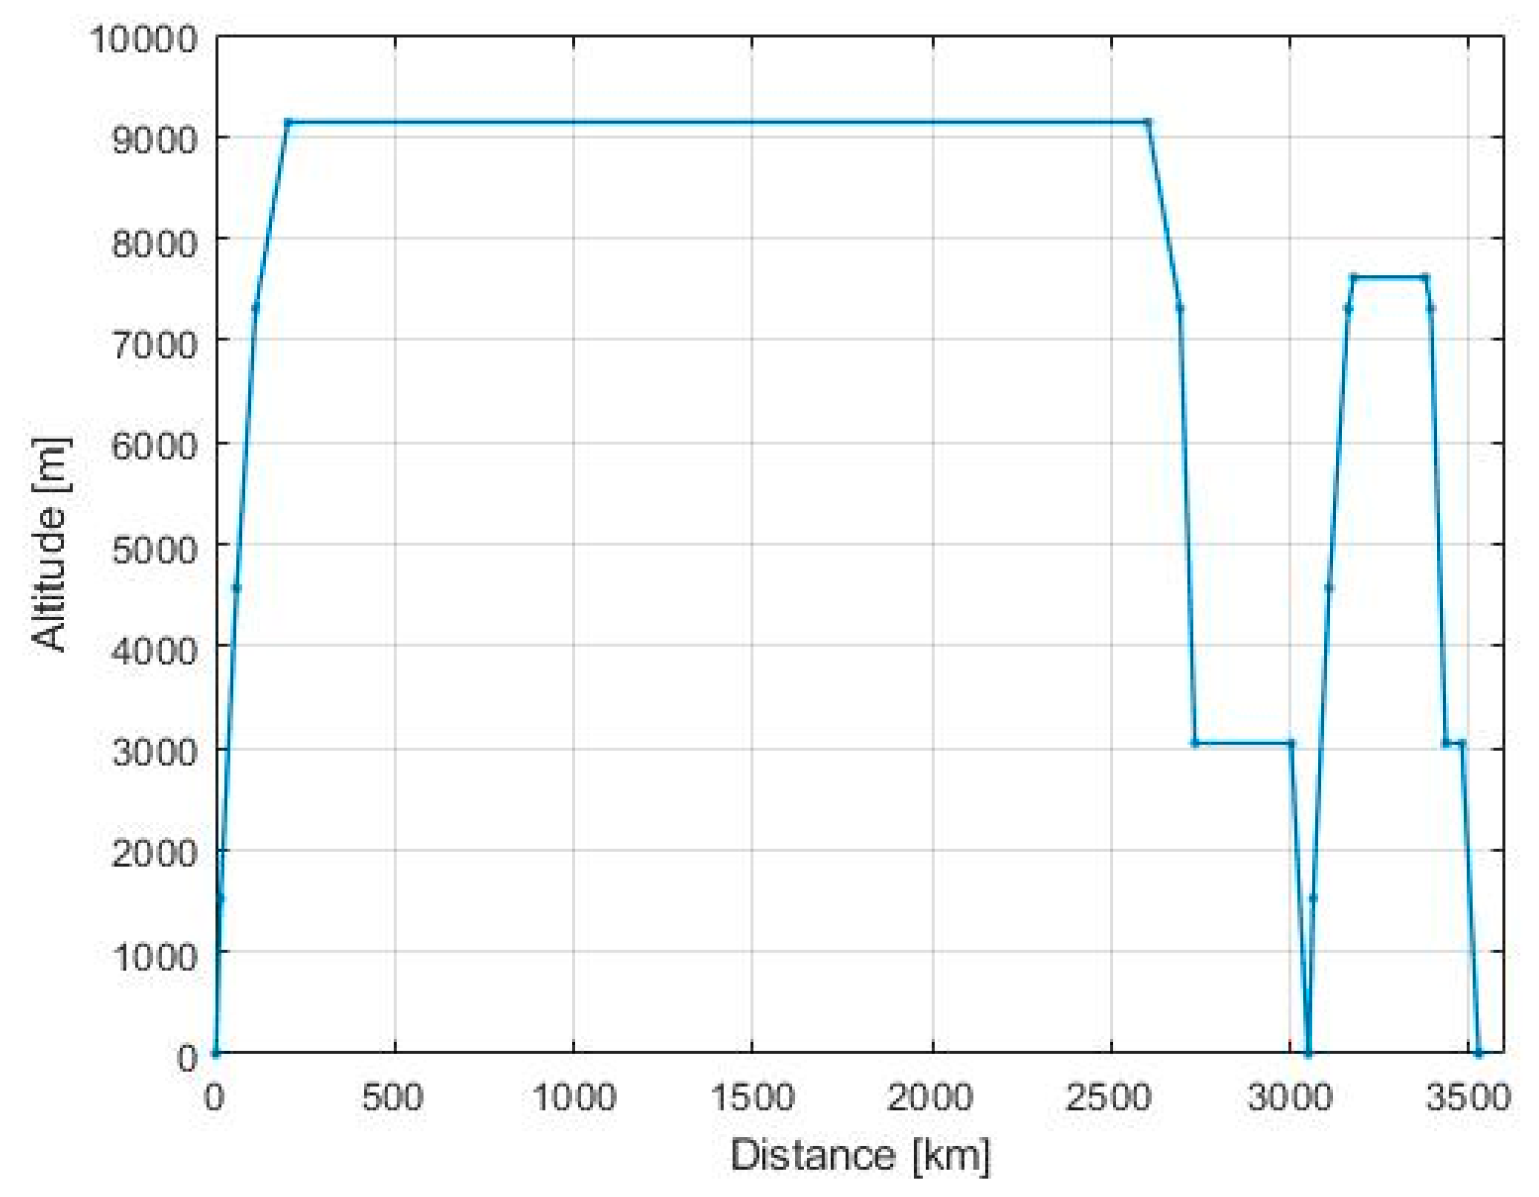
For what concerns fuel fraction, it is necessary to consider the actual fuel consumption for a specific mission profile. In this case, the mission displayed in Figure 4 has been considered. The considered reference mission profile features a four-segments climb after take-off, a main cruise at constant altitude (~9000 m), a two-steps descent, a holding with a first tentative landing maneuver and a subsequent diversion of about 500 km characterized by an associated climb, short cruise, descent and final landing.

3.2.1. Fuel Mass Estimation

According to [28], the fuel fraction of the aircraft for the entire mission can be estimated as in (4)
W f u e l W T O = 1.087 · 1 i = 1 N p h a s e s W i W i 1
where W i W i 1 is the ratio between the mass at the end of the i-th and (i-th-1) phases and 1.087 is a dimensionless factor to take int account reserves (which has been increased from the original 1.06 value). Numerical suggestions for these ratios already exist for subsonic kereosene-powered aircraft per each specific phase (e.g. take-off, climb, descent, approach etc…). These values come from semi-empirical models based on the assumption that common operational profiles produce well known values of fuel consumption. Usually, values of about 0.97, 0.98 and 0.99 are used for take-off, climb and descent respectively. For constant flight altitude phases, such as cruise and holding, the amount of fuel used can be derived applying the Breguet formulation, as in (5).
W e n d W s t a r t l e v e l   f l i g h t = e R a n g e   · S F C · g V · E  
where the Range refers only to the specific phase, SFC is the specific fuel consumption in kg/s/N, g is the gravity acceleration in m / s 2 , V is aircraft speed in m/s and E is the aerodynamic efficiency.
In case the range is not known a priori, or in case a user is characterizing a flight phase with variable altitude, Eq. (6) can be used, where an estimate of the duration of the leg is required as well as an update of aerodynamic and propulsive characteristics for the specific phase.
W e n d W s t a r t = e D u r a t i o n   · S F C · g E
Of course, when dealing with innovative aircraft using unconventional fuels, traditional W i W i 1 ratios cannot be directly applied, since the fuel consumption characterizing the operations of hydrogen powered engine is expected to be different from the one of conventional aircraft. In particular, hydrogen mass is intrinsically lower than the equivalent kerosene mass (to produce the same thrust values, thus applying an energy content equivalence), and consequently the impact on the overall aircraft mass is also lower, thus reducing the W i W i 1 ratios to values very close to 1.

3.2.2. Empty Mass Estimation

As far as the empty mass fraction is concerned, it can be estimated using a semi-empirical relationship, always suggested by [28], as reported in (7).
W e m p t y W T O = 0.32 + 0.66 · W T O 0.13 · A R 0.3 · T g W T O 0.06 · W T O S r e f 0.05 · M a c h M a x 0.05 · K
where AR is the aspect ratio, T g W T O is the thrust-to-weight ratio at take-off, W T O S r e f is the wing loading at take-off and K is a correction factor.
However, (7) is conceived for conventional aircraft, typically featuring integral tanks. In this case, dedicated rigid tanks are required to store hydrogen in liquid (cryogenic) state. Cryogenic tanks can become quite bulky and heavy, posing a challenge for integration into aircraft [29] and shall thus be considered in the conceptual design loop.
Literature usually refers to volumetric and gravimetric efficiencies of pressurized cryogenic hydrogen tanks, specifying the quantity of hydrogen they can store in relation to the tank volume and weight. Particularly, volumetric efficiency measures the amount of hydrogen that can be stored inside the tank relative to the total tank volume. Since liquid hydrogen has a very low density, cryogenic tanks must be designed efficiently to minimize the space inside that is not occupied by fuel. Volumetric efficiency is often expressed in liters (or cubic meters) of liquid hydrogen per liter (or cubic meter) of tank volume and is usually measured as a percentage. In the past, volumetric efficiencies were around 70% [30]. However, thanks to research in the field, technologies have improved and currently tanks with vacuum insulation can achieve volumetric efficiencies of 85.5% [31,32].
On the other hand, gravimetric efficiency measures the amount of hydrogen that can be stored inside the tank relative to its total weight. To be sufficiently robust and guarantee proper insulation for efficient hydrogen storage, tanks may reach considerable weights, especially when compared to the weight of the hydrogen they contain due to its low density. Gravimetric efficiency is expressed in kilograms of liquid hydrogen per kilogram of tank weight and it is also measured as a percentage. This parameter depends on various factors, including the tank size. Space rocket tanks have a single chamber that holds an enormous amount of hydrogen, allowing them to achieve gravimetric efficiencies where the tank structure mass is only 15% of the hydrogen mass [33]. However, aircraft tanks, in addition to being smaller, can even be more complex. This is because they must be able to maintain internal temperature for a longer time, usually facing more severe safety requirements. For these reasons, the gravimetric efficiencies of transport tanks are extremely low. Current efficiencies are around 20-35%, meaning they transport between 0.2 kg and 0.35 kg of hydrogen per kg of total mass (tank + fuel) [2,34]. Modern technologies promise to reach 50%, and estimates suggest that future tank generations will be able to achieve efficiencies beyond 70% [12]. However, the majority of literature states that 50% is a reasonably reliable value to which efficiency can tend in the near future [12,35,36].
The performance of a cryogenic tank may vary depending on various factors including tank design, materials used, thermal insulation technology, and storage pressure. For the sake of this work, the tanks analyzed will be approximated as cylinders connected by hemispheres, characterized by a gravimetric efficiency of 0.50 and a volumetric efficiency of 0.855.
To close the mathematical model, thus solving Eq. (4), some preliminary evaluation of aero-propulsive performance of the aircraft are needed. When it comes to aviation engines, the specific fuel consumption of a hydrogen-powered turbofan differs significantly from that of a conventional aviation engine exploiting kerosene [31]. This divergence arises from the unique properties of hydrogen as a fuel source. Most notably, it provides almost three times the energy per unit mass with reference to kerosene. Consequently, hydrogen-powered turbofan engines can attain significantly lower Specific Fuel Cconsumption (SFC), as they can produce the same level of thrust or power while consuming less fuel mass [32,37]. For traditional kerosene-powered turbofan engines, typical SFC values can vary, generally falling in the range of approximately 0.5 to 0.6 pounds of fuel (Jet-A or JP-8) per hour per pound of thrust (lb/hr/lbf) in cruise [38,39], while one third of these numbers is expected in case of hydrogen combustion. Since hydrogen engines are still under development there is a scarcity of typical SFC values to compare, making the estimation of this parameter a rather intricate task. Nonetheless, extensive research has been conducted in this field over the years. For instance, NASA estimated that these modified engines could achieve specific fuel consumption values of approximately 0.105 kg/hr/daN at sea level under standard conditions and of 0.205 kg/hr/daN at Mach 0.85 at 35000 feet [40,41]. Recent advancements in materials and technologies have further contributed to the refinement of these estimates. As a result, some studies suggest specific fuel consumption values as low as 0.170 kg/hr/daN for the cruise phase [42]. In this work, the values reported in (8) have been considered as a conservative approach, with reference to literature.
S F C T a k e O f f = 3.33 10 5   kg / s / daN   S F C C r u i s e = 5.83 10 5 kg / s / daN
Intermediate values of SFC are used for the other phases, considering values in (8) as lower and upper boundaries.
In terms of aerodynamic characteristics, it is possible to use the model suggested in [28] to evaluate the efficiency of the aircraft in a simple way. In this context, maximum aerodynamic efficiency is conceived as function of wing aspect ratio (AR) and surfaces ratio, as in (9).
L D M a x = K L D A w e t = K L D A R S w e t S r e f  
where K L D is a factor that varies according to the category of aircraft and is 15.5 for civil jets, A w e t is defined as wetted aspect ratio and S w e t S r e f is defined as wetted area over wing planform area.
As starting point for the iteration, a reference value of AR equal to 10.4 is selected. This yields a maximum efficiency of 16.4, and a cruise efficiency of around 14.2.
A complete analysis is then carried out using Eq. (4-9)

3.3. Performance Requirements Analysis and Matching Chart

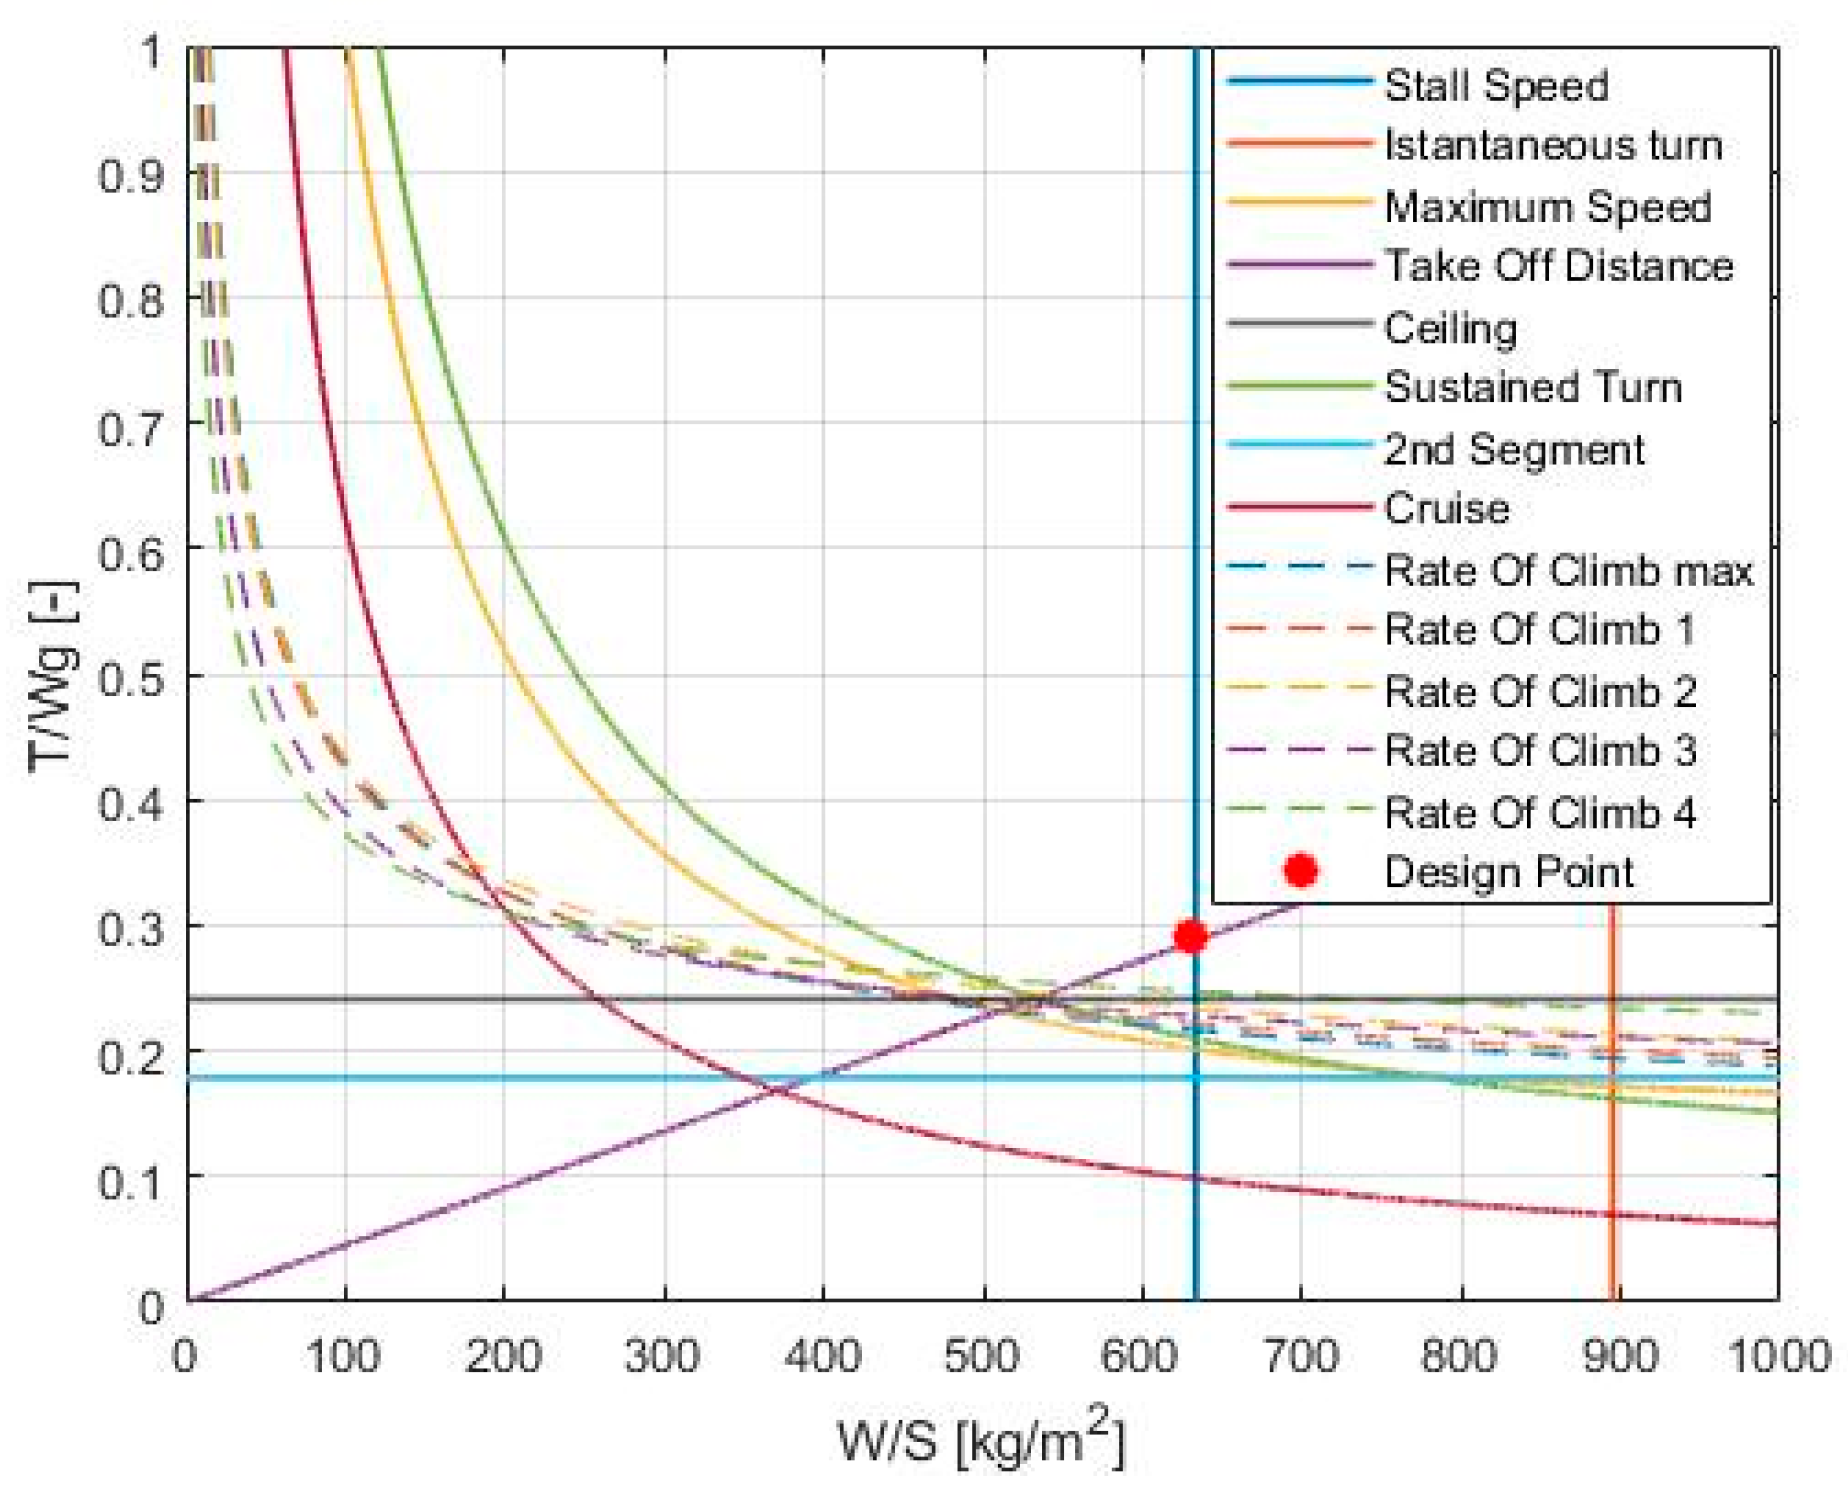
The iterative cycle on the mass requirement is coupled with the analysis of thrust requirements for the different flight phases, adopting the matching chart approach. This graphical tool represents a sort of performance map of an aircraft and enables engineers to assess the thrust-to-weight ratio and wing loading at a critical stage of the design process. The chart allows for the identification of a feasible design space and the definition of a design point that describes the best configuration of the vehicle in terms of maximum thrust, maximum take-off weight, and wing area while meeting all high-level requirements. It should be noted that this methodology, after being introduced by NASA [43], has been widely analyzed, used and even expanded, as in [28,44,45]. Unlike the procedure considered for estimating of MTOW, the matching chart approach requires a more detailed investigation of the aircraft requirements impacting either thrust-to-weight ratio or wing loading and employs flight mechanics theory. For the purposes of this work, requirements associated to stall (landing) and maximum speeds, take-off distance, reference turn, second segment, maximum rate of climb and ceiling, as well as cruise, were formulated, according to (10-19). The aircraft is supposed to behave like the associated traditional platform, even though the reduced take-off mass can be beneficial for take-off and landing requirements, as well as, in general, for wing design, since a lower surface may be required to sustain the airplane along the different phases of the mission, with potential reduction of parasite drag. Equations however, still hold as for the traditional competitor.
Stall speed requirement, also referenced as landing requirement in many manuals, is defined as in (10).
W S l n d = 1 2 V l n d 2 ρ 0 C L M a x g
where V l n d is the reference speed for the landing and C L M a x is hypothesized equal to 3.0. The phase is supposed to take place at sea level ( ρ 0 ).
Maximum speed requirement is defined as in (11)
T W M a x V = ρ c r u i s e V M a x 2 C D 0 2 W S g + 2 K e ρ c r u i s e V M a x 2 W S g
where
K e = 1 π   A R   e  
And e is the Oswald factor.
Take-off distance requirement can be defined as in (13).
T W T O = W S 1 l T O C L T O ρ T O
where l T O is take of distance and C L T O is the reference take-off lift coefficient, here assumed equal to 1.80. Take-off distance was set to 1300 m, at an altitude of 2800 m (to set proper value of ρ T O ).
Reference turn requirements can be set for the so-called “instantaneous turn”, representing a quick maneuver, and sustained turn, as in (14) and (15) respectively.
W S = 1 2 ρ 0 V r e f 2 C L T u r n 1 n t u r n   
T W = 1 2 ρ 0 V r e f 2 C D 0 W / S + W S n t u r n 2 1 2 ρ 0 V r e f 2 K e     
Second segment requirement comes from the reference regulation [46], prescribing a minimum value of climb gradient of G 2 n d = 2.4 % for twin-engines aircraft after take-off in case of one engine inoperative situation, as reported in (16).
T W = N e n g i n e s N e n g i n e s 1 1 E T O + G 2 n d
where E T O is the efficiency at take-off.
Rate of Climb (ROC) requirements can be specified for different mission legs, but in general, when referring to maximum ROC, the equation has the format of (17).
T W = R O C Π 2 g ρ r e f C D 0 K e W S + 1 E M a x  
In case ROC is equal to 0, it is possible to derive the equation for theoretical ceiling, as in (18), starting from the assumptions of (17).
T W = 1 E M a x
Cruise requirement is here formulated for best range condition, as specified in (19).
T W = 1 2 ρ c r u i s e V c r u i s e 2 4 3 C D 0 Π W S g  
where Π is the throttle in cruise.
The application of the overall method leads to the converged solution described in Table 1, in terms of mass.
Reference fuel mass fractions for the different phases are reported in Table 2. The methodology adopted for the derivation of the different mass fractions allow avoiding an overestimation of fuel mass (which can be potentially obtained if using traditional values). In fact, an excessive fuel quantity estimation, because of legacy data from literature, may lead to the definition of a large aircraft concept that will have difficulties in competing with the related traditional configuration.
In terms of matching chart, the result reported in Figure 5 are obtained.
The feasibility area is located above the highest T/Wg curve and at the left of the lower wing loading requirement (i.e. the stall/landing requirement). The selected design point lies on the wing loading requirement associated to the landing, where this encounters the take-off requirement, in order to minimize the required wing surface for the selected aircraft mass. Therefore, the required thrust-to-weight ratio to rise of about 0.05 (with reference to minimum achievable value), but the benefit of a smaller aircraft layout is acknowledged to be a priority. In addition, take-off requirement is critical because of the combination of short take-off distance and high-altitude of the airfield, which have both been considered to be strategical for the operations of the aircraft (to enable more routes, unlocking also additional destinations characterized by smaller airports). This yields a reference wing surface of about 100 m 2 and a required thrust of 177 kN (total), with wing loading equal to 630 k g / m 2 and thrust-to-weight ratio equal to 0.29.
In terms of overall dimensions, the layout proposed in Figure 6, based on the external configuration of A320 aircraft family, is in line with requirements and preliminary results and can therefore be considered as reference. A main hydrogen tank (blue) is located in the aft part of the fuselage, exploiting the entire airframe diameter. Additionally, two side-by-side cylindrical tanks (blue) are located in the forward part of the aircraft, below the cabin floor, exploiting part of the volume traditionally used for the cargo hold (Figure 6 shows only one, since they are side-by-side). The cabin (green) is kept in a conventional position, while the remaining cargo volume (red) is in the middle part of the airframe. Considering the reduced payload capability, cargo compartment is considered to be enough for passengers baggage, even if part of the vane is used for the forward hydrogen tanks. The positioning of the tank allows theoretically to control the Center of Gravity (CoG) of the aircraft during the depletion sequence of the hydrogen in flight, as discussed later on.

3.4. Payload-Range Diagram and Operational Capability

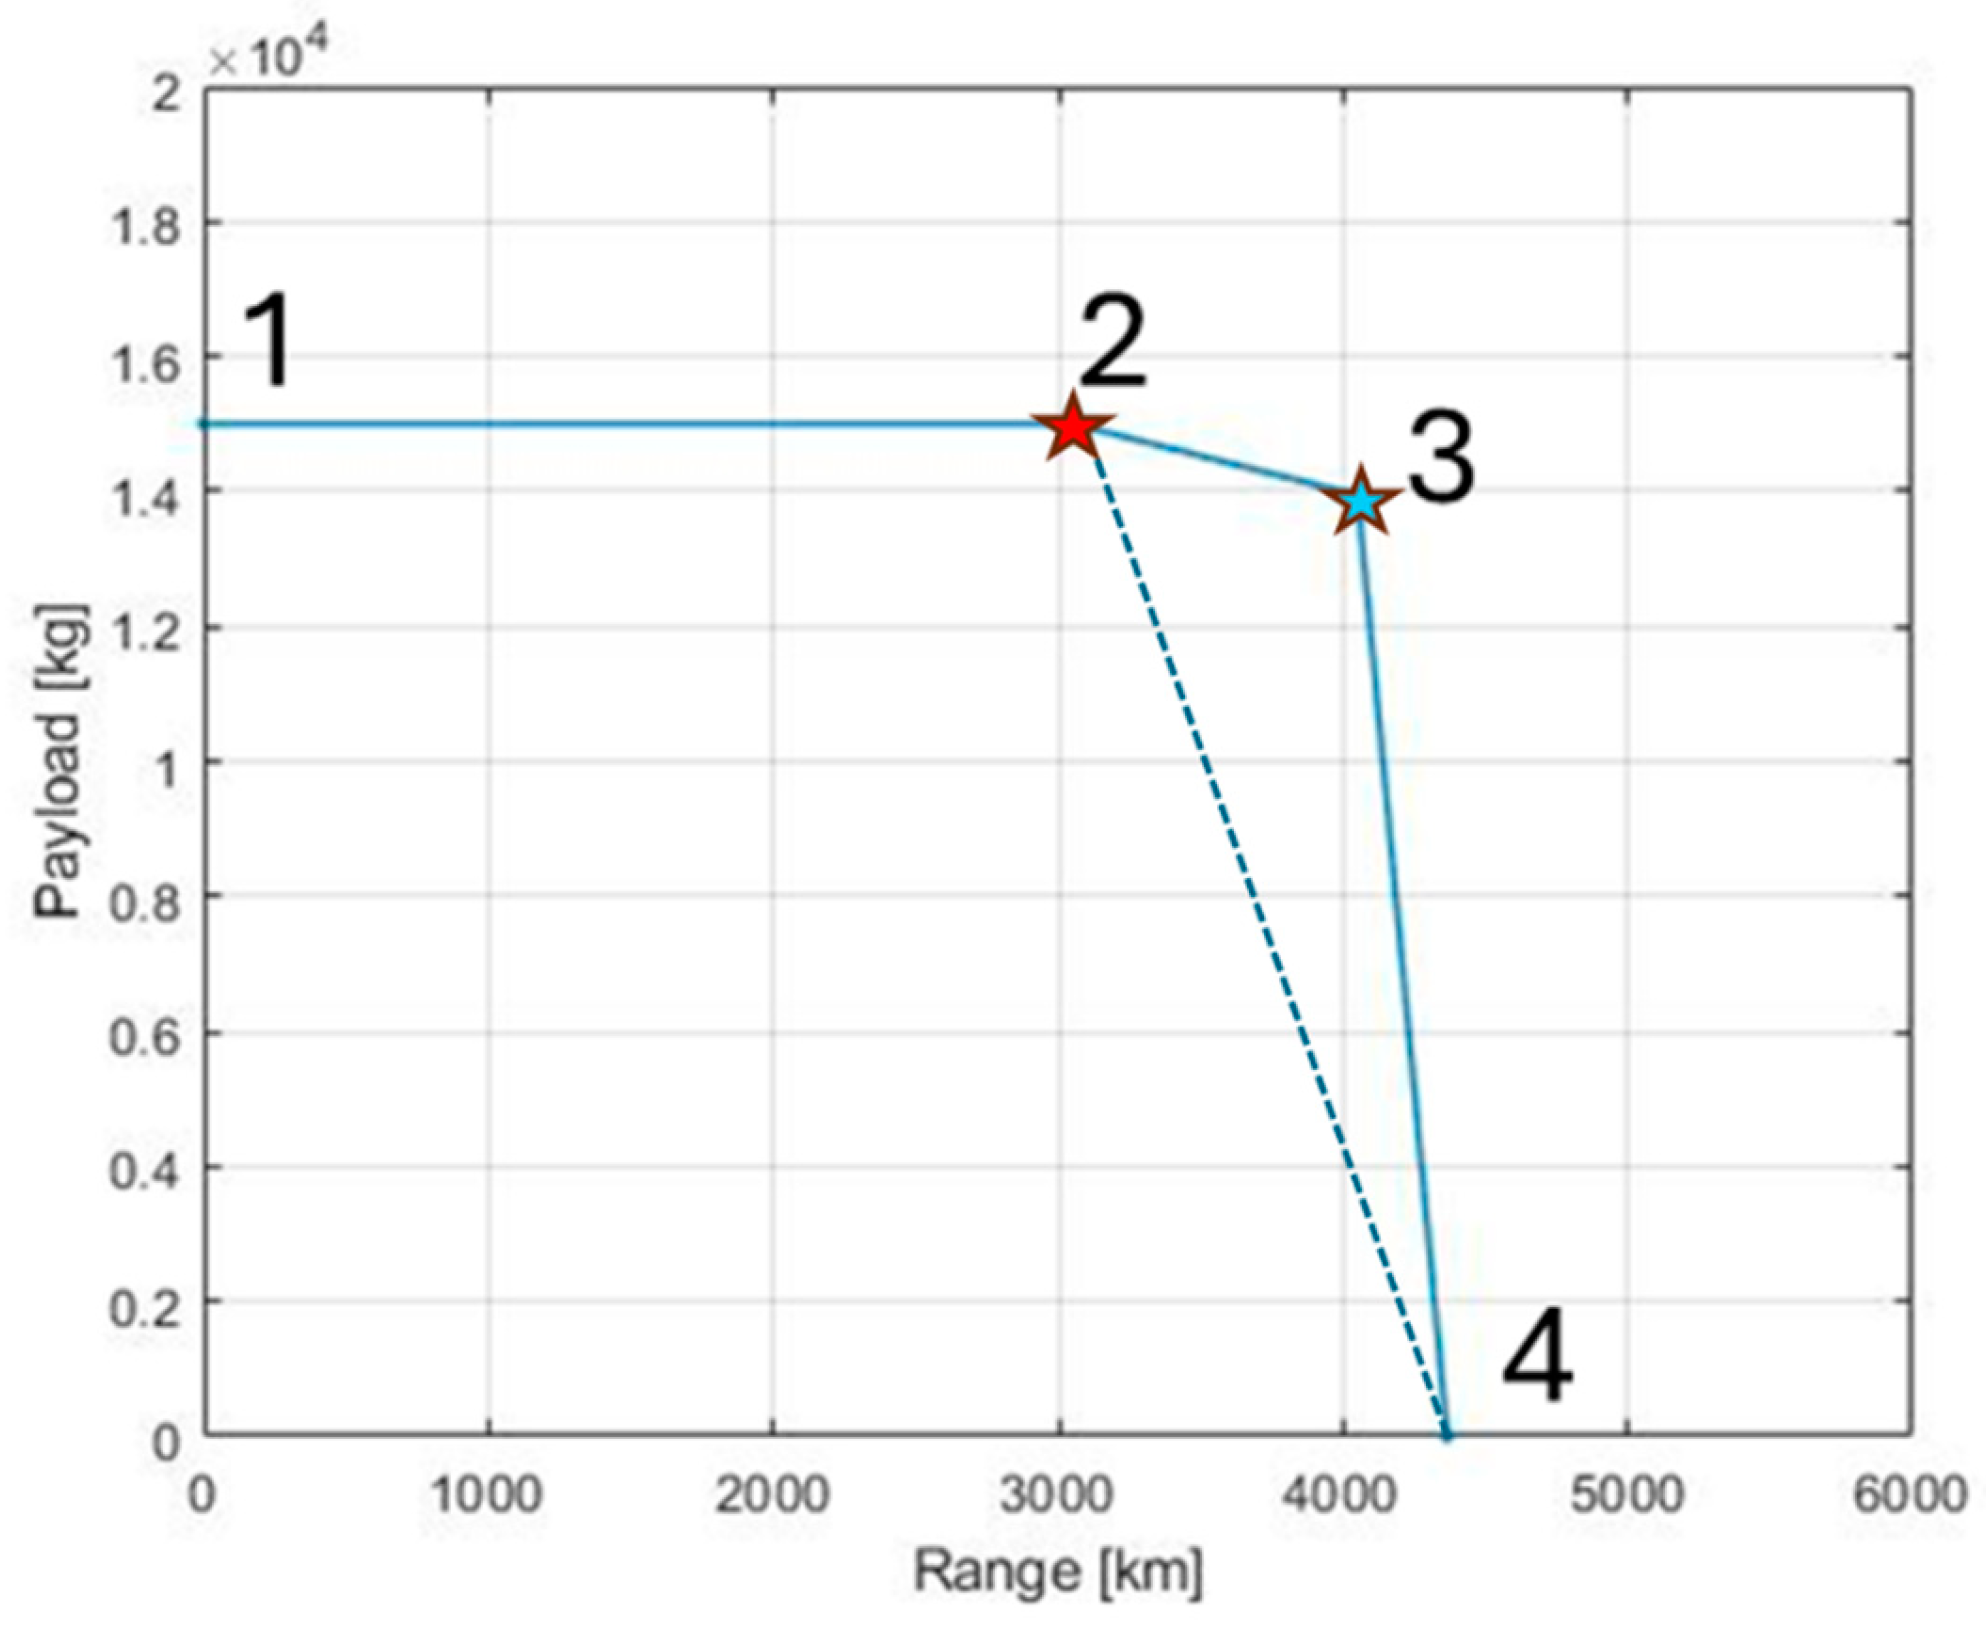
The nominal mission requires 4059 kg of fuel (for 3000 km and 150 passengers). However, since this would result in a very short mission with reference to competitor narrow bodies exploiting kerosene (able to cover trans-Atlantic routes) for similar passengers number. For this reason, the option of containing more fuel, with an even more reduced payload capability, is introduced, increasing the maximum capacity without modifying the MTOW of the aircraft. At this purpose, the payload-range diagram [47] reported in Figure 7 is in fact considered, with a theoretical maximum range (at zero payload, pt. 4 of the chart) of around 4300 km and a maximum storable fuel of 5100 kg. An intermediate operational area (pt.2 to pt.3 of the chart) can be identified, starting from the nominal mission (pt.2, red star) and performing a trade-off between payload and range (i.e. fuel), while maintaining the aircraft at its MTOW (up to pt. 3, cyan star). As a result, the possibility of implementing a longer aft tank is considered. Overall length increase of this tank, is estimated in around 0.7 m to reach the 5100 kg capacity.
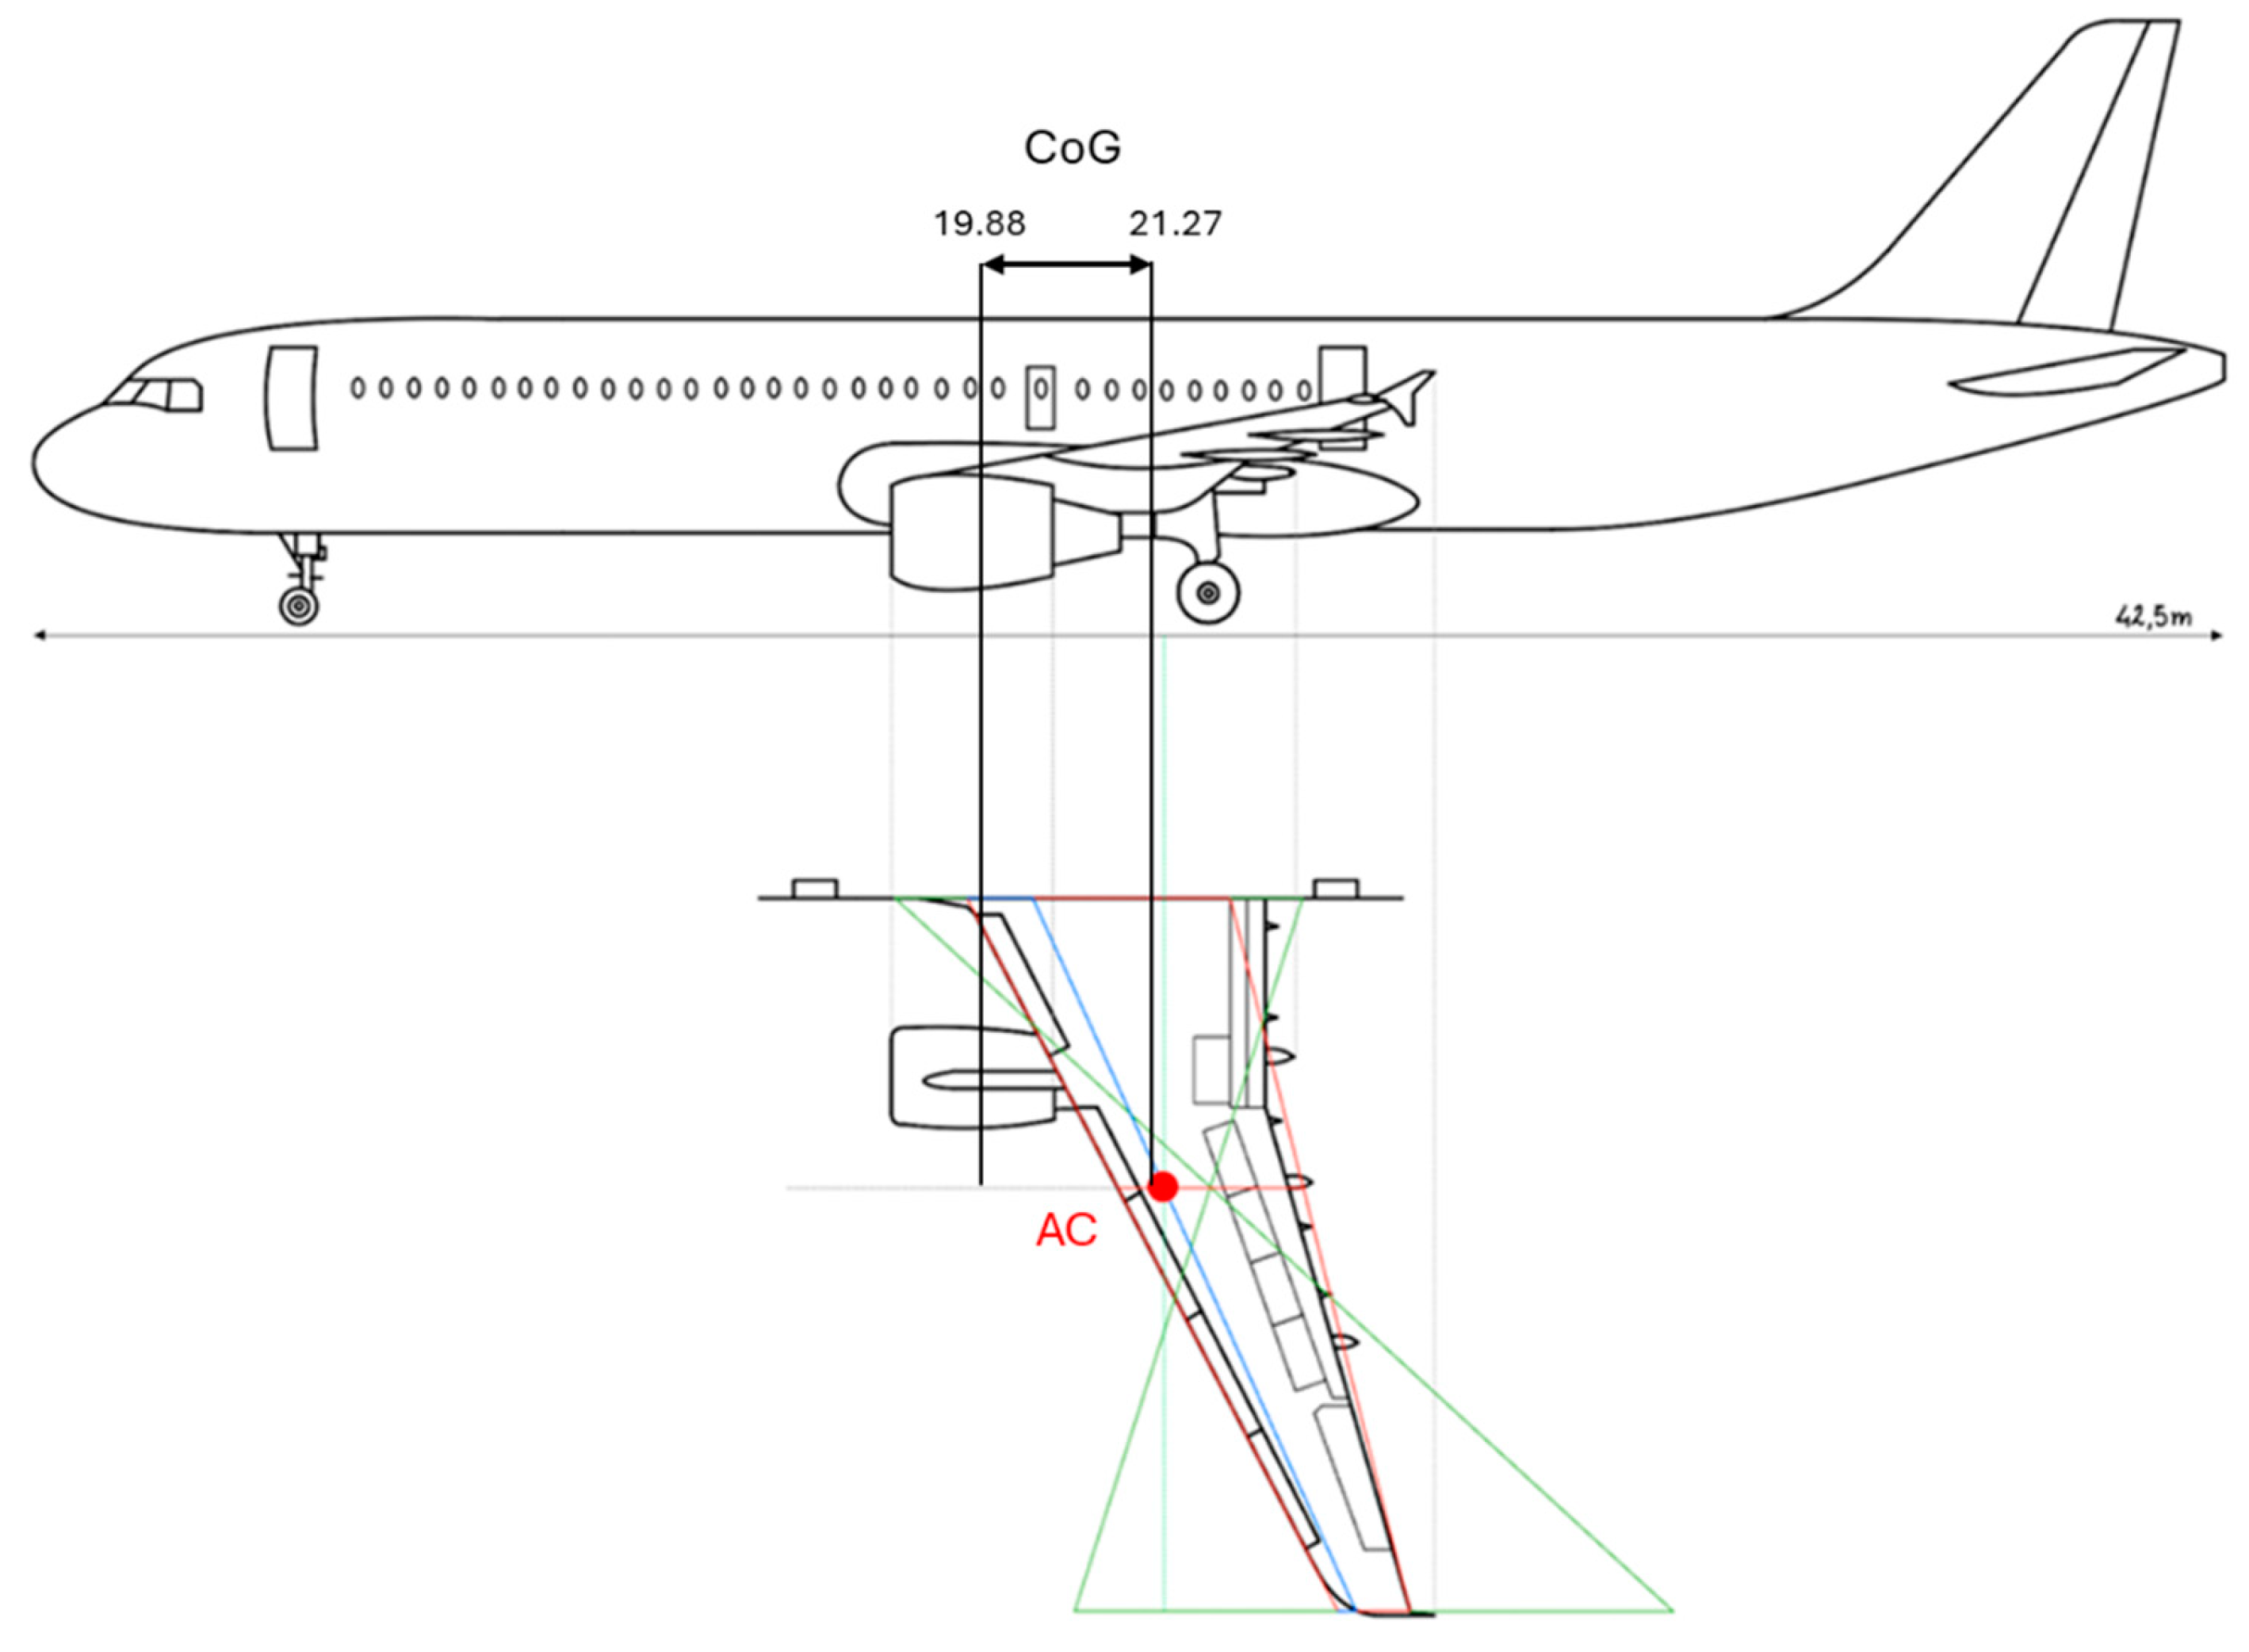
Considering that the main elements of the aircraft are in place, a preliminary analysis of the CoG can be performed by considering the combination of equivalent concentrated mass of tanks (full and empty), payload, cargo and distributed elements, generally referred to as airframe. This can be compared with the position of the aerodynamic centre of the wing (computed geometrically in Figure 8) to have a first evaluation of the overall neutral point of the aircraft and, as consequence, of the possibility of obtaining a static margin compatible with longitudinal static stability.
Neutral point is expected to be positioned at 21.9 m from the aircraft nose. Evaluation of the CoG in full and empty tanks conditions is performed associating to the elements in Figure 6 their concentrated mass, while evaluating their arm with reference to aircraft nose. This analysis is performed for both take-off and landing conditions associated to the main points of the payload-range diagram. The results are reported in Table 3 (operational condition 1 of the diagram is neglected). It can be noted that in all circumstances, the aircraft is statically stable, ensuring a positive margin of stability, even if for longer ranges the margin becomes thinner. In fact, if compared to conventional A320 layout, the wing has to be moved slighlty backwards, towards the tail of the aircraft, in order to ensure adequate margin in all conditions. With this layout, the aircraft is also stable on ground since the main landing gear lays behind the most rearward position of the computed CoG combinations.
The upgraded conceptual design methodology and tools presented in this section demonstrate of being capable of supporting the design of novel aircraft concepts propelled with hydrogen. Moreover, the technical feasibility of the presented solution is checked, even if additional efforts shall be placed to better investigate intrinsic problems of LH2 aircraft configurations of managing the fuel on-board in terms of thermal control and engine feed. However, the economic sustainability of the configuration needs further assessment to verify its competitiveness in operation. Section 4 focuses on the operational costs estimation of the aircraft.

4. Operating Costs Estimation and Sustainability Analysis

4.1. Operating Costs

Operating costs represent the most important cost category in the aircraft life cycle, typically including development, production, operating and disposal costs, since the amount of economic efforts which occur in the operational phase are by far the largest contribution [48]. Typically, the operating costs of an aircraft, with particular reference to those directly associated to the flight, can be predicted according to analytical or semi-empirical models based on vehicle data and performance, as well as on some statistical relationships. This approach, known as parametric costs estimation, uses Cost Estimation Relationships (CERs) to relate costs directly to design and mission parameters of the aircraft. This means that the characteristics of the specific design chosen by the engineers will have huge impact on the operational life and competitiveness of the vehicle. A careful cost engineering is thus crucial to understand whether a technically viable concept is also economically sustainable, especially looking at potential competitors. For the purpose of this work, the model described in [48], properly updated to include the aspect associated to LH2 on-board, as well as to tune costs to current historical period, is used to predict operational costs of the LH2 concept derived in Section 2. In order to consider a potential entry into service of the LH2 aircraft in 2035, producing comparable results with a conventional vehicle (Section 4), all estimations are based on 2035, considering a 2% annual inflation from 2023 onwards. Currency is US dollar.
Usually, operating costs are constituted by Direct Operating Costs (DOCs), which can be associated to aircraft operation in a specific mission or flight, and Indirect Operating Costs (IOCs) that are related to fleet management. According to [48], DOCs can be expressed as a combination of different cost items, as in (20).
D O C = D O C f l t + D O C m a i n t + D O C d e p r + D O C l n r + D O C f i n
where D O C f l t is the direct operating cost for flying, including crew, fuel and insurance cost; D O C m a i n t represents the maintenance cost; D O C d e p r is the depreciation cost of the aircraft; D O C l n r is the combination of landing and navigation fees, as well as registry taxes; D O C f i n is the cost of financing.
The mission specified by pt. 2 of the payload-range diagram (Figure 7) is considered, and the aircraft is characterized by the take-off mass and fuel mass specified in Table 1. A block time t b l of 4 hrs (Block Hours – BH) is considered, with a block speed V b l of 403 NM/hr and an annual utilization U y e a r of 2170 hrs. This implies that the annual block range R b l is 874230 NM.

4.1.1. Cost for Flying (Crew, Fuel, Insurance)

Starting with D O C f l t , according to [48], cockpit crew cost can be computed as in (21).
C c r e w = 1 + k · S A L A H + T E F V b l
where S A L is the annual salary in $, A H is the annual flight hours for the pilot (900 hrs have been considered), T E F is a travel expense factor ( 20.39   $ / B H ) and k is a factor to accounts for other expenses, such as vacation pay (it has been considered equal to 0.26). Salary can be adapted for captain and first officers, but a value between 140 k$ and 275 k$ per year is considered for 2035, starting from the values suggested in [48]. As result, a value between 0.53 – 1.00 $/NM is computed (for first officer and captain respectively), i.e. 214 - 403 $/BH. Cumulative value is 1.53 $/NM or 617 $/BH.
Fuel cost is one of the main sources of D O C f l t , especially for LH2, which is characterized by a higher cost if compared to traditional kerosene. Hydrogen production costs can vary depending on the geographical region, energy policies, and specific technologies used. For example, the cost of green hydrogen is closely linked to the development of hydrogen production and renewable energy generation technologies. Since green hydrogen is produced using electrolysis powered by renewable energy, the costs of renewable energy itself play a key role in influencing hydrogen costs. Investments in larger infrastructure and production capacity can contribute to making green hydrogen more cost-effective. Moreover, increased demand could stimulate investments and large-scale production, helping to reduce costs. For all these reasons, the cost of green hydrogen is expected to decrease over the years. According to most current research, LH2 price is projected to drop by a factor of 4 from today to roughly the same cost per unit energy as for kerosene by 2050 [2]. This allows for lower costs of electricity from renewable sources, which in turn affects potential green hydrogen production. This enables significant progress for this region. It is estimated that hydrogen could be obtained at a cost of $3.1 USD/kg in 2030 and $1.8 USD/kg in 2050, including liquefaction costs (which are far from negligible) [52]. In even more optimal regions, a 62% cost reduction is estimated by 2030, reaching costs in the range of $1.5/kg [53]. Many other less optimistic estimates suggest costs around €3.5 per kg in 2030, especially for production in European Union countries [54], or even higher [49,50,51]. Even for 2050, estimates are uncertain: in general, it can be said that the cost of hydrogen can go below €2/kg [55,56].
For the purposes of this estimation, a value of fuel price F P of about 2.5 $/kg has been considered (1.25 $/lb) for 2035. This assumption is perfectly in line with the average 2035 forecast reported in [57].
In that case, fuel cost can be computed as in (22)
C f u e l = M f u e l R b l F P
resulting in 6.90 $/NM or 2781 $/BH.
To close the evaluation of D O C f l t an insurance cost C i n s is estimated, considering a reference value of 0.53 $/NM or 214 $/BH, which is around 2% of total D O C .
D O C f l t can then be estimated as in (23)
D O C f l t = C c r e w + C f u e l + C i n s = 8.96 $ / N M     3611 $ B H

4.2.2. Maintenance Cost

D O C m a i n t   can be computed, according to [48], following a quite complex set of relationships providing estimation of labour and material costs for airframe and propulsion plant maintenance-related tasks. Literature suggests that, for a traditional narrow body aircraft, this cost item is typically around 900 $/BH in 2023 [58]. This value has been extended to consider an extra 40% of activities (i.e. of cost) per block hour, because of hydrogen storage and distribution systems on board, as suggested (as maximum) by [59] and then projected to 2035, obtaining 1562 $/BH. This is equal to 3.88 $/NM.

4.2.3. Depreciation Cost

D O C d e p r represents the loss of value of the aircraft because of its age and operational life, being function of the initial aircraft price and subsequent utilization. It is still unknown if the presence of hydrogen and related technologies for its management on-board may potentially induce a higher price compared to conventional platform, so a reference value of 115.65 M$ was set as 2035 Aircraft Estimated Price (AEP), considering 62.3 tons of take-off mass, hypothesizing that the average value of the aircraft should not be subjected to a high price deviation. This is equivalent to 93.27 M$ in 2023, which is an average value of the A320 family. D O C d e p r can be thus computed as in (24).
D O C d e p r = 0.85 · A E P D P · U y e a r s · V b l
With this value, a total depreciation of about 5.62 $/NM (i.e. 2265 $/BH), for a 20 years life (Depreciation Period – DP), is expected.

4.2.4. Landing, Navigation Fees and Registry Taxes

For what concerns D O C l n r it is difficult to provide a single value, since landing fees are strictly depending on the specific airport taken in consideration. For this specific case, an average value of European airports is taken, with reference to the take-off mass of the aircraft, considering the available (public) data from Amsterdam, Athens, Frankfurt, Istanbul, Lisbon, Madrid, Paris, Rome airports. Also, since the aircraft is not producing carbon dioxide, additional fees on emissions are not considered, potentially constituting an advantage for the case study. A reference value for landing fees C l a n d i n g   is thus considered around 2.52 $/NM or 1015 $/BH. Navigation fees C n a v   are instead related to flight routes followed by the aircraft, so, also in this case, an average value can be suggested, based on typical European scenario [60]. As result, a value of 1.77 $/NM or 713 $/BH is used. Ultimately, in terms of registry taxes C t a x , [48] suggests using a fraction of DOC, depending on take-off mass. In this case, a value of 0.063 $/NM or 25.4 $/BH is used. The total value of D O C l n r is provided in (25).
D O C l n r = C l a n d i n g + C n a v + C t a x = 4.35 $ N M   1754 $ B H

4.2.5. Financing Cost

To complete the analysis of Direct Operating Costs, an assumptions on financing D O C f i n is made. This is around 7% of total DOC, as suggested by [48], so a value of 1.60 $/NM is used (645 $/BH).

4.2.6. Total Operating Cost

The overall DOC for the hydrogen aircraft is thus specified in (26)
D O C = D O C f l t + D O C m a i n t + D O C d e p r + D O C l n r + D O C f i n = 24.41 $ N M      9837 $ B H
Total Operating Costs (TOCs) shall also include IOCs as final contribution to estimate the global operational effort to economically sustain operation of a single aircraft, establishing also the impact on ticket price per seat/passenger. Ref. [48] suggests IOCs to be 40% of the overall DOCs, in order to include passengers service, aircraft servicing, sales, administration, station and ground at fleet level, etc… This leads to a IOCs estimation of about 9.76 $/NM (3935 $/BH). Total cost is thus reported in (28).
O C s = D O C s + I O C s = 34.17 $ N M     13772 $ B H
This means around 55.1 k$ per flight, 367 $/pax and 0.122 $/pax/km.

5. Upstream Sustainability Assessment

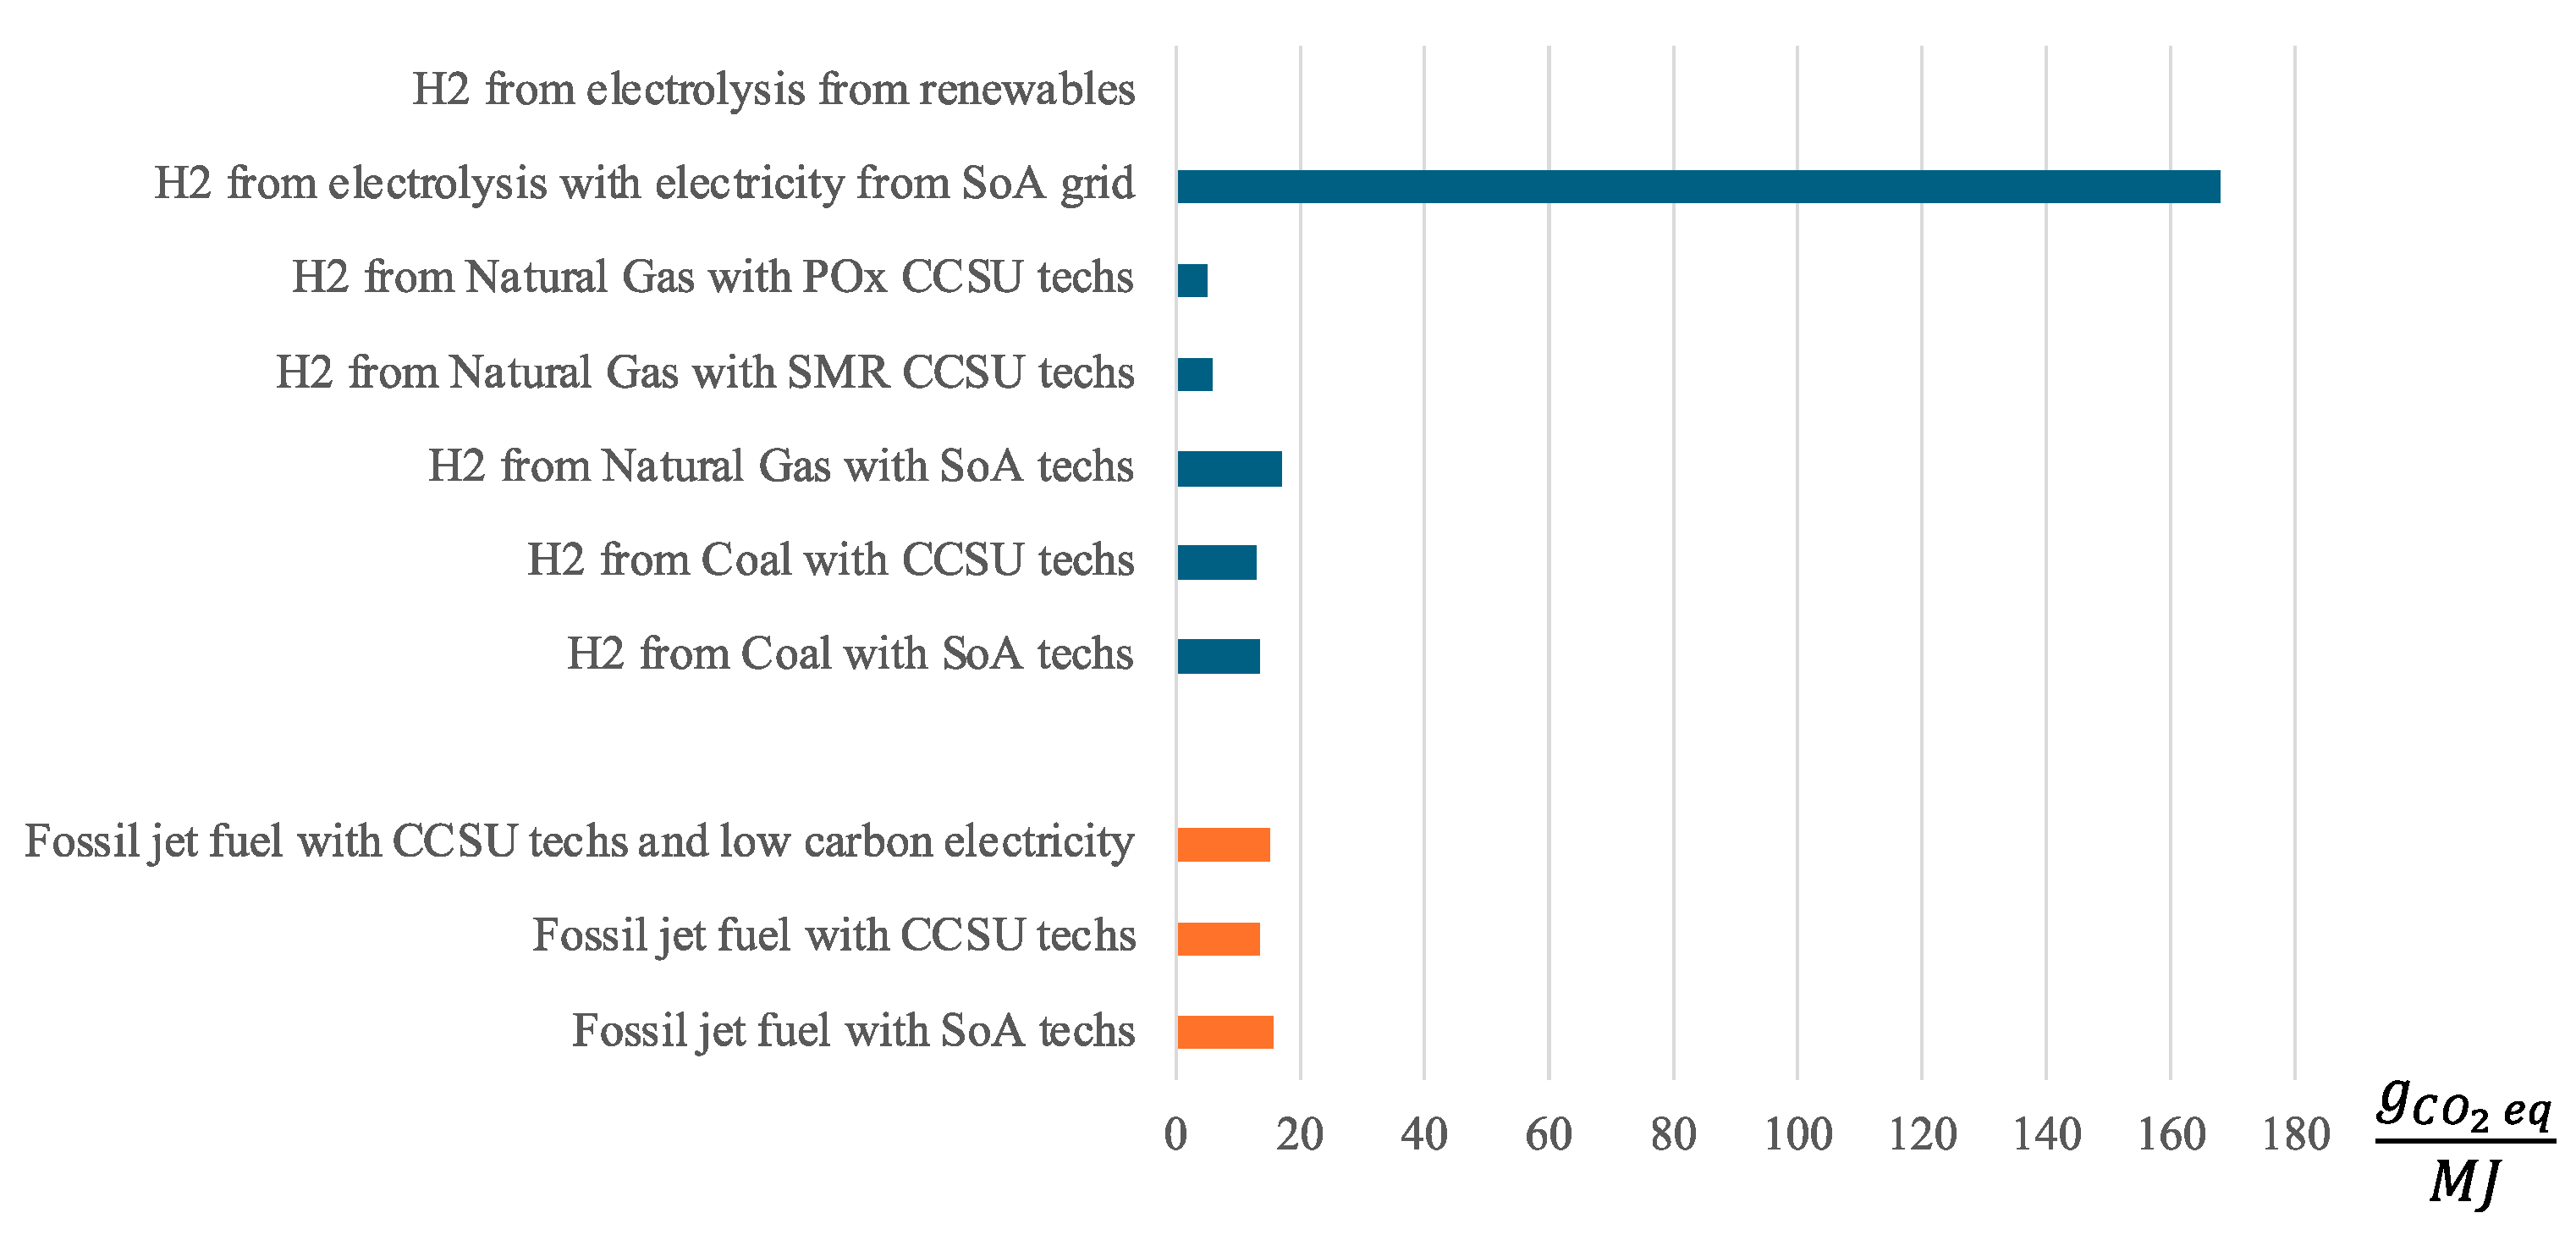
As highlighted by Kossarev et al. [7], in the attempt of checking the feasibility of an upgraded or novel aircraft design, it is fundamental to complement the technical investigations with the economic and environmental impact assessment. As far as the environmental impact is concerned, analytical formulations to anticipate the amount of chemical species produced by the direct combustion of traditional and sustainable aviation fuels have already been published [61]. However, especially when comparing the performance of traditional aircraft with novel concepts exploiting SAF, it is of uttermost importance to look carefully at the upstream emissions, i.e. to consider the entire fuel life-cycle. Considering hydrogen, in recent years, colours have been used to refer to different sources of hydrogen production. According to [62], “Black”, “grey” or “brown” refer to the production of hydrogen from coal, natural gas and lignite respectively. “Blue” is commonly used for the production of hydrogen from fossil fuels with CO2 emissions reduced by the use of Carbon Capture, Utilization and Storage (CCUS) technologies. “Green” is a term applied to production of hydrogen from renewable electricity. In general, there are no established colours for hydrogen from biomass, nuclear or different varieties of grid electricity. As the environmental impacts of each of these production routes can vary considerably by energy source, region and type of CCUS applied. According to the production pathways, the CO2 equivalent impact of different hydrogen production technologies varies widely. In particular, Figure 9 provides an overview of the CO2 equivalent impact of different hydrogen production technologies compared with the CO2 equivalent impact of current fossil jet fuel production.
In details, according to the International Energy Agency [63], the equivalent carbon intensity of hydrogen from natural gas without CCUS (17 g C O 2 e q / M J   ) is comparable to the one of hydrogen from coal without CCUS (14 g C O 2 e q / M J   ). The introduction of CCUS technologies can lead to moderate reductions of the impact (for hydrogen from coal 13 g C O 2 e q / M J ; from Natural gas with Steam Methane Reforming (SMR) 5.7 g C O 2 e q / M J ; from Natural gas with Partial Oxidation (POx) 5.7 g C O 2 e q / M J ). The high variability in equivalent carbon intensity of hydrogen from electrolysis depends on the CO2 intensity of the electricity input. For instance, the exploitation of electricity from renewable sources only can lead to a theoretically zero upstream emissions while the exploitation of electricity from the grid (with the current grid composition), can lead to pick values of the equivalent carbon intensity of hydrogen (168 g C O 2 e q / M J ) which represent an actual showstopper. In addition, the equivalent carbon intensity of jet fuels is reported, according to the forecasts of the ICAO – LTAG [15].

6. Comparisons with Conventional Competitor

The results obtained in Section 4 and Section 5 can be compared with an equivalent traditional aircraft platform to understand the viability of the concept and its competitiveness. The A319 is taken as benchmark considering the similarities in terms of payload-range capability. Particularly, a reference mission covering the same range with 150 passengers is considered for the kerosene fueled competitor, featuring a take-off mass of about 75000 kg and a fuel mass of 8400 kg. The same utilization, block time and speed are used.

6.1. Operating Costs Comparison

Considering that the DOC can be computed as in (20), the same cost items are also computed, according to the envisaged input. For what concerns D O C f l t , crew cost is not subjected to change. Fuel cost is instead an important variable to be considered. The average 2023 Jet A1 price is about 0.690 $/kg, which can be translated into 0.865 $/kg in 2035 considering a 2% inflation per year. This assumption is perfectly in line with the forecasts available in [57]. For the reference block range, this means a total value of 4.49 $/NM (i.e. 1808 $/BH). Considering also the contribution of insurance of about 0.40 $/NM, 161 $/BH (with the same hypothesis applied to LH2 aircraft, i.e. 2% of DOC), the overall D O C f l t is around 6.42 $/NM or 2587 $/BH. It can be already seen that the aircraft is much cheaper than the LH2 competitor, mainly because of the reduced fuel price.
D O C m a i n t is considered to be 900 $/BH as suggested in [58] in 2023, so the 2035 value is around 1116 $/BH (2.77 $/NM). Also in this case, the simplicity of the configuration in terms of fuel management contributes to the reduction of operating cost associated to maintenance.
The price of the A319 is known and it is established around 79 M$ in 2023, leading to an estimated aircraft price of 98 M$ in 2035. The aircraft is cheaper so it is possible to expect a reduced D O C d e p r over the same life time (20 years). With these values, a total depreciation of about 4.76 $/NM (i.e. 1918 $/BH) is expected, according to [48]. Also in this case, the cost item is lower, considering the reduced aircraft price.
For what concerns landing and navigation fees, as well as registry taxes, in this case the situation is slightly worst, since the aircraft has an higher take-off mass and contributes also to carbon dioxide emissions. In general, following the approach adopted for the hydrogen aircraft, a reference value of landing fees of about 2.58 $/NM (1040 $/BH) is expected in this case, plus 1.77 $/NM (713 $/BH) of navigation fees (which are equal to the LH2 aircraft version). Registry taxes are estimated around 0.061 $/NM (24.6 $/BH) since, even if the take-off mass is higher, global DOCs are lower with reference to LH2 aircraft. However, it should be noted that the European Union imposes a tax on carbon dioxide emissions. This tax increases based on the pollution produced and is calculated through the EU Emissions Trading System (EU ETS) [64]. The European Union's Emissions Trading System, also known as the EU Carbon Market, is one of the European Union's key environmental policy tools for addressing climate change. The primary goal of EU ETS is to reduce greenhouse gas emissions, particularly carbon dioxide (CO₂), from industries and energy sectors covered by the system. The system allocates a limited number of CO2 emission allowances to companies operating in high-energy-consuming sectors, which they can buy, sell, or trade among themselves. EU ETS covers various industrial sectors, including electricity generation, steel production, cement, oil refining, and commercial aviation. The environmental measures adopted became effective for the aeronautical sector in 2012 when aircraft operators in Europe began paying for their CO2 emissions. In [65] a method to calculate the impact of CO₂ emission costs on aircraft direct operating costs can be found, as outlined in the ETS described above. These emissions-related costs are referred to as CETS, i.e., the costs due to the EU ETS per flight.
Firstly, it is necessary to calculate the CO2 emissions per flight. According to ETS estimations, the CO₂ emission per kilogram of Jet A-1 fuel burned amounts to 3.15 kg. Once the mass of fuel burned during one trip ( W f u e l ) is known, the CO₂ emissions can be calculated. A certain amount of ECs is free, so this quantity p C O 2 , f r e e shall not subject to charges. The resulting formula for the calculation of CETS (cost per flight) is quite complex, as shown in (29).
C E T S = 3.15 · 10 3 · W f u e l · c t C O 2 · 17.6 + 0.7 · n y 2010 1 p C O 2 f r e e 100 + 2.5 · n y 2010 64.4 + 3.1 · ( n y 2010 )  
Here:
c t C O 2 represents the average costs per EC traded on the market. Every year, the costs of Emissions Certificates that are not provided for free increase more and more. Their price follows market trends, undergoing many fluctuations. As of today, the highest price is around €105 per EC [66]. The price will certainly rise in the future, but as it is impossible to estimate their future cost, this maximum value will also be used for the 2035 scenario;
n y is the year for which the cost is calculated; the two terms containing ( n y −2010) take into account the future number of aircraft movements with 2010 as the reference year. This assumes an average worldwide Revenue Passenger Kilometer (RPK) growth of 4.8% and an average RPK growth of 4.0% in Europe from 2011 to 2030;
p C O 2 , f r e e is the predefined percentage of free ECs for a specific year (for example, it represents 85% of the emission target in 2012 and 82% of the emission target from 2013). In this case, the reference year is 2005, which serves as the baseline year for defining emission targets. The quantity of ECs distributed for free by the European Union decreases each year, with the goal of continually reducing CO2 emissions. In 2035, it is estimated that the European Union will distribute only 50% of Emissions Certificates for free.
The overall tax contribution, including registry taxes is then higher and equal to 0.49 $/NM (197.5 $/BH) with a CETS equal to 700 $. Overall D O C l n r is thus equal to 4.84 $/NM (1950 $/BH). Even if this is a disadvantage with reference to LH2 aircraft, the increase of associated DOC is not enough to cover the reduction of other cost items. In fact, including also the 7% of DOC for financing (1.40 $/NM, 564 $/BH), the overall D O C for the reference A319 is supposed to be 20.19 $/NM, i.e. 8137 $/BH. Still, IOC are assumed to be 40% of DOC according to [48] so the TOC for this aircraft is equal to 28.27$/NM (11392 $/BH). This means 45.6 k$/flight, 304 $/pax and 0.101 $/pax/km.
Table 4 and Figure 10 summarize the comparison between LH2 aircraft and A319. As it can be seen, the LH2 aircraft is still competitive, even if a slightly higher cost is expected. Interestingly, the impact on single passenger is thus limited in terms of ticket price, with the aforementioned assumptions. The horizon 2035, used as basis for the study, reveals that a hydrogen price around 2 - 2.5 $/kg can be already competitive in terms of overall impact on operating costs, with the expected inflation rates affecting also kerosene (particularly, values around 2 $/kg may allow to reach equilibrium between the two aircraft). This is possible since, for the reference mission, the aircraft is carrying less propellant mass (because of related energy density), even if this has a higher price. In turn, take-off mass and taxes reduction are not enough to produce a sensible reduction of the DOC, in case hydrogen price remains high. This also suggests that, in order to promote the hydrogen-powered aviation, governmental actions are required to balance traditional hydrocarbon and alternative fuels operations, which otherwise will be affected by an unfair bias. It is also clear how, in 2023, hydrogen cannot be competitive as it is in current state, since production capacities are still very limited and green hydrogen has a price which is not compatible with viable operational scenarios, if compared to kerosene. The aforementioned price target shall then be reached, otherwise clean aviation based on hydrogen will be always subjected to higher operational costs.

6.2. Sustainability Analysis Comparison

In addition to the above reported results, the developed methodology allows for a comparison of different fuel technologies enabling an informed trade-off between economic and environmental sustainability. In fact, as reported in Table 5, depending on the technologies employed during the production phase, the fuel can have a substantially different contribution on both the environmental impact (expressed as kg of equivalent emitted CO2) and costs. Data reported in Table 5 is based on the research activities carried out independently by ICAO LTAG FUEL Subgroup and published in [15] and by the International Energy Agency [63]. The reader can appreciate the fact that moving to hydrogen before the complete maturation of the low-carbon technologies can have a detrimental effect of the environment. This effect can be higher than the one due to current fossil jet fuel. However, the introduction of novel low carbon technologies including, Carbon Capture Storage and Utilization (CCSU) applied to Steam Methane Reforming (SMR) or Partial Oxidation (POx) can guarantee a seamless pathway of blue hydrogen production towards the zero-emission targeted with Electrolysis.
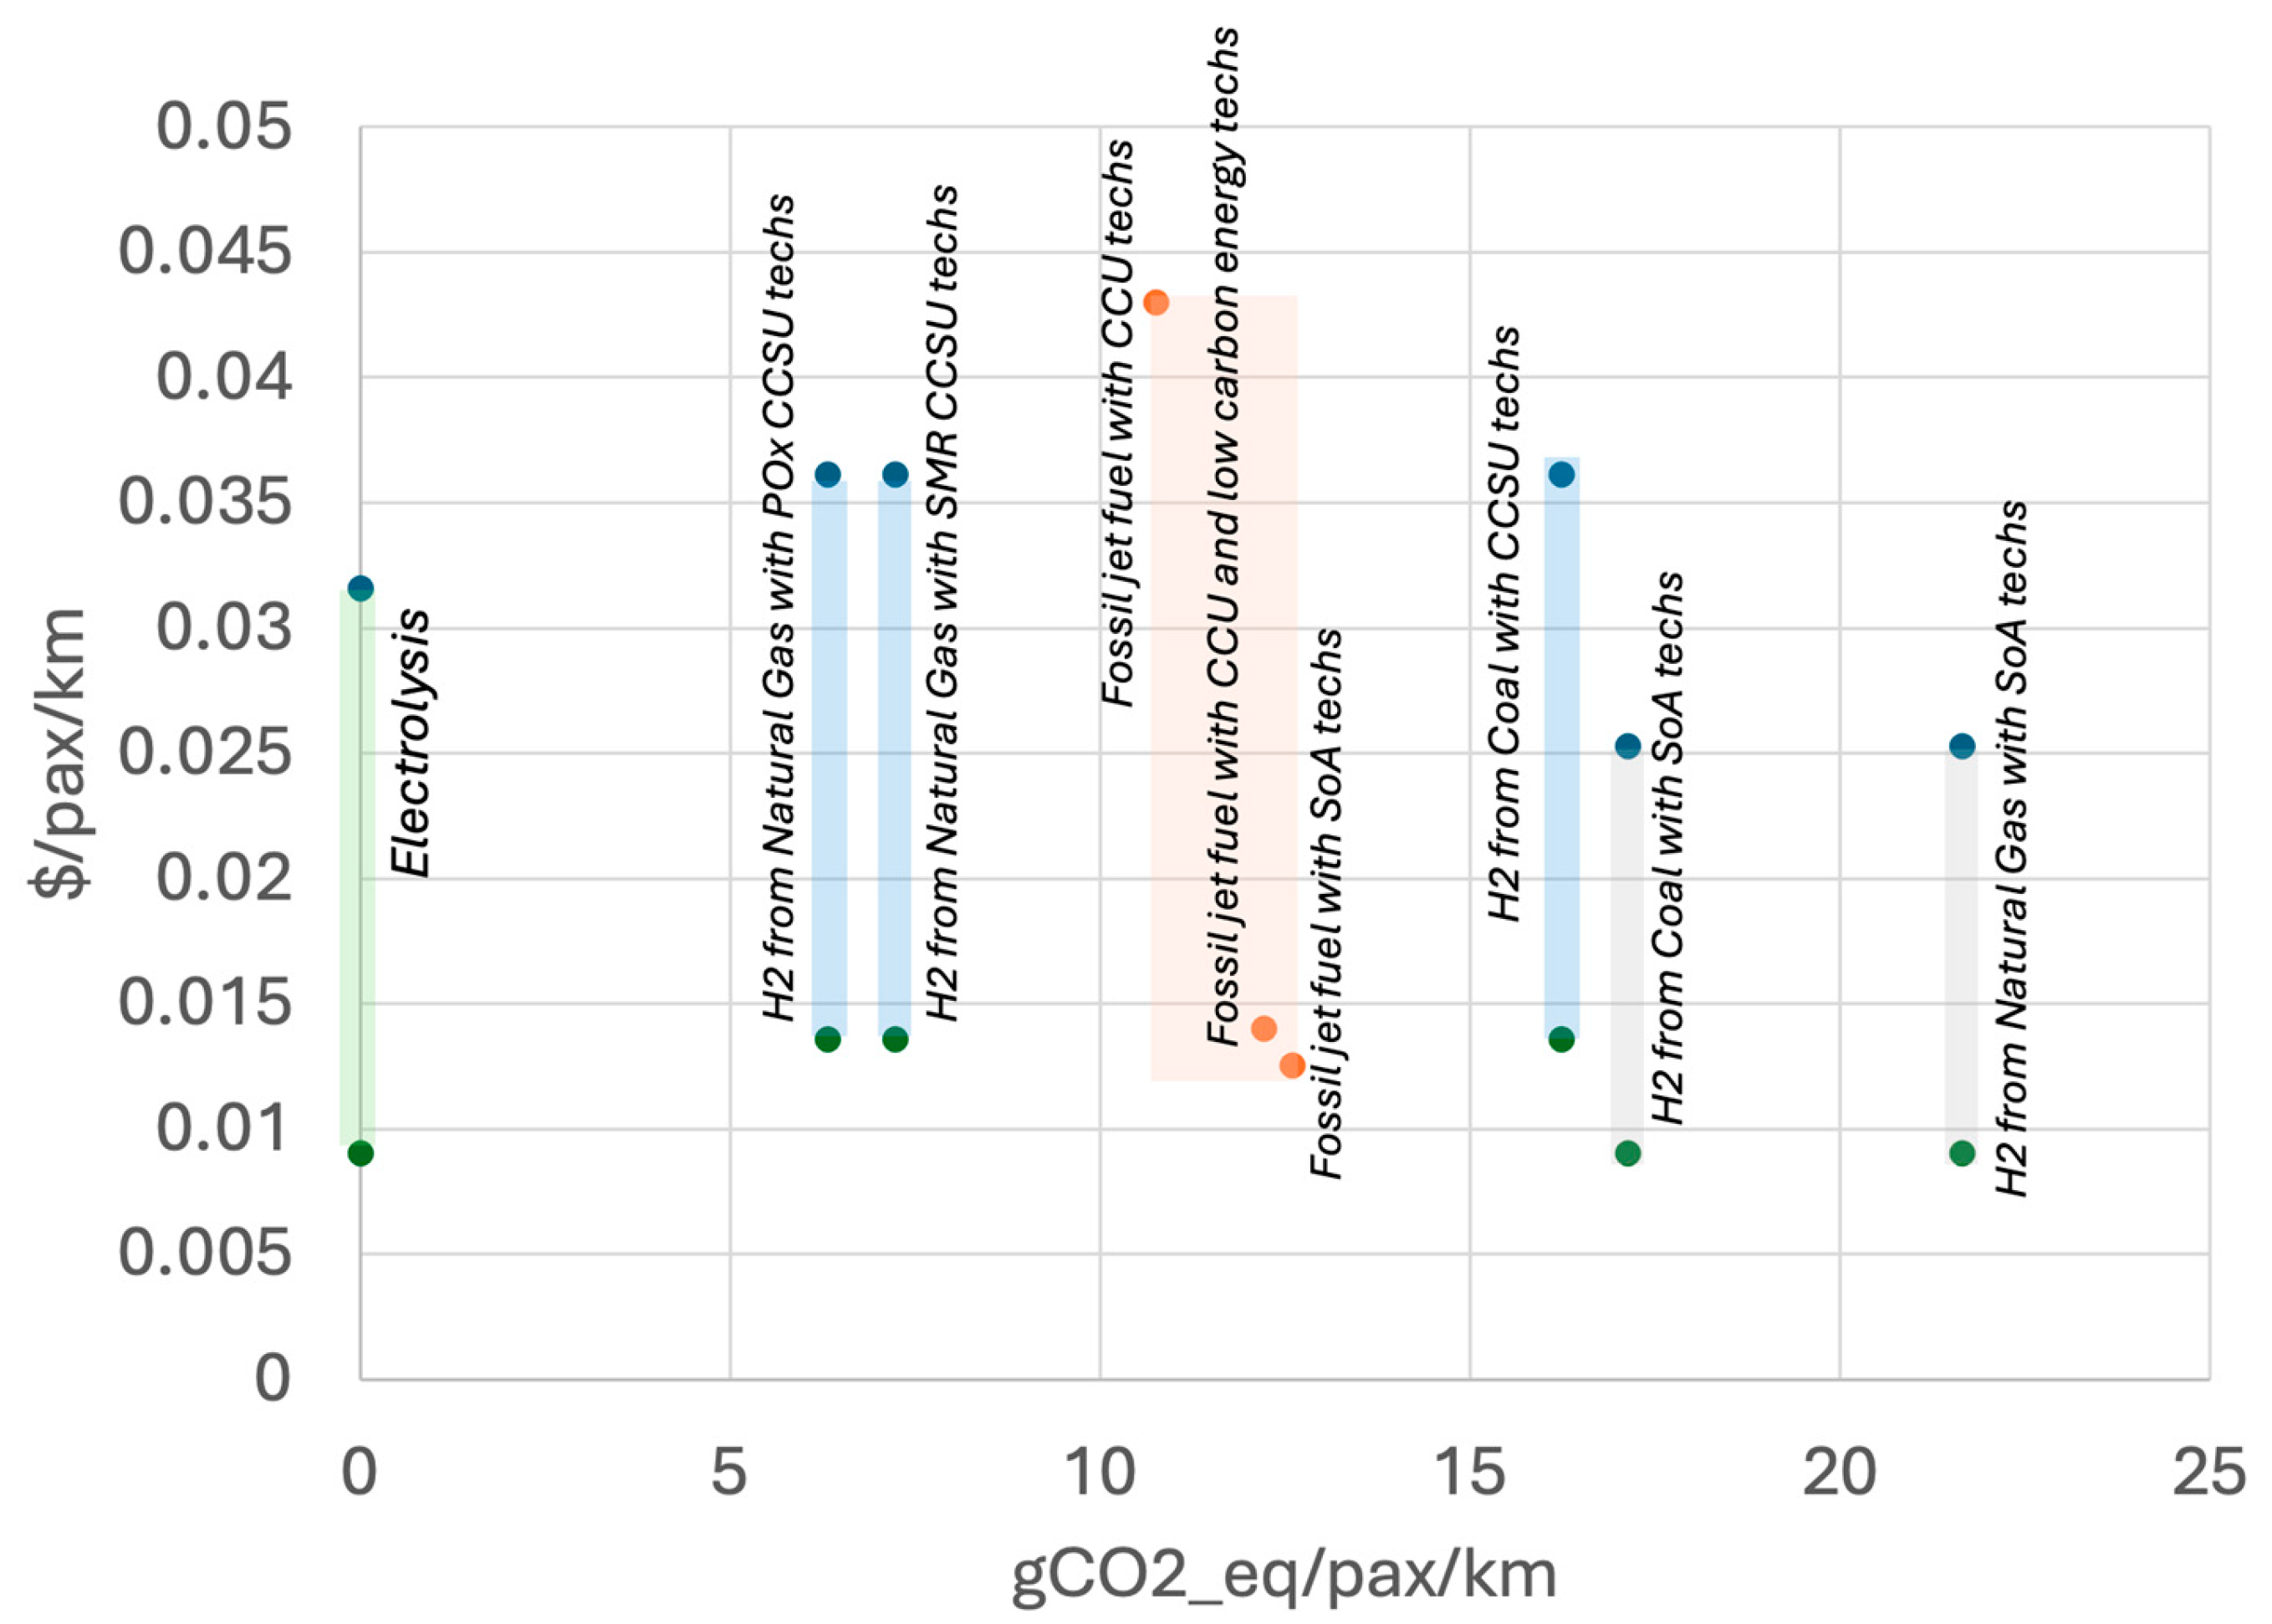
Finally, Figure 11 summarizes the major environmental and economic sustainability design options for the case study dealt with in the paper. Cast data is elaborated from two major sources: for hydrogen technologies [67] and for fossil jet fuels [57]. The economic sustainability, here expressed as $/pax/km, of the various options, shows that, benefitting of the envisaged technology maturation, hydrogen can reach compettive values with rspect to Jet Fuel. In fact, in all cases the variability of the estimation between minimum and maximum values is similar due to the uncertainties of the modelling in the refence sources. Conversely, the environmental sustainability index, here expressed as kg of equivalent emitted CO2, reveals the great potential of blue and green hydrogen.

7. Conclusions

This paper aimed at evaluating the technical feasibility as well as economic and environmental viability of a narrow body aircraft powered by hydrogen for direct combustion. Firstly, a conceptual design methodology was established in order to determine basic configuration, layout and performance of the reference aircraft, starting from the elicitation of mission requirements, specifically looking at the impact of liquid hydrogen storage on the overall vehicle concept. This allowed also to improve literature models dealing with conceptual design methodology, suggesting modifications to aircraft mass estimation process. The operational capabilities with reference to available fuel storage was also assessed, and the impact of the allocation of fuel tanks on the layout and static stability was analyzed. A mass reduction of 10 to 13 tons for the reference hydrogen aircraft was obtained because of the reduced fuel mass, considering the A319 competitor, over a mission of 3000 km with 150 passengers. A smaller wing surface was computed to sustain a lighter airframe, and similar thrust values were obtained, but with improved runway performance with reference to the competitor. Static stability was verified, even if some areas of the operational envelope, in terms of payload-range relationship, may be characterized by very small static margin (around 1%), potentially requiring a minimum amount of payload for longer ranges. From the point of view of operational costs, the reference hydrogen aircraft is more expensive than the kerosene competitor, with a Total Operating Cost expected in 2035 around 13800 $/BH (with reference to 11400 $/BH of the A319), which translates into 0.122 $/pax/km (with reference to 0.101 $/pax/km of the A319). This is mainly due to the higher cost of hydrogen, if compared to kerosene, when hypothesizing a green hydrogen supply chain. Reduction of aircraft mass and taxes/fees on emissions is not enough to compensate the fuel cost, also considering that the depreciation cost associated to a potential increase in acquisition cost shall be taken into account (together with more maintenance efforts). Policies on sustainable fuels are then expected to be required to encourage the entry-into-service of such kind of aircraft, to avoid an intrinsically unfair bias with reference to kerosene competitors. Development of hydrogen infrastructure, particularly green and blue supply chains may also help quite a lot the competitiveness in operation of the aircraft, since this may lead to reduction of cost-per-kg of the fuel. Values around 2$/kg as final hydrogen price can be already competitive in 2035, if compared to kerosene, considering that the latter will be subjected to inflation as well. The development of the infrastructure is also important with reference to upstream sustainability, since the study reveals that production process of gray hydrogen may produce even more CO2 than the traditional kerosene. On the other hand, blue hydrogen production can be in line with CO2 emissions of drop-in sustainable aviation fuels, as far as carbon capture technologies are considered. However, cost of carbon capture technologies shall not be underestimated for drop-in fuels, which may result even more expensive than blue hydrogen in some of the analyzed scenarios. Green hydrogen can be competitive only if the infrastructure will reach the required level of development and production rate, but it will for sure guarantee zero CO2 emissions.
Uncertainties about cost and emissions of different production processes for hydrogen and sustainable aviation fuels still affect these results, and future works shall surely deal with an update of the method to include the latest data within the estimation. From the point of view of operating costs, the estimation of aircraft maintenance effort for hydrogen configurations shall be also subjected to refinement, in order to clearly understand the differences with conventional platforms. Also, the consideration of the impact of hydrogen-hybrid architecture shall be assessed, to enable proper comparisons with direct combustion strategy. Ultimately, novel configurations, such as blended-wing-body concepts, can be also analyzed to assess potential benefits with reference to conventional tube-and-wing.

Author Contributions

Conceptualization, D.F.; methodology, D.F, S.C. and R.F.; software, D.F, S.C and R.F.; validation, D.F. and R.F.; formal analysis, S.C. and R.F.; investigation, D.F., S.C. and R.F.; resources, R.F.; data curation, D.F. and R.F.; writing—original draft preparation, D.F.; writing—review and editing, D.F. and R.F.; visualization, D.F. and R.F.; supervision, D.F. All authors have read and agreed to the published version of the manuscript.

Funding

This research received no external funding.

Data Availability Statement

All data used for this paper are either available within the cited references or embedded in the manuscript.

Conflicts of Interest

The authors declare no conflict of interest.

Nomenclature

BH Block Hour
BWB Blended Wing Body
CAEP Committee on Aviation Environmental Protection
CCUS Carbon Capture, Utilization and Storage
CERs Cost Estimation Relationships
CETS Cost associated to Emission Trading System
CO Carbon monoxide
CO2 Carbon dioxide
CoG Center of Gravity
CORSIA Carbon Offsetting and Reduction Scheme for International Aviation
DOCs Direct Operating Costs
EC Emission Certificate
ETS Emissions Trading System
ICAO International Civil Aviation Organization
IEA International Energy Agency
IOCs Indirect Operating Costs
LH2 Liquid hydrogen
LTAG Long Term Aspirational Goal
MTOW Maximum Take-Off Weight
NASA National Aeronautics and Space Administration
NM Nautical Mile
NOx Nitrogen oxides
POx Partial Oxidation
RPK Revenue Passenger Kilometer
SAF Sustainable Aviation Fuels
SMR team Methane Reforming
SoA State-of-art
TOCs Total Operating Costs
USD US Dollars
A W Wetted aspect ratio
A E P Aircraft Estimated Price [USD]
A H Annual pilot flight hours [hrs]
A R Wing aspect ratio
C c r e w Crew cost
C f u e l Fuel cost
C l a n d i n g Cost associated to landing fees
C i n s Insurance cost
C n a v Cost associated to navigation fees
C t a x Cost associated to registry taxes
C D 0 Drag coefficient at zero lift
C L M a x Maximum lift coefficient
C L T O Lift coefficient at take-off
C L T u r n Lift coefficient in reference turn manoeuver
c t C O 2 Cost per EC on ETS
D u r a t i o n Time duration for the specified mission phase [s]
D O C d e p r Direct operating costs for depreciation
D O C f i n Direct operating costs for financing
D O C f l t Direct operating costs for flying
D O C l n r Direct operating costs for landing and navigation fees
D O C m a i n t Direct operating costs for maintenance
D P Depreciation Period [years]
E Aerodynamic efficiency for the specified mission phase
E M a x Maximum aerodynamic efficiency
E T O Aerodynamic efficiency at take-off
F P Fuel price [USD/kg]
e Oswald factor
G 2 n d Climb gradient in second segment phase
g Gravity acceleration [m/s2]
l T O Take-off run [m]
n t u r n Load factor during turn manoeuver
K Correction factor for empty weight ratio computation
k Correction factor for crew cost
K e Correction factor fot thrust-to-weight ratio computation
K L D Correction factor for maximum aerodynamic efficiency computation
N e n g i n e s Number of engines
N p h a s e s Number of mission phases
n y Reference year for the computation of cost associated to ETS
p C O 2 f r e e Percentage of free CO2 per EC for a specific year
R a n g e Distance covered within the specified mission phase [m]
R b l Block range [NM]
R O C Rate of climb [m/s]
S A L Annual pilot salary [USD]
S r e f Reference wing surface [m2]
S w e t Overall wetted area [m2]
S F C Specific Fuel Consumption for the specified mission phase [kg/s/N]
S F C C r u i s e Specific Fuel Consumption in cruise [kg/s/N]
S F C T O Specific Fuel Consumption at take-off [kg/s/N]
T Total engines thrust [N]
T H Travel expense factor for pilots [USD/BH]
T W M a x V Thrust-to-weight ratio for maximum speed requirement
t b l Block time [BH]
U y e a r Aircraft utilization [year]
V Aircraft speed within the specified mission phase [m/s]
V b l Block speed [NM/BH]
V c r u i s e Aircraft speed during cruise [m/s]
V l n d Aircraft speed during landing [m/s]
V M a x Aircraft maximum speed [m/s]
V r e f Aircraft speed for reference turn manoeuver [m/s]
W c r e w Crew weight [kg]
W e m p t y Manufacturer empty weight [kg]
W f u e l Fuel weight [kg]
W i Aircraft weight at the end of i-th phase [kg]
W i 1 Aircraft weight at the end of (i-th -1) phase [kg]
W p a y l o a d Payload weight [kg]
W T O Design take-off weight [kg]
W S Wing loading in reference phase [kg/m2]
W S l n d Wing loading at landing [kg/m2]
W S t u r n Wing loading required for reference turn [kg/m2]
ρ 0 Sea level air density [kg/m3]
ρ c r u i s e Air density in cruise [kg/m3]
ρ r e f Air density in reference mission phase [kg/m3]
ρ T O Air density at take-off [kg/m3]
Π Throttle level

References

  1. ICAO, Innovation for a green transition, Environmental Report 2022, Montreal, CA, 2022.
  2. Clean Sky 2 JU, Hydrogen-powered aviation: A fact-based study of hydrogen technology, economics, and climate impact by 2050, Brussels, BE, 2020.
  3. Cardone, L. M., Petrone, G., De Rosa, S., Franco, F., Greco, C. S., Review of the Recent Developments About the Hybrid Propelled Aircraft. Journal of Aerospace Science, Technologies & Systems, 103, pp. 17-37, 2024. [CrossRef]
  4. Abu Salem, K., Palaia, G., Quarta, A. A., Review of hybrid-electric aircraft technologies and designs: Critical analysis and novel solutions. Progress in Aerospace Sciences, 141, 2023. [CrossRef]
  5. Eurocontrol, Think paper 21 - The challenge of long-haul flights decarbonization: when can cutting-edge energies and technologies make a difference?. 2023.
  6. Vivalda, P., Fioriti, M. Stream Life Cycle Assessment Model for Aircraft Preliminary Design. Aerospace, 11, 113, 2024. [CrossRef]
  7. Kossarev, K., Scholz, A.E., Hornung, M. Comparative environmental life cycle assessment and operating cost analysis of long-range hydrogen and biofuel fueled transport aircraft. CEAS Aeronautical Journal 14, pp. 3–28, 2023. [CrossRef]
  8. Marouani, I., Guesmi, T., Alshammari, B. M., Alqunun, K., Alzamil, A., Alturki, M., Hadj Abdallah, H., Integration of Renewable-Energy-Based Green Hydrogen into the Energy Future. MDPI Processes, 11, 2685, 2023. [CrossRef]
  9. Tanvir, A., Bhuiyan, M. H., Sakib, A. N., Becerril Corral, A., Siddique, Z., An Overview of Challenges for the Future of Hydrogen. MDPI Materials, 16, 6680, 2023. [CrossRef]
  10. IEA, Global Hydrogen Review 2022.
  11. Grewe, V. et al., Mitigating the Climate Impact from Aviation: Achievements and Results of the DLR WeCare Project. MDPI Aerospace, 4, 34, 2017. [CrossRef]
  12. Brewer, G. D, Hydrogen Aircraft Technology, CRC Press, 1991.
  13. Boeing Commercial Airplanes, High-Speed Civil Transport Study, NASA Contractor Report 4233, 1989.
  14. Paris Agreement. Proceedings of the Report of the Conference of the Parties to the United Nations Framework Convention on Climate Change, Paris, 2015.
  15. ICAO, Long-Term Aspirational Goal (LTAG), 2022.
  16. ICAO, Assembly Resolution 7 October 2022, Doc 10184, 2022.
  17. European Union, Regulation of the European Parliament and of the council on ensuring a level playing field for sustainable air transport (ReFuelEU Aviation), Brussels, 2023.
  18. Svensson, F., Potential of Reducting the Environmental Impact of Civil Subsonic Aviation by Using Liquid Hydrogen. Cranfield University, 2005.
  19. Adler, E. J., Martins, J. R. R. A., Hydrogen-powered aircraft: Fundamental concepts, key technologies, and environmental impacts. Progress in Aerospace Sciences, 141, 2023 . [CrossRef]
  20. Troeltsch, F. M., Engelmann, M., Scholz, A. E., Peter, F., Kaiser, J., Hornung, M., Hydrogen Powered Long Haul Aircraft with Minimized Climate Impact. AIAA Aviation 2020 Forum, 2020. [CrossRef]
  21. Saez Ortuno, M. A., Yin, F., Gangoli Rao, A., Vos, R., Proesmans, P-J., Climate Assessment of Hydrogen Combustion Aircraft: towards a green aviation sector. AIAA Scitech 2023 Forum, 2023. [CrossRef]
  22. Karpuk, S., Ma, Y., Elham, A., Design Investigation of Potential Long-Range Hydrogen Combustion Blended Wing Body Aircraft with Future Technologies. MDPI Aerospace, 10, 566, 2023. [CrossRef]
  23. Reckzeh, D., Technology Integration for Future Aircraft Configurations. Proceedings of the 33rd Congress of the International Council of the Aeronautical Sciences, 4-9 September, Stockholm, SE.
  24. Nicolin, B. A., Nicolin, I., Green hydrogen as an environmentally-friendly power source. INCAS Bulletin Vol 15, 2, pp. 141-147, 2023. [CrossRef]
  25. Tiwari, S., Pekris, M. J., Doherty, J. J., A review of liquid hydrogen aircraft and propulsion technologies. International Journal of Hydrogen Energy, 57, pp. 1174-1196, 2024. [CrossRef]
  26. Hoelzen, J., Silberhorn, D., Zill, T., Bensmann, B., Hanke-Rauschenbach, R., Hydrogen-powered aviation and its reliance on green hydrogen infrastructure – Review and research gaps. International Journal of Hydrogen Energy, 47, 5, pp. 3108-3130, 2022. [CrossRef]
  27. Hoelzen, J., Flohr, M., Silberhorn, D., Bensmann, A., Hanke-Rauschenbach, R., H2-powered aviation at airports – Design and economics of LH2 refueling systems. Energy Conversion and Management: X, 14, 2022. [CrossRef]
  28. Raymer, D. P., Aircraft design: a conceptual approach, 6th Ed. AIAA Education Series, Reston, VA (USA), 2018.
  29. Hua, T. Q., Ahluwalia, R. K., Peng, J. K., Kromer, M., Lasher, S., McKenney, K., Law, K., Sinha, J., Technical assessment of compressed hydrogen storage tank systems for automotive applications. International Journal of Hydrogen Energy, 36(4), 3037–3049, 2011. [CrossRef]
  30. Burke, A., Gardiner, M., Hydrogen storage options: technologies and comparisons for light-duty vehicle applications. Institute of Transportation Studies, University of California Davis, 2005.
  31. Brewer, D. G., Morris, R. E., Tank and Fuel Systems Considerations for Hydrogen Fueled Aircraft. SAE Transactions, vol. 84, 1975.
  32. Verstraete, D., The potential of liquid hydrogen for long range aircraft propulsion. Cranfield University, 2009.
  33. Pietrobon, S. S., Analysis of propellant tank masses, 2009.
  34. Saias, C. A., Roumeliotis, I., Goulos, I., Pachidis, V., Bacic, M., Assessment of hydrogen fuel for rotorcraft applications. International Journal of Hydrogen Energy, 47(76), 32655–32668, 2022. [CrossRef]
  35. Huete, J., Pilidis, P. Parametric study on tank integration for hydrogen civil aviation propulsion. International Journal of Hydrogen Energy, 46(74), 37049–37062, 2021. [CrossRef]
  36. Verstraete, D., Hendrick, P., Pilidis, P., Ramsden, K., Hydrogen fuel tanks for subsonic transport aircraft. International Journal of Hydrogen Energy, 35(20), 11085–11098, 2010. [CrossRef]
  37. Rao, A. G., Yin, F., van Buijtenen, J. P., A hybrid engine concept for multi-fuel blended wing body. Aircraft Engineering and Aerospace Technology, 86(6), 483–493, 2014. [CrossRef]
  38. Berry, W., Calleson, R., Espil, J., Quartero, C., Swanson, E., A fuel conservation study for transport aircraft utilizing advanced technology and hydrogen fuel. NASA Langley Research Centre, 1972.
  39. Corchero, G., Montanes, J. L., An approach to the use of hydrogen for commercial aircraft engines. Proceedings of the Institution of Mechanical Engineers, Part G: Journal of Aerospace Engineering, 219, 1, 2005. [CrossRef]
  40. Brewer, G. D., et al., Study of fuel systems for LH2-fueled subsonic transport aircraft, volume 1. NASA Langley Research Centre, 1978.
  41. CRYOPLANE Project Final Technical Report, Liquid Hydrogen Fuelled Aircraft – System Analysis, 2003.
  42. Carter, R., Development of a Liquid Hydrogen Combustion High Bypass Turbofan Model in NPSS. Mechanical Engineering and Materials Science Independent Study, 156, 2021.
  43. Loftin, L. K. Jr., Subsonic aircraft: evolution and the matching of size to performance (NASA Reference Publication 1060). Hampton, VA: NASA Langley Research Center, 1980.
  44. Fioriti M. Adaptable conceptual aircraft design model. Adv Aircr Spacecr Sci 2014.
  45. Ferretto, D., Fusaro, R., Viola, N., Innovative Multiple Matching Charts approach to support the conceptual design of hypersonic vehicles. Proceedings of the Institution of Mechanical Engineers, Part G: Journal of Aerospace Engineering, 234, 12, 2020. [CrossRef]
  46. EASA, Certification Specifications and Acceptable Means of Compliance for Large Aeroplanes (CS-25) – Amendment 28, 2023.
  47. Palaia, G., Abu Salem, K., Cipolla, V., Binante, V., Zanetti, D. Performance analysis and operating potential of a hybrid-electric regional aircraft with box-wing lifting architecture. Proceedings of the 9th European Conference for Aeronautics and Space Sciences (EUCASS), 27 June - 1 July, Lille, France, 2022. [CrossRef]
  48. Roskam, J., Airplane design - Part VIII: Airplane cost estimation: design, development, manufacturing and operating. University of Kansas, 1990.
  49. Burke A., Fulton, L., Use of Liquid Hydrogen in Heavy-Duty Vehicle Applications: Station and Vehicle Technology and Cost Considerations. Institute of Transportation Studies, University of California Davis, 2022.
  50. Connelly, E., Penev, M., Elgowainy, A., Hunter, C., DOE Hydrogen and Fuel Cells Program Record: Current status of Hydrogen Liquefaction Costs. US Department of Energy, 2019.
  51. Hydrogen Council, Path to hydrogen competitiveness: A cost perspective. 2020.
  52. Carvalho, F., Osipova, L., Zhou, Y., Life-cycle greenhouse gas emissions of hydrogen as marine fuel and cost of producing green hydrogen in Brazil. Working Paper 2023-11, International Council on Clean Transportation, 2023.
  53. Hydrogen Council, Hydrogen insights: a perspective on hydrogen investment, market development and cost competitiveness. 2021.
  54. Steer Group. Analyzing the costs of hydrogen aircraft, 2023.
  55. Fusaro, R., Vercella, V., Ferretto, D., Viola, N., Steelant, J., Economic and environmental sustainability of liquid hydrogen fuel for hypersonic transportation systems. CEAS Space Journal, 12(3), 441–462, 2020. [CrossRef]
  56. Franzmann, D., Heinrichs, H., Lippkau, F., Addanki, T., Winkler, C., Buchenberg, P., Hamacher, T., Blesl, M., Linßen, J., & Stolten, D. (2023). Green hydrogen cost-potentials for global trade. International Journal of Hydrogen Energy, 48, 85, 2023. [CrossRef]
  57. Becattini, V., Gabrielli, P., Mazzotti, M. Role of Carbon Capture, Storage, and Utilization to Enable a Net-Zero-CO2-Emissions Aviation Sector. Industrial & Engineering Chemistry Research, 60 (18), pp. 6848-6862, 2021. [CrossRef]
  58. Saxon, S., Weber, M., A better approach to airline costs. McKinsey & Company – Travel, Logistics & Infrastructure, 2017.
  59. Hoff, T., Becker, F., Dadashi, A., Wicke, K., Wende, G., Implementation of Fuel Cells in Aviation from a Maintenance Repair and Overhaul Perspective. MDPI Aerospace, 10, 23, 2023. [CrossRef]
  60. https://www.eurocontrol.int/crco#key-documents . Accessed 07/03/2024.
  61. Chandrasekaran, N., Guha, A. Study of Prediction Methods for NOx Emission from Turbofan Engines. Journal of Propulsion and Power, 28 (1), pp. 170-180, 2012. [CrossRef]
  62. IEA, The Future of Hydrogen: Seizing today’s opportunities, 2019.
  63. IEA, Comparison of the emissions intensity of different hydrogen production routes, 2021.
  64. https://climate.ec.europa.eu/eu-action/eu-emissions-trading-system-eu-ets_en . Accessed 07/03/2024.
  65. Johanning, A., Scholz, D., Evaluation of worldwide noise and pollutant emission costs for integration into direct operating cost methods. Deutscher Luft- und Raumfahrtkongress, 2012.
  66. https://tradingeconomics.com/commodity/carbon . Accessed 07/03/2024.
  67. https://kpmg.com/be/en/home/insights/2021/03/eng-the-hydrogen-trajectory.html . Accessed 11/07/2024.
Figure 1. Reference concepts from literature.
Preprints 112580 g001
Figure 2. Feasibility assessment for a hydrogen aircraft concept.
Preprints 112580 g002
Figure 3. Aircraft conceptual design process.
Preprints 112580 g003
Figure 4. Reference mission profile.
Preprints 112580 g004
Figure 5. Matching chart for the converged solution.
Preprints 112580 g005
Figure 6. Resulting aircraft layout.
Preprints 112580 g006
Figure 7. Payload-Range diagram for increased fuel capacity.
Preprints 112580 g007
Figure 8. Geometrical evaluation of wing aerodynamic center with reference to CoG position shift.
Preprints 112580 g008
Figure 9. Comparison of upstream equivalent carbon intensity of hydrogen and conventional jet-fuels.
Preprints 112580 g009
Figure 10. Total Operating Costs (TOC) breakdowns for LH2 aircraft and A319-based competitor.
Preprints 112580 g010
Figure 11. Comparison of environmental and economic sustainability design options.
Preprints 112580 g011
Table 1. Results for the converged solution.
Data Value
Fuel Mass [kg] 4059
Empty Mass [kg] 42813
Maximum Take-off Mass [kg] 62282
Empty Mass fraction 0.6874
Fuel Mass fraction 0.0652
Table 2. Fuel mass fractions for different phases.
Mass   fractions   W i / W i 1 Value
Take-off 0.9999
Climb (total) 0.9955
Cruise (2400 km)* 0.9612
Descent 0.9988
Holding 0.9936
Approach 0.9992
Attempted landing 0.9999
Go-around climb 0.9968
Diversion 0.9971
Descent 0.9988
Holding 0.9989
Approach 0.9992
Final landing 0.9999
Total ratio 0.9400
* Referred to 3000 km mission.
Table 3. Analysis of static margin for different operational conditions of the aircraft.
Operational condition* CoG position [m] Margin
2 – Take-off 20.17 7.9%
2 – Landing 19.88 9.2%
3 – Take-off 20.41 6.8%
3 – Landing 19.97 8.8%
4 – Take-off 21.17 1.0%
4 – Landing 21.27 2.8%
* Take-off condition, tanks filled with hydrogen for the mission; landing condition, empty tanks.
Table 4. Comparison between hydrogen powered aircraft and traditionl A319 architecture over a 3000 km mission with 150 pax.
Cost Items LH2 Aircraft A319-based competitor
DOC Crew [$/BH] 617 617
DOC Fuel [$/BH] 2781 1808
DOC Insurance [$/BH] 214 161
DOC Maintenance [$/BH] 1562 1116
DOC Depreciation [$/BH] 2265 1918
DOC Fees & Taxes [$/BH] 1754 1950
DOC Financing [$/BH] 645 564
DOC [$/BH] 9837 8137
IOC [$/BH] 3935 3255
TOC [$/BH] 13772 11392
TOC [$/pax] 367 304
TOC [$/pax/km] 0.122 0.101
Table 5. Comparison between hydrogen powered aircraft and traditionl A319 architecture in terms of Uptreem emissions for different technologies.
Upstream Emissions LH2 Aircraft
[kg CO2_eq]
A319-based competitor
[kg CO2_eq]
Fossil jet fuel with SoA techs 5671
Fossil jet fuel with CCSU techs 4840
Fossil jet fuel with CCSU techs and low carbon electricity 5490
H2 from Coal with SoA techs 7712
H2 from Coal with CCSU techs 7306
H2 from Natural Gas with SoA techs 9742
H2 from Natural Gas with SMR CCSU techs 3247
H2 from Natural Gas with POx CCSU techs 2841
Disclaimer/Publisher’s Note: The statements, opinions and data contained in all publications are solely those of the individual author(s) and contributor(s) and not of MDPI and/or the editor(s). MDPI and/or the editor(s) disclaim responsibility for any injury to people or property resulting from any ideas, methods, instructions or products referred to in the content.
Copyright: This open access article is published under a Creative Commons CC BY 4.0 license, which permit the free download, distribution, and reuse, provided that the author and preprint are cited in any reuse.
Prerpints.org logo

Preprints.org is a free preprint server supported by MDPI in Basel, Switzerland.

Subscribe

© 2024 MDPI (Basel, Switzerland) unless otherwise stated