Preprint
Article

Whole Genome Sequencing of the Entomopathogenic Fungus Lecanicillium lecanii, KMZW-1 and Its Efficacy against Bactrocera dorsalis

Altmetrics

Downloads

105

Views

74

Comments

0

Submitted:

18 July 2024

Posted:

19 July 2024

You are already at the latest version

Alerts
Abstract
Lecanicillium lecanii KMZW-1, is recognized for its potential as a bio-control agent against agricultural and forestry pests, particularly due to its compatibility with integrated pest management (IPM) strategies. This study aimed to investigate the complete genome of L. lecanii KMZW-1 and assess its pathogenicity against Bactrocera dorsalis. Whole genome sequencing revealed a genome size of 47,239,278 bp, comprising 27 contigs, with a GC content of 51.16%. The genome completeness was assessed as 97.93% using BUSCO analysis, AntiSMASH analysis identified 29 gene clusters associated with secondary metabolite biosynthesis providing insights into the genetic basis of its pathogenic mechanisms and biocontrol potential. The pathogenicity of L. lecanii KMZW-1 was assessed using concentrations ranging from 1×10^4 to 1×10^11 spores/mL. Higher-concentrations (1×10^10 to 1×10^11 spores/mL), resulted in significantly increased cumulative mortality rates of B. dorsalis adults compared to the control group. Notably, the pathogenicity was higher in male adults than in females. Probit regression analysis yielded LogLC50 values as 5.662 for female and 4.486 for male B. dorsalis adults. In summary, L. lecanii KMZW-1 exhibits strong insecticidal activity against B. dorsalis and shows potential as a biocontrol agent with IPM strategies. These findings provide robust genomic evidence supporting the use of L. lecanii KMZW-1in managing against B. dorsalis populations.
Keywords: 
Subject: Biology and Life Sciences  -   Insect Science

1. Introduction

Lecanicillium lecanii KMZW-1, formerly known as Verticillium lecanii, is a well-recognized entomopathogenic fungus belonging to the family Cordycipitaceae; order Hypocreales. Recently, biological control has garnered increased attention for managing agricultural insect pests, due to its environmental friendliness. Biocontrol agents such as L. lecanii KMZW-1, have become a focal point for experts seeking sustainable pest management solutions. Bactrocera dorsalis, commonly known as the oriental fruit fly, is a significant pest affecting a wide range of fruit crops [1]. Effective control of B. dorsalis is crucial for minimizing crop damage and financial losses.
Previous researches have showed the insecticidal potential of biocontrol agents. For example Methoxyfenozide and Beauveria bassiana have demonstrated promising results in controlling B. dorsalis. Chandramohan et al., (2016) reported mortality rates of 67.5%, 65.0% and 63.5% for Methoxyfenozide and 60.0%, for B. bassiana [1]. Similarly, Huang et al. (2014) found mortality rates of 78.2% for B. bassiana and 75.6% for Methoxyfenozide against oriental fruit fly. These studies provide a theoretical basis for exploring new bio-control agents against B. dorsalis highlighting the need for further research into the pathogenicity of L. lecanii KMZW-1 [2].
In recent years, advancement in biotechnology have provided new insights into the success of biological control. Genomic sequencing and comparative genomics analyses have become focal points in studying bio-control potential of entomopathogenic fungi, offering crucial insights about their biological characteristics and potential applications [3]. For instance, comparative genomics and evolutionary analyses of the entomopathogenic fungus Trichoderma harzianum have revealed the genetic features and evolutionary patterns related to its bio-control potential against plant pathogens [4]. These findings offers deep understanding of the genetic characteristics, pathogenic mechanisms, and bio-control potential of entomopathogenic fungus. Whole genome sequencing has emerged as a powerful tool for understanding the genetic basis of biological traits and behaviors in various organisms. The complete genome analysis of L. lecanii strain Lec8 revealed the genome size of 32.38 Mb, containing 9,531 genes, including those encoding proteins related to biosynthetic pathways which suggested strong entomopathogenic potential [5]. Similarly, the complete genome sequencing of L. lecanii strain 1502 which is known for its potential against aphids, revealed the genome size of 32.0 Mb, containing 9,312 genes [6]. These findings revealed significant potential for L. lecanii as a biocontrol agent though further research is needed for developing effective bio-control strategies. Fruit flies poses a major threat to a wide range of fruits and vegetables globally from tropical to subtropical environments due to their polyphagous nature [7,8]. B. dorsalis, in particular is a significant threat to horticultural crops in China and neighboring regions. Biological control of many insect pests including fruit flies, frequently employs entomopathogenic microorganisms [9,10,11,12]. This study aims to explore the entomopathogenic potential of L. lecanii KMZW-1 against B. dorsalis by utilizing complete genome sequencing and comparative genomics.

2. Materials and Methods

2.1. L. lecanii KMZW-1 Collection, and Culture

Adult Boettcherisca peregrina flies infected with a wild strain of fugus were collected from a pig farm at Yunnan Agricultural University, Animal Science Institute, Kunming City. Newly emerged 4-day-old B. peregrina flies, which were disease free and of uniform size, were individually placed in small rearing cages and provided with ample water, and white sugar. They were maintained under controlled conditions of 25±0.5°C, and a (12L:12D) light cycle. The wild strain of fungus was isolated from naturally infected B. peregrina flies and cultured on Potato Dextrose Agar (PDA). This strain was subsequently, reintroduced to B. dorsalis flies. The strain was propagated and expanded in PDA medium at 29°C and a pH of 6.0 following the methodology of [13].

2.2. Insect Collection and Rearing

The population of B. dorsalis was collected from fallen fruits in a mango orchard located in the suburb of Kunming (latitude 23°36′ N, longitude 101°58′ E, altitude 460.97 meters). Infested fruits were placed on sandy soil until hatching and pupation. After pupation, the pupae were collected and moved indoors. Upon adult emergence, the flies were provided a diet consisting of 10% yeast extract, 5% peptone, 30% white sugar, and 15% agar supplemented with water.
For, egg collection mating females were allowed to oviposit in plastic bottles lined within stint fruit juices coating the inner walls. The eggs were then transferred to fresh-keeping boxes containing larval feed composed of 10% yeast extract, 5% peptone, 30% white sugar, 10% agar, and 40% bran. Larvae were allowed to mature and pupate in the soil. The emerged adults from the third generations were maintained in rearing cages (30cm × 30cm × 30cm) with 100 mesh nylon netting Indoor environmental conditions were controlled at a temperature of 25±1°C, relative humidity of 60±10%, and photoperiod of (14L:10D).

2.3. DNA Extraction and PCR Amplification Materials

(1) Single colony of L. lecanii KMZW-1 isolated after cultivation.
(2) Fungal DNA rapid extraction kit with centrifuge columns.
(3) Enzyme: Q5 High-Fidelity DNA Polymerase obtained from New England, Bio labs (NEB).
(4) Molecular weight standard: DL1 5000 purchased from Takara
(5) PCR primers: 27F primer (10μM): 5’-AGAGTTTGATCMTGGCTCAG-3’ and 1492R primer (10μM): 5’-TACGGYTACCTTGTTACGACTT-3’.2.4

2.4. Complete Genome Sequencing, Assembly and Annotation

2.4.1. Genome Sequencing

The experimental process followed the standard protocol provided by Oxford Nanopore Technologies (ONT), encompassing sample quality assessment, library construction, library quality detection and library sequencing. The library construction process included the following steps:
1. Genomic DNA Extraction and Quality Control:
1. High quality genomic DNA was extracted, and its purity, concentration and integrity were checked using Nanodrop spectrophotometry, Qubit flurometry and 0.35% agarose gel electrophoresis.
2. Fragment Recovery:
2. The BluePippin automatic nucleic acid recovery system was used to recovers large DNA fragments.
3. Library construction (SQK-LSK109 Sequencing kit):
a) DNA damage repair and end repair were perfomed followed by magnetic bead purification
b) DNA fragments were ligated with adapters followed by another round of, magnetic bead purification
c) Qubit flurometry was used for library quantification
4. Sequencing.
d). Sequencing was done using a computer based system 2.4.2

2.4.2. Genome Assembly and Analysis

The filtered sub reads were assembled using NECAT software, and the initial assembly results were corrected using Racon software with the filtered sub reads. Subsequently, Pilon software [14] was utilized to further enhance the assemblyaccuracy by employing second-generation data. The alignment rate was assessed using BWA software [15].
Mapped (%): The percentage of clean reads mapped to the reference genome out of all clean reads was calculated using the Samtools flagstat command.
2. Properly mapped (%): This metric showed the percentage of paired-end sequencing reads mapped to the reference genome with distances consistent with the expected length distribution of sequencing fragments, checked using the Samtools flagstat command.
3. Coverage (%): The coverage of the assembled genome, was determined using the Samtools depth command.
4. Depth (X): The depth of coverage across the assembled genome, was quantified using the Samtools depth command.
After completing the assembly of L. lecanii KMZW-1genome, its completeness was done using BUSCO (Benchmarking Universal Single-Copy Orthologs, v3.0.2). The analysis employed the fungi_odb9 database [16], which includes 29,000 single-copy orthologous genes from 185 fungal species. The completeness of the genome assembly was determined by calculating the percentage of complete single-copy genes identified in the L. lecanii KMZW-1 genome sequence compared to the total number of single-copy genes in the database.

2.4.3. Genome Predictions

LTR_FINDER v1.05 [17], MiX-Hunter [18], RepeatScout v1.0.5 [19], PILER-DF v2.4 [20] were used to construct the repeat sequence database. The database was classified using PASTE Classifier [21], and merged with the Repbase [22] to form the final repeat database Repeat Masker v4.0.6 [23] was then used to predict the repeat sequence.
Gene structure prediction primarily involves ab initio prediction, homology-based protein prediction, and transcriptome data prediction, Ab initio prediction tools used were co Genscan [24], Augustus v2.4 [25], Glimmer HMM v3.0.4 [26], Gene ID v1.4 [27], and SNAP (version 2006-07-28). Homology-based protein prediction was performed using GeMoMa v1.3.1 [28]. Transcriptome-based assembly was conducted using Hisat2 v2.0.4 and Stringtie v1.2.3, with TransDecoder v2.0 employed for Unigene sequence prediction. Predicted results were integrated using EVM v1.1.1 [29] and refined using PASA v2.0.2. tRNA genes were predicted using tRNAscan-SE v1.3.1 [30], and drRNA genes were predicted using Infernal v1.1.1 [31].
Genomic scanning was performed using GenBlastA v1.0.1 [32] to filter predicted functional genes. Subsequently, GeneWise v2.2.0 [33] was utilized to identify immature and frame-shift mutations, followed by analysis of presumed candidates. antiSMASH v6.0.0 [34] was employed to predict secondary metabolite gene clusters.

2.4.4. Genome Protein Annotations

The predicted proteins were subjected to BLAST [35] against various databases:Nr [36], Swiss-Prot [37], TrEMBL [37], KEGG [38], KOG [39] using e value threshold of 1e-5. GO annotations were performed using annotations using Blast2GO [40] based on the result of BLAST searches. Pfam domain were identified using HMMER [41]. In addition, pathogenicity related protein were determined using CAZy [42], TCDB [43], PHI [44], [45] CYPED, DFVF [46] and others. Secreted proteins were detected using SignalP 4.0 [47] and transmembrane proteins were filtered by TMHMM [48] to isolate ain candidate secreted proteins. Effector proteins among the P secreted proteins were predicted utilizing [49].

2.5. Pathogenicity Test of L. lecanii KMZW-1 against B. dorsalis

2.5.1. Conidial Suspension Preparation

The fungal strain L. lecanii KMZW-1, stored at -80° used recovered for fresh culture. A 100 μL aliquot of the fungal suspension was evenly spread onto PDA solid medium containing kasugamycin using a disposable spreader. The plates were then incubated at a constant temperature of 26°C in an incubator. Subsquently, fungal mycelia were carefully scraped off from the PDA plates using a disposable inoculation loop and transferred to a 1.5 mL centrifuge tube containing sterile water. The mixture was thoroughly mixed, by vortexing to disperse the mycelia. Next 200μL of the fungal suspension was aspirated with a pipette and evenly spread onto fresh PDA solid medium using a spreader. The plates were returned to the constant temperature incubator at 26°C for until desired concentrations of conidia was achieved.

2.5.2. Bioassays

The experiment utilized the hit and trial method and mortality rate was monitored d every 24 hours for 12 consecutive days. All treated insects were place in rearing chambers at a temperature of 29°C, relative humidity of 85%, and a 12:12h photoperiod. Insects were given a liquid culture medium and water throughout the experiment.
Each treatment group consisted of 30 insects and all experiments were performed in triplicate. Male and female adults were separated for experimentation with no age specificity.
Table 1. Concentration determination test concentration batches and groups.
Concentration Female Insect Male Insect
1×10⁴ 3*30 3*30
1×10⁵ 3*30 3*30
1×10⁶ 3*30 3*30
1×10⁷ 3*30 3*30
1×10⁸ 3*30 3*30
1×10⁹ 3*30 3*30
1×10¹⁰ 3*30 3*30
1×10¹¹ 3*30 3*30
Control 3*30 3*30
Total (Insect) 720 720

2.5.3. Data Analysis

The cumulative mortality rate of B. dorsalis was statistically analyzed using Microsoft Office Excel 2021. The LC50 values were calculated using Probit regression and the results were plotted on a logarithmic scale (base 10). Graphs were generated using GraphPad Prism, (USA, 8.3.0538).

3. Results

3.1. Genome Assembly

The genome assembly of L. lecanii KMZW-1 resulted in 27 contigs with a total length of 47,239,278 base pairs (bp). Key metrics include an N50 of 2,751,789 bp and an N90 values of 1,018,923 bp, indicating a higher proportion of larger contigs in the assembly and overall good contiguity. The GC content of the genome observed 51.16%, provided insights into its genetic composition (Table 2). Importantly the assembly process gained closure without any gaps showing the of the genome assembly. This achievement is crucial for subsequent analyses such as gene structure analysis, functional annotation, and evolutionary analysis. The statistical results of gene assembly were as follows:

3.2. BUSCO Evaluation

We utilized the fungi_odb9 database in BUSCO [16] which contains 290 conserved core genes for fungi to evaluate the completeness of our fungal genome assembly using BUSCO (v2.0). A total of 284 complete BUSCO genes were identified in our assembly, resulting in a genome completeness evaluation of 97.93%. Among these, 281 genes were identified as single-copy, constituting 96.90% of the total BUSCO genes assessed. The presence of these genes in a single copy showed the high accuracy and completeness of the genome assembly.
Additionally, 3 genes were identified as multi-copy, accounting for 1.03% of total genes. These genes likely exist in multiple copies or repetitive sequences influencing the assembly process. Four genes were predicted to be incomplete, accounting for 1.38% of total genes. These incomplete genes may result from assembly gaps or missing sequences in the genome as assembly process. Furthermore, 2 genes were not predicted at all, constituting 0.69% of total genes indicating that some conserved genes were not detected during the genome assembly process (Table 3).

3.3. General Database Annotations

Gene sets were annotated using different databases GO Annotation, KEGG Annotation, KOG Annotation, Pfam Annotation, Swissprot Annotation, TrEMBL Annotation, and nr Annotation (Table 4). A total number oof 13,867 genes were annotated indicating that the majority of genes obtained at least one functional annotation, providing a solid foundation for subsequent gene function studies For example, annotations varied across databases; GO Annotation annotated 9,994 genes, KEGG Annotation annotated 3,775 genes, KOG Annotation annotated 7,059 genes, Pfam Annotation annotated 10,510 genes, Swissprot Annotation annotated 8,390 genes, TrEMBL Annotation annotated 13,862 genes, and nr Annotation annotated 13,864 genes. For genes with lengths in the range of 100≤length<300 bp, annotations varied from 913 (KEGG) to 3,733 (All Annotated), indicating that even shorter gene fragments can obtain a certain degree of annotation. However, the genes with lengths greater than or equal to 300 bp, generally received higher annotation quantities. For instance, the nr database annotated 9,993 genes, indicating that longer genes are more likely to receive functional annotations.

3.4. GO Annotations

Gene Ontology (GO) annotation classification for the genes of L. lecanii KMZW-1 given in Figure 1. Biological Process (BP) with 4,444 genes, Cellular Component (CC) with 2,279 genes, and Molecular Function (MF) with 7,603 genes were found. Among these categories, the ‘metabolic process’ category has the highest number of genes, with 1,401 genes, followed by the ‘binding’ category with 938 genes. Additionally, there were categories such as catalytic activity, structural molecule, cellular component, and others, with gene counts of 689, 462, 239, and 218, respectively.

3.5. KOG Annotations

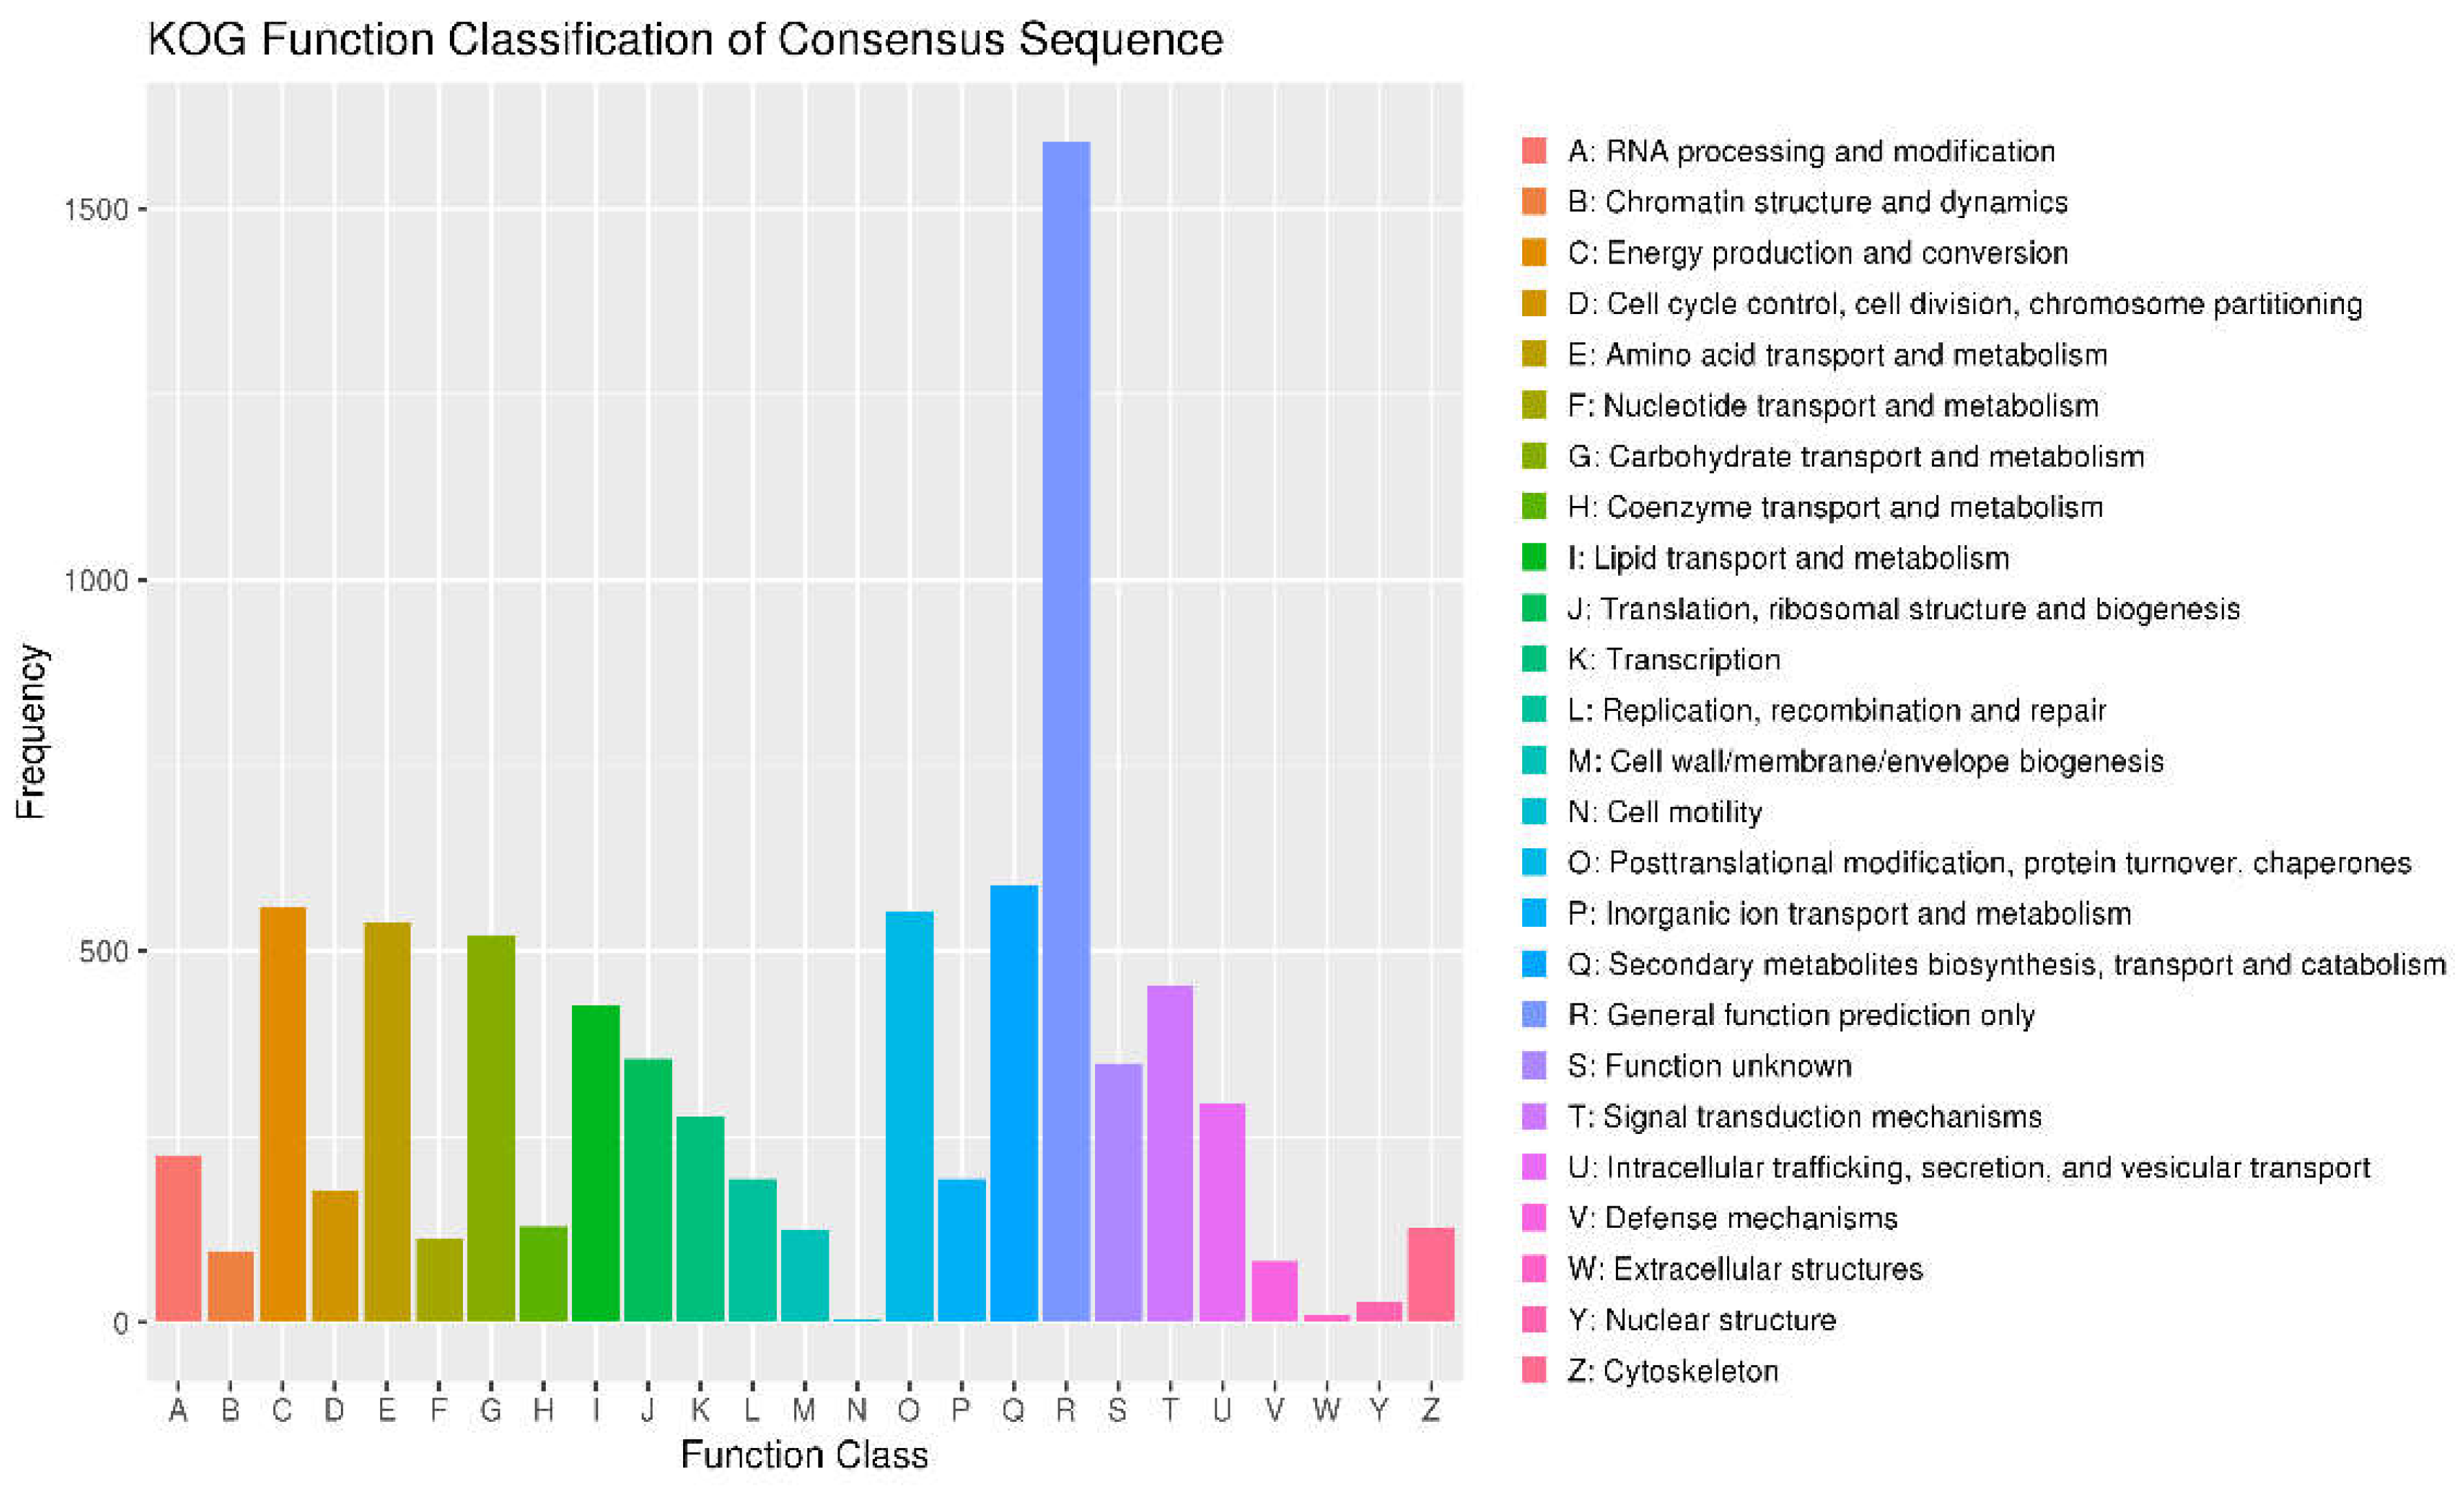
Energy production and conversion (C) contains approximately 1500 genes, the highest among all categories. This suggests that L. lecanii possesses extensive energy metabolism pathways essential for adapting to variable environments and supporting Figure 2 pathogenic potential. Amino acid transport and metabolism (E) included around 1000 genes indicating specialization in amino acid metabolism crucial for protein synthesis and cell growth. Nucleotide transport and metabolism (F) has a similar number of genes as the amino acid metabolism, approximately 1000 genes, reflecting complexity in nucleotide metabolism, crucial for fundamental life activities such as DNA replication, repair, and RNA metabolism. Carbohydrate transport and metabolism (G) also comprises around 1000 genes, indicating L. lecanii’s ability to effectively utilize and regulate carbohydrate metabolism, crucial for energy production and carbon skeletons. Translation, ribosomal structure, and biogenesis (J) encompasses around 500 genes reflecting .L. lecanii activity in protein synthesis, vital for its growth and development. Replication, recombination, and repair (L) includes a moderate number of genes, indicating L. lecanii mechanisms for maintaining genome stability, crucial for its long-term survival and adaptability. Secondary metabolites biosynthesis, transport, and catabolism (Q) involves e relatively fewer genes, but is crucial for tproduction of bioactive compounds in L. lecanii, potentially influencing pathogenic potential. Function unknown (S) encompasses genes whose functions are yet to be fully elucidated, Its presence suggested unexplored functional areas in the genome of L. lecanii, which could include undiscovered novel functions or specific metabolic pathways.

3.6. KEGG Annotations

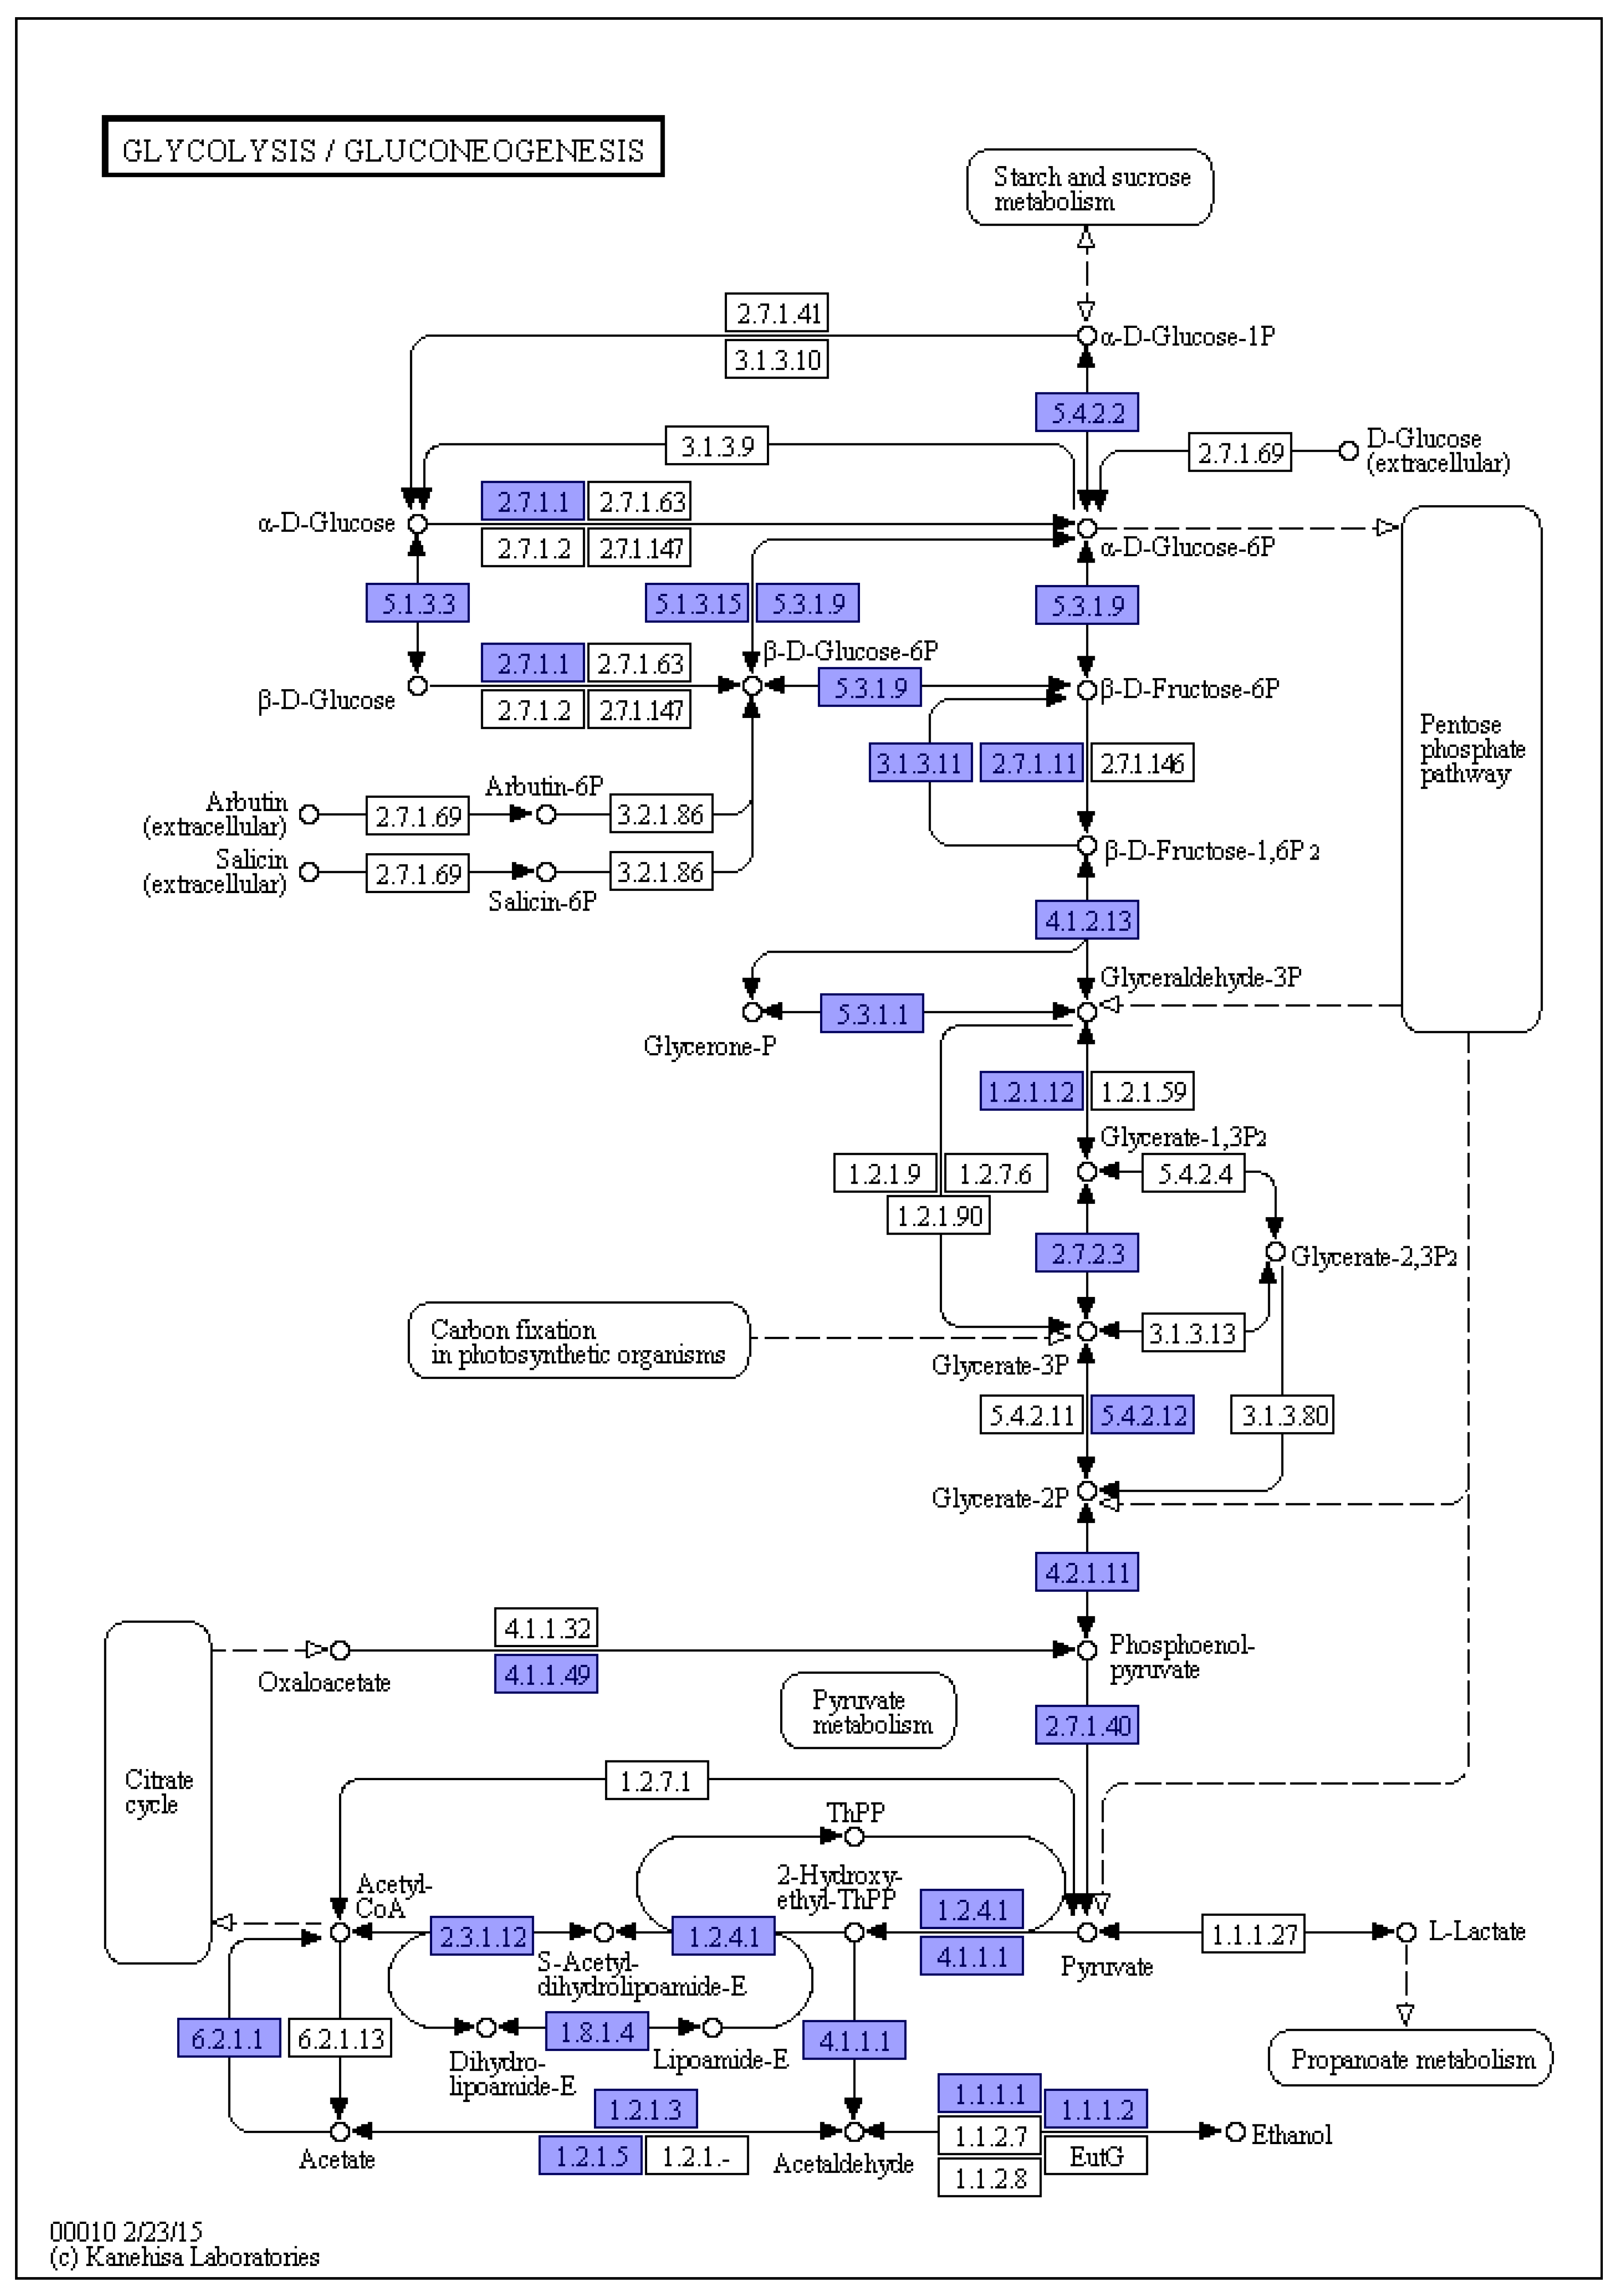
Figure 3 depicts the Glycolysis/Gluconeogenesis metabolic pathway in the genome of L. lecanii KMZW-1, a fundamental pathway in cellular energy metabolism. This pathway begins with D-glucose and progresses through a series of enzymatic reactions, ultimately yielding pyruvate and ATP, crucial for energy production. Blue boxes in the diagram represent the presence of genes encoding key enzymes corresponding to the pathway, and the numbers within the boxes indicate the Enzyme Commission (EC) numbers, which are internationally recognized enzyme classification codes. Main steps include phosphorylation of glucose to glucose-6-phosphate (EC 2.7.1.1). Glucose-6-phosphate is then converted to pyruvate through multiple steps, involving key enzymes such as phosphofructokinase (EC 2.7.1.11) and pyruvate kinase (EC 2.7.2.3) Gluconeogenesis is the reverse metabolic pathway of glycolysis but involves different enzymes in certain steps. Alhough not detailed in the diagram, this pathway involves crucial enzymatic conversion that enable the synthesis of glucose, essential for cellular energy and metabolic processes in L. lecanii KMZW-1.
The diagram also depicts other regulated metabolic pathways related to sugar metabolism, including Pentose Phosphate Pathway and Carbon fixation in photosynthetic organisms. These pathways essential for maintaining intracellular redox balance and synthesizing nucleotides, amino acids, etc.
The presence of genes encoding key enzymes in both glycolysis and gluconeogenesis pathways suggested that L. lecanii has the complete metabolic capability to regulate its energy production and storage.
Additionally, the diagram illustrates pathways related to sugar metabolism, such as Lactate fermentation and Pyruvate fermentation, which may function under anaerobic conditions or specific environmental condition.
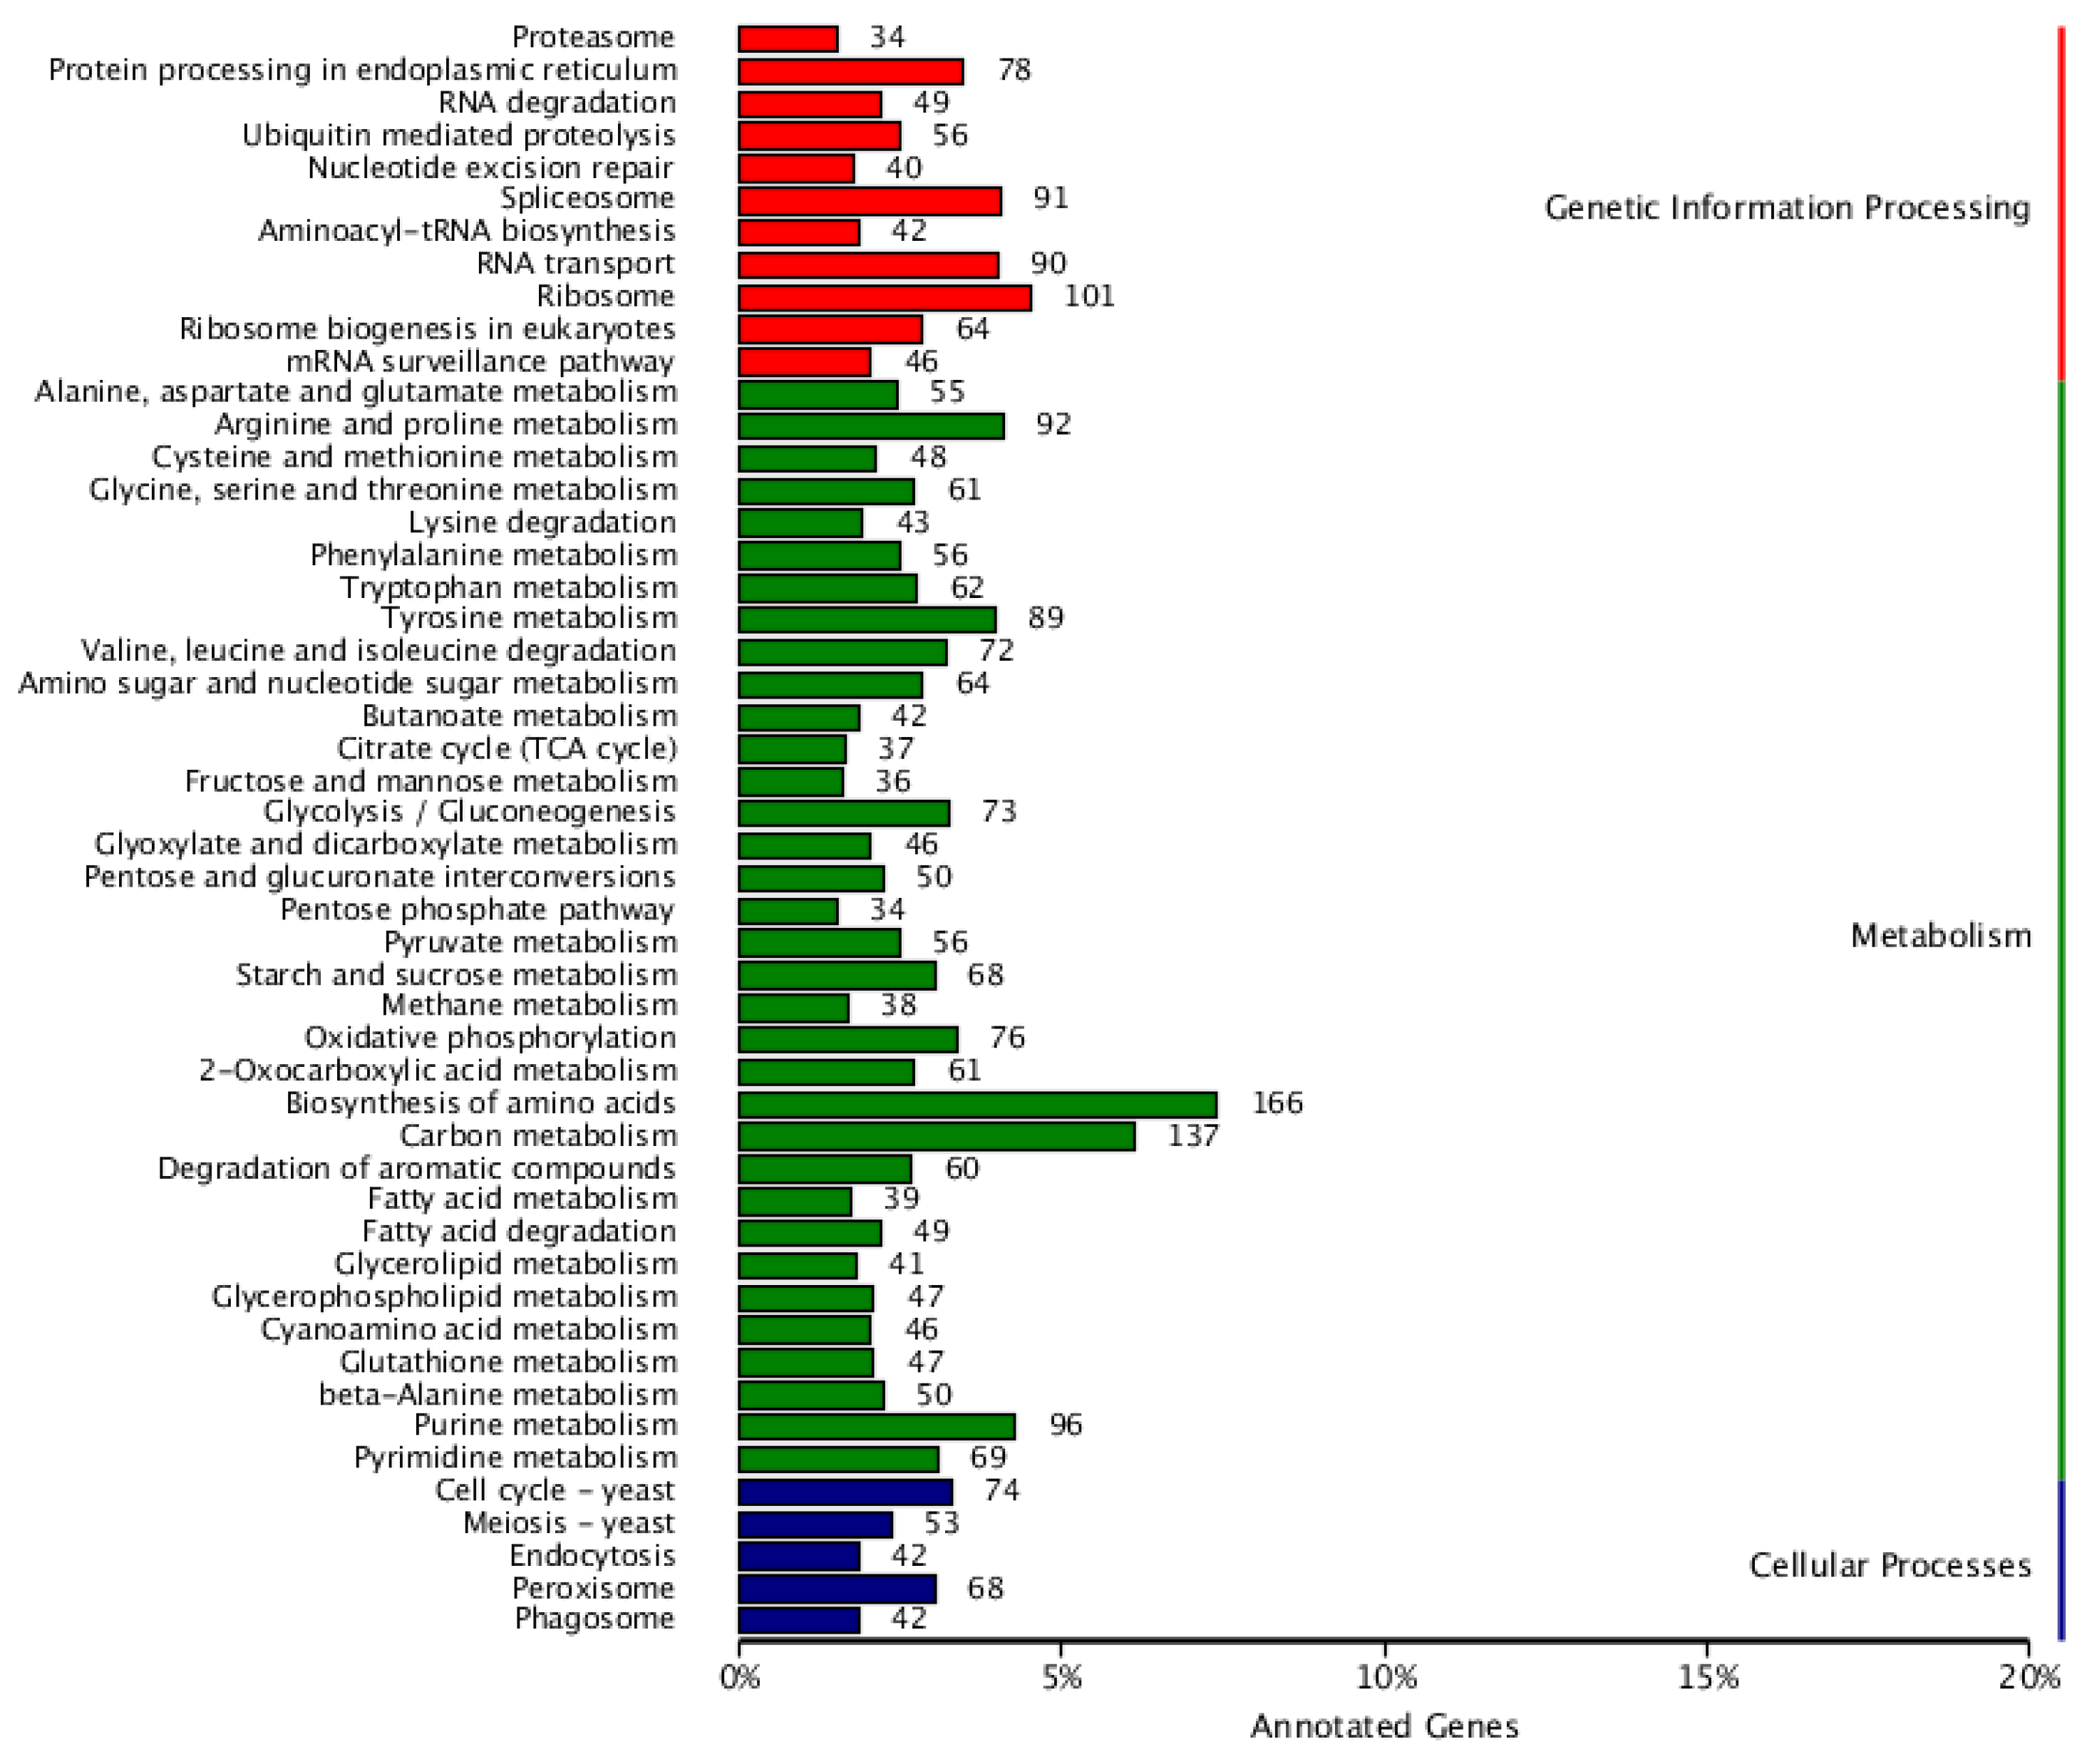
Genetic Information Processing: Significant categories include “Ribosome” (101 genes, approximately 10%), “Spliceosome” (91 genes), and “mRNA surveillance pathway” (46 genes). These data indicate that L. lecanii has complex protein synthesis and RNA processing mechanisms, which are crucial for its growth and adaptability (Figure 4).
2. Cellular Processes: Processes like, “Endocytosis” (5%) and “Phagosome” (42 genes), which involve the uptake and processing of substances within the cell, likely play crucial role in L. lecanii’s nutrient acquisition and defense mechanisms.
3. Metabolism: Categories such as “Biosynthesis of amino acids” (166 genes, approximately 16%) and “Purine metabolism” (96 genes) encompass a relatively large number of genes, indicating that L. lecanii has complete pathways for amino acid synthesis, essential for cell growth and DNA synthesis.
Although not explicitly listed in the graph, L. lecanii’s genome likely contains genes related to environmental responses enabling it to adapt, to different environmental conditions, such as stress resistance. Also the presence of human disease-related categories though primarily focused on humans, may reflect potential mechanisms of interaction between L. lecanii and hosts, providing valuable insights into its role as a bio-control agent. Other Important Categories like “Peroxisome” (42 genes) and “Endocytosis” (5%) in cellular processes, as well as “Glycolysis/Gluconeogenesis” (73 genes) and “Citrate cycle (TCA cycle)” (42 genes) in Metabolism, these genes participate in cell energy metabolism and substance cycling, which are crucial for energy production and growth of L. lecanii.

3.7. Pathogenicity Test of L. lecanii KMZW-1 at Different Concentrations

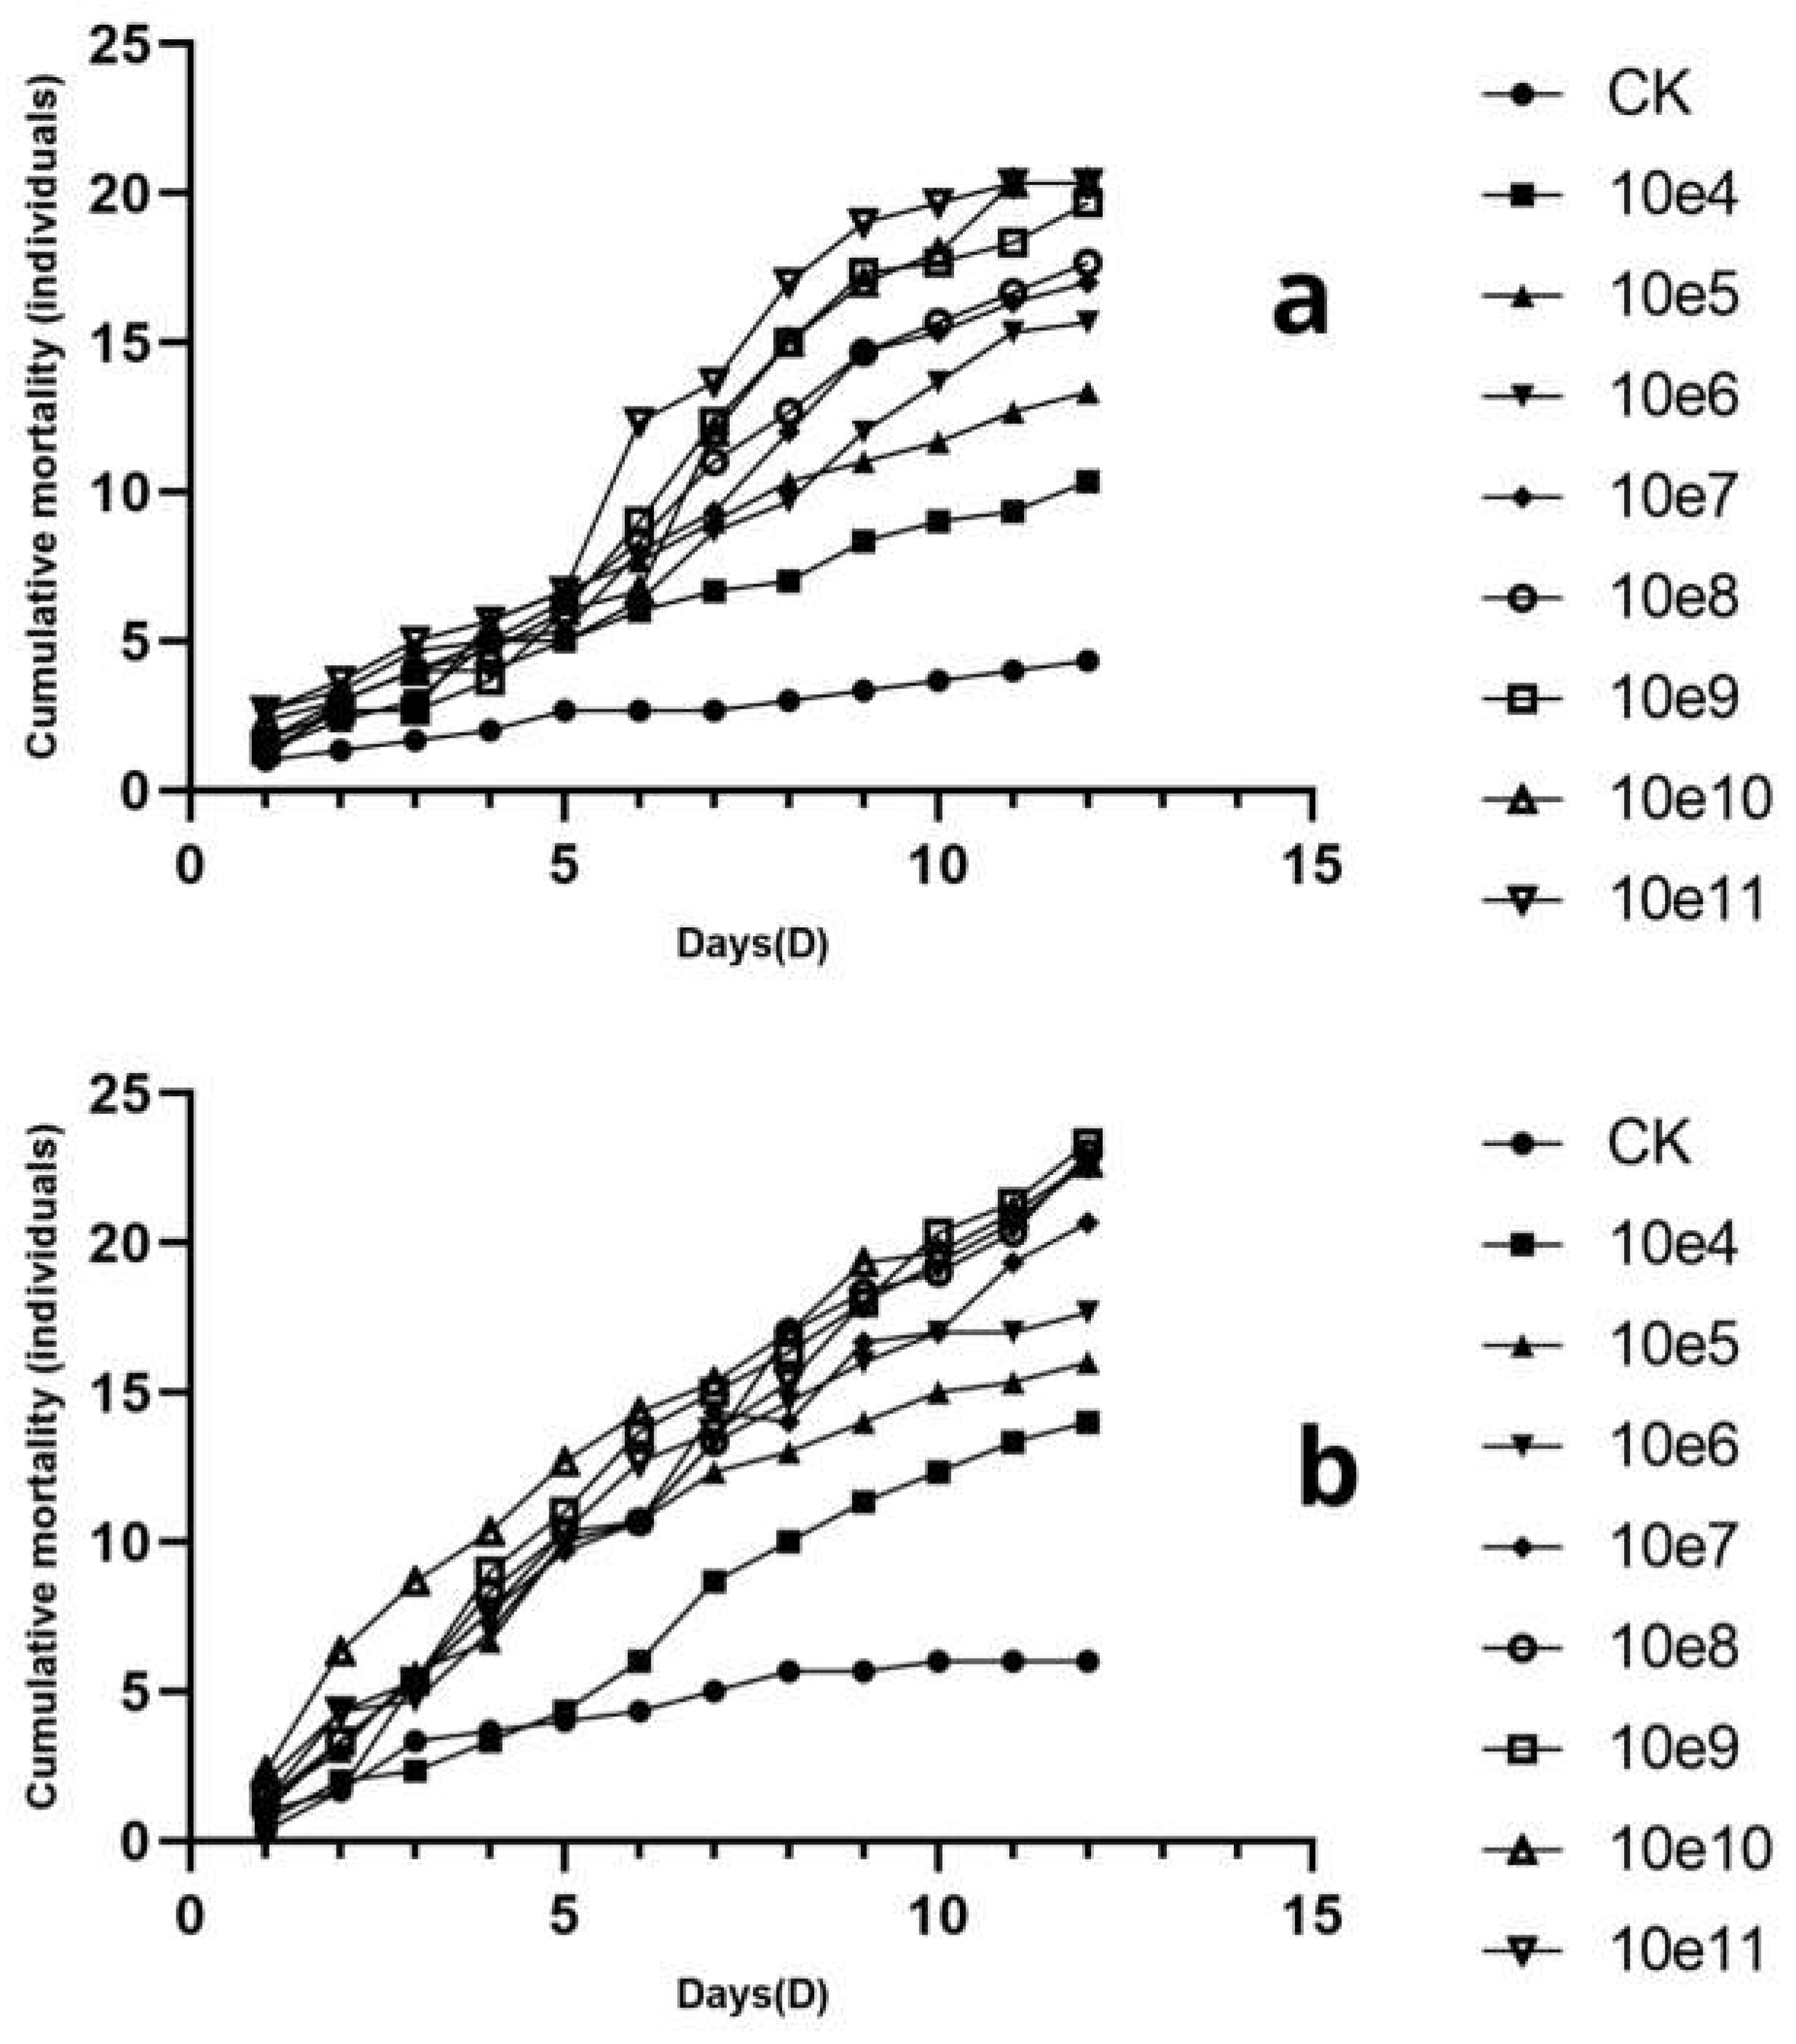
The cumulative mortality of B. dorsalis adults infected with varying concentrations of L. lecanii KMZW-1 spore suspensions (female adults in Figure a, male adults in Figure b) over time are given in Figure 5. The lines represent different concentrations of L. lecanii KMZW-1 spore suspensions ranging from 1×10⁴ spores/mL to 1×10¹¹ spores/mL, while CK (control group) represents the population not infected with the fungus. The cumulative mortality increases over time in all treatment groups, indicating that as time progresses, more B. dorsalis adults were infected. In the female adult group treated with a spore concentration of 1×10⁴ spores/mL, 6 deaths were observed on the 4th day, and the number of deaths continued to increase over time, reaching 10 by the 12th day. In the male adult group treated with a concentration of 1×10⁵ spores/mL, 13 cumulative deaths were observed by the 7th day, reaching 16 by the 12th day. There is positive correlation between the concentrations of spore suspensions and the cumulative mortality of B. dorsalis adults.
The higher the spore concentration, the higher the cumulative mortality rate over time. For instance, in the female adult group treated with a spore concentration of 1×10¹⁰ spores/mL, the number of dead B. dorsalis individuals increased to 21 by the 12th day. Similarly in the male adult group treated with a spore concentration of 1×10¹¹ spores/mL, the highest concentration treatment group, the number of dead B. dorsalis individuals significantly increased, reaching 21 by the 12th day, the highest among all concentration groups. This likely occurred because higher concentrations of spore suspensions contain more active spores, increased the chances and speed of infection.
The difference between the control group (CK) and the treatment groups indicates that fungal infection was the main cause of increased mortality of B. dorsalis.
Regarding the time effect, in the early stages (e.g., first 5 days), the differences in mortality rates among different concentration treatment groups were not significant. However, as the experiment progressed, the mortality rate in the high concentration treatment groups becomes significantly higher than that in the low concentration treatment groups. This indicates that L. lecanii KMZW-1 requires some time to proliferate within the host and cause death.
By comparing the insecticidal rates of different high concentrations against female and male adults of B. dorsalis, it is evident that L. lecanii KMZW-1 has asignificantly higher insecticidal effect against male adults. At each concentration gradient, the insecticidal rate for male adults is approximately 10% higher than that for female adults.
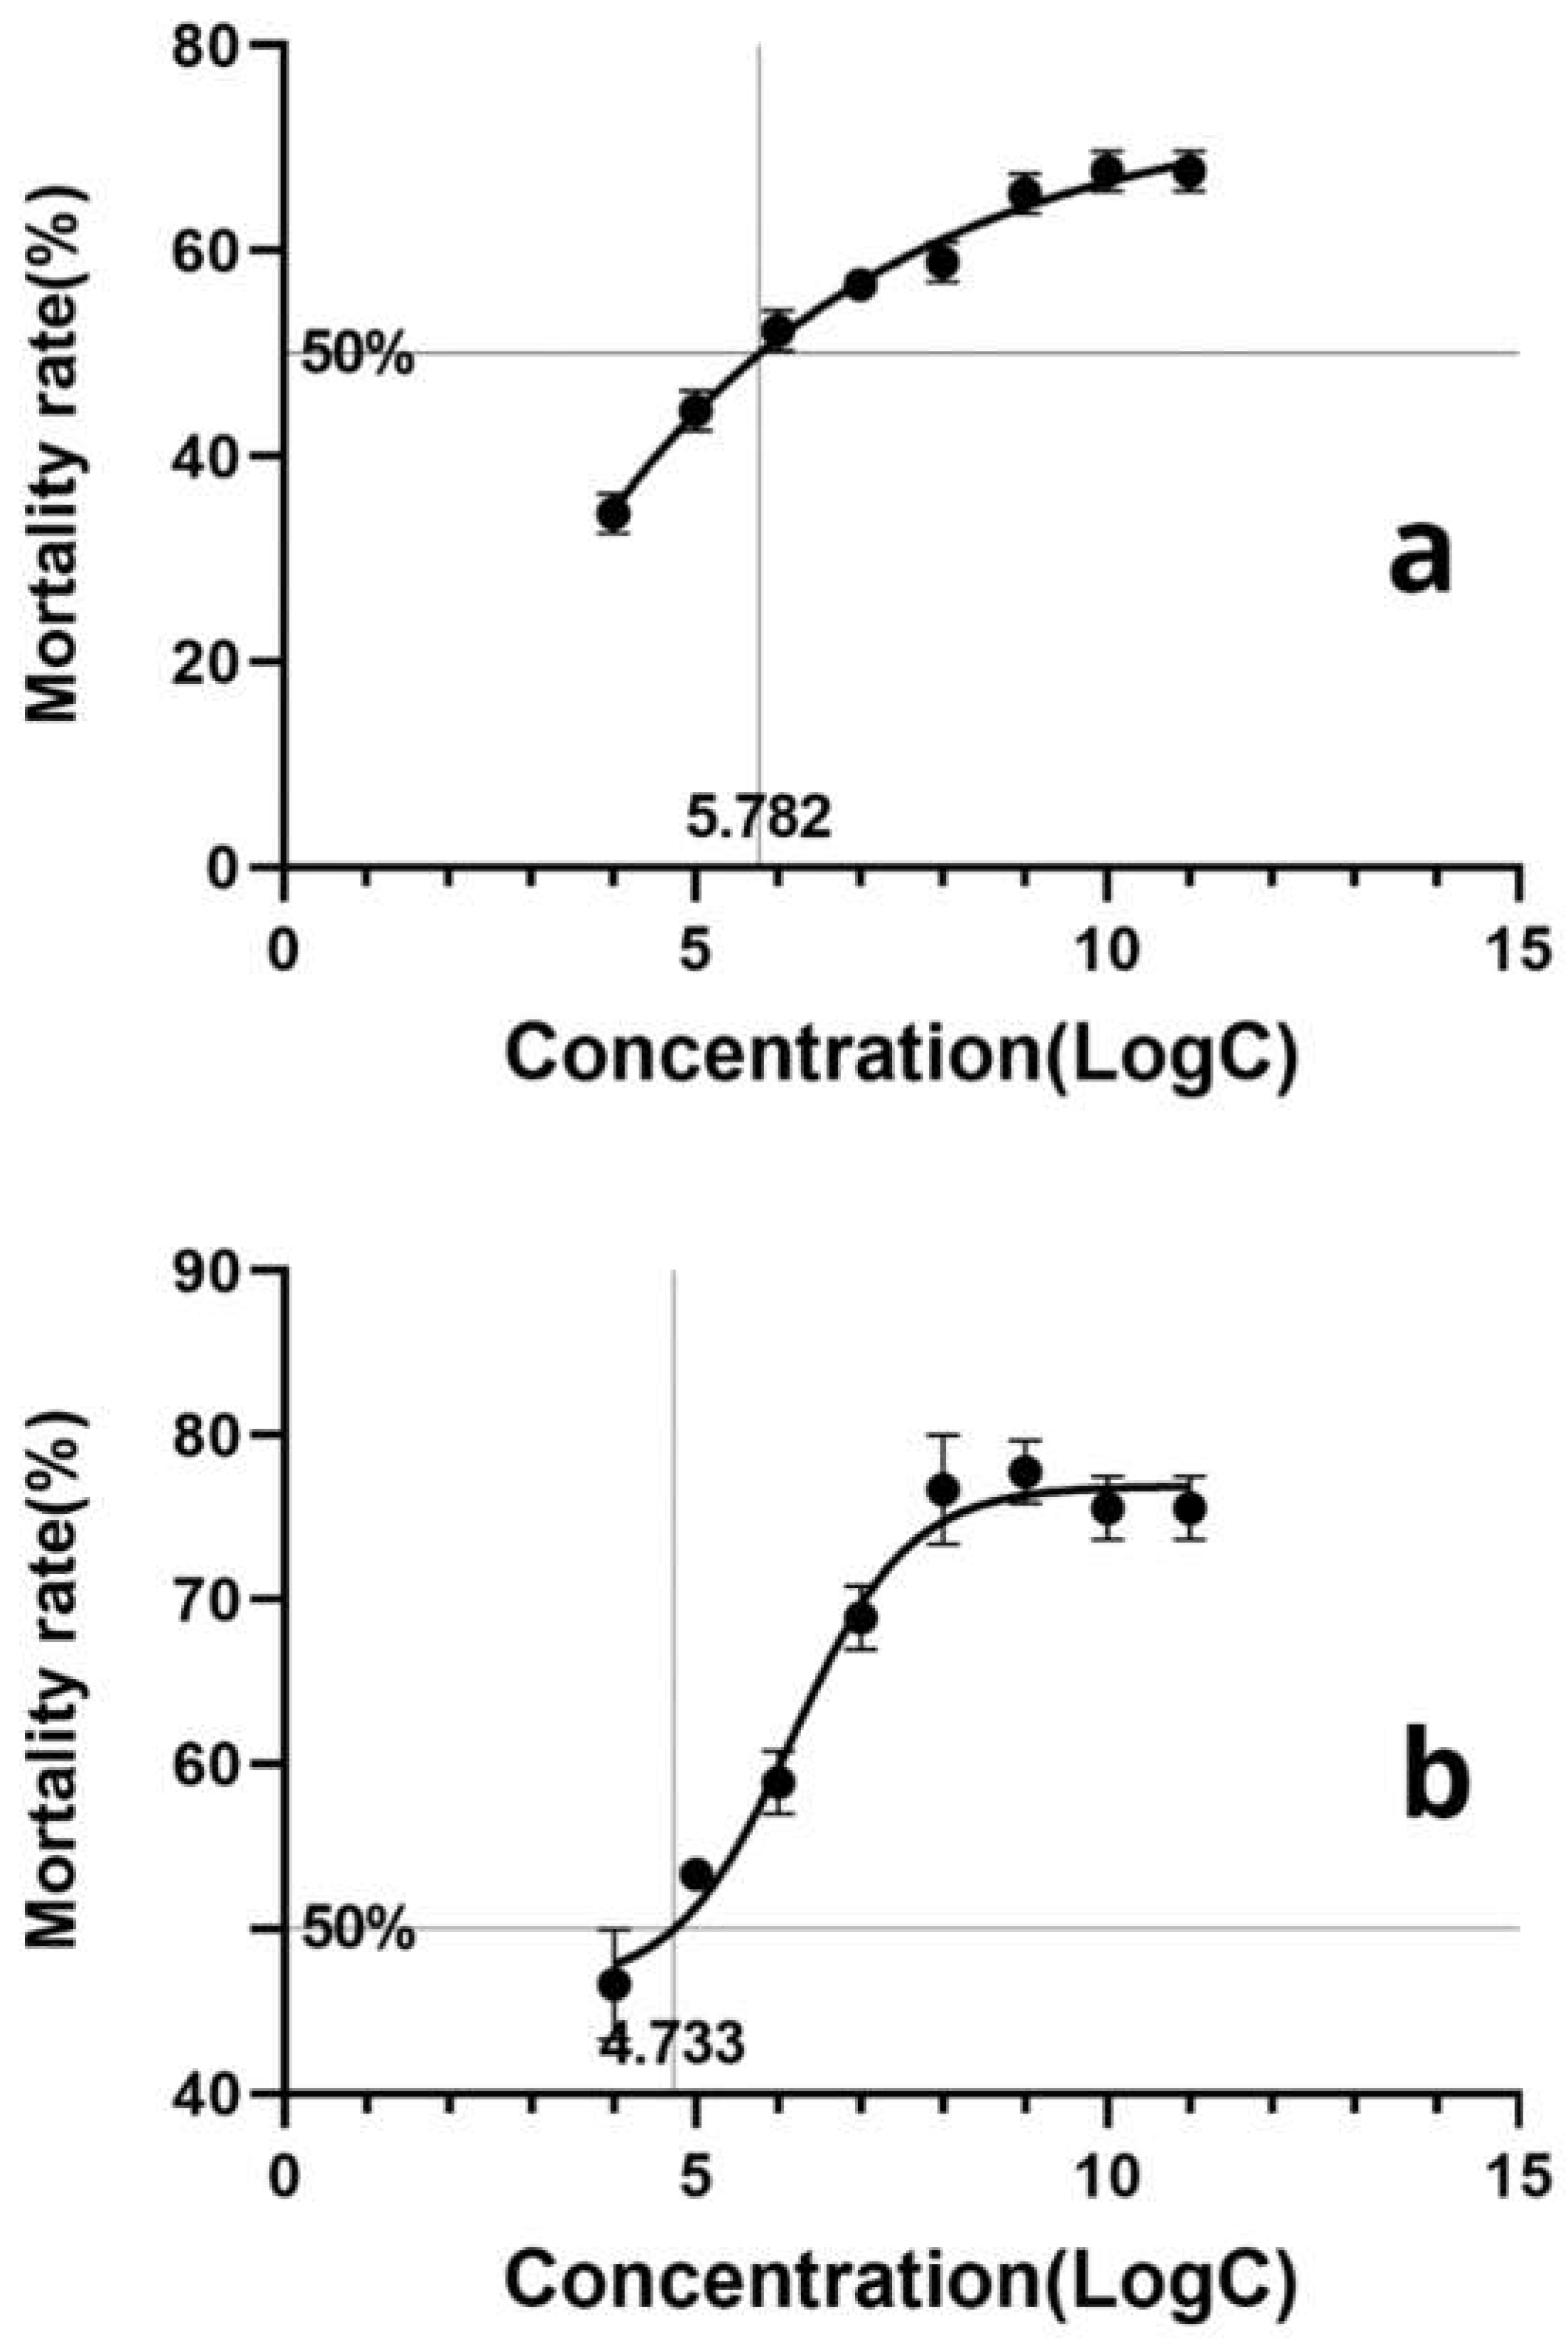
Based on the calculation, the LogLC50 of L. lecanii KMZW-1 against adult B.dorsalis females was determined as 5.662 and against male adults as 4.486 (Figure 6). A significant increase in the mortality observed as spore concentration increased from LogC4 to LogC9. Particularly at LogC6 and higher concentrations, the mortality rate rapidly reaches high levels, suggested a strong lethal effect of L. lecanii KMZW-1 against B. dorsalis.

4. Discussion

In recent years, whole-genome sequencing emerged as important tool for elucidating the genetic characteristics and biological mechanisms of bio-control fungal strains. Comparative analyses have revealed distinct genomic features among these strains including variations in GC content, numbers of coding genes, and specific gene clusters. In this study, Oxford Nanopore Technologies (ONT) sequencing technology was employed with a sequencing depth of no less than 150X (second-generation ≥50X, third-generation ≥100X), ContigN50 ≥1M. The genome of L. lecanii KMZW-1 spans 47,239,278 bp, across 27 contigs, with a GC content of 51.16%. The completeness of the genome assessed by BUSCO was of 97.93%. Repeat sequences totaled 228,359 bp, showing 0.48% of the genome. Genome predictions identified a protein gene length of 2,304,086 bp, 41,984 exons, 28,086 introns, 4 repeat sequences with a total length of 1,029 bp, 78 rRNA non-coding genes, 4 non-coding RNA families, 303 tRNA, 49 non-coding RNA families, and 7 pseudo genes predicted with a length of 1,463 bp. antiSMASH analysis detected 29 gene clusters with a total length of 1,336,365 bp.
Our findings align with previous whole genome sequencing studies on different organisms. For example, through-genome of VD18R19 was determined to be 4,123,380 bp, in size with a GC content of 43.80%. It encodes 4,245 genes, including 85 tRNA genes, 30 rRNA genes, 33 sRNA genes, and 60 tandem repeat sequences. Using antiSMASH software predicted, VD18R19 was predicted to contains 6 genes cluster inovolved in the synthesis of antibacterial secondary metabolite such as surfactin, plipastatin, bacillibactin, bacilysin, bacillaene, and subtilosin A. Comparative genomic analysis indicated a high structural homology between VD18R19 and the model strain B. subtilis 168 [50]. In another study by Zhao et al. (2022), third-generation PacBio sequencing technology was employed to sequence strain CSR-2. The genome analysis revealed comprehensive insights into its genetic makeup and potential applications. The genome sequencing of strain CSR-2 showed a length of 3,202,366 bp, encoding 3,007 genes, with an average gene length of 943.76 bp [51]. Similarly, whole genome sequencing of B. subtilis strain DNKAS was conducted followed by comparative genomic analysis with eight other B. subtilis strains, focusing particularly on genes related to biofilm formation. DNKAS has genome size of 4.15 Mb, with a GC content of 43.42%, and 4,359 predicted coding genes. Among these 4,217 genes were annotated with direct homologous protein cluster classification. Notably, DKNAS share 1,354 homologous genes with the other B. subtilis strains stdudied. Furthermore DNKAS possesses 26 genes related to biofilm formation, including functional genes corresponding to B. subtilis NCD-2 [52]. This study performed comprehensive functional annotation of the genome of L. lecanii KMZW-1, including annotations fron GO, KEGG, KOG, Pfam, Swissprot, TrEMBL, and Nr databases. The results showed 9994 GO annotations, 3775 KEGG annotations, 7059 KOG annotations, 10510 Pfam annotations, 8390 Swissprot annotations, 13862 TrEMBL annotations, and 13864 Nr annotations. In a similar study Li et al., (2023) conducted whole genome sequencing of strain SQ-2 using the Illumina MiSeq X10 platform. They used antiSMASH tool was to identify genes responsible for the biosynthesis of secondary metabolites. The genome SQ-2 was determined to be 3,486,537 base pairs, with a GC content of 46.63%, encoding a total of 4,298 genes. Eleven gene clusters associated with secondary metabolite biosynthesis were identified, including six clusters responsible for the synthesis of antifungal compounds such as bacillaene, bacilysin, butirosin, fengycin, bacillibactin, and surfactin [53].
Similarly, Li et al., (2022a) employed a combination of second-generation Illumina HiSeq and third-generation PacBio sequencing technologies for whole genome sequencing of strain MC2-1. The complete genome size of MC2-1 was determined to be 3,929,792 base pairs, with an average GC content of 46.5%, encoding a total of 4,015 genes. The genome contains 86 tRNA genes, 27 rRNA genes, and 81 sRNA genes, along with 2 genomic islands, 1 prophage, and 9 CRISPR-Cas systems [54]. Genes annotation in the NR, Swiss-Prot, COG, GO, and KEGG databases yielded 4,015, 3,347, 2,996, 2,841, and 2,223 genes, respectively. Due to high damaging potential of B. dorsalis, its control often involves multiple tactics including the use of etomopathogenic fungus. In this study, B. dorsalis adult females and males were treated with different spore suspensions of L. lecanii KMZW-1 strain at different concentrations (1×10⁷, 1×10⁶, 1×10⁵, 1×10⁴ spores/mL). After 12 days of treatment, the cumulative average mortality rates of B. dorsalis adults were recorded as follows: 56.67% (68.89%), 52.22% (58.89%), 44.44% (53.33%), and 34.44% (46.67%) for females (males), respectively, compared to a survival rate of 85.56% (80%) in the control group.
The calculated LogLC50 for L. lecanii KMZW-1 against female and male B. dorsalis adults were 5.662 and 4.486, respectively. Furthermore, after treatment with high concentrations (1×10¹¹, 1×10¹⁰, 1×10⁹, 1×10⁸ spores/mL) of L. lecanii KMZW-1, the cumulative average mortality rates of B. dorsalis adults were significantly higher than the control 14.44% (20%) after 12 days, reaching 67.78% (75.56%), 67.78% (75.56%), 65.56% (77.78%), and 58.89% (76.67%), respectively.
These findings are consistent with the results of many other researchers assessing the pathogenicity of different entomopathogenic fungus against B. dorsalis. For example, Cherry and Moore, (2006) extensively observed the infection of M. anisopliae on B. dorsalis and found that approximately 70% of the treated fruit fly larvae were heavily infected, with a survival rate of only 30% [55]. These results indicated that M. anisopliae has high pathogenicity against B. dorsalis similar to the pathogenic potential observed with the L. lecanii KMZW-1 in this study. Additionally, B. bassiana is another commonly used entomopathogenic fungus that can infect and kill various pests, including B. dorsalis. Field experiments involving B. bassiana treatment showed an average mortality rate of 85% for B. dorsalis. Furthermore, the hatching rate of oriental fruit fly eggs was significantly reduced to 35% [56].
Similarly, Jackson and Dunlap, (2012) found that Isaria fumosorosea treatment significantly reduced the survival rate of B. dorsalis larvae upto 40% with an infection rate of 90% [57]. In our studies, L. lecanii KMZW-1 exhibited a concentration-dependent effect on both male and female adults of B. dorsalis with a markedly higher impact on male adults. This suggests the strong potential of L. lecanii KMZW-1 for use in integrated pest management programs targeting B. dorsalis.

5. Conclusions

Our findings revealed the whole genome sequencing of L. lecanii KMZW-1, a genome size of 47,239,278 bp, comprising 27 contigs, with a GC content of 51.16% and a completeness as 97.93%. Additionally, 29 gene clusters associated with secondary metabolite biosynthesis were identified. These findings provide crucial insights into the genetic characteristics, pathogenic mechanisms, and bio-control potential of L. lecanii KMZW-1. Subsequently, pathogenicity of L. lecanii against B. dorsalis demonstrated a concentration dependent increase in mortality rates. Notably the pathogenicity of L. lecanii was significantly higher in male adults compared to females with LogLC50 values of 5.662 and 4.486 for female and male B. dorsalis adults, respectively. These findings provides robust genomic evidence supporting the potential of L. lecanii KMZW-1 for integrated pest management strategies against B. dorsalis.

Supplementary Materials

The following supporting information can be downloaded at: www.mdpi.com/xxx/s1, Figure S1: title; Table S1: title; Video S1: title.

Author Contributions

J.Y. and M.H. contributed equally to this work. They jointly developed the research methodology, carried out the experiments, analyzed and interpreted the data, and drafted the initial manuscript. Both authors were actively involved in revisions and critical discussions throughout the manuscript preparation process. D.Q., M.W., C.S., L.S., S.H., and M.J. provided critical feedback on the experimental design, assisted in data interpretation, and helped in writing. G.W. and C.X. supervised the project, secured funding, and provided overall guidance and mentorship. All authors have read and agreed to the submitted version of the manuscript.

Funding

This work was supported by National Natural Science Foundation of China (32060639, 32060640, and 32260704), Reserve Talents Project for Yunnan Young and Middle-aged Academic and Technical Leaders (202105AC160037), and Yunnan Fundamental Research Projects (202401AT070240).

Institutional Review Board Statement

Not applicable.

Informed Consent Statement

Not applicable.

Data Availability Statement

The original contributions presented in the study are included in the article/Supplementary Material, further inquiries can be directed to the corresponding authors.

Acknowledgments

We thank the editors and anonymous referees for their invaluable comments and suggestions. We would like to express our gratitude to Dr. Abid Ali, Department of Entomology, University of Agriculture Faisalabad, Pakistan for commenting on earlier draft of the manuscript.

Conflicts of Interest

The authors declare no conflict of interest.

References

  1. Chandramohan B, Sathiyabama M, Senthil-Nathan S 2016. Efficacy Of Metarhizium Anisopliae And Beauveria Bassiana Against Bactrocera Dorsalis And Bactrocera Cucurbitae (Diptera: Tephritidae). Journal Of Asia-Pacific Entomology, 19: 929-934.
  2. Huang Z H, Song C L, Cui Z X 2014. The Insecticidal Activity Of Lecanicillium Lecanii And Beauveria Bassiana Against Bactrocera Dorsalis Adults. Journal Of Fruit Science, 31: 1046-1051.
  3. Zhang L, Chen X, Hou Q, Et Al. 2018. Genome Sequencing And Comparative Genomics Reveal The Potential Pathogenic Mechanism Of Cercospora Sojina Hara On Soybean. Scientific Reports, 8: 1796.
  4. Li X, Liu Y, Fan Z, Et Al. 2022b. Comparative Genomics And Evolutionary Analysis Of Trichoderma Harzianum And Its Biocontrol Potential Against Plant Pathogens. *Frontiers In Microbiology. Frontiers In Microbiolog, 13.
  5. Cao Y, Wang Y, Feng M G 2020. Whole-Genome Sequence Of Lecanicillium Attenuatum Strain Lec8, An Entomopathogenic Fungus With High Potential As A Biocontrol Agent. *Microbiology Resource Announcements, 9: E01480-01499.
  6. Huang L, Fan G, Fang W, Et Al. 2021. Genome Sequencing And Analysis Of Lecanicillium Lecanii 1502, A Potential Entomopathogenic Fungus For Controlling Aphids. *Archives Of Microbiology : 4329-4334.
  7. Weems, H.V. , Heppner J.B. Caribbean Fruit Fly (Anastrepha Suspense Loew (Insecta: Diptera: Tephritidae)) Featured Creatures EENY-196: July Reviews. UF/IFAS; Gainesville, FL, USA: 2014.
  8. Vargas, R.I.; Piñero, J.C.; Leblanc, L. An Overview of Pest Species of Bactrocera Fruit Flies (Diptera: Tephritidae) and the Integration of Biopesticides with Other Biological Approaches for Their Management with a Focus on the Pacific Region. Insects 2015, 6, 297–318. [Google Scholar] [CrossRef] [PubMed]
  9. Usman, M.; Gulzar, S.; Wakil, W.; Piñero, J.C.; Leskey, T.C.; Nixon, L.J.; Oliveira-Hofman, C.; Wu, S.; Shapiro-Ilan, D. Potential of entomopathogenic nematodes against the pupal stage of the apple maggot Rhagoletis pomonella (Walsh) (Diptera: Tephritidae). J. Nematol. 2020, 52, 1–9. [Google Scholar] [CrossRef] [PubMed]
  10. Gulzar, S.; Wakil, W.; Shapiro-Ilan, D.I. Combined Effect of Entomopathogens against Thrips tabaci Lindeman (Thysanoptera: Thripidae): Laboratory, Greenhouse and Field Trials. Insects 2021, 12, 456. [Google Scholar] [CrossRef] [PubMed]
  11. Wakil, W.; Tahir, M.; Al-Sadi, A.M.; Shapiro-Ilan, D. Interactions Between Two Invertebrate Pathogens: An Endophytic Fungus and an Externally Applied Bacterium. Front. Microbiol. 2020, 11. [Google Scholar] [CrossRef] [PubMed]
  12. Tahir, M.; Wakil, W.; Ali, A.; Sahi, S.T. Pathogenicity of Beauveria bassiana and Metarhizium anisopliae isolates against larvae of the polyphagous pest Helicoverpa armigera. Èntomol. Gen. 2019, 38, 225–242. [Google Scholar] [CrossRef]
  13. Wang L, Gao X, Wang S, Et Al. 2010. Biological Characteristics And Pathogenicity Of Lecanicillium Lecanii On Diseased Bactrocera Dorsalis. Anhui Agricultural Science : 7909-7912.
  14. Walker B J, Abeel T, Shea T, Et Al. 2014. Pilon: An Integrated Tool For Comprehensive Microbial Variant Detection And Genome Assembly Improvement. Plos One, 9: E112963.
  15. Li, H.; Durbin, R. Fast and accurate short read alignment with Burrows—Wheeler transform. Bioinformatics 2009, 25, 1754–1760. [Google Scholar] [CrossRef]
  16. Simão, F.A.; Waterhouse, R.M.; Ioannidis, P.; Kriventseva, E.V.; Zdobnov, E.M. BUSCO: Assessing genome assembly and annotation completeness with single-copy orthologs. Bioinformatics 2015, 31, 3210–3212. [Google Scholar] [CrossRef]
  17. Xu, Z.; Wang, H. LTR_FINDER: an efficient tool for the prediction of full-length LTR retrotransposons. Nucleic Acids Res. 2007, 35, W265–W268. [Google Scholar] [CrossRef] [PubMed]
  18. Han, Y.; Wessler, S.R. MITE-Hunter: a program for discovering miniature inverted-repeat transposable elements from genomic sequences. Nucleic Acids Res. 2010, 38, e199–e199. [Google Scholar] [CrossRef]
  19. Price, A.L.; Jones, N.C.; Pevzner, P.A. De novo identification of repeat families in large genomes. Bioinformatics 2005, 21, i351–i358. [Google Scholar] [CrossRef] [PubMed]
  20. Edgar, R.C.; Myers, E.W. PILER: identification and classification of genomic repeats. Bioinformatics 2005, 21, i152–i158. [Google Scholar] [CrossRef] [PubMed]
  21. Wicker, T.; Sabot, F.; Hua-Van, A.; Bennetzen, J.L.; Capy, P.; Chalhoub, B.; Flavell, A.; Leroy, P.; Morgante, M.; Panaud, O.; et al. Reply: A unified classification system for eukaryotic transposable elements should reflect their phylogeny. Nat. Rev. Genet. 2009, 10, 276–276. [Google Scholar] [CrossRef]
  22. Jurka, J.; Kapitonov, V.V.; Pavlicek, A.; Klonowski, P.; Kohany, O.; Walichiewicz, J. Repbase Update, a database of eukaryotic repetitive elements. Cytogenet. Genome Res. 2005, 110, 462–467. [Google Scholar] [CrossRef] [PubMed]
  23. Tarailo-Graovac, M.; Chen, N. Using RepeatMasker to Identify Repetitive Elements in Genomic Sequences. Curr. Protoc. Bioinform. 2009, 25, 4.10.1–4.10.14. [Google Scholar] [CrossRef] [PubMed]
  24. Burge C, Karlin S 1997. Prediction Of Complete Gene Structures In Human Genomic DNA. J. Mol. Biol., 268: 78-94.
  25. Stanke, M.; Waack, S. Gene prediction with a hidden Markov model and a new intron submodel. Bioinformatics 2003, 19, ii215–ii225. [Google Scholar] [CrossRef] [PubMed]
  26. Majoros, W.H.; Pertea, M.; Salzberg, S.L. TigrScan and GlimmerHMM: two open source ab initio eukaryotic gene-finders. Bioinformatics 2004, 20, 2878–2879. [Google Scholar] [CrossRef] [PubMed]
  27. Alioto, T.; Blanco, E.; Parra, G.; Guigó, R. Using geneid to Identify Genes. Curr. Protoc. Bioinform. 2018, 64, e56. [Google Scholar] [CrossRef]
  28. Keilwagen J, Wenk M, Erickson J L, Et Al. 2016. H: Using Intron Position Conservation For Homology-Based Gene Prediction. Nucleic Acids Research, 44: E89-E89.
  29. Haas B J, Salzberg S L, Zhu W, Et Al. 2008. Automated Eukaryotic Gene Structure Annotation Using Evidencemodeler And The Program To Assemble Spliced Alignments. Genome Biol., 9: R7.
  30. Lowe T M, Eddy S R 1997. Trnascan-SE: A Program For Improved Detection Of Transfer RNA Genes In Genomic Sequence. Nucleic Acids Res., 25: 955-964.
  31. Nawrocki E P, Eddy S R 2013. Infernal 1.1: 100-Fold Faster RNA Homology Searches. Bioinformatics, 29: 2933-2935.
  32. She R, Chu J S C, Wang K, Et Al. 2009. Genblasta: Enabling BLAST To Identify Homologous Gene Sequences. Genome Res., 19: 143-149.
  33. Birney, E.; Clamp, M.; Durbin, R. GeneWise and Genomewise. Genome Res. 2004, 14, 988–995. [Google Scholar] [CrossRef] [PubMed]
  34. Blin, K.; Shaw, S.; Kloosterman, A.M.; Charlop-Powers, Z.; van Wezel, G.P.; Medema, M.H.; Weber, T. antiSMASH 6.0: improving cluster detection and comparison capabilities. Nucleic Acids Res. 2021, 49, W29–W35. [Google Scholar] [CrossRef] [PubMed]
  35. Altschul, S.F.; Madden, T.L.; Schäffer, A.A.; Zhang, J.; Zhang, Z.; Miller, W.; Lipman, D.J. Gapped BLAST and PSI-BLAST: A new generation of protein database search programs. Nucleic Acids Res. 1997, 25, 3389–3402. [Google Scholar] [CrossRef] [PubMed]
  36. Deng Y Y, Li J Q, Wu S F 2006. Integrated Nr Database In Protein Annotation System And Its Localization. J]. Comput Eng, 32: 71-74.
  37. Boeckmann B, Bairoch A, Apweiler R, Et Al. 2003. The SWISS-PROT Protein Knowledgebase And Its Supplement Trembl In 2003. Nucleic Acids Res., 31: 365-370.
  38. Kanehisa M, Goto S, Kawashima S, Et Al. 2004. The KEGG Resource For Deciphering The Genome. Nucleic Acids Res., 32: D277-280.
  39. Tatusov, R.L.; Galperin, M.Y.; Natale, D.A.; Koonin, E.V. The COG database: a tool for genome-scale analysis of protein functions and evolution. Nucleic Acids Res. 2000, 28, 33–36. [Google Scholar] [CrossRef] [PubMed]
  40. Conesa A, Götz S, García-Gómez J, Et Al. 2004. Blast2GO: A Universal Annotation And Visualization Tool For Functional Genomics Research.
  41. Eddy S R 1998. Profile Hidden Markov Models. Bioinformatics : 755-763.
  42. Cantarel, B.L.; Coutinho, P.M.; Rancurel, C.; Bernard, T.; Lombard, V.; Henrissat, B. The Carbohydrate-Active EnZymes database (CAZy): An expert resource for Glycogenomics. Nucleic Acids Res. 2009, 37, D233–D238. [Google Scholar] [CrossRef] [PubMed]
  43. Saier M H, JR. , Tran C V, Barabote R D 2006. TCDB: The Transporter Classification Database For Membrane Transport Protein Analyses And Information. Nucleic Acids Res., 34: D181-186.
  44. Winnenburg, R. PHI-base: a new database for pathogen host interactions. Nucleic Acids Res. 2006, 34, D459–D464. [Google Scholar] [CrossRef] [PubMed]
  45. Fischer, M.; Knoll, M.; Sirim, D.; Wagner, F.; Funke, S.; Pleiss, J. The Cytochrome P450 Engineering Database: a navigation and prediction tool for the cytochrome P450 protein family. Bioinformatics 2007, 23, 2015–2017. [Google Scholar] [CrossRef] [PubMed]
  46. Lu, T.; Yao, B.; Zhang, C. DFVF: database of fungal virulence factors. Database 2012, 2012, bas032–bas032. [Google Scholar] [CrossRef] [PubMed]
  47. Petersen, T.N.; Brunak, S.; von Heijne, G.; Nielsen, H. SignalP 4.0: discriminating signal peptides from transmembrane regions. Nat. Methods 2011, 8, 785–786. [Google Scholar] [CrossRef]
  48. Krogh A, Larsson B, Von Heijne G, Et Al. 2001. Predicting Transmembrane Protein Topology With A Hidden Markov Model: Application To Complete Genomes. J. Mol. Biol., 305: 567-580.
  49. Sperschneider, J.; Gardiner, D.M.; Dodds, P.N.; Tini, F.; Covarelli, L.; Singh, K.B.; Manners, J.M.; Taylor, J.M. EffectorP: predicting fungal effector proteins from secretomes using machine learning. New Phytol. 2015, 210, 743–761. [Google Scholar] [CrossRef] [PubMed]
  50. Gao S F, Liu A Q, Sang L W, Et Al. 2018. Whole-Genome Sequencing And Comparative Genomics Analysis Of Bacillus Subtilis VD18R19, A Biocontrol Agent Against Phytophthora Foot Rot Disease In Pepper. Journal Of Tropical Crop Science, 39: 2021-2027.
  51. Zhao M X, Bai Z Y, Zhang X H, Et Al. 2022. Biocontrol Effects Of Strain CSR-2 Against Maize Stalk Rot And Its Whole-Genome Sequence Analysis. Chinese Journal Of Biological Control, 38: 242-249.
  52. Wang Q, Bao H F, Ding R R, Et Al. 2022. Whole-Genome Sequencing And Analysis Of Biofilm-Related Genes In Bacillus Subtilis Strain DNKAS As A Biocontrol Agent. Herbivorous Livestock : 56-64.
  53. Li S R, Li X, Feng J L, Et Al. 2023. Whole-Genome Sequencing And Bioinformatic Analysis Of The Biocontrol Agent Bacillus Amyloliquefaciens SQ-2. Bulletin Of Microbiology, 50: 1073-1097.
  54. Li H M, He M C, Gao X, Et Al. 2022a. Whole-Genome Sequencing Analysis Of The Biocontrol Agent Bacillus Velezensis MC2-1. Southern Agricultural Journal, 53: 3420-3432.
  55. Cherry A J, Moore D 2006. Infection Of The Non-Target Invertebrate Pests Bactrocera Dorsalis And Bactrocera Cucurbitae (Diptera: Tephritidae) With Metarhizium Anisopliae And Beauveria Bassiana. Biocontrol Science And Technology, 16: 701-713.
  56. Reddy N P, Prashanthi S K 2015. Evaluation Of Indigenous Beauveria Bassiana And Metarhizium Anisopliae Isolates Against Bactrocera Dorsalis (Hendel) And Their Prospects In The Fruit Fly Control Programme. Journal Of Biopesticides, 8: 104-108.
  57. Jackson M A, Dunlap C A 2012. Laboratory Evaluation Of Isaria Fumosorosea CCM 8367 For Controlling Bactrocera Dorsalis (Diptera: Tephritidae). Florida Entomologist, 95: 62-69.
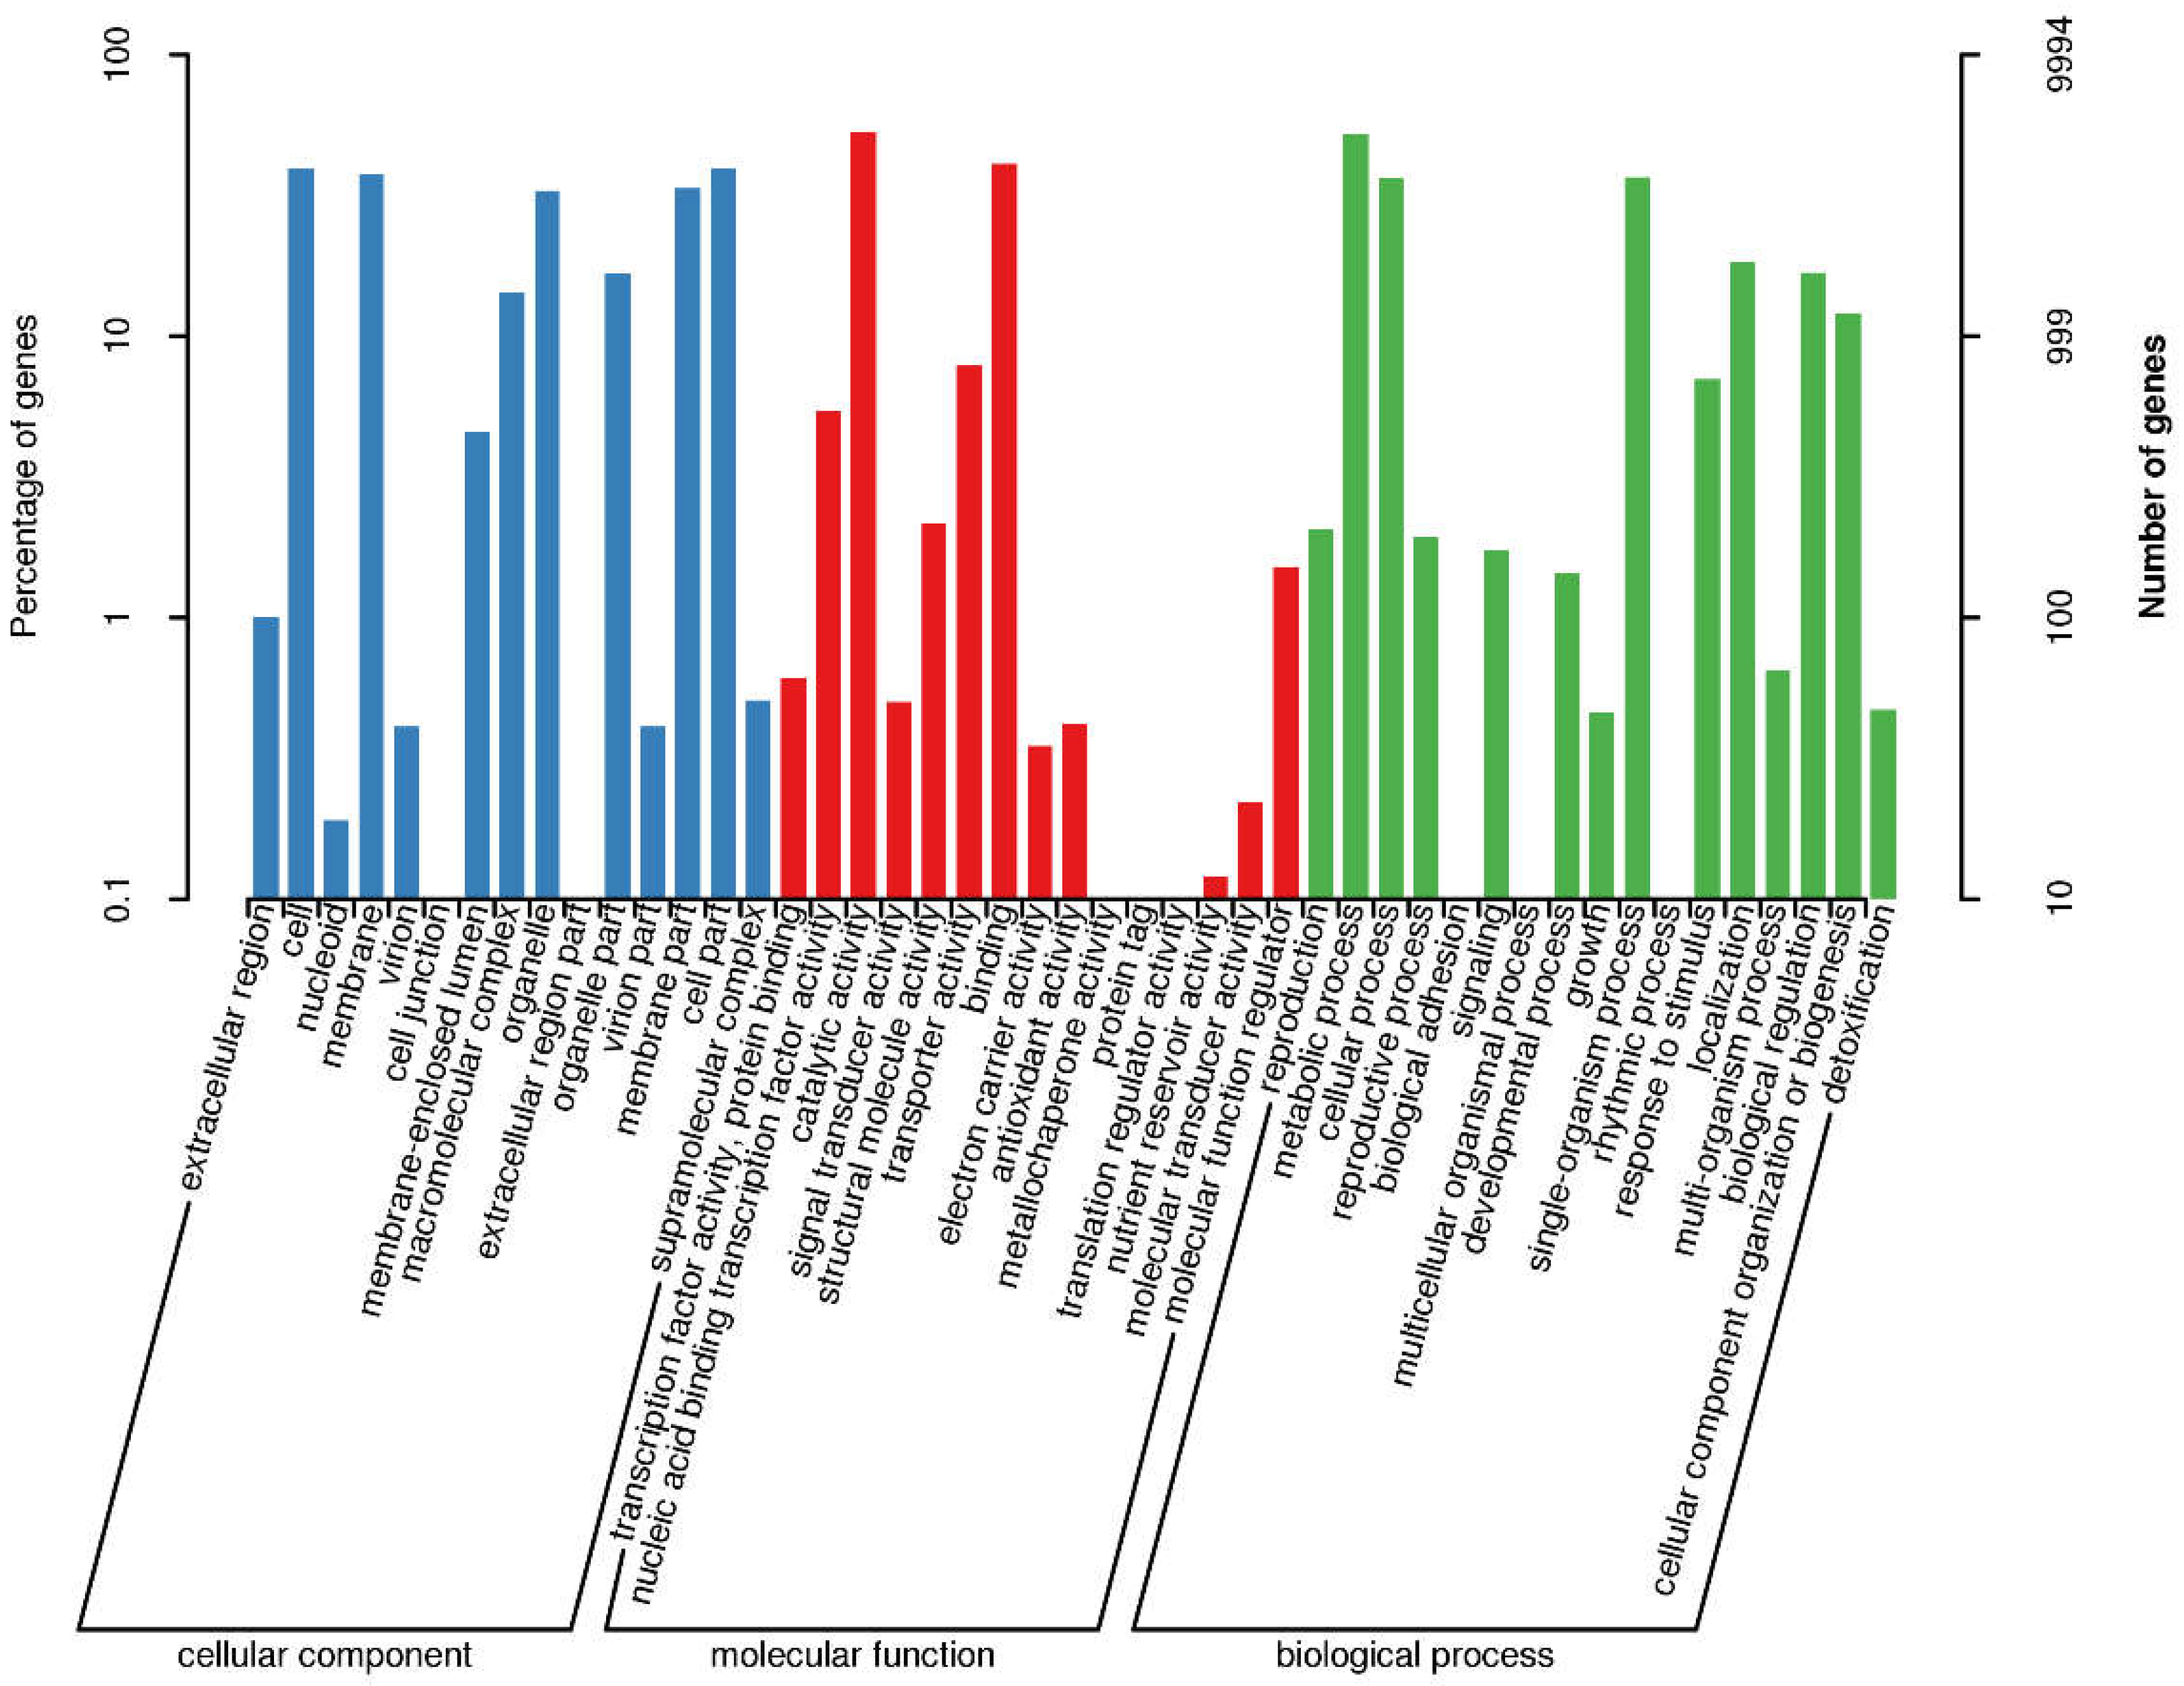
Figure 1. Category statistics of GO annotations. Note: The horizontal coordinate is the content of GO classification, the left side of the vertical coordinate is the percentage of the number of genes, and the right side is the number of genes. This figure shows the gene enrichment of each secondary function of GO in the context of all genes, reflecting the status of each secondary function in this context.
Preprints 112561 g001
Figure 2. Category statistics of KOG function annotations. Note: The horizontal coordinate is the classification content of KOG, and the vertical coordinate is the number of genes. In different functional categories, the proportion of genes reflects the metabolic or physiological bias in the corresponding period and environment, which can be scientifically explained in combination with the distribution of research objects in each functional category.
Preprints 112561 g002
Figure 3. Schematic diagram of KEGG metabolic pathway results. Note: The number in the box represents the EC number of the key enzyme in the metabolic pathway, and the blue box indicates the presence of the coding gene corresponding to the enzyme in the genome.
Preprints 112561 g003
Figure 4. Classification statistics of KEGG annotations. Note: The vertical coordinate is KEGG secondary classification, and the horizontal coordinate is percentage.
Preprints 112561 g004
Figure 5. The variation in cumulative mortality count under different treatments for B. dorsalis adults. Note: a: The variation in cumulative mortality count in different treatments for female B. dorsalis adults;b: The variation in cumulative mortality count in different treatments for male B. dorsalis adults.
Preprints 112561 g005
Figure 6. The calculation of lethal concentration for B. dorsalis adults. Note: a: The calculation of lethal concentration for female B. dorsalis adults;b: The calculation of lethal concentration for male B. dorsalis adults.
Preprints 112561 g006
Table 2. Statistics of genome assembly.
Contig Length (bp) Contig Number Contig N50 (bp) Contig N90 (bp) GC content (%) Gaps Number
47,239,278 27 2,751,789 1,018,923 51.16 0
Note: Contig Length (bp): indicates the length of contig that is more than 1 kb. Contig Number: Indicates the number of contig above 1 kb. contig N50 (bp): length of contig N50; contig N90 (bp): length of contig N90; GC Content (%): GC content; Gaps Number: The number of gaps.
Table 3. BUSCO evaluation statistics.
Complete BUSCOs(C) Complete and single-copy BUSCOs(S) Complete and duplicated BUSCOs(D) Fragmented BUSCOs(F) Missing BUSCOs(M) Total Lineage BUSCOs
284 (97.93%) 281 (96.90%) 3 (1.03%) 4 (1.38%) 2 (0.69%) 290
Note: Complete BUSCOs: Find the complete gene number; Complete and single-copy BUSCOs: The number of single-copy genes; Complete and duplicated BUSCOs: number of duplicated genes; Fragmented BUSCOs: predicts incomplete gene number; Missing BUSCOs: No predicted number of genes; Total Lineage BUSCOs: The number of conserved gene sets.
Table 4. Gene function annotation statistics for L. lecanii KMZW-1.
Database Number 100<=length<300 length>=300
GO_Annotation 9,994 2,279 7,603
KEGG_Annotation 3,775 913 2,788
KOG_Annotation 7,059 1,422 5,575
Pfam_Annotation 10,510 2,346 8,076
Swissprot_Annotation 8,390 1,692 6,608
TrEMBL_Annotation 13,862 3,729 9,992
nr_Annotation 13,864 3,730 9,993
All_Annotated 13,867 3,733 9,993
Note: Database: Annotated functional database; Number: The number of genes on the annotation; 100<=length<300: the number of genes whose length is (100~300bp); length>=300: The number of genes with a length greater than 300 bp.
Disclaimer/Publisher’s Note: The statements, opinions and data contained in all publications are solely those of the individual author(s) and contributor(s) and not of MDPI and/or the editor(s). MDPI and/or the editor(s) disclaim responsibility for any injury to people or property resulting from any ideas, methods, instructions or products referred to in the content.
Copyright: This open access article is published under a Creative Commons CC BY 4.0 license, which permit the free download, distribution, and reuse, provided that the author and preprint are cited in any reuse.
Prerpints.org logo

Preprints.org is a free preprint server supported by MDPI in Basel, Switzerland.

Subscribe

© 2024 MDPI (Basel, Switzerland) unless otherwise stated