1. Introduction
In recent years, the application of sustainable materials in structural engineering has become a growing demand due to the environmental concerns and the need for eco-friendly solutions [
1]. Bamboo emerges as a sustainable construction material, offering promising potential. Live bamboo can absorb up to 40% more carbon dioxide and produce 35% more oxygen than an equivalent stand of trees [
2] and reduce deforestation due to high harvest cycles compared to structural timber [
3].
The natural drawbacks of bamboo include susceptibility to harsh environmental factors (moisture content and bamboo’s water absorption capacity), variability in quality, and long-term durability [
4,
5,
6]. Engineered bamboo aims to enhance bamboo’s advantages while minimizing its natural drawbacks [
7,
8,
9]. A key advantage bamboo brings over other bio-based structural materials is its rapid growth rate, whilst structural timber suffers from a slow recovery period during its harvest cycles, bamboo can be harvested every 4-5 years without a need for replantation. As such, if bamboo is picked as one of the ‘green’ solutions to this problem, deforestation risks will be decreased. Two primary categories within existing Engineered bamboo are bamboo Scrimber and Laminated Bamboo Lumber (LBL), involving bamboo fibres saturated in resin. However, the manufacturing processes of these bamboo products are rather complex and lengthy and may also result in material losses particularly for the LBLs. They also suffer from lack of standardized codes which impedes their construction industry adoption [
10].
The literature proposed the bamboo composite columns made of resin and bamboo culms [
11,
12]. Various configurations were examined, including bio-based epoxy and furan-based matrices, as well as different culm types and composite configurations. A comparison with a control specimen (test series without a matrix) revealed that a matrix-based composite approach enhances compressive strength by at least 40%. The LCBC members that are only slightly modified composites hold immense promise for structural applications.
The adoption of sustainable construction practices involves substituting petroleum-based resins with bio-based alternatives. This shift is attributed to their significant environmental advantages, including reduced reliance on petroleum resources, while still maintaining comparable strength properties [
13]. Other research indicates that furan-based resins have minimal embodied carbon due to the biomass produced during their agricultural production [
14].
The sustainability potential of furan-based solutions is supported by literature, which highlights the economic advantage of furfuryl alcohol’s abundant supply, enhancing their renewability and economic sustainability. Ipakchi
et al. [
15] conclude that furan-based resins are an excellent substitute for their petroleum-based counterparts. However, it is worth noting that petroleum-based epoxies are more practical and readily available compared to most furan-based resins, making them more favorable in terms of ease of use [
13]. Hence, any proposed solution must be rigorously evaluated in terms of both economical feasibility and environmental friendliness.
Harnessing the potential of bamboo in combination with advanced bio-based resins presents a compelling response for constructing environmental-friendly and structurally efficient buildings. LCBC structural members with the use of bio-based resins are sustainable but expensive compared to petroleum-based alternatives [
10]. Despite the challenges, furan-based LCBC columns displayed comparable strength (27 MPa) in compression [
10,
11].
The literature emphasized the impact of choosing split or full culm bamboo on mechanical properties [
11]. The study by Mofidi
et al. [
11] highlights differences in failure mechanisms. Studies have been conducted on a composite beam and column demonstrated that adding a bonding agent to utilize multiple bamboo specimens as a matrix reinforces the material [
16]. This reinforcement enhances the modulus of elasticity, consequently improving mechanical properties such as compressive and bending strength. Observations also highlighted the bamboo’s tendency to kink during loading, indicating brittleness that diminishes its serviceability, a factor that demands further exploration, especially concerning different species and cross sections.
The test results by Bhagat
et al. (2020) [
16] led to the conclusion that the concept possesses strong potential for widespread structural use. In addition, they suggested that specifying culms in a rectangular shape, as opposed to the natural circular hollow section, sacrifices some efficiency, likely to conform to rectangular structural timber norms. Notably, the study did not explore environmental-friendly resin options, a gap that requires attention. Additionally, the study’s reliability could be enhanced by testing a larger sample size, given that only three beam specimens were examined.
The presented investigation aims to contribute to the aforementioned existing gaps by exploring the use of bio-based and sustainable resin options, while ensuring these resins constitute a low percentage of the total volume. In doing so, the paper investigates the buckling behavior of circular bamboo composite columns using bio-based resins (including furan resins) in different composite configurations and compares them with columns made with petroleum-based resin, specifically epoxy, under uniaxial compressive loads. The incorporation of bio-based resins further enhances the eco-friendliness of these composites. It reduces the reliance on petroleum-derived products and mitigates the carbon footprint associated with traditional construction materials.
In addition, the effect of buckling is observed in slender columns (L/r ≈ 0.03) tested under compression, where L and r are the lengths and radii of the specimens. In the experimental part of this study, the buckled samples exhibited bulging in the culm, a phenomenon also noted in the raw bamboo testing of the materials used in this study by the same group [
9]. The effects of buckling become more pronounced when analyzing the stress-strain curves of slender composite samples, accelerating failure and promoting brittle behavior. Another approach employed in this study is a finite element analysis (FEA) approach. The FEA is conducted using ABAQUS software to simulate the behavior of bamboo composite columns under uniaxial compression load. This numerical approach provides valuable insights into the structural response, deformations, and failure mechanisms of the composite columns. Through FEA software, equations representing the physical behavior of the columns in compression are solved iteratively. Buckling analysis using nonlinear Riks method involves determining the critical load at which the sudden increase in axial deflection occurs. The numerical results were calibrated against the experimental test results to provide practical insights that can aid in optimizing bamboo-based structural elements, particularly in terms of resin contents. It is expected that the FEA provide valuable insights into buckling phenomena, aiding in the design of robust and stable LCBC columns.
The objectives of this study can be refined and summarized as follows: Manufacturing and investigating experimentally and numerically multiple LCBC slender columns with four various configurations, different biobased resin matrices, and different bamboo species focusing on minimizing embodied carbon.
2. Methodology
The following methodology is used in this article:
Seventeen LCBC slender short columns with bio-based and synthetic resins are manufactured with four various configurations exclusive of the corresponding control specimens (without resin).
The compression tests on specimens with and without resin are conducted until failure to obtain buckling load and post-buckling behavior.
The failure modes observed in the specimens from test results are analyzed, including the buckling and post-buckling behavior.
The behavior of the columns made with similar resins and bamboo species, but different cross-sectional configurations are compared.
The behavior of the columns made with bio-based composites against the columns with synthetic resins, but similar cross-sectional configurations and bamboo species are compared.
The behavior of the columns made with different cast-in-place giant bamboo species, but similar configurations and resin matrix are studied.
The buckling behavior of the LCBC column under uniaxial compression is simulated using ABAQUS.
The impact of different resin contents on maximum stress, buckling, and post-buckling behavior of columns are compared.
3. Experimental Study
The experimental study involves analyzing both mechanical and physical properties, providing qualitative descriptions of sample failure behaviors and quantitative data such as compressive strength, buckling load, strain at buckling, and stiffness. The testing process is divided into three categories.
1)
Category Testing 1 - Components: The separated elements of LCBC members, this includes the four different raw bamboo species, and four types of resins as respectively were reported in [
9] and [
10].
2) Category Testing 2 - Controls: Non composite samples which do not contain a resin matrix but have similar configurations of bamboo investigated in this study. These can be compared with the LCBC column results to study the effect of resin matrix presence.
3)
Category Testing 3 - LCBC members: Varying configurations made with different bamboo species, split culm or full culm as well as different resins as test parameters. The testing methods for engineered bamboo have been influenced by the bamboo testing standards, specifically ISO 22157 [
17], which were originally designed for raw bamboo testing.
3.1. Category 1 Testing - Components
To generate numerical results for the composites, testing each component is necessary. The resins play a crucial role in forming and binding the bamboo culms, requiring a deep understanding of their mechanical properties (
Table 1).
Additionally, this research aims to validate the effectiveness and potential of using bio-based resins as substitutes for traditional and commonly used synthetic resin options. The experimental results may be able to show that bio-epoxy resins and polyfurfuryl alcohol (PFA) resins should not be chosen solely based on their environmental benefits but are indeed practical replacements. The study compares recent advancements in structural use of bio-epoxy and furan-based resin against a conventional synthetic epoxy.
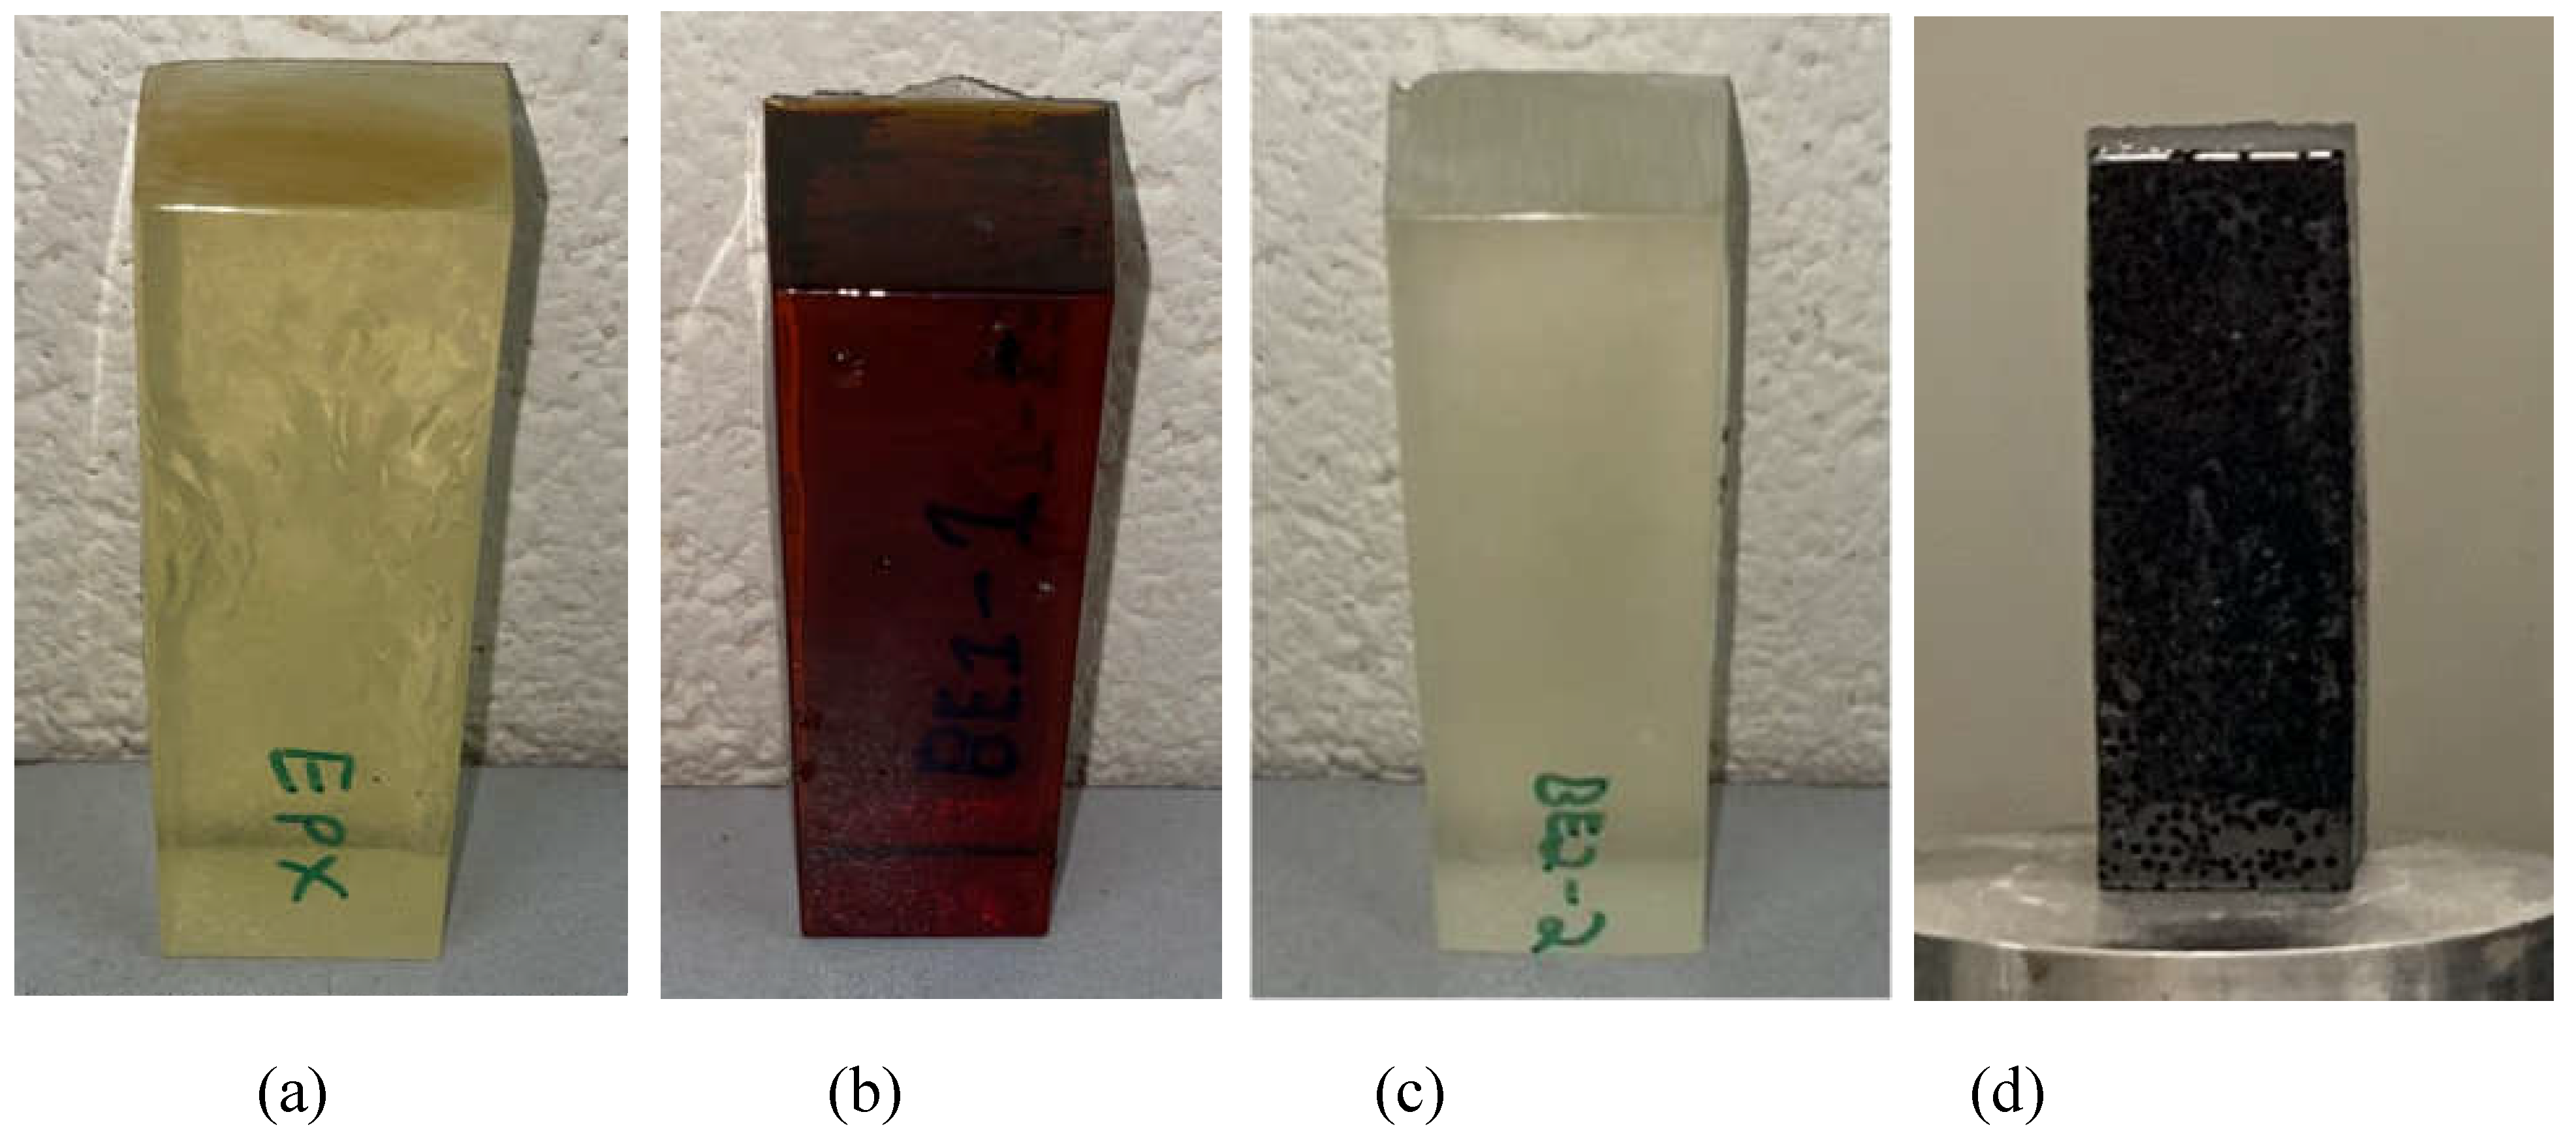
In the labelling procedure for resins Bio-based Experimental soft filler and Bio-Epoxy are abbreviated as BE1 and BE2, whereas PF1 is used for polyfurfuryl alcohol resin. In this study, four different resins were considered: a commercially available synthetic epoxy (EPX), Epolam 2017 (
Figure 1a); an experimental soft bio-based resin (
Figure 1b); a commercially available bio-epoxy produced by Entropy Resins (
Figure 1c); and a furfural-based resin made by TransFurans Chemicals, identified as a PFA-based resin (
Figure 1d). All of the resins were set in the same mold, this ensured standardization across the dimensions of all samples. The ASTM D695-15 [
18] was used to measure the compressive properties of the selected resins.
The compressive strengths of the tested specimens were determined to be 78.90 MPa for synthetic epoxy (EPX), 0.32 MPa for bio-based soft filler (BE1), 94.30 MPa for bio-epoxy resin (BE2), and 42.00 MPa for PFA-based resin (PF1). The strain at maximum compressive strength, corresponding to a linear stress-strain relationship, was recorded as 0.040 for EPX, 0.338 for BE1, 0.063 for BE2, and 0.019 for PF1.
3.2. Category 2 Testing - Controls
Four different types of bamboo species namely Moso, Guadua, Madake, and Tali species are tested. Moso bamboo (Phyllostachys edulis) is a species native to South China, Korea, and Japan known for its exceptional height. Moso is known to be available in a variety of sizes. It presents the opportunity for its use as an internal element of the LCBC member. Guadua bamboo (Guadua angustifolia), native to the American tropics, is renowned for its exceptional strength and flexibility. Madake bamboo (Phyllostachys bambusoides) is a prominent species in Japan, revered for its rapid growth and versatility. Tali bamboo (Gigantochloa apus) originates from Southeast Asia and is valued for its dense and straight culms. The compressive strength values obtained for Moso, Guadua, Madake, and Tali have been reported as 69.9 MPa, 60.7 MPa, 88.9 MPa and 59.1 MPa.
The different composite configurations are manufactured in order to compare the effects of using various arrangements of bamboo culms and strips, in addition to the effect of different species of bamboo and culm sizes with different resin matrices. Engineered bamboo reduces the effect of natural variation, this can be verified with the LCBC columns tested in this study. The Russian Doll (RD) configuration entails the assembly of three bamboo culms of varying sizes, nested inside one another and saturated with resin (
Figure 2a). The Big Russian Doll (BRD) configuration incorporates an additional culm, totaling four culms, resulting in a larger overall diameter (
Figure 2b). In the Hawser (HAW) configuration, five smaller culms are inserted into a giant bamboo culm before resin infusion (
Figure 2c). The Scrimber (SCR) configuration is distinctive in its utilization of split bamboo culms, with a larger culm serving as the base, and split bamboo pieces manually positioned prior to resin saturation (
Figure 2d). It should be noted that the industrially produced bamboo scrimber have a entirely different manufacturing procedure, however, due to similarities in using bamboo strips as the main component, the SCR test series in this study is named over the industrially-produced bamboo scrimber.
The composites had to follow a simple and logical coding procedure in order to allow for quick identification of specimens, a labelled explanation of the coding used is shown in
Figure 3. The majority of studied specimens in this paper are slender type which carry no additional code to make the labels shorter.
In the present work, to understand the effectiveness of using resins within the composites, samples without resin were created and tested. These samples were named ‘control’ samples (CO code) and feature identical configurations to the composites minus the resins. The control samples had a length of 400 mm (with variations for each specimen as shown in
Table 2). This allows for further observations on the effects of buckling to be made. The compressive behavior of the stocky composite columns is presented in another paper by the same authors [
12]. A list of all control samples and their physical properties are included in
Table 2.
To be able to compare control samples to LCBC members by assessing the effect of a resin matrix on the compressive behavior of the columns without including the bucking effect, the average for the three HAW-BE2-M-ST stocky samples has been used against the averaged results for the two HAW-M-CO-ST stocky samples. The results of this comparison are shown in
Table 3. The ‘Increase’ row has been included to indicate the additional compressive strength gain due to the presence of the resin.
The results are presented in terms of the axial compressive stress reached at the peak (
fc,0), the measured axial deformation at ultimate (
∆Lc,0), the axial loads attained at the peak (
Fult), the axial compressive strain reached the peak (
εc,0), and the material toughness (
UT), by calculating the area under the stress strain graph. In
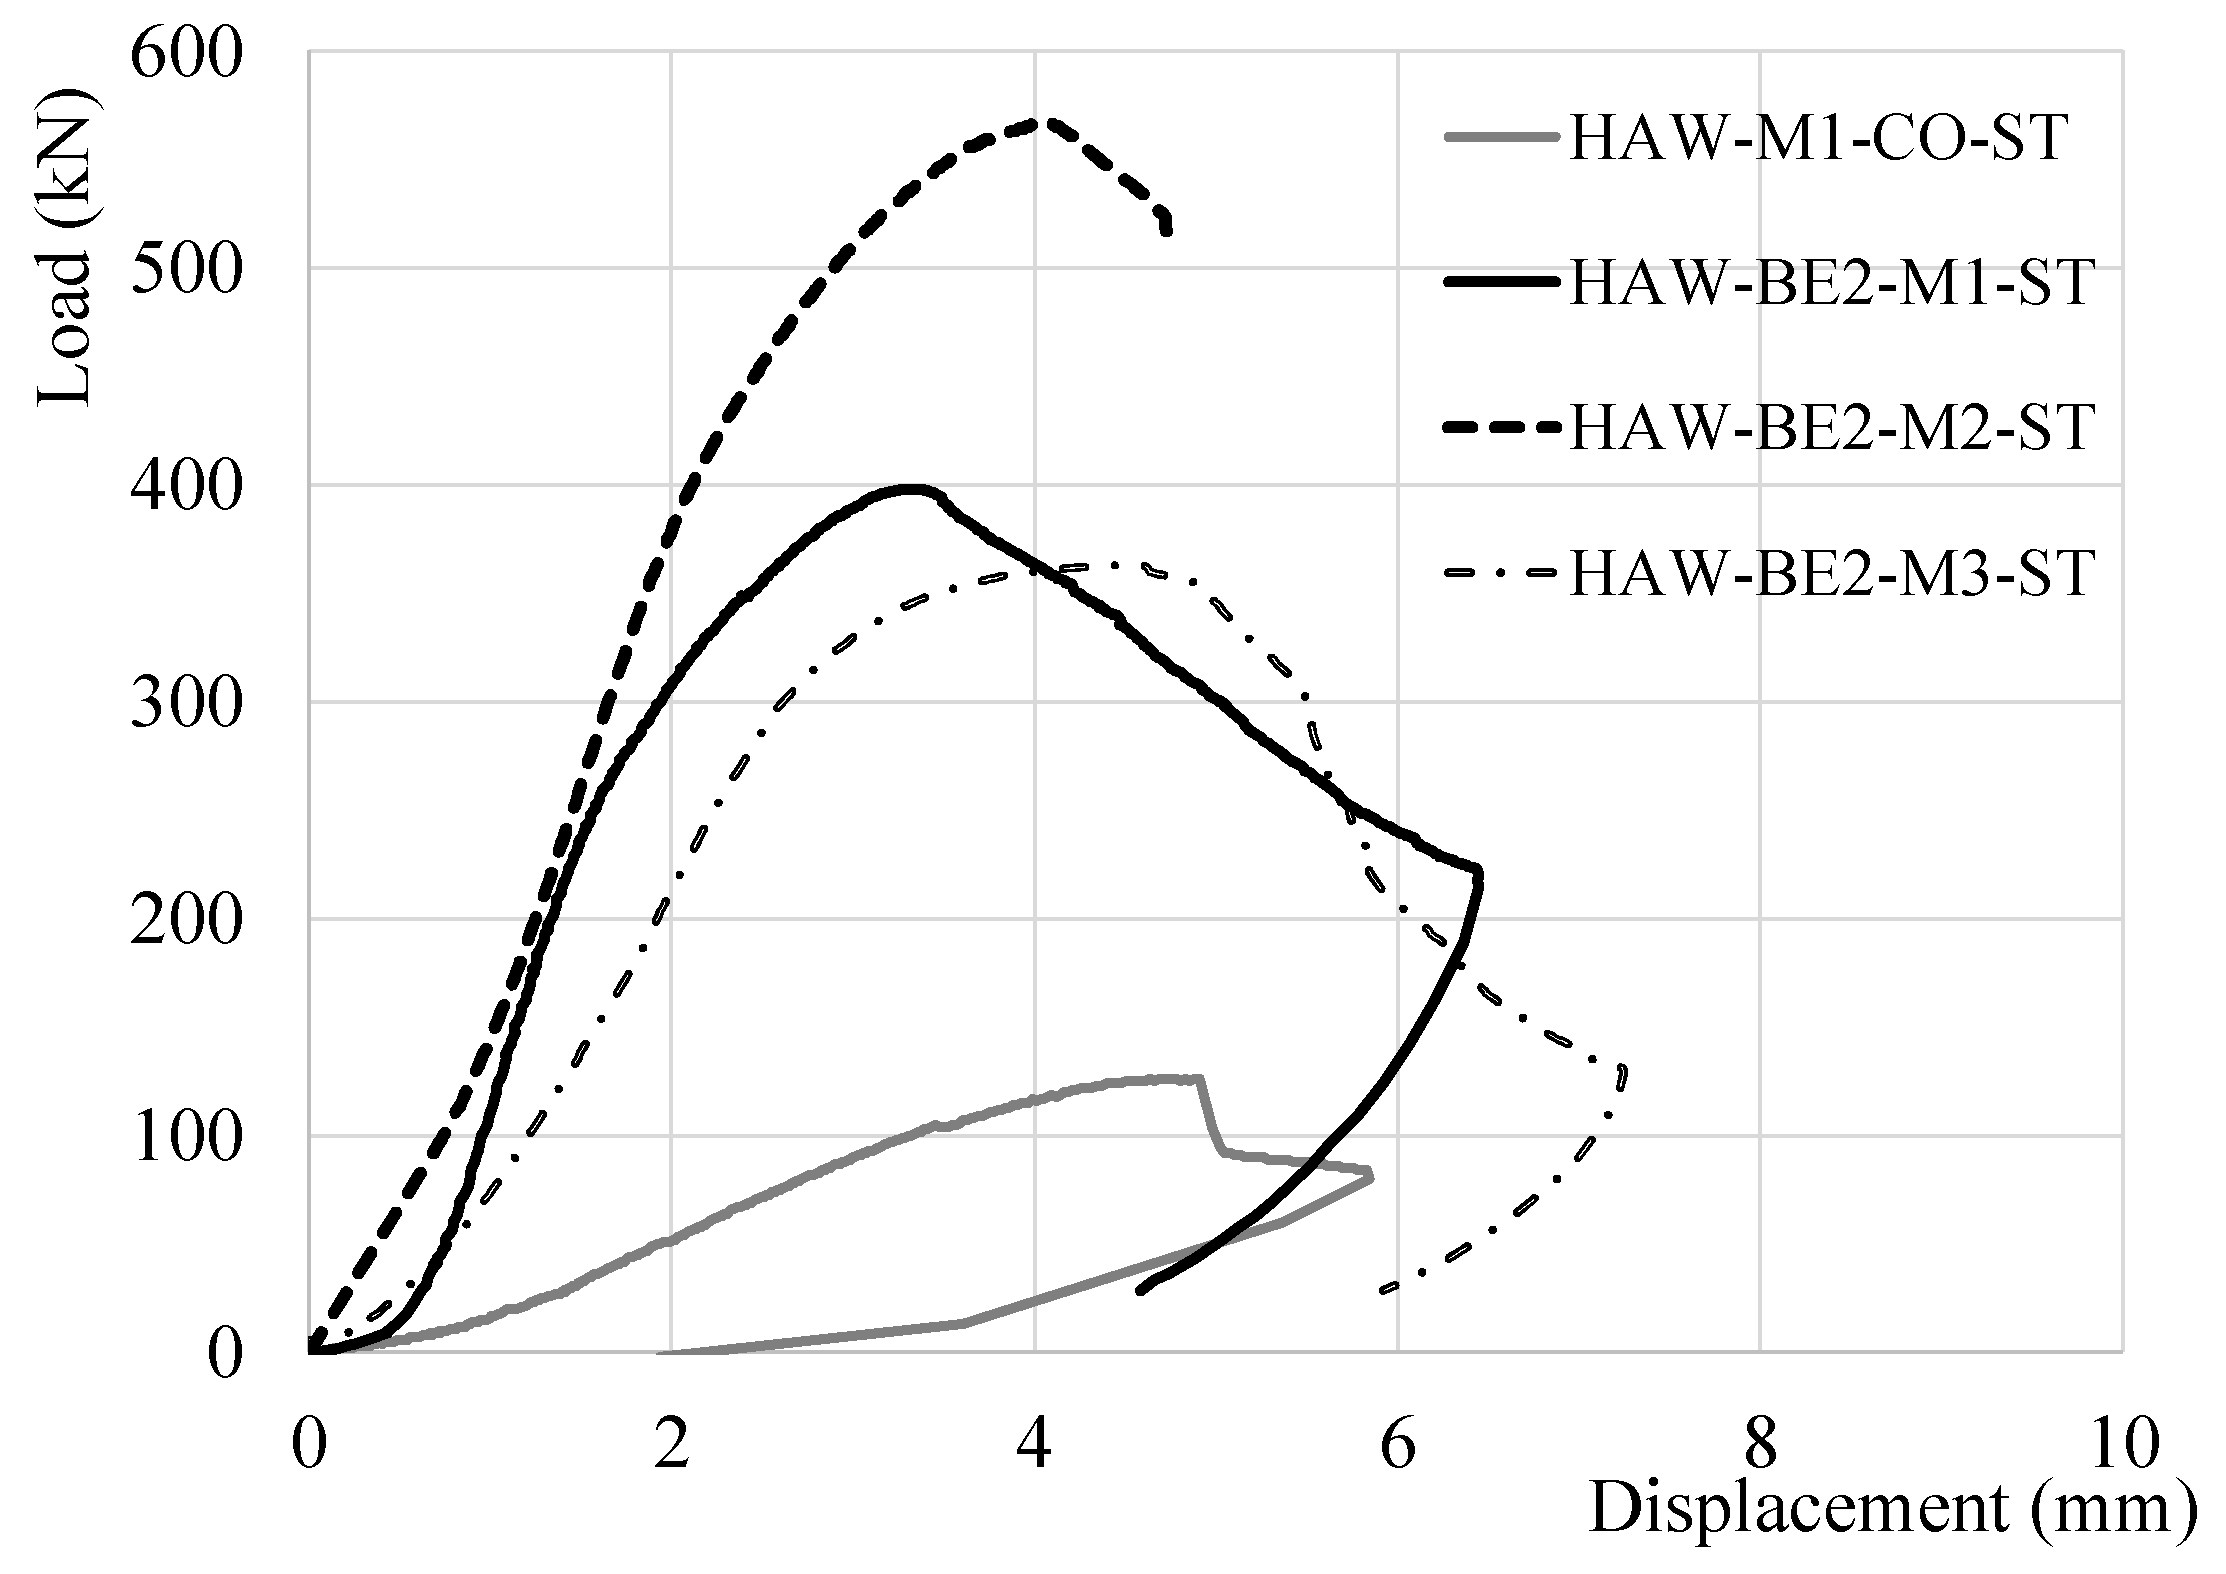
Table 3, the stocky LCBC samples, HAW-BE2-M-ST, which benefited from a BE2 resin matrix can be seen to resist a far greater load whilst displacing less. They also on average have considerably greater ability to absorb energy which is shown with their increased toughness values. The comparison of these specimens in a load-displacement graph can be found in
Figure 4.
From observing the load bearing behavior of the samples in
Figure 4, it is clear that the addition of resin has a significant impact on the load capacity of the stocky samples. The presence of a matrix proves to be beneficial for the structural use of LCBC elements to prevent premature crack propagation in the composite specimens (
Figure 5).
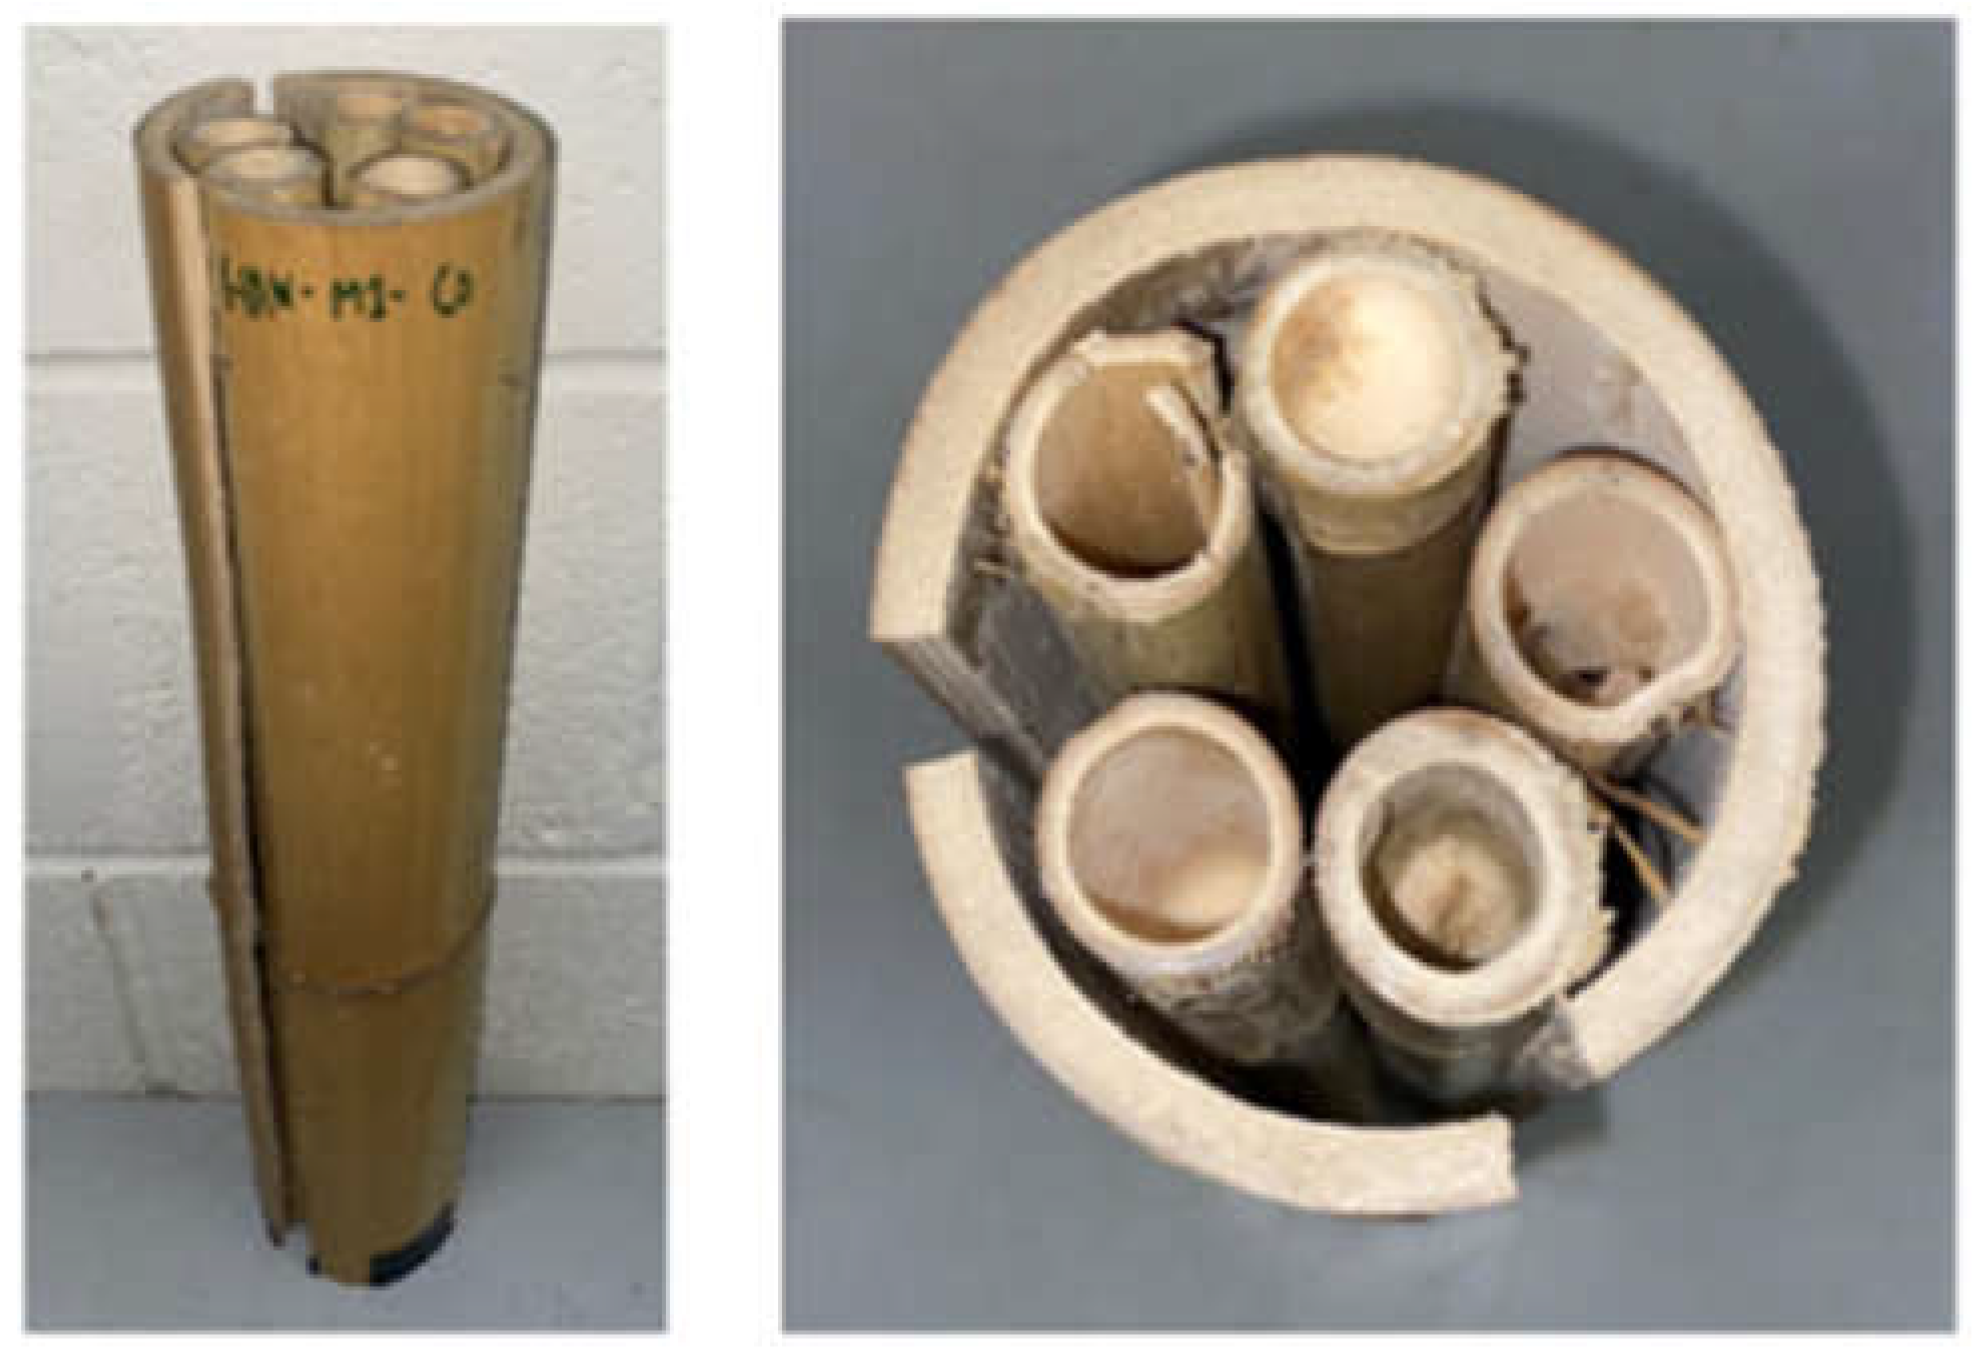
Due to short length of the specimens, the addition of resin did not significantly alter the failure behavior between the LCBC and the control specimen, the only large difference is that the LCBC has an increased softening period of plastic deformation when compared to the control. Conversely, the typical brittle failure mechanism of a slender control sample is depicted in
Figure 6.
The slender control sample can be seen to have experienced two large longitudinal cracks that have widened to a point where the specimen has suffered brittle failure due to the culm being split into two separate pieces. Other than these two cracks the specimen appears to show no other signs of failure. Therefore, the sample failed under highly localized stresses.
3.3. Category 3 Testing: LCBC Specimens
Four different configurations of LCBC slender columns (RD, BRD, HAW, and SCR) with different resin matrices are manufactured and tested of which the test results for buckling behavior are presented here.
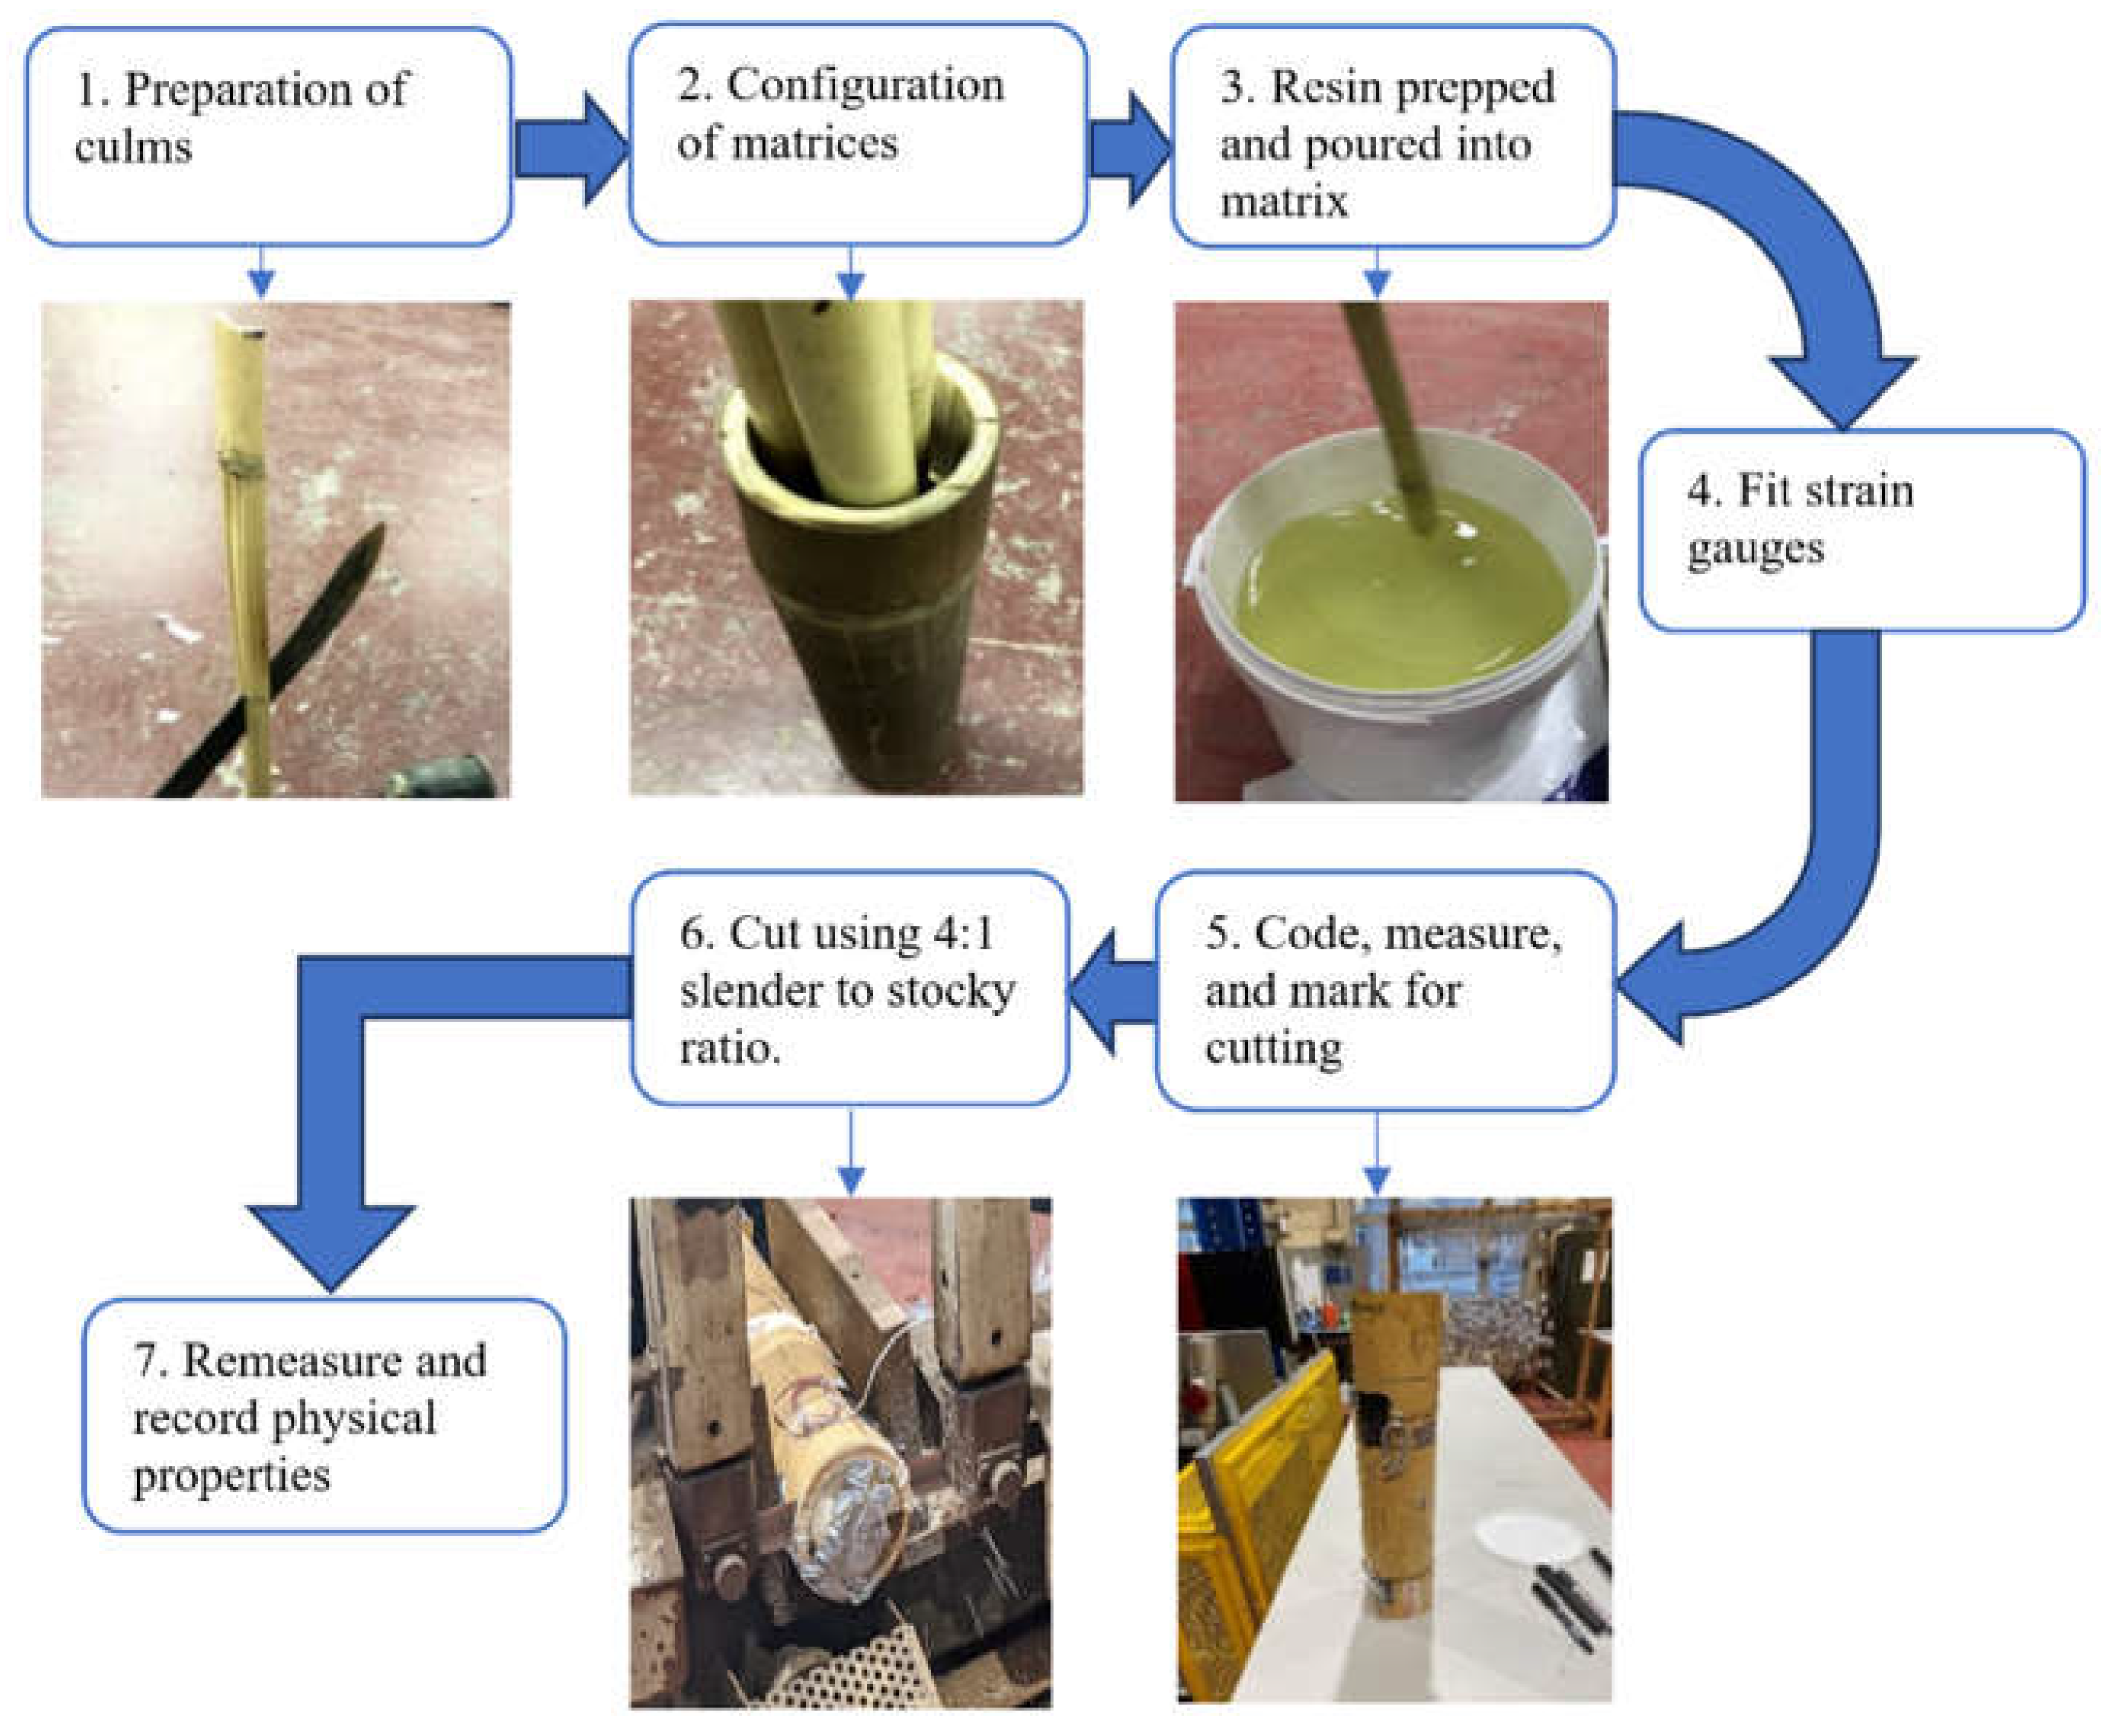
A diagrammatic overview of the preparation process for the composites is shown in
Figure 7. The culms selected for the composites only needed to be split for the SCR configuration.
The summary of the LCBC columns’ physical properties can be found in
Table 4. The slender specimens, which are four times longer than the previously presented stocky LCBC members (see [
10]), are presented in this article.
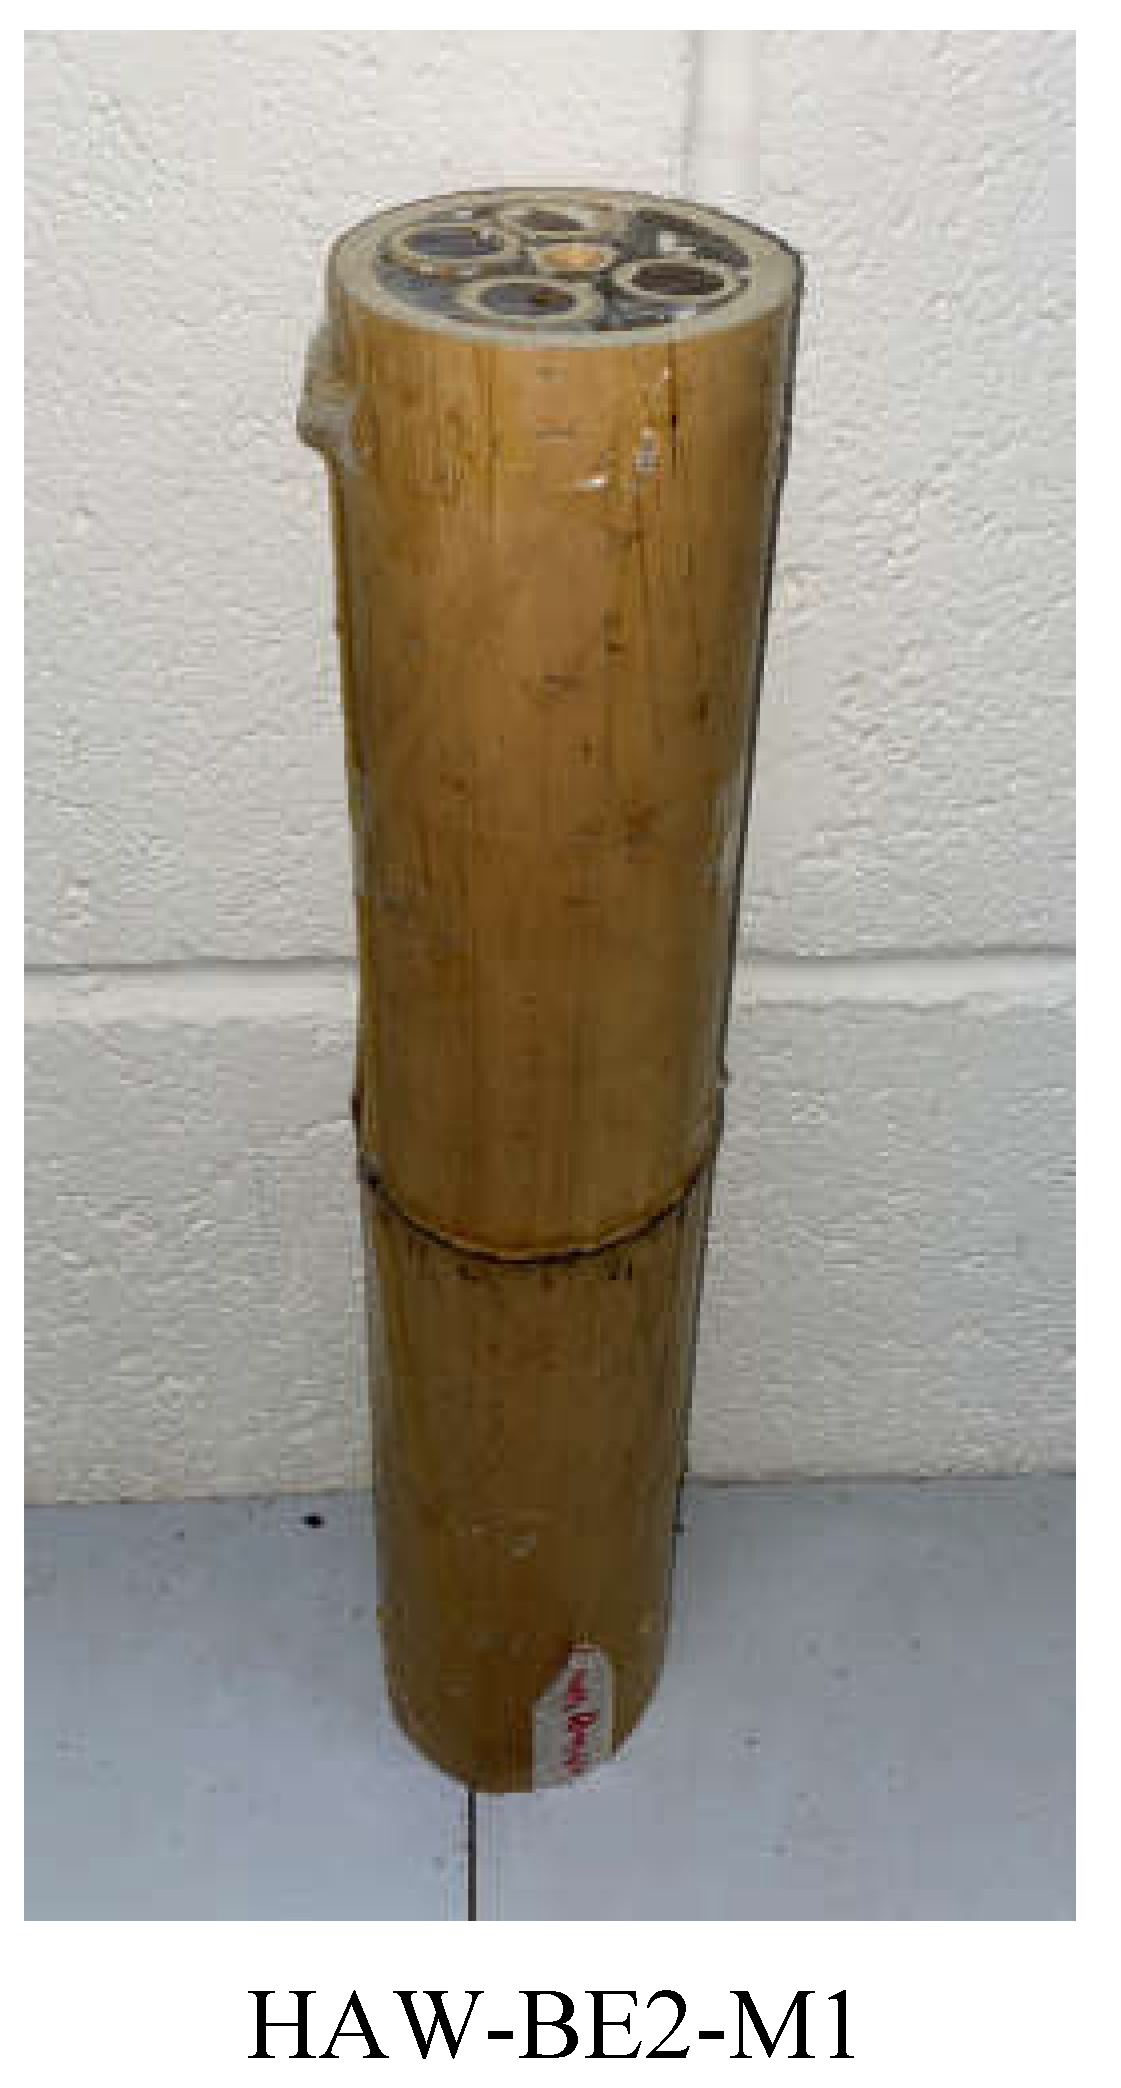
Out of the 40 LCBC specimens manufactured and tested, 17 slender specimens were evaluated and compared in this study. A slender specimen is shown in
Figure 8.
3.4. Experimental Testing Method
The compressive properties of the LCBC specimens were tested using a compressive testing machine with an 8000 kN maximum loading capacity. The machine’s bottom platen featured a spherical bearing to ensure concentric loading by allowing necessary rotations. The specimen end planes were adjusted with sandpaper for uniform load transfer. An intermediate metallic sheet was placed between the loading platens and specimen ends to minimize friction. Vertical load and displacement were recorded automatically at 1-second intervals. A loading rate of 2.0 kN/s was used to ensure specimen failure within 300 ± 120 seconds, as instructed by ISO 22157:2019 [
17].
4. Experimental Results of Slender LCBC Short Columns
In this investigation, 17 stocky LCBC columns were studied. The principal test parameters in this study are: 1) the cross-sectional configuration of LCBC members; 2) resin matrices; and 3) the bamboo species. The experimental results corresponding to the compression test of each slender LCBC specimen are presented in
Table 5.
The results are presented in terms Fult, fc,0, ∆Lc,0, εc,0, and the modulus of elasticity of specimens in compression parallel to the fibres (Εc,0). In this section, the effects of different test parameters of the study are discussed based on the compression behavior of the specimens in each category.
4.1. Buckling Effect
The behavior of 6 slender members in average over their corresponding stocky members in the context of mechanical properties and potential buckling effects are discussed here (
Table 6).
Table 6 includes a comparison of two LCBC slender specimen types with their stocky sample of each, an average has been used for the BE2 slender specimens as well as PF1 slender specimens. An increase by around an average amount of 29% and 27% can be seen in strength of the BE2 and PF1 specimens, respectively, when a stocky sample is considered in comparison with an identical slender specimen. The stocky sample will not have undergone brittle failure, therefore having the ability to absorb more energy and better resist crack propagation. Similarly, a greater displacement can be seen for slender specimens when compared to stocky specimens which can be due to buckling of slender specimens prior to failure. This effect will be discussed more in detail in the following numerical analysis section of this study.
4.2. Cross-Sectional Configuration Choice
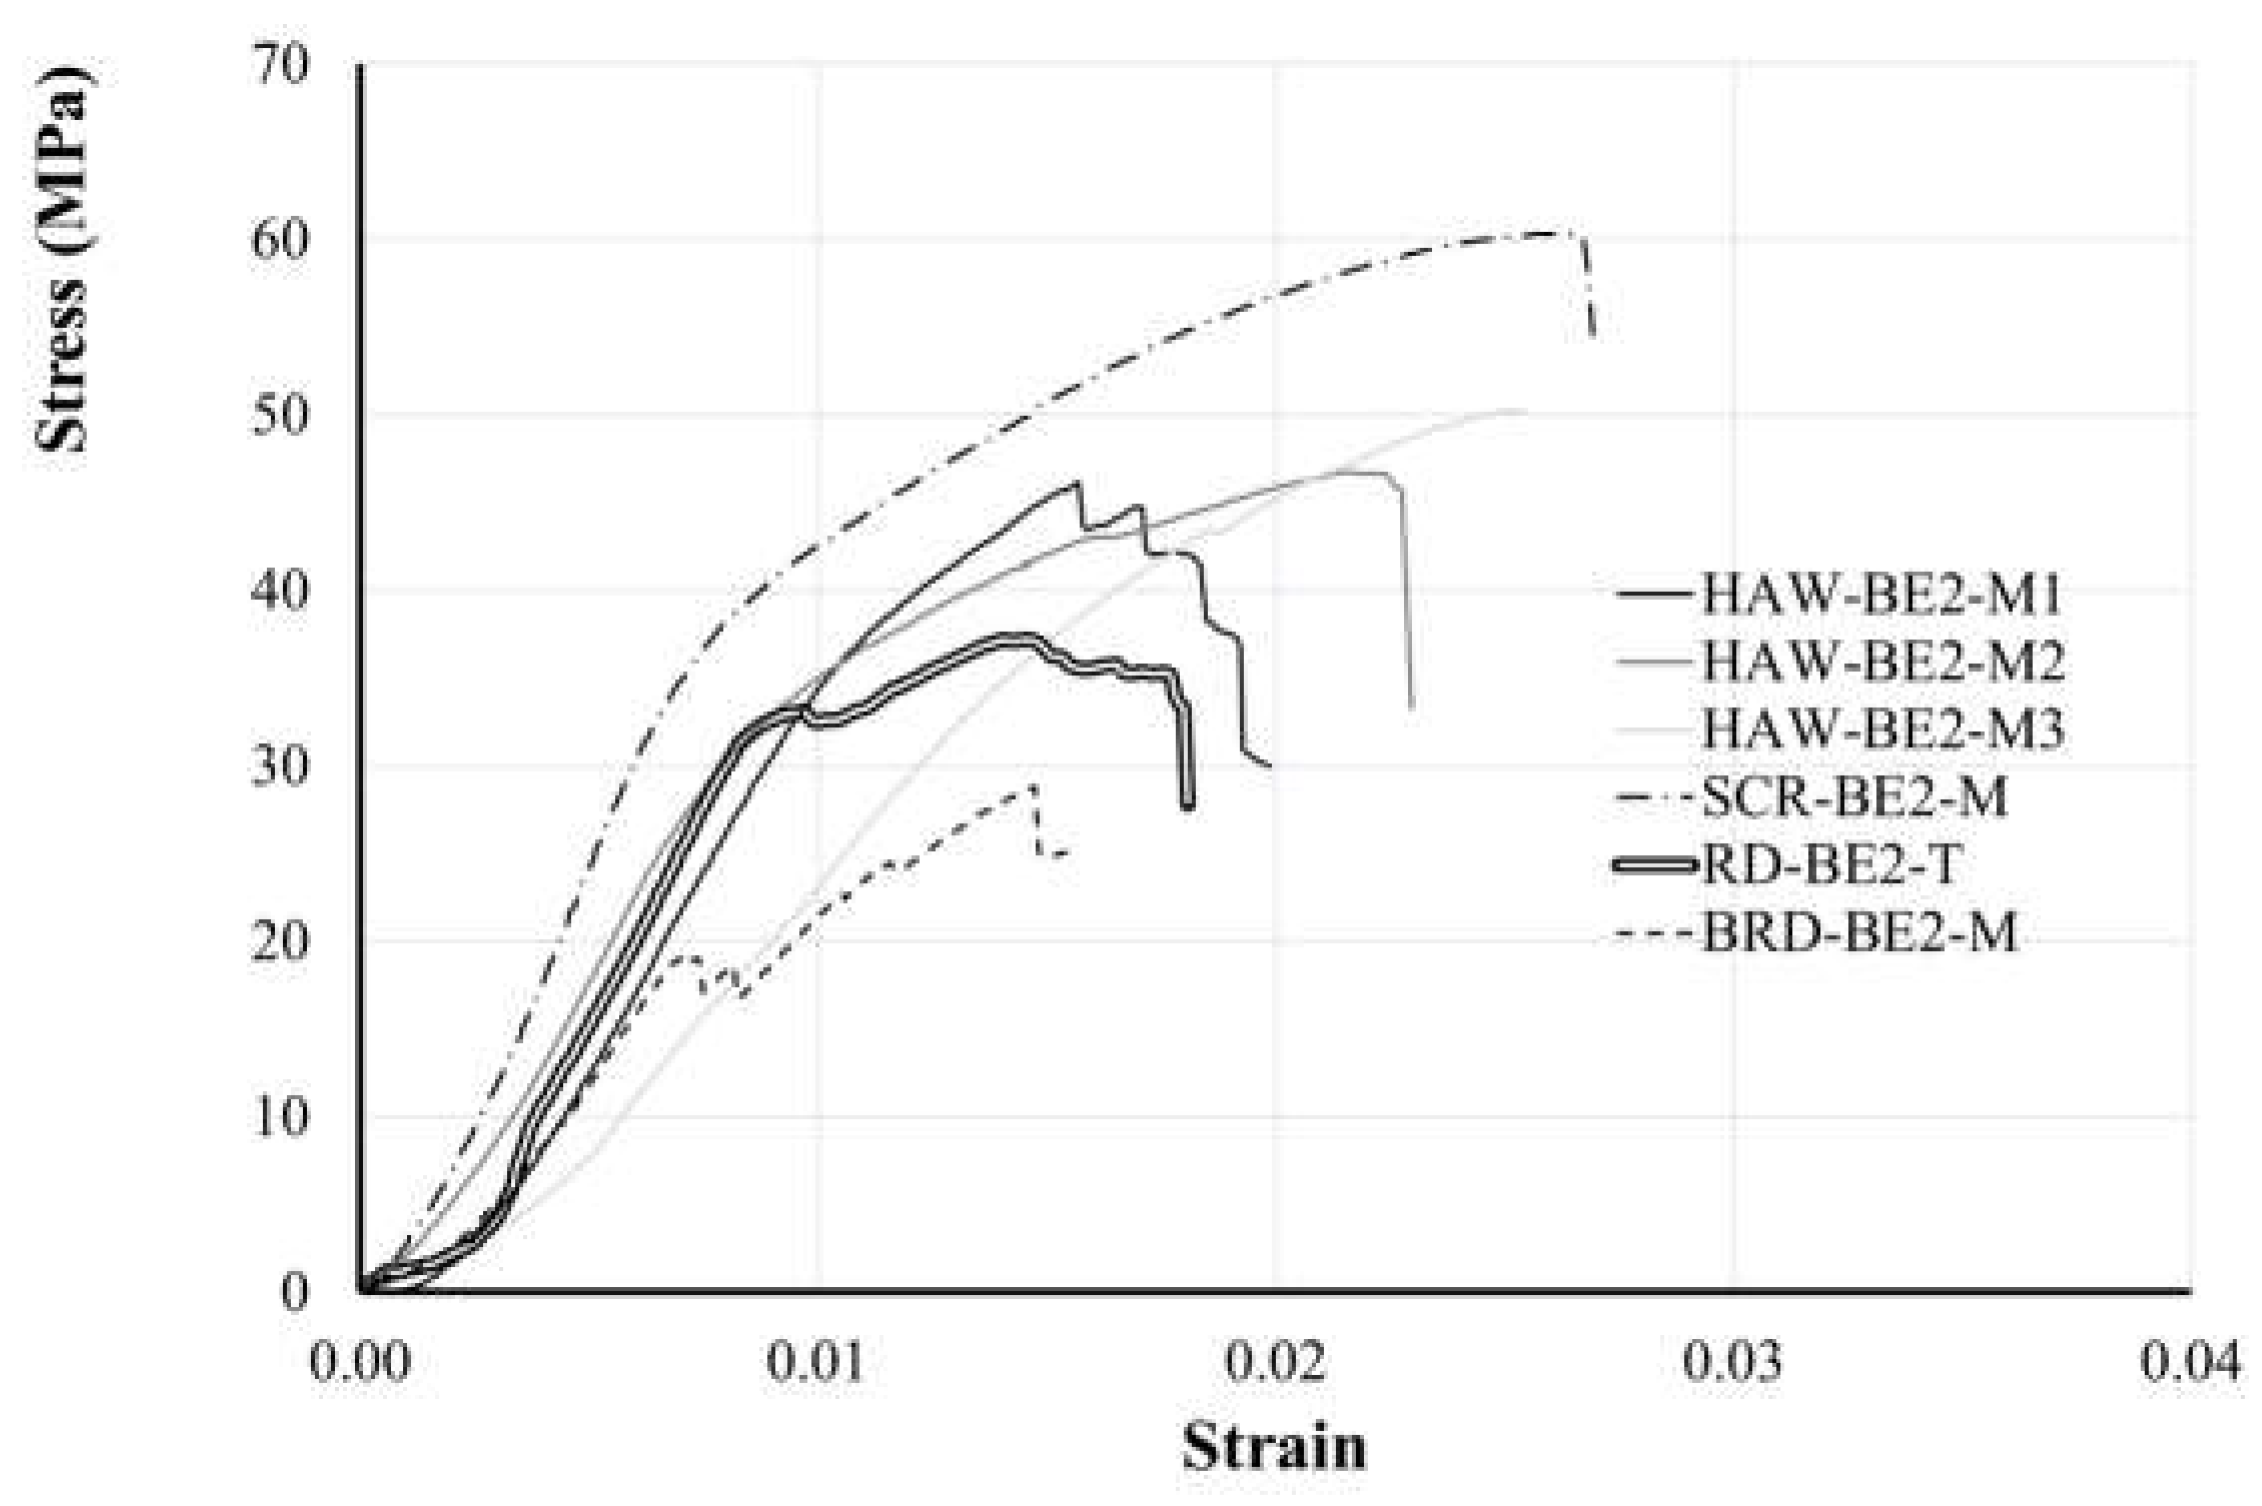
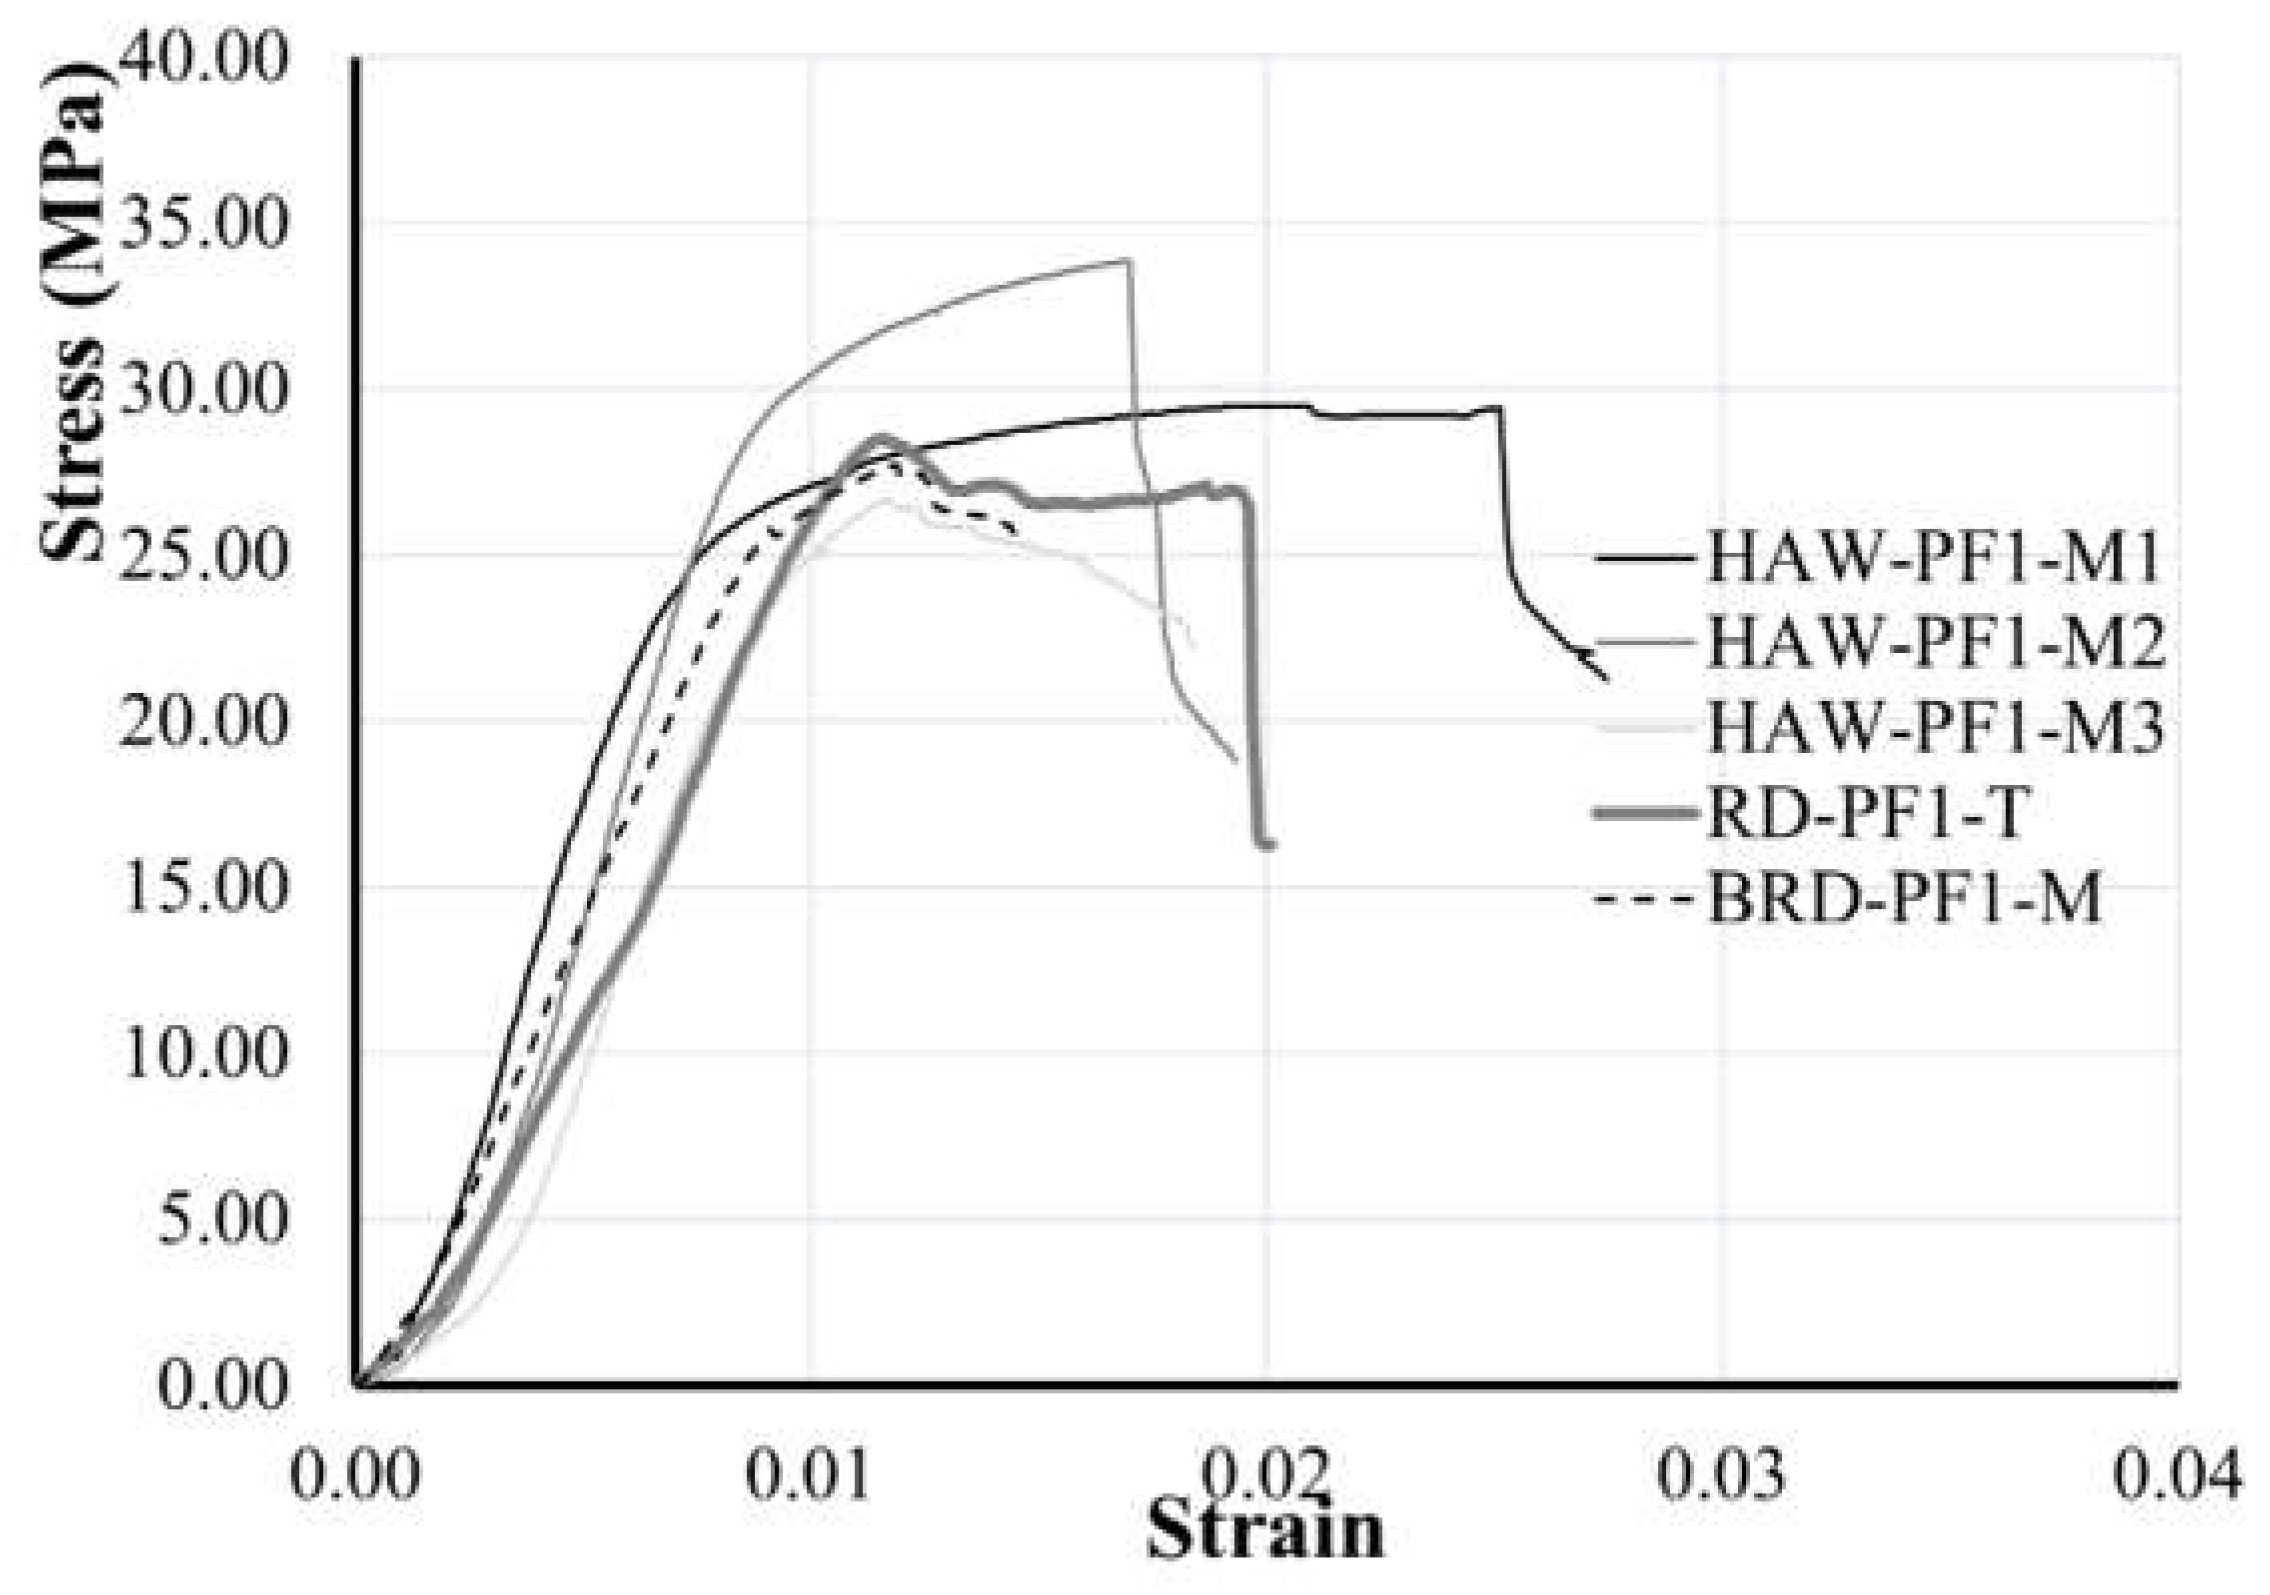
The effect of the LCBC configuration is discussed in this section. The compressive stress versus strain behavior for slender specimens produced with BE2 and PF1 resin matrices including all cross-sectional configurations proposed for the LCBC columns are presented in
Figure 9 and
Figure 10, respectively. For these resin matrix series, only the specimens made with Moso bamboo were considered here to minimize the test parameter to the effect of cross-sectional configuration. In the absence of the results of RD-BE2-M specimen, the results of RD-BE2-T are provided for comparison purposes. The compressive stress versus the longitudinal strain in members made with all proposed LCBC configurations with BE2 resin and Moso bamboo is presented in
Figure 9.
For the specimens made with BE2 resin,
Figure 9 shows that the specimen with SCR configuration achieves the highest compressive strength at 60.34 MPa. The compressive strengths of three identical HAW specimens (M1, M2, and M3) are reported as 46.15 MPa, 46.83 MPa, and 50.25 MPa. The BRD configuration had the lowest compressive strength at 28.83 MPa. A greater bamboo content in BRD configuration, compared to other configurations, had an adverse effect on the mechanical properties of the LCBC member. The compressive strength of Moso bamboo used in this study is 69.90 MPa, which is lower than that of BE2 resin at 94.30 MPa. Consequently, the bamboo component fails before the BE2 resin in an LCBC member, and the higher bamboo content in the BRD configuration adversely affects its mechanical properties. The abrupt decrease in load bearing (brittle failure) can be seen in all specimens. The brittle failure commonly associated with buckling can be seen by the abrupt drop after the ultimate strength is reached for the slender samples. The softening region can not be observed despite what has been reported for stocky specimens elsewhere (see [
10]).
Figure 10 illustrates the compressive behavior of specimens with different cross-sectional categories made with PF1 resin matrix. As can be seen in
Figure 10, the HAW-PF1-M2 configurations reached the greatest compressive strengths of 33.98 MPa. The results for HAW-PF1-M1 and M3 are obtained equal to 29.52 MPa and 26.71 MPa, respectively.
The HAW specimens in PF1 series exhibit strain hardening before abrupt failure in both HAW-PF1-M1 and HAW-PF1-M2.
4.3. Resin Matrix Effect
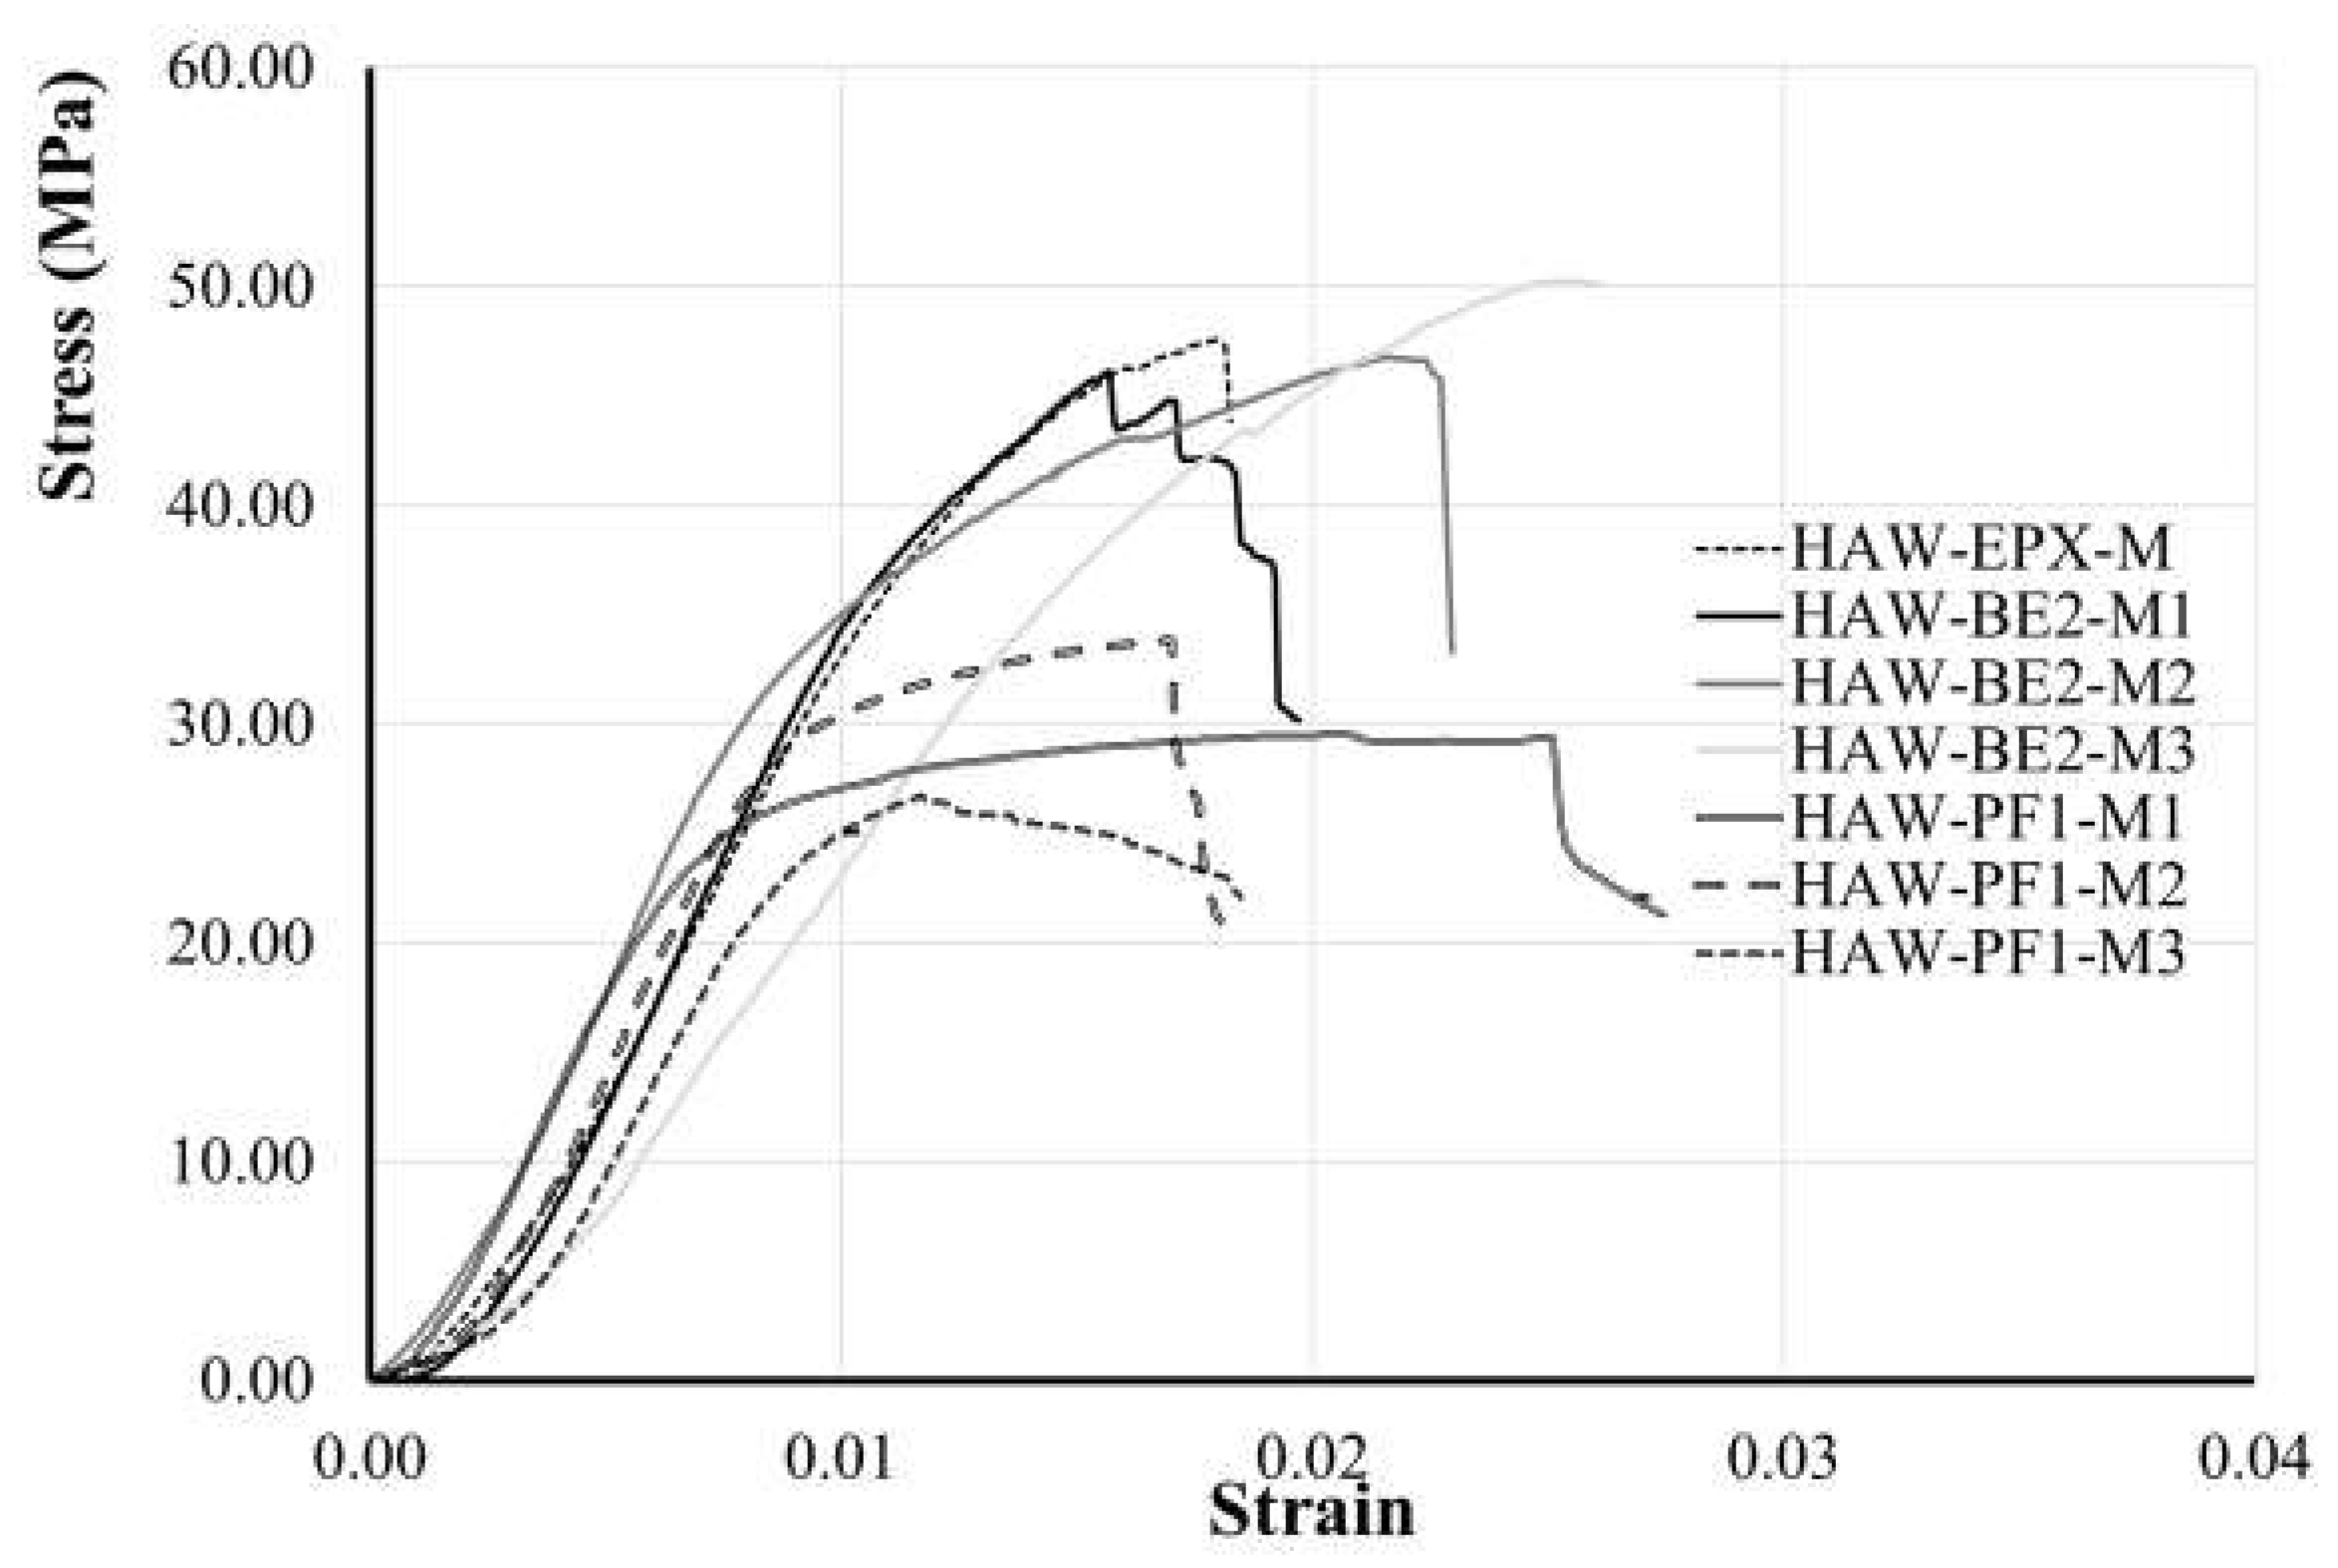
The effect of the resin matrix used to produce the LCBC slender columns can be observed when reviewing the compressive behavior of HAW specimens made with Moso bamboo. Three different resins have been used to fabricate these specimens including EPX, BE2, and PF1. The compressive stress versus axial strain of all specimens with HAW configuration is presented in
Figure 11.
The specimens made with synthetic epoxy (HAW-EPX-M3) reached the compressive strength of 47.60 MPa which is comparable to the results of the three specimens made with BE2 (BE2-M1, BE2-M2, and BE2-M3) with 46.15 MPa, 46.83 MPa, and 50.25 MPa, correspondingly. The specimens made with PF1 resin (HAW-PF1-M1 to M3) reached 29.52 MPa, 33.98 MPa, and 26.71 MPa, respectively, which is impressive for a LCBC column made with 100% naturally resources components. These are promising results with respect to the use of bio-epoxy and PFA resin instead of synthetic epoxy.
The potential for EPX resins to fracture into multiple pieces was initially predicted during testing of the resin components, highlighting the brittle failure observed here. In contrast, PF1 resin exhibited highly ductile behavior, with specimen HAW-PF1-M1 showing a prolonged plateau phase.
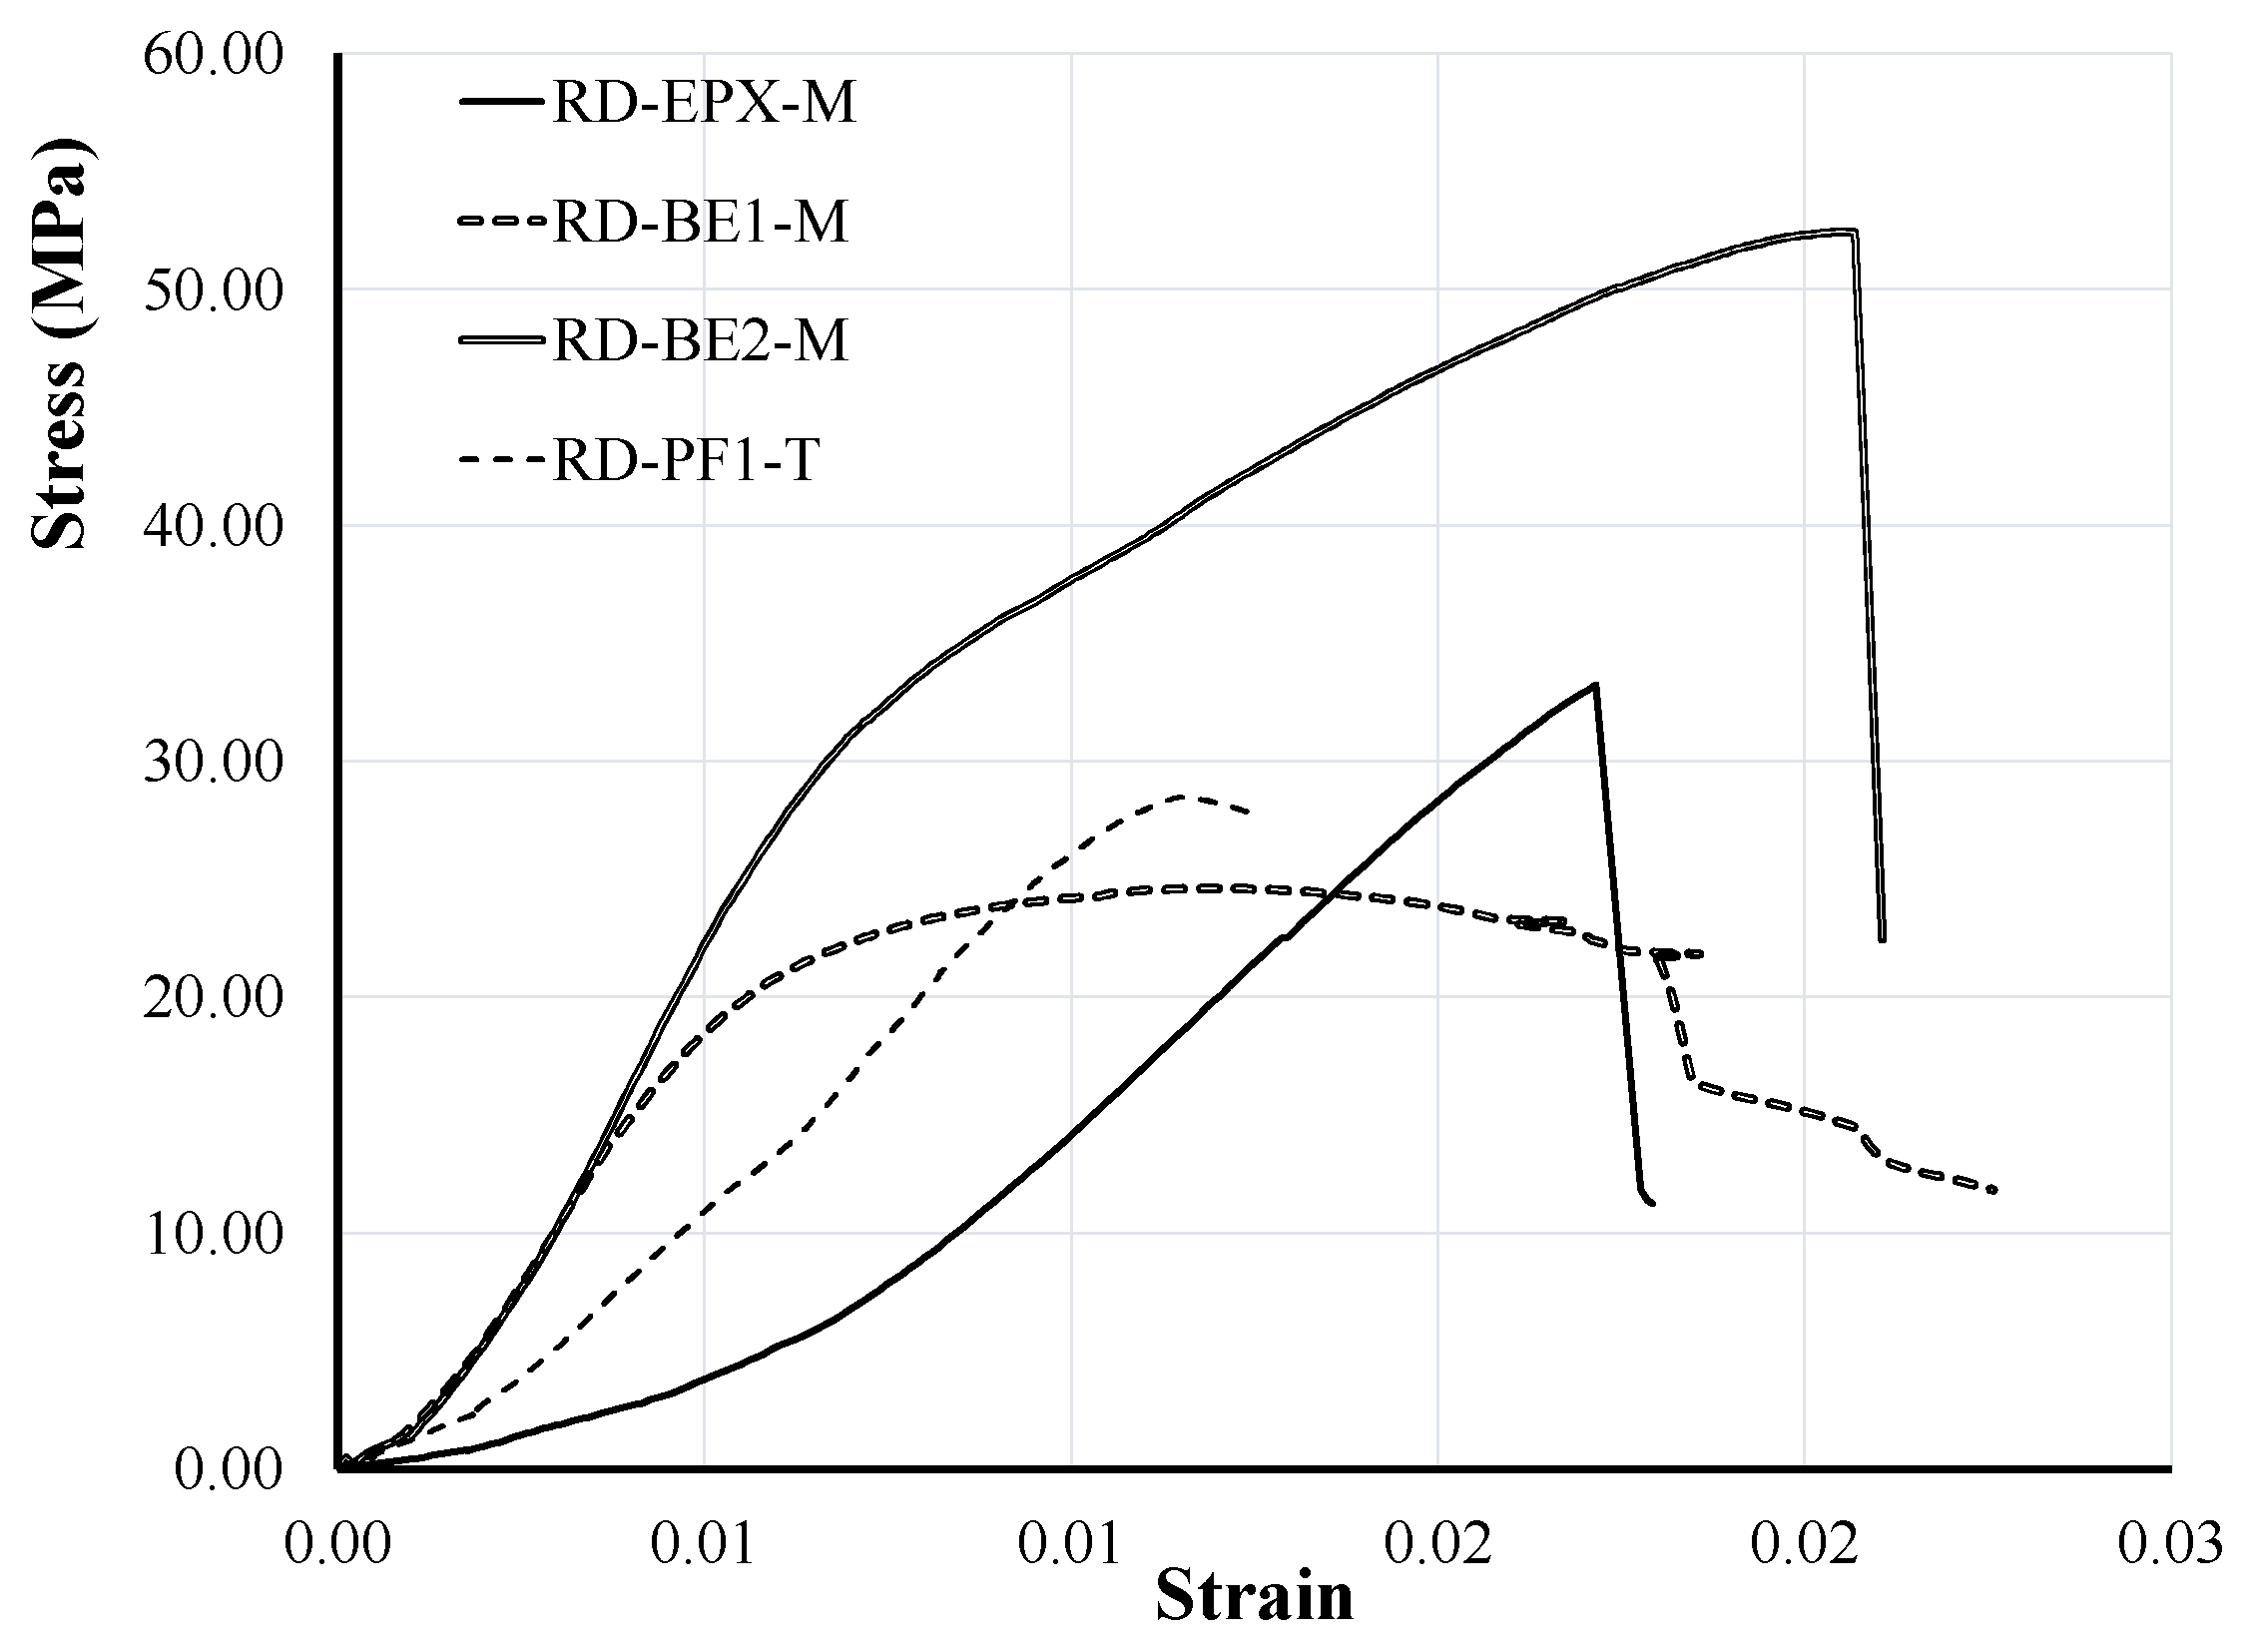
Figure 12 illustrates the compressive behavior of RD series specimens made with EXP, BE1, BE2, and PF1 resin matrices using Moso bamboo (except for RD-PF1-T).
Similar to the HAW series, the specimens made with bio-epoxy (RD-BE2-M) achieved higher compressive strength (52.47 MPa) compared to the specimens made with EPX, BE1, and PF1 with compressive strengths of 33.26 MPa, 24.73 MPa, 28.50 MPa, respectively. After reaching the maximum load the abrupt failure is observed at the specimen with BE2 resin while, similar to the HAW-PF1-M specimens, softening is observed for specimen with RD specimen made with BE1 and PF1 resin. Testing results for the BE2 resin show the appearance of cracks and a transition to brittle failure with no load recovery and low ductility for the RD-BE2-M sample, as depicted in
Figure 13. Conversely, the analysis of the local strain of PFA-based resin shows a longer interval between serviceability and ultimate failure, with more evidence of cracking (see
Figure 13). The less brittle behavior of the PF1 resin leads to a rather ductile failure of the RD-PF1-T specimen.
4.4. Failure Modes
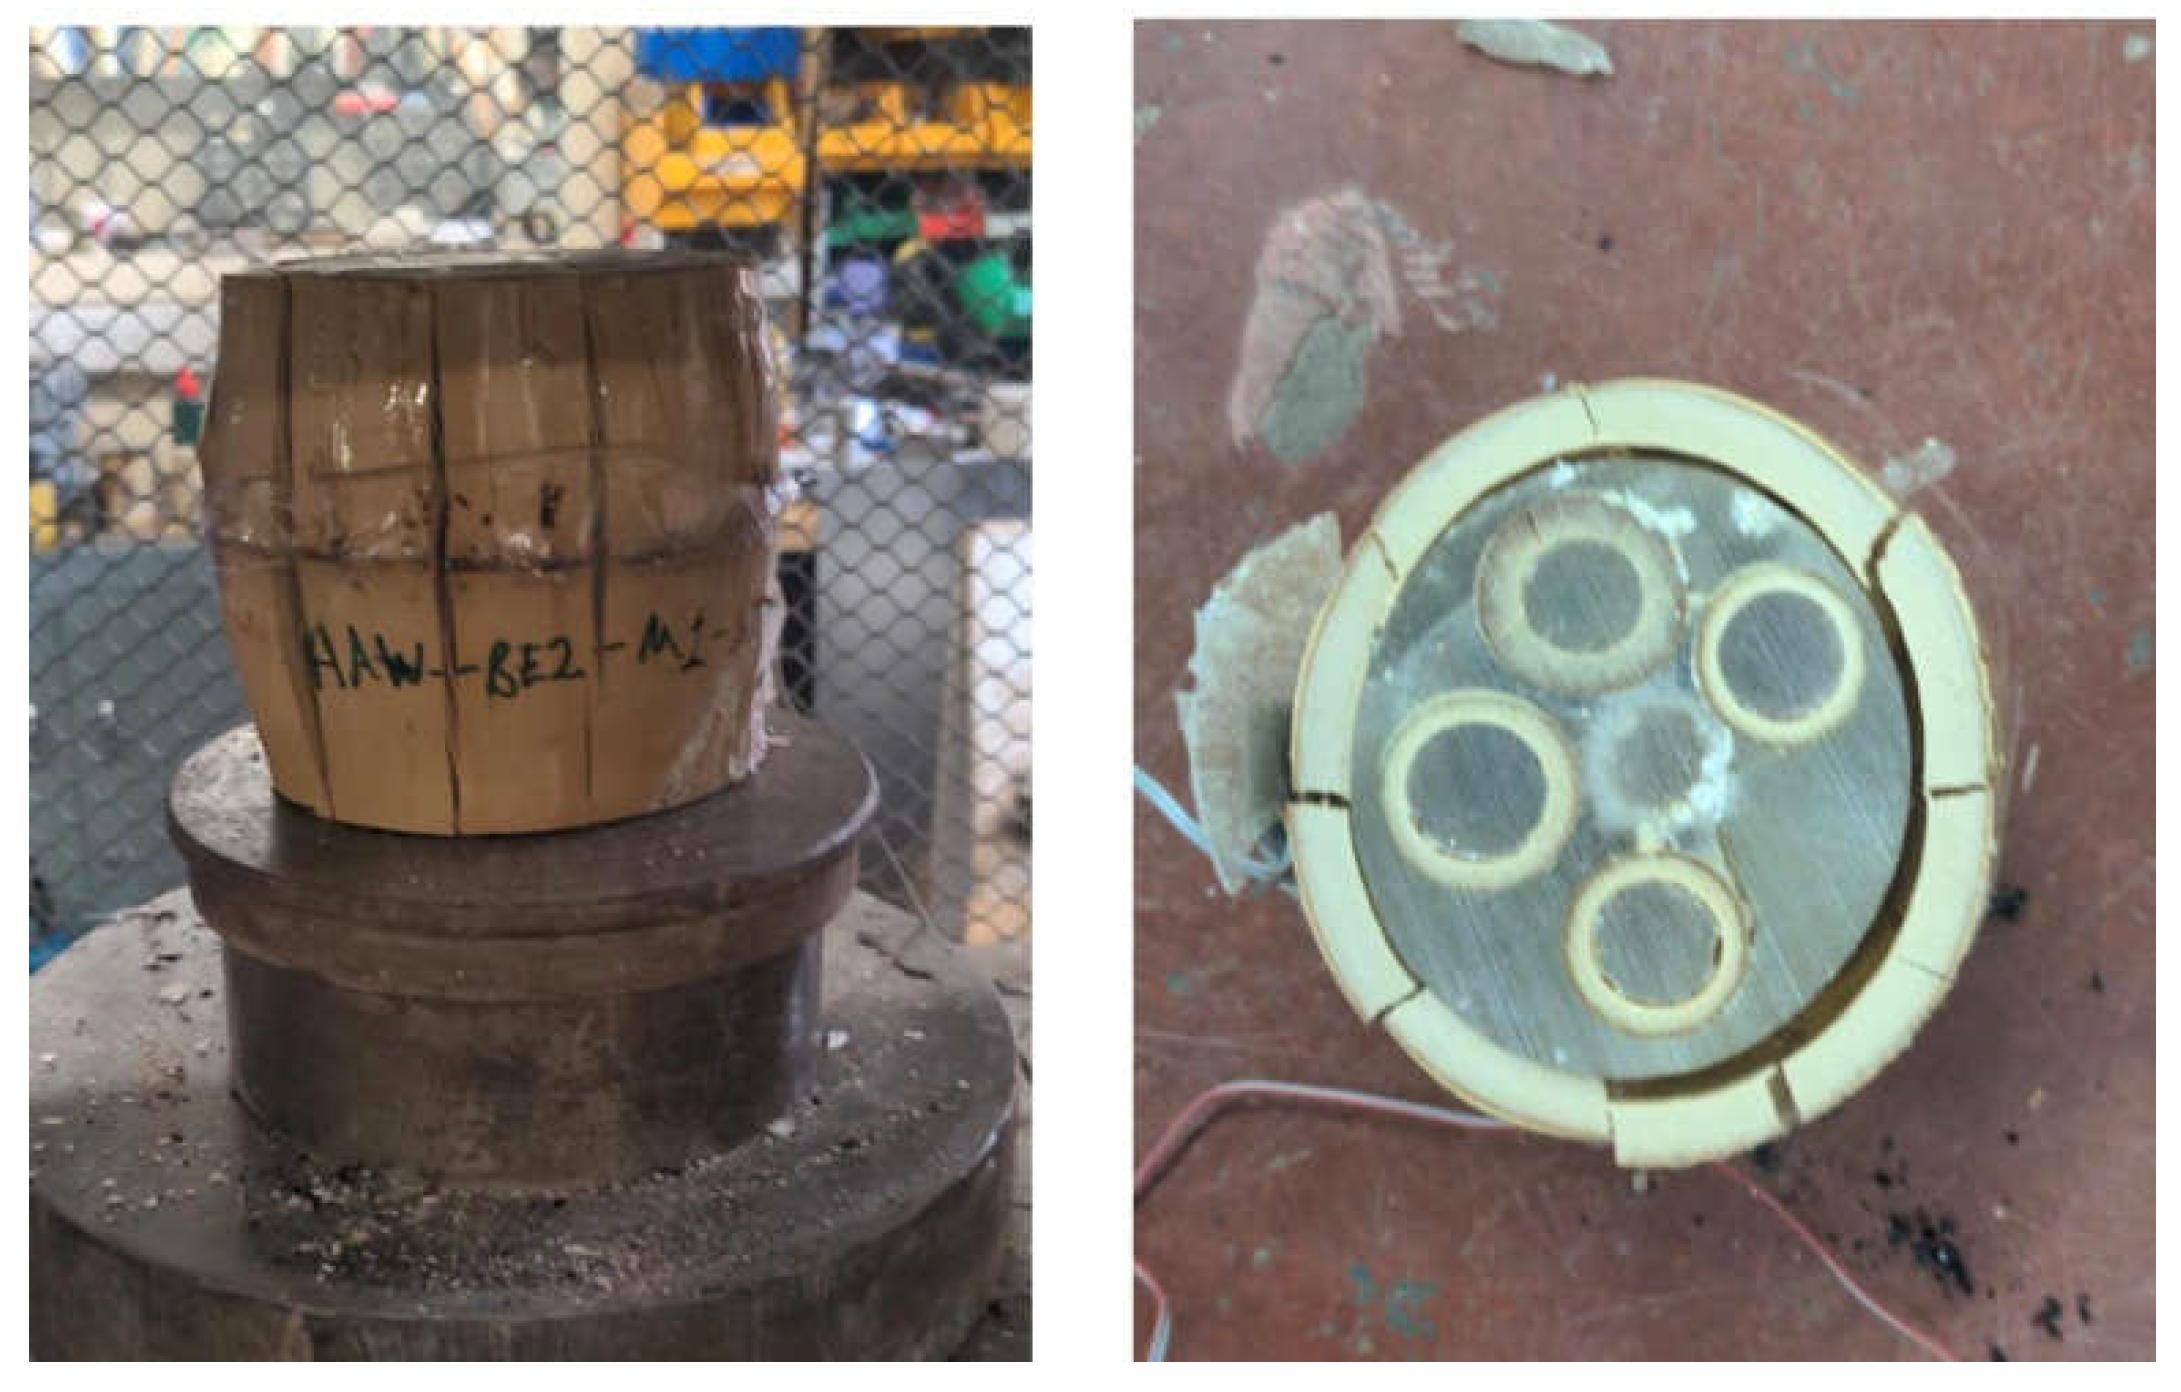
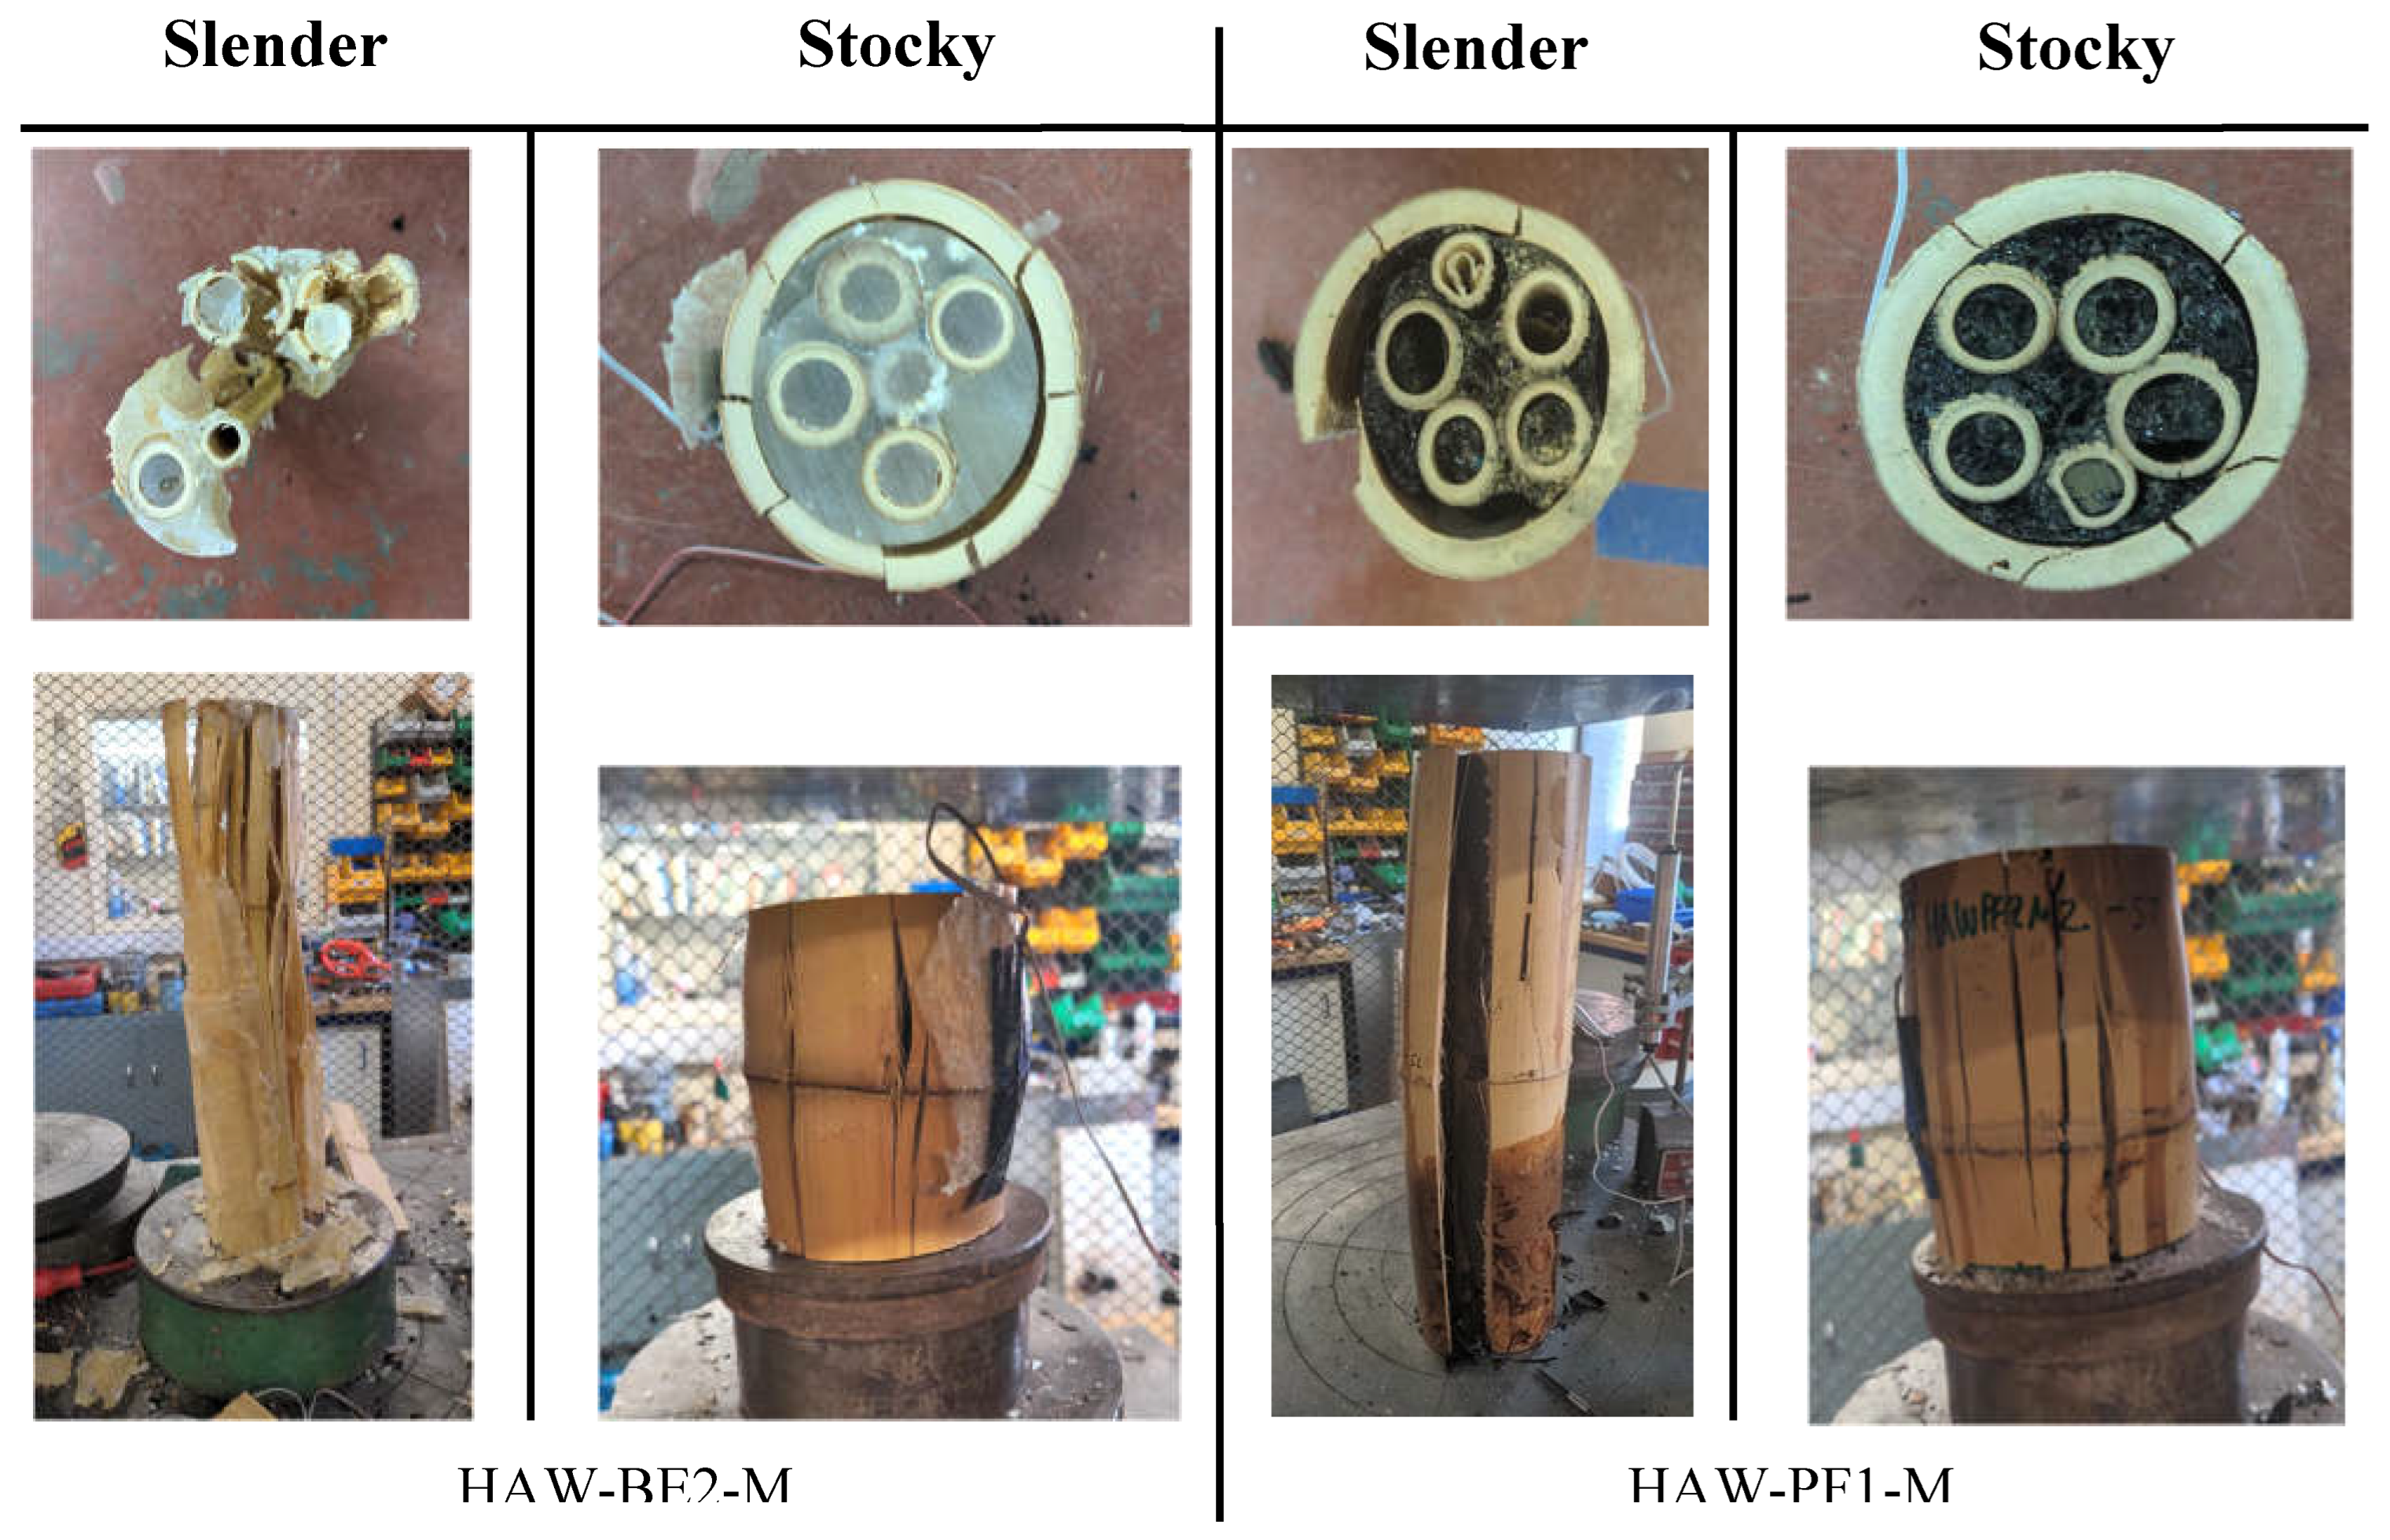
Figure 13 presents the failure and post-failure behavior of two specimens, one stocky and one slender, from HAW-BE2-M and HAW-PF1-M. The matrices do not display a large amount of cracking in stocky specimens. This has been concluded as indicating a composite action and stress distribution. Alternatively, the slender samples display noticeable buckling behavior characterized by significant lateral deformation. The impact of the brittle failures can be seen clearly in the HAW-BE2-M sample (
Figure 13) where the build up of pressure within the central core has resulted in major fracturing within the resin, resulting in the outer culm splitting into several pieces. The outer culm came apart from the central matrix section leaving the inner culm exposed, the fragmented debris from the resins can be seen in
Figure 13.
Conversely, the PF1 specimen experienced more ductile failure, as evidenced by the resin section and outer culm not splitting into numerous pieces. As observed in
Figure 11, this is due to the slightly longer period of inelastic deformation for PF1 sample before failure compared to the BE2 sample.
4.5. Bamboo Species Choice
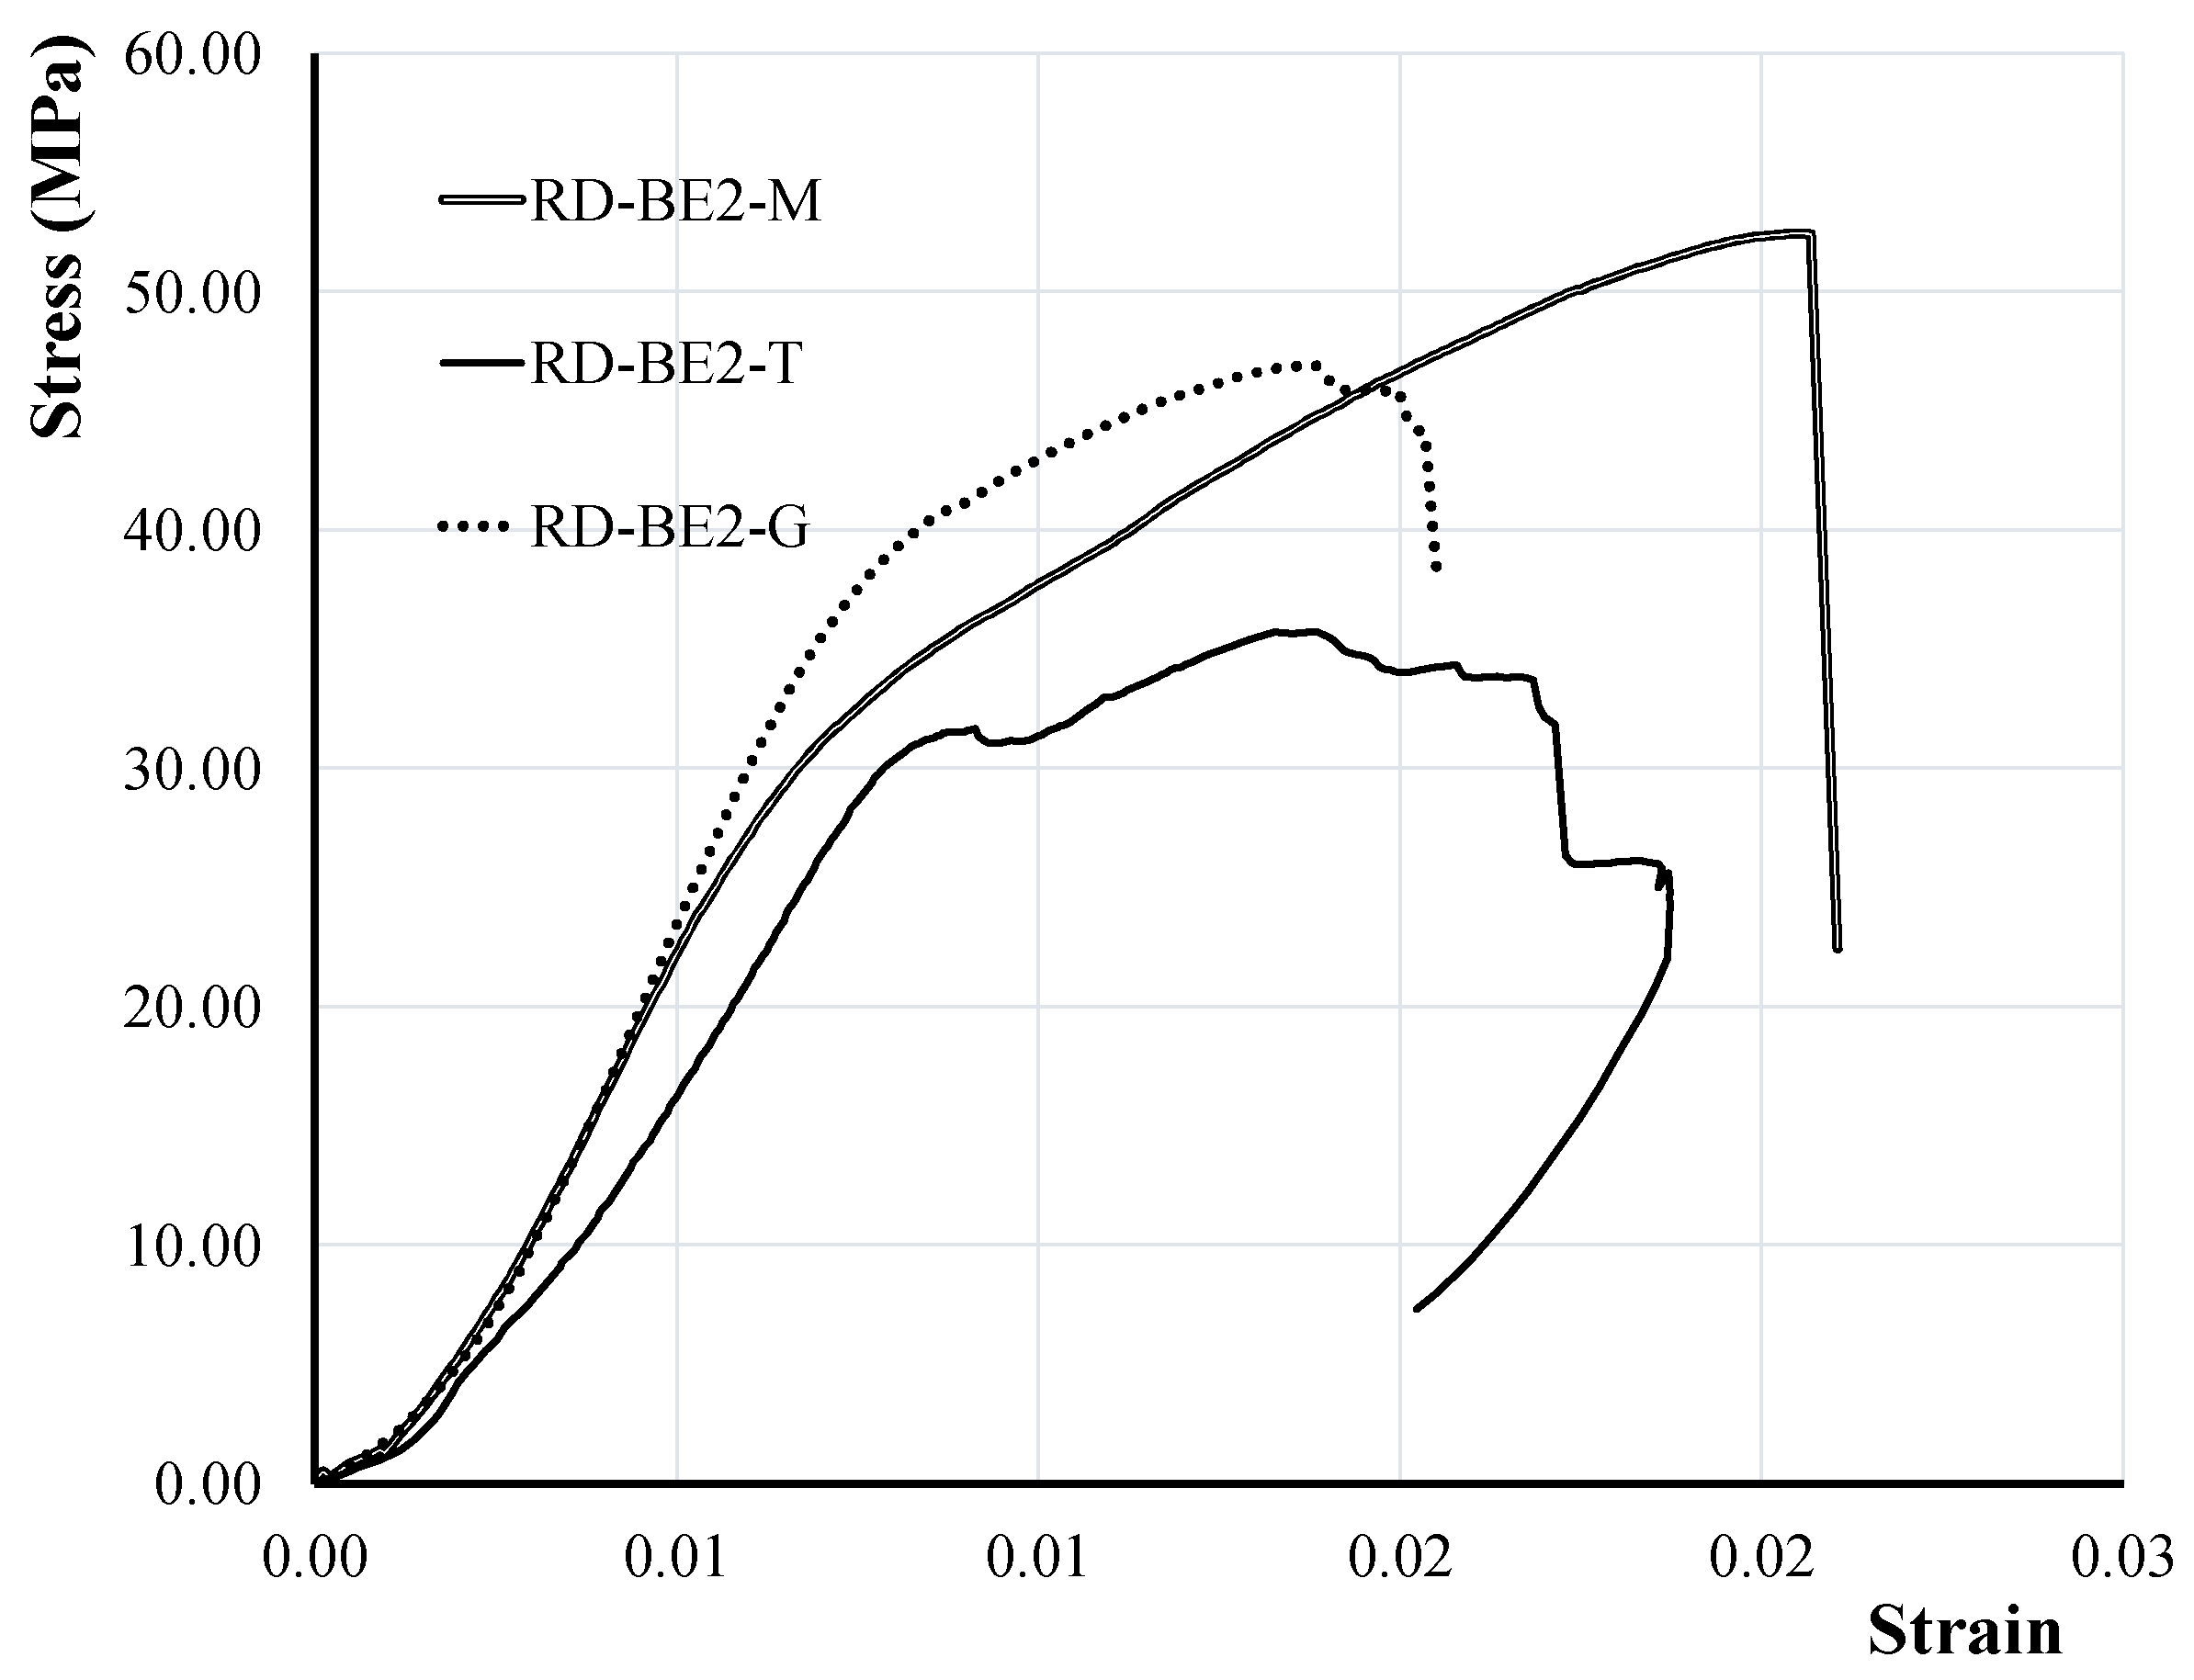
The effect of the bamboo species on the behavior of the different LCBCs can be observed in the behavior of specimens in the RD series.
Figure 14 reveals the compressive behavior of specimens with RD configuration and identical resin matrices made with Moso, Guadua, and Tali species.
When comparing the compressive behavior of RD-BE2-M, RD-BE2-T, and RD-BE2-G specimens, it can be seen that the specimen with Moso bamboo reached an impressive strength of 52.47 MPa, closely followed by the specimen made with Guadua with 47.01 MPa. The specimen made with Tali bamboo failed at the compressive stress of 37.18 MPa. When it comes to the stiffness of the LCBC made with different species, the stiffest specimen was the LCBC made with Guadua species with a modulus of elasticity of 6.23 GPa followed by the Moso specimen with 5.15 GPa. The specimen made with Tali species reached 4.41 GPa.
5. Numerical Study
The FEA software ABAQUS [
19] was implemented for modeling and analysis of LCBC columns under axial compressive loads. Using FEA to achieve a solution to a given problem has the benefits of not requiring access to potentially expensive laboratory equipment and being able to predict the results for the further experimental tests. Axial compression loads were applied numerically on the LCBC column models. The constitutive models which describe the behaviors of the constituent parts of the composite are formulated and given as input to ABAQUS. The buckling analysis of the specimens is conducted using static Riks analysis in ABAQUS. In addition, FEA is employed to analyze the stress-strain behavior, stress and strain at failure, maximum load, displacement, and failure behavior of the samples. The numerical FEA sample is made in HAW configuration from full culm small Moso bamboo, an epoxy matrix, and an outer giant bamboo culm.
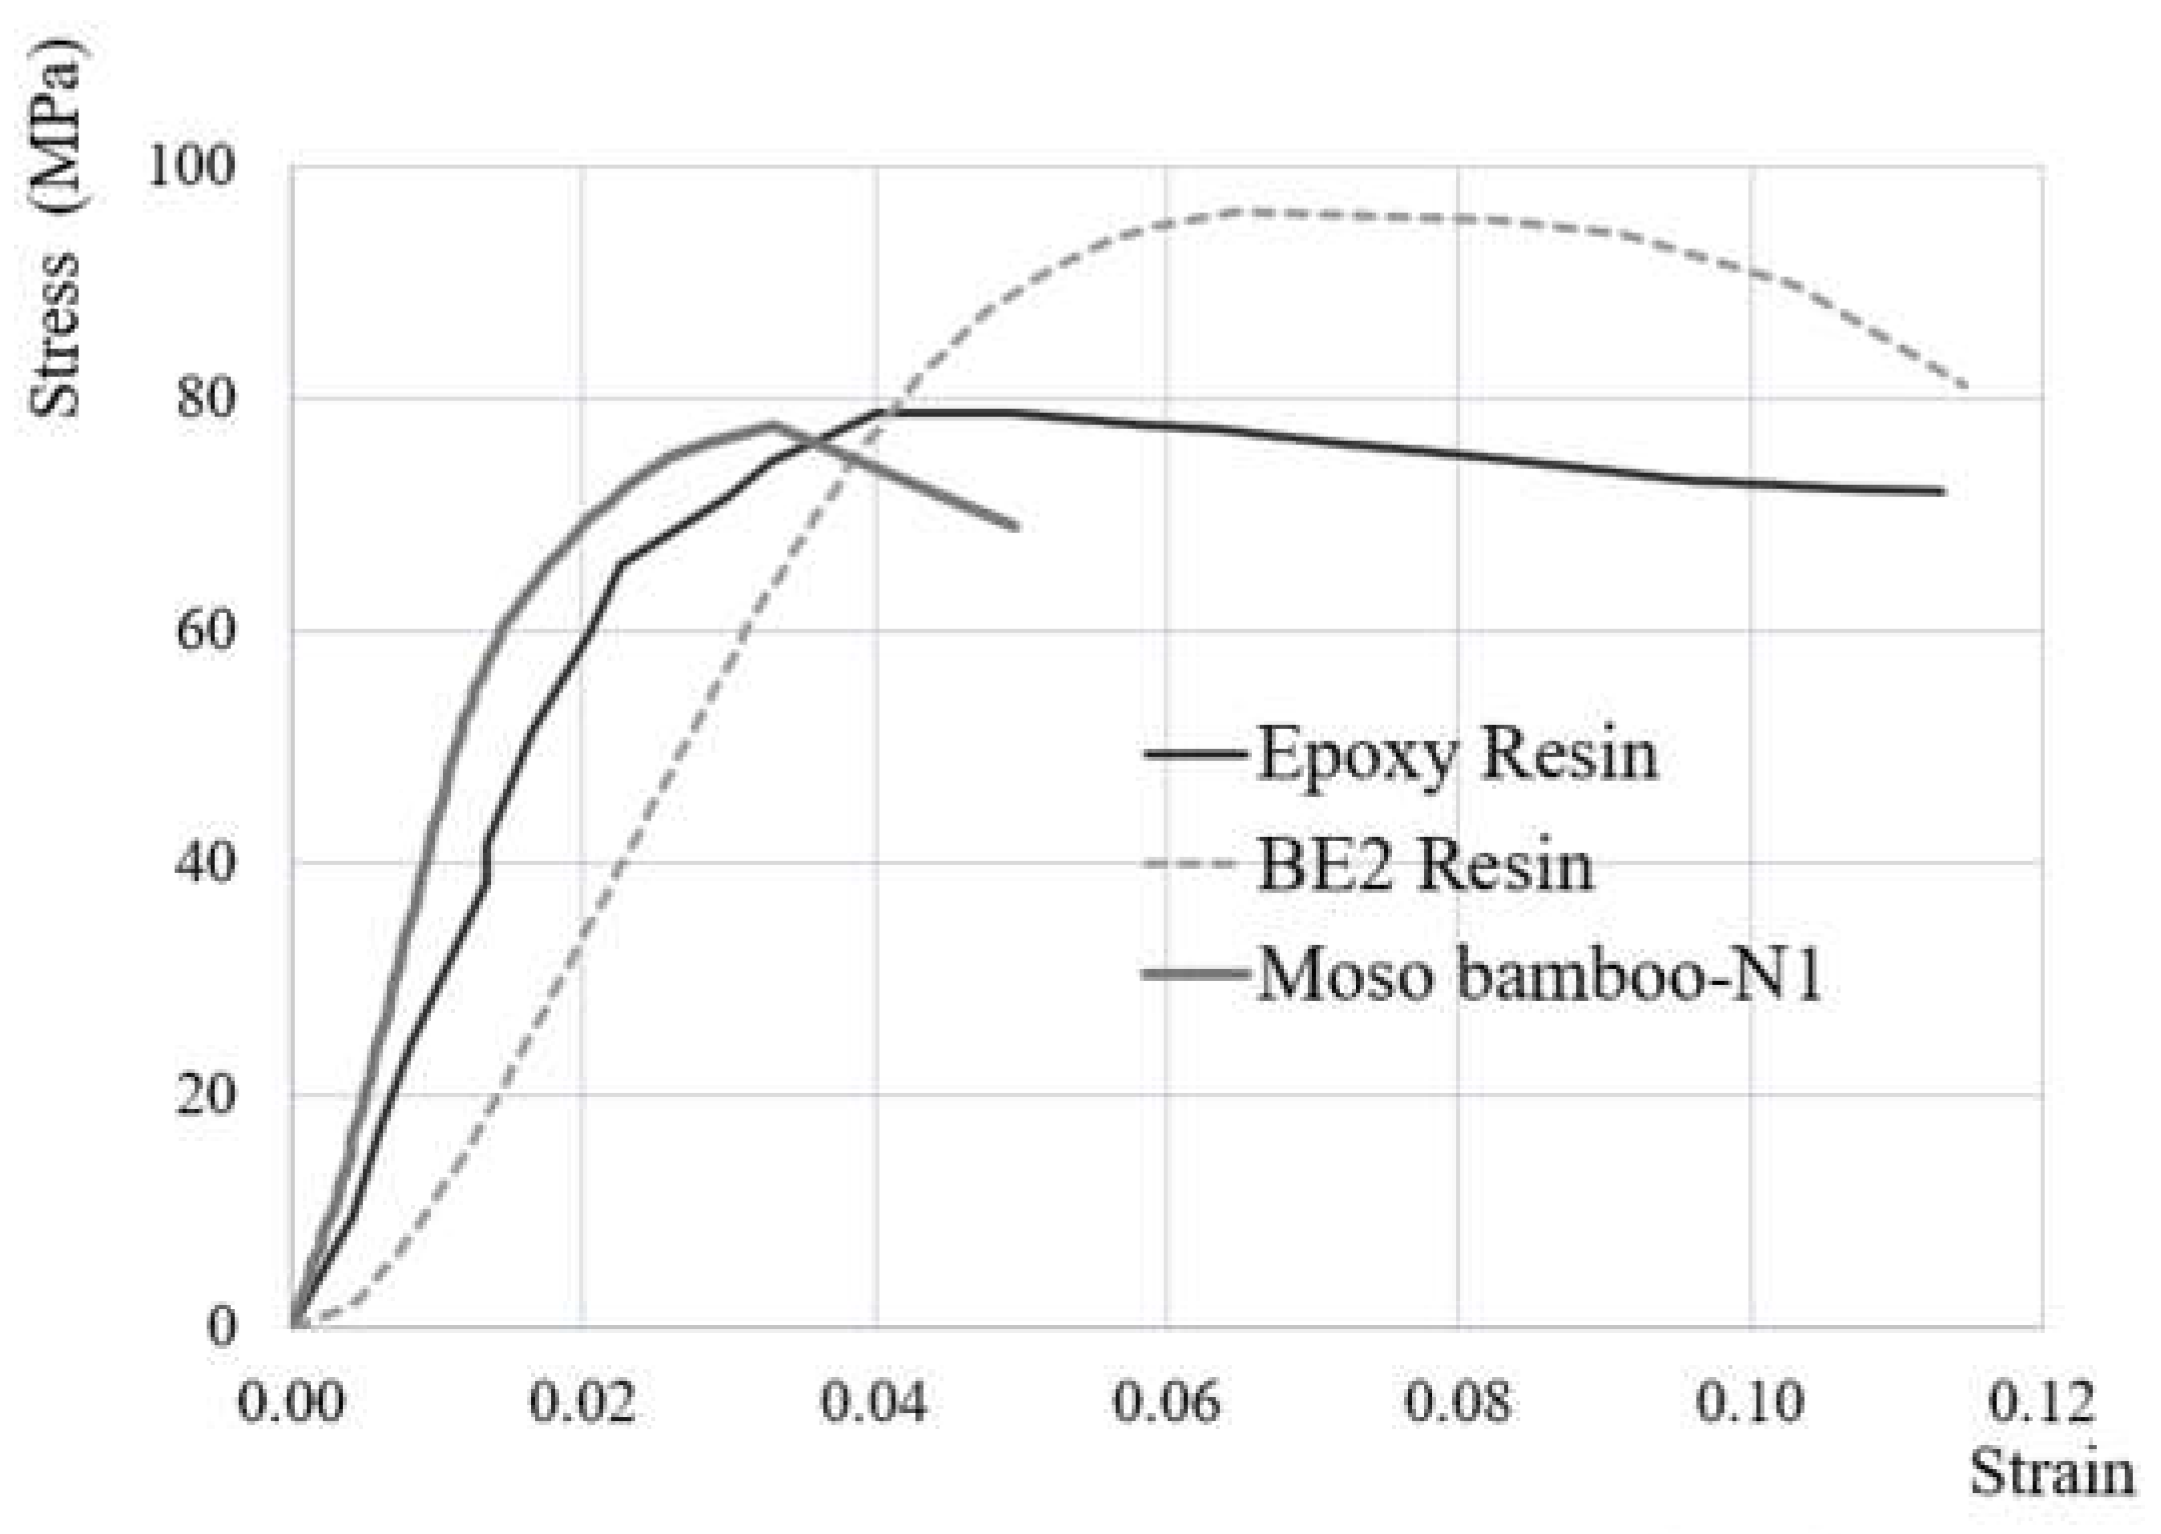
Input given to ABAQUS for the constitutive model of Moso bamboo (
Figure 15) displays nonlinear behavior, showcasing yielding, plastic deformation, and eventual failure (derived from experimental data, specimen N1 in [
9]). Furthermore, Poisson’s ratio for Bamboo and resin are set at 0.3 [
22] and 0.37 [
23].
The elastic and plastic material behavior for resins and bamboo incorporates isotropic features in the model. A ductile damage model is utilized for both bamboo and resin matrices. The model encompasses the assessment and assimilation of damage progression, encompassing fracture strain, stress triaxiality, and strain rate [
23]. Within this framework, bamboo fibres are integrated into resin matrices, while a tie constraint secures the resin to the external bamboo structure [
24].
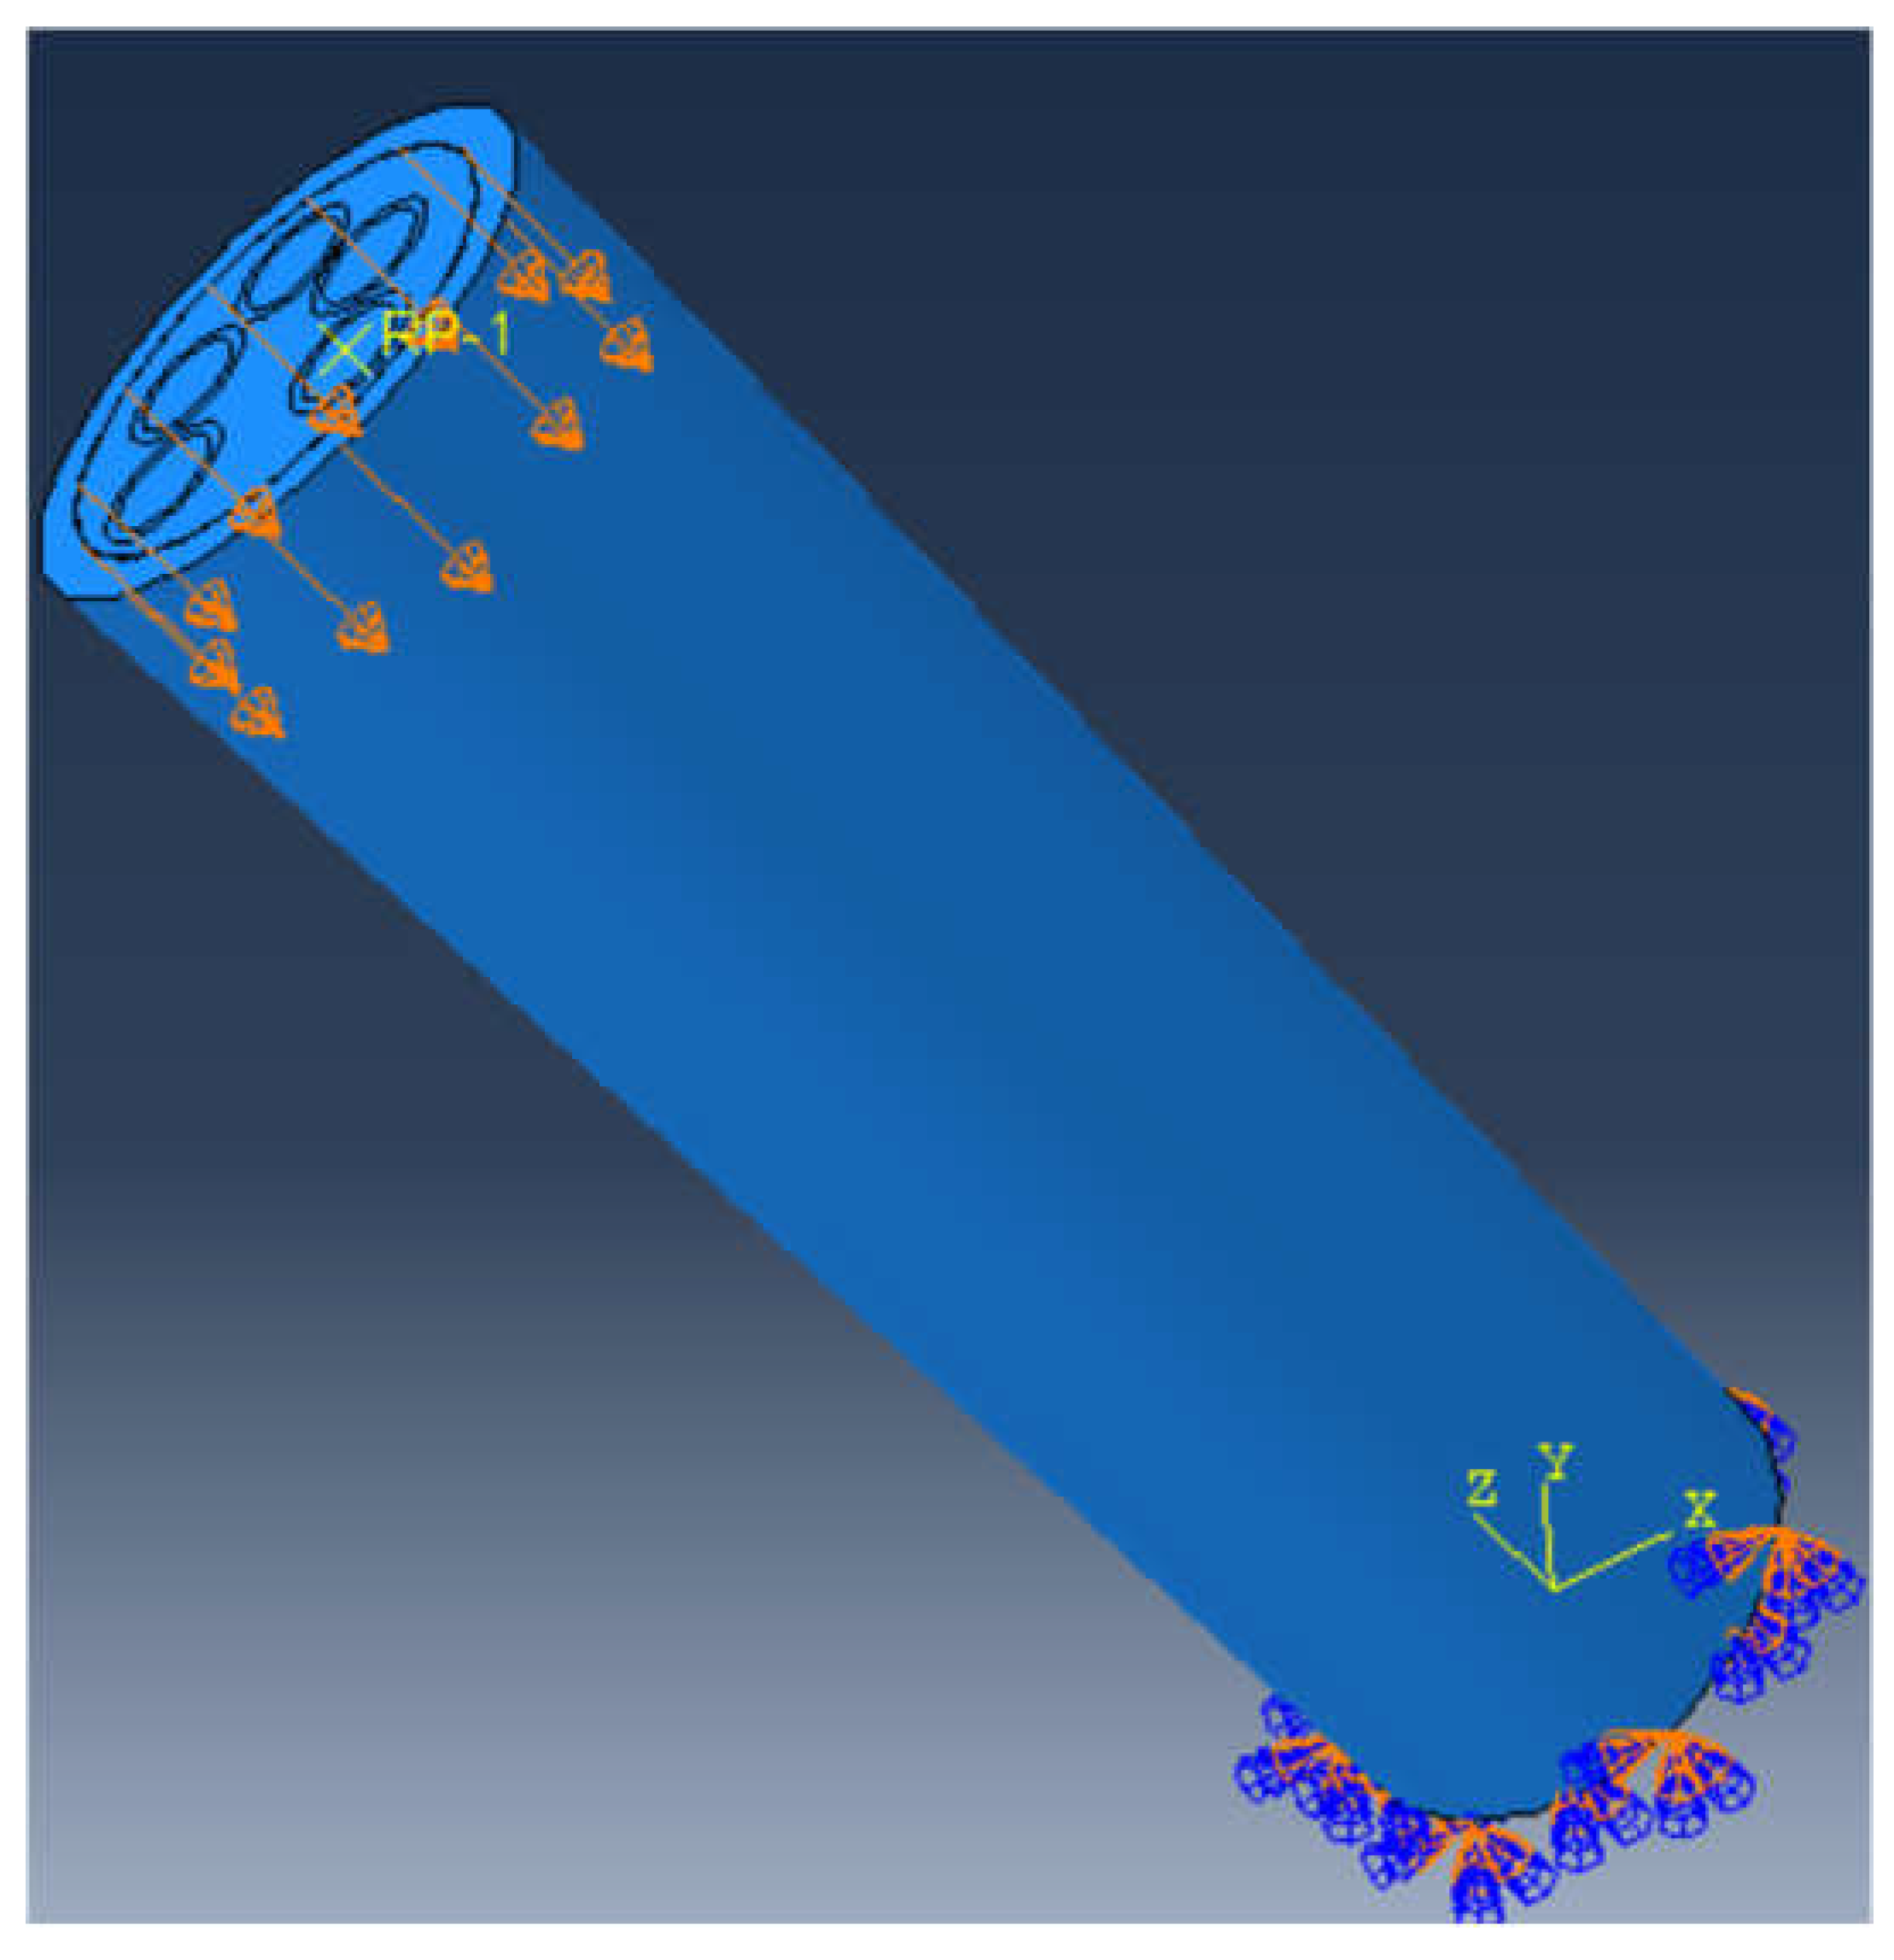
Given the geometry of the bamboo composite under examination, a three-dimensional FEA was conducted in this study (
Figure 16). Utilizing three-dimensional eight-node linear brick elements with reduced integration (C3D8R), the analysis ensured structural integrity by incorporating hourglass control. The H-version mesh refinement facilitated convergence of FEA outputs, with a strategy based on sensitivity analysis guiding the selection of 5 mm elements for finer resolution of column geometry and precise results.
The static-Riks method, applicable for non-linear analysis of the plastic behavior of Moso bamboo and epoxy, is better adapted to solve problems where large deformations before buckling can occur.
For non-linear analysis of plastic behavior of the LCBC columns with Moso bamboo and EPX resin, the static-Riks method is applicable. The static-Riks method, based on the modified Newton-Raphson algorithm, is well-suited for addressing problems involving large deformations [
23]. It effectively addresses complex load-displacement behaviors and abrupt failures during buckling analysis.
FEM results are calibrated to the test data to accurately depict buckling behavior at the failure point. This calibration helps optimize column design by identifying how these factors influence performance under load. To calibrate the FEM results to test data after performing a linear buckling analysis, the mode shapes associated with the lowest eigenvalues (the most critical buckling modes) are extracted and applied as initial imperfections to the column. After extensive trial and error, the optimal mode shape for each column is determined to be a combination of the first to third modes.
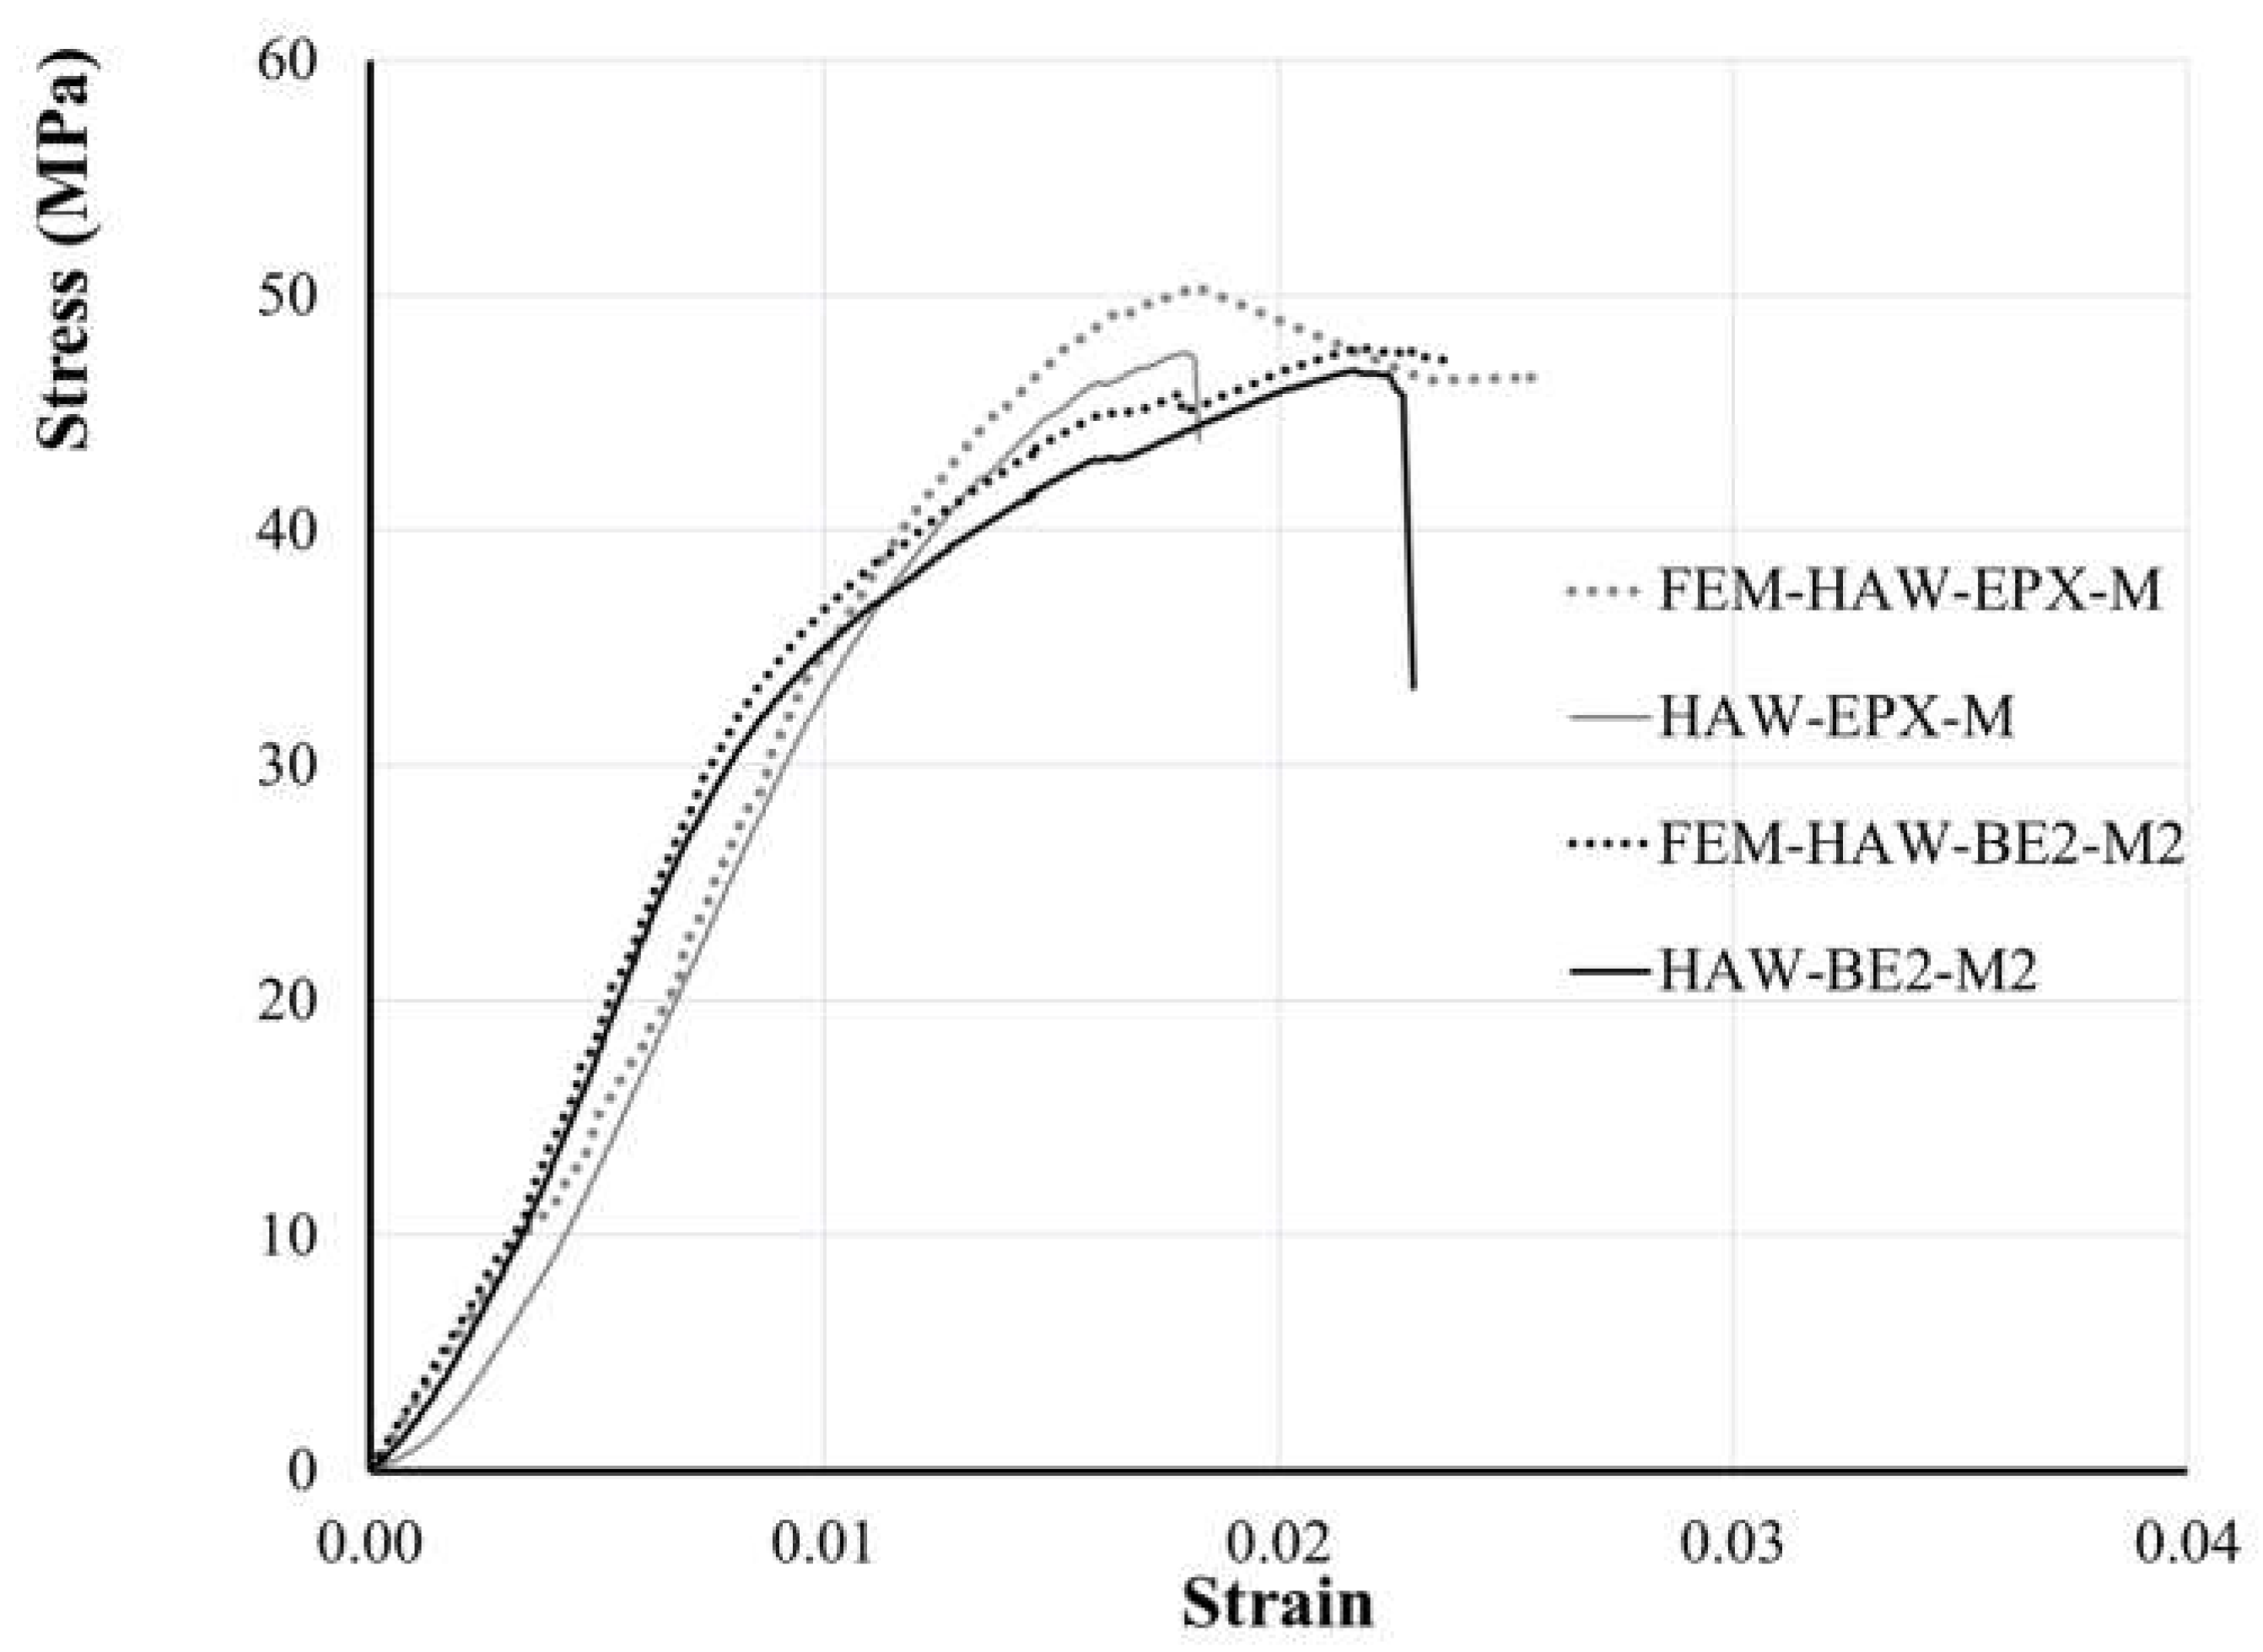
In the experimental testing of the HAW-EPX-M, the axial stress at failure was 48 MPa with an axial strain at failure of 0.018 (
Figure 17). The specimen modeled using the C3D8R elements gives results closest to the experimental values, with the maximum axial stress differing by only 2 MPa. The result is 50.00 MPa for the FEA output compared to the experimental result of 47.60 MPa. At failure, the axial strain of the model is 0.019.
To illustrate the effect of buckling, the axial load-displacement graph from the FEA of the HAW-BE2-M2 specimen is presented in
Figure 18. At the maximum load, the axial load and displacement are observed to be 384.6 kN and 8.64 mm, respectively.
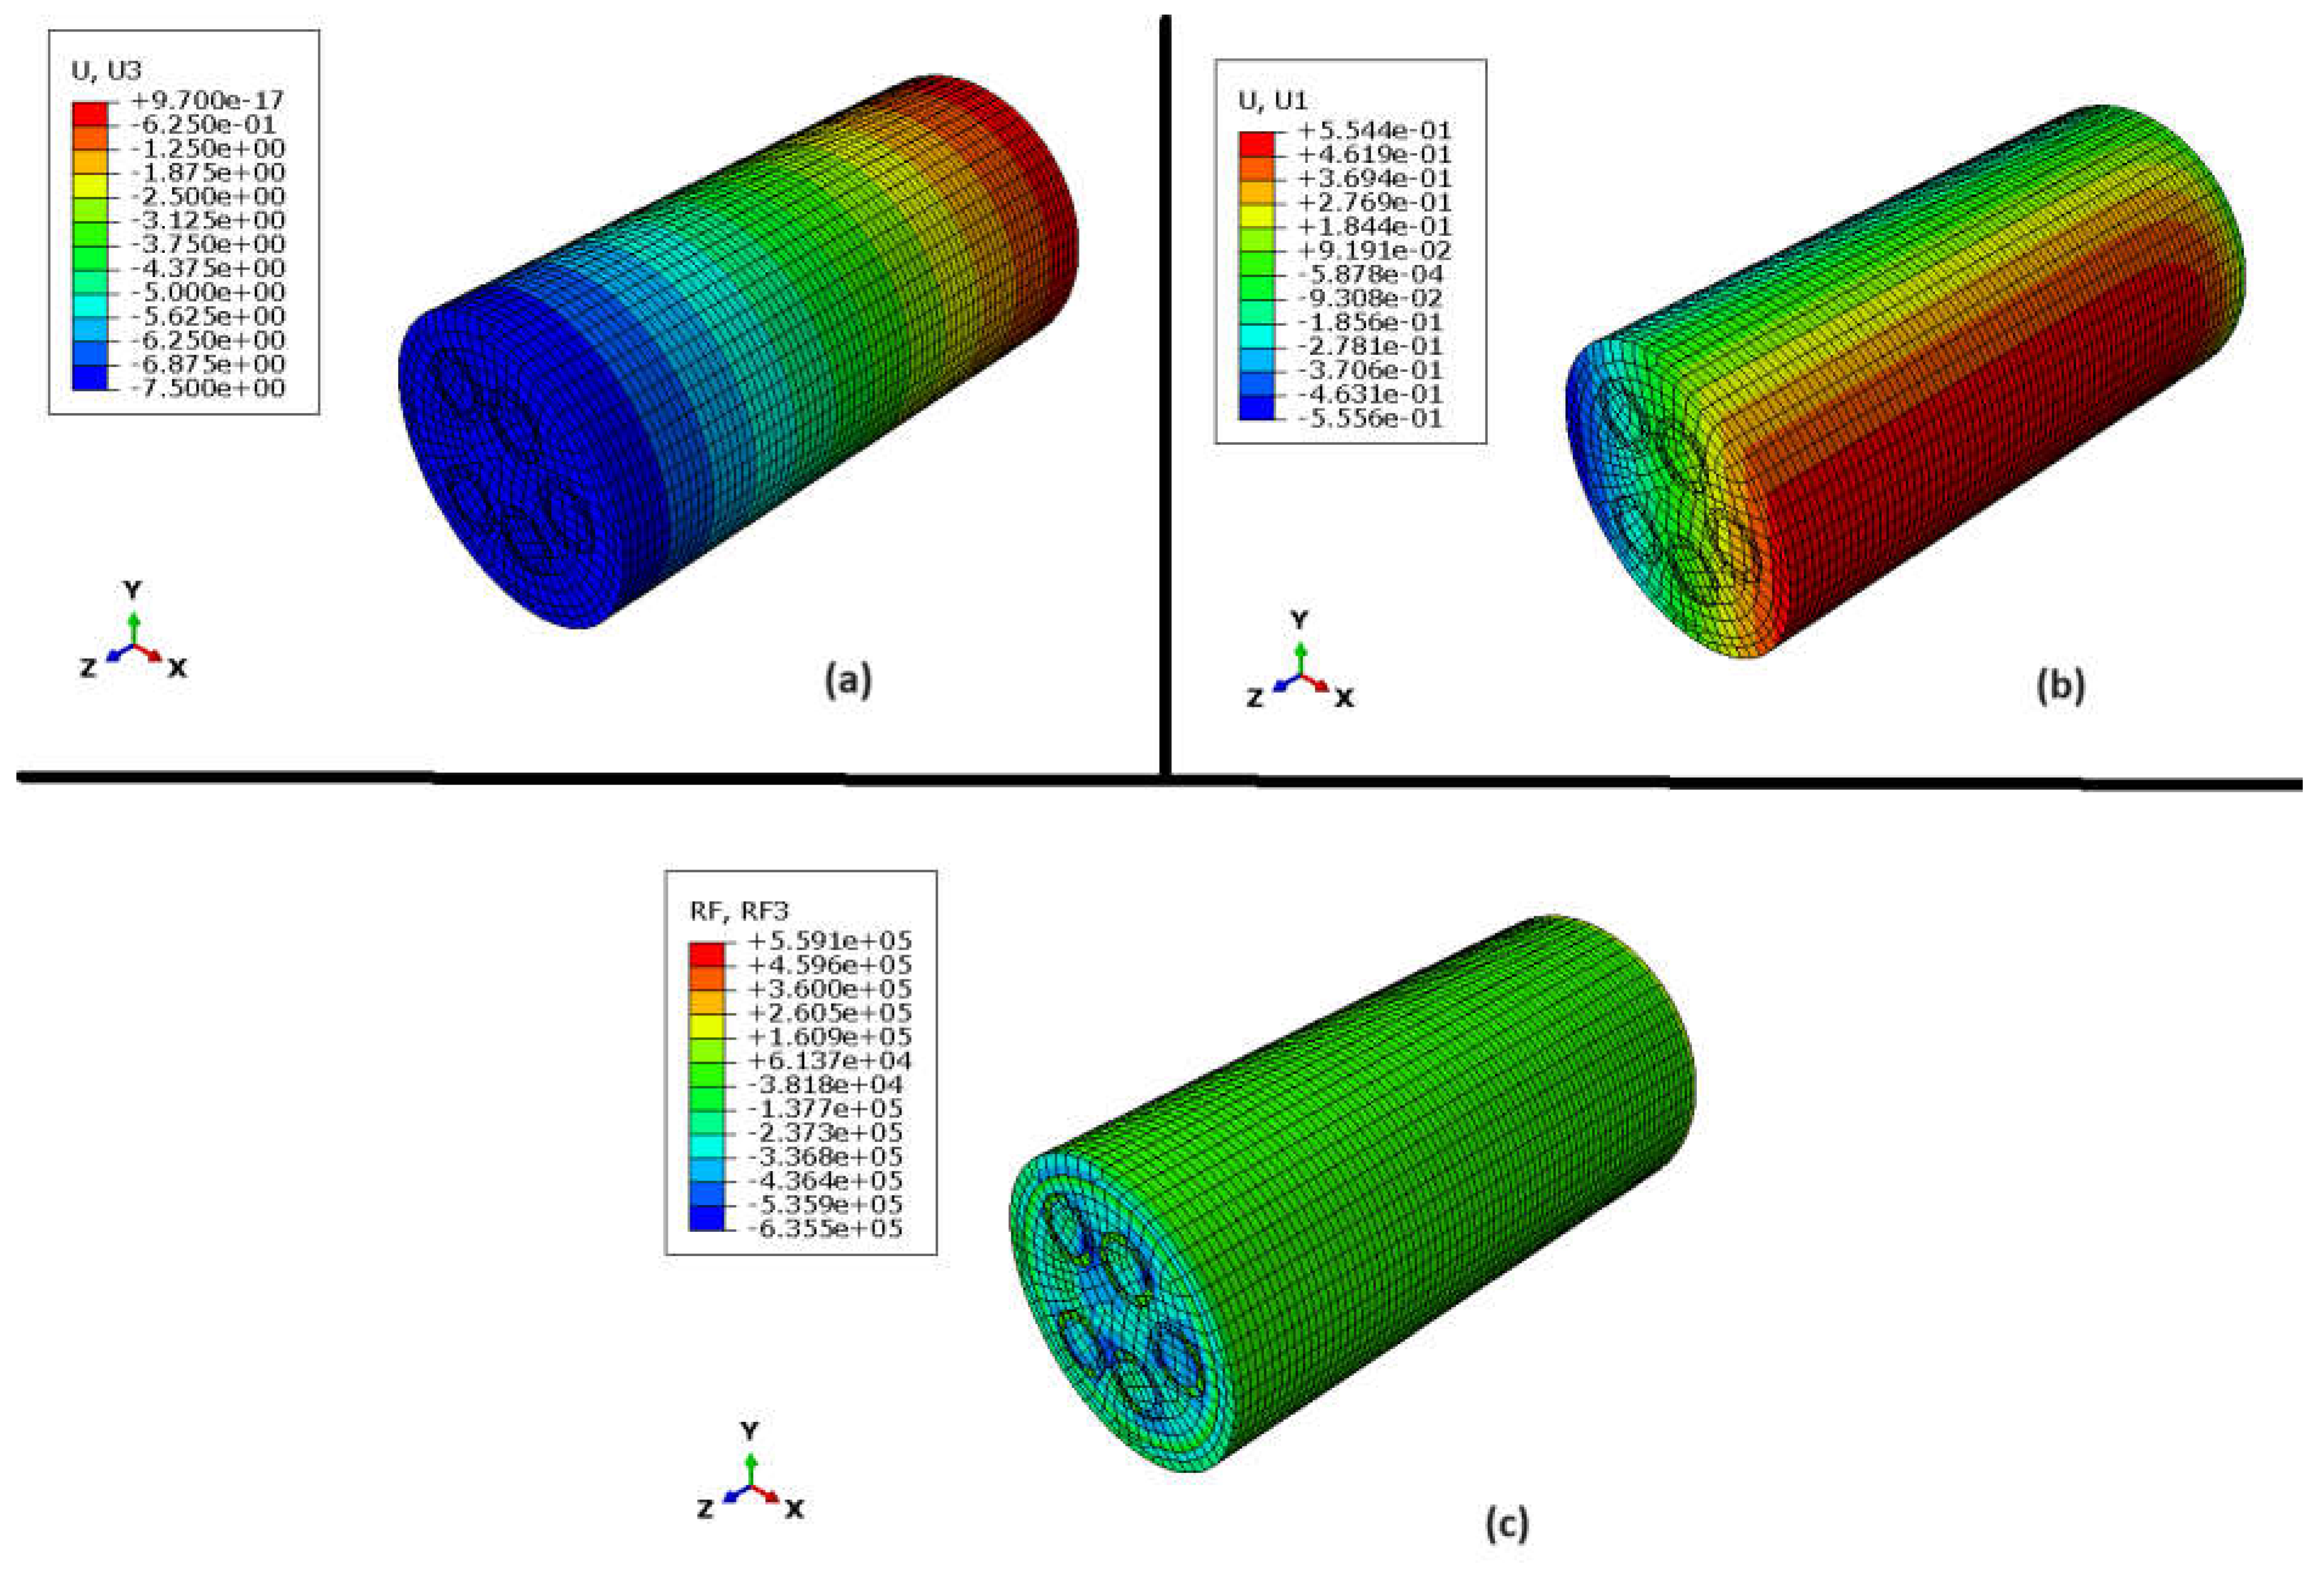
To illustrate the column’s buckling behavior,
Figure 19a, 19b, and 19c present the distributions of axial displacement at buckling, lateral displacement at buckling, and buckling load, respectively. The FEA results obtained demonstrate excellent agreement with the data from
Figure 18. The lateral displacement of the column visually represents its buckled shape. Axial displacement and load readings are measured at 7.5 mm and 390 kN, respectively, comparable to the test results of 8.64 mm and 385 kN.
Numerical Effect of Resin Content
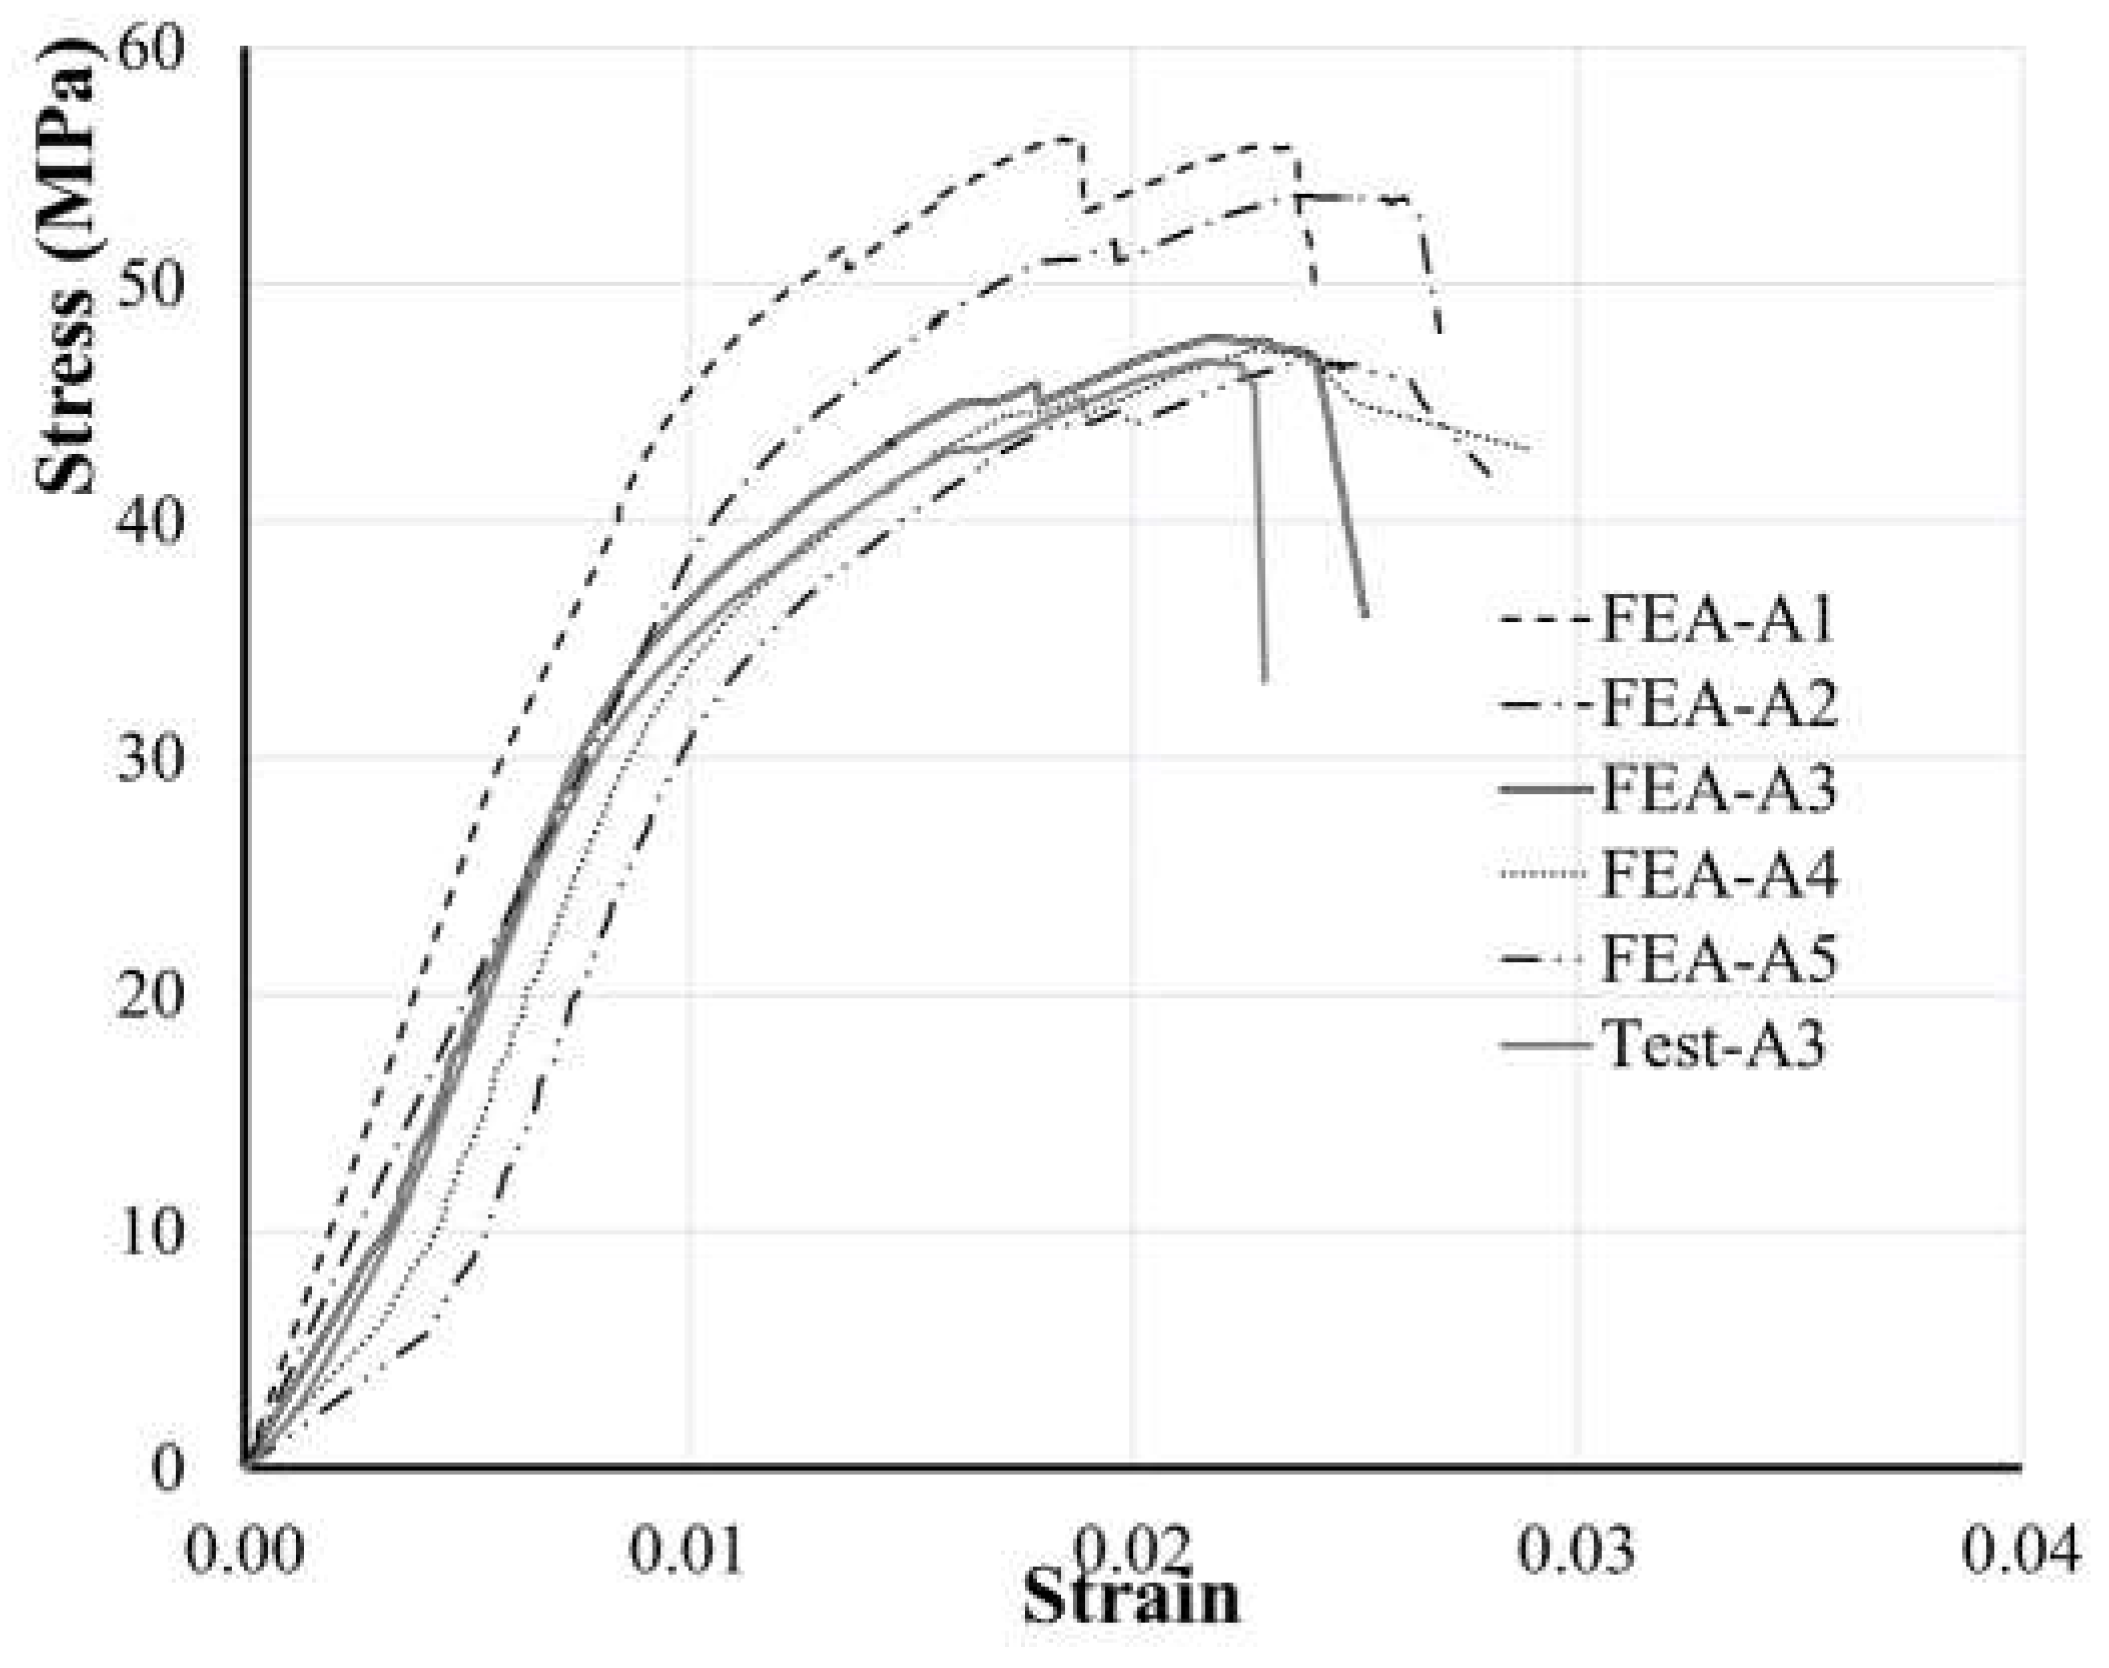
Resin content significantly influences the mechanical properties and durability of composites by binding reinforcing fibres. Optimizing the amount of resin ensures peak performance across various applications. Strict control over resin content is essential for maintaining consistent manufacturing quality. A parametric study was conducted to explore the impact of enlarging outer column dimensions while keeping thickness consistent, which affects cross-sectional areas and resin content in composites.
Figure 20 illustrates stress-strain graphs derived from parametric investigations that center on the resin content of HAW-BE2 columns. These graphs show how changes in the outer dimensions of the columns, while maintaining a constant column thickness, lead to different cross-sectional areas and consequently affect the compressive behavior of the LCBC columns.
The cross-sectional areas are denoted by indices A1 to A5, representing ratios of 1.2, 1.1, 1, 0.9, and 0.8 relative to the sample cross-section, respectively. Configuration A1 shows the highest resin content when the cross-sectional area is scaled to 1.2 times the current section.
A discernible trend is observed wherein the peak stress (buckling load) decreases gradually with increasing resin content. The peak stresses at the buckling are 55.73 MPa, 53.64 MPa, 48.60 MPa, 47.90 MPa, and 47.60 MPa for A1 through A5, respectively. In specimens with lower resin content, buckling occurs at lower stress levels but higher strains. The strains at buckling are 0.014, 0.015, 0.016, 0.018, and 0.019 for A1 through A5, respectively (see
Table 7).
The phenomenon of abrupt failure following peak stress is universally observed across all instances examined. Among the simulated cases, configurations A1 to A3 show a sharper reduction in strength compared to others, while A4 and A5 exhibit a more gradual failure. The greater bamboo content in A4 and A5 leads to gradual failure after buckling. As seen in
Figure 13, the gradual failure after the peak load is more evident in bamboo compared to BE2 resin.
Additionally, the initial stiffness of the column, indicated by the gradient of the initial linear segment, decreases with reduced resin content. The stiffness values for A1 through A5 are 3.61 GPa, 3.16 GPa, 2.80 GPa, 2.44 GPa, and 2.40 GPa, respectively (
Table 7), where r is the radius of the LCBC sample and t is the wall thickness of the cast-in-place giant bamboo.
6. Conclusions
Through this study the buckling behavior of LCBC columns has been evaluated. Four different cross-sectional configurations, including HAW, BRD, RD, and SCR were proposed to be manufactured with bio-epoxy (BE2), furan-based (PF1), and synthetic epoxy (EPX) resins, in addition to a soft experimental filler (BE1) resin. Experimental compressive strength testing was conducted and was used to demonstrate the mechanical properties and load bearing behaviors of columns. Numerical analysis using ABAQUS software predicted the compressive capacity of the columns with varying resin contents. The results of this study indicate that LCBC columns which use bio-based resins have the potential to displace their more carbon intensive counterparts. The following conclusions are drawn from this study:
Peak compressive strengths reached 60.34 MPa for bio-based composites (SCR-BE2-M) and 47.60 MPa for synthetic composites (HAW-EPX-M). In addition, HAW-BE2-M3 reached 50.25 MPa, showcasing the potential of bio-based resins in composite applications.
Among tested specimens utilizing Moso bamboo culm and BE2 resin, the specimen incorporating SCR configurations achieved the highest average compressive strengths. Whereas, among tested specimens incorporating Moso bamboo culms and PF1 resin, the HAW-PF1-M2 configuration exhibited the highest compressive strength.
The used resin matrices profoundly impact the compressive strength and elasticity modulus of LCBC slender columns made. Bio-epoxy (BE2) shows higher strength but when compared with synthetic epoxy and bio resins like PF1. While PF1, in contrast, offers greater ductility despite lower strength, highlighting diverse performance considerations for structural applications.
The RD specimen made with Moso bamboo as a cast-in-place giant bamboo showed greater strength compared to those using Guadua and Tali giant bamboo as the external bamboo culm.
The FEA investigation conducted with ABAQUS accurately predicts the stress-strain behavior, stress at failure, and stress distribution of slender bamboo composite columns subjected to axial compressive loads. These FEA results were closely calibrated against experimental data, enabling an investigation into the influence of parameters such as resin content on column behavior.
Resin content significantly affects the mechanical properties and buckling behavior of bamboo composite columns. Higher resin content leads to higher peak stress and initial stiffness but causes more abrupt failures after buckling. Optimizing resin content is crucial for improved performance and durability of the proposed columns.
Author Contributions
Conceptualization, A.M. and G.S.; methodology, A.M and G.S.; software, G.S. and M.R.; validation, G.S., M.R. and A.M.; formal analysis, A.M. and G.S.; investigation, C.P., B.D., G.S. and A.M; resources, A.M.; data curation, M.R. and A.M.; writing—original draft preparation, A.M., G.S., C.P. and B.D.; writing—review and editing, A.M. and G.S.; visualization, A.M. and G.S.; supervision, A.M.; project administration, A.M.; funding acquisition, A.M. All authors have read and agreed to the published version of the manuscript.
Funding
This research was partially supported by NSERC Discovery Grant RGPIN 2023-05246 to Dr. Mofidi.
Data Availability Statement
No new data was created or analyzed in this study. Data sharing is not applicable to this article.
Acknowledgments
The financial support of the National Science and Engineering Research Council of Canada, through operating grants to Dr. Amir Mofidi to cover the analytical and nu-merical research team salaries is gratefully acknowledged. The authors thank Dr Jean Hall for her continuous support of M.Eng. research at Newcastle University. The efficient collaboration of Stuart Patterson (engineering laboratory team leader), Gareth Wear (senior laboratory technician) and Michael Finlay (heavy structures laboratory technician) at Newcastle University in conducting the tests is acknowledged. The authors acknowledge Transfurans Chemicals BVBA valuable and generous donation of Biorez 141010 and technical support on the resin application.
Conflicts of Interest
The authors declare no conflicts of interest.
References
- Harries KA, Sharma B, Richard M. Structural use of full culm bamboo: the path to standardization. International Journal of Architecture, Engineering and Construction 2012; 1(2): 66–75. [CrossRef]
- Pan C, Zhou G, Shrestha AK, Chen J, Kozak R, Li N, Li J, He Y, Sheng C and Wang G Bamboo as a Nature-Based Solution (NbS) for Climate Change Mitigation: Biomass, Products, and Carbon Credits, Climate, 2023; 11(9): 175. [CrossRef]
- Atanda J. Environmental impacts of bamboo as a substitute constructional material in Nigeria. Case Studies in Construction Materials 2015; 3: 33–39. [CrossRef]
- Mohit H, Vishwanath, B, Kumar, GH, Selvan, VAM, Sanjay, MR, Siengchin S. Applications and drawbacks of bamboo fiber composites. Bamboo Fiber Composites: Processing, Properties and Applications 2021; 247-270. [CrossRef]
- Jawaid M, Rangappa SM, Siengchin S (Eds.). Bamboo fiber composites: processing, properties and applications. Springer Nature 2020. ISBN : 978-981-15-8488-6.
- Agate EE, Timothy N, Nathaniel AO, Ngassam I. Performance of Expansive Soil Stabilized with Bamboo Charcoal, Quarry Dust, and Lime for Use as Road Subgrade Material, SSRG International Journal of Civil Engineering 2024; (11)2. [CrossRef]
- Sharma B, et al. Engineered bamboo for structural applications. Construction and Building Materials 2015; 81: 66–73. [CrossRef]
- Sun X, He M, Li Z. Novel engineered wood and bamboo composites for structural applications: State-of-art of manufacturing technology and mechanical performance evaluation. Construction and Building Materials 2020; 249. [CrossRef]
- Drury B, Padfield C, Russo M, Swygart L, Spalton L, Froggatt S, Mofidi A. Assessment of the compression properties of different giant bamboo species for sustainable construction. Sustainability 2023; 15(8):6472. [CrossRef]
- Padfield C, Drury B, Soltanieh G, Rajabifard M, Mofidi A. Innovative cross-sectional configurations for low-cost bamboo composite (LCBC) structural columns. Preprints 2024; 2024070293. [CrossRef]
- Mofidi A, Abila J, Ng JTM. Novel advanced composite bamboo structural members with bio-based and synthetic matrices for sustainable construction. Sustainability 2020; 12(6). [CrossRef]
- Richardson C, Mofidi, A. Non-Linear Numerical Modelling of Sustainable Advanced Composite Columns Made from Bamboo Culms, Construction Materials 2021; 1(3). [CrossRef]
- Ramon E, Sguazzo C, Moreira PMGP. A review of recent research on bio-based epoxy systems for engineering applications and potentialities in the aviation sector. Aerospace 2018, 5(4); 110. [CrossRef]
- Tumolva T, Kubouchi M. Evaluating the carbon storage potential of furan resin-based green composites. ICCM International Conferences on Composite Materials 2011.
- Ipakchi, H., Shegeft, A., Rezadoust, A.M., Zohuriaan-Mehr, M.J., Kabiri, K., Sajjadi, S. Bio-resourced furan resin as a sustainable alternative to petroleum-based phenolic resin for making GFR polymer composites. Iranian Polymer Journal (English Edition) 2020; 29(4): 287–299. [CrossRef]
- Bhagat D, Bhalla S, West RP. Fabrication and structural evaluation of fibre reinforced bamboo composite beams as green structural elements. Composites Part C 2021; 5:100150. [CrossRef]
- ISO 22157:2019 Bamboo structures - Determination of Physical and Mechanical Properties of Bamboo Culms – Test Methods. International Standards Organization, 2019 25 Pages Spalton O. Bio-based structural members for construction. Newcastle: Newcastle University 2020.
- ASTM D695. Standard Test Method for Compressive Properties of Rigid Plastics. American Society for Testing and Materials 2015.
- ABAQUS. Abaqus Unified FEA-3DEXPERIENCE R2018; Systèmes D., Ed.; 3DS-SIMULIA: Rue Marcel Dassault, Vélizy-Villacoublay, France, 2018.
- Lopez, J. Optimizing the mechanical characteristics of bamboo to improve the flexural behavior for biocomposite structural application 2012. Master’s Theses, California Polytechnic State University. [CrossRef]
- Morelle XP, Chevalier J, Bailly C, Pardoen T, Lani F. Mechanical characterization and modeling of the deformation and failure of the highly crosslinked RTM6 epoxy resin. Mechanics of Time-Dependent Materials 2017; 21. [CrossRef]
- Cetisli F, Naito CJ. State of the art of analytical prediction for confined concrete. ATLSS Engineering Research Center, Lehigh University 2003; https://preserve.lehigh.edu/lehigh-scholarship/faculty-and-staff-publications/atlss-reports/state-art-analytical-prediction.
- Zhao M. On nonlinear buckling and collapse analysis using Riks method. In Abaqus Users’ Conference 2008; 1-9. Simulia. https://api.semanticscholar.org/CorpusID:167211853.
- Henriques J, da Silva LS, Valente IB. Numerical modeling of composite beam to reinforced concrete wall joints: Part I: Calibration of joint components. Engineering Structures 2013; 52. [CrossRef]
Figure 1.
Resin matrices used: a) Epolam 2017 Synthetic Epoxy (EPX); b) Experimental soft filler (BE1); c) Entropy Bio-Epoxy (BE2); and d) BioRez PFA-based resin (PF1).
Figure 1.
Resin matrices used: a) Epolam 2017 Synthetic Epoxy (EPX); b) Experimental soft filler (BE1); c) Entropy Bio-Epoxy (BE2); and d) BioRez PFA-based resin (PF1).
Figure 2.
Illustrations of proposed LCBC configurations: a) BRD; b) RD; c) HAW; and d) SCR.
Figure 2.
Illustrations of proposed LCBC configurations: a) BRD; b) RD; c) HAW; and d) SCR.
Figure 3.
Specimen labelling format.
Figure 3.
Specimen labelling format.
Figure 4.
Load-displacement curves for the Moso control specimens versus LCBC members with Moso and BE2 resin.
Figure 4.
Load-displacement curves for the Moso control specimens versus LCBC members with Moso and BE2 resin.
Figure 5.
Image of a stocky HAW-BE2-M-ST specimen.
Figure 5.
Image of a stocky HAW-BE2-M-ST specimen.
Figure 6.
Image of HAW-M-CO control sample after testing.
Figure 6.
Image of HAW-M-CO control sample after testing.
Figure 7.
LCBC manufacturing process.
Figure 7.
LCBC manufacturing process.
Figure 8.
A slender LCBC specimen.
Figure 8.
A slender LCBC specimen.
Figure 9.
Compressive stress versus strain of BE2 specimens with different configurations.
Figure 9.
Compressive stress versus strain of BE2 specimens with different configurations.
Figure 10.
Compressive stress versus measured longitudinal strain of PF1 test series with different cross-sectional configuration.
Figure 10.
Compressive stress versus measured longitudinal strain of PF1 test series with different cross-sectional configuration.
Figure 11.
Compressive stress versus measured longitudinal strain of HAW test specimens with different resins.
Figure 11.
Compressive stress versus measured longitudinal strain of HAW test specimens with different resins.
Figure 12.
Compressive stress versus measured longitudinal strain of RD specimens with different resins.
Figure 12.
Compressive stress versus measured longitudinal strain of RD specimens with different resins.
Figure 13.
Effect of buckling on failure mechanisms.
Figure 13.
Effect of buckling on failure mechanisms.
Figure 14.
Compressive stress versus measured longitudinal strain of RD specimens with different cast-in-place giant bamboo species.
Figure 14.
Compressive stress versus measured longitudinal strain of RD specimens with different cast-in-place giant bamboo species.
Figure 15.
Engineering behavior of Moso bamboo and Resins.
Figure 15.
Engineering behavior of Moso bamboo and Resins.
Figure 16.
LCBC short column model.
Figure 16.
LCBC short column model.
Figure 17.
Comparison of compressive stress and measured longitudinal strain of test specimens for HAW configuration versus FEA results.
Figure 17.
Comparison of compressive stress and measured longitudinal strain of test specimens for HAW configuration versus FEA results.
Figure 18.
Axial load-displacement results from test and FEM for HAW-BE2-M.
Figure 18.
Axial load-displacement results from test and FEM for HAW-BE2-M.
Figure 19.
(a) Axial displacement at buckling, (b) Lateral displacement at buckling, and (c) load distribution at buckling for the HAW-BE2-M2 column.
Figure 19.
(a) Axial displacement at buckling, (b) Lateral displacement at buckling, and (c) load distribution at buckling for the HAW-BE2-M2 column.
Figure 20.
Parametric Finite Element Analysis (FEA) on compressive stress and measured longitudinal strain in HAW-BE2-M2, alongside experimental results.
Figure 20.
Parametric Finite Element Analysis (FEA) on compressive stress and measured longitudinal strain in HAW-BE2-M2, alongside experimental results.
Table 1.
Physical properties of the tested resins samples.
Table 1.
Physical properties of the tested resins samples.
| Specimen |
Width
(mm) |
Depth
(mm) |
Length
(mm) |
Cross Sectional Area (mm2) |
Volume
(mm3) |
Mass
(g) |
Density
(kg/m3) |
q
(g/mm) |
| EPX |
29.6 |
29.2 |
75 |
864 |
64,824 |
75 |
1157 |
1.0 |
| BE1-1 |
25.7 |
24.6 |
73.3 |
632 |
46,342 |
54 |
1165 |
0.7 |
| BE1-2 |
27.8 |
28.9 |
70.3 |
803 |
56,480 |
73 |
1292 |
1.0 |
| BE2-1 |
27.9 |
28.7 |
71.2 |
801 |
57,012 |
63 |
1105 |
0.9 |
| BE2-2 |
28.6 |
26.1 |
74.6 |
746 |
55,686 |
63 |
1131 |
0.8 |
| PF1-1 |
31.6 |
28.8 |
71.2 |
910 |
64,798 |
53 |
818 |
0.7 |
| PF1-2 |
25.3 |
18.7 |
70.1 |
473 |
33,165 |
45 |
1350 |
0.6 |
Table 2.
Physical properties of control samples.
Table 2.
Physical properties of control samples.
| Configuration |
Specimen |
DOuter
(mm) |
Area
(mm2) |
Length
(mm) |
Volume
(Liters) |
Mass
(g) |
Bamboo
(%) |
Void
(%) |
q
(g/mm) |
| HAW |
HAW-CO1 |
90.0 |
2990 |
398.0 |
3.17 |
1008 |
47 |
53 |
2.0 |
| HAW-CO2 |
94.0 |
3398 |
440.0 |
3.74 |
1305 |
49 |
51 |
2.4 |
| RD |
RD-CO1 |
92.1 |
2665 |
393.7 |
3.29 |
1196 |
40 |
60 |
2.4 |
| BRD |
BRD-CO1 |
123.5 |
5391 |
410.0 |
6.11 |
2395 |
45 |
55 |
4.7 |
| BRD-CO2 |
120.4 |
5691 |
382.8 |
5.49 |
2207 |
50 |
50 |
4.6 |
| BRD-CO3 |
119.5 |
6501 |
370.6 |
5.28 |
2453 |
58 |
42 |
5.2 |
Table 3.
Effectiveness of using a bio-based resin (BE2) on mechanical properties.
Table 3.
Effectiveness of using a bio-based resin (BE2) on mechanical properties.
| Specimen |
fc,0
(MPa) |
∆L c,0
(mm) |
Fult
(kN) |
ε c,0 |
UT
(J/m3) |
| HAW-M-CO |
46 |
5.4 |
147 |
0.0103 |
0.3 |
| HAW-BE2-M-ST |
62 |
4.1 |
442 |
0.0431 |
2.4 |
| Increase (%) |
35% |
-24% |
201% |
318% |
700% |
Table 4.
Physical properties of slender LCBC columns.
Table 4.
Physical properties of slender LCBC columns.
| Configuration |
Specimen |
DOuter
(mm) |
Area
(mm2) |
Length
(mm) |
Volume
(Liter) |
Mass
(g) |
Bamboo
(%) |
Resin
(%) |
q
(g/mm) |
| HAW |
HAW-EPX-M |
95.1 |
7108 |
377.6 |
2.69 |
2351 |
42 |
58 |
6.2 |
| HAW-BE2-M1 |
87.0 |
5949 |
365.3 |
2.17 |
1901 |
52 |
48 |
5.2 |
| HAW-BE2-M2 |
102.7 |
8289 |
384.4 |
3.19 |
2505 |
50 |
50 |
6.5 |
| HAW-BE2-M3 |
91.7 |
6604 |
369.0 |
2.44 |
2022 |
49 |
51 |
5.5 |
| HAW-PF1-M1 |
97.0 |
7387 |
311.9 |
2.3 |
1744 |
54 |
46 |
5.6 |
| HAW-PF1-M2 |
88.6 |
6161 |
384.7 |
2.37 |
1188 |
51 |
49 |
3.1 |
| HAW-PF1-M3 |
92.7 |
6749 |
295.2 |
1.99 |
1666 |
54 |
46 |
5.6 |
| RD |
RD-EPX-M |
99.0 |
7703 |
380.3 |
2.92 |
2476 |
43 |
57 |
6.5 |
| RD-BE1-M |
98.4 |
7607 |
261.6 |
1.99 |
1789 |
48 |
52 |
6.8 |
| RD-BE1-G |
82.7 |
5372 |
354.7 |
1.91 |
1680 |
47 |
53 |
4.7 |
| RD-BE2-M |
88.7 |
6177 |
368.2 |
2.27 |
2038 |
49 |
51 |
5.5 |
| RD-BE2-T |
84.0 |
5540 |
390.3 |
2.16 |
1737 |
53 |
47 |
4.5 |
| RD-BE2-G |
80.7 |
5111 |
374.2 |
1.91 |
1614 |
47 |
47 |
4.3 |
| RD-PF1-T |
82.2 |
5305 |
375.4 |
1.99 |
1179 |
48 |
52 |
3.1 |
| BRD |
BRD-BE2-M |
116.3 |
10626 |
368.4 |
3.91 |
3329 |
59 |
41 |
9.0 |
| BRD-PF1-M |
123.7 |
12018 |
382.3 |
4.59 |
3059 |
63 |
37 |
8.0 |
| SCR |
SCR-BE2-M |
87.8 |
6055 |
379.8 |
2.29 |
1918 |
56 |
44 |
5.1 |
Table 5.
Experimental results of slender LCBC columns.
Table 5.
Experimental results of slender LCBC columns.
| Configuration |
Specimen |
∆Lc,0
(mm) |
εc,0 |
Fult
(kN) |
fc,0
(MPa) |
Ec,0
(GPa) |
Hawser
(HAW)
|
HAW-EPX-M |
6.83 |
0.0179 |
338.35 |
47.60 |
3.28 |
| HAW-BE2-M1 |
5.54 |
0.0157 |
274.55 |
46.15 |
4.48 |
| HAW-BE2-M2 |
8.52 |
0.0216 |
388.23 |
46.83 |
4.51 |
| HAW-BE2-M3 |
9.48 |
0.0257 |
331.88 |
50.25 |
3.07 |
| HAW-PF1-M1 |
7.88 |
0.020 |
218.04 |
29.52 |
4.46 |
| HAW-PF1-M2 |
6.62 |
0.0169 |
209.35 |
33.98 |
4.43 |
| HAW-PF1-M3 |
3.52 |
0.0117 |
180.28 |
26.71 |
3.94 |
Russian Doll
(RD)
|
RD-EPX-M |
6.52 |
0.0172 |
256.23 |
33.26 |
2.63 |
| RD-BE1-M |
3.25 |
0.0121 |
188.09 |
24.73 |
4.76 |
| RD-BE1-G |
5.28 |
0.0145 |
161.36 |
30.03 |
3.44 |
| RD-BE2-M |
7.54 |
0.0204 |
324.11 |
52.47 |
5.15 |
| RD-BE2-T |
6.04 |
0.0208 |
205.98 |
37.18 |
4.41 |
| RD-BE2-G |
5.24 |
0.0138 |
240.28 |
47.01 |
6.23 |
| RD-PF1-T |
4.40 |
0.0115 |
151.17 |
28.50 |
2.87 |
Big Russian Doll
(BRD)
|
BRD-BE2-M |
5.45 |
0.0224 |
306.35 |
28.83 |
2.60 |
| BRD-PF1-M |
4.54 |
0.0119 |
333.26 |
27.73 |
3.33 |
Scrimber
(SCR)
|
SCR-BE2-M |
9.95 |
0.0262 |
365.38 |
60.34 |
5.48 |
Table 6.
Impact of buckling of slender member on mechanical properties.
Table 6.
Impact of buckling of slender member on mechanical properties.
| Length |
Specimen |
fc,0
(MPa) |
∆L c,0
(mm) |
Fult
(kN) |
ε c,0 |
| Slender |
HAW-BE2-M1 to M3 (average) |
48 |
7.8 |
331 |
0.0210 |
| Stocky |
HAW-BE2-M-ST |
62 |
4.1 |
442 |
0.0431 |
| |
Loss (%) |
29% |
- |
33% |
- |
| Slender |
HAW-PF1-M 1 to M3 (average) |
30 |
6.0 |
203 |
0.0162 |
| Stocky |
HAW-PF1-M-ST |
38 |
3.0 |
236 |
0.0302 |
| |
Loss (%) |
27% |
- |
17% |
- |
Table 7.
The data extracted from the parametric study of stress-strain curves of HAW-EPX-M under compression load.
Table 7.
The data extracted from the parametric study of stress-strain curves of HAW-EPX-M under compression load.
| |
FEA-A1 |
FEA-A2 |
FEA-A3 |
FEA-A4 |
FEA-A5 |
| Radius of section (RS) |
1.2r
|
1.1r
|
r |
0.9r
|
0.8r
|
| Radis of resin (RR) |
1.2r-t
|
1.1r-t
|
r-t
|
0.9r-t
|
0.8r-t
|
| Peak stress (SP), MPa |
55.73 |
53.64 |
48.60 |
47.90 |
47.60 |
| The strain at buckling |
0.014 |
0.015 |
0.016 |
0.018 |
0.019 |
| Degree of Stress softening (SP - SF), MPa |
2.50 |
2.65 |
3.40 |
2.64 |
1.65 |
| Stiffness (E0), GPa |
3.61 |
3.16 |
2.80 |
2.44 |
2.40 |
|
Disclaimer/Publisher’s Note: The statements, opinions and data contained in all publications are solely those of the individual author(s) and contributor(s) and not of MDPI and/or the editor(s). MDPI and/or the editor(s) disclaim responsibility for any injury to people or property resulting from any ideas, methods, instructions or products referred to in the content. |
© 2024 by the authors. Licensee MDPI, Basel, Switzerland. This article is an open access article distributed under the terms and conditions of the Creative Commons Attribution (CC BY) license (http://creativecommons.org/licenses/by/4.0/).
