1. Introduction
Zinc oxide (ZnO) is an n-type semiconductor with a band gap of 3.37 eV and large free exciton binding energy (60 mV) [
1]. Its unique properties, including good transparency, high electron mobility, and strong luminescence at room temperature, make it an excellent candidate for a wide range of applications. The versatility of ZnO in these diverse applications is evidence of its potential optoelectronic devices, acoustic transducers, varistors, gas sensors, transparent electrodes, optical windows in solar panels, and transparent conductors [
2].
The ZnO films reported in this work are layers of material with thicknesses running from tens of nanometers to a few tens of microns. These films, formed from the accumulation of atoms or molecules on the surface of a substrate, have gained importance over the years due to their continuous growth in various technological applications, such as manufacturing microelectronics devices, photovoltaic components, and sensors. The deposition technique used to form a thin film is not just a step in the process but a crucial factor in obtaining the properties required for specific types of technological applications. Understanding and mastering this technique is key to the success of any thin film project. The thin film's deposition process is summarized in three main stages: the generation of atomic species, the transport of these spices through a medium, and the interaction of the spices on a substrate.
Thin films can be produced using different deposition methods, which can be summarized as physical and chemical processes. The physical methods include laser ablation, molecular beam epitaxy, physical vapor deposition, and sputtering [
3,
4]. On the other hand, chemical methods, such as chemical vapor deposition, atomic layer epitaxy, sol-gel, spin, dip coating, and spray pyrolysis [
5,
6], are known for their precision and reliability, providing a sense of confidence in thin film production.
The Pneumatic Pyrolytic Spray technique allows us to synthesize the precursor material for its deposition on a surface [
7]. This technique is based on the pyrolytic decomposition of a metal compound dissolved in a mixture when sprayed on a preheated substrate. The geometry of the spray nozzle and the gas pressure determine the shape of the spray, the droplet size distribution, and the gas flow. The latter determines the growth kinetics and the quality of the film. Other essential control parameters that affect the quality of the films are the substrate's nature and temperature, the solution's composition, the carrier gas, the solution flow rate, the deposition time, and the distance from the substrate to the spray nozzle. Films grown on substrates below 300 ºC are amorphous in nature, while polycrystalline films are formed at higher temperatures [
8].
In order to create films with good physical properties, it is essential to prevent the metal from completely oxidizing by adding a suitable compound, such as propanol or alcohol. When organic materials decompose, they reduce oxide films and create anion vacancies [
9]. Higher substrate temperatures increase the deposition rate and support chemical reduction (anion vacancies) [
9]. The precursor solution consists of salts of the elements to be deposited and dissolved in alcohol or water. Therefore, in order to create high-quality thin films with strong adhesion, it is crucial to control the solution parameters (concentration, pH, solvent), which in turn might influence the size of the generated droplets, resulting in a material with suitable properties.
The physical properties of some alcohols used as solvents in precursor solutions, such as ethanol (CH3CH2OH) and methanol (CH3OH), are of utmost importance. These organic compounds, each containing at least one hydroxyl group attached to a saturated carbon atom, share a range of physical properties. Their exceptional water solubility and relatively low boiling points (78.3 ºC for ethanol and 64.7 ºC for methanol) play a crucial role in their applications.
This study involved the deposition of ZnO thin films on soda-lime glass using the spray pyrolysis technique at substrate temperatures of 400, 450 and 500 ºC. By altering the solvent (ethanol or methanol) in the precursor solution, the resulting variations in the films' structural, morphological, optical, and electrical properties were investigated. It is worth noting that these studies have not been done at temperatures higher than 400 ºC, marking our research as a contribution to the field.
2. Materials and Methods
ZnO thin films were prepared using the Pneumatic Pyrolytic Spray technique. The soda-lime glass was used as the substrate, and in the spraying solution, either ethanol or methanol was used as the solvent. To prepare the spraying solution, 10.97 g of zinc acetate 2-hydrate and 50 ml of acetic acid were slowly added under agitation into 250 ml of deionized water, following a precise sequence of steps. The acetic acid was added to the solution to prevent the formation of hydroxides. Then, 700 ml of the solvent (ethanol or methanol) was added to the solution. The depositions were carried out at three substrate temperatures: 400, 450 and 500°C. In each case, 70 ml of precursor solution was sprayed onto the substrate.
The ZnO thin films and their thickness were analyzed using the Rutherford Backscattering (RBS) technique. A 3 MV Pelletron-type accelerator was used, with 1 mm diameter alpha particles at an energy of 2.5 MeV. The backscattered alpha particles were collected using a surface barrier detector positioned at a 167° angle to the beam direction. The signals from the detector were amplified and sent to a multichannel analyzer and a computer to generate the RBS spectrum for each sample. The SIMNRA code [
10] was used to analyze the spectrum and obtain the elemental composition of the samples.
The structural properties of the ZnO thin films were analyzed with a Bruker D8 Advanced Diffractometer, using the Cu kα radiation, by the X-ray Diffraction (XRD) technique. This thorough research approach was also applied to the transmittance properties of the films and the calculation of their band gaps, which were studied at room temperature with an Agilent HP 8453 UV-Vis spectrophotometer in the 300–1000 nm range. The samples’ morphology and particle size were conducted with a Scanning Electron Microscope FEG JEOL JSM-7800. Resistivity measurements were studied with a Jandel Multi Height Microposition probe equipment, using the four-point probe method.
3. Results and Discussion
3.1. RBS Results
The elemental concentration of the ZnO thin films was obtained using the RBS technique.
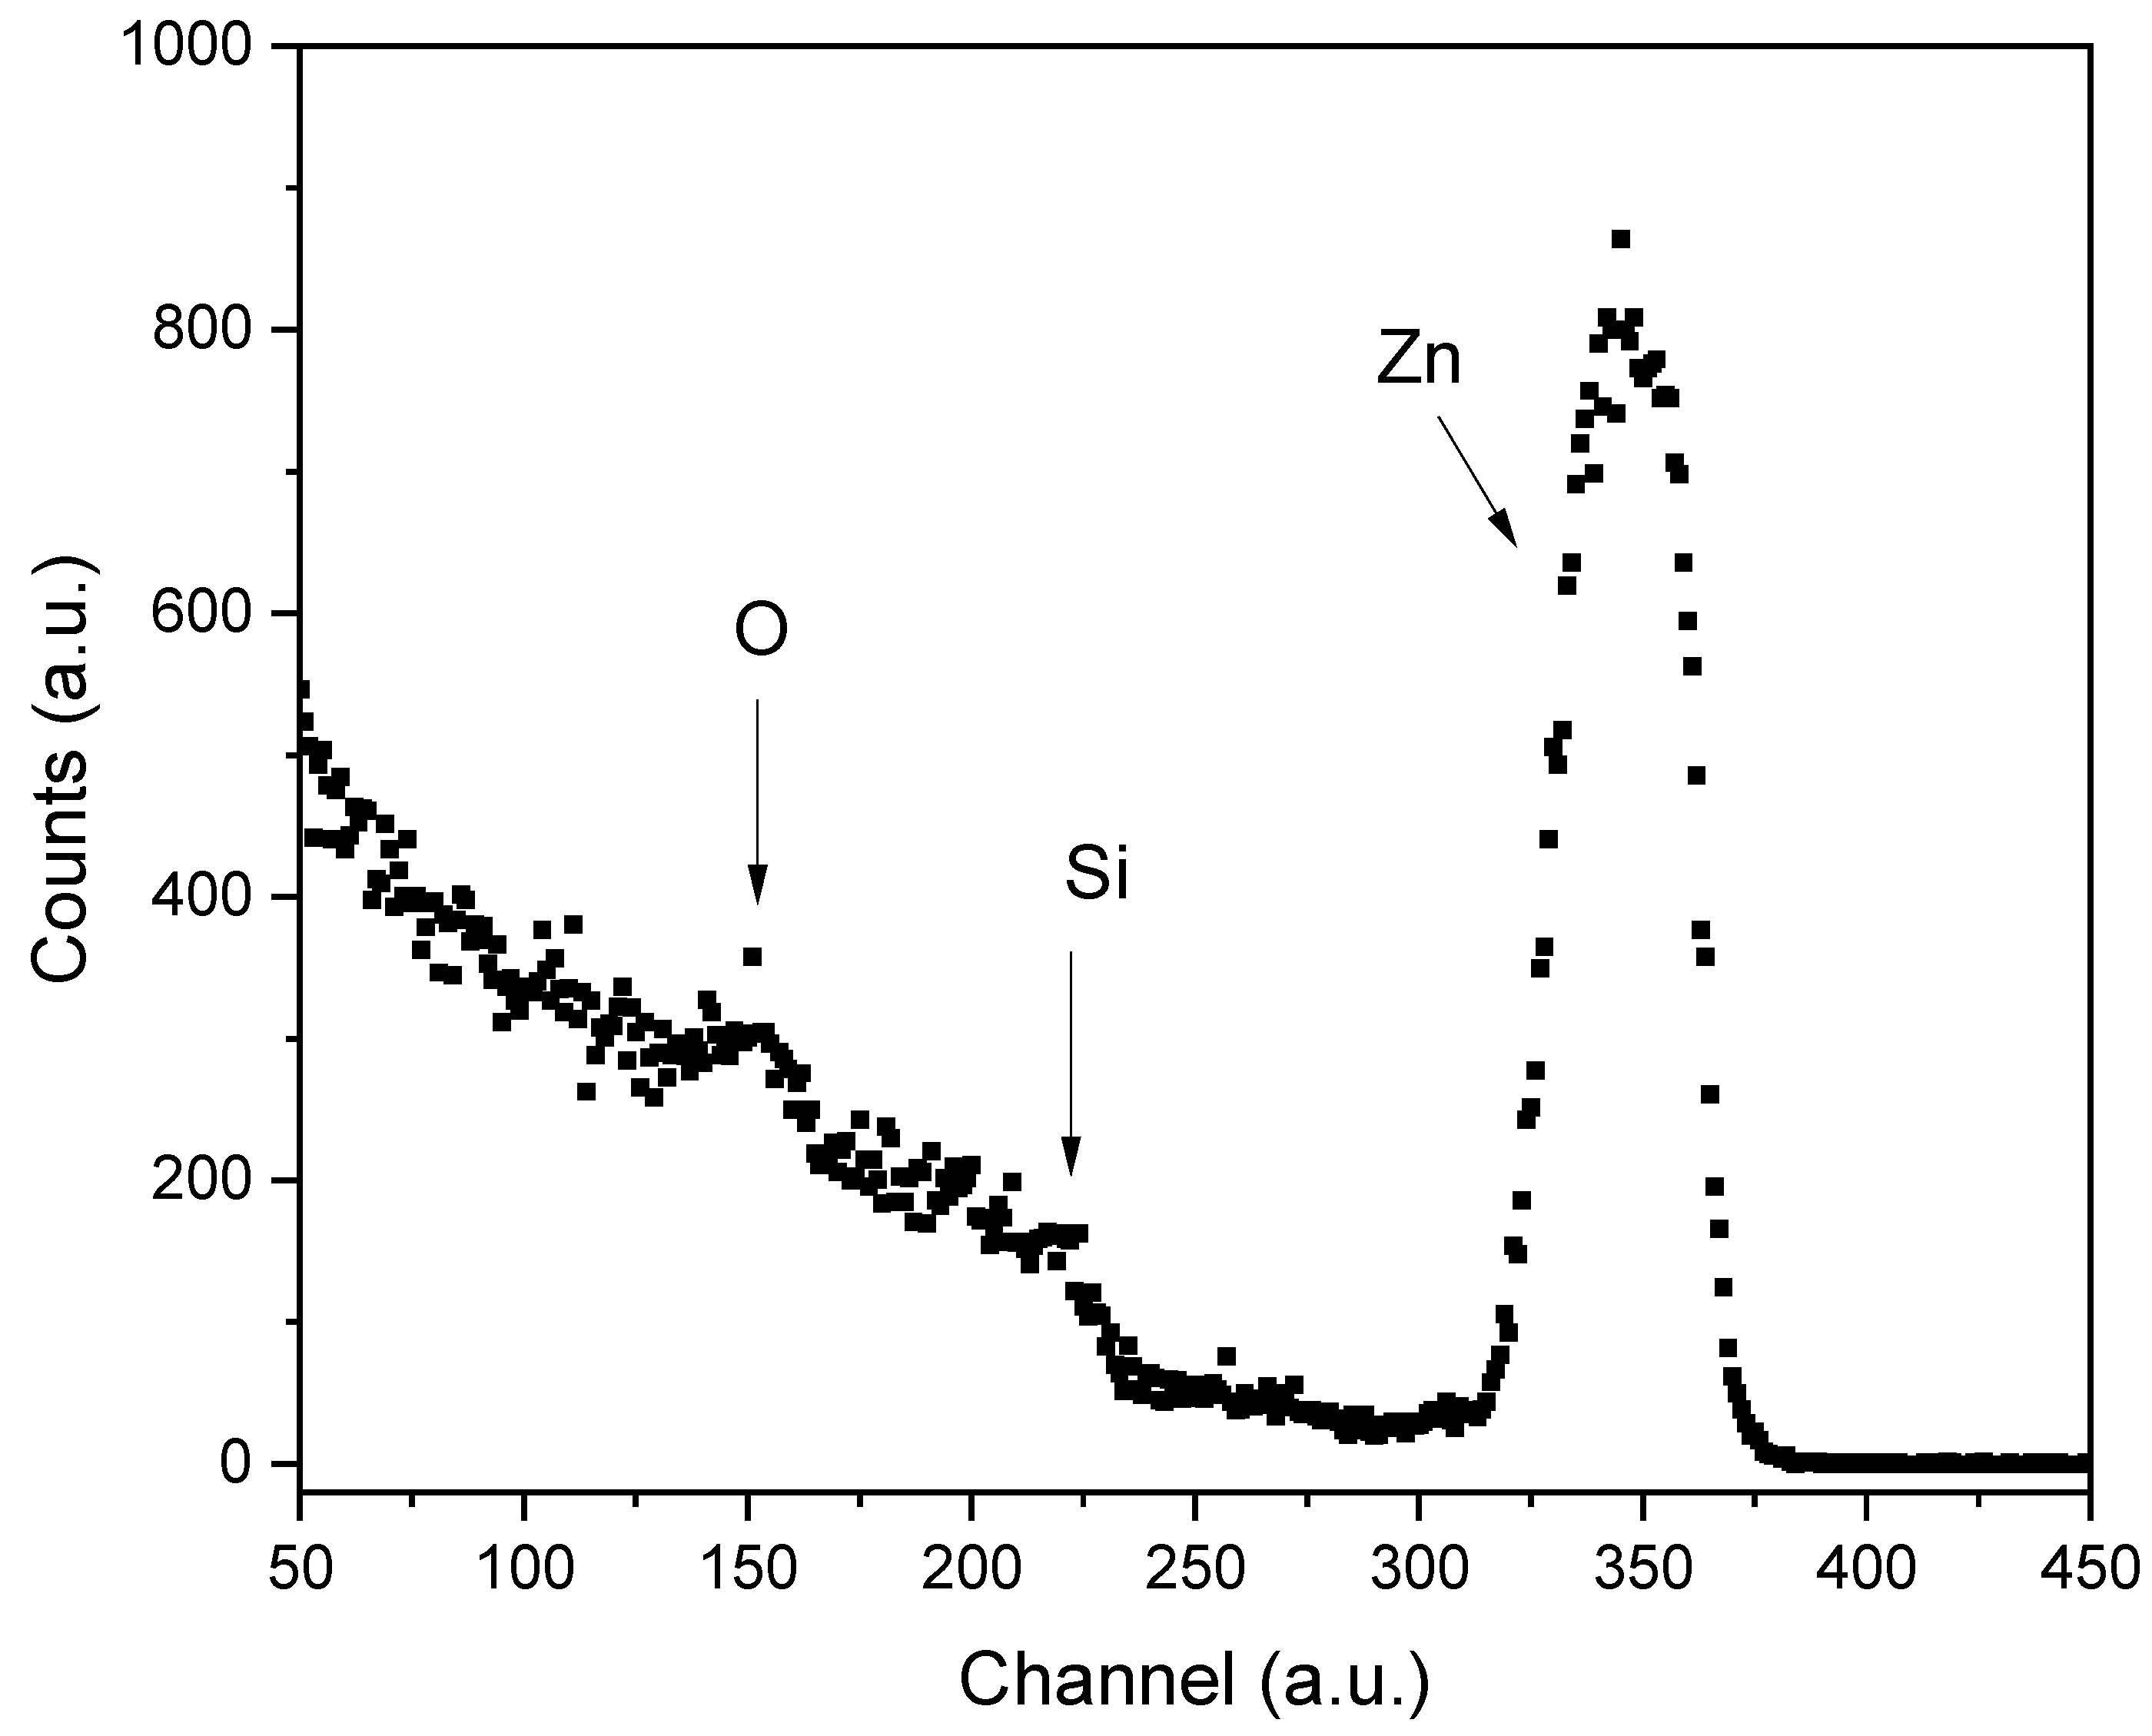
Figure 1 presents a typical RBS spectrum corresponding to the ZnO thin film prepared at 450 ºC and using ethanol as the solvent. The peaks corresponding to the elements that compose the sample (Zn and O) and the substrate (Si and O) are visible. It is important to note that this nuclear technique does not allow us to separate the oxygen signal from the film and the substrate; nevertheless, the Zn signal is clearly observed. The SIMNRA analysis revealed the presence of Zn atoms within the SiO
2 matrix, indicating the occurrence of element diffusion during the synthesis process. Notably, the depth of Zn diffusion into the SiO
2 matrix is consistent for both ethanol and methanol solvents.
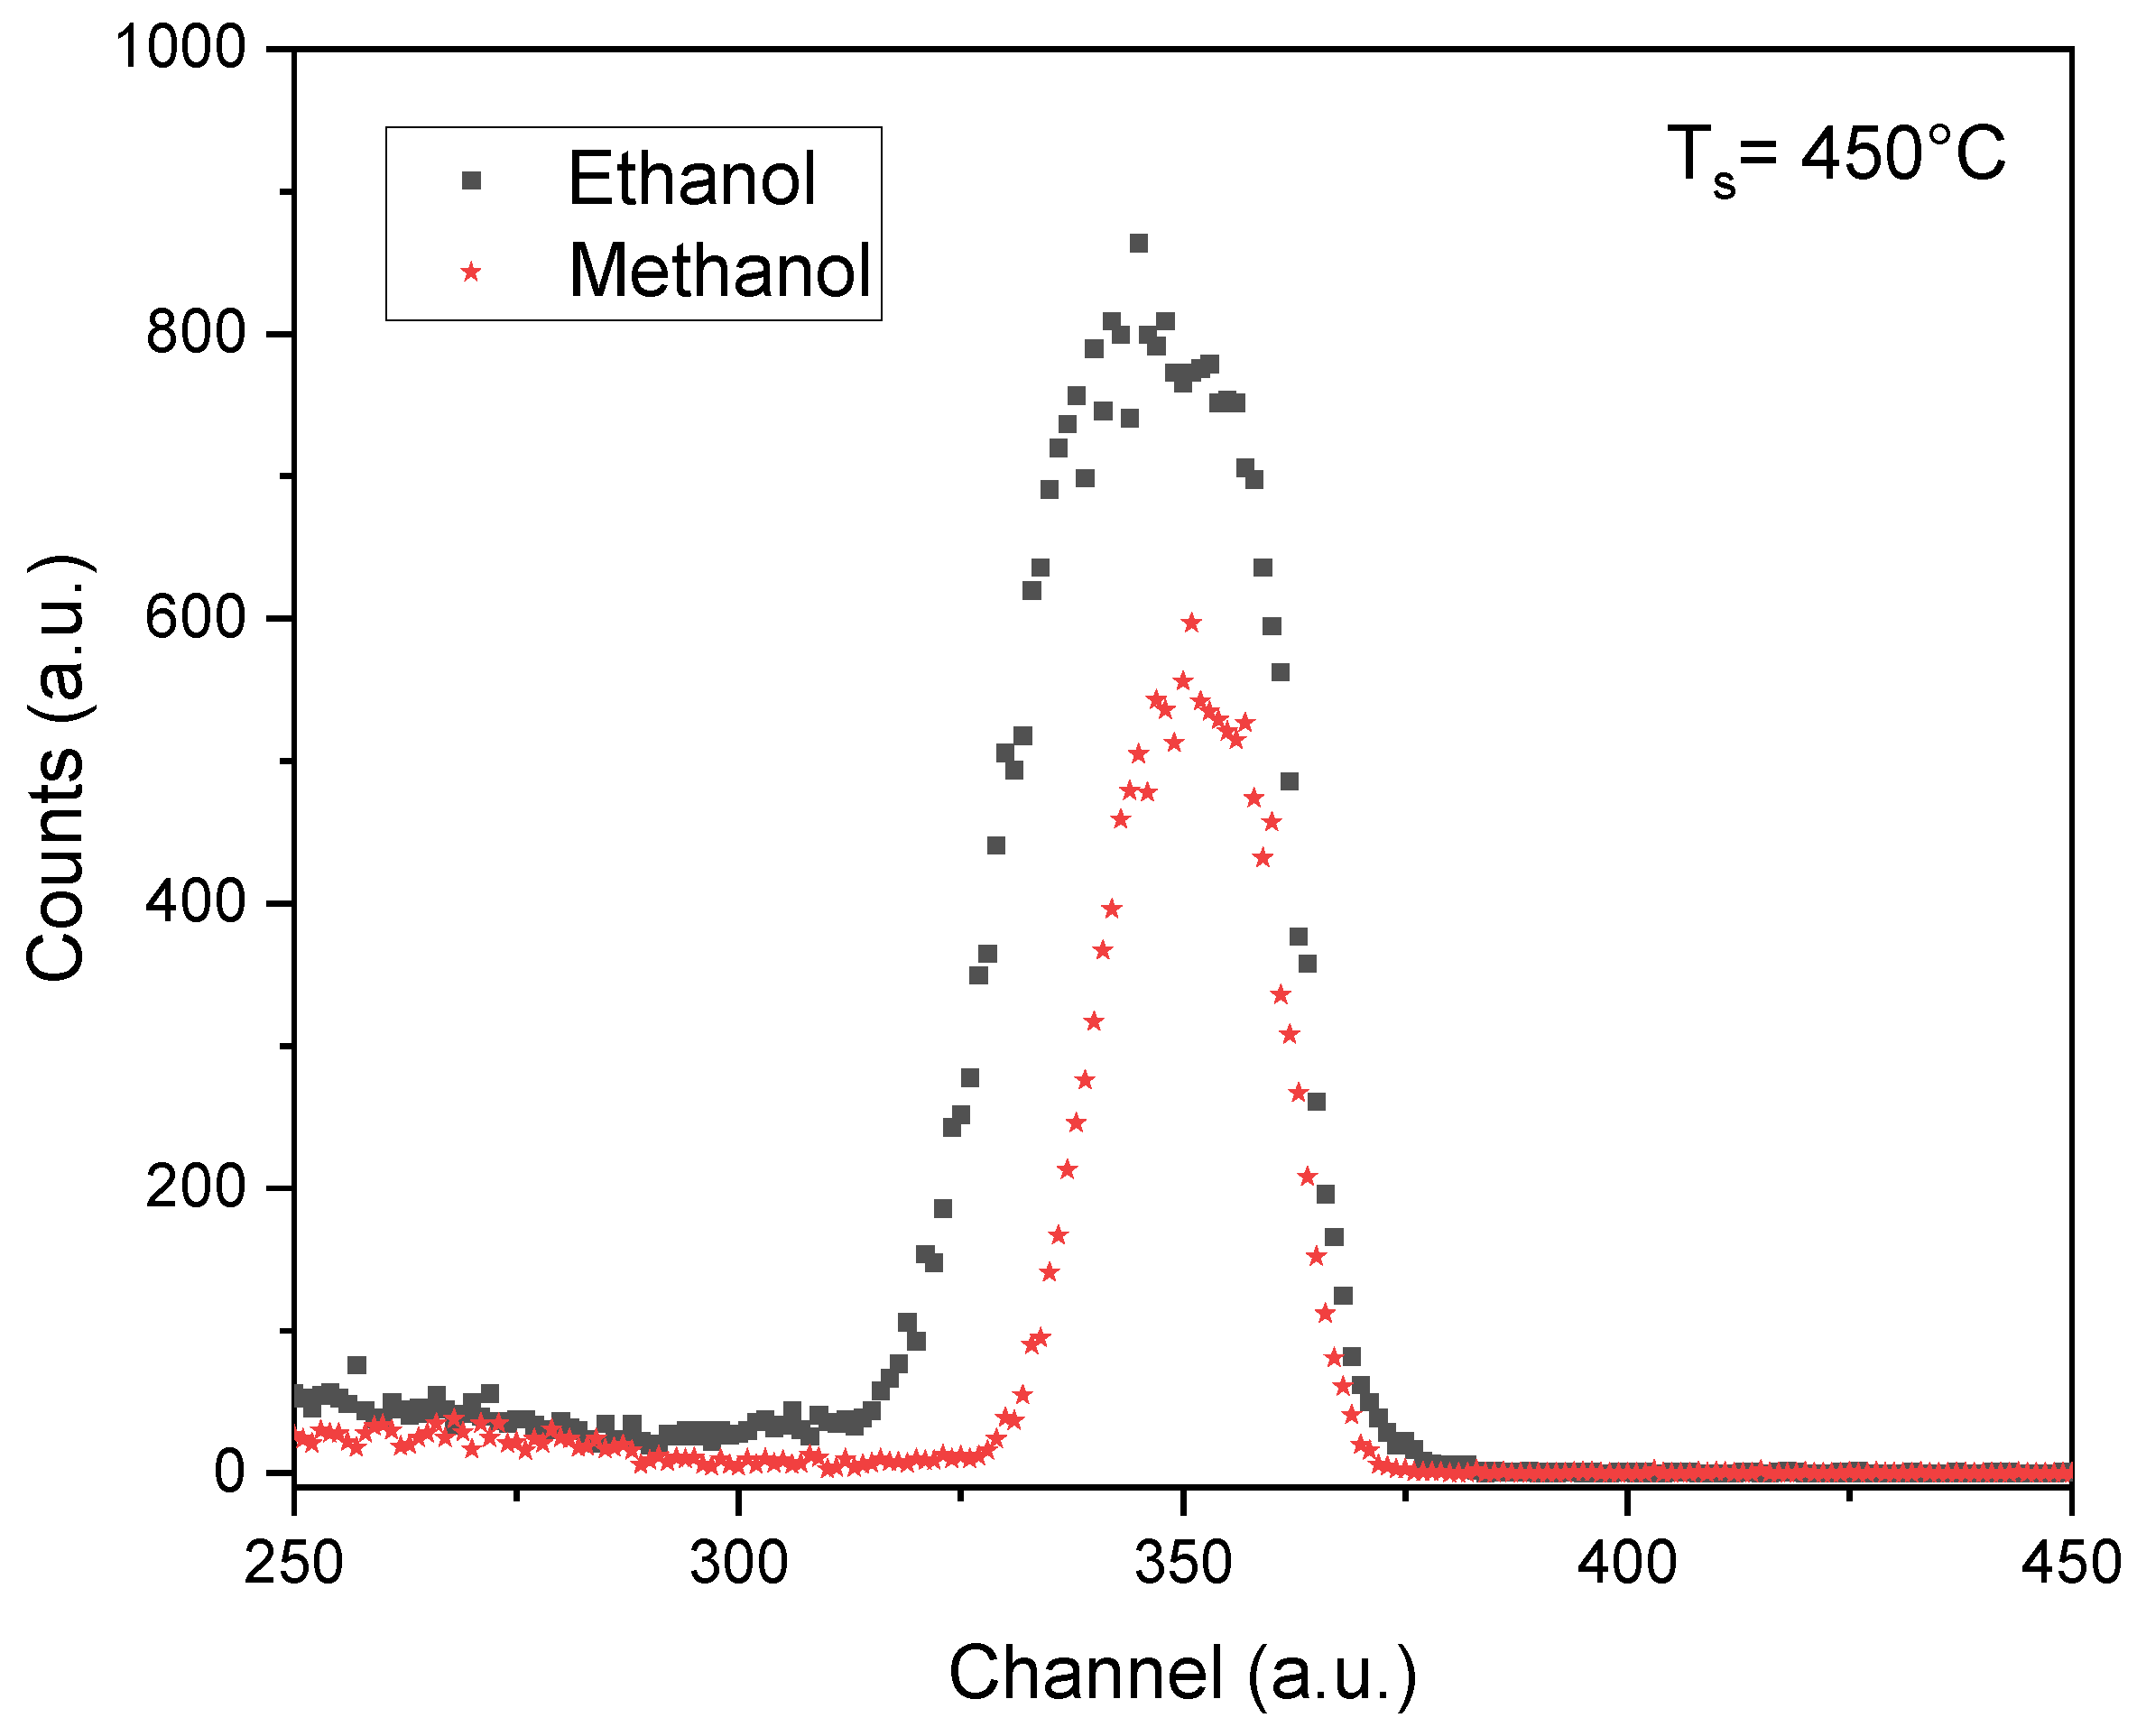
Figure 2 compares the RBS signals of the Zn element for the samples prepared at 450 °C using ethanol and methanol as solvents. A noticeable increase in the height and width of the Zn peak when ethanol is used can be noticed. In an RBS spectrum, the peak's height and width indicate the element's concentration and depth within the sample, respectively [
11]. This fact suggests that ethanol plays a crucial role in the more straightforward incorporation of Zn into the film, resulting in thicker films. The width of the FWHM of the Zn signal is directly related to the film's width, as will be discussed later.
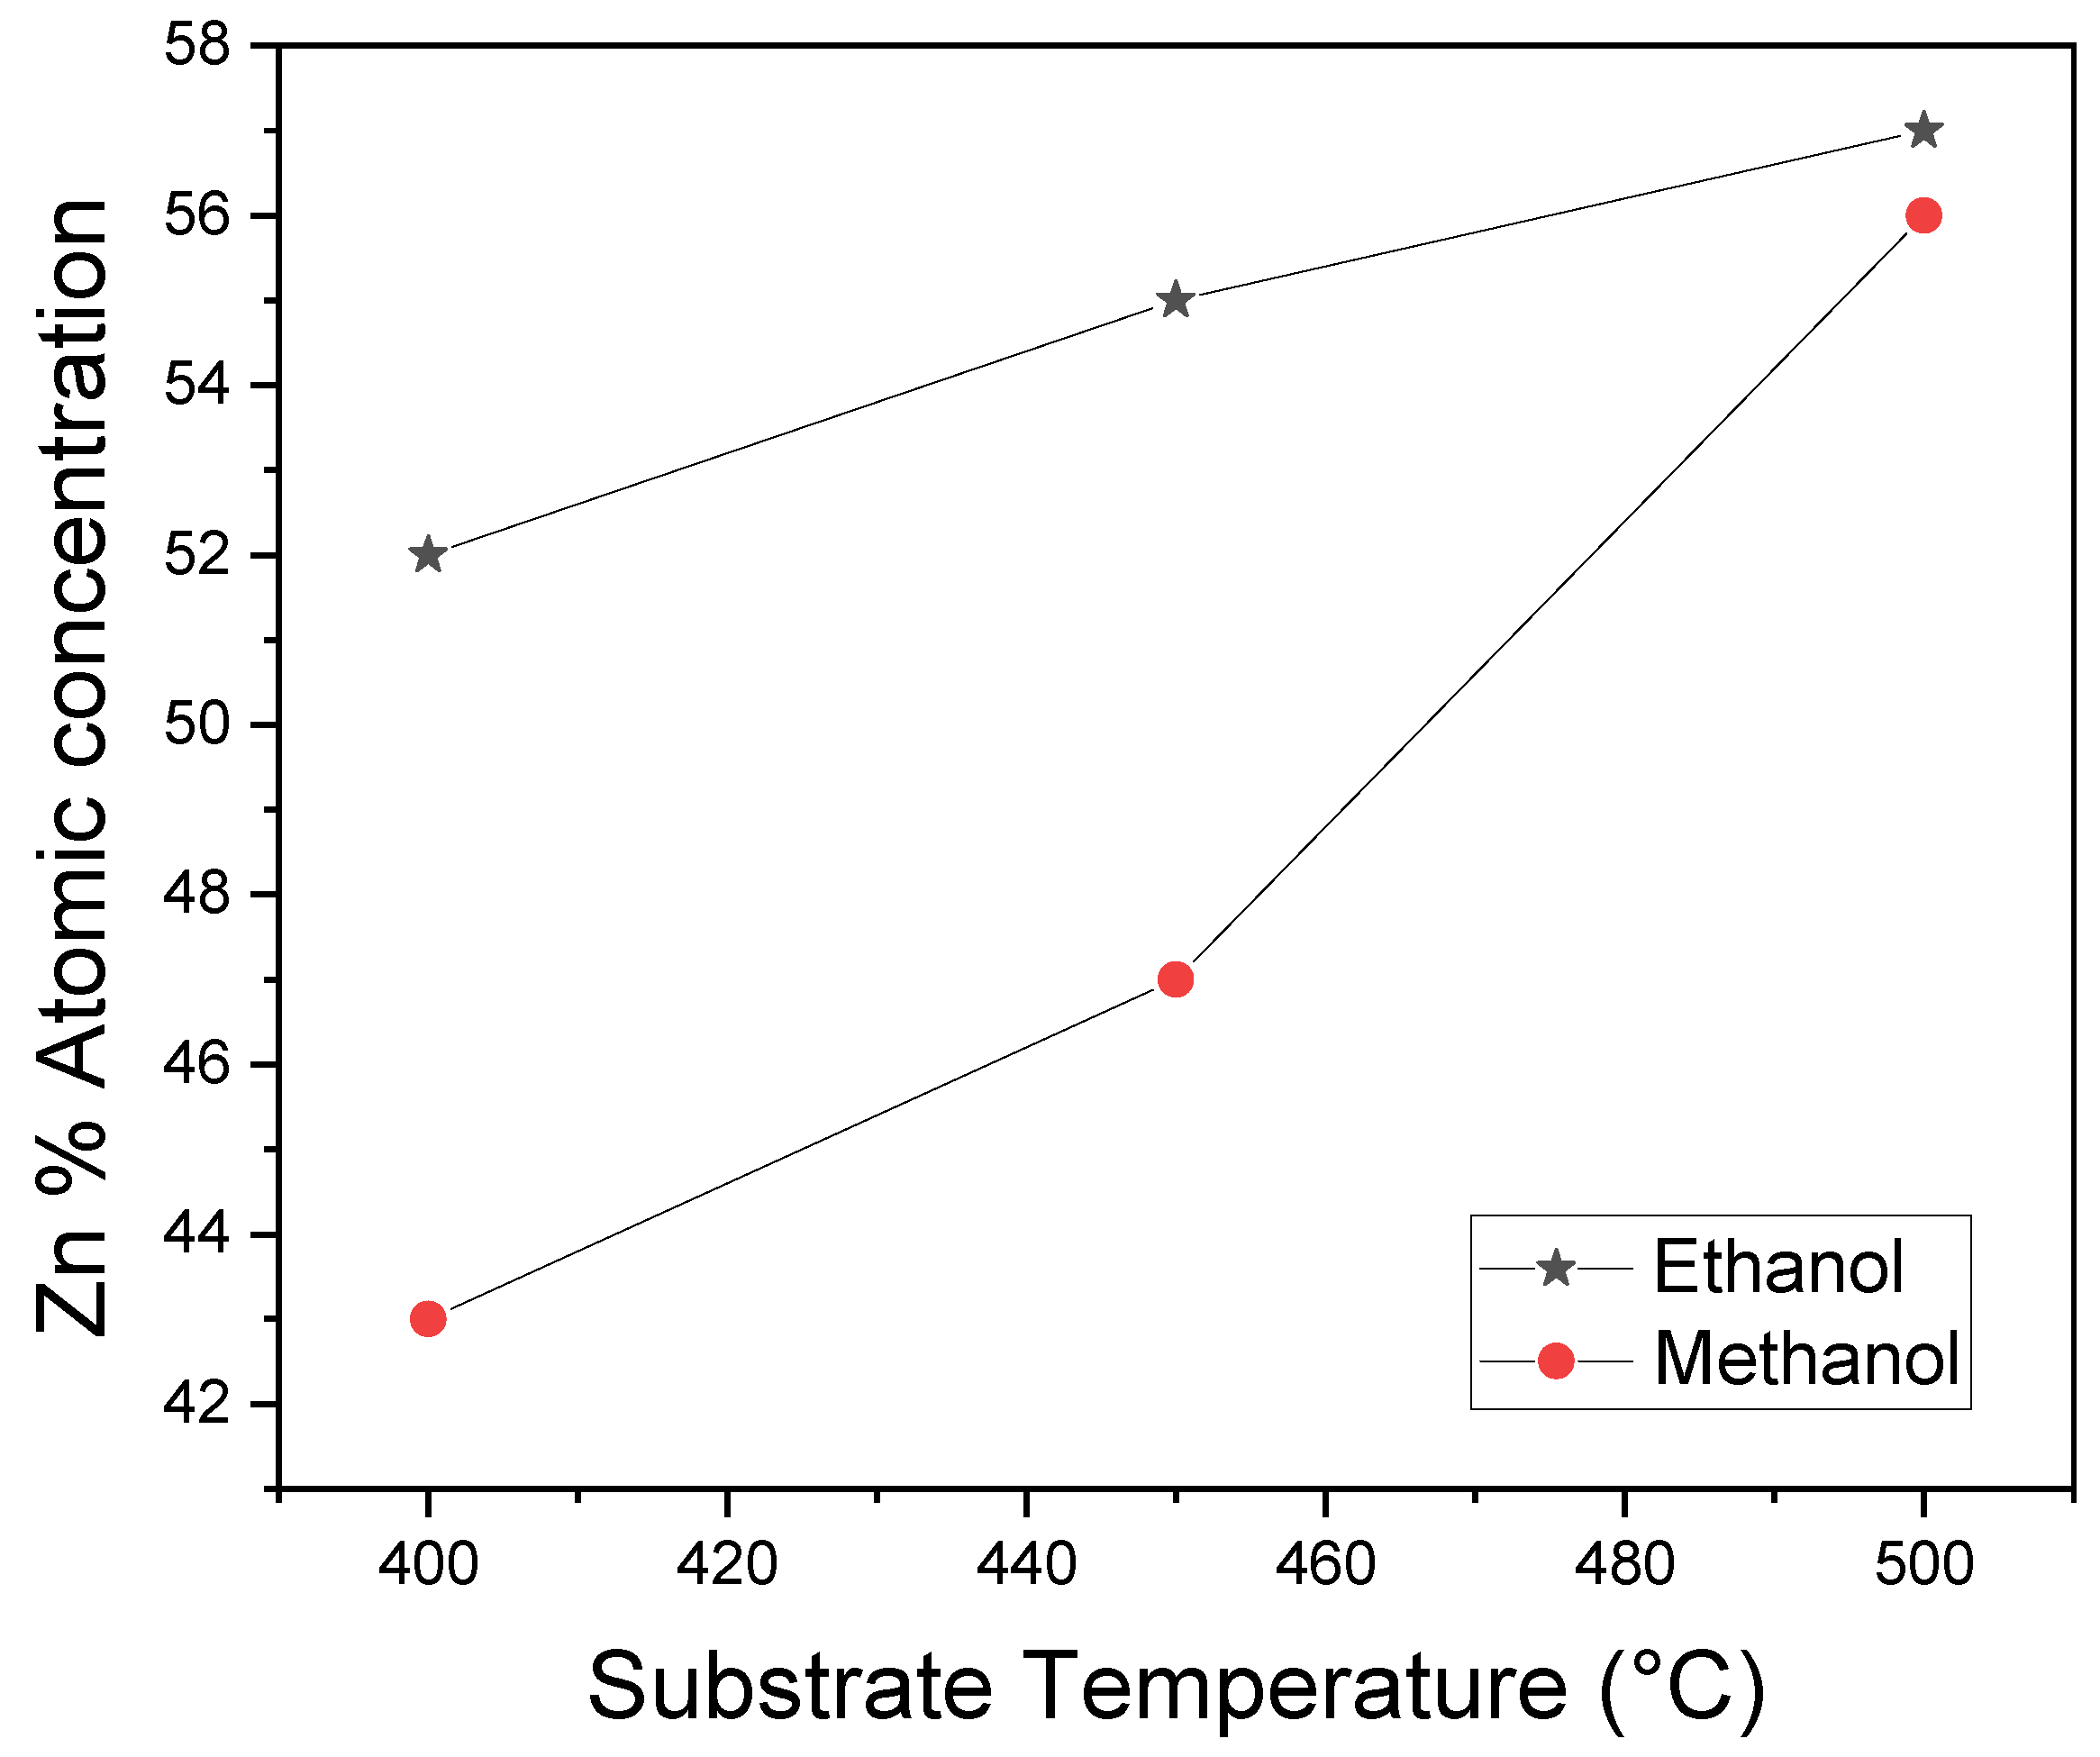
Figure 3 displays the percentage concentration of Zn atoms versus the substrate temperature. These results are derived from the analysis of RBS spectra using the SIMNRA code, which calculates the elemental concentrations in the samples. It was observed that similar to the findings in
Figure 2, using ethanol as a solvent during the synthesis of ZnO thin films leads to easy incorporation of Zn into the sample, resulting in stoichiometric samples. The increase in Zn concentration with the substrate temperature during sample preparation underscores the dominant role of this variable during the synthesis of the films. Furthermore, it was observed that at 500 ºC, stoichiometric ZnO films could be obtained regardless of the type of solvent used. Additionally,
Figure 3 illustrates the diminishing in Zn atoms, which corresponds to an excess of oxygen atoms in films prepared at 400 ºC and 450 ºC using methanol as the solvent.
The thickness of the ZnO film was determined using energy loss calculations. In an RBS experiment, alpha particles lose energy in different ways based on the atom they collide with or on the depth at which the atom is located. Equation (1) [
12] can be used to obtain the film's thickness by calculating the stopping power of the alpha particles in each element that makes up the material.
where
X represents the thickness of the ZnO layer,
ΔE stands for the energy loss of the alpha particles when they interact with the Zn atoms, and
[ε] denotes the stopping power of the alpha particles in Zn. In this case,
ΔE corresponds to the FWHM of the Zn peak in the RBS spectrum.
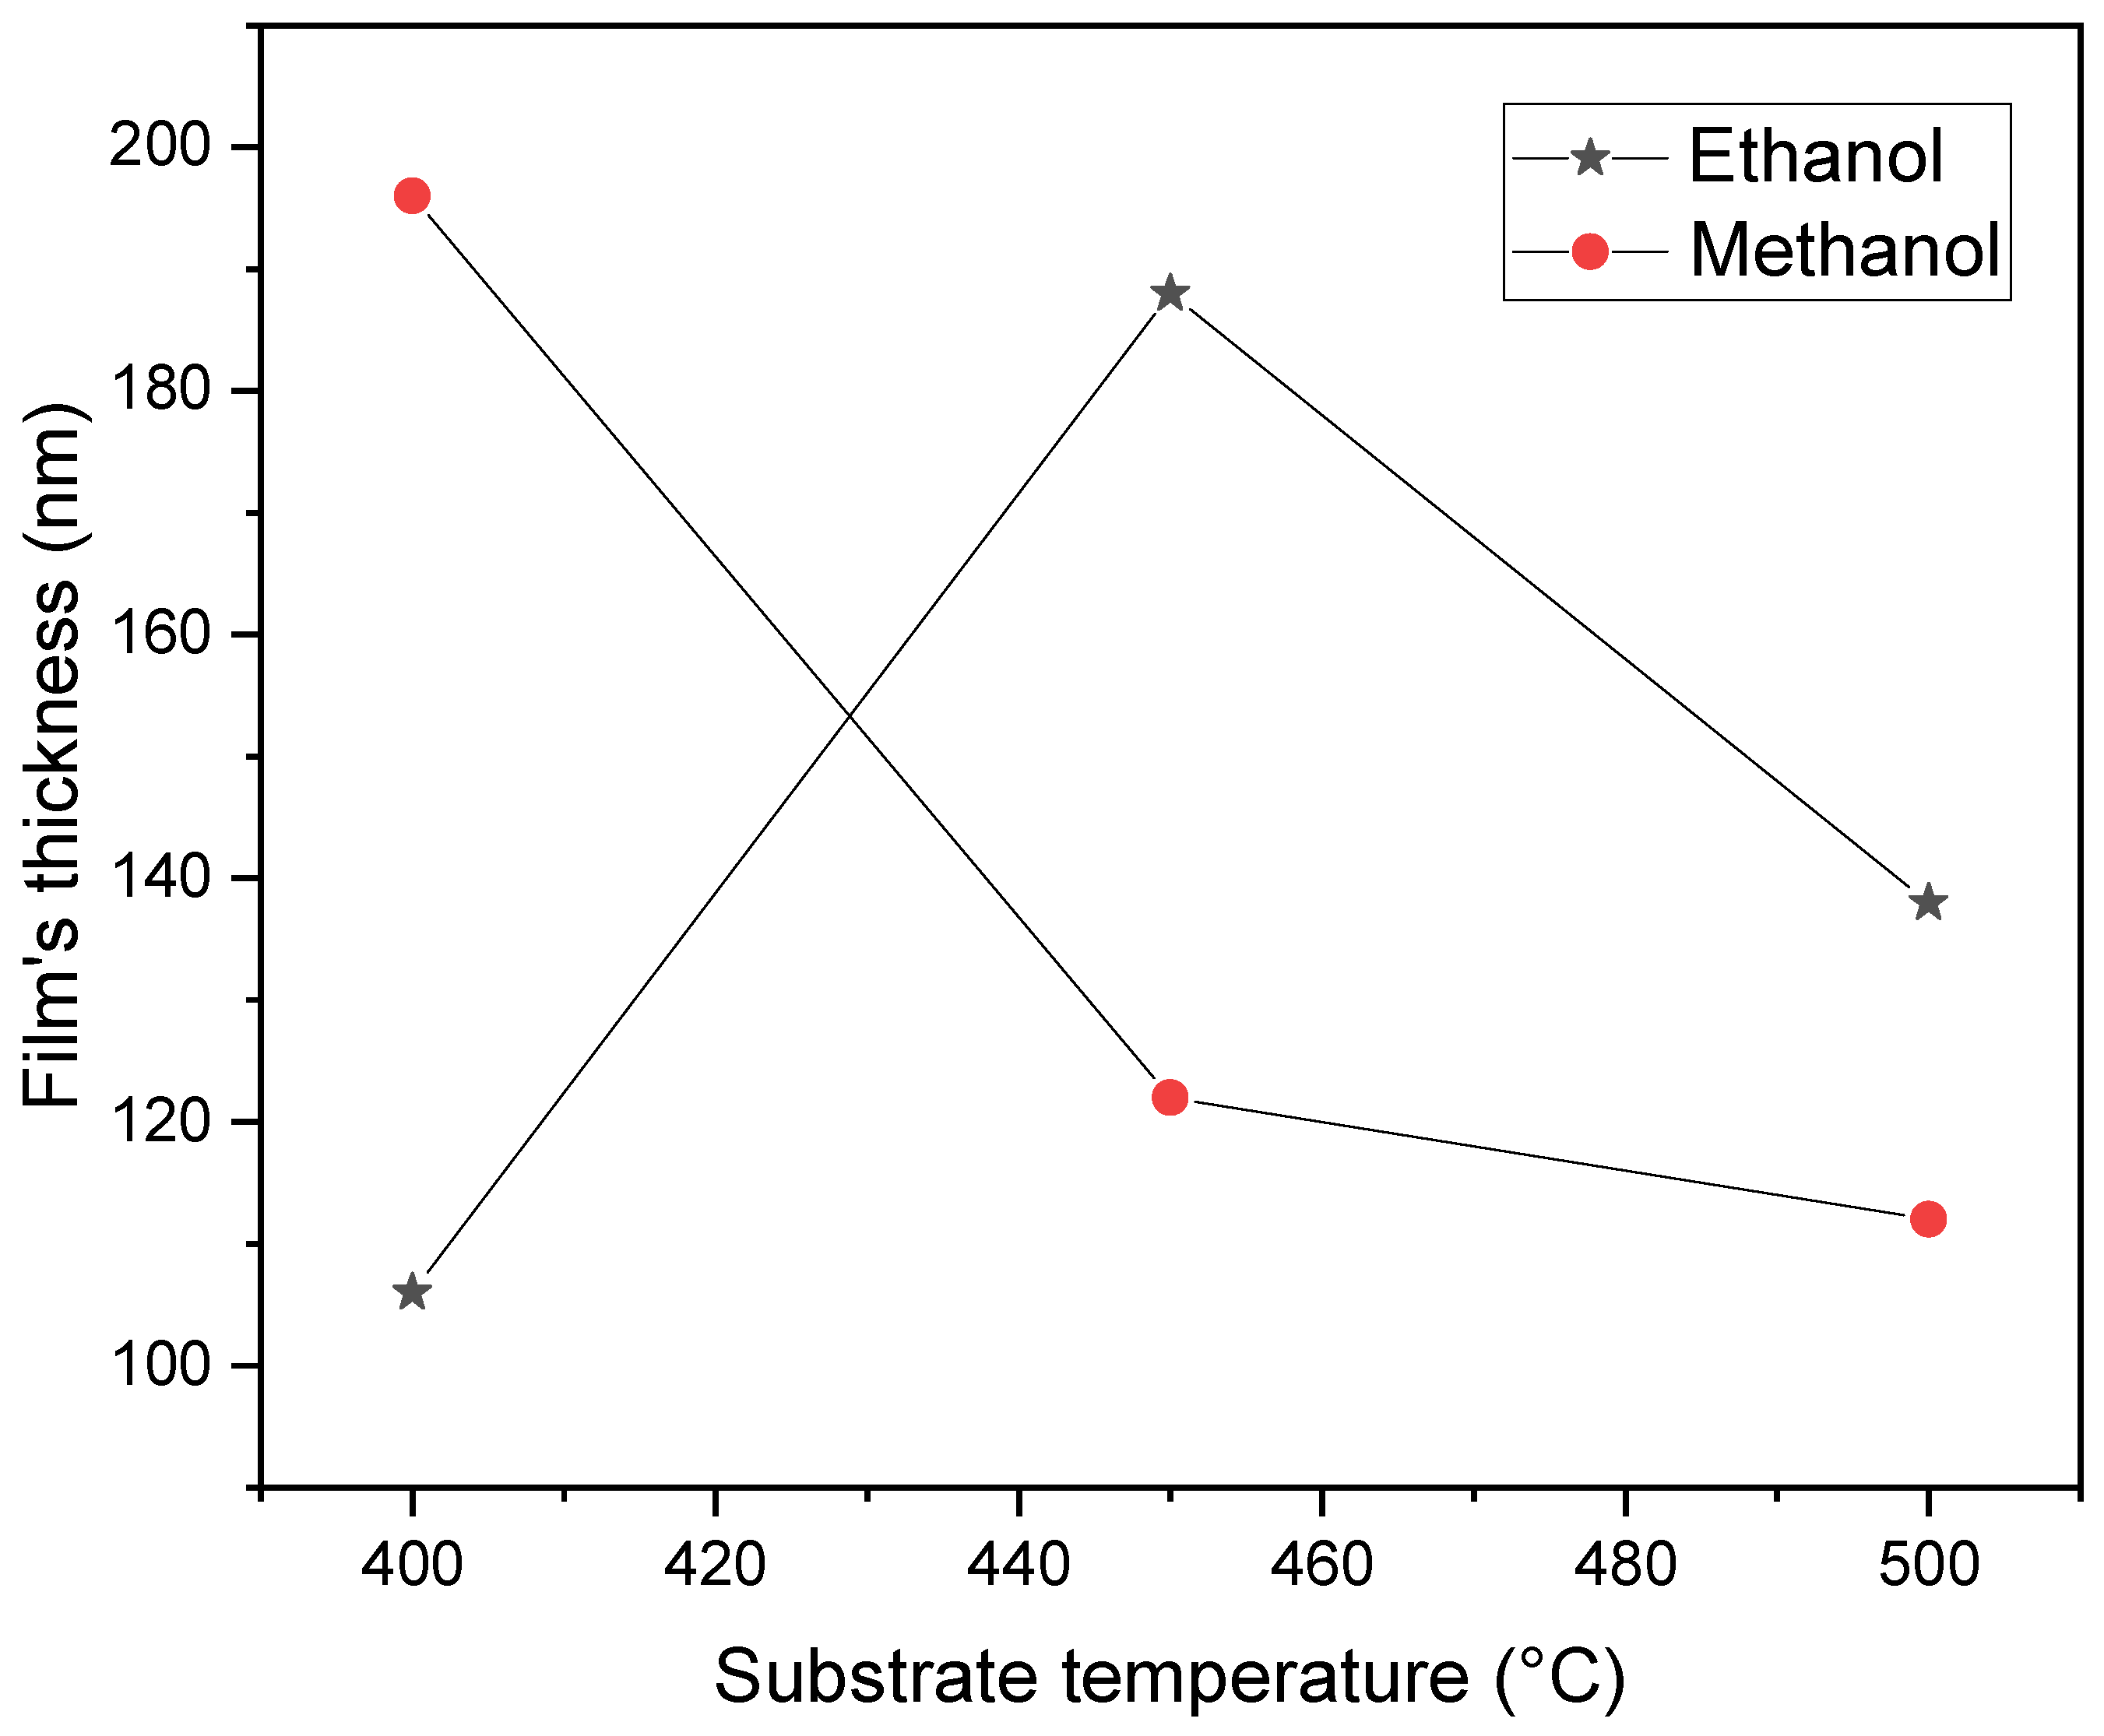
Figure 4 displays the film thickness of the samples synthesized using either ethanol or methanol as substrate temperature is increased. The figure reveals a significant difference in film thickness when the substrate temperature is set at 400 and 450 ºC, but this difference decreases at 500 ºC. This change in film thickness at different temperatures is a crucial finding, as it indicates the influence of substrate temperature on the uniformity of the film. This last finding is consistent with the results shown in
Figure 3, which displays the Zn atomic composition. The amount of Zn is identified as a critical factor during film synthesis, leading to the production of ZnO films with a more uniform thickness, regardless of the solvent used during the film’s preparation. The substrate temperature of 500 ºC is emphasized as a critical parameter in the synthesis of the films, highlighting its importance.
3.2. Structural Properties
X-ray diffraction (XRD) analysis unveiled the crystalline structure of the ZnO thin films, as it is shown in
Figure 5. The analysis identified the following peaks: (100), (002), (101), (102), and (103). These results indicate that the ZnO films are polycrystalline with a hexagonal wurtzite structure and a preferred growth orientation along the c-axis, regardless of the solvent used, and are in agreement with other works that used solvents such as ethanol, methanol, propanol or 2-methoxyethanol [
9,
13,
14]. This behavior was verified by Yang et al. [
15], which observed an increment in preferred orientation in the (002) direction when more polar solvents were used. They also noted that the polarities of the solvents are related to variations in the growth of the films. For instance, ZnO, in the form of wurtzite, is a polar crystal structure, which alterns Zn
2+ and O
2- layers along the c-axis. When the solvent's polarity increases, crystal growth in the (002) direction is observed.
This is due to the strong interaction between the polar surface and the polar solvent, which reduced the surface energy.
In our case, the polarity of methanol (5.1) is higher than ethanol's (4.3). For this reason, the (002) peak is higher for 450 and 500 ºC substrate temperatures. In the case of the sample deposited at 400 ºC, the opposite is observed, where the (002) methanol peak is clearly smaller than the ethanol one. Zaier et al. [
16] observed this behavior when they studied the effects of the solution molarity on the structural properties of ZnO thin films. They noted that when molarity increases, the solution contains more zinc ions, affecting the ZnO film growth rate and enhancing the intensity of the (002). According to the results shown in
Figure 3, the number of zinc atoms in the sample deposited with ethanol is significantly greater than in the methanol sample, so it is not a surprise that the (002) peak in the ethanol film is higher than the methanol one.
The diffractograms in
Figure 5 demonstrate that the films improve crystallization as the substrate temperature increases. They also show that the films deposited with methanol exhibit a significant tendency to enhance their crystallization at lower diffraction angles than the samples produced with ethanol. This variation in crystallinity indicates that the solvent has a role during crystal growth. Potter et al. [
17] related this variation with the precursors that initially react with the solvent to form clusters and crystallites. They argue that when the solvent evaporates, the clusters diffuse to the substrate and adsorb, dictating the nucleation and growth of the film. They conclude that the solvent can influence these clusters' growth, leading to various film structures.
On the other hand, at 500 ºC, the films share remarkable similarities in the peaks and crystallinity. This behavior can be related to an increase of the Zn atoms in the films during their preparation process. At 500 ºC, the samples are stoichiometric, as was verified with RBS studies depicted in
Figure 3. The films also reveal sharper and narrower peaks in the XRD spectra at this temperature. It is a clear indication that raising the substrate temperature promotes the diffusion of atoms that were absorbed on the substrate during the pyrolysis process and speeds up the movement of atoms to energetically favorable positions.
Based on JCPDS data (File 36-1451) [
18], the lattice constants for ZnO are
a=3.24982 Å and
c=5.20661 Å, where
c/a = 1.6021. The lattice constants for the hexagonal ZnO thin films in our study were calculated using Eq. (2) [
19], and the results are displayed in
Table 1.
The results of
Table 1 show a small increment in the lattice constants relative to the ZnO diffraction pattern [
18]. These values also confirm that the ZnO films grow preferentially perpendicular to the substrate surface. This expansion could be due to the presence of free charge in the material or to oxygen vacancies that can increase the lattice constants of the materials, as Mahajan et al. [
13] reported.
Using the (002) peak diffraction and the Debye-Scherrer formula, the average size (
D) of the crystallites in the ZnO films were calculated [
20]:
where
k is the shape factor (0.9),
λ is the wavelength of the Cu K
α,
β is the FWHM of the most intense peak of the XRD curves, and
θ is the Bragg angle.
The results in
Table 2 demonstrate a clear relationship between the crystallite's average size and the solvent used during the synthesis of the ZnO films. Hence, the films prepared using ethanol produce the largest crystallite size. In this sense, two properties of the solvents are the main responsible for this behavior. Foo et al. [
14] consider that the higher viscosity value of the ethanol (1.2 mPa.s) over the methanol’s (0.594 mPa.s) produces the largest crystallites in the materials; however, Hamidi et al. [
21] attribute this enhancement in crystallite size to the lower dielectric constant of ethanol (24.6) compared with methanol (32.7). Indeed, the dielectric constant is directly related to the polarity of the solvents used in the solution, as the hydrolysis rate varies in solvents, so the lowest polarity solvent produces the higher crystallite size.
3.3. Optical Properties
Figure 6 presents the optical transmittance spectra of the ZnO films. The sharp decrease in the UV region, a result of band gap absorption, is particularly pronounced in the sample deposited at 450 ºC using ethanol. Beyond this band gap, the transmittance is high, indicating that the synthesized films are low in impurities and have few lattice defects [
16]. The region of higher transparency, between 72% and 97%, is significantly influenced by the substrate temperature and the solvent used during film preparation. Notably, the optical transmittance does not show a clear tendency based on the temperature or the solvent used in the sprayed solution. At 400 nm, for 400 ºC, the transmittance of the methanol film is lower than the ethanol one, converging after 500 nm. For 450 ºC, the behavior is inverse, but the transmittance curves never coincide. For 500 ºC, the transmittance is more prominent for ethanol, but at 470 nm, the transmittance curves of both samples cross each other and change their behavior. Potter et al. [
17] observed changes in the transmittance of ZnO films using different solvents. They concluded that this behavior could result from increased carbon contamination of the different solvents that causes a visible darkening in the films.
The Tauc relation [
22] is used for calculating the optical band gap of ZnO films.
where
α is the absorption coefficient,
hv is the photon energy,
A is a constant related to the material's refractive index, and
Eg is the optical band gap.
This equation leverages the information provided by the transmittance curves, which are instrumental in our research on semiconductor optical band gaps. To obtain the energy band gap of the materials, we begin by plotting (αhv)2 as a function of the energy of the incident radiation. Then, we use this plot to identify the energy band gap of the films. This is done by locating the point where the extrapolated linear part of the curve intersects with the incident energy axis.
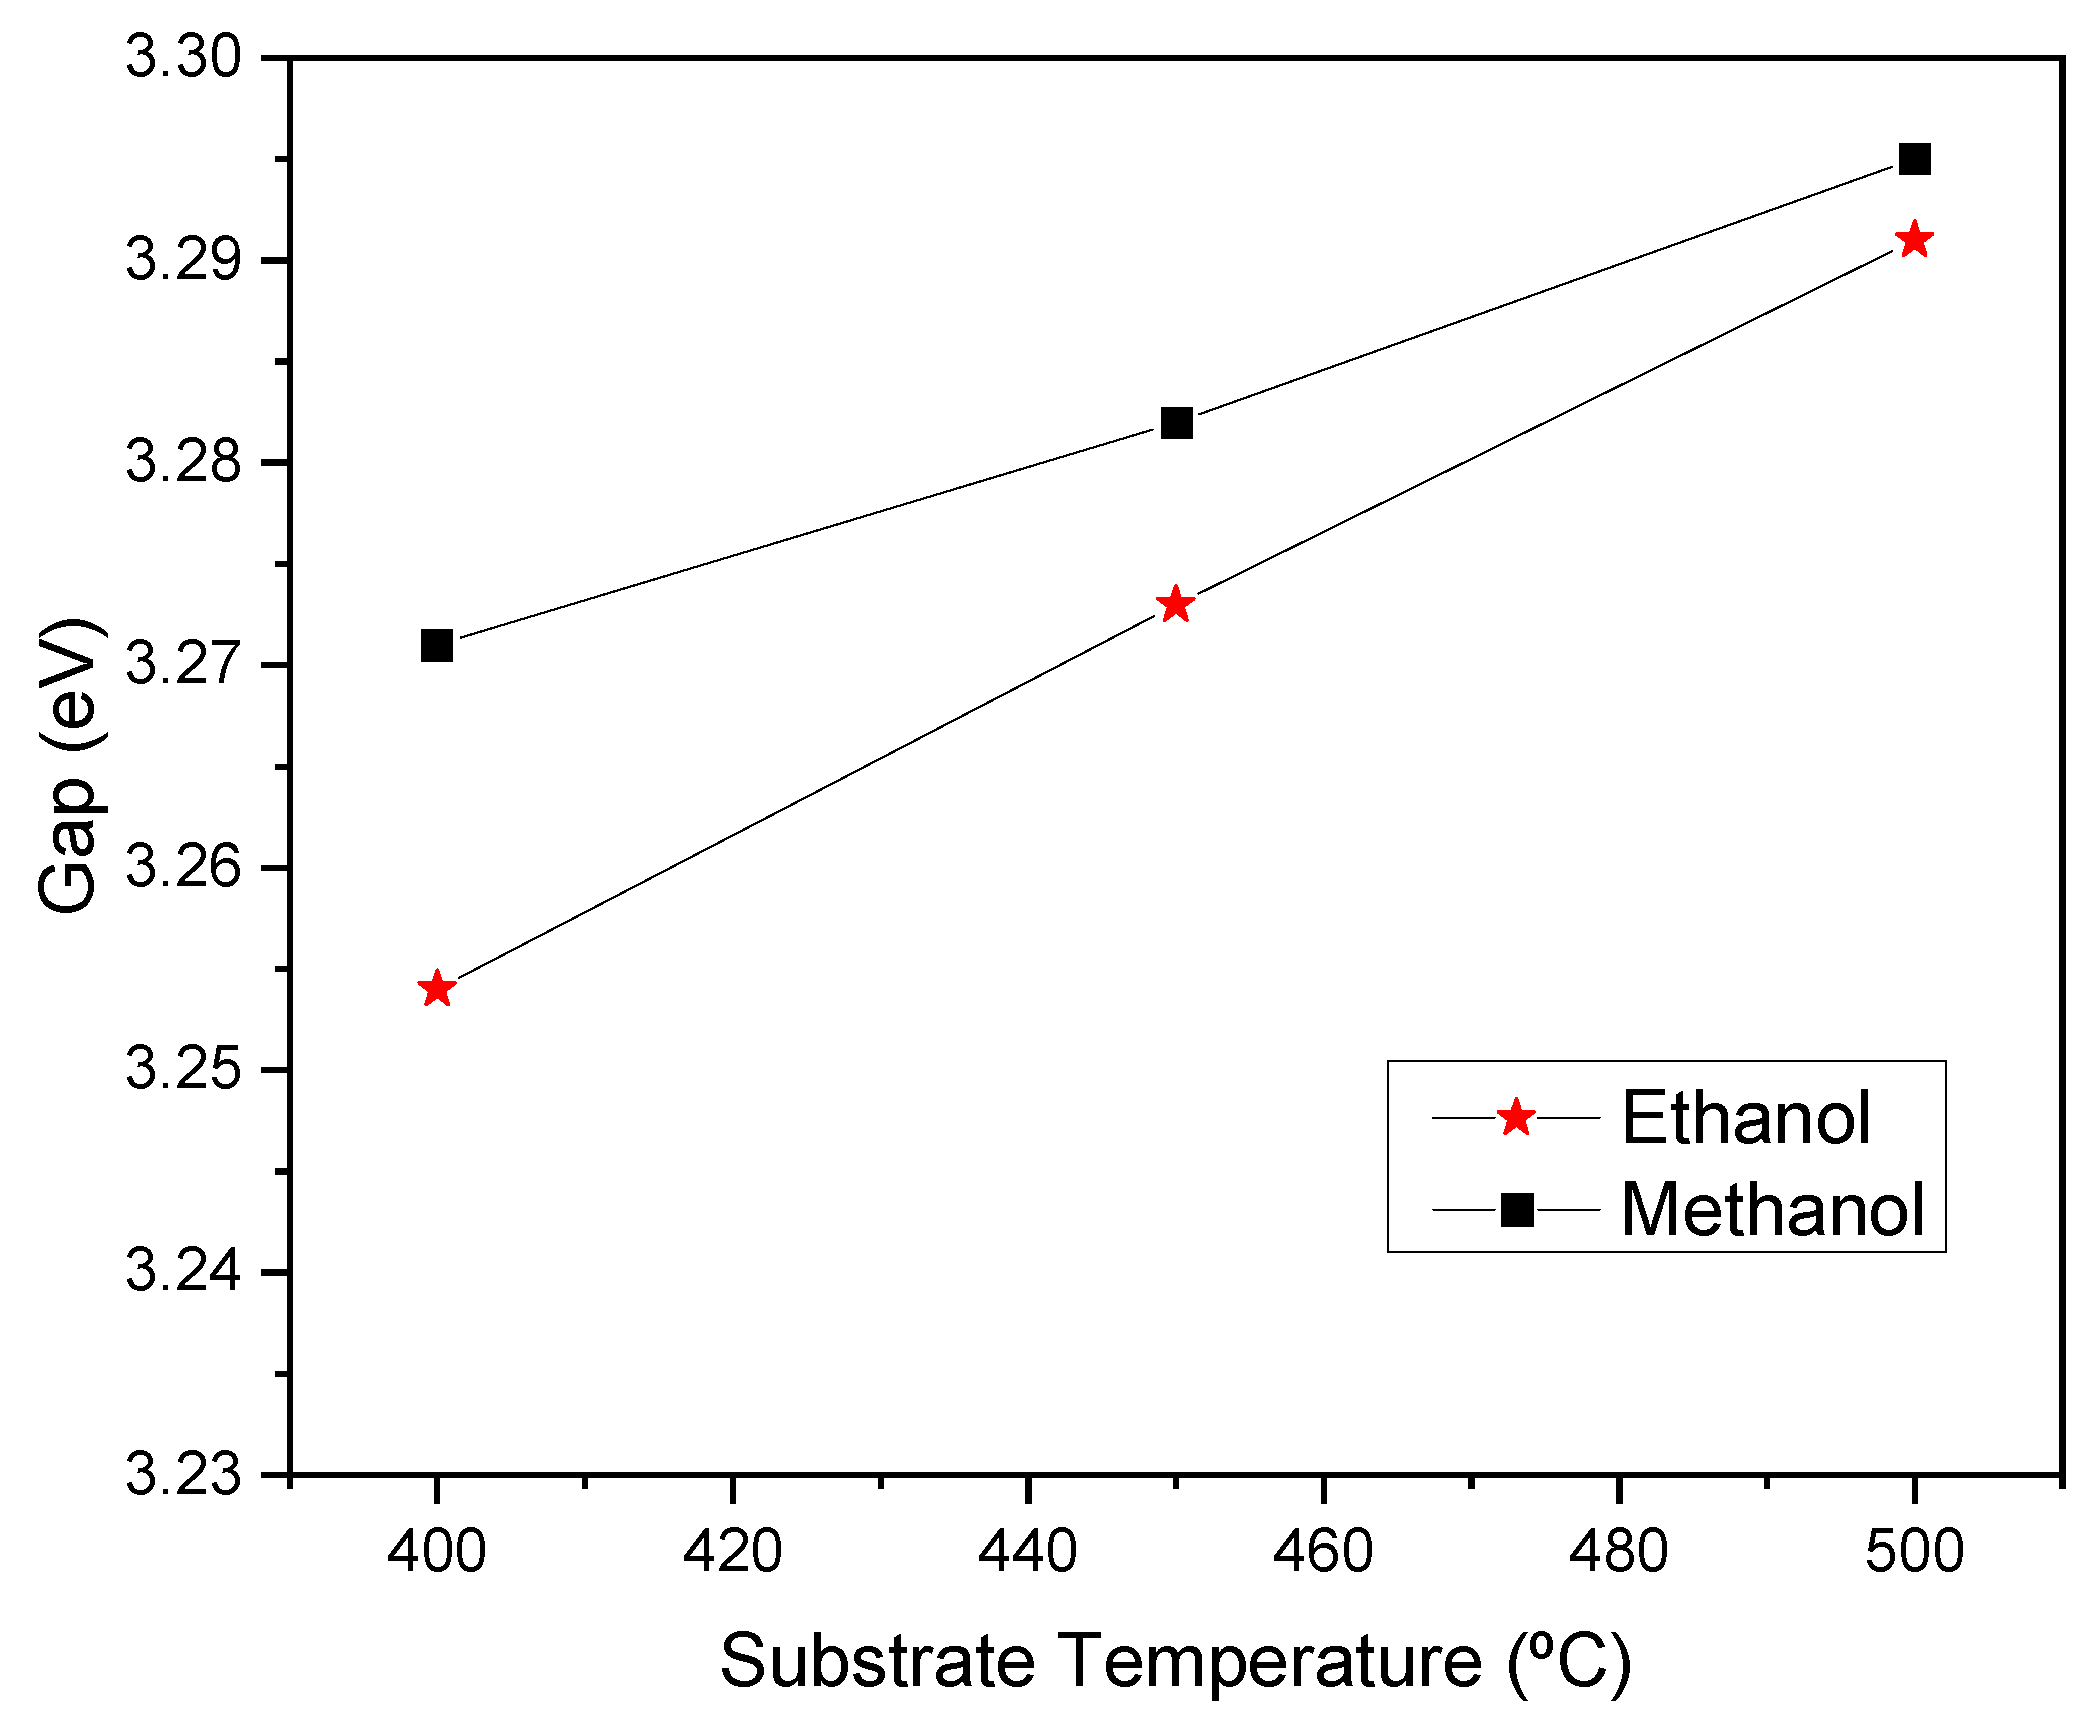
The results, as depicted in
Figure 7, show that the energy band gap increases with the temperature of the substrate and is further enhanced when methanol solvent is used during the sample preparation. The band gap values vary from 3.253 to 3.290 eV for ethanol and 3.271 to 3.295 eV for methanol. Some authors [
18] attribute the increase in optical band gap to the improvement in the film's crystallinity as the substrate temperature increases, as is verified in
Figure 5. It is well-established that band gap variations are due to a multitude of factors, including crystallite dimension, quantum size effects, changes in the density of impurities, variations in crystallinity, defects, residual stresses, and strains. In our case, the variations in the energy band gap with crystallite size, as seen in
Table 2, clearly show that crystallite dimension and quantum size effects are the main responsible for the changes in the energy band gap relative to the solvent used during the preparation of the samples. This effect was observed by Mahajan et al. [
9] and Benramache et al. [
23].
3.4. Morphological Properties
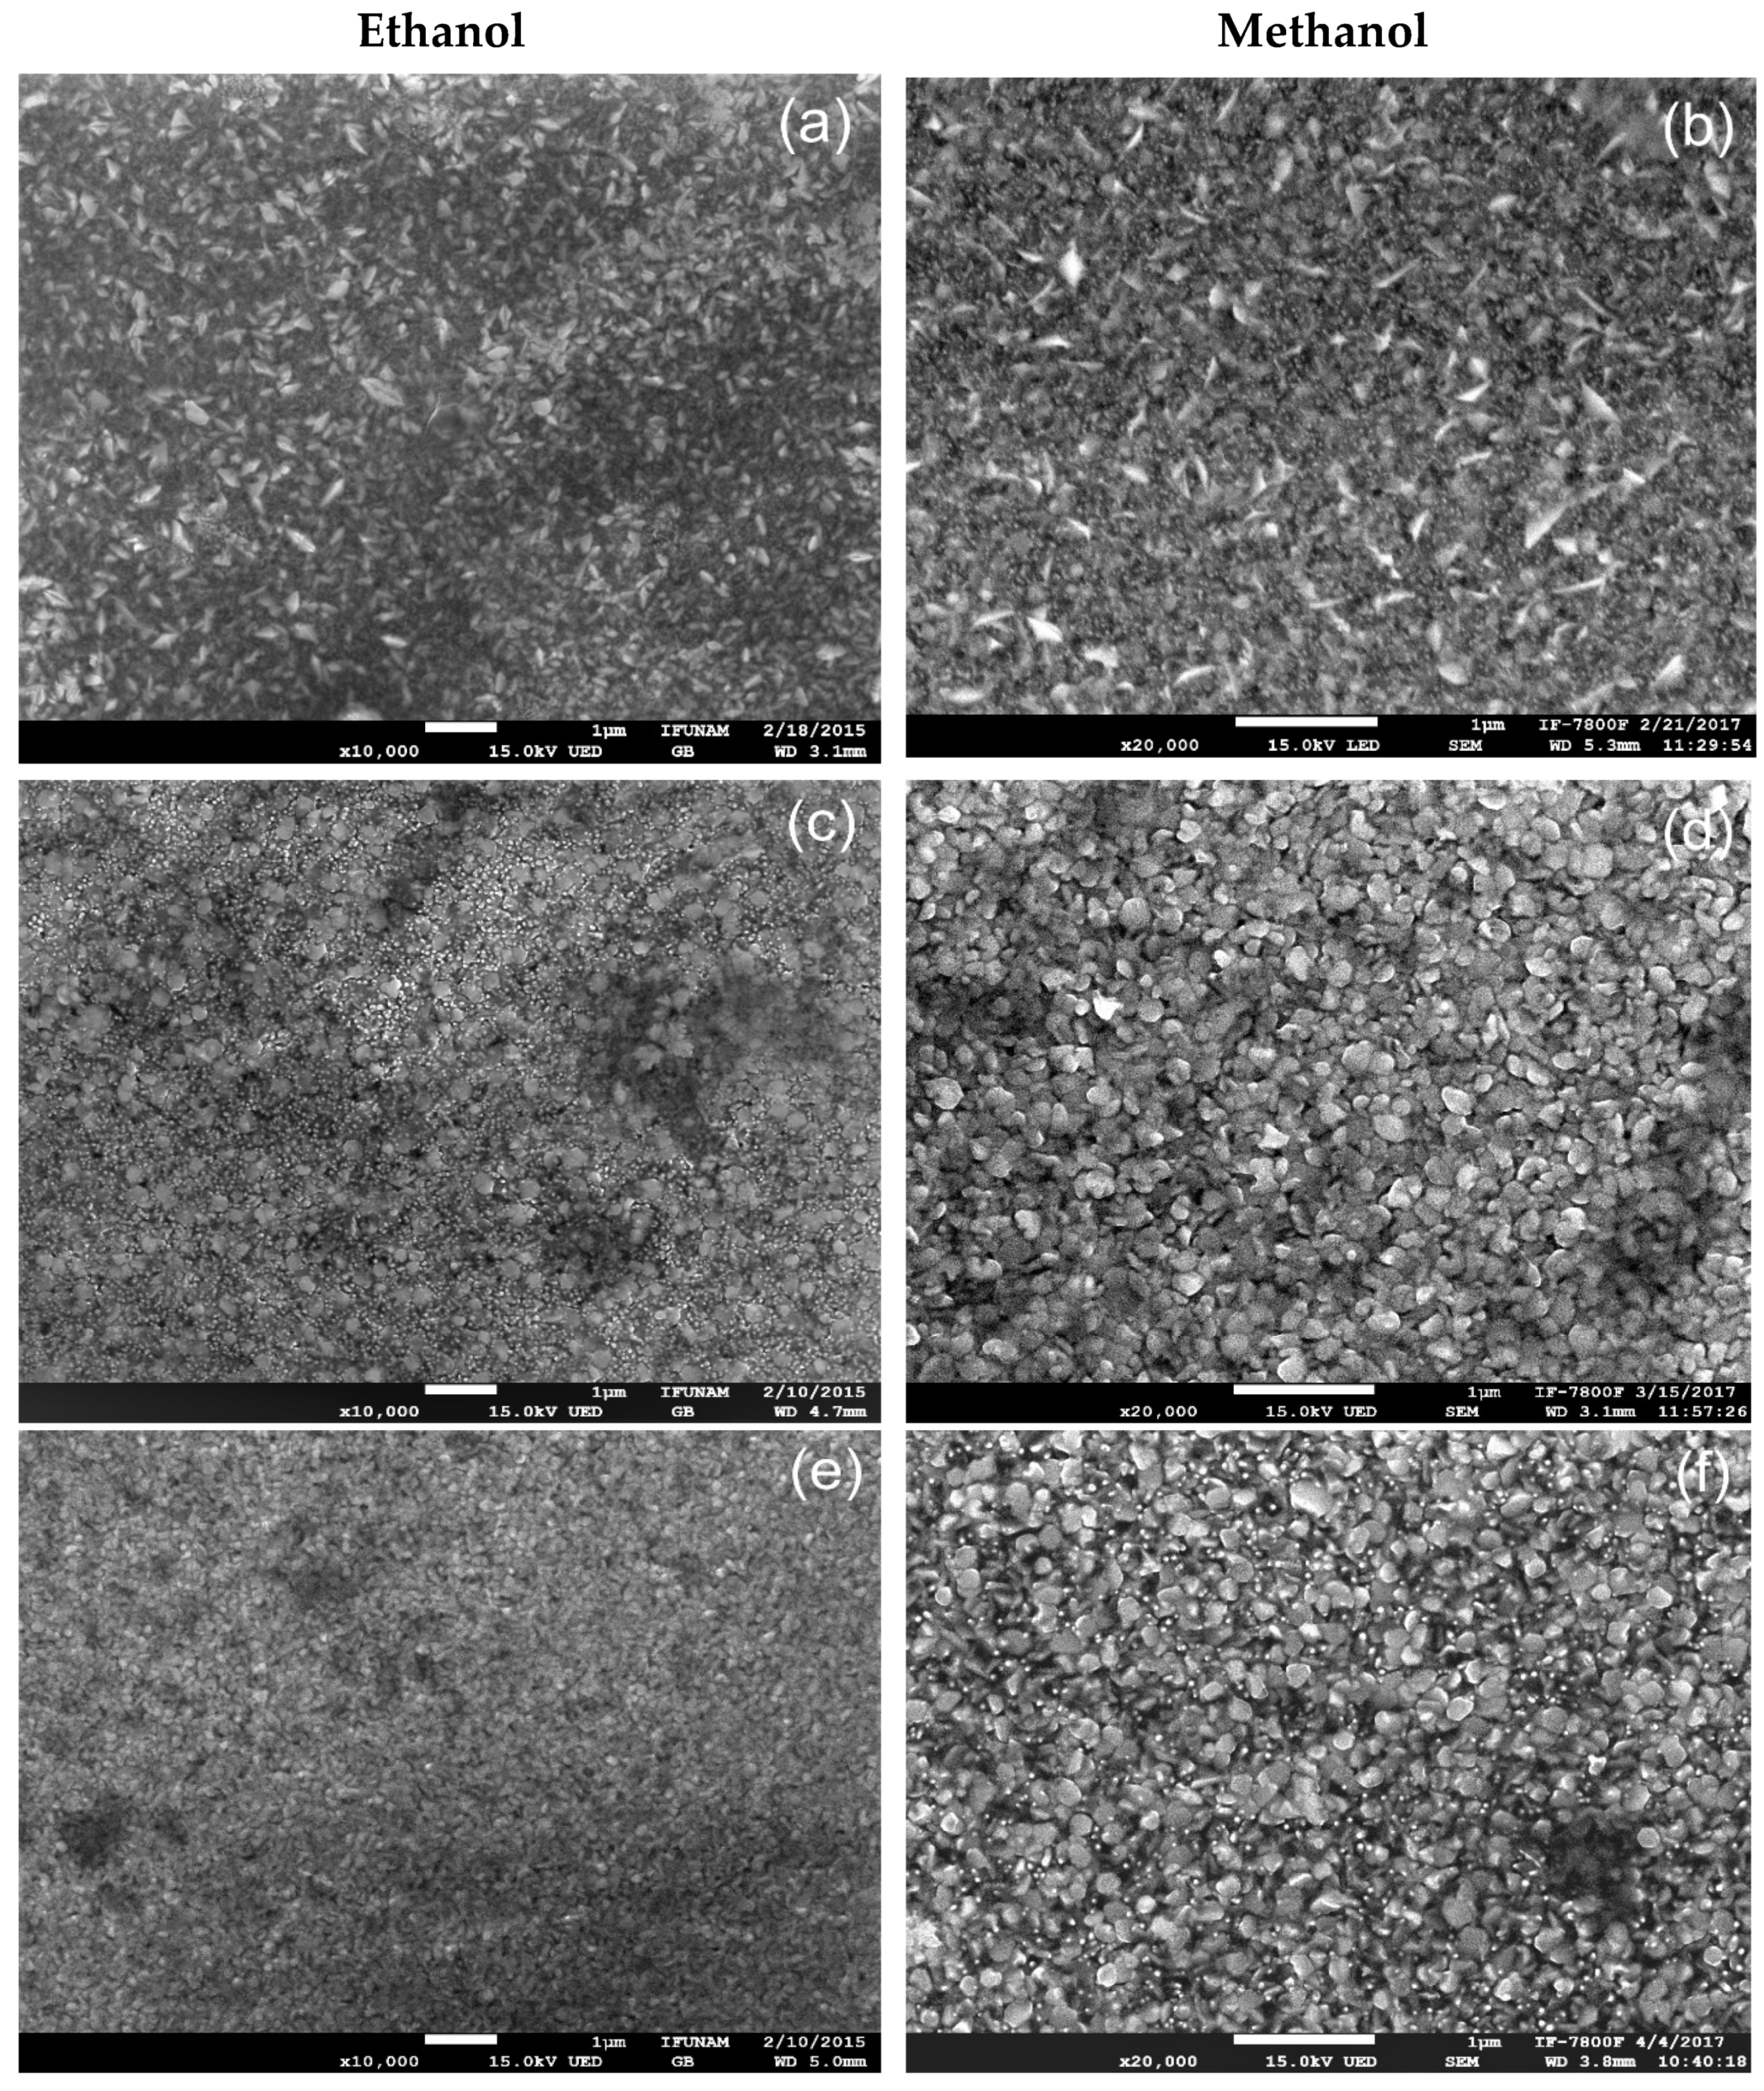
Figure 8 depicts SEM micrographs of ZnO films. The images exhibit dense, regular, and compact surfaces with various textures, grain sizes, and morphologies. The substrate temperature and the solvent used in the sprayed solution influence these characteristics.
When ethanol is used as the solvent to synthesize the films (
Figure 8(a),
Figure 8(c) and
Figure 8(e)), the grains form aggregates with different dimensions and forms. At 400 ºC, the grains have a flake-like shape, while at 450 and 500 ºC, they are rounded. The largest particles (233 nm average size) were obtained at 450 °C, while the tiniest particles (81 nm average size) were observed at 500 °C. In this case, the grain size increases at 450 °C and then decreases at 500 ºC.
The samples prepared with methanol (
Figure 8(b),
Figure 8(d), and
Figure 8(f)) showed changes in surface grain morphology as the substrate temperature changed. At 400 ºC, the grains had a flake-like shape, but at 450 ºC, there was a significant change: the particles transformed from flake-like to densely packed spherical grains. This shape was maintained for the films deposited at 500 ºC. The grain size increased, measuring 89 nm at 400 ºC, 130 nm at 450 ºC, and 148 nm at 500 ºC. These findings are essential for understanding grain morphology and have potential applications in materials science and nanotechnology for designing materials with specific grain sizes and shapes.
It is also worth noting that in both cases: ethanol and methanol, the grains exhibited a flake-like form at 400 ºC, but at higher temperatures, they became rounded when both solvents were used during the preparation of the films. It is also noticeable that the micrographs of the films prepared using methanol show an improvement in grain growth. This is because solutions with lower viscosity improved the grain growth during the spray pyrolysis process. Methanol and ethanol solvents have viscosities values of 0.594 mPa.s and 1.2 mPa.s, respectively. Wang et al. [
24] studied different aerosols generated with an ultrasonic nebulizer and found that viscosity has a crucial role during grain growth. They saw that when the viscosity of a solution decreases, the mean droplet size does as well, leading to an increase in the spray volume rate. In this case, a lower viscosity solution will provide a faster supply of the precursors to the substrate, which improves the growing mechanisms.
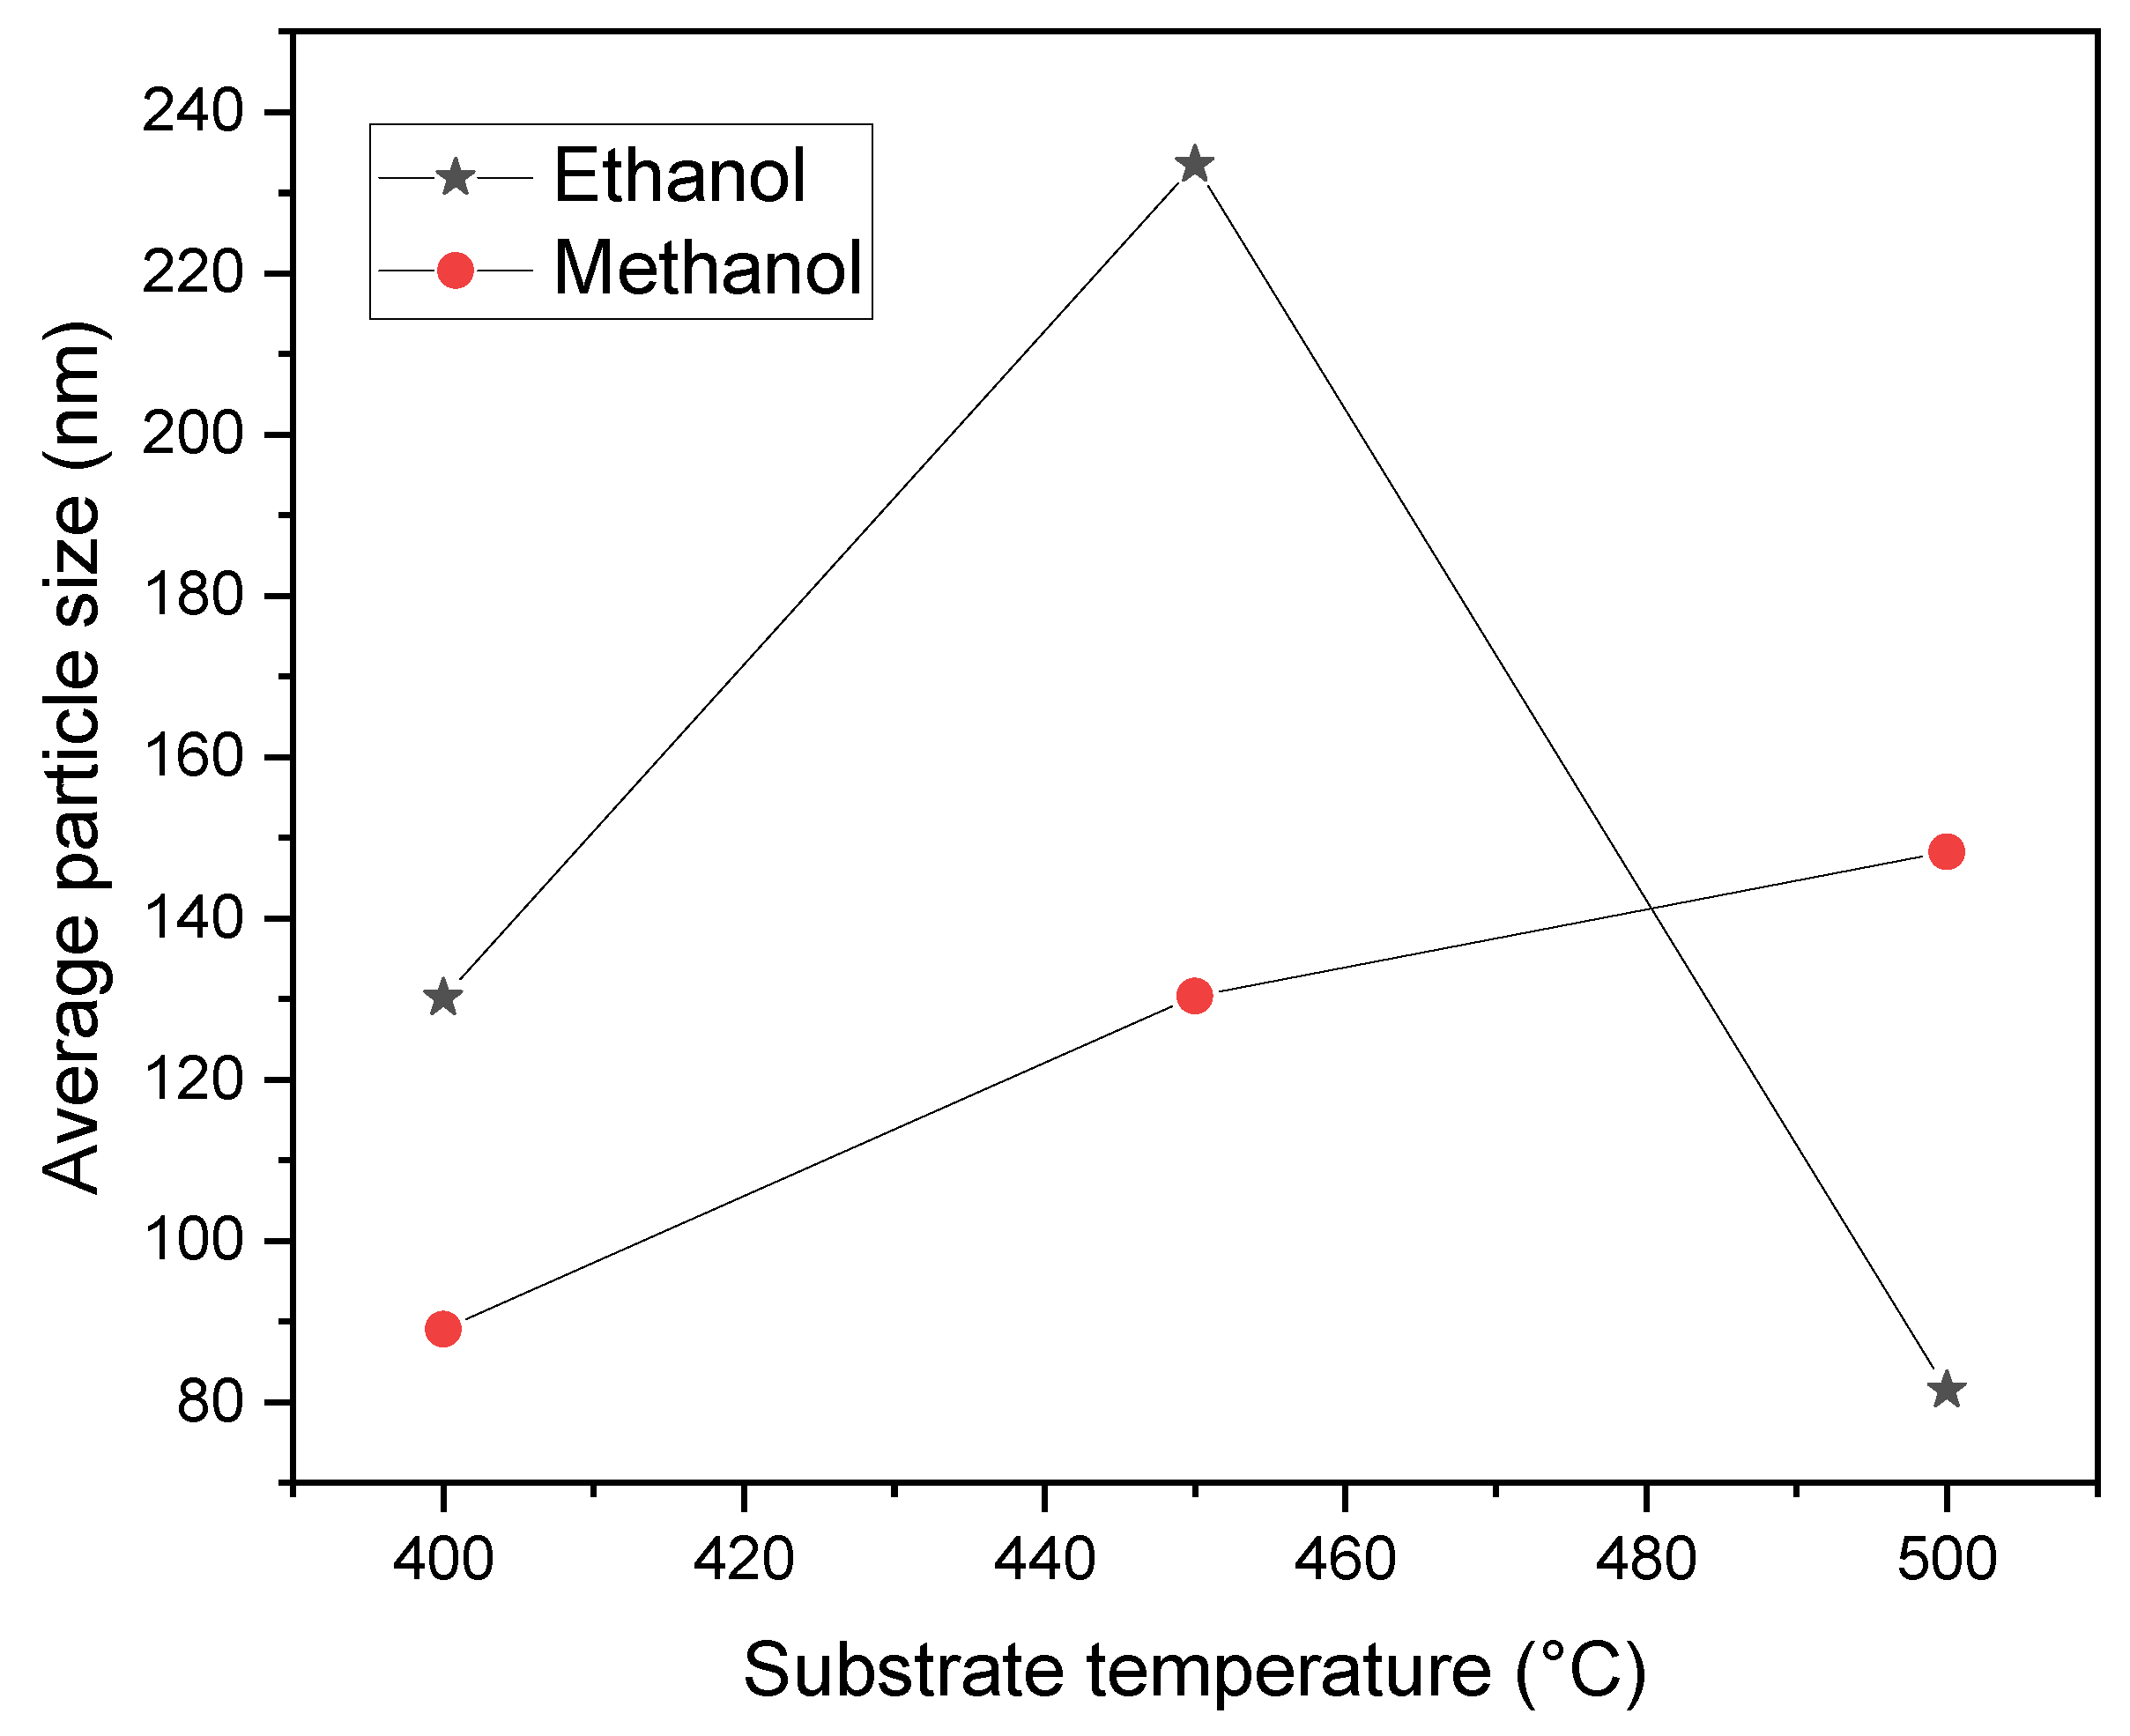
Figure 9 presents the relationship between the average particle size and the substrate temperature for the two solvents used in this study. The J-Image code was employed to measure the particle size with utmost accuracy. In the case of the methanol films, the average particle size increases as the temperature rises, as a consequence of an increment of the amount of Zn atoms, as is verified in
Figure 3. As we explained previously, the decreasing in viscosity of the solution led to an increment in the spray volume rate. As the sprayed solution increases, so does the Zn atoms that arrive at the substrate. While forming the ZnO film, the electrostatic interaction between solute particles becomes more significant, enhancing the probability of more solute particles coming together and forming a grain, increasing the particle size [
25].
On the other hand, in the case of ethanol, the average particle size tends to increase and then decrease with temperature. At temperatures of 400 and 450 ºC, these films show the same behavior as the methanol ones. However, at 500 ºC, the particle size decreases dramatically, which is contrary to the expected result. The same behavior was observed when examining the film thickness of the ethanol samples in
Figure 4. A more detailed study is required for substrate temperatures between 450 and 500 ºC to understand the changes in particle size and film thickness in the case of ethanol solution.
3.5. Electrical Results
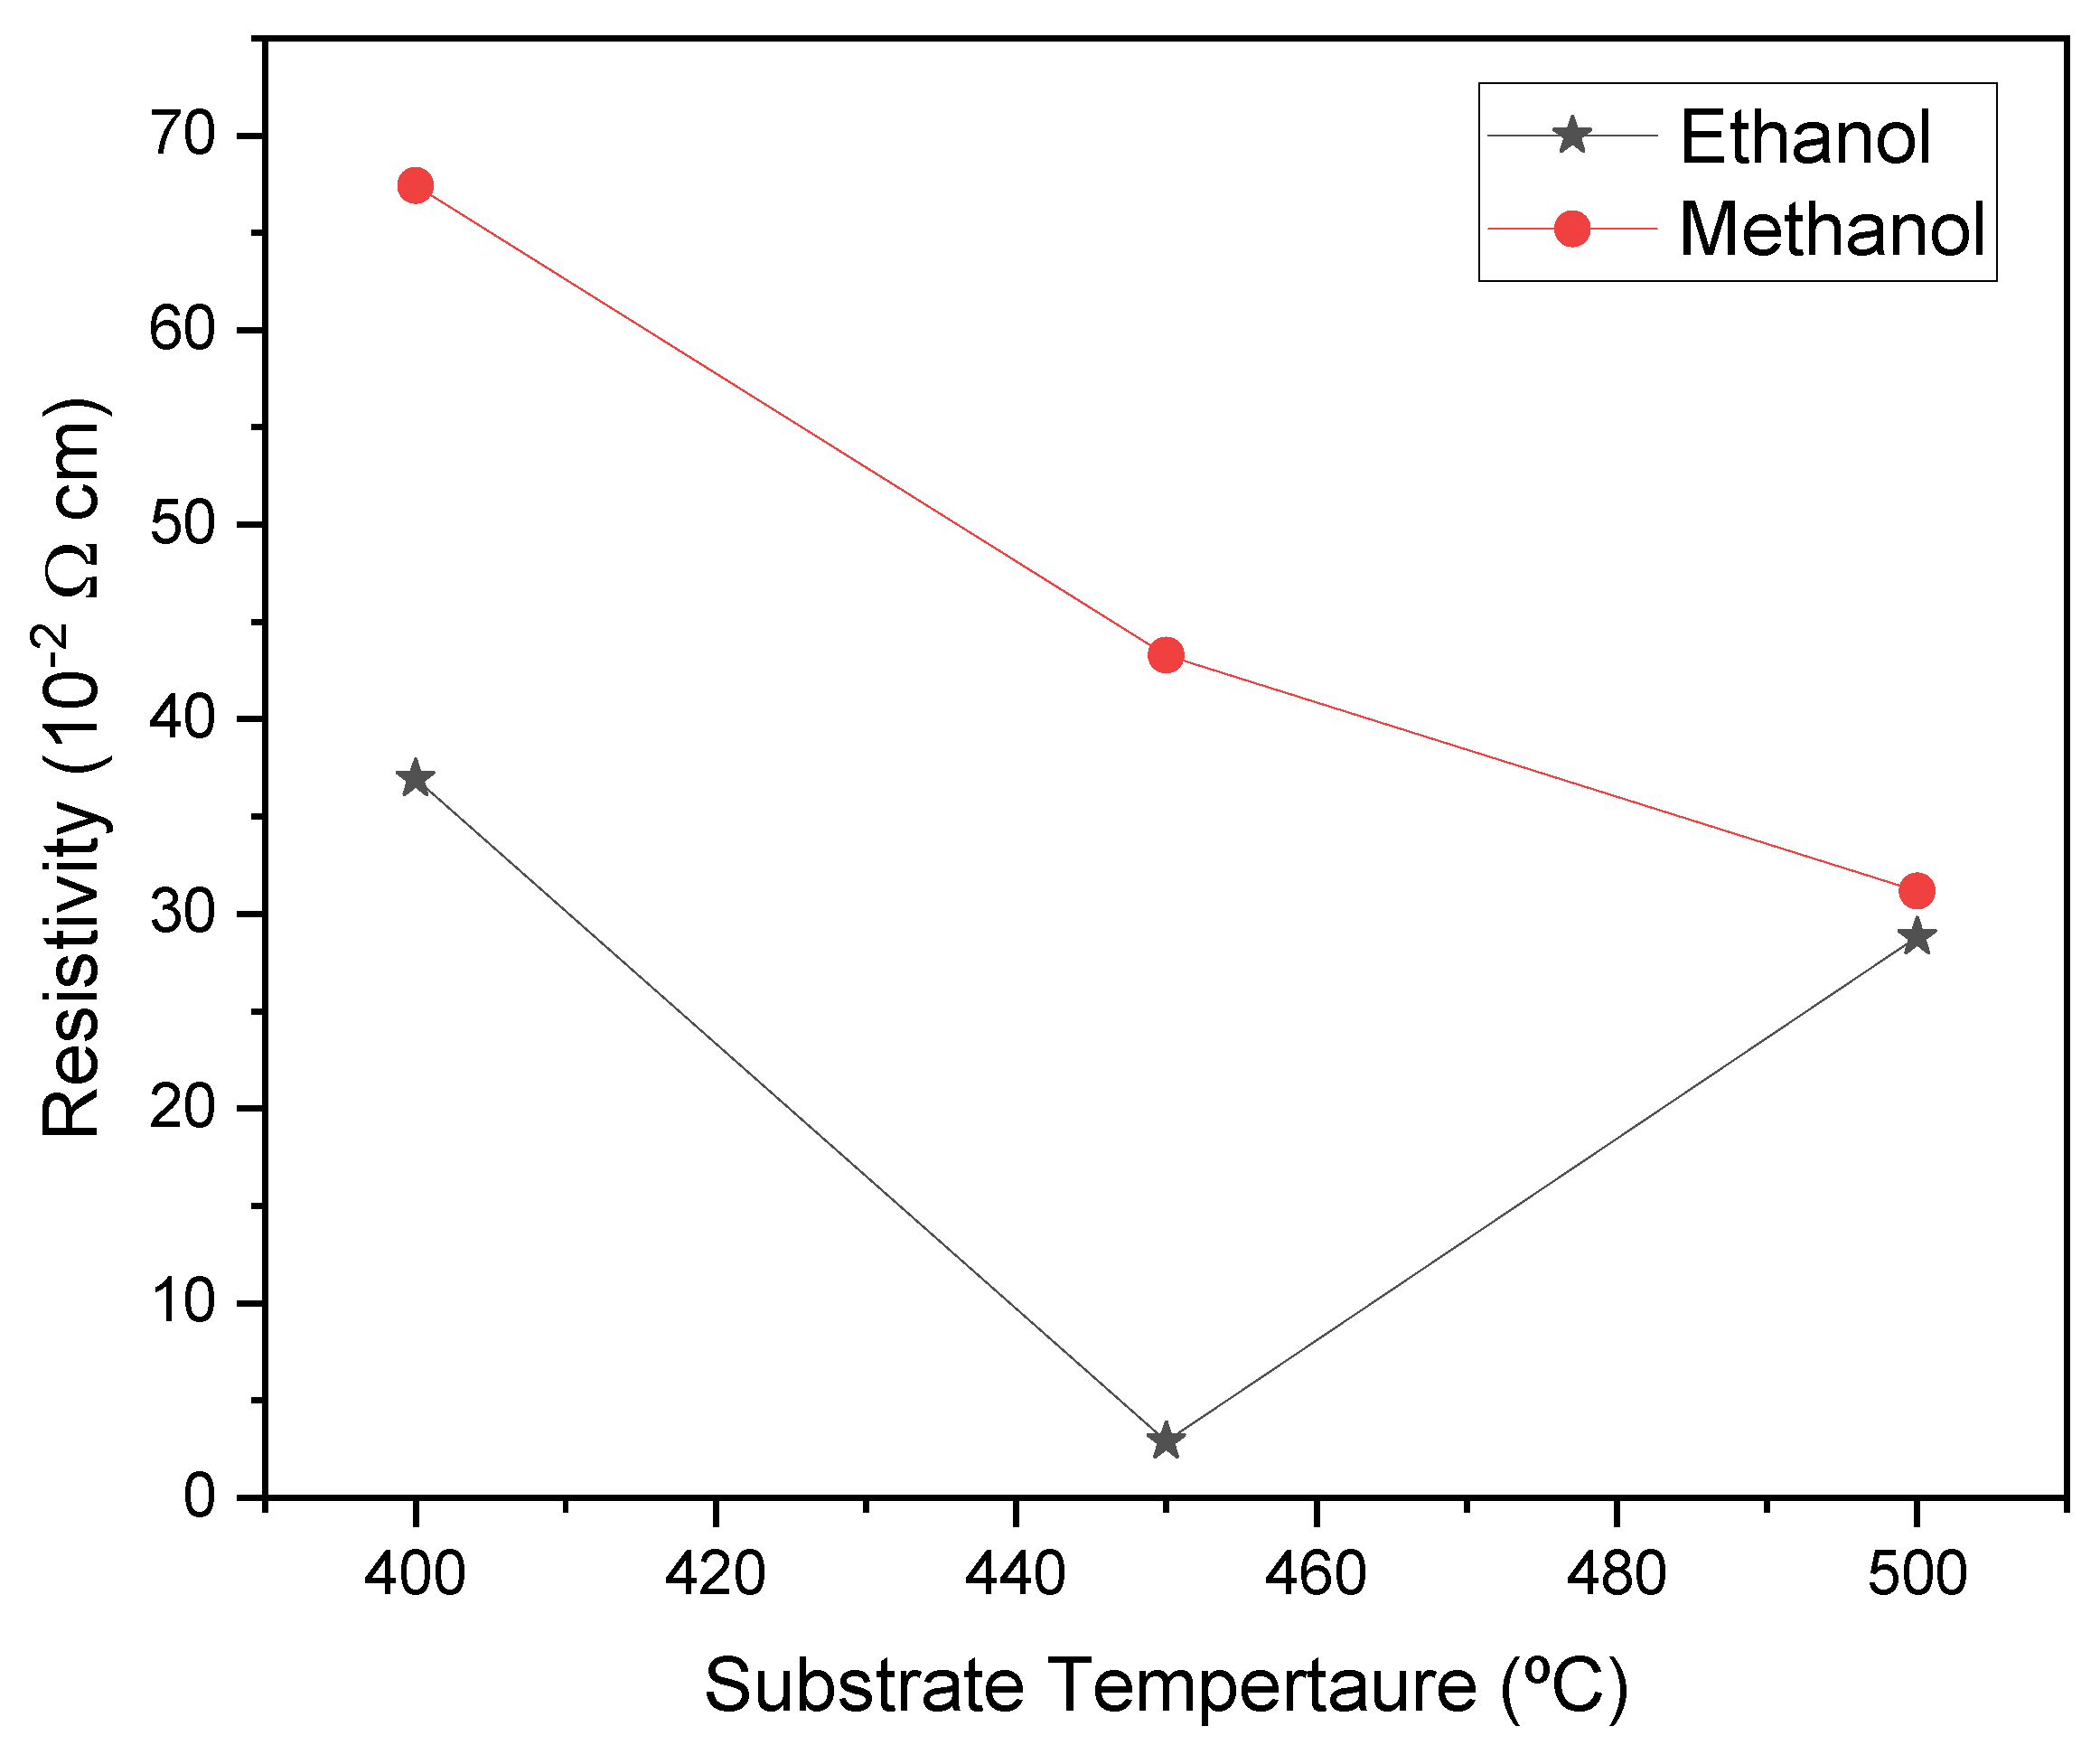
Figure 10 displays the resistivity of the films prepared at various temperatures using either ethanol or methanol as the solvent during the solution preparation. The resistivity of the films is consistently higher for the methanol samples, irrespective of the substrate temperature.
The resistivity of the films prepared with ethanol shows an interesting relationship with the samples' substrate temperature. The resistivity values, which start at 36.95×10
-2 Ωcm at 400 ºC, show a significant decrease to 2.91×10
-2 Ωcm at 450 ºC and then an increase to 28.81×10
-2 Ωcm at 500 ºC. These values are crucial and could potentially revolutionize electronic devices. The behavior we observed in our films may be linked to changes in particle size. Upon comparing
Figure 9 and
Figure 10, we noticed a clear correlation between resistivity and particle size: smaller resistivity is associated with larger particle size. This discovery is of utmost importance because it suggests that adjusting the particle size could effectively control the resistivity of ZnO films. This finding leads us to believe that there is a specific temperature, in our case 450 °C, which results in increased particle size and decreased resistivity of the films. This has the significant advantage of increasing the carrier concentration of ZnO.
The resistivity of the methanol samples decreases as the temperature increases. For instance, the film deposited at 500 °C reaches a minimum value of 31.17×10
-2 Ωcm. This can be attributed to the increased zinc ions in the film at higher temperatures, as shown in
Figure 3. The higher concentration of zinc ions enhances the free electron amount, leading to a decrease in the resistivity of the ZnO film. This behavior is consistent with the findings of Zaier et al. [
16] and Wen et al. [
26] They proposed that the improved structure of the films at elevated substrate temperatures contributes to the decrease in resistivity by enhancing electron mobility. Additionally, the increase in particle size, as seen in
Figure 9, also leads to higher electron mobility and contributes to the decrease in resistivity. Conversely, some researchers, such as Zahedi et al. [
27] also suggest that the reduction in resistivity may be due to an enhancement in crystal quality.
The main difference in resistivity between the samples prepared with ethanol or methanol solvents is that the ethanol films show a lower resistivity than the methanol ones for all the substrate temperatures, indicating that the carrier concentration is higher than the one obtained by methanol. The reason is that ethanol films present an enhanced concentration of Zn atoms and a large number of oxygen vacancies, as shown in
Figure 3, which creates a pair of free electrons and causes a decrease in the film’s resistivity [
23,
28,
29]. At 500 ºC, the differences in resistivity values of the samples when ethanol or methanol was used as the solvent during the synthesis of the films decreased, and the electrical properties almost coincided. This result shows that 500 ºC is a critical temperature for depositing ZnO thin films.
5. Conclusions
ZnO thin films were deposited onto soda-lime glass substrates using chemical spray pyrolysis at substrate temperatures of 400, 450 and 500 ºC. The precursor solution solvents used were either ethanol or methanol. Our findings show that the optical, structural, morphological, electrical, and elemental concentration properties of the ZnO thin films can be adjusted to suit various optoelectronic applications just by varying the precursor solvent. It was also observed that at 500 ºC, the ZnO thin films prepared with either ethanol or methanol exhibited almost the same high-quality crystallinity, stoichiometry, average crystallite size, energy band gap, and resistivity. These discoveries have the potential to influence future research and applications in this field, and they motivate us to continue our work with renewed inspiration. Our results indicate that the choice of the solvent medium is crucial in obtaining high-quality ZnO thin films and tailoring their physical properties.
Author Contributions
Conceptualization, D.A.; Methodology, D.A.; Validation, D.A.; Formal Analysis, A-L.; Investigation, D.A, A.L.; Resources, D.A, A.L.; Data Curation, A.L.; Writing – Original Draft Preparation, A.L.; Writing – Review & Editing, D.A, A.L.; Visualization, D.A.; Supervision, D.A.; Project Administration, D.A.; Funding Acquisition, D.A, A.L.”.
Funding
“This research was funded by UNAM DGAPA-PAPIIT, grant IN-101122.
Acknowledgments
The authors wish to acknowledge the technical assistance of Roberto Hernández, Diego Quiterio, Karim López, Francisco Javier Jaimes, Mauricio Escobar and Antonio Morales.
Conflicts of Interest
The authors declare no conflict of interest.
References
- Martínez, M.A.; Herrero, J.; Gutiérrez, M.T. Deposition of transparent and conductive Al-doped ZnO thin films for photovoltaic solar cells. Solar Energy Mater. & Solar Cells 1997, 45, 75–86. [Google Scholar]
- Purica, M.; Budianu, E.; Rusu, E. Heterojunction with ZnO polycrystalline thin films for optoelectronic devices applications. Microelectronic Engineering 2000, 51-52, 425–431. [Google Scholar] [CrossRef]
- Chen, F.; Ye, Z.; Xu, W.; Zhao, B.; Zhu, L.; Lv, J. Fabrication of p-type ZnO thin films via MOCVD method by using phosphorous as dopant source. J. of Crystal Growth 2005, 281, 458–462. [Google Scholar] [CrossRef]
- Groenen, R.; Loffler, J.; Sommeling, P.M.; Linden, J.L.; Hamers, E.A.G.; Schropp, R.E.I.; van de Sanden, M.C.M. Surface textured ZnO films for thin film solar cell applications by expanding thermal plasma CVD. Thin Solid Films 2001, 392, 226–230. [Google Scholar] [CrossRef]
- Pal, B.; Sharon, M. Enhanced photocatalytic activity of highly porous ZnO thin films prepared by sol-gel process. Materials Chemistry and Physics 2002, 76, 82–87. [Google Scholar] [CrossRef]
- Prasada Rao, T.; Santhoshkumar, M.C. Highly oriented (100) ZnO thin films by spray pyrolysis. Applied Surface Science 2009, 255, 7212–7215. [Google Scholar]
- Godbole, B.; Badera, N.; Shrivastava, S.; Jain, D.; Ganesan, V. Growth Mechanism of ZnO Films Deposited by Spray Pyrolysis Technique. Materials Sciences and Applications 2011, 2, 643–648. [Google Scholar] [CrossRef]
- Hafdallah, A.; Ferdi, A.; Aida, M.S.; Attaf, N.; Amara, A. Effect of substrate temperature studies on spray pyrolysis deposited ZnO thin films. International Journal of Advanced Research 2015, 3, 240–246. [Google Scholar]
- Vimalkumar, T.V.; Poornima, N.; Kartha, C.S.; Vijayakumar, K.P. Effect of precursor medium on structural, electrical and optical properties of sprayed polycrystalline ZnO thin films. Materials Science and Engineering: B 2010, 175, 29–35. [Google Scholar] [CrossRef]
- Mayer, M. SIMNRA User’s Guide, Version 6.04, Max Planck-Institute für Plasmaphysik, Garching.
- J.R. Tesmer and M. Nastasi, Ed. Handbook of Modern Ion Beam Materials Analysis, Ed. MRS, USA, 1995.
- W.K. Chu, J.W. Mayer and M.-A. Nicolet. Backscattering Spectrometry. Ed. Academic Press, USA, 1978.
- Mahajan, C.M.; Pendharkar, M.; Chaudhari, Y.A.; Sawant, S.S.; Ankamwar, B.; Takwale, M.G. Spray Deposited Nanocrystalline ZnO Transparent Electrodes: Role of Precursor Solvent. Journal of Nano-Electronic Physics 2016, 8, 02026. [Google Scholar] [CrossRef]
- Foo, K.L.; Kashif, M.; Hashim, U.; Liu, W.-W. Effect of different solvents on the structural and optical properties of zinc oxide thin films for optoelectronic applications. Ceramics International 2024, 40, 753–761. [Google Scholar] [CrossRef]
- Yang, J.; Wei, B.; Li, X.; Wang, J.; Zhai, H.; Li, X.; Sui, Y.; Liu, Y.; Wang, J.; Lang, J.; Zhang, Q. Synthesis of ZnO films in different solvents and their photocatalytic activities. Cryst. Res. Technology 2015, 50, 840–845. [Google Scholar] [CrossRef]
- Zaier, A.; El az, F.O.; Lakfif, F.; Kabir, A.; Boudjadar, S.; Aida, M.S. Effects of the substrate temperature and solution molarity on the structural opto-electric properties of ZnO thin films deposited by spray pyrolysis. Materials Science in Semiconductor Processing 2009, 12, 207–211. [Google Scholar] [CrossRef]
- Potter, D.B.; Parkin, I.P.; Carmalt, C.J. The effect of solvent on Al-doped ZnO thin films deposited via aerosol-assisted CVD. RSC Advances 2018, 8, 33164. [Google Scholar] [CrossRef] [PubMed]
- Powder Diffraction File 36-1451 for hexagonal ZnO, JCPDS-International Center for Diffraction data, 1997.
- B.D. Cullity. Elements of X-Ray Diffraction. 2nd Ed., Addison-Wesley, USA, 1998.
- Klung, H.P.; Alexander, L.E. X-ray Diffraction Procedures for Polycrystalline and Amorphous Materials, 2nd ed.; Wiley: USA, 1974. [Google Scholar]
- Hamidi, A.E.; Elmahboub, E.; Hichou, A.E.; Almaggoussi, A. Investigation of solvent effect on the structural morphological and optical properties of ZnO doped Mg elaborated by sol-gel method. Research and Reviews: Journal of Material Science 2022, 10, 17–23. [Google Scholar]
- Viezbicke, B.D.; Patel, S.; Davis, B.E.; Birnie, D.P., III. Evaluation of the Tauc method for optical absorption edge determination: ZnO thin films as a model system. Phys. Status Solid B 2015, 252, 1700–1710. [Google Scholar] [CrossRef]
- Benramache, S.; Rahal, A.; Benhaoua, B. The effects of solvent nature on spray-deposited ZnO thin film prepared from Zn (CH3COO)2, 2H2O. Optik 2014, 125, 663–666. [Google Scholar] [CrossRef]
- Wang, W.N.; Purwanto, A.; Lenggoro, I.W.; Okuyama, K.; Chang, H.; Jang, H.D. Investigation on the Correlations between Droplet and Particle Size Distribution in Ultrasonic Spray Pyrolysis. Ind. Eng. Chem. Res. 2008, 47, 1650–1659. [Google Scholar] [CrossRef]
- Prasada Rao, T.; Santhoshkumar, M.C. Effect of thickness on structural, optical and electrical properties of nanostructured ZnO thin films by spray pyrolysis. Applied Surface Science 2009, 255, 4579–4584. [Google Scholar]
- Wen, R.; Wang, L.; Wang, X.; Yue, G.-H.; Chen, Y.; Peng, D.-L. Influence of substrate temperature on mechanical, optical and electrical properties of ZnO: Al films. Journal of Alloys and Compounds 2010, 508, 370–374. [Google Scholar] [CrossRef]
- Zahedi; Dariani; Rozati, R.S.; Structural, S.M. Optical and Electrical Properties of ZnO Thin Films Prepared by Spray Pyrolysis: Effect of Precursor Concentration. Bull Mater Sci 2014, 37, 433–439. [Google Scholar] [CrossRef]
- Muruganantham, G.; Ravichandran, K.; Saravanakumar, K.; Ravichandran, A.T.; Sakthivel, B. Effect of solvent volume on the physical properties of undoped and fluorine-doped tin oxide films deposited using a low-cost spray technique. Superlattices and Microstructures 2011, 50, 722–733. [Google Scholar] [CrossRef]
- Sivalingam, D.; Gopalakrishnan, J.B.; Balaguru Rayappan, J.B. Influence of precursor concentration on structural, morphological and electrical properties of spray deposited ZnO thin films. Crystal Research and Technology 2011, 46, 685–690. [Google Scholar] [CrossRef]
Figure 1.
Typical RBS spectra of ZnO thin film grown at 450 ºC, using ethanol as the solvent.
Figure 1.
Typical RBS spectra of ZnO thin film grown at 450 ºC, using ethanol as the solvent.
Figure 2.
Comparison of the RBS spectra of ZnO thin films prepared at 450 ºC, using ethanol and methanol as the solvent in the sprayed solution.
Figure 2.
Comparison of the RBS spectra of ZnO thin films prepared at 450 ºC, using ethanol and methanol as the solvent in the sprayed solution.
Figure 3.
Zinc atomic concentration versus the substrate temperature in ZnO thin films synthesized using ethanol or methanol as the solvent.
Figure 3.
Zinc atomic concentration versus the substrate temperature in ZnO thin films synthesized using ethanol or methanol as the solvent.
Figure 4.
ZnO film’s thickness versus the substrate temperature.
Figure 4.
ZnO film’s thickness versus the substrate temperature.
Figure 5.
XRD analysis of ZnO films deposited at (a) 400ºC, (b) 450ºC and (c) 500ºC.
Figure 5.
XRD analysis of ZnO films deposited at (a) 400ºC, (b) 450ºC and (c) 500ºC.
Figure 6.
Optical transmittance spectra of the samples deposited at (a) 400ºC, (b) 450ºC, and (c) 500ºC, using ethanol and methanol as solvents in the spray solution.
Figure 6.
Optical transmittance spectra of the samples deposited at (a) 400ºC, (b) 450ºC, and (c) 500ºC, using ethanol and methanol as solvents in the spray solution.
Figure 7.
Optical band gap of ZnO thin films deposited at different substrate temperatures.
Figure 7.
Optical band gap of ZnO thin films deposited at different substrate temperatures.
Figure 8.
SEM micrographs show ZnO films deposited at 400 ºC, 450 ºC and 500 ºC. Micrographs (a), (c), and (e) correspond to the ethanol solvent, while micrographs (b), (d), and (f) correspond to the methanol solvent.
Figure 8.
SEM micrographs show ZnO films deposited at 400 ºC, 450 ºC and 500 ºC. Micrographs (a), (c), and (e) correspond to the ethanol solvent, while micrographs (b), (d), and (f) correspond to the methanol solvent.
Figure 9.
The average particle size versus substrate temperature.
Figure 9.
The average particle size versus substrate temperature.
Figure 10.
Variation of resistivity of the ZnO films as a function of substrate temperature for ethanol and methanol solvents.
Figure 10.
Variation of resistivity of the ZnO films as a function of substrate temperature for ethanol and methanol solvents.
Table 1.
Lattice constants of ZnO thin films prepared 400, 450 and 500 ºC.
Table 1.
Lattice constants of ZnO thin films prepared 400, 450 and 500 ºC.
Substrate
Temperature (ºC) |
a (nm) Ethanol |
c (nm) Ethanol |
c/a
Ethanol |
a (nm)
Methanol |
c (nm)
Methanol |
c/a
Methanol |
| 400 |
0.3365 |
0.5444 |
1.6178 |
0.3365 |
0.5197 |
1.5444 |
| 450 |
0.3375 |
0.5444 |
1.6130 |
0.3365 |
0.5425 |
1.6121 |
| 500 |
0.3365 |
0.5431 |
1.6139 |
0.3365 |
0.5431 |
1.6139 |
Table 2.
The average size (D) of the crystallite in the samples of ZnO.
Table 2.
The average size (D) of the crystallite in the samples of ZnO.
| Substrate temperature (ºC) |
Average size of the crystallite prepared with ethanol (nm) |
Average size of the crystallite prepared with methanol (nm) |
| 400 |
36.52 |
29.16 |
| 450 |
31.21 |
29.98 |
| 500 |
35.45 |
34.78 |
|
Disclaimer/Publisher’s Note: The statements, opinions and data contained in all publications are solely those of the individual author(s) and contributor(s) and not of MDPI and/or the editor(s). MDPI and/or the editor(s) disclaim responsibility for any injury to people or property resulting from any ideas, methods, instructions or products referred to in the content. |
© 2024 by the authors. Licensee MDPI, Basel, Switzerland. This article is an open access article distributed under the terms and conditions of the Creative Commons Attribution (CC BY) license (http://creativecommons.org/licenses/by/4.0/).
