1. Introduction
Hydrogen fuel has generated substantial recent interest in the scientific community because of the need for sustainable fossil fuel substitutes. In particular 'green hydrogen' that is produced via electrolysis using renewable energy sources has made substantial progress (Kojima et al., 2023; Oliveira et al., 2021). Although only 5% of hydrogen is currently generated from the electrolysis process, it is expected to increase to 25% by 2050 (Shiva Kumar and Lim, 2022; Wang et al., 2022). Despite a promising path for energy storage and carbon neutrality, integration of hydrogen (H2) production with the existing power grid still remains inefficient when compared directly with contemporary battery storage technologies, especially considering recent improvements in lithium battery systems (Pellow et al., 2015; Vidas and Castro, 2021). One promising approach to reduce green hydrogen costs is using surplus power from solar photovoltaic (PV) systems that exceeds immediate energy demands (Al-Buraiki and Al-Sharafi, 2022; Ural and Gencoglu, 2014). This approach has the advantage of utilizing renewable energy more effectively, but also avoids some of the limitations associated with grid dependency like energy transmission losses (Energy.gov, 2022), grid congestion, inequitable compensation for solar generators (Schelly et al., 2017; Prehoda et al., 2019) and the variability in grid electricity prices (Kirk, 2022).
In order to achieve fully renewable H2 production it is necessary to establish comprehensive setups which not only utilize PV power efficiently, but also integrate it with electrolyzer technologies (Song et al., 2022). AEM electrolyzer represent the most promising approach to electrolysis due to their potential for higher efficiency (Falcão, 2023). Optimizing PV systems and batteries specifically for AEM technology, however, requires detailed discussion and analysis to tailor the energy supply to the unique demands of these electrolyzer (Khalilnejad et al., 2016). Implementing a structured operating schedule to maximize energy efficiency and H2 output is fundamental for practical application of these technologies (Song et al., 2022), including optimization of the PV system’s performance to align with the operational characteristics of AEM electrolyzer (Falcão, 2023; IRENA, 2020). Despite this potential, the literature that focuses on direct use of PV power from DC bus for electrolysis remains sparse, with very few studies detailing the entire setup of such systems (De Lorenzo et al., 2022; Guilbert and Vitale, 2020).
Within this research area, DC-DC converters are essential components for directly DC bus connected PV-powered hydrogen production, but are only commercially available from a few companies that offer custom solutions (Absopulse Electronics Ltd, 2024; “Elejoy,” 2024; “Mean Well,” 2024). There are studies on open-source adjustable DC-DC converters, but they are limited to low-power, laboratory-scale models that utilize dSPACE processor-based control systems (Brunoro and Vieira, 1999; Koch et al., 2022). Online resources provide guides for constructing low-power buck converters using direct integrated circuits (ICs) (alayi, 2024; Podlesnyi, 2024), which are only suitable for low power devices and not programmable. Similarly, commercially available adjustable DC-DC converters are often based on a non-programable IC (Drok, 2024). These limitations explain why traditional electrolysis setups, rely on relatively inefficient AC-DC converters, which introduces additional stages of energy conversion and leads to increased losses and costs (Starke et al., 2008). Thus, one approach to overcome this challenge is the development of a low-cost DC-DC converter, which is a crucial step towards efficiency improvement of electrolytic hydrogen production systems. Previous work has shown an effective method to decrease costs for such components is to use an open hardware design methodology (Oberloier and Pearce, 2018; Pearce, 2020). Due to unavailability and poor access to DC-DC adjustable converters in both the market and the open-source community, this work develops a customizable step-down converter is a DC-to-DC converter (buck converter). Current and voltage controls are integrated using an Arduino microcontroller. Despite the availability of some commercial options with inadequate voltage regulation and lacking constant current-constant voltage (CC-CV) control, this project aims to create an open-source solution that fills the existing void, particularly for applications that require more robust capabilities, like running an anion exchange membrane (AEM) electrolyzer.
Filling these knowledge gaps, this study introduces a comprehensive renewable H2 production setup combined by a structured operating schedule to align PV performance with AEM electrolyzer characteristics. First an open-source DC-DC adjustable converter is designed, prototyped, and tested to enable the AEM to operate at its optimum efficiency without disrupting the continuous operation of existing loads. Predicting realistic and reliable H2 production rates at daily, monthly, and yearly scale is needed to provide a clear understanding of operational efficacy and sustainability of such systems. Thus, this hardware is combined by a structured operating schedule to align PV performance with AEM electrolyzer characteristics, where the AEM efficiency and flow rate has been taken into consideration. Finally, the performance of the open-source converter was compared with a lab bench power supply by monitoring the hydrogen production flow rate at a specific power level and the quality of the produced hydrogen. The results are presented and discussed in the context of both the potential for green hydrogen as well as accelerating PV deployment.
2. Methods
Currently developed PV-powered electrolyzer systems utilize both PV and grid power (Hassan et al., 2015; Rouholamini and Mohammadian, 2015) to operate at higher efficiency or are directly tied to PV as an only load (Atlam et al., 2011; Đukić and Firak, 2011; Maeda et al., 2012). The latter typically operate while the PV power is available, making them dependent on solar availability (Khalilnejad et al., 2016; Muhammad-Bashir et al., 2020; Rahim et al., 2015). This research addresses a different aspect by targeting the use of surplus energy produced by an installed PV system that exceeds the load. The aim is to operate the AEM to reduce or utilize this surplus energy for producing and storing hydrogen. To facilitate easy integration with any existing system, it is necessary to develop a DC-DC adjustable converter. This converter will enable the AEM to operate at its optimum efficiency without disrupting the continuous operation of existing loads. This approach ensures that the surplus energy is effectively utilized, enhancing the overall efficiency and sustainability of the PV system.
Although in the context of a conventional PV system, the AEM will function as a non-critical load and can be operated based on the availability of excess PV power, it is important to operate at the highest efficiency of the AEM. To achieve this, a small portion of existing battery capacity will be utilized for power leveling, allowing operation at a fixed current and voltage according to the AEM efficiency data. Thus, the system does not require any addition battery to optimize based on the load as might be done for a conventional PV battery system; the focus, instead, is on optimizing the AEM operation time and duration to maximize operational hours without depending on the battery. The battery is thus much smaller and less costly than a conventional PV battery system. To accomplish this a scheduling scheme is necessary for the AEM operation for maximizing the total yearly H2 production by ensuring optimal AEM operation at fixed power while utilizing a small battery capacity. The operating time for all the days within a specific month was assumed to be the same, thereby minimizing the impact of the unpredictable nature of PV generation. A scheduling scheme is developed and simulated with Solar Alone Multi-objective Advisor (SAMA) open source software to provide an estimation of operating time and schedule (Ali Sadat et al., 2023; Sadat and Pearce, 2023). This approach will also provide a scheme for all other non-critical load operating times based on available PV power, allowing for the reduction of PV power wastage without the need to increase battery size and concomitant costs.
2.1. AEM Specification and Setup
The AEM electrolyzer (Cipher Neutron, Toronto, Canada) has an operating voltage ranging between 0 V up to 6.6 V. The electrolyzer has 3 cells and the plates area is 50 cm
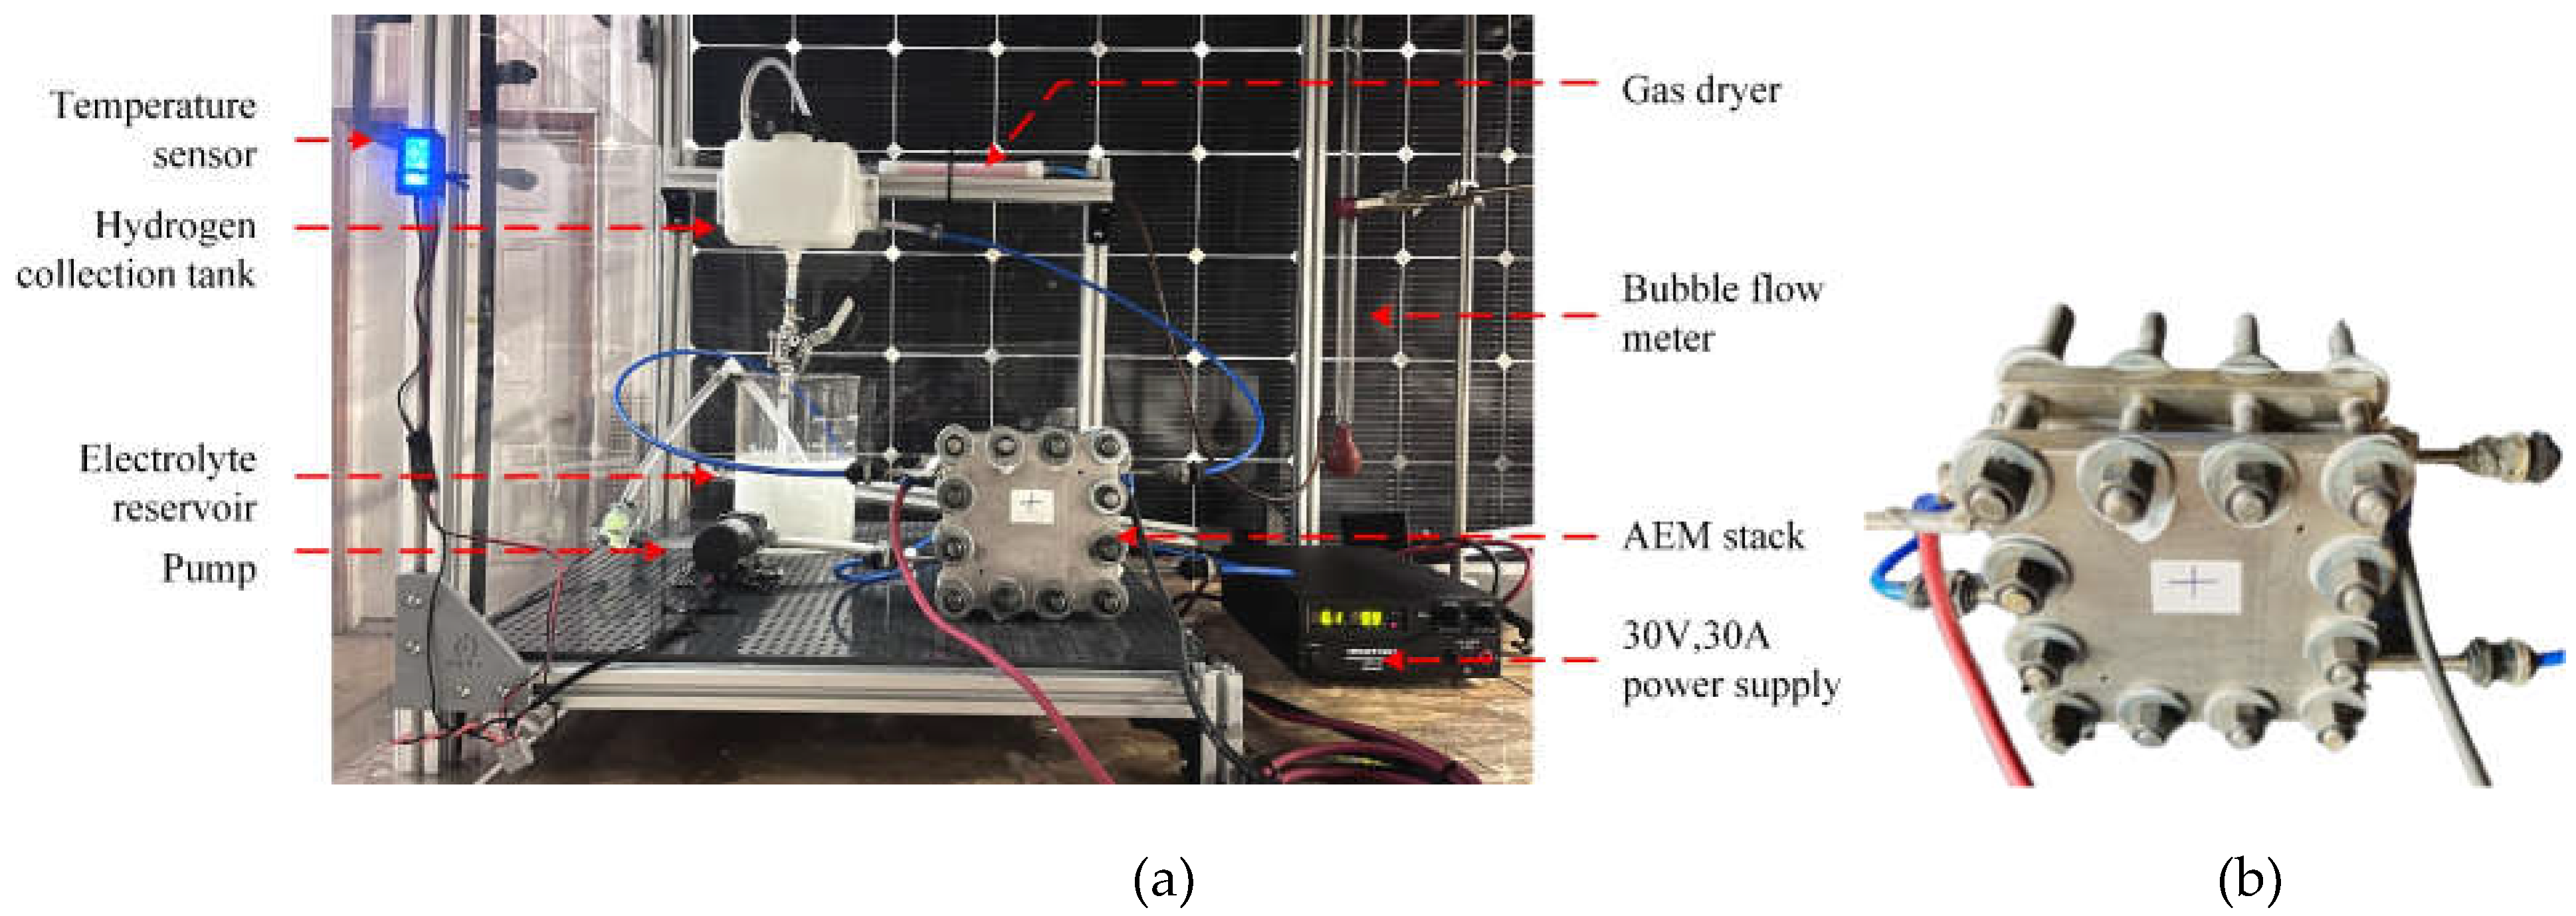
2 with a current range up to 50 A at 70 °C. The electrolyzer cell and the setup of the experiment is shown in
Figure 1. Tests were completed at room temperature (20 °C) with a solution of 1 mole concentration of potassium hydroxide (KOH). The lower flow rate at minimum supplied power was measured with a manual bubble flowmeter (SUPELCO 2-0433, Pennsylvania, USA) and repeated three times for each reading. The instrument flow rate was measured at different current levels in intervals of 2 A, from 2 A to 16 A using first an adjustable power supply by Circuit Test model PSC-6632 (Burnaby, Canada) (87% conversion efficiency) and comparing the results with the open-source adjustable DC-DC converter developed in this research work. Considering an additional power requirement of 35 W for the pump and sensors, the total continuous power requirement of 100 W is required for the AEM. To analyze the purity of H
2 produced by the AEM, hydrogen was collected and tested in the micro gas chromatograph (MicroGC) Varian CP-4900 (California, USA). The efficiency of the AEM is determined by equation 1.
2.2. System Design
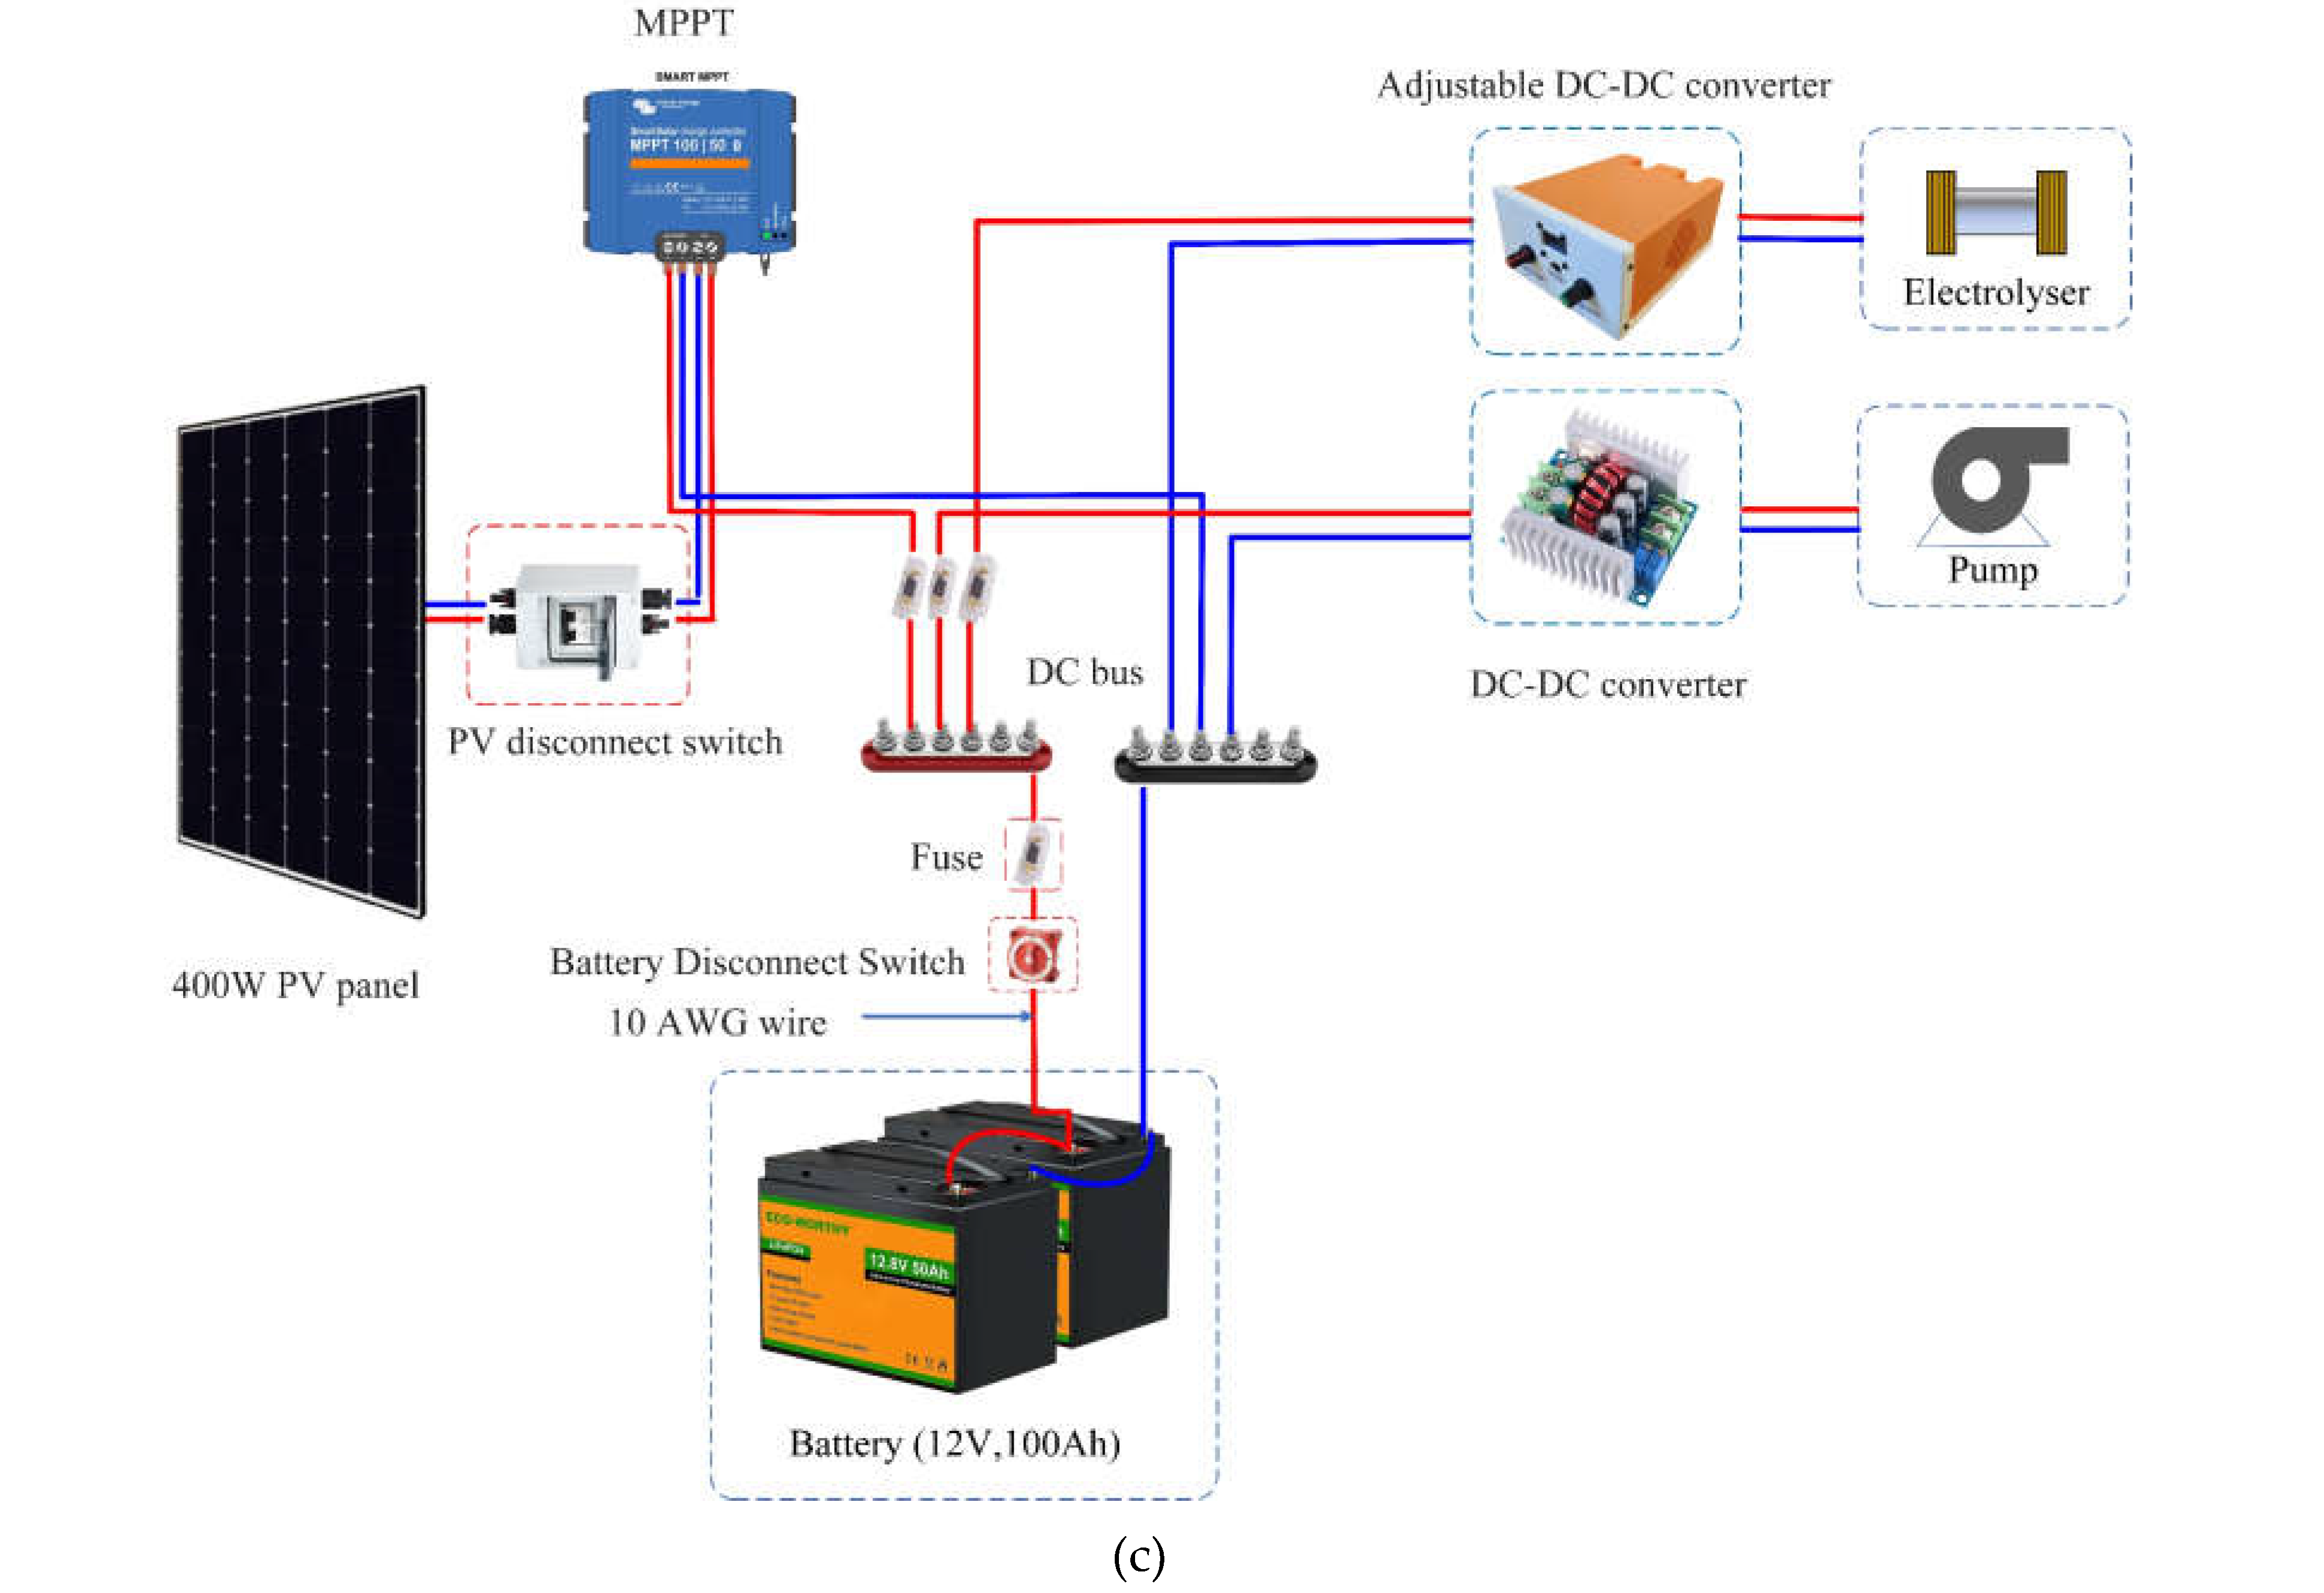
To simplify this research, PV-generated power data equivalent to a 400 W PV module is considered as the system's excess power to representing an existing setup with surplus PV-generated data. To limit the dependency on the battery, only two 12 V, 50 Ah batteries are considered as part of the existing surplus system. The aim is to integrate the AEM with the 12 V system for harnessing PV energy while taking full advantage of PV generated power. To operate the AEM at its optimal efficient current, an adjustable DC-DC converter with constant voltage and constant current capabilities ranging from 0-12 V and 0-20 A is designed and another 12 V converter is used to supply power to the pump and temperature sensor, while the pump requires maximum of 4 A at 12 V. To integrate the PV system with the DC bus bar, a maximum power point tracker (MPPT) rated at 30 A is employed.
2.3. AEM Scheduling
In a particular system with a defined surplus energy capacity, the objective is to optimize AEM scheduling only utilizing the excess energy without relying on the battery and primarily operating based on PV power generation.
Method 1: To utilize the excess energy without adding additional batteries into consideration and without disrupting the operation of the existing load, scheduling is possible only based on excess PV data. When the excess energy exceeds the optimal operating power of the electrolyzer, the AEM will turn on; otherwise, it will remain off. While this approach utilizes PV energy, the unpredictable nature of PV results in an unpredictable AEM schedule, necessitating automation of the system.
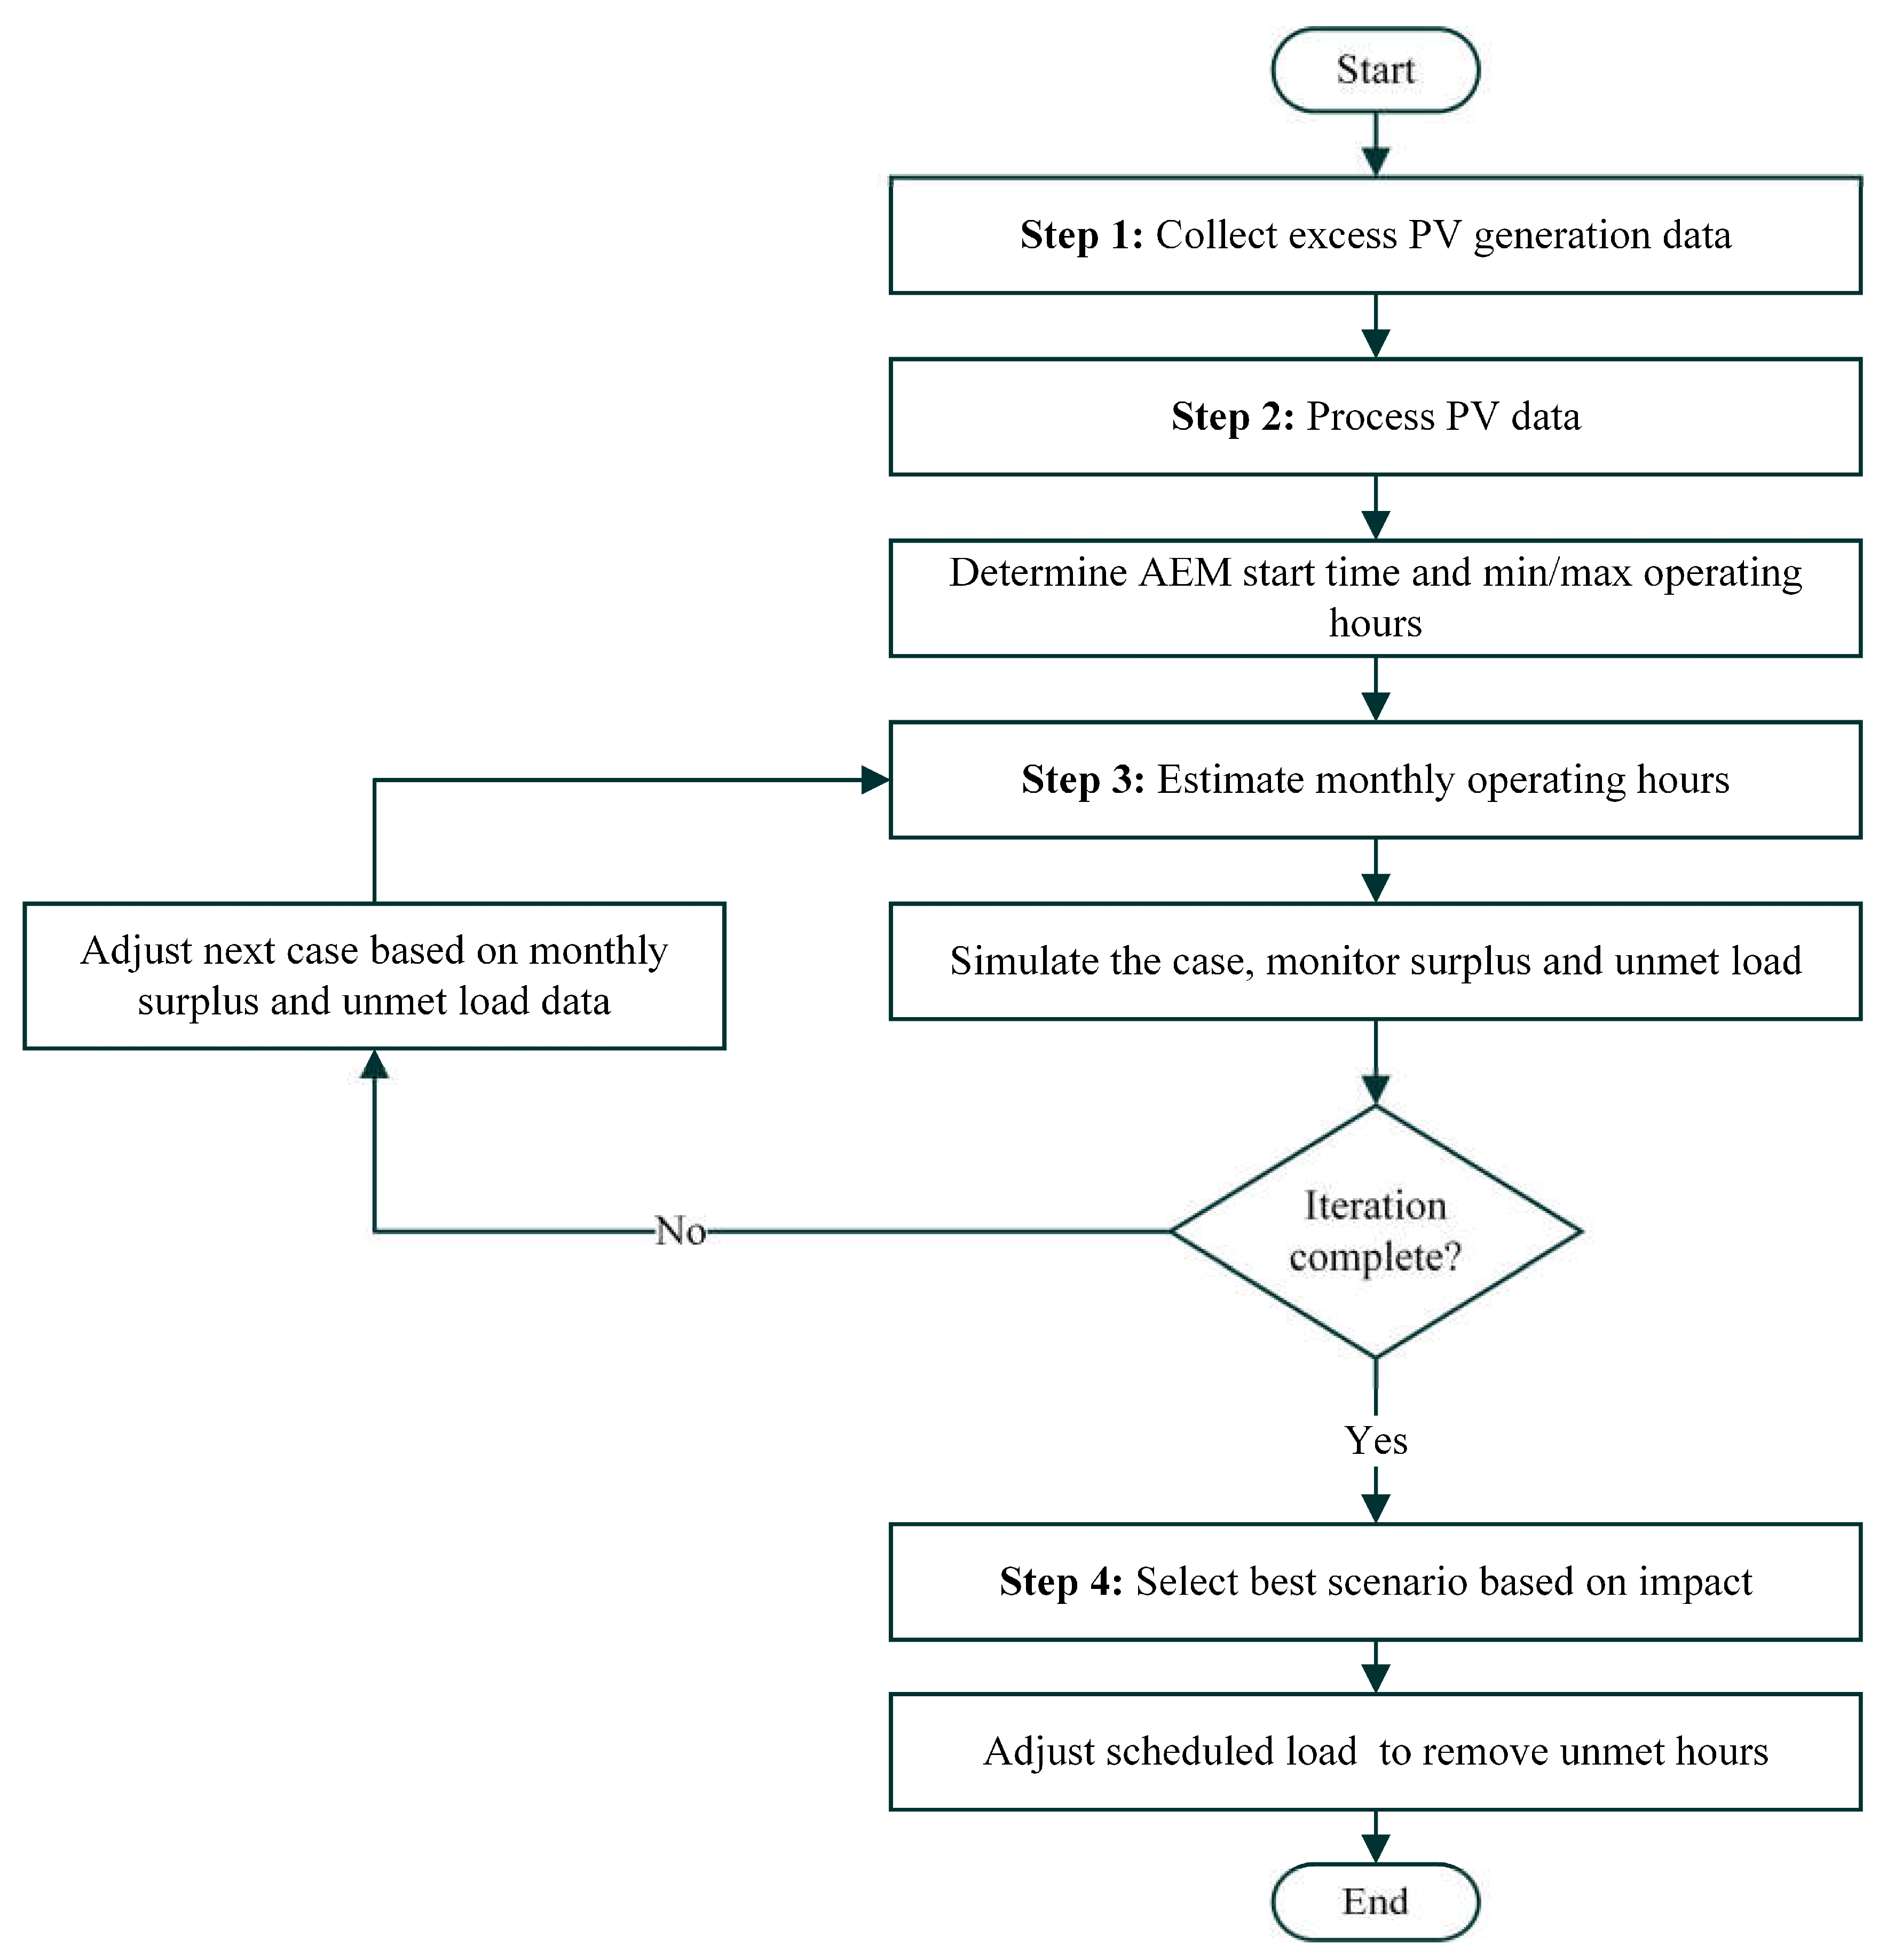
Method 2: To achieve more control over scheduling and ensure continuous, uninterrupted operation consistent throughout each day of the month, with only the pattern varying from month to month, the scheduling of the off grid electrolyzer can be done based on two factors: the optimal daily operating hours of the electrolyzer and the start and end times of its operation. These two factors can be optimized to minimize PV power wastage and unmet load. This approach is the opposite of the PV and battery optimization technique. Here the plan is to schedule the load in such a way that PV wastage and unmet loads are minimized. In this context, unmet load refers to instances where, despite efforts to minimize PV wastage, the scheduled AEM operation may be interrupted as the AEM operation schedule for all the days of a month remains the same, while there are variations in solar irradiance patterns throughout the month. The following steps have been taken to determine the optimal scheduling of load.
Step 1. Collect monthly PV generation data at the optimal tilt angle of 34° to maximize annual energy production for case study location of London, Ontario, Canada.
Step 2. Process the PV data to calculate the average PV generation for each hour of a day, separately for each month. This 24-hour data is used to set the optimal AEM starting time based on average hourly PV power exceeding the electrolyzer power demand. This step also provides the minimum operating hours for each month, calculated from the number of consecutive hours when PV generation surpasses the electrolyzer operating power. The maximum operating hours are determined by dividing the total monthly excess PV power generation by electrolyzer power consumption.
Step 3. Estimate the daily operating hours between the minimum and maximum thresholds based on the AEM start time identified in the previous step for each month. Operating hours within this range need to be selected to explore various scenarios, using simulation results to confirm the optimal scheduling. Initially, the operating hours are to be selected lower than the maximum in order to minimize unmet load. Then the surplus electricity hours and unmet load needs to be monitored throughout this process while the next case is assumed based on the monthly surplus and unmet load data.
Step 4. After running several case-based studies, the best scenario is selected using predefined criteria, considering the impact of each case to minimize both excess electricity and unmet load. Both of these factors have different value ranges (Vafaei et al., 2020) and also there exists an inverse relationship between them. Thus, the impact normalizes the values of both excess energy and unmet load, taking them into account collectively as per equation (2), with the minimum value being considered optimal.
One important consideration is that in this analysis, both unmet load and excess energy wastage have been given the same weight (w
1 = 1 and w
2 = 1). If minimizing excess energy is prioritized over unmet load, the weights should be adjusted accordingly, which might result in a different optimal case, and vice versa. Lastly, the load is adjusted to eliminate the unmet load from the scheduled load data. The steps are highlighted over the flow chart in
Figure 2.
2.4. Adjustable DC-DC Converter Design
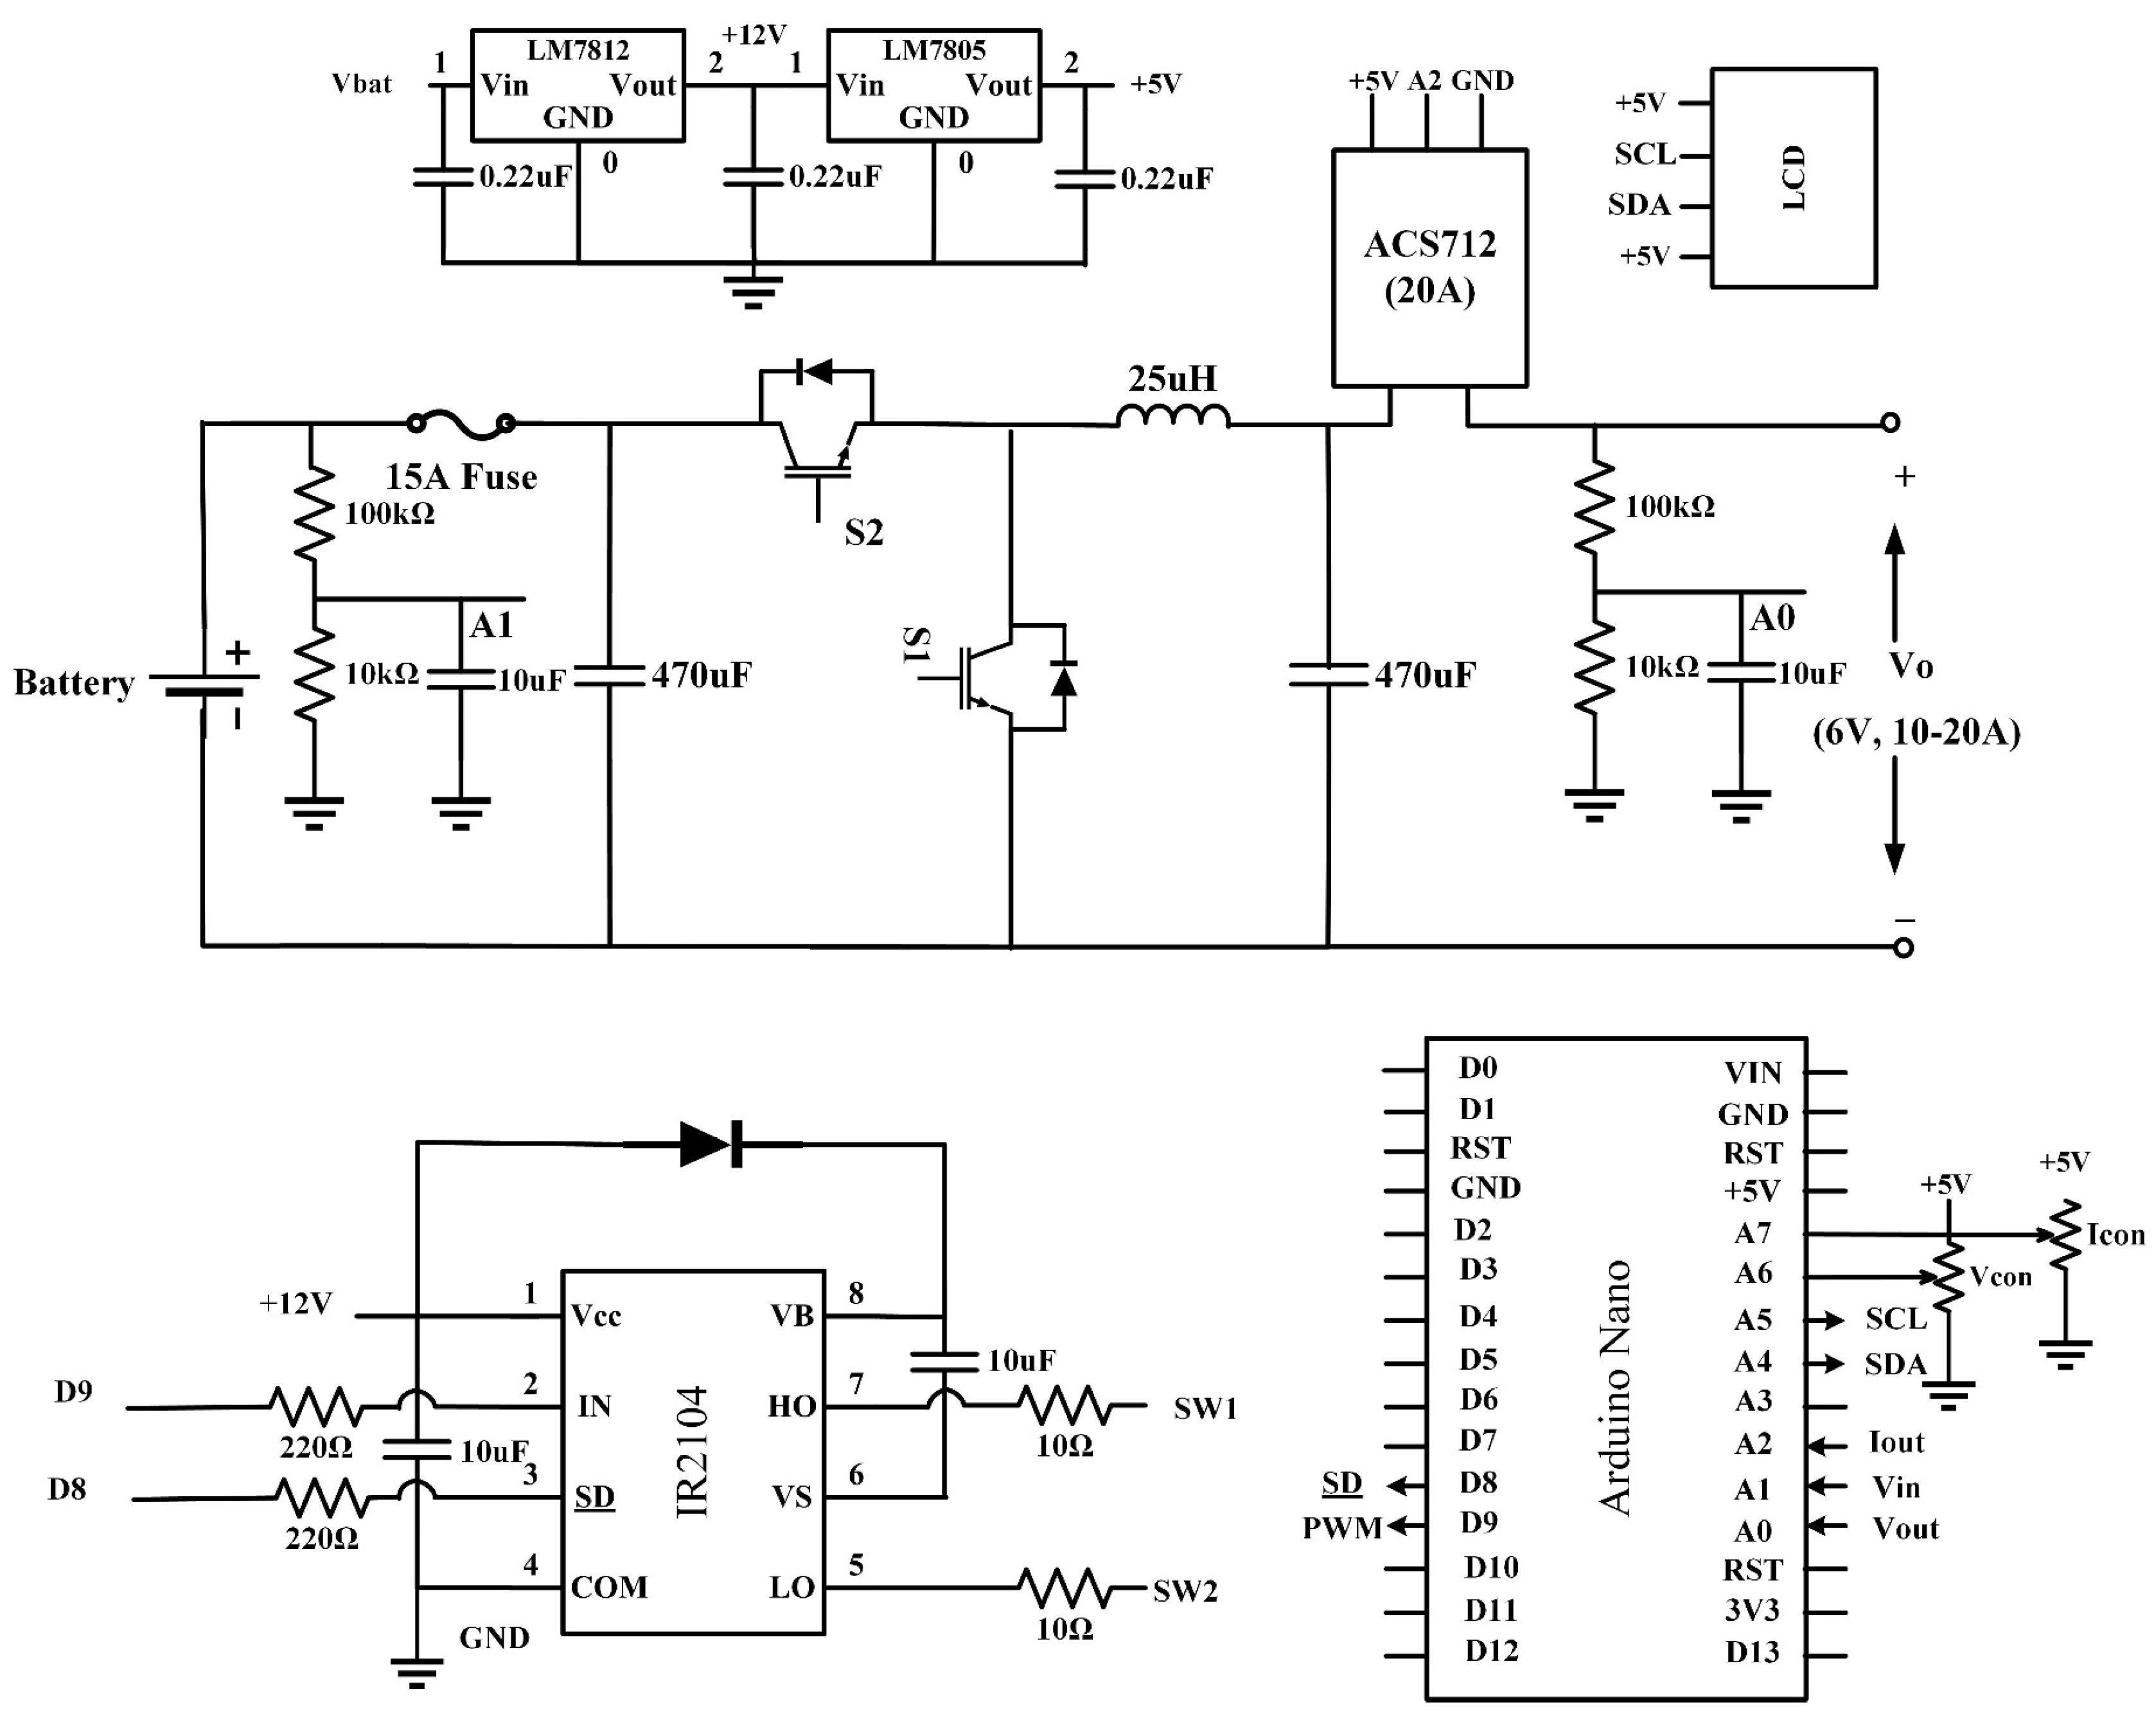
To operate the electrolyzer efficiently at a pre-determined operating current (10-15 A), an adjustable DC-DC converter was designed based on the open-source Arduino Nano (Arduino, Turin, Italy), which automatically selects constant current and constant voltage mode operation based on set voltage and current. These can be adjusted by two rotary potentiometers of 10 kΩ connected to the analog pins of the Arduino. The converter used here is a synchronous buck converter where IRF3205 MOSFETs (75 A) are used as switches. IR2104 MOSFET driver IC is used to provide complementary pulse width modulation (PWM) pulses to both low side and high side MOSFETs, the MOSFET driver circuit consists of a bootstrap capacitor of 10 μF.
The capacitor and inductor size of the buck converter is selected above their critical value to keep the voltage ripple (
within 1% while maximum 25% current ripple (
at the maximum inductor current rating with 25 kHz switching frequency (
fs) of the MOSFETs. The adjustable DC-DC buck converter is meant to be connected to a source voltage (V
s) of 12 V and supplying AEM around 6 V at output (V
0), so the converter is designed considering this scenario as optimal. This gives an optimal duty cycle (D) 50% for the converter design. Also, the maximum power rating is considered 120 W, 20 A for 6 V, which requires designing the converter with 20 A average inductor current. The critical inductor (L
crit) and capacitors (C
crit) values are calculated based on the following equations (3) and (4) and the variables are defined along with their values in
Table 1.
The inductor and capacitors of the buck converter are selected above their critical value and the schematic of the converter is shown in
Figure 3.
For designing the inductor, toroidal inductor core 0078934A7 from Magnetics (Butler, Pennsylvania, USA) is used which is 26.92 mm in outer diameter and 11.18 mm in height, has relative magnetic permeability 90 and inductance factor 113 nH per turn. The design parameters for the 25 μF, 25 A inductor are shown in
Table 2.
Figure 3.
Schematic of adjustable DC-DC synchronous buck converter.
Figure 3.
Schematic of adjustable DC-DC synchronous buck converter.
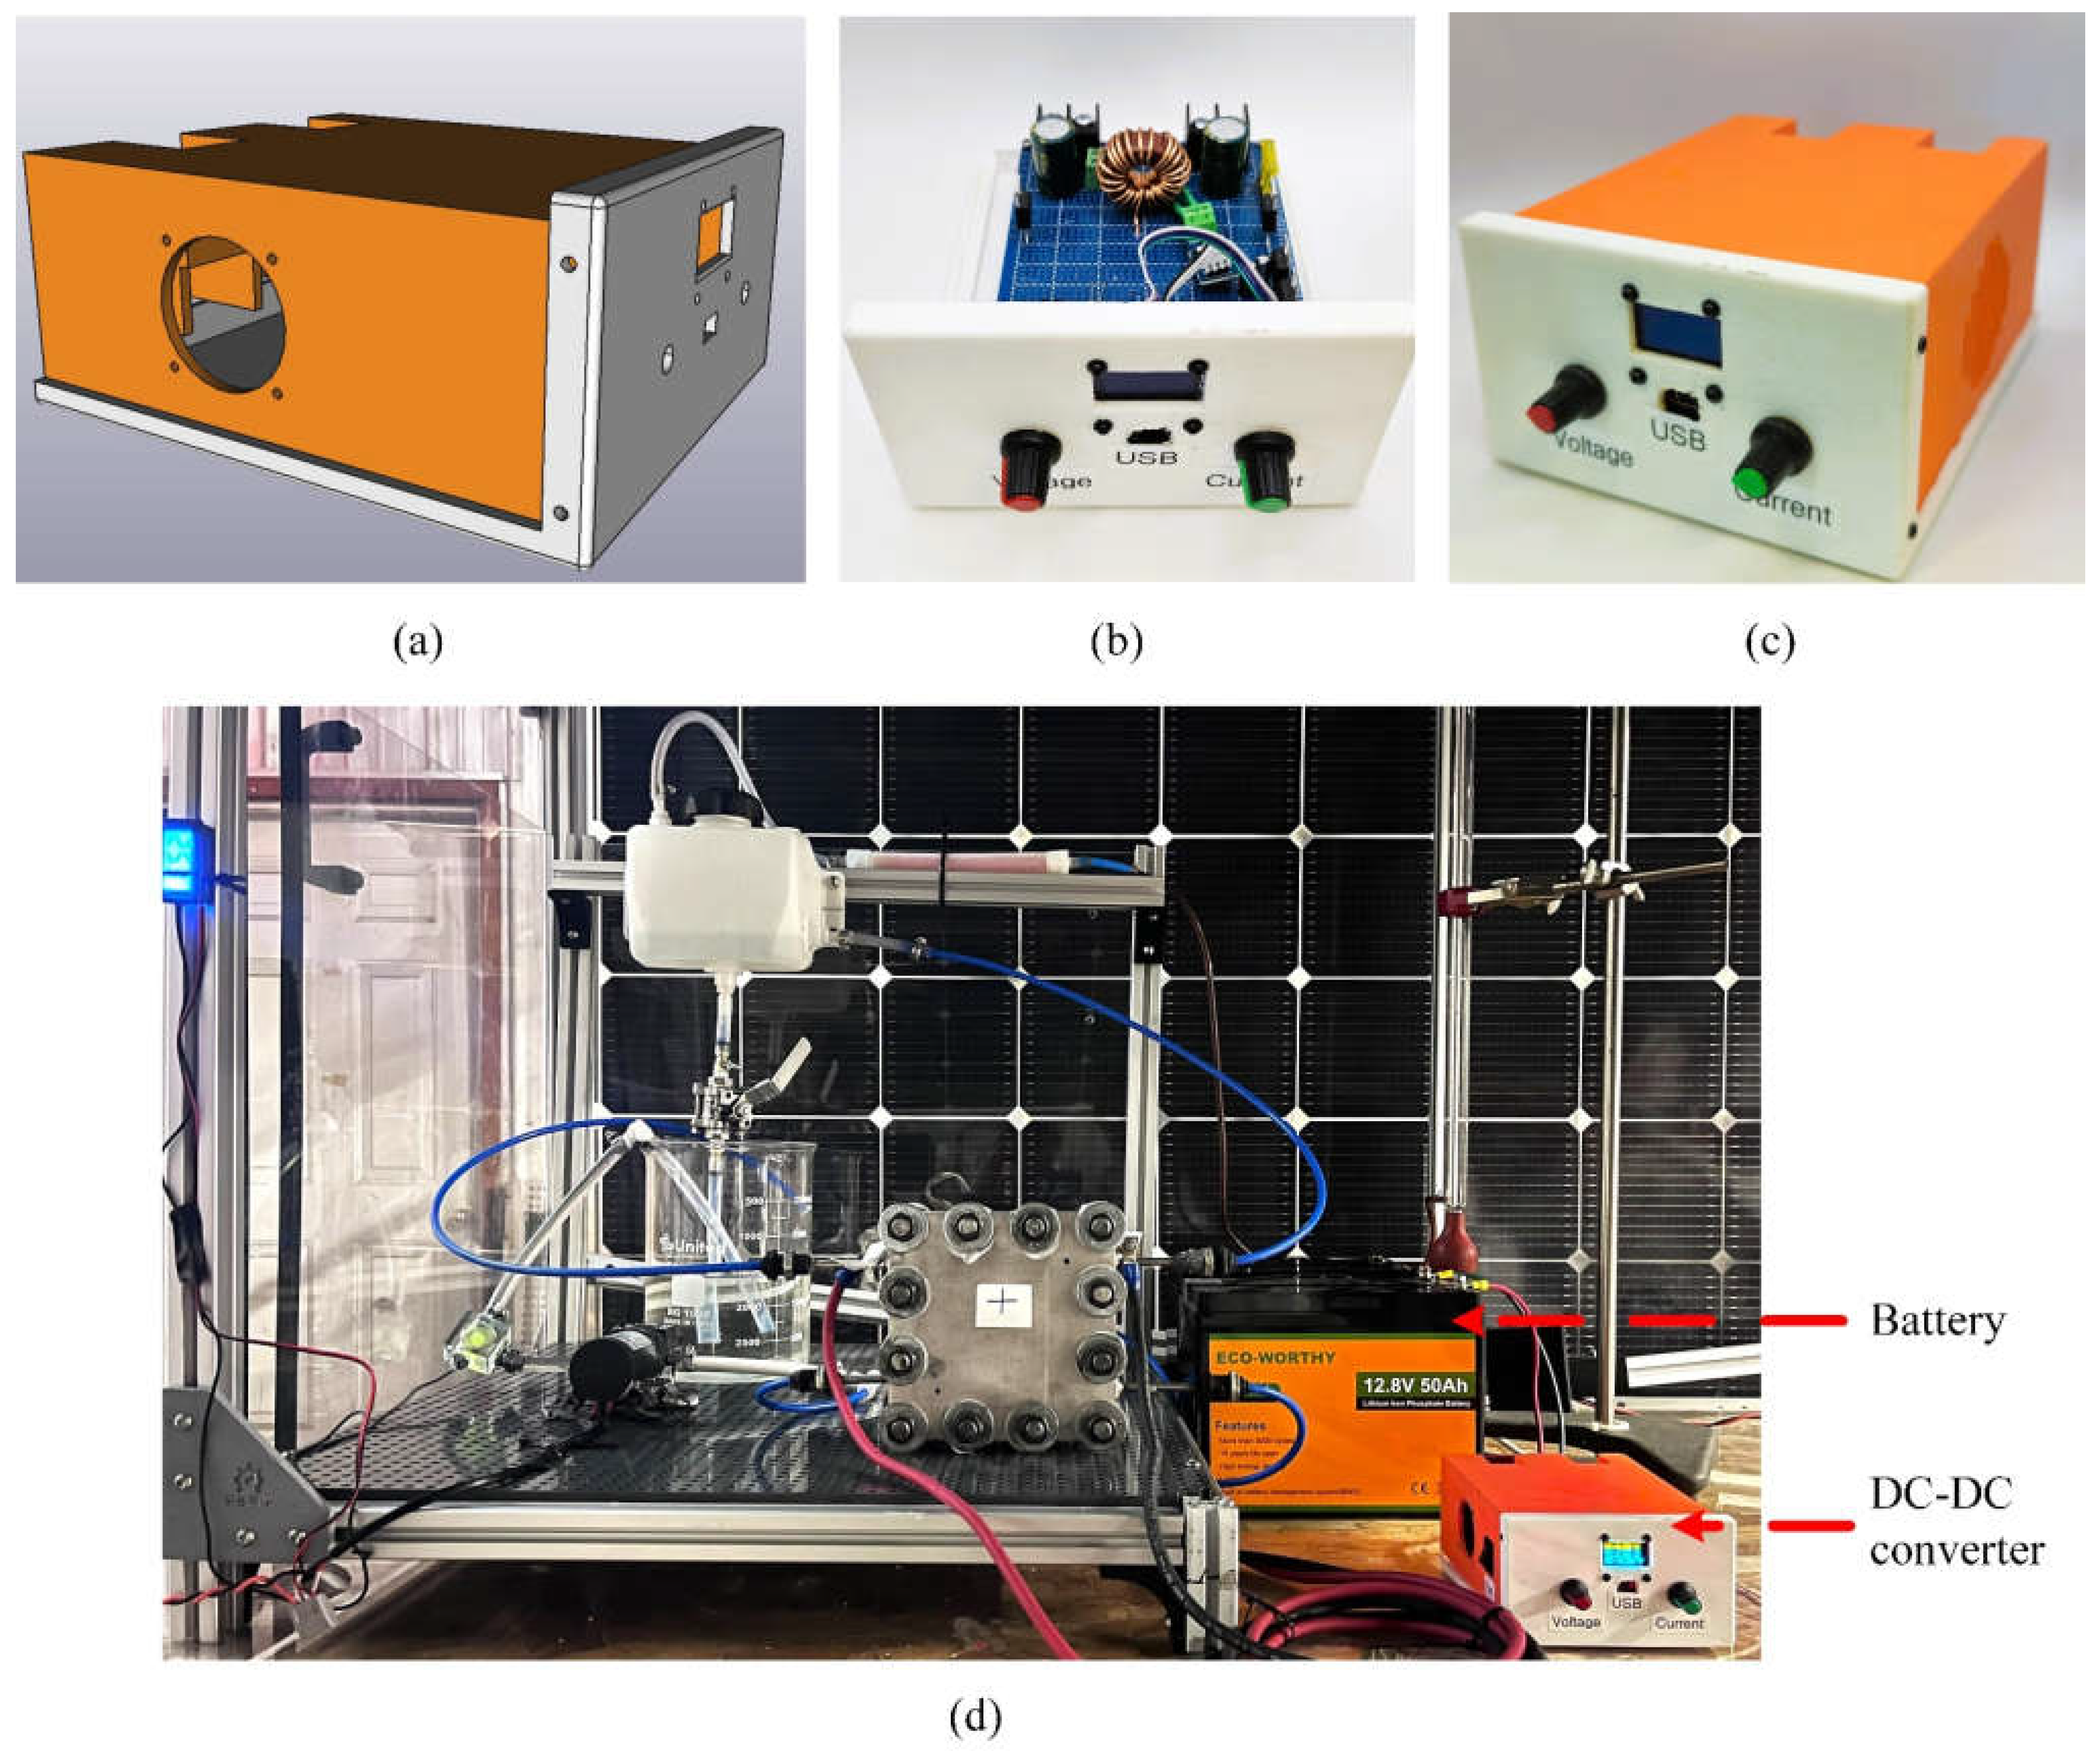
All the converter related files, Arduino code and 3-D printed parts design files along with the bill of materials and the 3-D printing parameters are available under open source licenses (Rahman et al., 2024). The 3-D printed encloser (
Figure 4(a-c)) is designed in two parts in FreeCAD (Version: 0.21.1) and printed in a RepRap class (Sells et al., 2009; Jones et al., 2011; Bowyer, 2014) open source Prusa Mk3 (Prusa Research, Prague, Czech Republic) printer using poly lactic acid filament with 0.6 nozzle (layer height 0.3 and infill 20%) and later assembled with its snap fit mechanism along with M3 screws to secure the assembly.
3. Results
3.1. AEM Scheduling
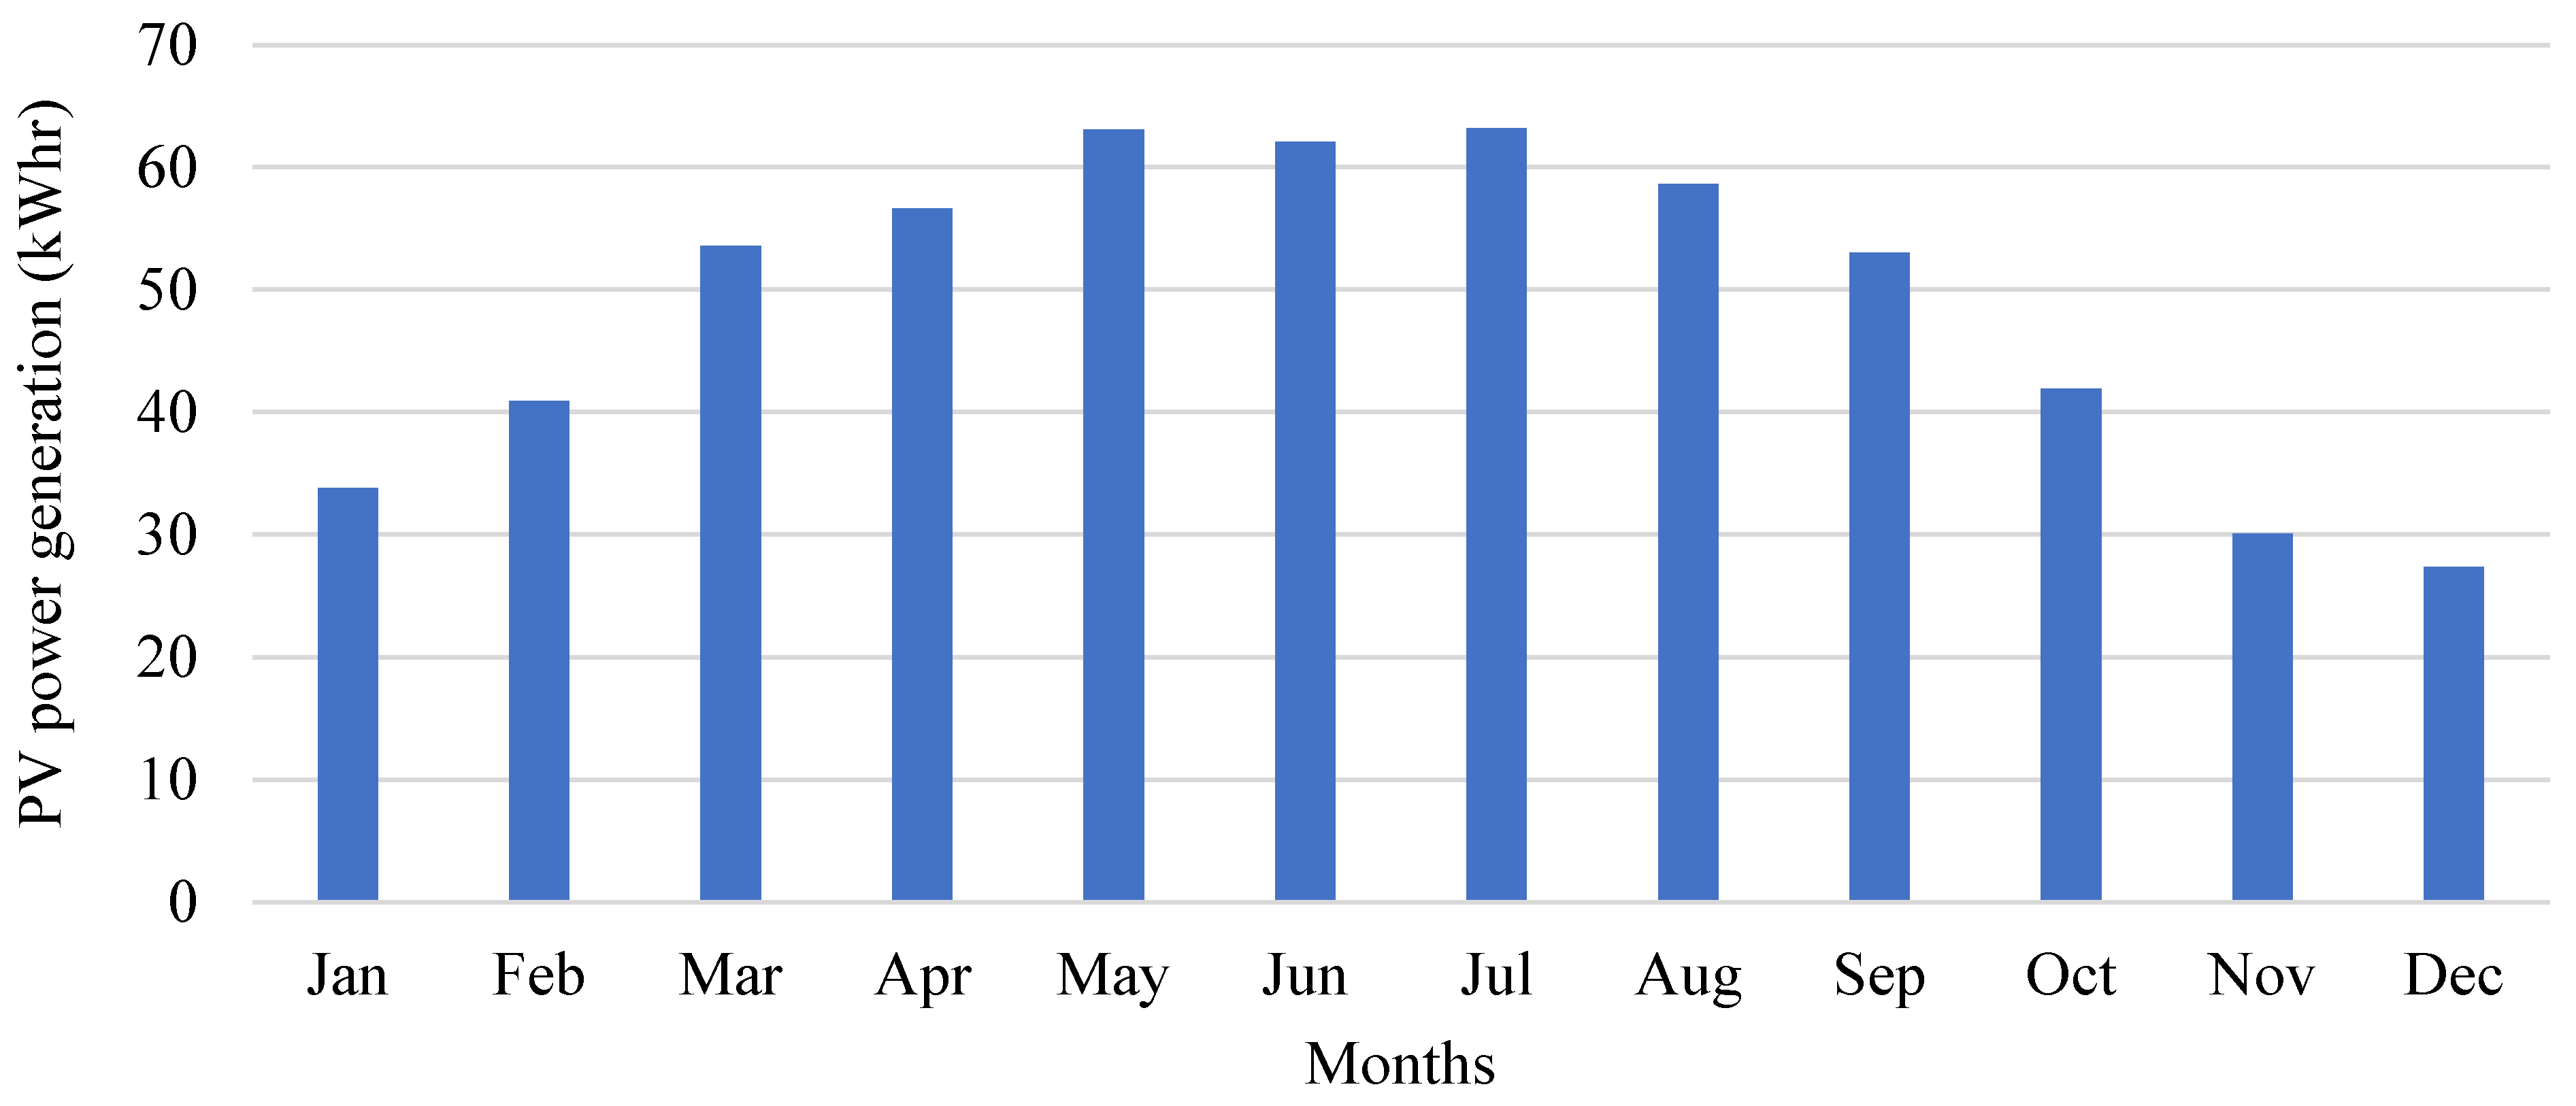
Following the method described above the optimal operation schedule for the AEM system was developed. Initially, hourly PV generation data for a 400 W PV module was determined using SAMA, as depicted in
Figure 5. In method 1, scheduling of the electrolyzer was done based on the hourly excess PV data, only scheduling the AEM when the excess PV power surpassed the operating power threshold (100 W).
In method 2, based on average 24-hour PV power generation data, the optimal start times for each month, along with the minimum and maximum operating hours, were identified and shown in
Table 3.
Various scenarios were considered and simulated in SAMA using the load following dispatch technique to determine the optimal monthly operating hours. This involved varying the operating hours each month while monitoring surplus electricity hours and unmet load. Ten different cases were evaluated. Each case in
Table 4 was selected based on the unmet and excess load data from the previous scenario, allowing for iterative optimization.
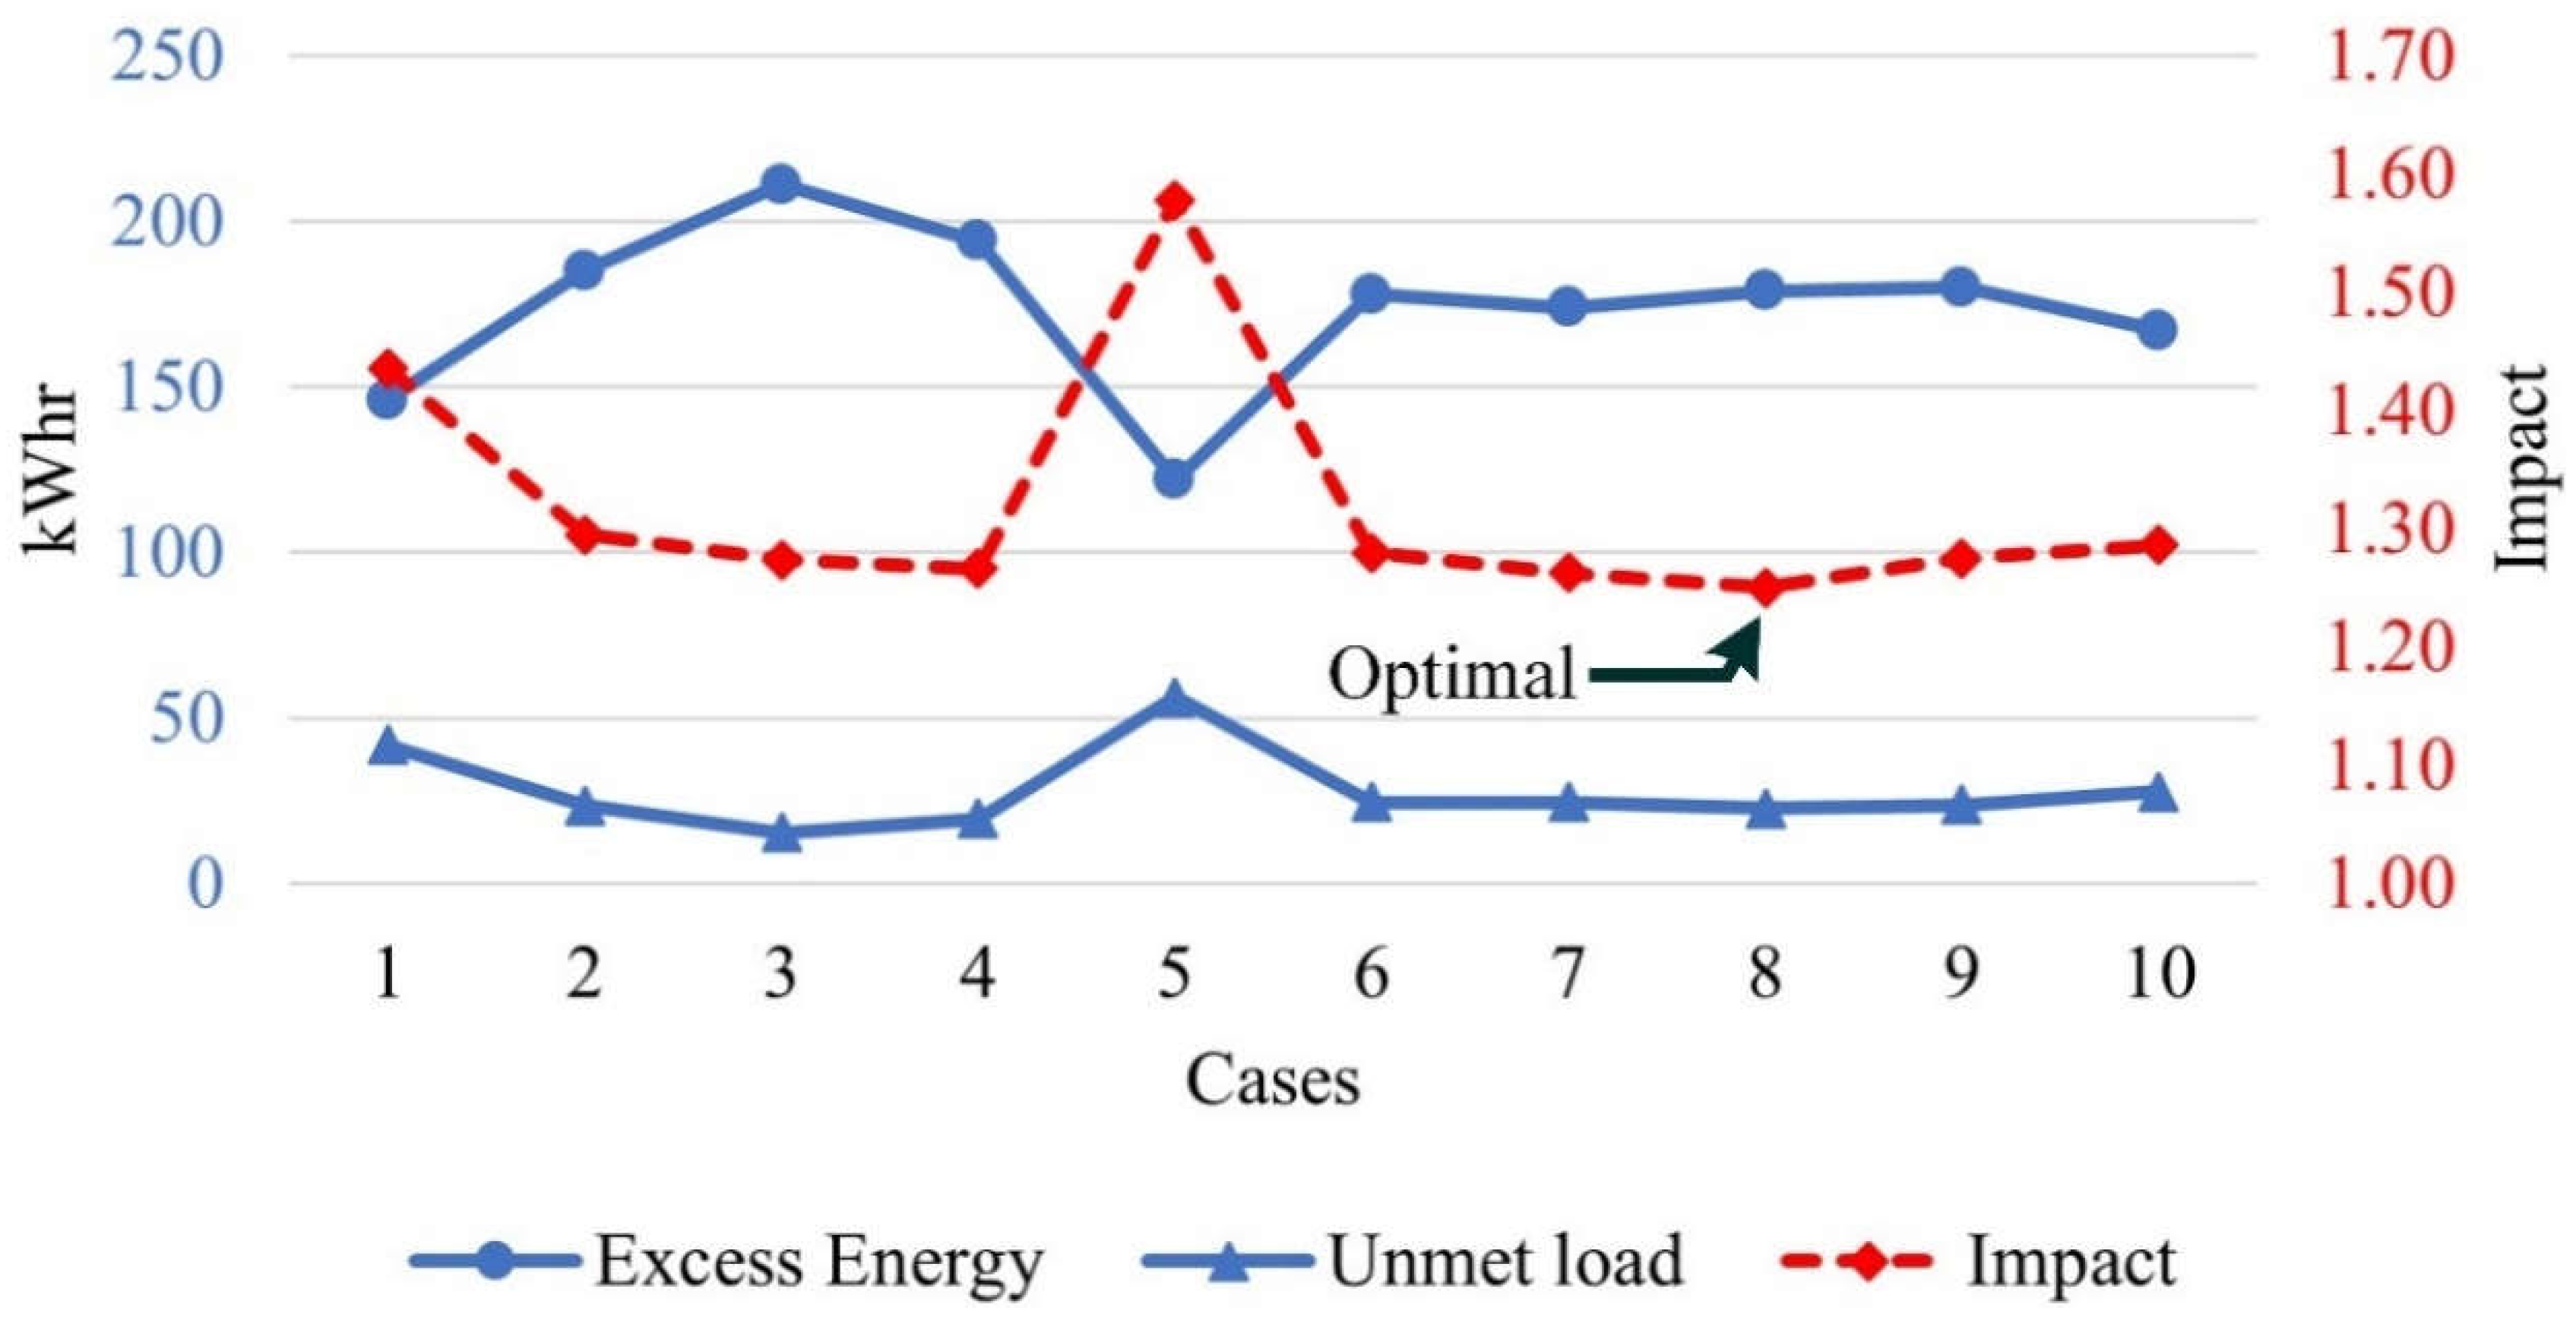
Based on the analysis of excess energy wastage and unmet load data across these cases, it was determined that Case 8, as presented in
Table 5, provided the optimal scheduling solution. This case successfully minimized both excess energy and unmet load as the value of impact (equation 2) is minimum in this case (
Figure 6), ensuring efficient and effective operation of the AEM system. From
Table 5, it is evident that the optimal case should be around a scheduled load of 408 kWhr. Any increase or decrease from this point would raise the impact.
3.2. Off Grid PV System’s Performance and Energy Usage
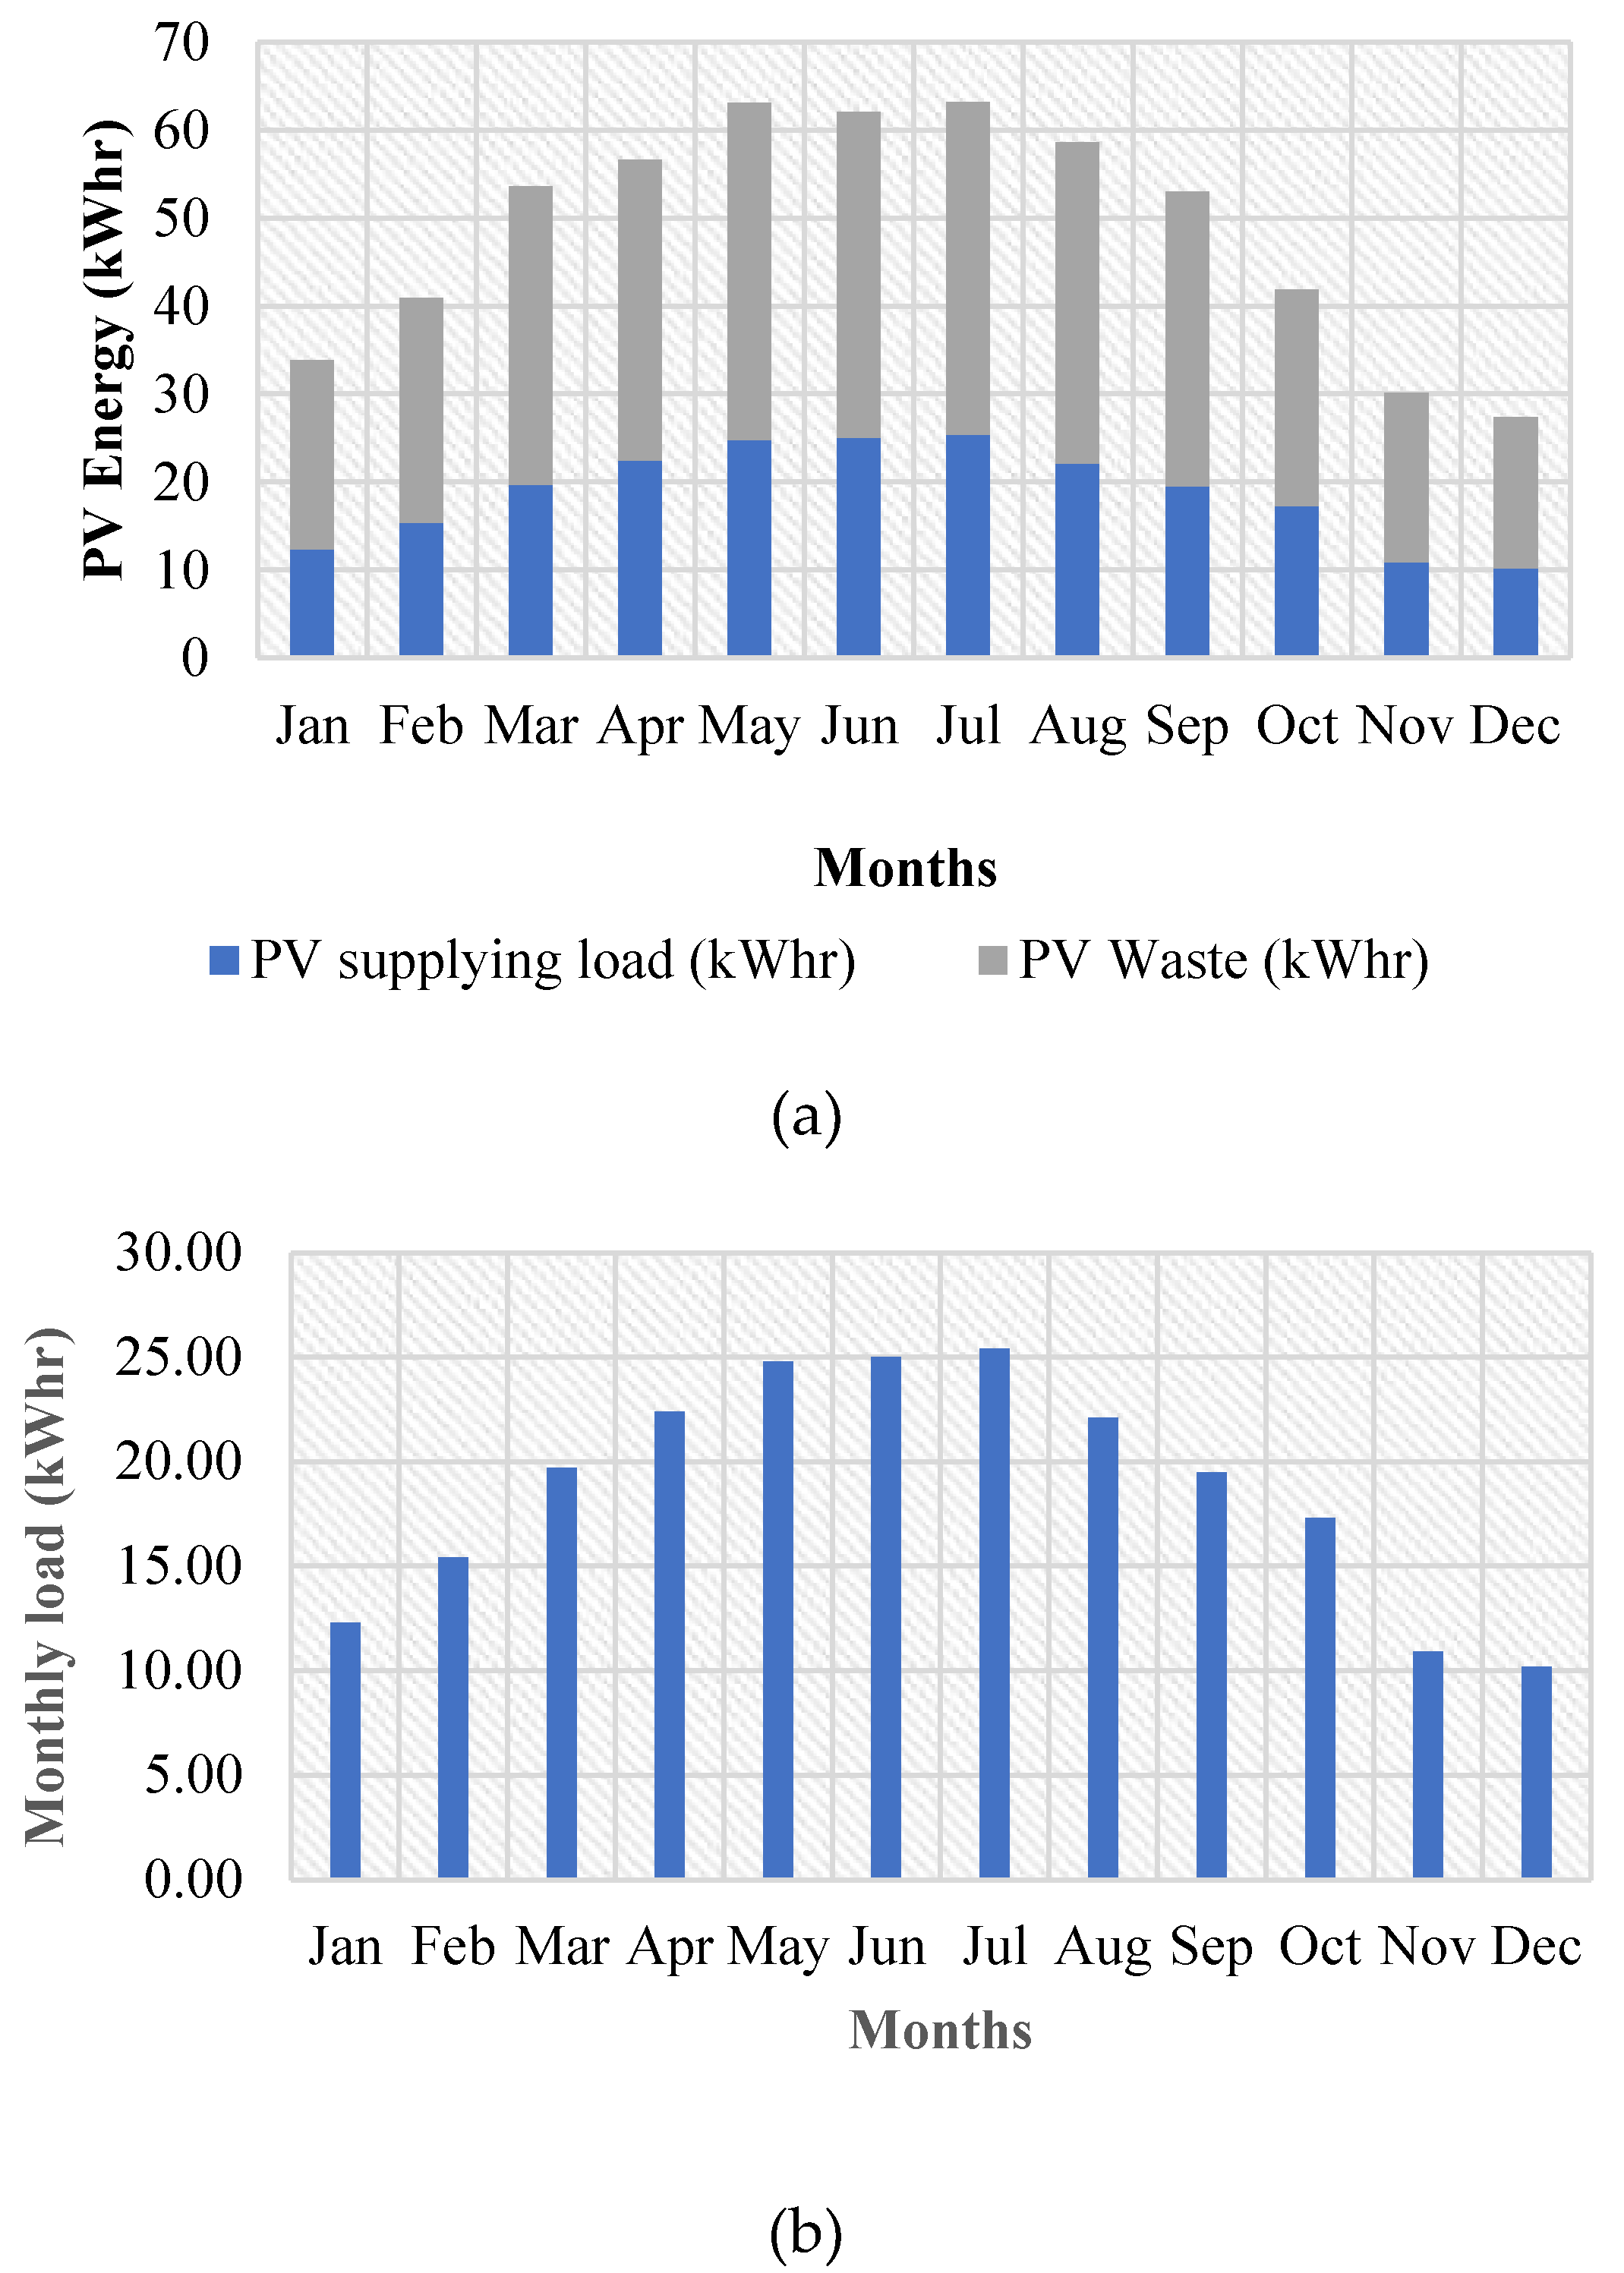
In method 1, the PV system with a capacity of 400 W was analyzed, generating an annual PV power output of 584.05 kWh. Although the system successfully met the annual load requirement of 225 kW (
Figure 7) ensuring a fully served load with no capacity shortages, the scheduled load was unable to utilize 359.04 kWh of the initial total excess energy. Thus, a significant 61.5% of the total power remains unused, leading to substantial energy waste.
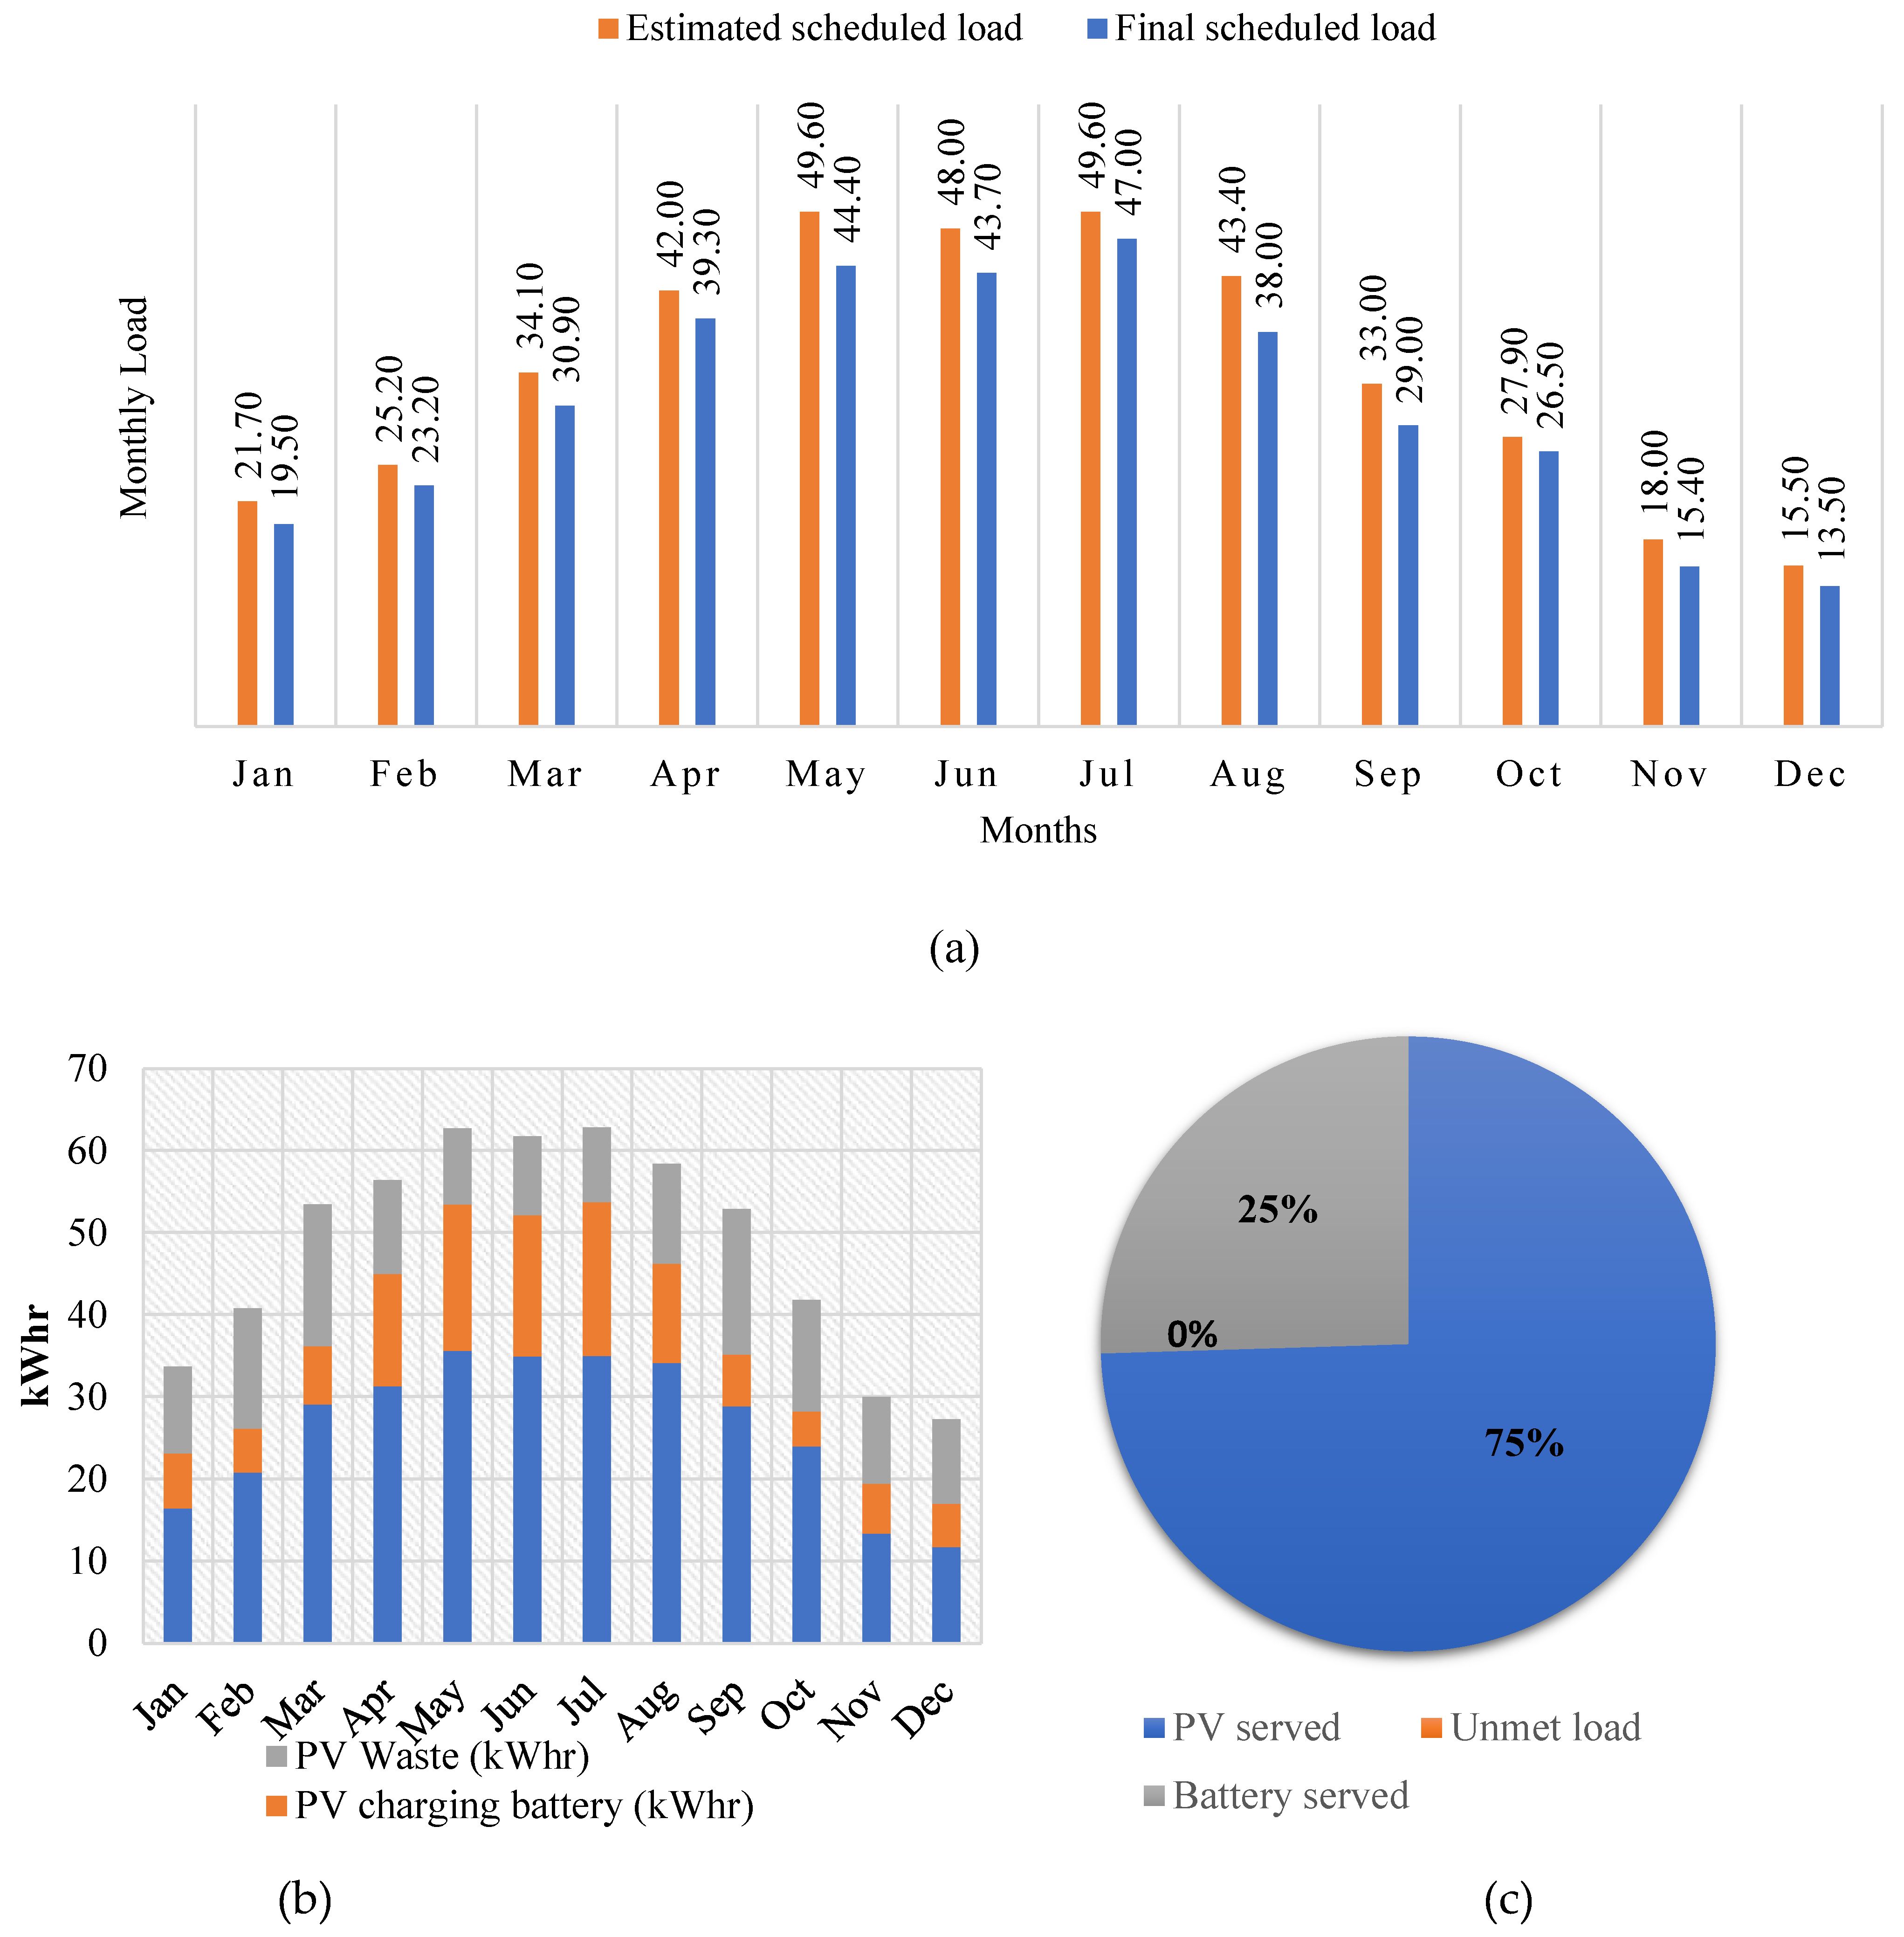
For method 2, in the best-case scenario (Case 8), the annual load estimation is 408 kWh (
Figure 8(a)), has an unmet load of 22.6 kWh. After removing the unmet portion from the estimated schedule, a final schedule (370.4 kWhr) is prepared, and this revised load scenario is then re-simulated in SAMA. Additionally,
Figure 8(b) illustrates the utilization of PV energy, offering insight into how PV power drives the AEM and stores excess energy in the battery along with the energy waste. Furthermore,
Figure 8(c) confirms that the scheduling scheme enables the AEM to operate on PV power for 75% of the total scheduled operation, with only 25% provided by the battery, and 0% of unmet load.
3.3. AEM Characteristics
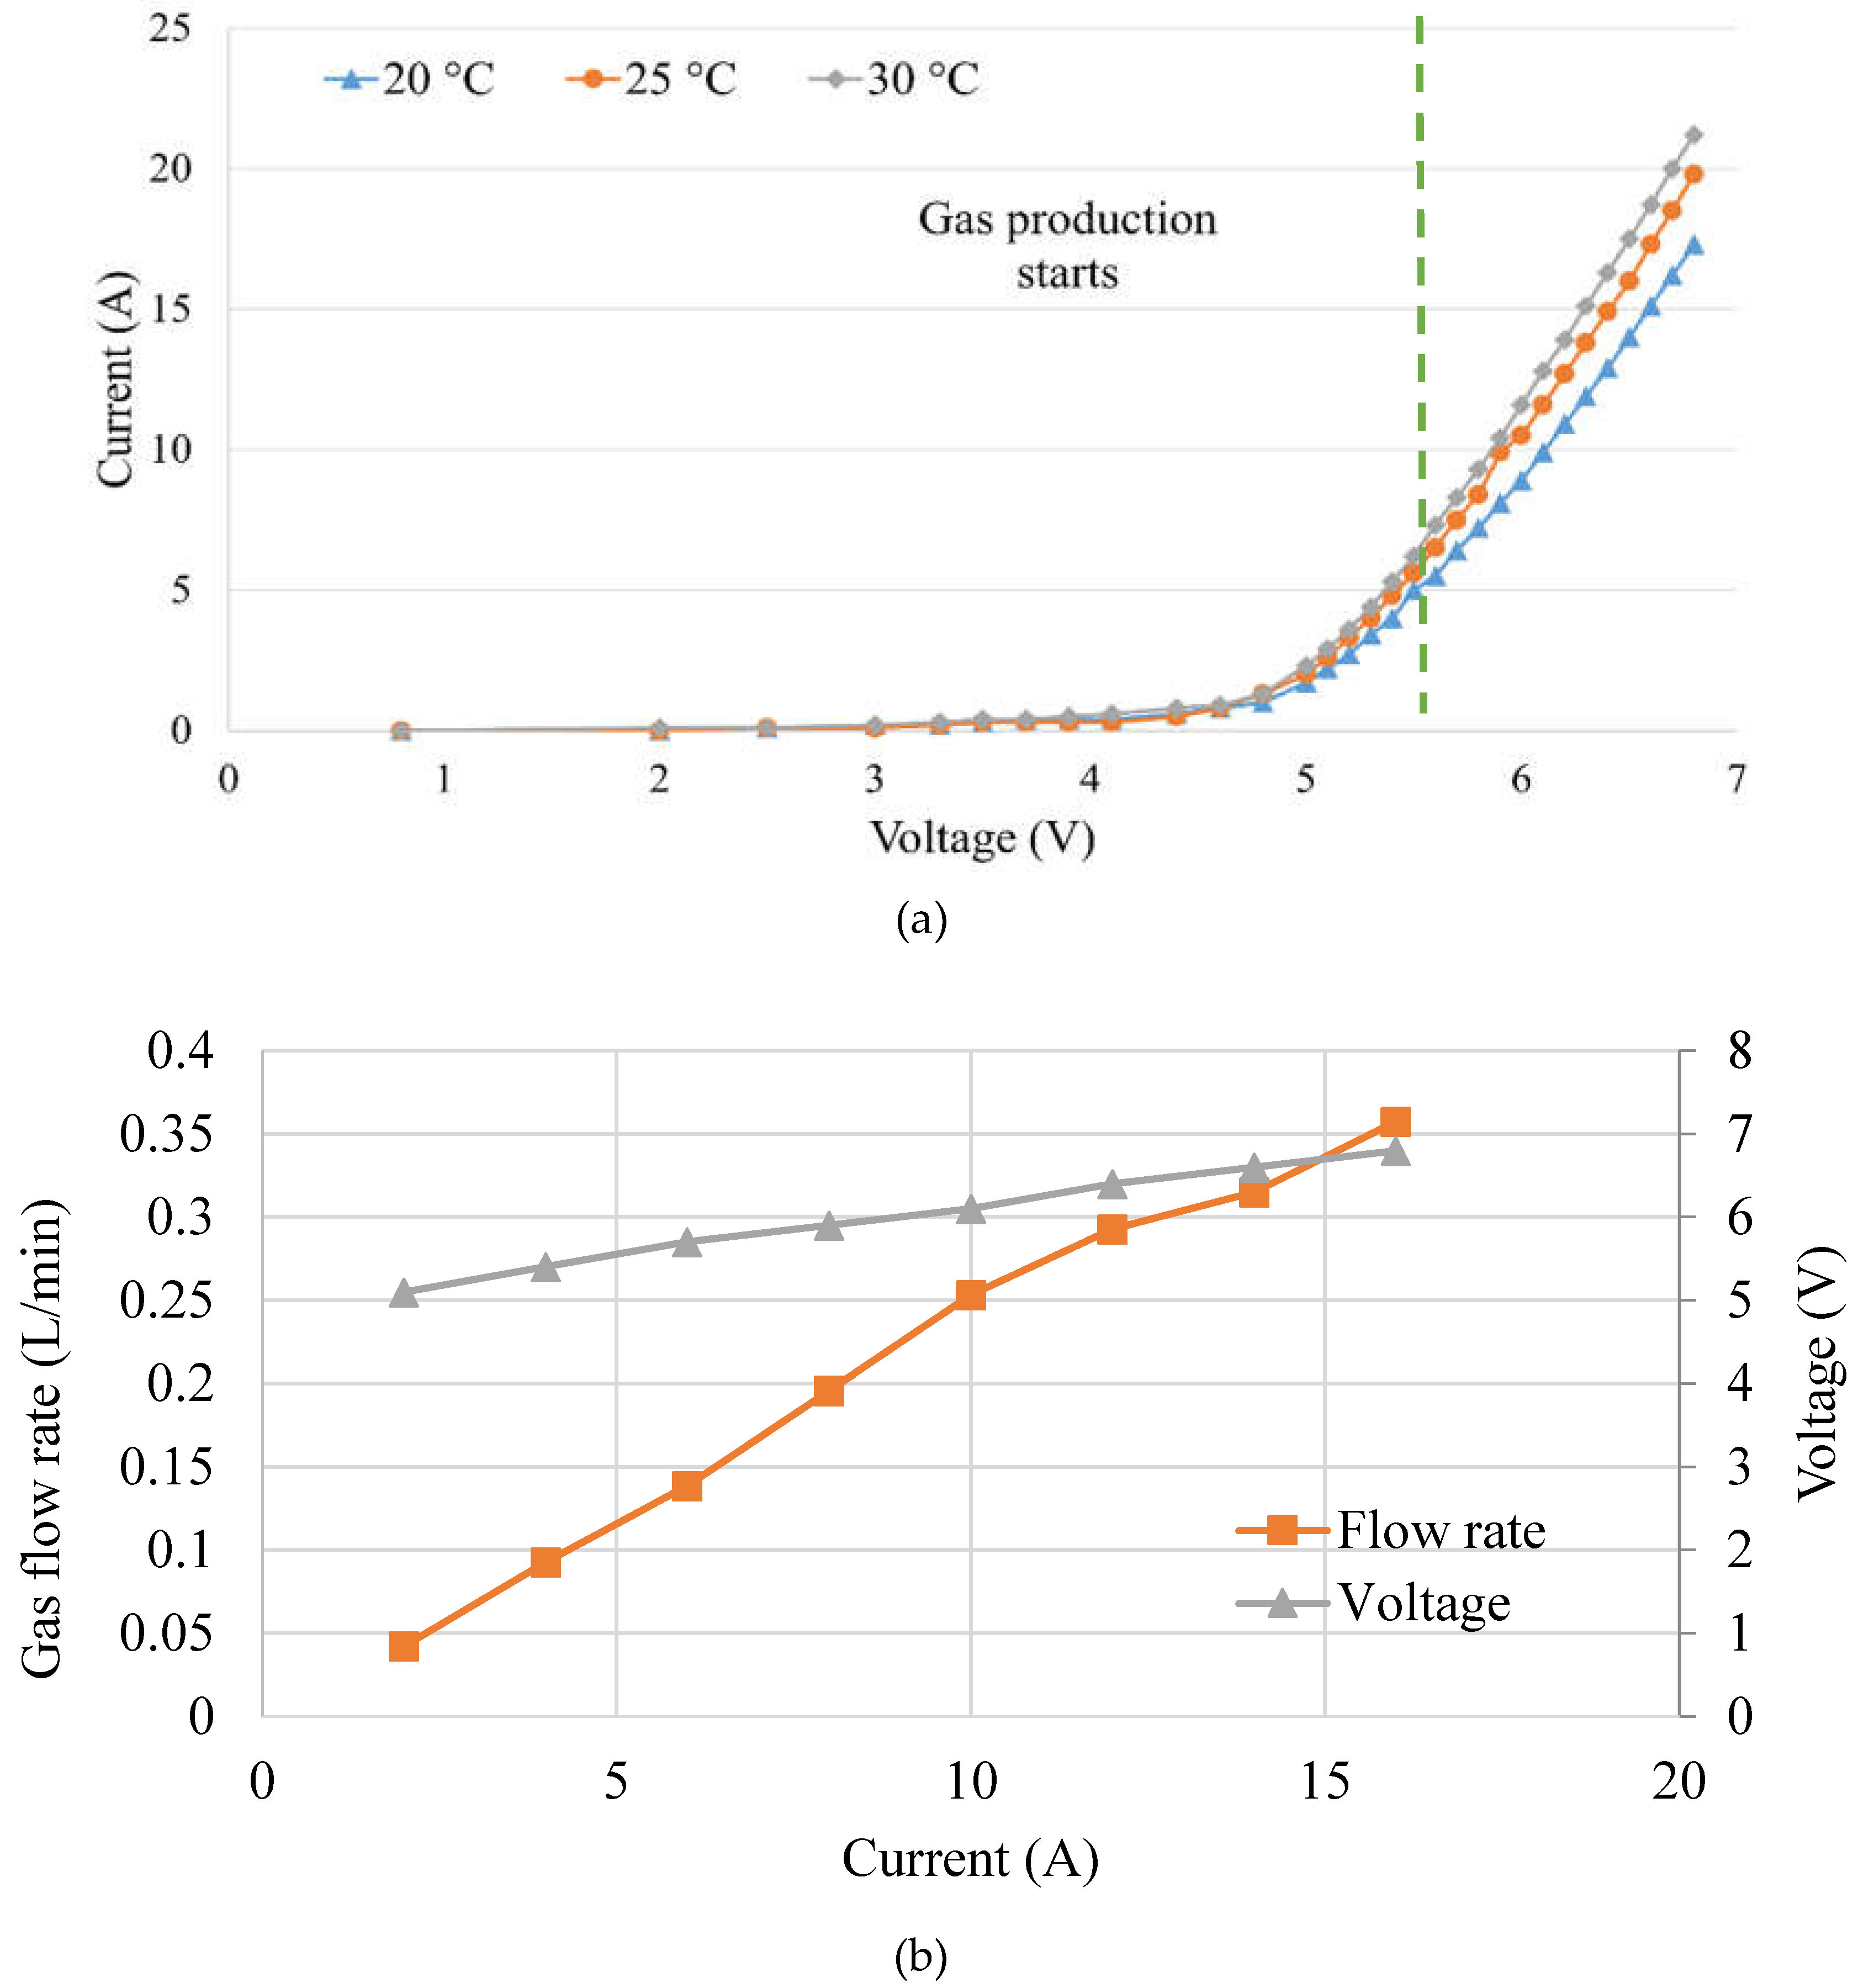
The electrical characteristics of AEM while the electrolyzer was working at 20 °C-30 °C, shown in
Figure 9(a). In
Figure 9(b) the results obtained in terms of gas production measured through the flowmeter is displayed.
Consequently, the efficiency of the electrolyzer has been determined using Equation 1.
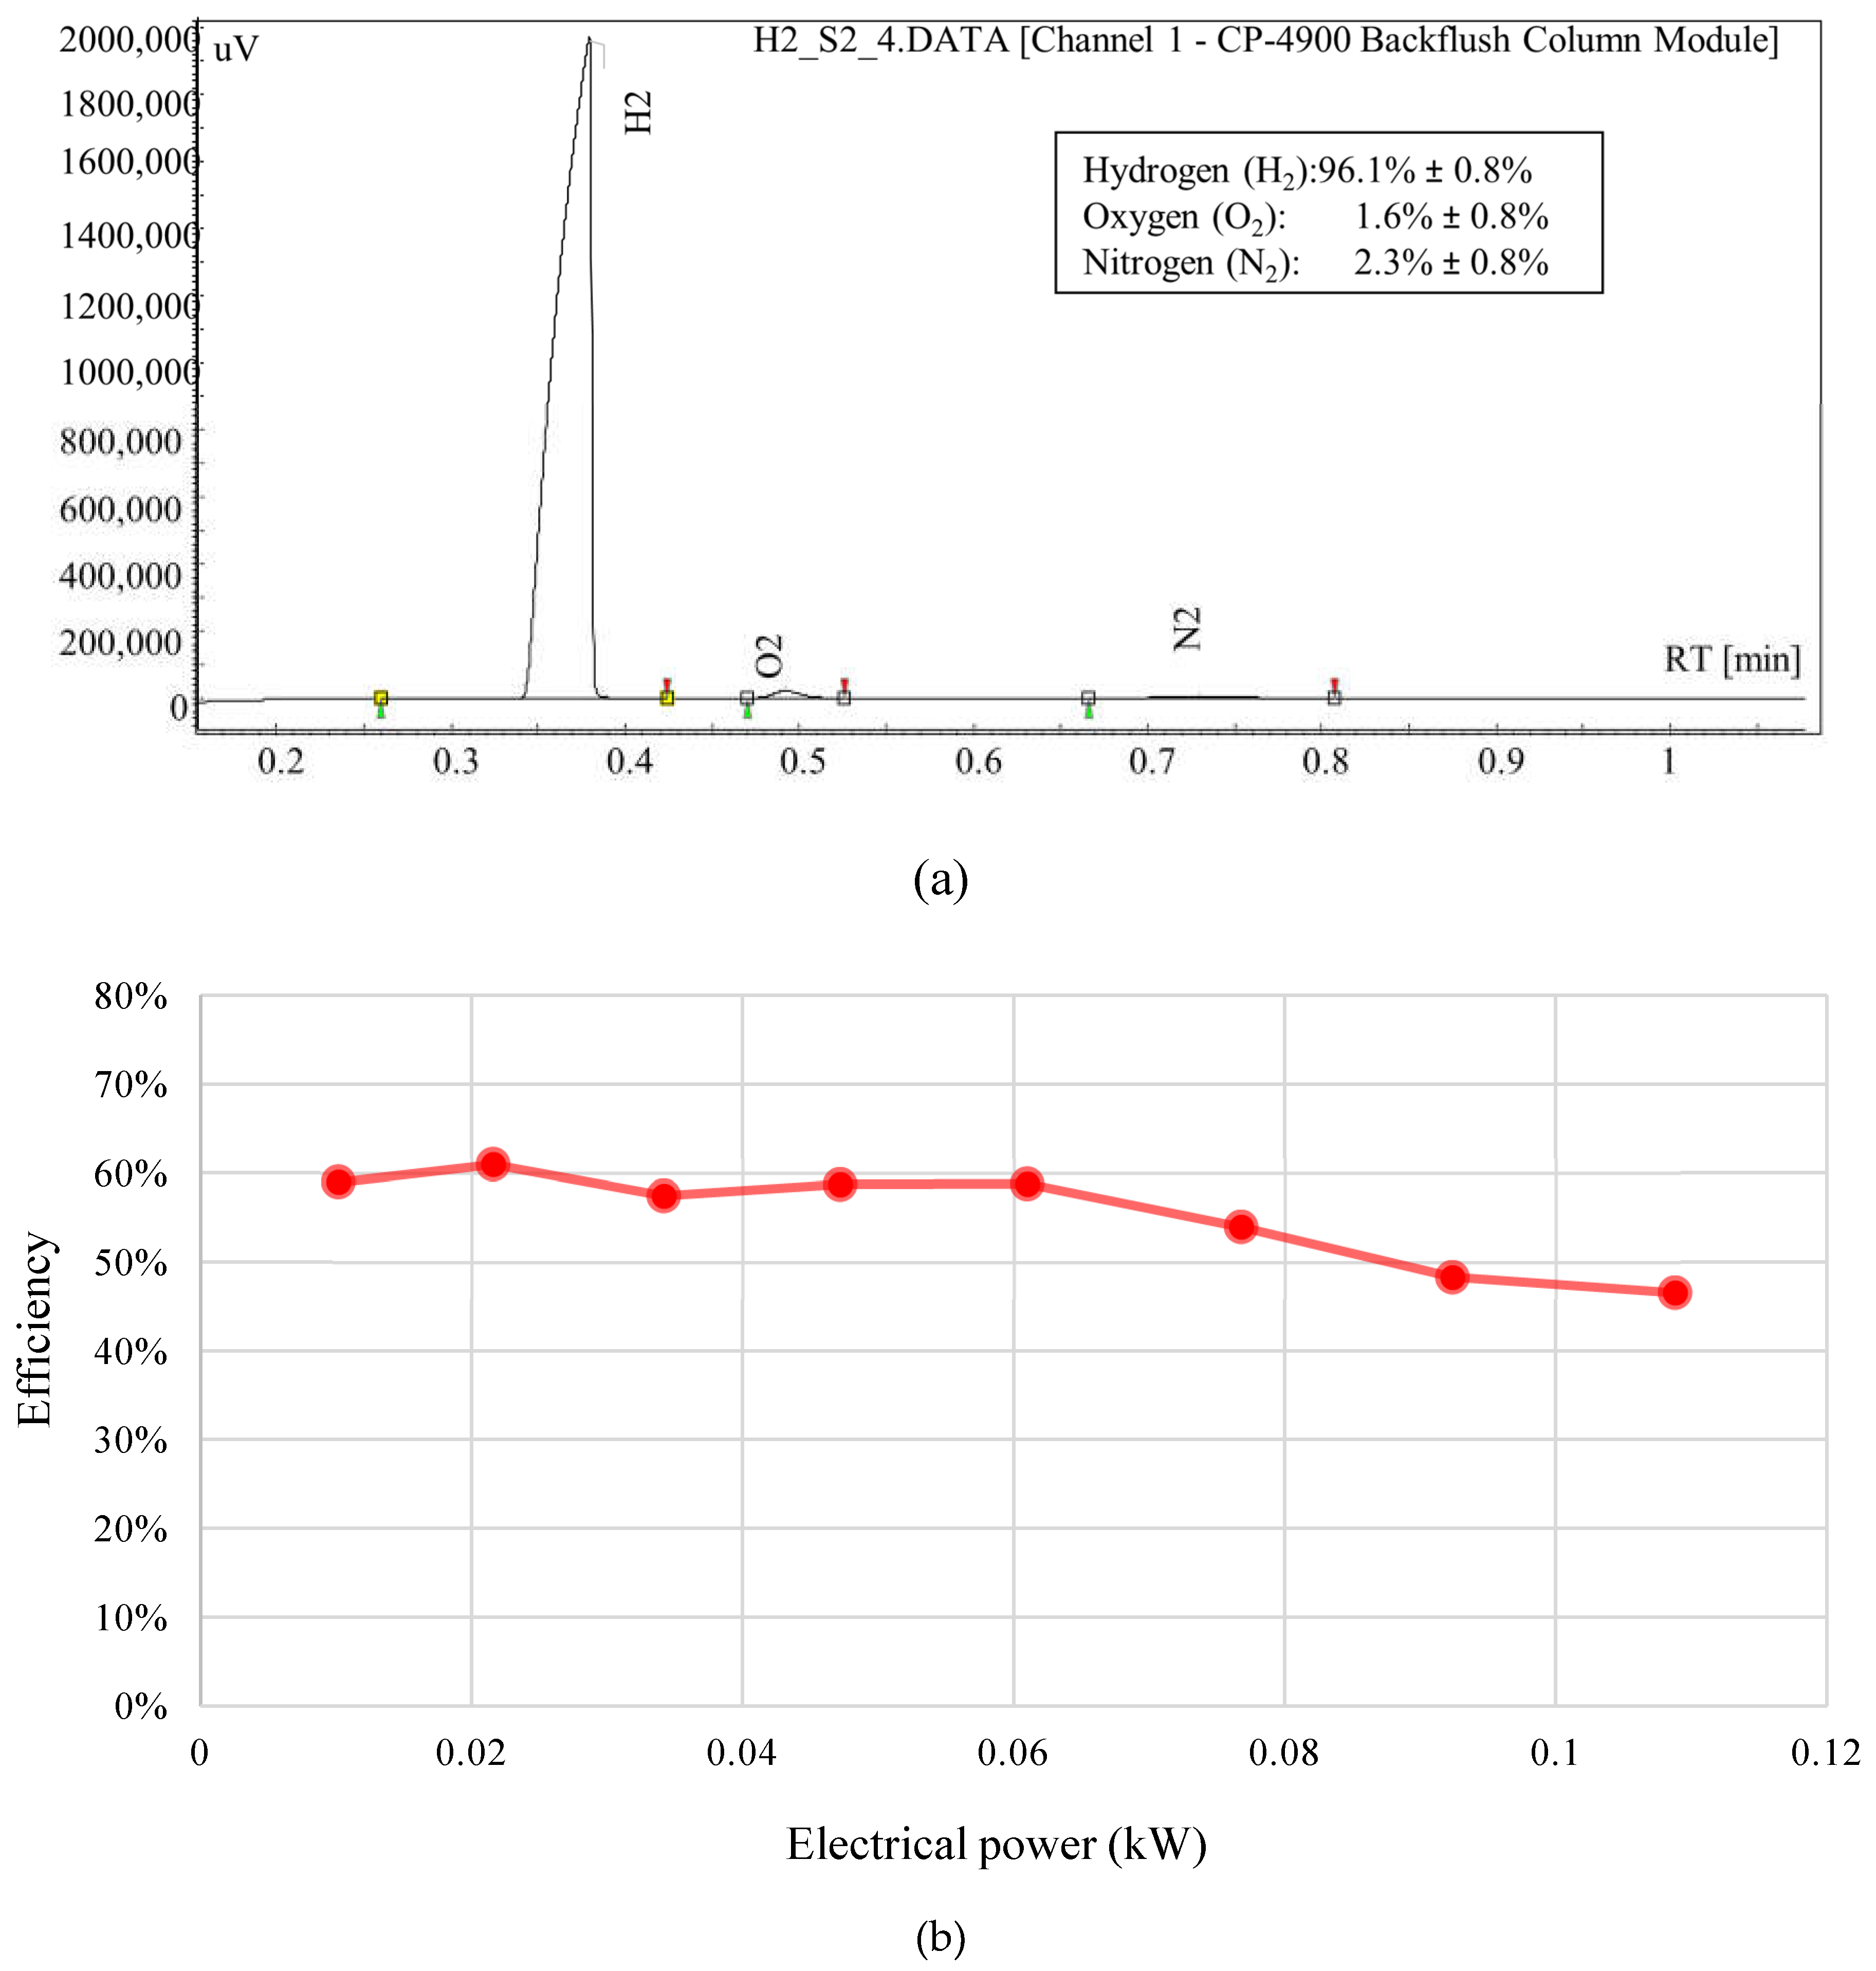
Figure 10(b) shows how the AEM efficiency remains approximately at 60% until the current reaches 10 A (65 W), after which it begins to decline slightly around 50%, which leads to selection of 10 A as the optimal operating current for the subsequent experiments. Analyzing the hydrogen produced in this process is tested in the MicroGC, and it has been demonstrated the purity of the produced H
2 is 96.1% as shown in
Figure 10(a) through the chromatogram.
3.4. DC-DC Converter Performance
3.4.1. Output Voltage Quality and Efficiency Measurement
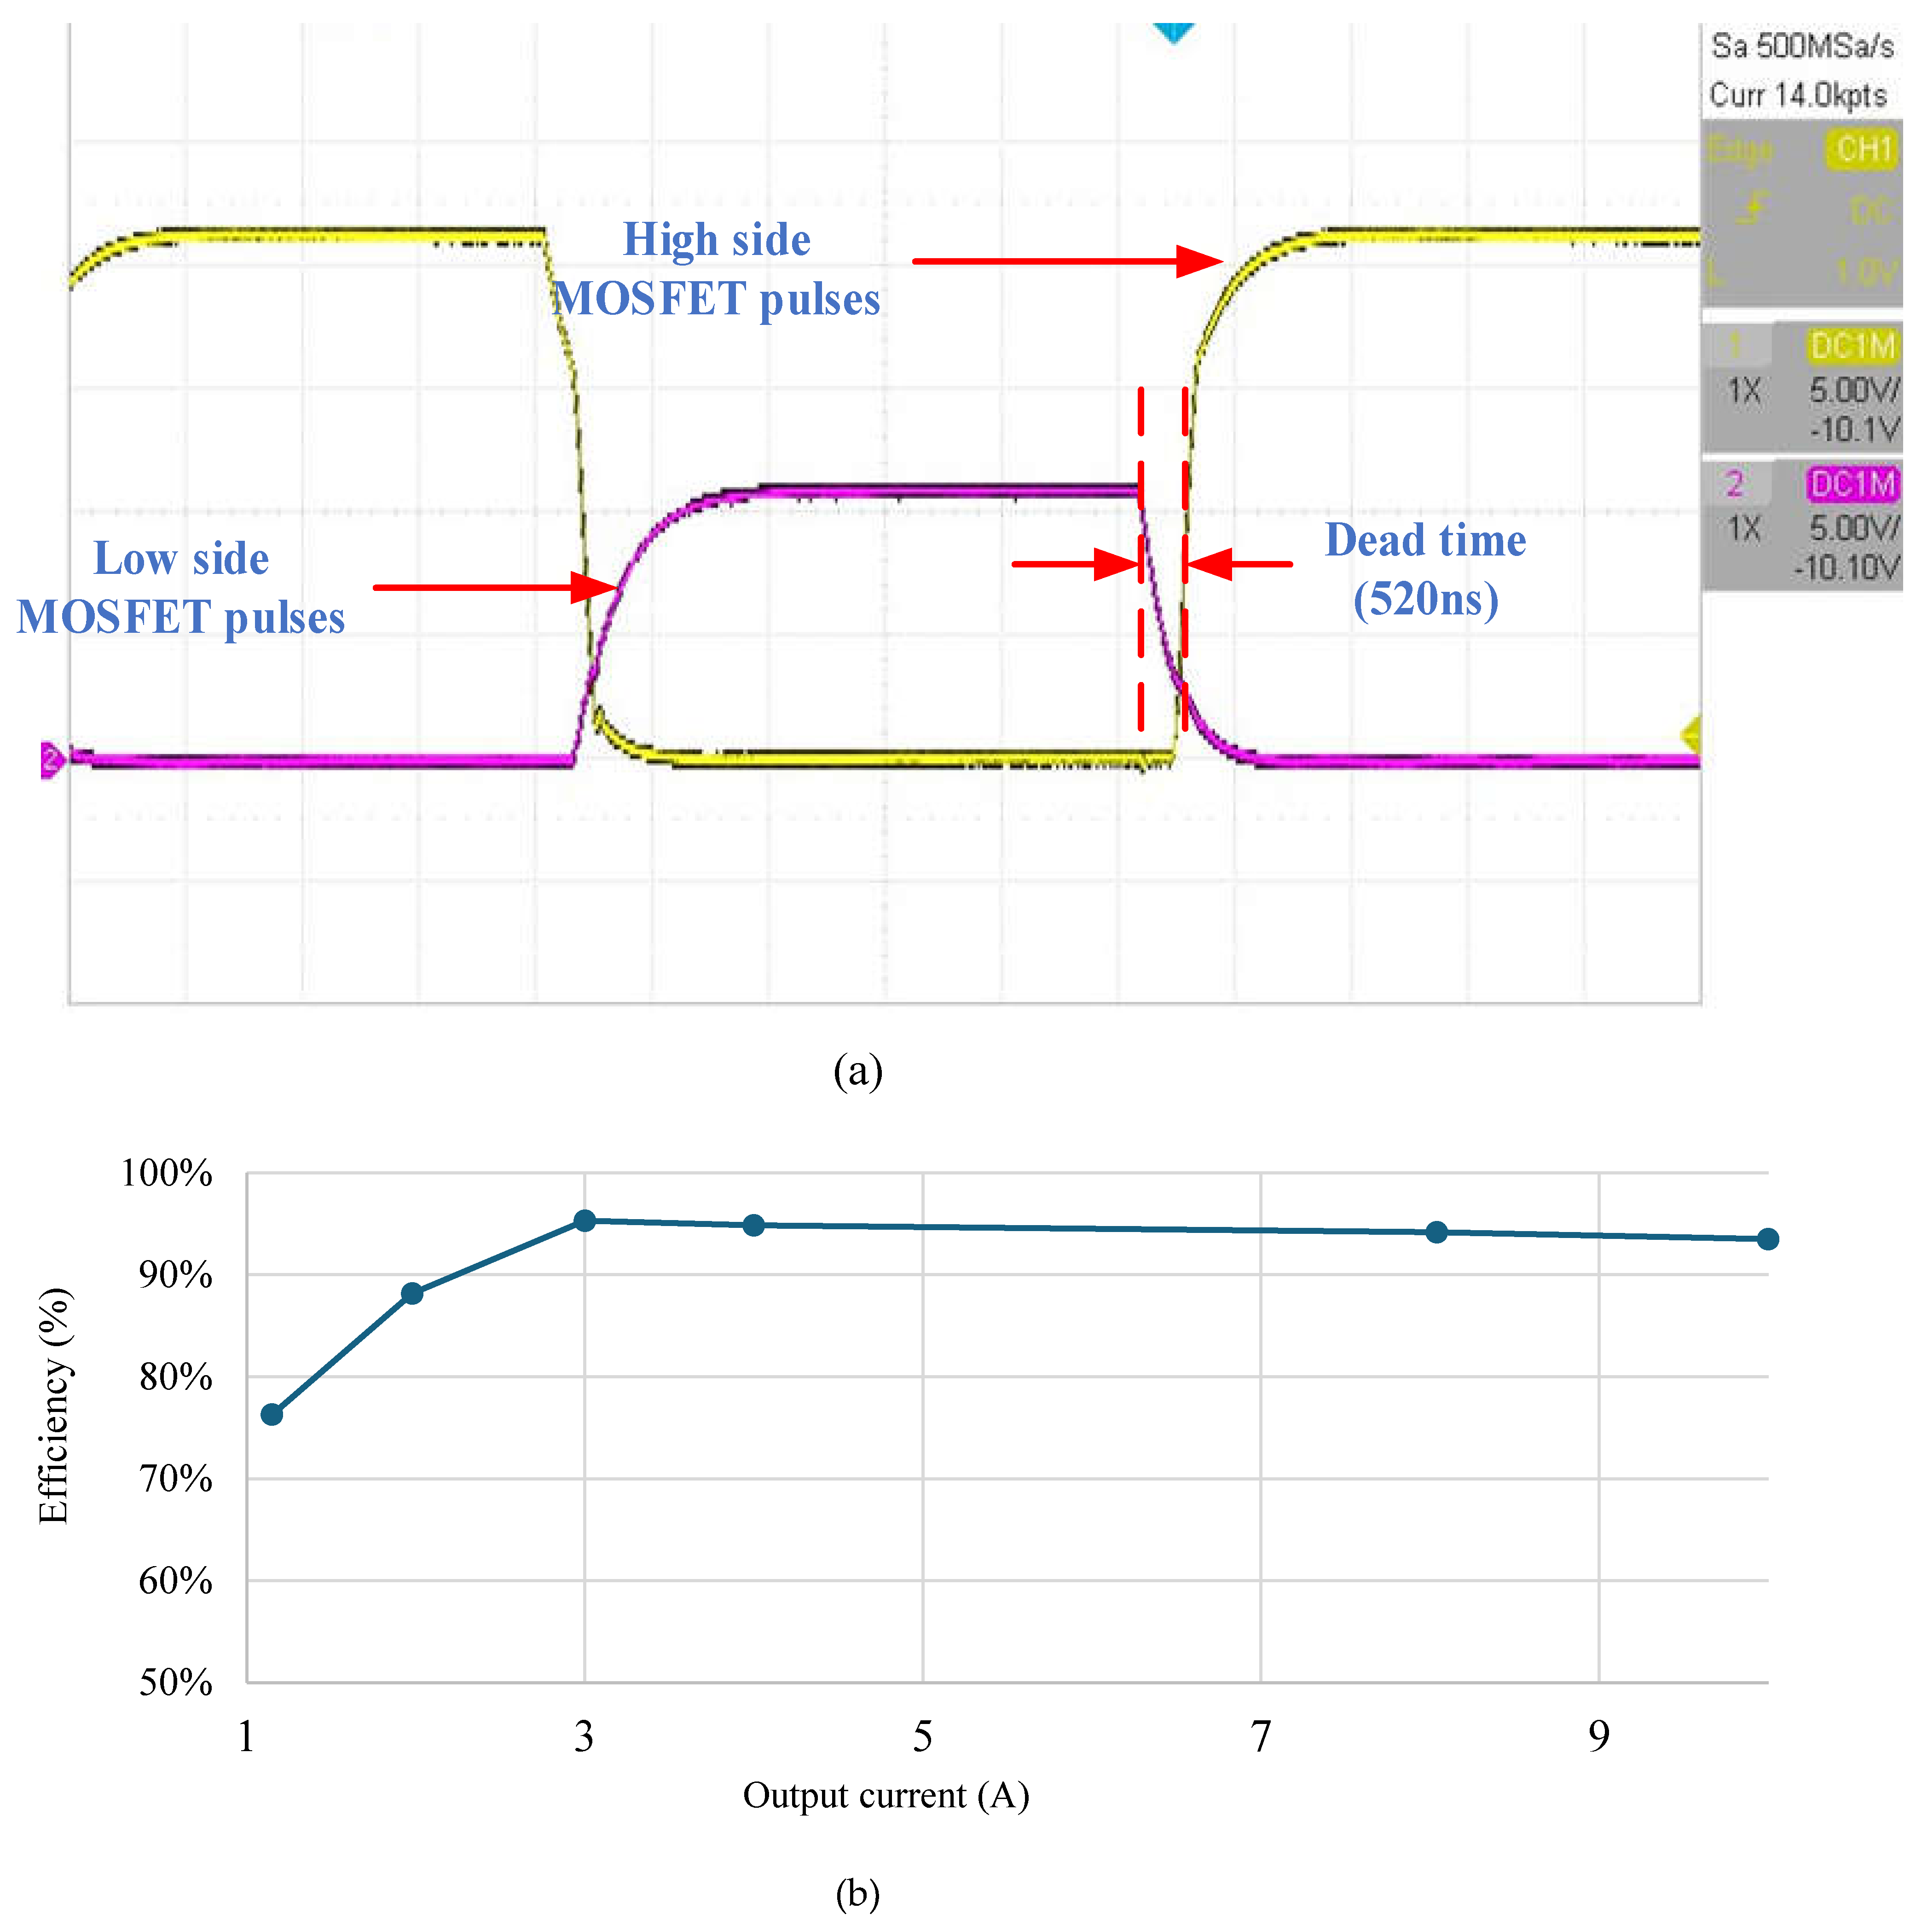
A synchronous buck converter topology has been adopted in this research to achieve better efficiency than the conventional buck converter. In addition, the complementary MOSFET switching pulses have dead time of 5.20 × 10
-7 s to reduce switching losses by implementing ZVS (
Figure 11(a)). Along with this using a larger output capacitor and higher switching ensures better quality of output voltage. For a wider range of load current the efficiency varies slightly, but remains above 90% as seen in
Figure 11(b).
3.4.2. A Comparative Study of Grid-Connected Power Supply vs. Open-Source Converter with Solar Power
From the AEM efficiency versus electrical power plot in
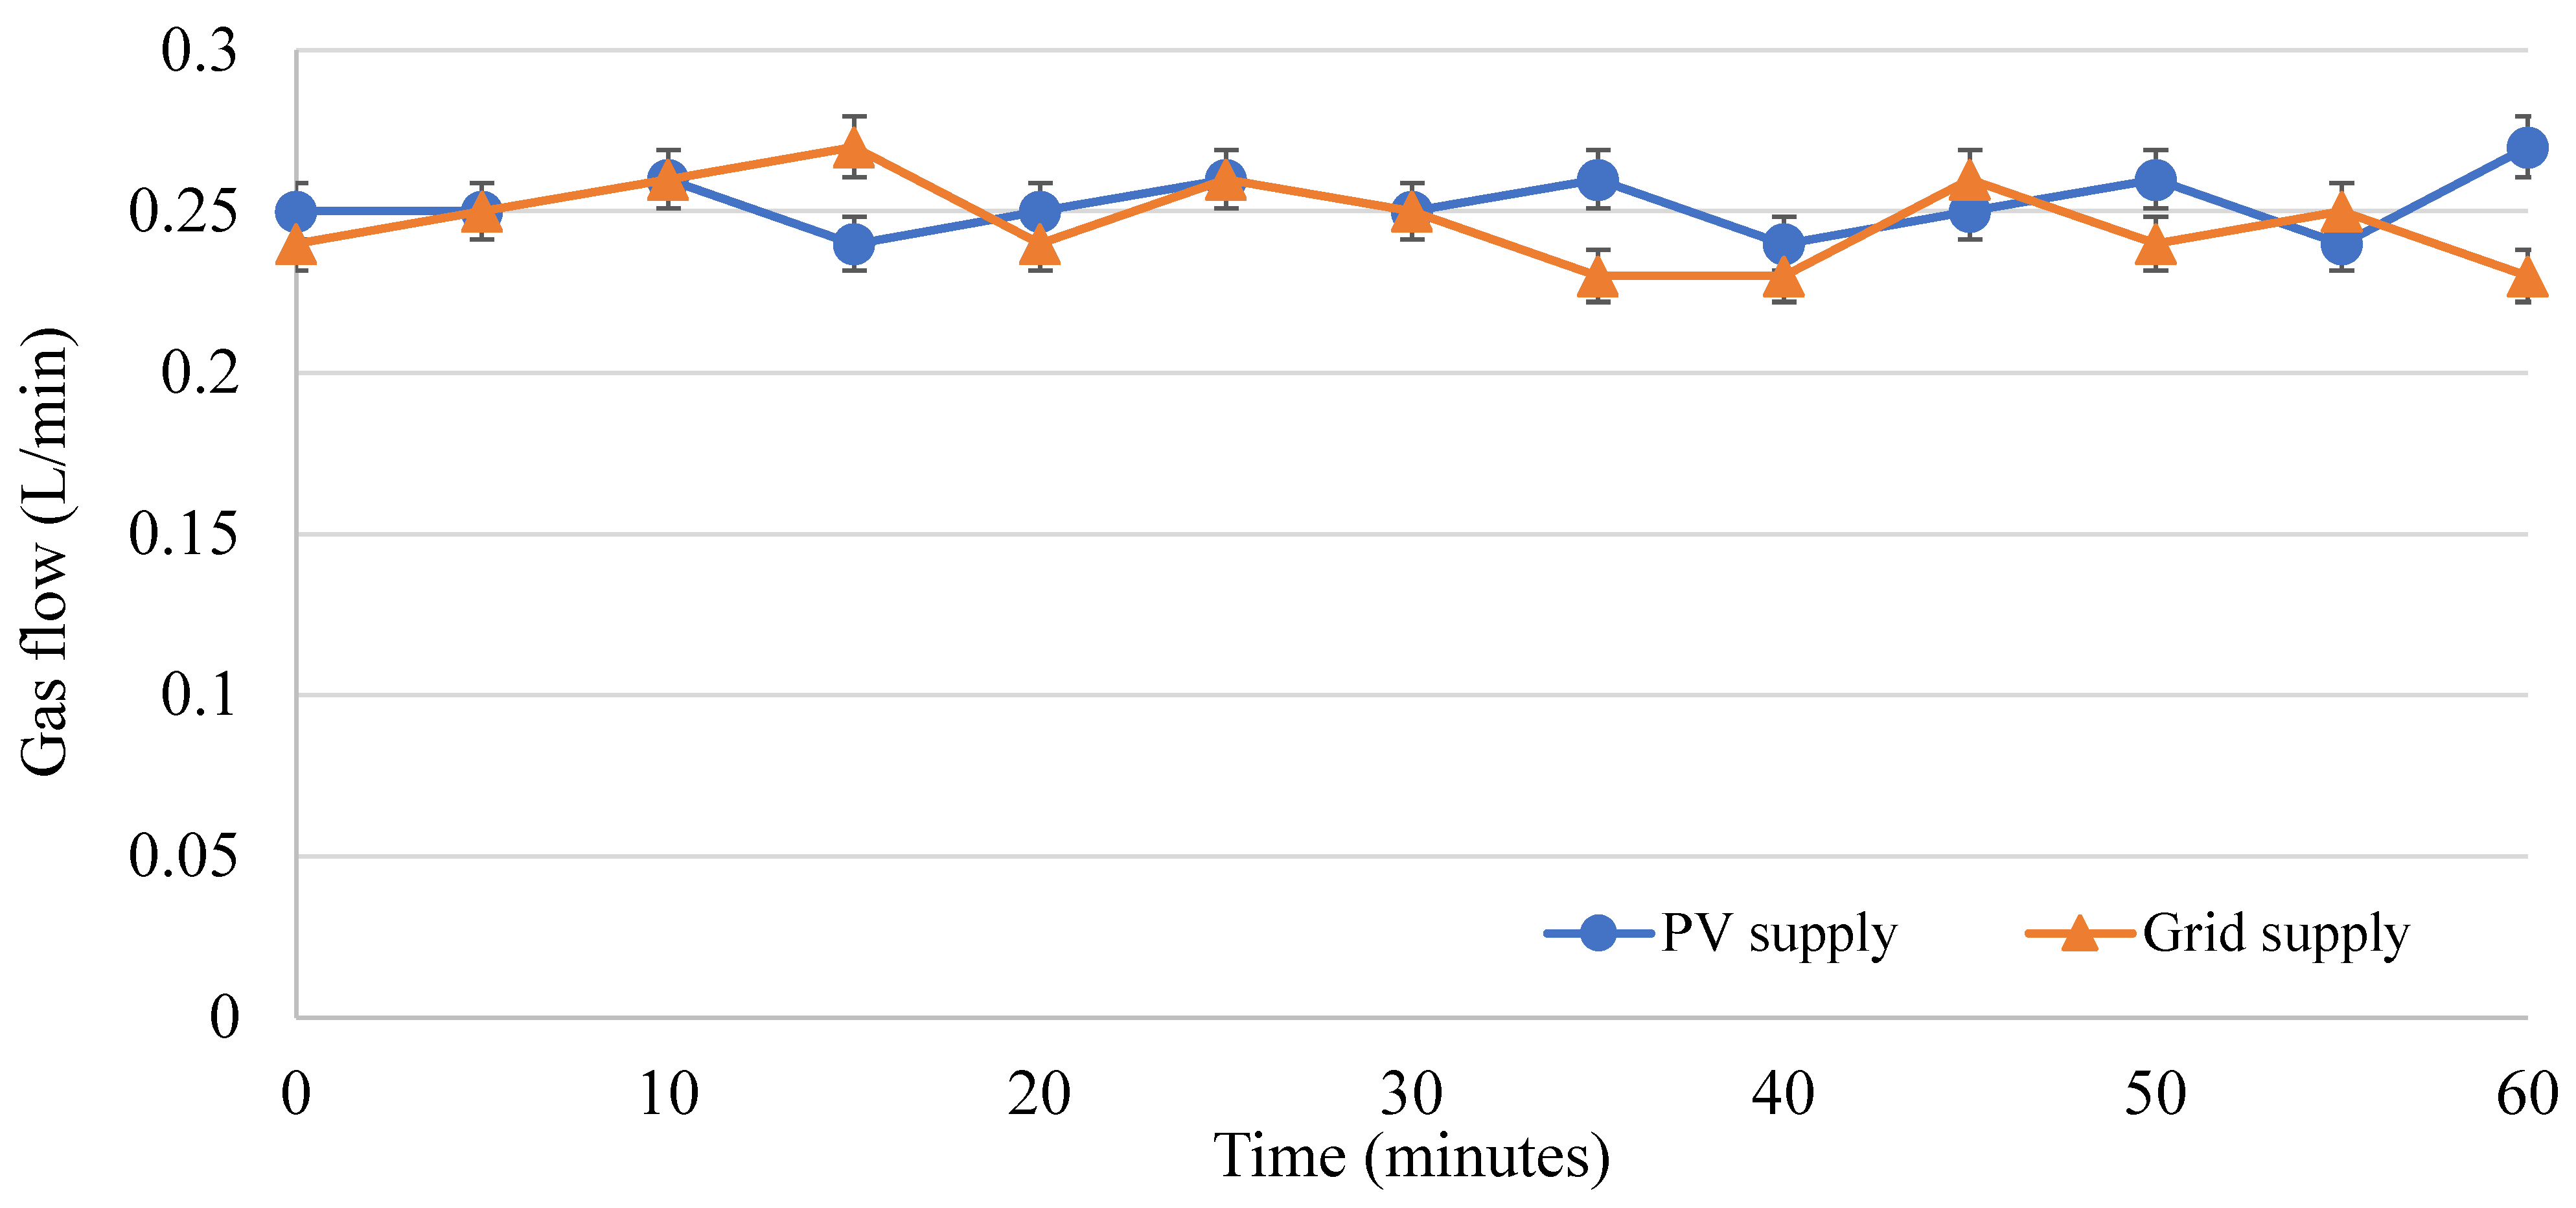
Figure 10(b), efficiency is found to be approximately 60% for operating current ranging from 8 A-14 A. For this study 10 A is considered as optimum operating current and the AEM is operated at this current for 60 minutes for both the grid connected and off-grid PV setup at the same 10 A current. The two setups are directly compared based on measuring the flow rate in each in three minutes interval. From
Figure 12 it is clear that for both setups, the flow rate almost remains stable for 10 A, although a little fluctuation may be caused by experimental measurements using a manual bubble flowmeter (3.5% variance) as shown by the variance values in
Figure 12. Throughout the period of experiment for the setup the flow rate of hydrogen is found to be around 0.25 L/min.
4. Discussion
Green hydrogen production utilizing renewable energy provided through grid power is increasingly becoming mainstream (Bianco and Blanco, 2020; Islam et al., 2024; Li et al., 2022), although the potential for incorporating solar DC power directly into the process is foreseeable. Additionally, the requirement of DC power for electrolysis adds further potential efficiency gains. There have been very few instances where DC power is directly employed (Gibson and Kelly, 2010, 2008), and utilizing excess energy of an already existing PV system makes the approach used here unique. PV systems have become the lowest-cost form of electricity generation in many areas, offering a sustainable alternative to fossil fuels (Bellini, 2021; Kennedy, 2023). The intermittent nature of solar energy can present a challenge for grid operators (Anees, 2012; Pérez-Arriaga and Batlle, 2012). For example, the daily solar cycle can lead to an excess supply during peak sunlight hours, contributing to what is known as the "duck curve” (Jones-Albertus, 2017). To address this challenge, H2 can be used as a form of energy storage by utilizing excess electricity generated from PV systems to electrolyze water into hydrogen. This stored energy can be used during periods of low solar output or high demand (IRENA, 2020b). This study provides an alternative, open-source solution utilizing direct PV power for the AEM electrolyzer. This open-source solution could significantly impact the hydrogen production industry as open source technologies can be scaled by any company (Chengalur-Smith et al., 2010; Pearce, 2015).
The results shown here not only demonstrate the feasibility, but also provide test results that validate the effectiveness of AEM electrolyzer when powered directly by solar energy in this configuration. The proposed method shows how utilizing the excess PV generated power, the opensource dc-to-dc converter as illustrated in
Figure 11, maintains a steady-state operation for the electrolyzer. This setup, in those conditions consistently achieves an average flow rate of 0.25 L/min. Based on the planned operational hours, this results in an annual production of 57,810 liters of hydrogen, considering 15 L/hr over 0.1 kWhr of energy consumption and the 370.4 kWhr scheduled over the entire year using a single PV module. All aspects of this design can be increased to reach scale.
This study had several limitations that can be overcome in future work. Although, the number of cases considered for AEM scheduling here is adequate to get reasonable results; a higher number of cases might result in more accurate optimization. On the other hand, daily scheduling without the use of additional batteries, as mentioned in method 1, allows for very easy implementation of this system, but utilizes only less than half of the total excess power. Also predicting on PV power generation data in advance for proper scheduling, however, is still challenging as it depends directly on weather prediction (Slingo and Palmer, 2011). In contrast, monthly scheduling combined with some battery storage will significantly reduce PV energy waste and unmet load issues. Heuristic search space methods, however, such as particle swarm optimization (PSO), can also be implemented in the future to find the optimal operating schedule (Oberloier et al., 2022). This requires incorporating a PSO into the SAMA code to identify the optimal scheduling. The PSO algorithm will vary the operating hours each month, creating new yearly load data. Based on this load data, SAMA will provide the yearly excess energy data and unmet load data and the optimal scheduling will be selected. In addition to optimal scheduling, integrating the scheduling scheme with the preexisting system and its existing load is essential for the feasibility analysis of the method. Finally, a life cycle assessment of the system may provide greater insight into its economic and environmental benefits of this approach for supporting distributed generation of PV (Roy and Pearce, 2024).
5. Conclusions
This study introduces a new approach for green hydrogen production, demonstrating the practical integration of an open-source DC-DC converter with solar photovoltaics to power an anion exchange membrane electrolyzer. The open-source converter, able to keep efficiency over 90%, has shown how it can be used to directly power the electrolyzer while taking advantage of solar energy surplus after all other electrical loads are met. This approach not only facilitates hydrogen production but also paves the way for further research in adjustable DC-DC converter topologies and their integration into hydrogen production systems. By strategically scheduling the demonstration AEM electrolyzer stack for maximizing the output hydrogen production and minimizing solar energy waste, the results show how even a small AEM of only 3 cells and 50 cm2 active area can effectively generate over 5 kg (57,810 L) of hydrogen per year. This hydrogen allows the excess solar electricity to be stored and utilized more flexibly. The scheduling scheme for non-critical loads based on the excess PV power of an existing system introduces innovative techniques to optimize load management. This approach enhances the utilization of off-grid PV power, shifting the focus from designing systems tailored to the load to optimizing the load for existing systems. This introduces a novel concept for off-grid PV system design, advancing the goal of adopting fully off-grid system by maximizing the full utilization of PV power capacity without relying on grid connectivity. By employing this sustainable method, the study highlights a scalable solution that not only enhances the efficiency of hydrogen production, but also promotes the deployment of renewable energy technologies. This exemplifies a significant advancement in the field of green energy, offering a potential pathway towards achieving carbon neutrality.
6. Acknowledgements
This work was supported by the Hydrogen Innovation Fund (HIF) by the Independent Electricity System Operator (IESO), which aims to explore the integration of low-carbon hydrogen technologies into Ontario's electricity grid, the Natural Sciences and Engineering Research Council of Canada and the Thompson Endowment.
References
- Absopulse Electronics Ltd. DC-DC Converters. ABSOPULSE Electronics Ltd., 2024. Available online: https://absopulse.com/dc-dc-power-converters/ (accessed on 29 May 2024).
- alayi. alayi/stm32f334-buck-boost; 2024.
- Al-Buraiki, A.S.; Al-Sharafi, A. Hydrogen production via using excess electric energy of an off-grid hybrid solar/wind system based on a novel performance indicator. Energy Conversion and Management 2022, 254, 115270. [Google Scholar] [CrossRef]
- Ali Sadat, S.; Takahashi, J.; Pearce, J.M. A Free and open-source microgrid optimization tool: SAMA the solar alone Multi-Objective Advisor. Energy Conversion and Management 2023, 298, 117686. [Google Scholar] [CrossRef]
- Anees, A.S. Grid integration of renewable energy sources: Challenges, issues and possible solutions. In Proceedings of the 2012 IEEE 5th India International Conference on Power Electronics (IICPE); 2012; pp. 1–6. [Google Scholar] [CrossRef]
- Atlam, O.; Barbir, F.; Bezmalinovic, D. A method for optimal sizing of an electrolyzer directly connected to a PV module. International Journal of Hydrogen Energy 2011, 36, 7012–7018. [Google Scholar] [CrossRef]
- Bellini, E. Utility scale solar reaches LCOE of $0.028-$0.041/kWh in the US, Lazard finds [WWW Document]. pv magazine International. 2021. Available online: https://www.pv-magazine.com/2021/11/05/utility-scale-solarreaches- lcoe-of-0-028-0-041-kwh-in-the-us-lazard-finds/ (accessed on 29 May 2024).
- Bianco, E.; Blanco, H. Green Hydrogen: A Guide to Policy Making. 2020. [Google Scholar]
- Bowyer, A. 3D Printing and Humanity’s First Imperfect Replicator. 3D Printing and Additive Manufacturing 2014, 1, 4–5. [Google Scholar] [CrossRef]
- Brunoro, M.; Vieira, J.L.F. A high-performance ZVS full-bridge DC-DC 0-50-V/0-10-A power supply with phase-shift control. IEEE Transactions on Power Electronics 1999, 14, 495–505. [Google Scholar] [CrossRef]
- Chengalur-Smith, I.; Nevo, S.; Demertzoglou, P. An Empirical Analysis of the Business Value of Open Source Infrastructure Technologies. Journal of the Association for Information Systems 2010, 11. [Google Scholar] [CrossRef]
- De Lorenzo, G.; Agostino, R.G.; Fragiacomo, P. Dynamic Electric Simulation Model of a Proton Exchange Membrane Electrolyzer System for Hydrogen Production. Energies 2022, 15, 6437. [Google Scholar] [CrossRef]
- Drok. DROK [WWW Document]. DROK. 2024. Available online: https://www.droking.com/ (accessed on 29 May 2024).
- Đukić, A.; Firak, M. Hydrogen production using alkaline electrolyzer and photovoltaic (PV) module. International Journal of Hydrogen Energy Hysydays 2011, 36, 7799–7806. [Google Scholar] [CrossRef]
- Elejoy [WWW Document]. 2024. Elejoy. Available online: https://elejoy.com/ (accessed on 18 June 2024). Elejoy.
- Energy.gov. DOE Study Shows Maximizing Capabilities of Existing Transmission Lines through Grid-Enhancing Technologies (GETs) Can Reduce Transmission Investment and Increase Renewable Integratio. Office of Electricity, 2022. [Google Scholar]
- Falcão, D.S. Green Hydrogen Production by Anion Exchange Membrane Water Electrolysis: Status and Future Perspectives. Energies 2023, 16, 943. [Google Scholar] [CrossRef]
- Gibson, T.L.; Kelly, N.A. Predicting efficiency of solar powered hydrogen generation using photovoltaic-electrolysis devices. International Journal of Hydrogen Energy 2010, 35, 900–911. [Google Scholar] [CrossRef]
- Gibson, T.L.; Kelly, N.A. Optimization of solar powered hydrogen production using photovoltaic electrolysis devices. International Journal of Hydrogen Energy 2008, 33, 5931–5940. [Google Scholar] [CrossRef]
- Guilbert, D.; Vitale, G. Improved Hydrogen-Production-Based Power Management Control of a Wind Turbine Conversion System Coupled with Multistack Proton Exchange Membrane Electrolyzers. Energies 2020, 13, 1239. [Google Scholar] [CrossRef]
- Hassan, S.Z.; Mumtaz, S.; Kamal, T.; Khan, L. Performance of grid-integrated photovoltaic/fuel cell/ electrolyzer/battery hybrid power system. In Proceedings of the 2015 Power Generation System and Renewable Energy Technologies (PGSRET); 2015; pp. 1–8. [Google Scholar] [CrossRef]
- IRENA. Green hydrogen cost reduction - Scaling up electrolysers to meet the 1.5 C climate goal. 2020. [Google Scholar]
- Islam, A.; Islam, T.; Mahmud, H.; Raihan, O.; Islam, M.S.; Marwani, H.M.; Rahman, M.M.; Asiri, A.M.; Hasan, M.M.; Hasan, M.N.; et al. Accelerating the green hydrogen revolution: A comprehensive analysis of technological advancements and policy interventions. International Journal of Hydrogen Energy 2024, 67, 458–486. [Google Scholar] [CrossRef]
- Jones, R.; Haufe, P.; Sells, E.; Iravani, P.; Olliver, V.; Palmer, C.; Bowyer, A. RepRap—the replicating rapid prototyper. Robotica 2011, 29, 177–191. [Google Scholar] [CrossRef]
- Jones-Albertus, B. Confronting the Duck Curve: How to Address Over-Generation of Solar Energy | Department of Energy [WWW Document]. 2017. Available online: https://www.energy.gov/eere/articles/confronting-duck-curve-how-address-over-generation-solar-energy (accessed on 29 May 2024).
- Kennedy, R. Solar levelized cost of electricity is 29% lower than any fossil fuel alternative [WWW Document]. pv magazine USA. 2023. Available online: https://pv-magazine-usa.com/2023/12/07/solar-levelized-cost-of-electricity-is-29-lower-than-any-fuel-fossil-alternative/ (accessed on 29 May 2024).
- Khalilnejad, A.; Sundararajan, A.; Abbaspour, A.; Sarwat, A. Optimal Operation of Combined Photovoltaic Electrolyzer Systems. Energies 2016, 9, 332. [Google Scholar] [CrossRef]
- Kirk, K. Energy loss is single-biggest component of today’s electricity system » Yale Climate Connections [WWW Document]. Yale Climate Connections. 2022. Available online: http://yaleclimateconnections.org/2022/10/energy-loss-is-single-biggest-component-of-todays-electricity-system/ (accessed on 20 May 2024).
- Koch, D.; Wrana, D.; Schoch, B.; Kallfass, I. Low-Noise, 24 V, 1 A, 2.1 MHz GaN DC/DC Converter for Variable Power Supply of a GaN-Based Solid-State Power Amplifier. In Proceedings of the 2022 IEEE Applied Power Electronics Conference and Exposition (APEC); 2022; pp. 1208–1213. [Google Scholar] [CrossRef]
- Kojima, H.; Nagasawa, K.; Todoroki, N.; Ito, Y.; Matsui, T.; Nakajima, R. Influence of renewable energy power fluctuations on water electrolysis for green hydrogen production. International Journal of Hydrogen Energy 2023, 48, 4572–4593. [Google Scholar] [CrossRef]
- Li, Y.; Shi, X.; Phoumin, H. A strategic roadmap for large-scale green hydrogen demonstration and commercialisation in China: A review and survey analysis. International Journal of Hydrogen Energy, Hydrogen Sourced from Renewables and Clean Energy: Feasibility of Large-scale Demonstration Projects 2022, 47, 24592–24609. [Google Scholar] [CrossRef]
- Maeda, T.; Ito, H.; Hasegawa, Y.; Zhou, Z.; Ishida, M. Study on control method of the stand-alone direct-coupling photovoltaic—Water electrolyzer. International Journal of Hydrogen Energy Optimization Approaches to Hydrogen Logistics 2012, 37, 4819–4828. [Google Scholar] [CrossRef]
- Magnetics. Inductor Design Tool [WWW Document]. 2024. Available online: https://magneticsinductordesigntool.spang.com/system/recommend (accessed on 23 April 2023).
- Mean Well [WWW Document]. Mean Well, 2024. Available online: https://www.meanwell.com/index.aspx (accessed on 17 June 2024).
- Muhammad-Bashir, S.; Al-Oufi, M.; Al-Hakami, M.; Nadeem, M.A.; Mudiyanselage, K.; Idriss, H. Comparison between the performance of high concentrated and non-concentrated PV-cells for hydrogen production using PEM water electrolyzers. Solar Energy 2020, 205, 461–464. [Google Scholar] [CrossRef]
- Oberloier, S.; Holmes, W.J.; Reich, L.A.; Pearce, J.M. Particle Swarm Optimization of Printing Parameters for Open-source TIG-based Metal 3D Printing. Chinese Journal of Mechanical Engineering: Additive Manufacturing Frontiers 2022, 1, 100050. [Google Scholar] [CrossRef]
- Oberloier, S.; Pearce, J.M. General Design Procedure for Free and Open-Source Hardware for Scientific Equipment. Designs 2018, 2, 2. [Google Scholar] [CrossRef]
- Oliveira, A.M.; Beswick, R.R.; Yan, Y. A green hydrogen economy for a renewable energy society. Current Opinion in Chemical Engineering 2021, 33, 100701. [Google Scholar] [CrossRef]
- Pearce, J.M. Economic savings for scientific free and open source technology: A review. HardwareX 2020, 8, e00139. [Google Scholar] [CrossRef]
- Pearce, J.M. Quantifying the Value of Open Source Hard-ware Development. Modern Economy 2015, 06, 1. [Google Scholar] [CrossRef]
- Pellow, M.A.; Emmott, C.J.; Barnhart, C.J.; Benson, S.M. Hydrogen or batteries for grid storage? A net energy analysis. Energy & Environmental Science 2015, 8, 1938–1952. [Google Scholar] [CrossRef]
- Pérez-Arriaga, I.J.; Batlle, C. Impacts of Intermittent Renewables on Electricity Generation System Operation. Economics of Energy & Environmental Policy 2012, 1, 3–18. [Google Scholar]
- Podlesnyi, V. vpodlesnyi/SynchrBuckConverter. 2024. [Google Scholar]
- Prehoda, E.; Pearce, J.M.; Schelly, C. Policies to Overcome Barriers for Renewable Energy Distributed Generation: A Case Study of Utility Structure and Regulatory Regimes in Michigan. Energies 2019, 12, 674. [Google Scholar] [CrossRef]
- Rahim, A.H.A.; Tijani, A.S.; Fadhlullah, M.; Hanapi, S.; Sainan, K.I. Optimization of Direct Coupling Solar PV Panel and Advanced Alkaline Electrolyzer System. Energy Procedia 2015, 79, 204–211. [Google Scholar] [CrossRef]
- Rahman, M.M.; Antonini, G.; Pearce, J.M. Open-source DC-DC converter. 2024. [Google Scholar]
- Rouholamini, M.; Mohammadian, M. Energy management of a grid-tied residential-scale hybrid renewable generation system incorporating fuel cell and electrolyzer. Energy and Buildings 2015, 102, 406–416. [Google Scholar] [CrossRef]
- Roy, R.; Pearce, J.M. Is small or big solar better for the environment? Comparative life cycle assessment of solar photovoltaic rooftop vs. ground-mounted systems. Int J Life Cycle Assess 2024, 29, 516–536. [Google Scholar] [CrossRef]
- Sadat, S.A.; Pearce, J.M. SAMA (Solar Alone Multi-objective Advisor). 2023. [Google Scholar] [CrossRef]
- Schelly, C.; Louie, E.P.; Pearce, J.M. Examining interconnection and net metering policy for distributed generation in the United States. Renewable Energy Focus 2017, 22–23, 10–19. [Google Scholar] [CrossRef]
- Sells, E.; Bailard, S.; Smith, Z.; Bowyer, A.; Olliver, V. RepRap: The Replicating Rapid Prototyper: Maximizing Customizability by Breeding the Means of Production. In Handbook of Research in Mass Customization and Personalization; World Scientific Publishing Company, 2009; pp. 568–580. [Google Scholar] [CrossRef]
- Shiva Kumar, S.; Lim, H. An overview of water electrolysis technologies for green hydrogen production. Energy Reports 2022, 8, 13793–13813. [Google Scholar] [CrossRef]
- Slingo, J.; Palmer, T. Uncertainty in weather and climate prediction. Philosophical Transactions of the Royal Society A: Mathematical Physical and Engineering Sciences 2011, 369, 4751–4767. [Google Scholar] [CrossRef] [PubMed]
- Song, H.; Luo, S.; Huang, H.; Deng, B.; Ye, J. Solar-Driven Hydrogen Production: Recent Advances, Challenges, and Future Perspectives. ACS Energy Lett 2022, 7, 1043–1065. [Google Scholar] [CrossRef]
- Starke, M.; Tolbert, L.M.; Ozpineci, B. AC vs. DC distribution: A loss comparison. In Proceedings of the 2008 IEEE/PES Transmission and Distribution Conference and Exposition; 2008; pp. 1–7. [Google Scholar] [CrossRef]
- Ural, Z.; Gencoglu, M.T. Design and simulation of a solar-hydrogen system for different situations. International Journal of Hydrogen Energy 2014, 39, 8833–8840. [Google Scholar] [CrossRef]
- Vafaei, N.; Ribeiro, R.; Camarinha-Matos, L. Selecting Normalization Techniques for the Analytical Hierarchy Process. 2020; pp. 43–52. [Google Scholar] [CrossRef]
- Vidas, L.; Castro, R. Recent Developments on Hydrogen Production Technologies: State-of-the-Art Review with a Focus on Green-Electrolysis. Applied Sciences 2021, 11, 11363. [Google Scholar] [CrossRef]
- Wang, T.; Cao, X.; Jiao, L. PEM water electrolysis for hydrogen production: fundamentals, advances, and prospects. Carb Neutrality 2022, 1, 21. [Google Scholar] [CrossRef]
Figure 1.
(a) Electrolyzer testing setup; (b) 3 cell version of Cipher Neutron AEM; (c) wiring diagram.
Figure 1.
(a) Electrolyzer testing setup; (b) 3 cell version of Cipher Neutron AEM; (c) wiring diagram.
Figure 2.
Flow chart of optimizing AEM operating schedule (Method 2).
Figure 2.
Flow chart of optimizing AEM operating schedule (Method 2).
Figure 4.
(a) 3-D encloser design; (b) PCB design of DC-DC converter; (c) Assembly of the converter; (d) Final off grid PV supply setup for AEM electrolyzer.
Figure 4.
(a) 3-D encloser design; (b) PCB design of DC-DC converter; (c) Assembly of the converter; (d) Final off grid PV supply setup for AEM electrolyzer.
Figure 5.
Monthly PV power generation for 400 W PV module at 34° tilt angles in London, ON.
Figure 5.
Monthly PV power generation for 400 W PV module at 34° tilt angles in London, ON.
Figure 6.
Case based excess energy and unmet energy plot. The optimal impact is highlighted.
Figure 6.
Case based excess energy and unmet energy plot. The optimal impact is highlighted.
Figure 7.
(a) Utilization of PV energy by AEM, battery charging and wastage. (b) Monthly scheduled load based on method 1.
Figure 7.
(a) Utilization of PV energy by AEM, battery charging and wastage. (b) Monthly scheduled load based on method 1.
Figure 8.
(a) Monthly scheduled load based on case 8; (b) Utilization of PV energy by AEM, battery charging and wastage; (c) Sources of scheduled AEM power.
Figure 8.
(a) Monthly scheduled load based on case 8; (b) Utilization of PV energy by AEM, battery charging and wastage; (c) Sources of scheduled AEM power.
Figure 9.
(a) Current vs voltage characteristics curve of AEM electrolyzer; (b) Gas flow measurements.
Figure 9.
(a) Current vs voltage characteristics curve of AEM electrolyzer; (b) Gas flow measurements.
Figure 10.
(a) MicroGC chromatogram; (b) Efficiency vs power consumption of AEM.
Figure 10.
(a) MicroGC chromatogram; (b) Efficiency vs power consumption of AEM.
Figure 11.
(a) Complementary pulses and dead time; (b) Efficiency as a function of output current.
Figure 11.
(a) Complementary pulses and dead time; (b) Efficiency as a function of output current.
Figure 12.
Flow rate vs time (grid vs off grid).
Figure 12.
Flow rate vs time (grid vs off grid).
Table 1.
Parameters of adjustable DC-DC buck converters.
Table 1.
Parameters of adjustable DC-DC buck converters.
| Parameter |
Value |
| Max load power |
120 W |
| Input voltage VS
|
12 V |
| Output voltage V0
|
6 V |
| Duty cycle (d) |
50% |
| Average current (Iavg) |
20 A |
| Ripple Current (Δl) |
5 A |
| Peak inductor current (ipeak) |
25 A |
| Critical Inductance (Lcrit) |
24 μH |
| Critical output capacitor (Ccrit) |
416.67 μF |
| Inductance (L) |
25 μH, 25A |
| Output capacitor (Co) |
470 μF, 25V |
| Input capacitor (Cin) |
470 μF, 25V |
Table 2.
Inductor design parameters (Magnetics, 2024).
Table 2.
Inductor design parameters (Magnetics, 2024).
| Parameters |
Values |
| Number of Turns |
22 |
| Wire Size (AWG) |
16 AWG |
| Winding Factor |
20.8% |
| DC Resistance |
12.49 mΩ |
| Finished OD |
30.7 mm |
| Finished HT |
15 mm |
| Total Wire Length |
947 mm |
| Saturation current Isat
|
38.9107 A |
Table 3.
Hourly average PV power generation to find operational hours (marked in green) for each month.
Table 3.
Hourly average PV power generation to find operational hours (marked in green) for each month.
| Month |
6AM |
7AM |
8AM |
9AM |
10AM |
11AM |
12PM |
1PM |
2PM |
3PM |
4PM |
5PM |
6PM |
Min |
Max |
| Jan |
0.00 |
0.00 |
0.05 |
0.09 |
0.15 |
0.16 |
0.18 |
0.16 |
0.14 |
0.09 |
0.07 |
0.00 |
0.00 |
5 |
10 |
| Feb |
0.00 |
0.02 |
0.07 |
0.12 |
0.17 |
0.21 |
0.22 |
0.19 |
0.19 |
0.14 |
0.09 |
0.04 |
0.00 |
7 |
14 |
| Mar |
0.00 |
0.05 |
0.11 |
0.18 |
0.21 |
0.22 |
0.23 |
0.24 |
0.20 |
0.15 |
0.10 |
0.05 |
0.00 |
8 |
17 |
| Apr |
0.02 |
0.07 |
0.13 |
0.17 |
0.23 |
0.23 |
0.25 |
0.24 |
0.20 |
0.16 |
0.11 |
0.06 |
0.01 |
9 |
18 |
| May |
0.03 |
0.10 |
0.14 |
0.19 |
0.22 |
0.24 |
0.25 |
0.23 |
0.22 |
0.19 |
0.12 |
0.07 |
0.02 |
9 |
20 |
| Jun |
0.04 |
0.09 |
0.14 |
0.19 |
0.23 |
0.25 |
0.26 |
0.24 |
0.21 |
0.18 |
0.13 |
0.08 |
0.03 |
9 |
20 |
| Jul |
0.03 |
0.08 |
0.14 |
0.18 |
0.22 |
0.24 |
0.26 |
0.24 |
0.22 |
0.17 |
0.12 |
0.08 |
0.03 |
9 |
20 |
| Aug |
0.02 |
0.07 |
0.12 |
0.17 |
0.20 |
0.22 |
0.25 |
0.24 |
0.21 |
0.17 |
0.12 |
0.07 |
0.02 |
9 |
18 |
| Sep |
0.01 |
0.06 |
0.13 |
0.17 |
0.21 |
0.23 |
0.24 |
0.22 |
0.19 |
0.15 |
0.10 |
0.05 |
0.00 |
9 |
17 |
| Oct |
0.00 |
0.05 |
0.09 |
0.16 |
0.16 |
0.18 |
0.19 |
0.18 |
0.14 |
0.12 |
0.07 |
0.02 |
0.00 |
7 |
13 |
| Nov |
0.00 |
0.01 |
0.07 |
0.11 |
0.13 |
0.14 |
0.14 |
0.13 |
0.13 |
0.09 |
0.04 |
0.00 |
0.00 |
6 |
10 |
| Dec |
0.00 |
0.00 |
0.05 |
0.09 |
0.12 |
0.14 |
0.14 |
0.12 |
0.11 |
0.08 |
0.04 |
0.00 |
0.00 |
5 |
8 |
Table 4.
Cases considered based on different monthly operating hours for optimal scheduling.
Table 4.
Cases considered based on different monthly operating hours for optimal scheduling.
| Month |
Jan |
Feb |
Mar |
April |
May |
June |
July |
Aug |
Sep |
Oct |
Nov |
Dec |
| Case 1 |
8 |
12 |
15 |
15 |
16 |
16 |
16 |
14 |
14 |
10 |
8 |
6 |
| Case 2 |
7 |
11 |
12 |
13 |
15 |
15 |
15 |
13 |
12 |
8 |
7 |
5 |
| Case 3 |
7 |
10 |
11 |
12 |
14 |
14 |
14 |
12 |
11 |
7 |
6 |
5 |
| Case 4 |
7 |
10 |
11 |
13 |
15 |
15 |
15 |
13 |
12 |
7 |
6 |
5 |
| Case 5 |
8 |
12 |
15 |
16 |
18 |
18 |
18 |
16 |
15 |
11 |
8 |
6 |
| Case 6 |
7 |
10 |
12 |
13 |
15 |
15 |
15 |
15 |
13 |
9 |
6 |
5 |
| Case 7 |
7 |
10 |
11 |
14 |
16 |
16 |
16 |
14 |
12 |
9 |
6 |
5 |
| Case 8 |
7 |
9 |
11 |
14 |
16 |
16 |
16 |
14 |
11 |
9 |
6 |
5 |
| Case 9 |
7 |
8 |
11 |
14 |
15 |
16 |
16 |
14 |
12 |
9 |
7 |
5 |
| Case 10 |
7 |
9 |
12 |
14 |
16 |
17 |
17 |
14 |
12 |
9 |
6 |
6 |
Table 5.
Excess electricity, unmet load, and impact for cases.
Table 5.
Excess electricity, unmet load, and impact for cases.
| Case |
Total PV power [kWhr] |
Scheduled load [kWhr] |
Excess electricity [kWhr] |
Unmet load [kWhr] |
Impact |
| Case 1 |
584 |
456.1 |
146 |
41.8 |
1.44 |
| Case 2 |
584 |
404.3 |
185 |
23.5 |
1.29 |
| Case 3 |
584 |
374.0 |
211 |
15.4 |
1.27 |
| Case 4 |
584 |
392.3 |
194 |
19.5 |
1.27 |
| Case 5 |
584 |
489.8 |
122 |
56.2 |
1.58 |
| Case 6 |
584 |
410.8 |
178 |
24.5 |
1.28 |
| Case 7 |
584 |
413.8 |
174 |
24.6 |
1.26 |
| Case 8 |
584 |
408.0 |
179 |
22.6 |
1.25 |
| Case 9 |
584 |
408.1 |
180 |
23.7 |
1.27 |
| Case 10 |
584 |
423.3 |
167 |
27.8 |
1.29 |
|
Disclaimer/Publisher’s Note: The statements, opinions and data contained in all publications are solely those of the individual author(s) and contributor(s) and not of MDPI and/or the editor(s). MDPI and/or the editor(s) disclaim responsibility for any injury to people or property resulting from any ideas, methods, instructions or products referred to in the content. |
© 2024 by the authors. Licensee MDPI, Basel, Switzerland. This article is an open access article distributed under the terms and conditions of the Creative Commons Attribution (CC BY) license (http://creativecommons.org/licenses/by/4.0/).
