Preprint
Article

Numerical Simulation of Non-Darcy Flow in Naturally Fractured Tight Gas Reservoirs for Enhanced Gas Recovery

Submitted:

20 July 2024

Posted:

22 July 2024

You are already at the latest version

A peer-reviewed article of this preprint also exists.

Abstract
In this work, we analyzed non-Darcy two-component single-phase isothermal flow in naturally fractured tight gas reservoirs for enhanced gas recovery (EGR) and carbon dioxide storage as a possible application. We used the Peng-Robinson equation of state to evaluate the thermodynamic properties of the components, and we performed the discretization of the governing partial differential equations using the Finite Volume Method. This process leads to two subsystems of algebraic equations, which, after linearization and use of an operator splitting method, are solved by the Conjugate Gradient (CG) and Biconjugate Gradient Stabilized (BiCGSTAB) methods for determining the pressure and fraction molar, respectively. We include inertial effects using the Barree and Conway model, gas slippage via a more recent model than Klinkenberg’s and we use a simplified model for the effects of effective stress. We also utilize a mesh refinement technique to represent the discrete fractures. Finally, we implemented simulations to show the influence of inertial, slippage and stress effects on production in fractured tight gas reservoirs.
Keywords: 
Subject: 
Engineering  -   Mechanical Engineering

1. Introduction

Fluid flow in porous media is present in several areas of scientific and technological knowledge [1]. In this context, due to technological advances, so-called unconventional reservoirs have aroused great interest in the oil industry. However, even with the most recent knowledge and technologies, the economically viable production of these reservoirs still presents challenges when aiming to increase gas recovery rates [2]. On the other hand, they have great potential regarding the geological storage of carbon dioxide. Therefore, the numerical simulation of flow in tight and shale gas reservoirs is a topic of great importance for the energy sector on a global scale.
Specifically, it is relevant to mention unconventional reservoirs of low permeability, tight gas, or those with very low permeability, that is, shale gas. Shale is a fine-grained sedimentary rock typically composed of clay, silt, and organic matter. Unlike conventional reservoirs, shale gas reservoirs have low porosity and permeability, which makes commercial exploitation of the gas more difficult. For example, sandstone-type formations have low permeability.
Usually, to extract gas from shales, a process called hydraulic fracturing (fracking) is used. It involves injecting a mixture of water, sand, and chemicals into the formation to create fractures, which allow gas to flow more easily. This extraction method differs from traditional natural gas production methods, such as drilling a well and allowing the gas to flow to the surface, which may not be effective for shale-type gas reservoirs [3].

1.1. Brief Review: Shale and Tight Gas Reservoirs

In recent years, investigations into low and very-low permeability reservoirs containing natural gas have intensified. Among the topics explored, it is possible to highlight the studies: flow mechanisms in shale gas reservoirs [4,5]; correlations for absolute permeability as a function of pressure [6,7,8]; fractured horizontal wells in shale gas reservoirs [9]; about naturally fractured reservoirs [10]; two-phase flow including gas slippage and production through fractured horizontal wells [11,12,13]; and the effects of heterogeneity and non-Darcy in tight gas reservoirs [14].
Guria [15] addressed the effects of non-ideal gas behavior and slippage when measuring permeability in porous media. The author used cubic equations of state as the van der Waals, Soave-Redlich-Kwong, and Peng-Robinson to reproduce the non-ideal behavior of gases, including or not hydrocarbons. He also proposed a comprehensive mathematical model for evaluating the apparent permeability, dependent on pressure and temperature, in porous media when real gases flow.
Rubin et al. [16] performed experiments on shales of the Marcellus formation. They showed that the effects of gas slippage and matrix compaction are significant when evaluating gas production due to the substantial depletion of reservoir pressure, especially at the end of production. However, their impact on gas recovery quantification and hydraulic fracturing design has not yet been understood and systematically investigated. According to the authors, the results showed that ignoring both effects when simulating flow in the reservoir leads to an incorrect estimate of gas production.
In the work by Ding et al. [17], they carried out experiments to understand the nonlinear behavior of flow in tight gas reservoirs, including the effects of slippage and inertial/turbulent effects. The authors also attested that experimental methods applicable to conventional reservoirs lead to significant errors when applied to these unconventional reservoirs.
Friedel and Voigt [18] applied numerical reservoir simulation to study the inertial effect in a fractured reservoir. They conducted simulations considering a fully implicit formulation and investigated synthetic cases for gas production. The results indicated that non-Darcy flow influenced productivity, even for relatively low gas production rates. The authors also mention that they evaluated a scenario in which they verified a reduction between 21% and 40% in gas production.
In 2012, Clarkson et al. [19] discussed the rapid evolution of the technology used to evaluate the properties of unconventional gas reservoirs and hydraulic fracturing. The authors proposed a model for optimizing the development of unconventional gas reservoir fields, raising critical issues related to the analysis of reservoir samples, production data analysis, and transient flow responses. The authors aimed, for example, to review existing methods for reservoir evaluation and to introduce new methods for evaluating heterogeneities, focusing on tight and shale reservoirs and discussing the influence of non-Darcy inertial effects.
On the other hand, Ye et al. [20] considered non-Darcy inertial effects using Forchheimer’s model and unconventional coal-bed methane reservoirs. According to experimental results, the so-called non-Darcy flow factor, β , associated with the inertial effects, can be expressed as a power law dependent on absolute permeability. The authors point out that for certain conventional gas reservoirs, β can be considered constant, but this may not be suitable for coal-bed methane with a notable change in permeability. They also report that when the paper was published, few studies considered β as a function of coal permeability in reservoir simulations. The results of the simulations showed that considering a constant β factor can significantly underestimate or overestimate the gas production rate for coal-bed methane wells.
Other authors have also pointed to the possibility of errors in calculating the productivity of gas wells if the inertial effects are not considered, including cases with and without fractures and the use of horizontal wells. [21] dealt with this issue, proposing the concept of the apparent equivalent radius of the well to consider the non-Darcy inertial flow in a fracture. Firstly, the authors presented an iterative process to calculate the productivity of vertical fractured gas wells using the proposed concept, followed by an analysis of the productivity of horizontal multi-fractured gas-producing wells. The results showed that non-Darcy inertial effects can significantly decrease production even in low-permeability reservoirs (less than 1 mD) and reduce the potential interference between hydraulic fractures.
According to Farahani et al. [22], two main effects for accurately modeling the productivity of gas reservoirs are slippage and inertial flow in porous media. These effects lead to an introduction of an apparent permeability for the gas phase, different from the absolute permeability measured when we have a single liquid phase flow. Therefore, we must consider these elements when performing pressure tests to characterize gas reservoirs. The authors studied gas flow conditions in laboratory measurements using Iranian Kangan and Dalan carbonates, developing a correlation to estimate the inertia factor of the samples. In addition, they introduced an equation to estimate the maximum allowable pressure variation per length to maintain the laminar flow regime (Darcy flow) in the samples.
Furthermore, Fu et al. [12] proposed a new productivity model for multi-fractured horizontal wells and considered the beta inertial factor to incorporate the effects of high velocity. In addition, the authors considered the consequences of stress reduction (negative on effective permeability) and slip (positive on absolute permeability). The authors studied tight gas reservoirs, including the impacts of the presence of the water phase in the porous medium.
Assessing the economic viability of unconventional gas reservoirs has been challenging due to the inherent difficulties in accurately quantifying absolute permeabilities on the micro/nano-darcy scale [23]. It greatly influences the behavior of gas mass transport in porous media with low permeability. However, correctly measuring the permeability of porous media of this type is difficult. Gas flow differs from what occurs with liquids, for example, due to its high compressibility, the effect of slippage, and, sometimes, adsorption [24].
The study by Luo et al. [25] aimed to analyze temperature variation and quantitatively diagnose water production in multi-fractured horizontal wells for two-phase flows in tight gas reservoirs. The work led to a model for determining temperature considering effects such as, for example, Joule-Thomson and thermal expansion. They simulated synthetic cases to illustrate temperature behavior. The sensitivity analysis indicated that the gas phase slippage was responsible for reducing the well temperature. They also concluded that it was significantly impacted depending on the reservoir permeability values and the length of the fractures. Subsequently, they applied the proposed model to a field case, and the comparison showed a good agreement between the results.
Liu et al. [26] experimentally examined the effect of the pore-throat structure on the behavior of gas-water flow in a formation composed of low-permeability sandstone bearing natural gas. More specifically, they carried out mercury injection tests under controlled pressure to measure capillary pressure and identify the characteristics of a pore-throat structure and its connectivity and distribution of pore diameters. Subsequently, the specificities of the flow, including the variation in the saturation of the mobile fluid, the relative permeability, and the degree of water blockage, were quantified using displacement experiments and the nuclear magnetic resonance technique. The pore-throat structure, especially its connectivity, was estimated to be the dominant factor in the distribution of mobile fluid saturation and the infiltration characteristics of the two phases in a tight gas reservoir composed of sandstone. This study allowed us to understand how the structure of the pore throat influences the behavior of gas-water flow in a low-permeability gas reservoir, emphasizing the importance of identifying and classifying flow patterns.
The gas reservoir in the Kelasu field, in the Tarim basin (China), is of the tight gas type, ultra-deep, with existing fractures at various scales within the matrix, including faults. The flow inside it was studied by Sun et al. [27] via numerical simulations of the pressure test type in vertical wells, considering the porous matrix, fractures, and faults, combining the random generation of natural fracture networks with the use of discrete unstructured fractures. The numerical methodology used the mixed finite element method, and they obtained typical curves using different random fracture networks. Based on the observed results, they classified the distribution of the fracture network of fractured low-permeability sandstone reservoirs. Furthermore, they also discussed the influence of the random generation of fracture networks on well tests.

1.2. Carbon Sequestration

Therefore, as we can see, tight gas and shale gas reservoirs have become increasingly important within unconventional reserves. Among the applications involving them, we can cite carbon dioxide injection into the reservoir, aiming at carbon sequestration and natural gas recovery [28]. For example, due to the competitive adsorption between carbon dioxide and methane, the capture and carbon storage in tight and shale gas reservoirs also constitutes an opportunity to improve gas recovery. Furthermore, we already use the injection of CO2 in oil recovery.
To address the impacts of greenhouse gas emissions into the atmosphere, one of the strategies to mitigate the problem of carbon dioxide release is its capture and sequestration in underground rock formations, which can have other purposes besides storage [29]. One example would be the consideration of low-permeability reservoirs, as the controlled injection of CO2 into these formations improves natural gas recovery and proves to be an efficient solution for storing carbon dioxide [30].
According to Liu et al. [31], CO2 storage to enhance natural gas recovery (CO2 Storage with Enhanced Gas Recovery, CSEGR) is a promising option. It can reduce the concentration of carbon dioxide in the environment by sequestering it in gas reservoirs and simultaneously increase the production of natural gas, which can be used, for example, in sustainable hydrogen production through methane reforming [32].
Aminu and Manovic [33] expect that carbon capture and storage will have a role in reducing greenhouse gas emission. For example, in the southern North Sea, the Bunter sandstone formation has been identified as a potential reservoir that can store significant amounts of carbon dioxide. The formation has favorable rock and geometry properties, making CO2 storage feasible on an industrial scale. However, they noted that captured CO2 typically contains impurities, which can alter the boundaries of the carbon dioxide phase diagram, resulting in higher costs for storage operations. The authors also modeled the effect of CO2 and impurities (NO2, SO2, and H2S) on reservoir production performance.
From the point of view of the presence of heterogeneities, Wang et al. [34] report that natural or induced fractures are typically present in sub-surface geological formations. They, therefore, need to be studied for a reliable estimate of long-term carbon dioxide storage. Fractures can undermine storage security as they increase the risk of carbon dioxide escaping. In addition, fractures can act as flow barriers, causing significant pressure gradients in relatively small regions near fractures. However, despite their high sensitivities, the impact of fractures on the complete storage process is still not understood. In the cited study, the authors developed and applied a numerical model to analyze the role of discrete fractures in the flow mechanism and transport of CO2 plumes in simple and complex fracture geometries. The results indicate that the fracture has effects that depend on the different trapping mechanisms.
Therefore, carbon capture and storage can contribute to climate change mitigation if implemented on a large scale. Achieving high injection rates in deep saline aquifers, for example, requires a detailed assessment of injectivity performance and an evaluation of the processes that alter rock properties in the region of nearby wells, as discussed by Parvin et al. [35]. One of the most common forms of injectivity loss in the context of carbon dioxide storage in saline aquifers is salt precipitation driven by brine evaporation into the relatively dry flow of injected CO2, according to the authors.

2. Non-Darcy Flow

For flows inside a porous medium corresponding to high Reynolds numbers, the relationship between the flow rate and the pressure gradient [36] is no longer linear. The nonlinearity, in this case, comes from inertial effects. Although it may originate from other causes, in petroleum engineering it is essentially related to flow values. According to Amao [37], different behavior from that predicted by Darcy’s law due to inertial effects appears mainly in the following cases: near the wellbore; hydraulically fractured wells; gas reservoirs; condensate reservoirs; high flow potential wells; naturally fractured reservoirs; and gravel packs. Therefore, in these cases it would be recommended that specific flow models be used, taking into account inertial effects.
Barree and Conway [38] proposed a model, which introduces the notion of apparent permeability, as a way of including inertial effects [39,40],
v = k a p p μ p ρ g z ,
where v is the apparent velocity, μ is the fluid viscosity, p is the pressure, ρ is the density, g is the magnitude of the acceleration due to gravity, z is the depth, and the apparent permeability tensor is given by
k a p p = k m i n + k k m i n 1 + ρ | v | μ τ c F E ,
and k m i n is a minimum permeability value at high flow rates, k is the permeability tensor, F and E are dimensionless constants and τ c is the inverse of characteristic length. It is an advantageous alternative to the Forchheimer model [36].
Usually we take F = E = 1 and introduce k m r = k m i n k 1 [38], to obtain the form used here
k a p p = k B C k = k m r + I k m r 1 + R e k ,
where
R e = ρ | v | μ τ c
is the Reynolds number, and I is the identity tensor.
As already mentioned, this model has some advantages, such as providing a limit value for apparent permeability at high flows [39]. Furthermore, it would allow a better representation of transitions between flow regimes in the porous medium, according to Lai et al. [39].
In this work, we also consider a simplified model to account for the effects of effective stress on permeability variation [41]
k = exp [ γ ( p 0 p ) ] k 0 ,
where γ is the permeability modulus, and p 0 and k 0 are the initial pressure and absolute permeability tensor.
Furthermore, we know that the slippage effects can be introduced in terms of the Knudsen number [42,43]. Therefore, the combined effects of gas slippage and effective stress on permeability variation are determined in the form
k = exp [ γ ( p 0 p ) ] 1 + 4 K ¯ n 1 + K ¯ n k 0 ,
where K ¯ n is the Knudsen number of the mixture and, according to Wang et al. [44], for a two-component flow
K ¯ n = 1 r h x 1 λ 1 + x 2 λ 2 ,
where r h is the hydraulic radius and, for each component, λ 1 and λ 2 are the mean free path of gas molecules [45], and x 1 (CO2) and x 2 (CH4) represent the molar fraction, respectively.

3. Two-Component Flow

In this article, we are interested in simulating the enhanced recovery process when injecting carbon dioxide into a naturally fractured tight gas reservoir (in general, with matrix permeability less than 0.1 mD and porosity less than 10%) containing methane. When developing our numerical code, we considered the following hypotheses: three-dimensional one-phase isothermal flow; newtonian fluids; compressible fluids; small compressibility rock [40]; no adsorption effects; no chemical reactions; and fractured media modeled using Discrete Fracture Networks (DFN) [46].
The governing equations for two-component single-phase flow can be obtained from the continuity equation [47] and modified Darcy’s law (1) [39,40], since we assume that the flow is isothermal. Therefore, after combining these two equations we obtain [48,49]
t ϕ ξ = · ξ μ k a p p p ρ g z + q ,
where ϕ represents the porosity, ξ is the molar density, given by the real gas law
ξ = p R T Z ,
q is a source term, R is the universal gas constant, T the temperature and Z is the compressibility factor.
On the other hand, when it comes to molar fractions, the governing equation is given by [48,49],
t ϕ x m ξ = · x m ξ μ k a p p p ρ g z + ϕ ξ D x m + q m
where m = 1 , 2 , , N c , x m is the molar fraction, q m is a source term, N c is the number of components and D is the effective dispersion tensor, which can be introduced as [49,50]:
D v = τ D m I + D v I + D D v v v ,
where τ is the tortuosity, D m is the molecular diffusion coefficient, D and D are the transversal and longitudinal hydrodynamic dispersion tensor coefficients, and v is given by Equation (1). In our simulations we will consider that [50]
D l = ζ log 10 L c η ,
D t = 0.1 D l ,
where ζ and η are parameters that must be provided, and L c represents a characteristic length.
The dependent variables, the pressure and mole fraction of one of two components, are obtained by solving the partial differential Equations (8) and (10) numerically.
The Peng-Robison cubic equation of state is employed to calculate the compressibility factor Z [49,50]. For this purpose, we start from its original form
p = R T v b a v 2 + 2 b v b 2
where v is the molar volume and for each component
a m = 0.45724 R 2 T c m 2 p c m 1 + κ m 1 T T c m 1 / 2 2 ,
b m = 0.07780 R T c m p c m ,
κ m = 0.37464 + 1.54226 ω m 0.26992 ω m 2 ,
where ω m is the acentric factor of component, and p c m and T c m are the respective critical pressure and temperature.
For a mixture of N c components [51]
a = m = 1 N c n = 1 N c x m x n ( 1 k m n ) a m a n
b = m = 1 N c x m b m
where k m n is a binary interaction parameter, considered to be null in our simulations.
Thus, once known the values of the universal gas constant (R), pressure (p) and temperature (T), we can determine the compressibility factor (Z) from the Peng-Robison equation (14) rewritten as
Z 3 1 B Z 2 + A 2 B 3 B 2 Z A B B 2 B 3 = 0 ,
where
A = a p R 2 T 2 , B = b p R T
where a and b are calculated using Equations (18) and (19).
Finally, the molar density value can be calculated using Equation (9) and the viscosity using the correlation proposed by Lohrenz et al. [52].

4. Finite Volume Formulation

We used the Finite Volume Method (FVM) [53] in the numerical resolution of the governing equations, since their respective theoretical solutions are not known.
As is usual in the case of this method, a finite number of control volumes are superimposed on the domain and the governing equations are discretized by integrating them in time (from t n to t n + 1 ) and space, over a finite volume [53].
To obtain the discrete equations, we use time-implicit formulations, approximations such as three points centered differences for the spatial derivatives, with the exception of advective terms, which are approximated through a first-order upwind type scheme [49].
Furthermore, we employ a structured three-dimensional mesh when partitioning the domain and the planar fractures are discretized and inserted into it.
By way of illustration, Figure 1 contains the representation of a three-dimensional structured mesh, where the nodes are positioned in the centers of finite volumes and we highlight the one belonging to the central finite volume as well as those of its six neighbors.
We also adopted the established nomenclature, in which the integer subscripts i, j and k represent the indices of the center of one of the cells (or finite volumes), according to their position along the directions of the x-, y- and z-axes respectively. Besides that, the subscripts i ± 1 / 2 , j ± 1 / 2 , and k ± 1 / 2 indicate the faces of the finite volumes in the direction of the Cartesian x-, y- and z-axes.
The steps relating to the integration of the governing equations will be omitted, since the usual procedures inherent to the method were employed. More details can be found in the book authored by Versteeg and Malalasekera [53]. Therefore, considering that the apparent permeability ( k a p p ) and effective dispersion ( D ) tensors are diagonal [47], the discrete final form of Equation (8) is [48,49]
T x , i + 1 / 2 , j , k n + 1 p i + 1 , j , k n + 1 p i , j , k n + 1 T x , i 1 / 2 , j , k n + 1 p i , j , k n + 1 p i 1 , j , k n + 1 + T y , i , j + 1 / 2 , k n + 1 p i , j + 1 , k n + 1 p i , j , k n + 1 T y , i , j 1 / 2 , k n + 1 p i , j , k n + 1 p i , j 1 , k n + 1 + T z , i , j , k + 1 / 2 n + 1 p i , j , k + 1 n + 1 p i , j , k n + 1 T z , i , j , k 1 / 2 n + 1 p i , j , k n + 1 p i , j , k 1 n + 1 ρ g T x , i + 1 / 2 , j , k n + 1 z i + 1 , j , k z i , j , k + ρ g T x , i 1 / 2 , j , k n + 1 z i , j , k z i 1 , j , k ρ g T y , i , j + 1 / 2 , k n + 1 z i , j + 1 , k z i , j , k + ρ g T y , i , j 1 / 2 , k n + 1 z i , j , k z i , j 1 , k ρ g T z , i , j , k + 1 / 2 n + 1 z i , j , k + 1 z i , j , k + ρ g T z , i , j , k 1 / 2 n + 1 z i , j , k z i , j , k 1 + Q i , j , k n + 1 = V b c p n + 1 p n + 1 p n Δ t i , j , k ,
where p n + 1 must be calculated numerically, knowing that
c ( p n + 1 ) = ϕ n ξ p + ξ n + 1 ϕ 0 c ϕ ,
ξ p = 1 R T Z p R T Z 2 Z p ,
where Equation (23) was obtained from a conservative expansion [54], the last partial derivative is calculated from Equation (20), and we consider a constant rock compressibility.
On the other hand, to determine the molar fraction, from Equation (10) we obtain
D x , i + 1 / 2 , j , k n + 1 x m , i + 1 , j , k n + 1 x m , i , j , k n + 1 D x , i 1 / 2 , j , k n + 1 x m , i , j , k n + 1 x m , i 1 , j , k n + 1 + D y , i , j + 1 / 2 , k n + 1 x m , i , j + 1 , k n + 1 x m , i , j , k n + 1 D y , i , j 1 / 2 , k n + 1 x m , i , j , k n + 1 x m , i , j 1 , k n + 1 + D z , i , j , k + 1 / 2 n + 1 x m , i , j , k + 1 n + 1 x m , i , j , k n + 1 D z , i , j , k 1 / 2 n + 1 x m , i , j , k n + 1 x m , i , j , k 1 n + 1 + T m x , i + 1 / 2 , j , k n + 1 p i + 1 , j , k n + 1 p i , j , k n + 1 T m x , i 1 / 2 , j , k n + 1 p i , j , k n + 1 p i 1 , j , k n + 1 + T m y , i , j + 1 / 2 , k n + 1 p i , j + 1 , k n + 1 p i , j , k n + 1 T m y , i , j 1 / 2 , k n + 1 p i , j , k n + 1 p i , j 1 , k n + 1 + T m z , i , j , k + 1 / 2 n + 1 p i , j , k + 1 n + 1 p i , j , k n + 1 T m z , i , j 1 / 2 , k n + 1 p i , j , k n + 1 p i , j , k 1 n + 1 ρ g T m x , i + 1 / 2 , j , k n + 1 z i + 1 , j , k z i , j , k + ρ g T m x , i 1 / 2 , j , k n + 1 z i , j , k z i 1 , j , k ρ g T m y , i , j + 1 / 2 , k n + 1 z i , j + 1 , k z i , j , k + ρ g T m y , i , j 1 / 2 , k n + 1 z i , j , k z i , j 1 , k ρ g T m z , i , j , k + 1 / 2 n + 1 z i , j , k + 1 z i , j , k + ρ g T m z , i , j , k 1 / 2 n + 1 z i , j , k z i , j , k 1 + Q m , i , j , k n + 1 = V b ϕ x m ξ n + 1 ϕ x m ξ n Δ t i , j , k ,
where m = 1 , 2 , , N c 1 , . The new molar fraction x m n + 1 must be determined. Here, Q m , i , j , k = V b i , j , k q m , i , j , k , Q i , j , k = V b i , j , k q i , j , k , V b i , j , k = Δ x Δ y Δ z i , j , k , where Δ x i , j , k , Δ y i , j , k and Δ z i , j , k are the grid sizes in the x-, y- and z-directions.
In these equations, we define the transmissibilities T by
T x , i ± 1 2 , j , k n + 1 ξ k a p p x x A x μ Δ x i ± 1 2 , j , k n + 1 ,
T y , i , j ± 1 2 , k n + 1 ξ k a p p y y A y μ Δ y i , j ± 1 2 , k n + 1 ,
T z , i , j , k ± 1 2 n + 1 ξ k a p p z z A z μ Δ z i , j , k ± 1 2 n + 1 ,
and T m = x m T .
We also introduce the discrete dispersion coefficients D as
D x , i ± 1 / 2 , j , k A x ϕ ξ D x x Δ x i ± 1 / 2 , j , k ,
D y , i , j ± 1 / 2 , k A y ϕ ξ D y y Δ y i , j ± 1 / 2 , k ,
D z , i , j , k ± 1 / 2 A z ϕ ξ D z z Δ z i , j , k ± 1 / 2 ,
for the three spatial directions, respectively.

4.1. Auxiliary Conditions

In terms of boundary conditions, the reservoir is sealed (zero flow across its boundaries) and gas is injected, at a prescribed flow rate ( Q s c ), in the lower left corner and produced in the upper right at the same flow rate ( Q s c ).
The reference pressure ( p 0 ) and reference temperature ( T 0 ) values are provided at the initial time and the reservoir contains only methane gas at the beginning of the simulations.

4.2. Mesh Refinement

When simulating discrete fractures, depending on their dimensions and properties, we must prevent the appearance of discontinuities through the use of mesh refinement, introducing a transition region in their neighborhood [40,55]. For this purpose, the spatial dimensions of the cells neighboring the fractures will vary according to a logarithmic function and they will increase in size as they distance themselves from the fractures [49].

4.3. Solving Systems of Algebraic Equations

Because the discretized governing equations are nonlinear, we cannot directly employ algebraic methods formulated specifically for solving systems of linear algebraic equations. For us to use them, we must first linearize these equations. As a result, we will have a coupled system of equations for determining pressure and mole fraction. Aiming to decouple them [49], we employ an operator-splitting method [56].
Once the system of equations was decoupled, we chose two well-known and efficient methods to obtain their numerical solutions. As the coefficient matrix is symmetric in the case of the algebraic system whose dependent variable is pressure, we decided to use the Conjugate Gradient Method (CG) [57]. As this is not the case when determining the mole fraction, we chose to use the Biconjugate Gradient Stabilized Method (BiCGSTAB) [57].

4.4. Numerical Validation

Concluding this section, we must highlight that the numerical results obtained with this simulator were previously quantitatively validated in the case of flow in a square domain containing two orthogonal fractures that intersect each other, in the region to the right of the reservoir, forming an inverted “L”. In this test case, we considered the tracer transport in a single-phase flow of an incompressible fluid in a two-dimensional domain in the presence of these two fractures. Additional information about the domain geometry, dimension and positioning of fractures, in addition to physical properties, can be found in Debossam et al. [49].

5. Results and Discussion

The main objective of this work is to quantify the influence of inertial, gas slippage and effective stress effects on production in naturally fractured tight gas reservoirs. In advanced gas recovery techniques, we know that a fluid can be injected into the reservoir to extract a greater amount of gas. As the environmental issue is currently of great importance, we decided to inject carbon dioxide (CO2) into a reservoir containing methane (CH4). Therefore, in addition to increasing the volume of gas produced, we can use the reservoir to store this fluid, which is harmful to the environment.
As we are considering two-component single-phase flow in a naturally fractured reservoir, we need a model to represent the fracture network within the porous medium. Among the existing possibilities, for structured meshes, we opted for the arrangement known as Sugar Cube [58]. It is based on Barenblatt et al. [59]’s double porosity model, which predicts a system of fractures with high permeability, a porous matrix with low permeability and the existence of flow from the porous matrix to the fractures.
As previously stated, fractures are represented using the Discrete Fracture Networks (DFN) [46] technique. In it, fractures are inserted into the computational mesh and represented by a set of finite volumes. They are differentiated from the porous matrix, in addition to their dimensions, by their different physical properties, that is, porosity and absolute permeability. Furthermore, due to the discrepancy between the thickness of the fracture and the dimensions of the finite volumes, a mesh refinement is introduced in the regions around the fractures [40].
With regard to the dimensions of the reservoir, as well as other properties and parameters common to all simulations, they are presented in Table 1. We remind that the subscripts r refer to the porous matrix while f refers to the fractures.
Next, the specific properties of the injected and resident fluids, respectively carbon dioxide and methane, can be seen in Table 2.
Finally, we present in Table 3 the length of the fractures ( L f ), their thickness (w), permeability ( k f ) and porosity ( ϕ f ). In the Sugar Cube configuration, the fractures are positioned in the vertical and horizontal directions, equidistant and orthogonal to each other, and have the same length and thickness. In each x y -plane, we positioned nine fractures, parallel and equidistant from each other, along the longitudinal and transverse directions.

5.1. Mesh Refinement

From the results of previous simulations for a mesh refinement study [49], we found that numerical convergence is achieved and numerical diffusion is minimized to acceptable levels when we employ a mesh containing 320 × 320 ×3 finite volumes. Therefore, all simulations are performed considering this mesh.

5.2. Numerical Results

In this work, we chose to use a sealed reservoir and flow rate conditions imposed for the gases that are being injected and produced. Therefore, production curves will not be presented, but rather the advance front of CO2 inside the reservoir, in pre-established plans. As a result of the flow rate being constant, the inertial effects, gas slippage and effective stress will be felt in the variation of the molar fraction field inside the reservoir. Subsequently, in a future work, we intend to introduce a well-reservoir coupling model [60] and work with the pressure prescribed in the producing well.
As mentioned, our interest is to study the influence of inertial effects, gas slippage, and effective stress on the displacement of the advance front of the gas injected into the reservoir. We did this by monitoring the variation in the molar fraction of CO2 inside the reservoir. Comparisons are made based on results obtained considering classical Darcy’s law without incorporating the mentioned effects.
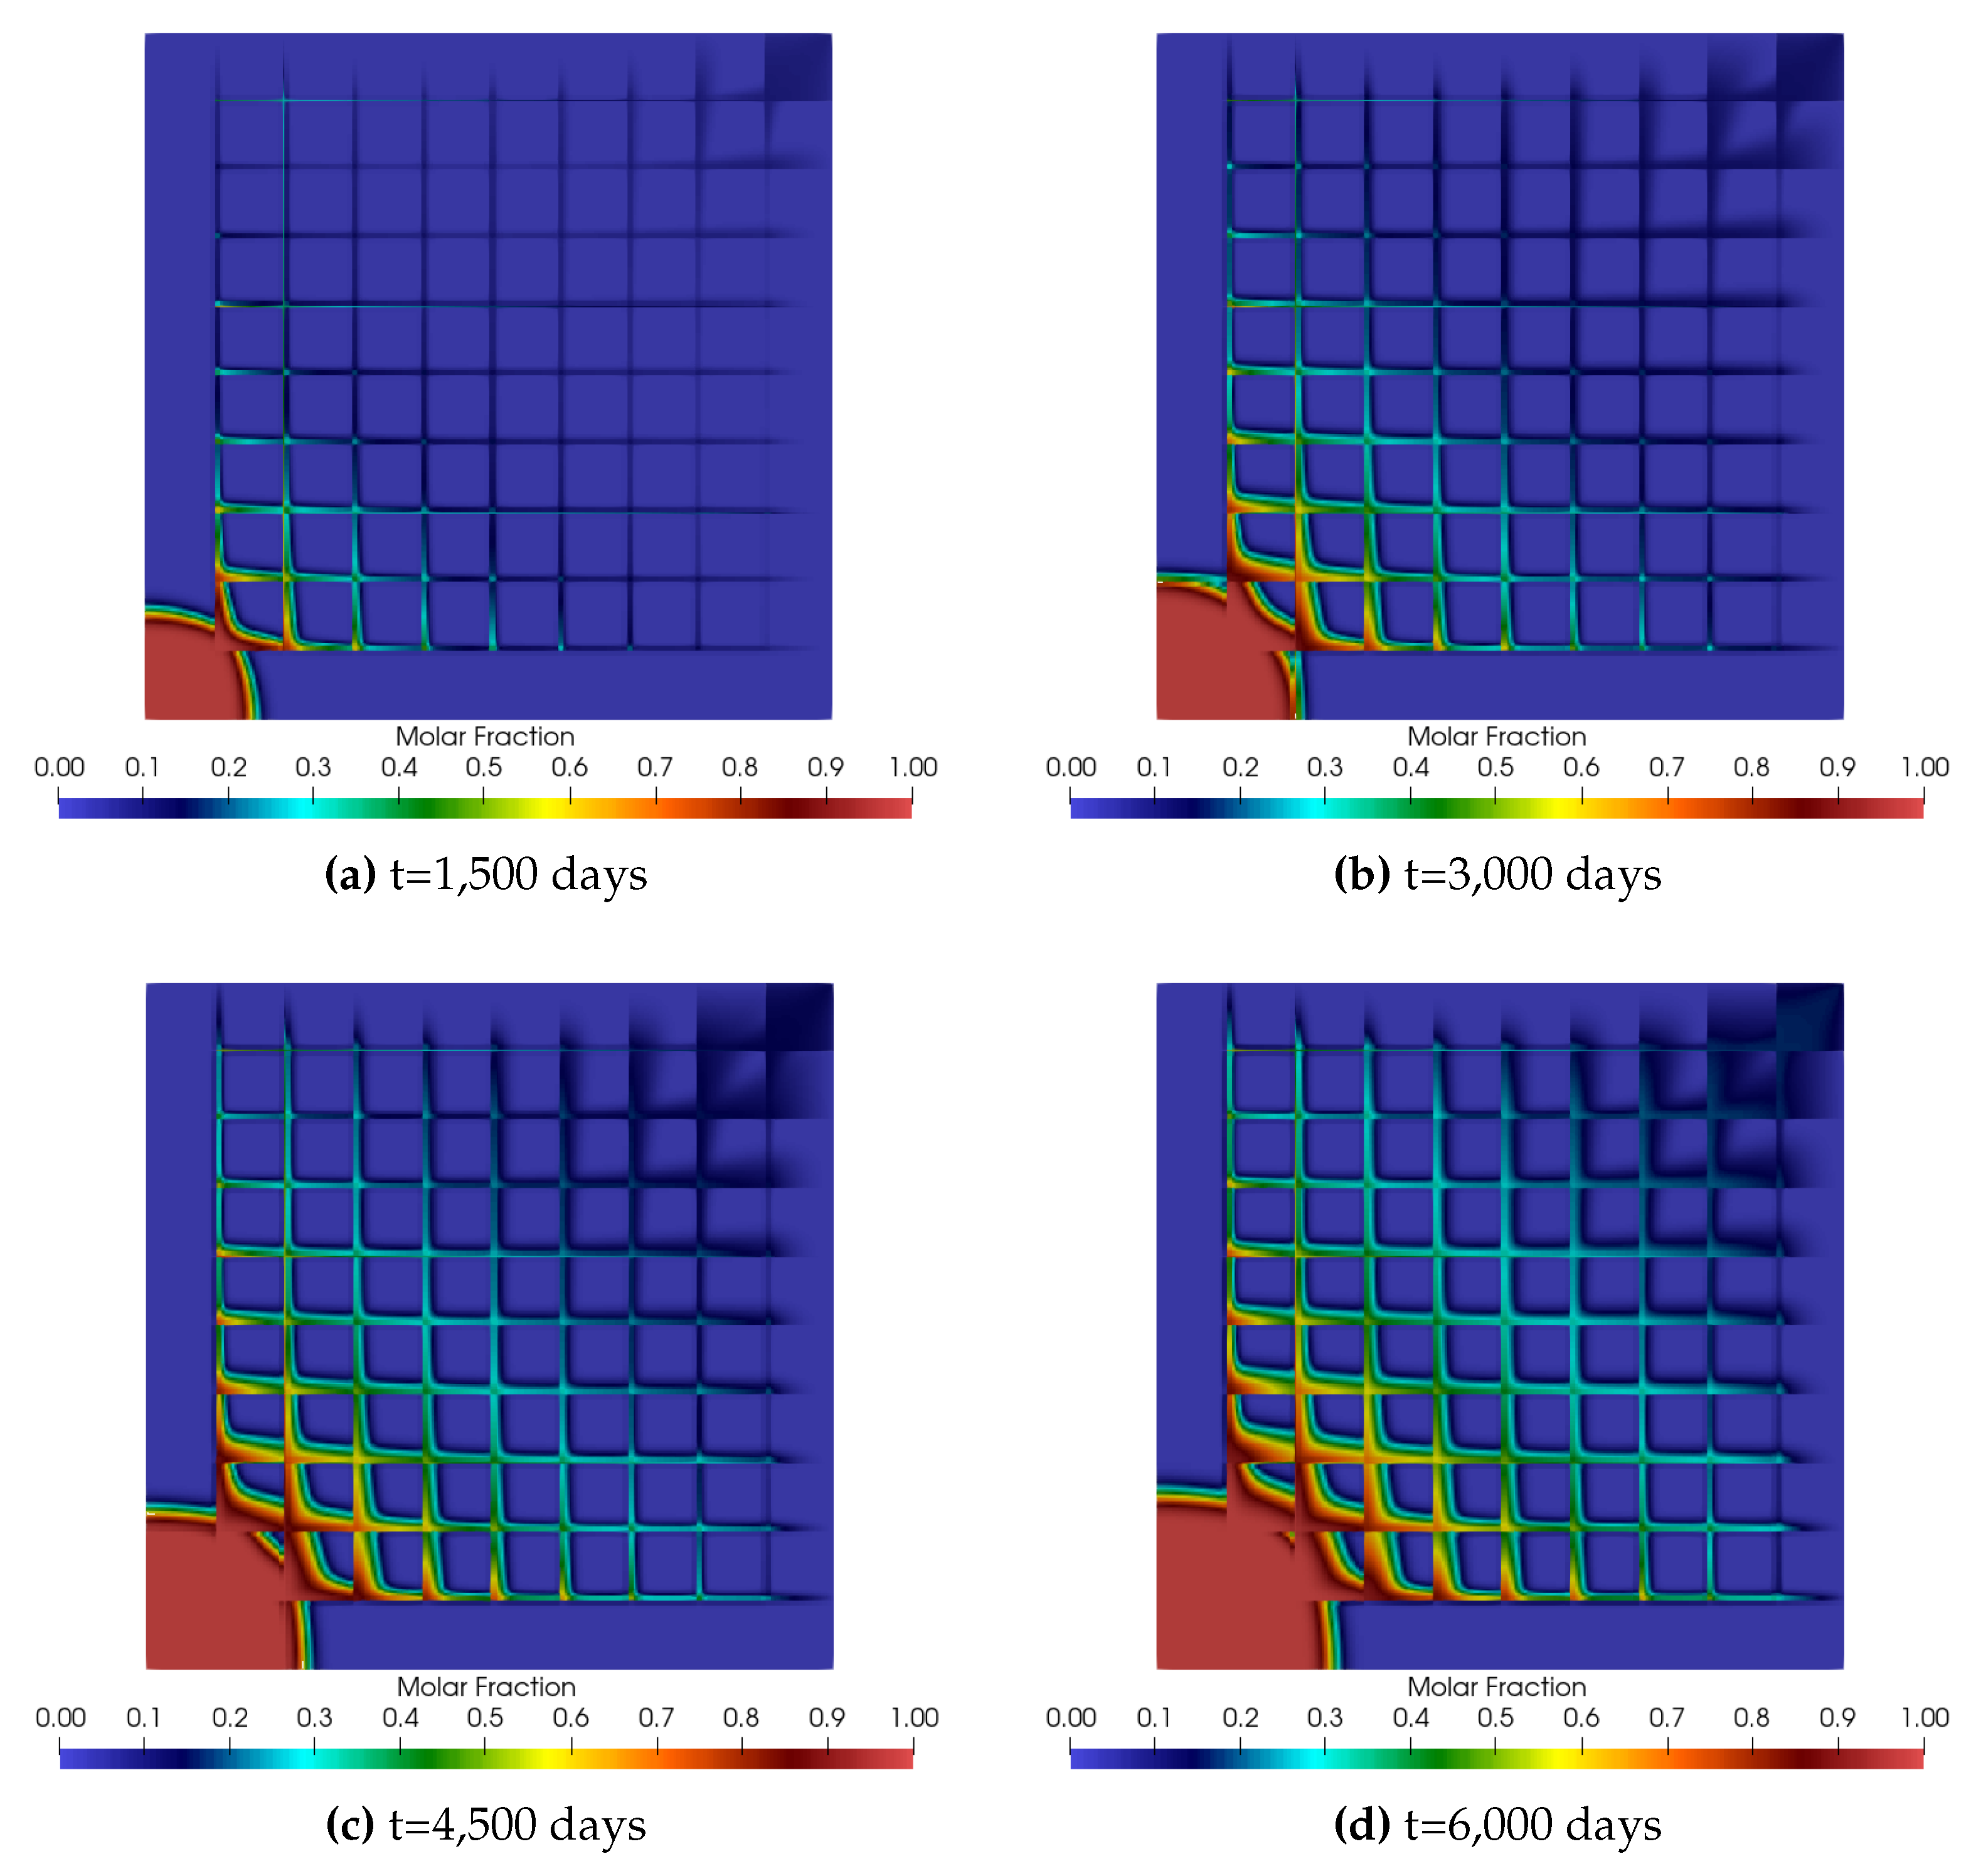
For all simulations, the maximum production time is equal to 6,000 days, and we presented the molar fraction values in the x y -plane for a value of z corresponding to half of L z and for four different selected time instants.
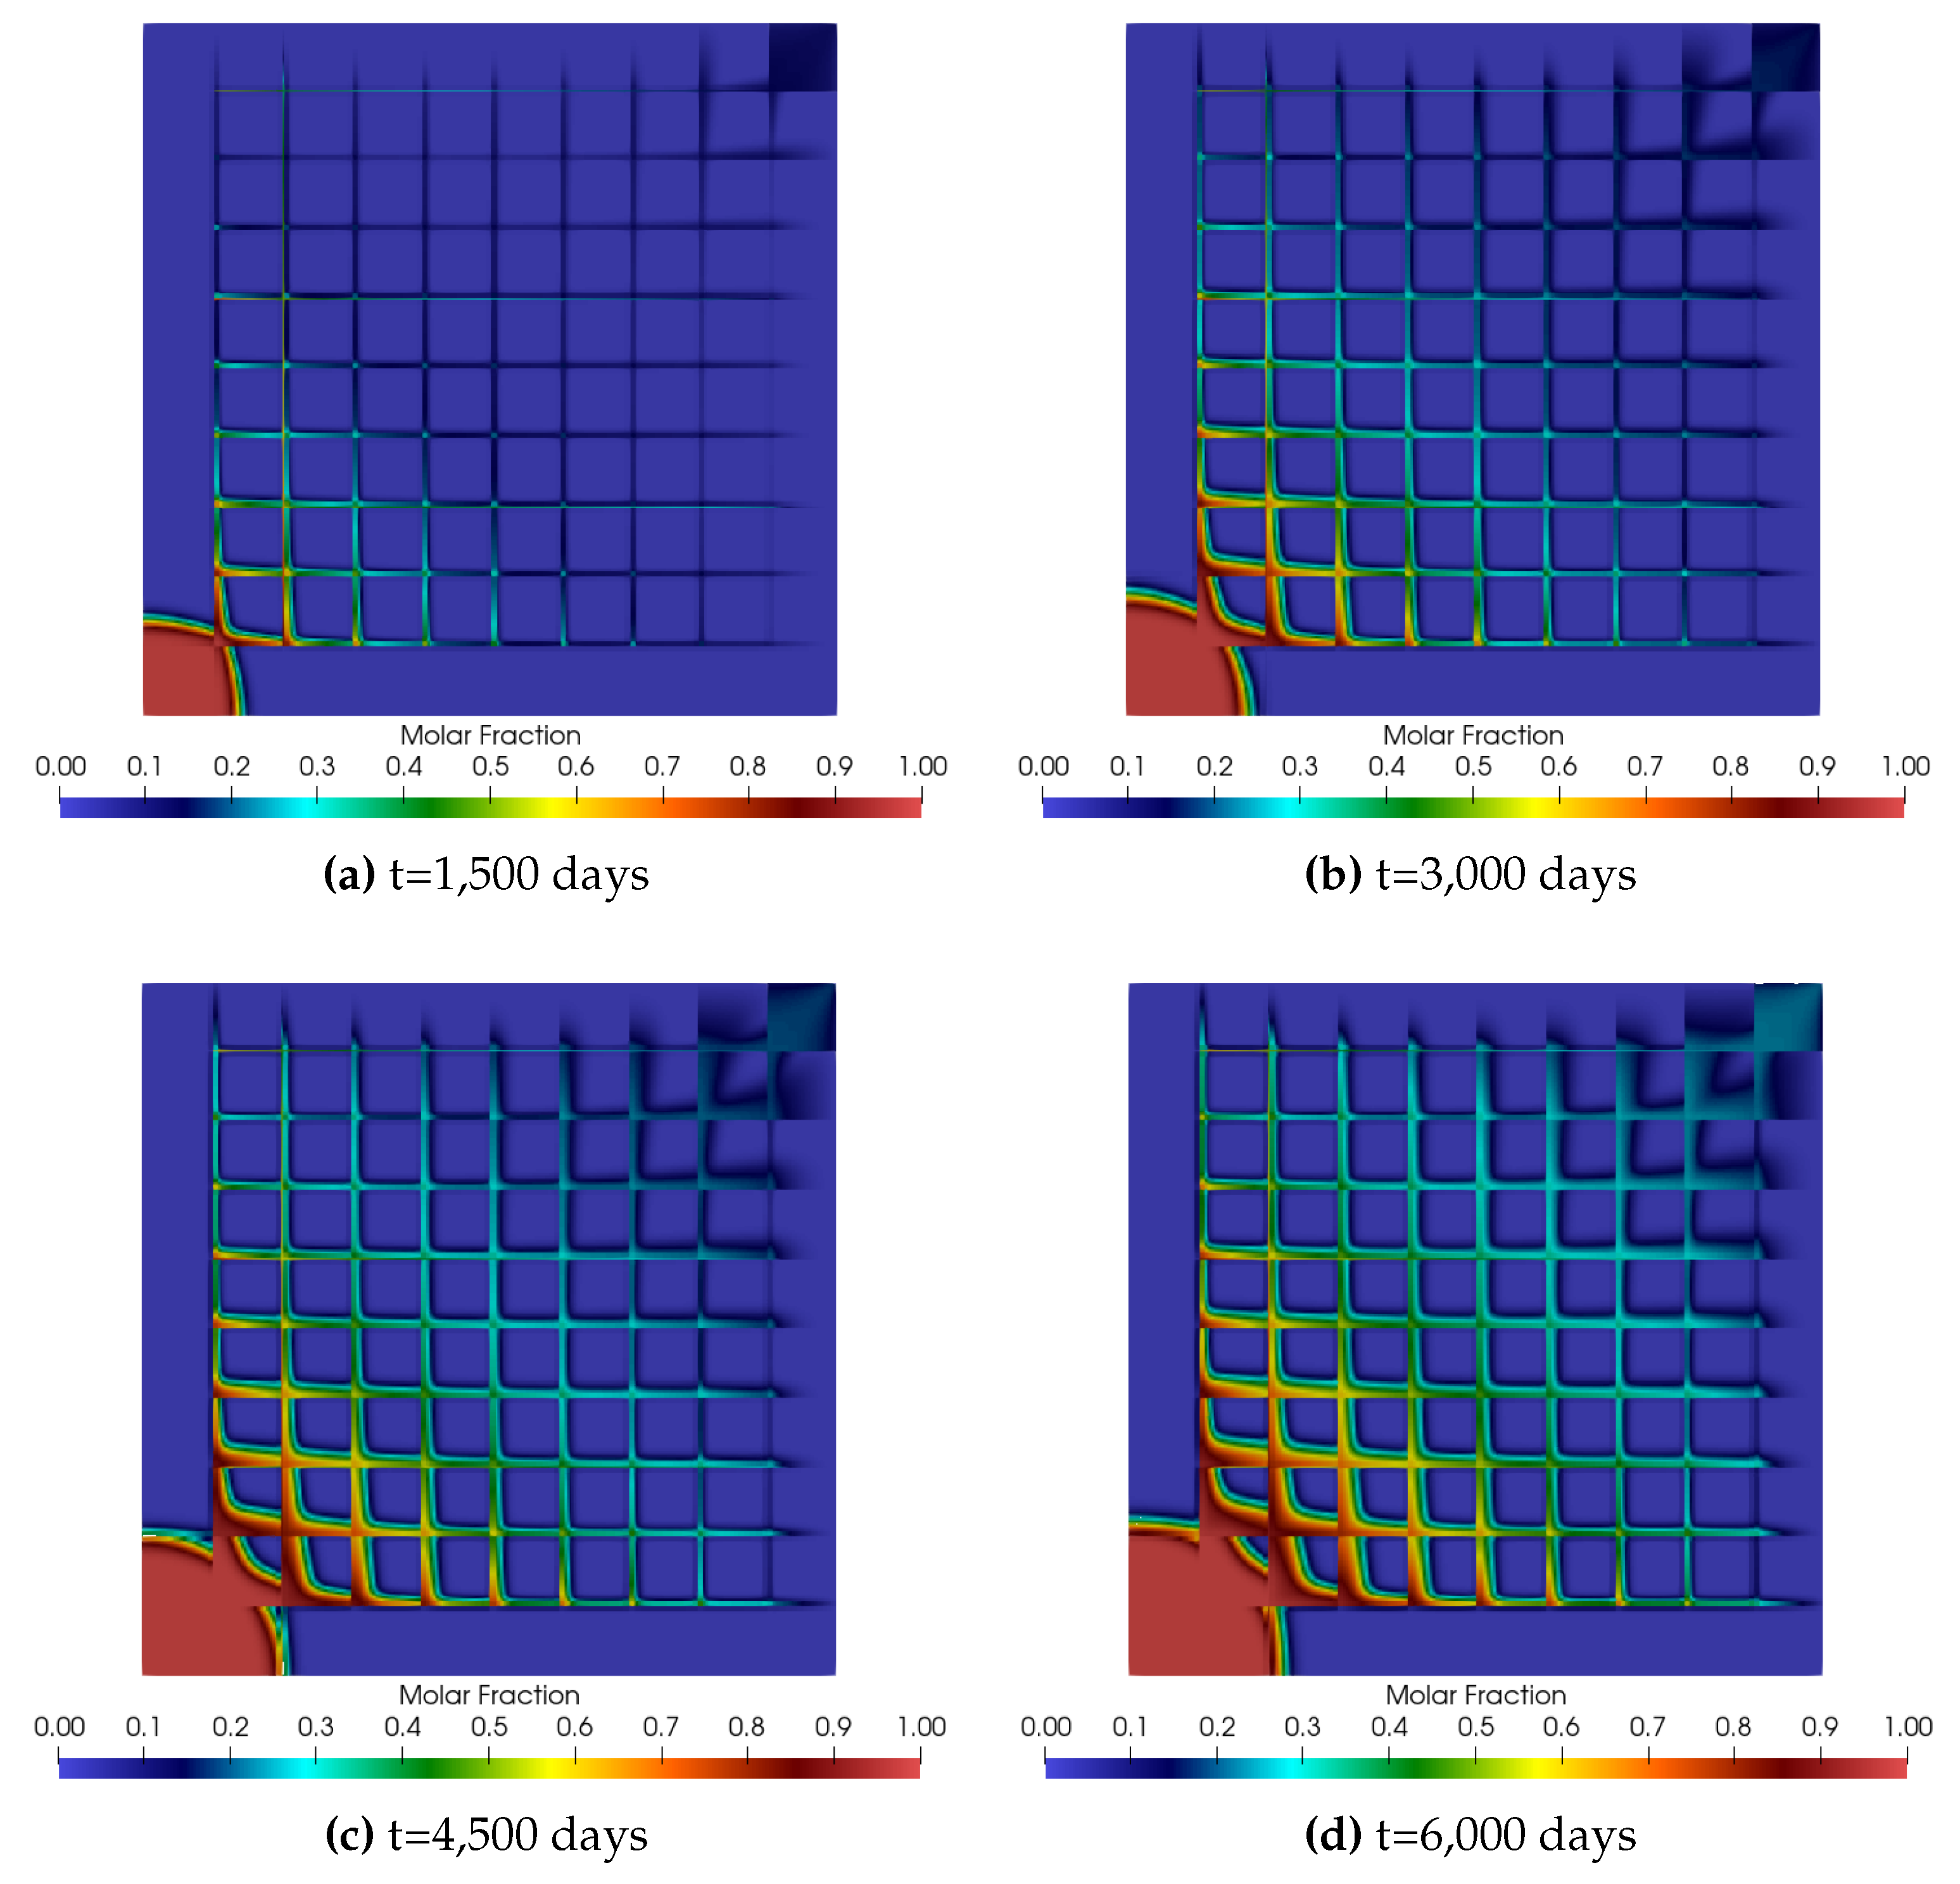
Therefore, let’s start with the advance of carbon dioxide in the case of flow governed by classical Darcy’s law, see Figure 2. These are the reference results against which we will analyze the impacts caused by including the effects already referenced.
When we observe the distribution of the molar fraction, we can see that when we attained the maximum time, a portion of the CO2, thanks to the presence of fractures, has already reached the production region, with its values being approximately equal to 0.2.
In the injection region, we found that the first square region delimited by the crossing of the fractures has not yet been filled by the injected gas, and the maximum molar fraction value is higher than 0.8.
Next, we move on to the case of Darcy’s law, modified to account for inertial effects. With the introduction of apparent permeability, in the model proposed by [38] its values are limited between k (for Reynolds number approaching zero) and k a = k m r k in the limit of R e tending to infinity, with k m r less than the unit. In short, in regions where the flow has higher Reynolds number values, the tendency is to have apparent permeability values lower than those considered in classical Darcy’s law.
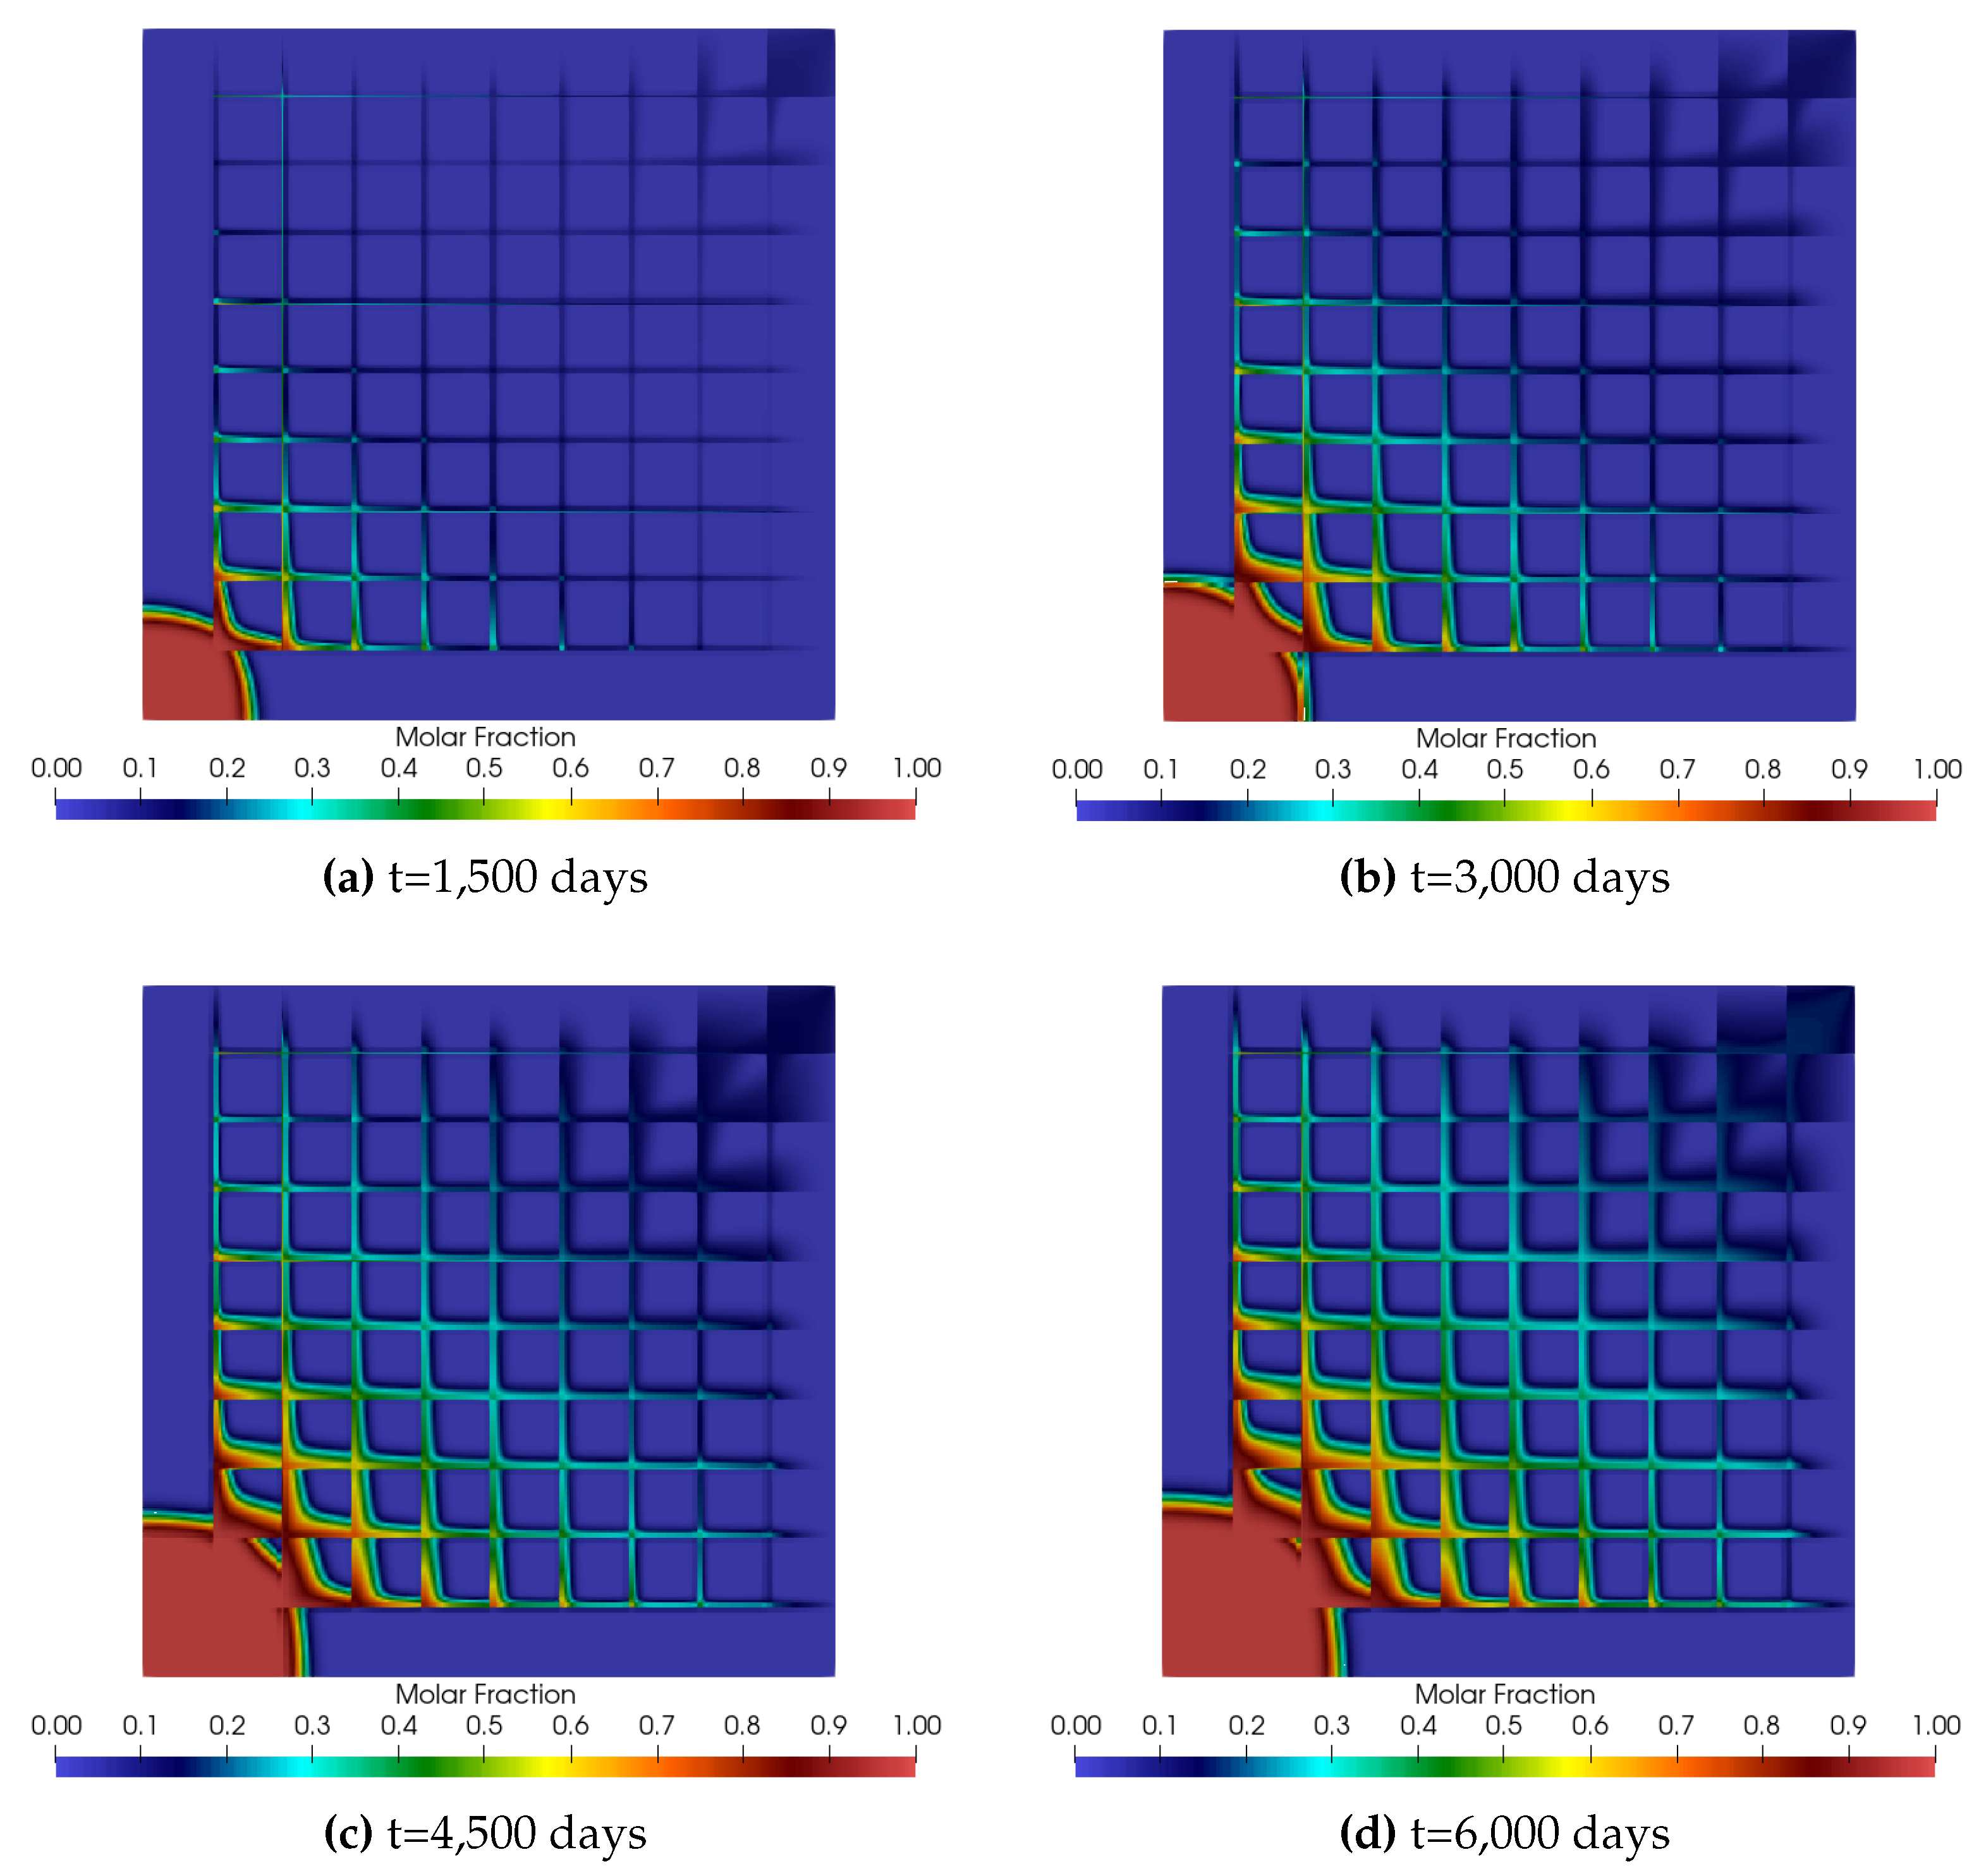
We can see this trend in the fields presented in Figure 3. As the apparent permeability tends to be lower in fractures, the gas that advances closer to the injection will take longer to reach the production region. We also verify that the mole fraction is less than 0.2, contrary to the case in the previous example. So, we can say that inertial effects are slowing down the displacement of the injected gas.
Continuing, we focus on the effects arising from the stress field. In it, we know that permeability values can change depending on pressure variations. Its variation will grow exponentially and will be higher when the reservoir pressure is higher than the initial one.
In regions of the reservoir not yet disturbed by gas injection, the permeability value will tend to be equal to that of Darcy’s classical law. On the other hand, in those where the pressure is higher than the initial, we will have a higher value. We must remember that this effect is not taken into account in fractures.
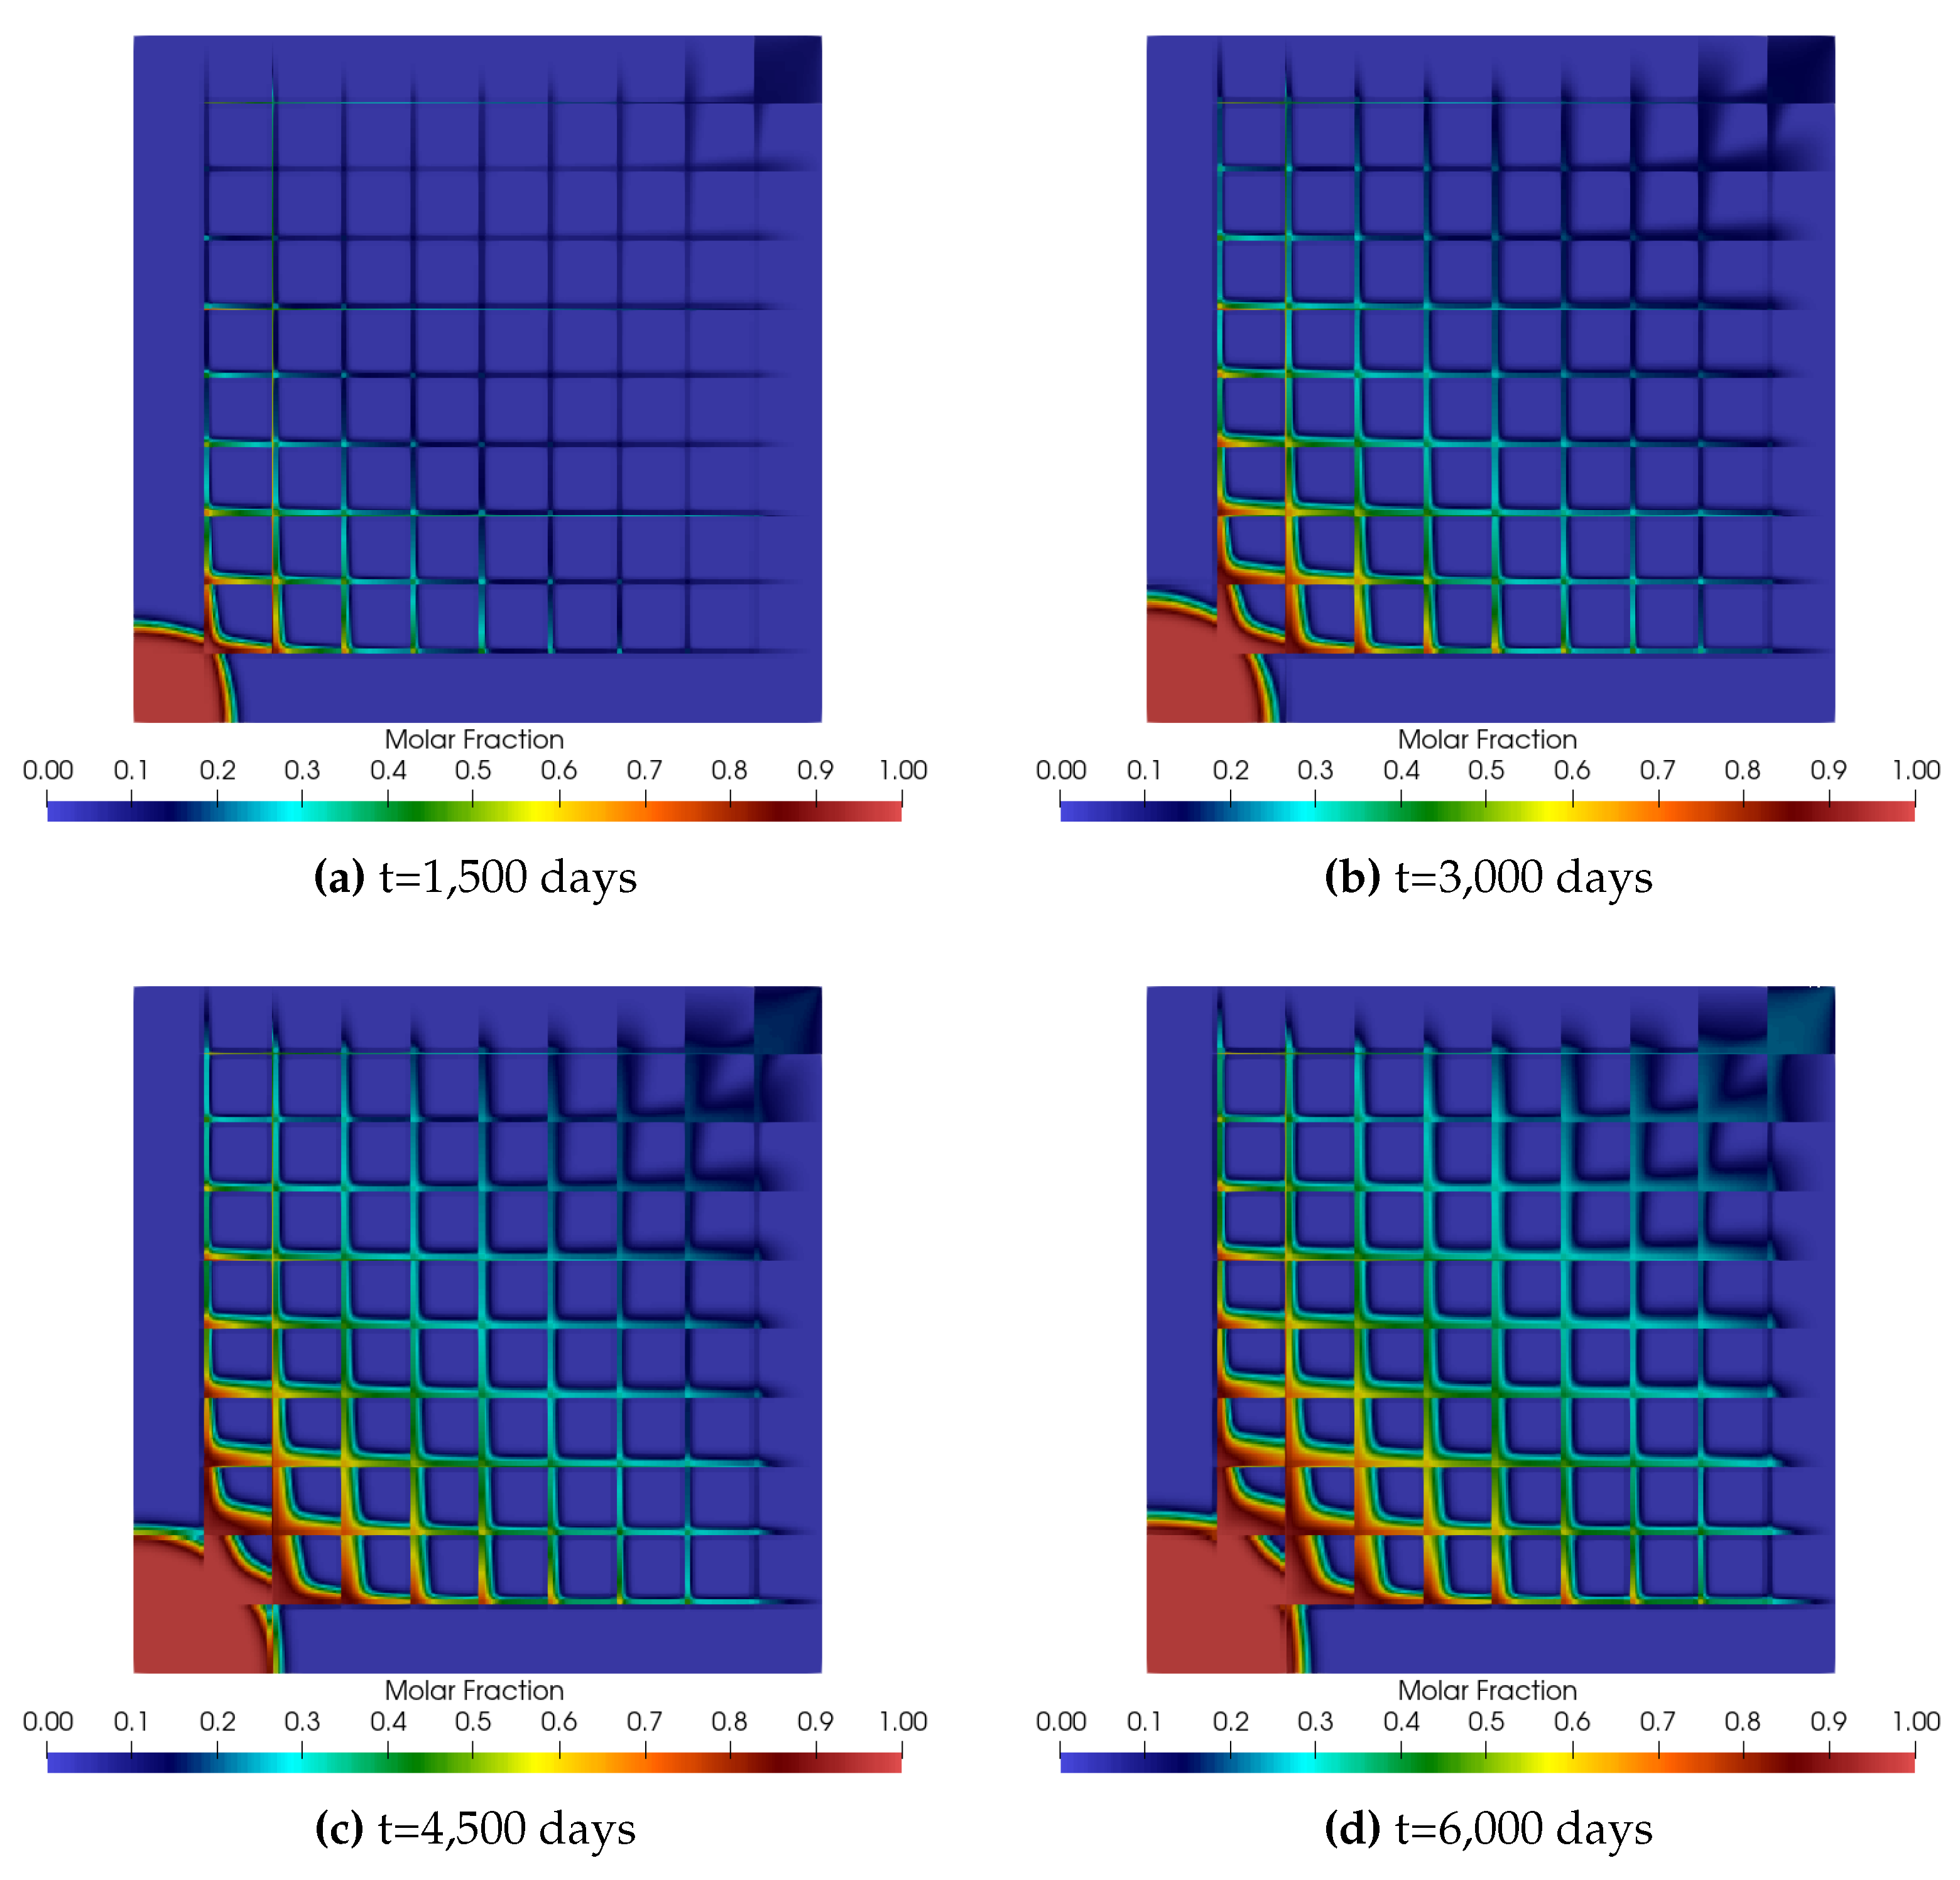
In practical terms, we note (Figure 4) that, for the evaluated parameters, there were only little variations concerning the distribution of CO2 when we compare the values to those in the first example. We can distinguish a smaller filling of the region delimited by the fractures in the lower left corner and a smaller molar fraction of the injected gas than in the case where the permeability is constant, upper right corner.
The last effect incorporated was that arising from gas slippage. In this model, if the Knudsen number of the mixture of components tends to zero, the permeability value would be the same as the initial. On the other hand, when it tends to infinity, its value would become five times greater than the initial value.
However, we must remember that the slip regime is characterized by 0.001 K n 0.1 . Thus, the highest viable variation would be for an apparent permeability equal to 1.4 k 0 .
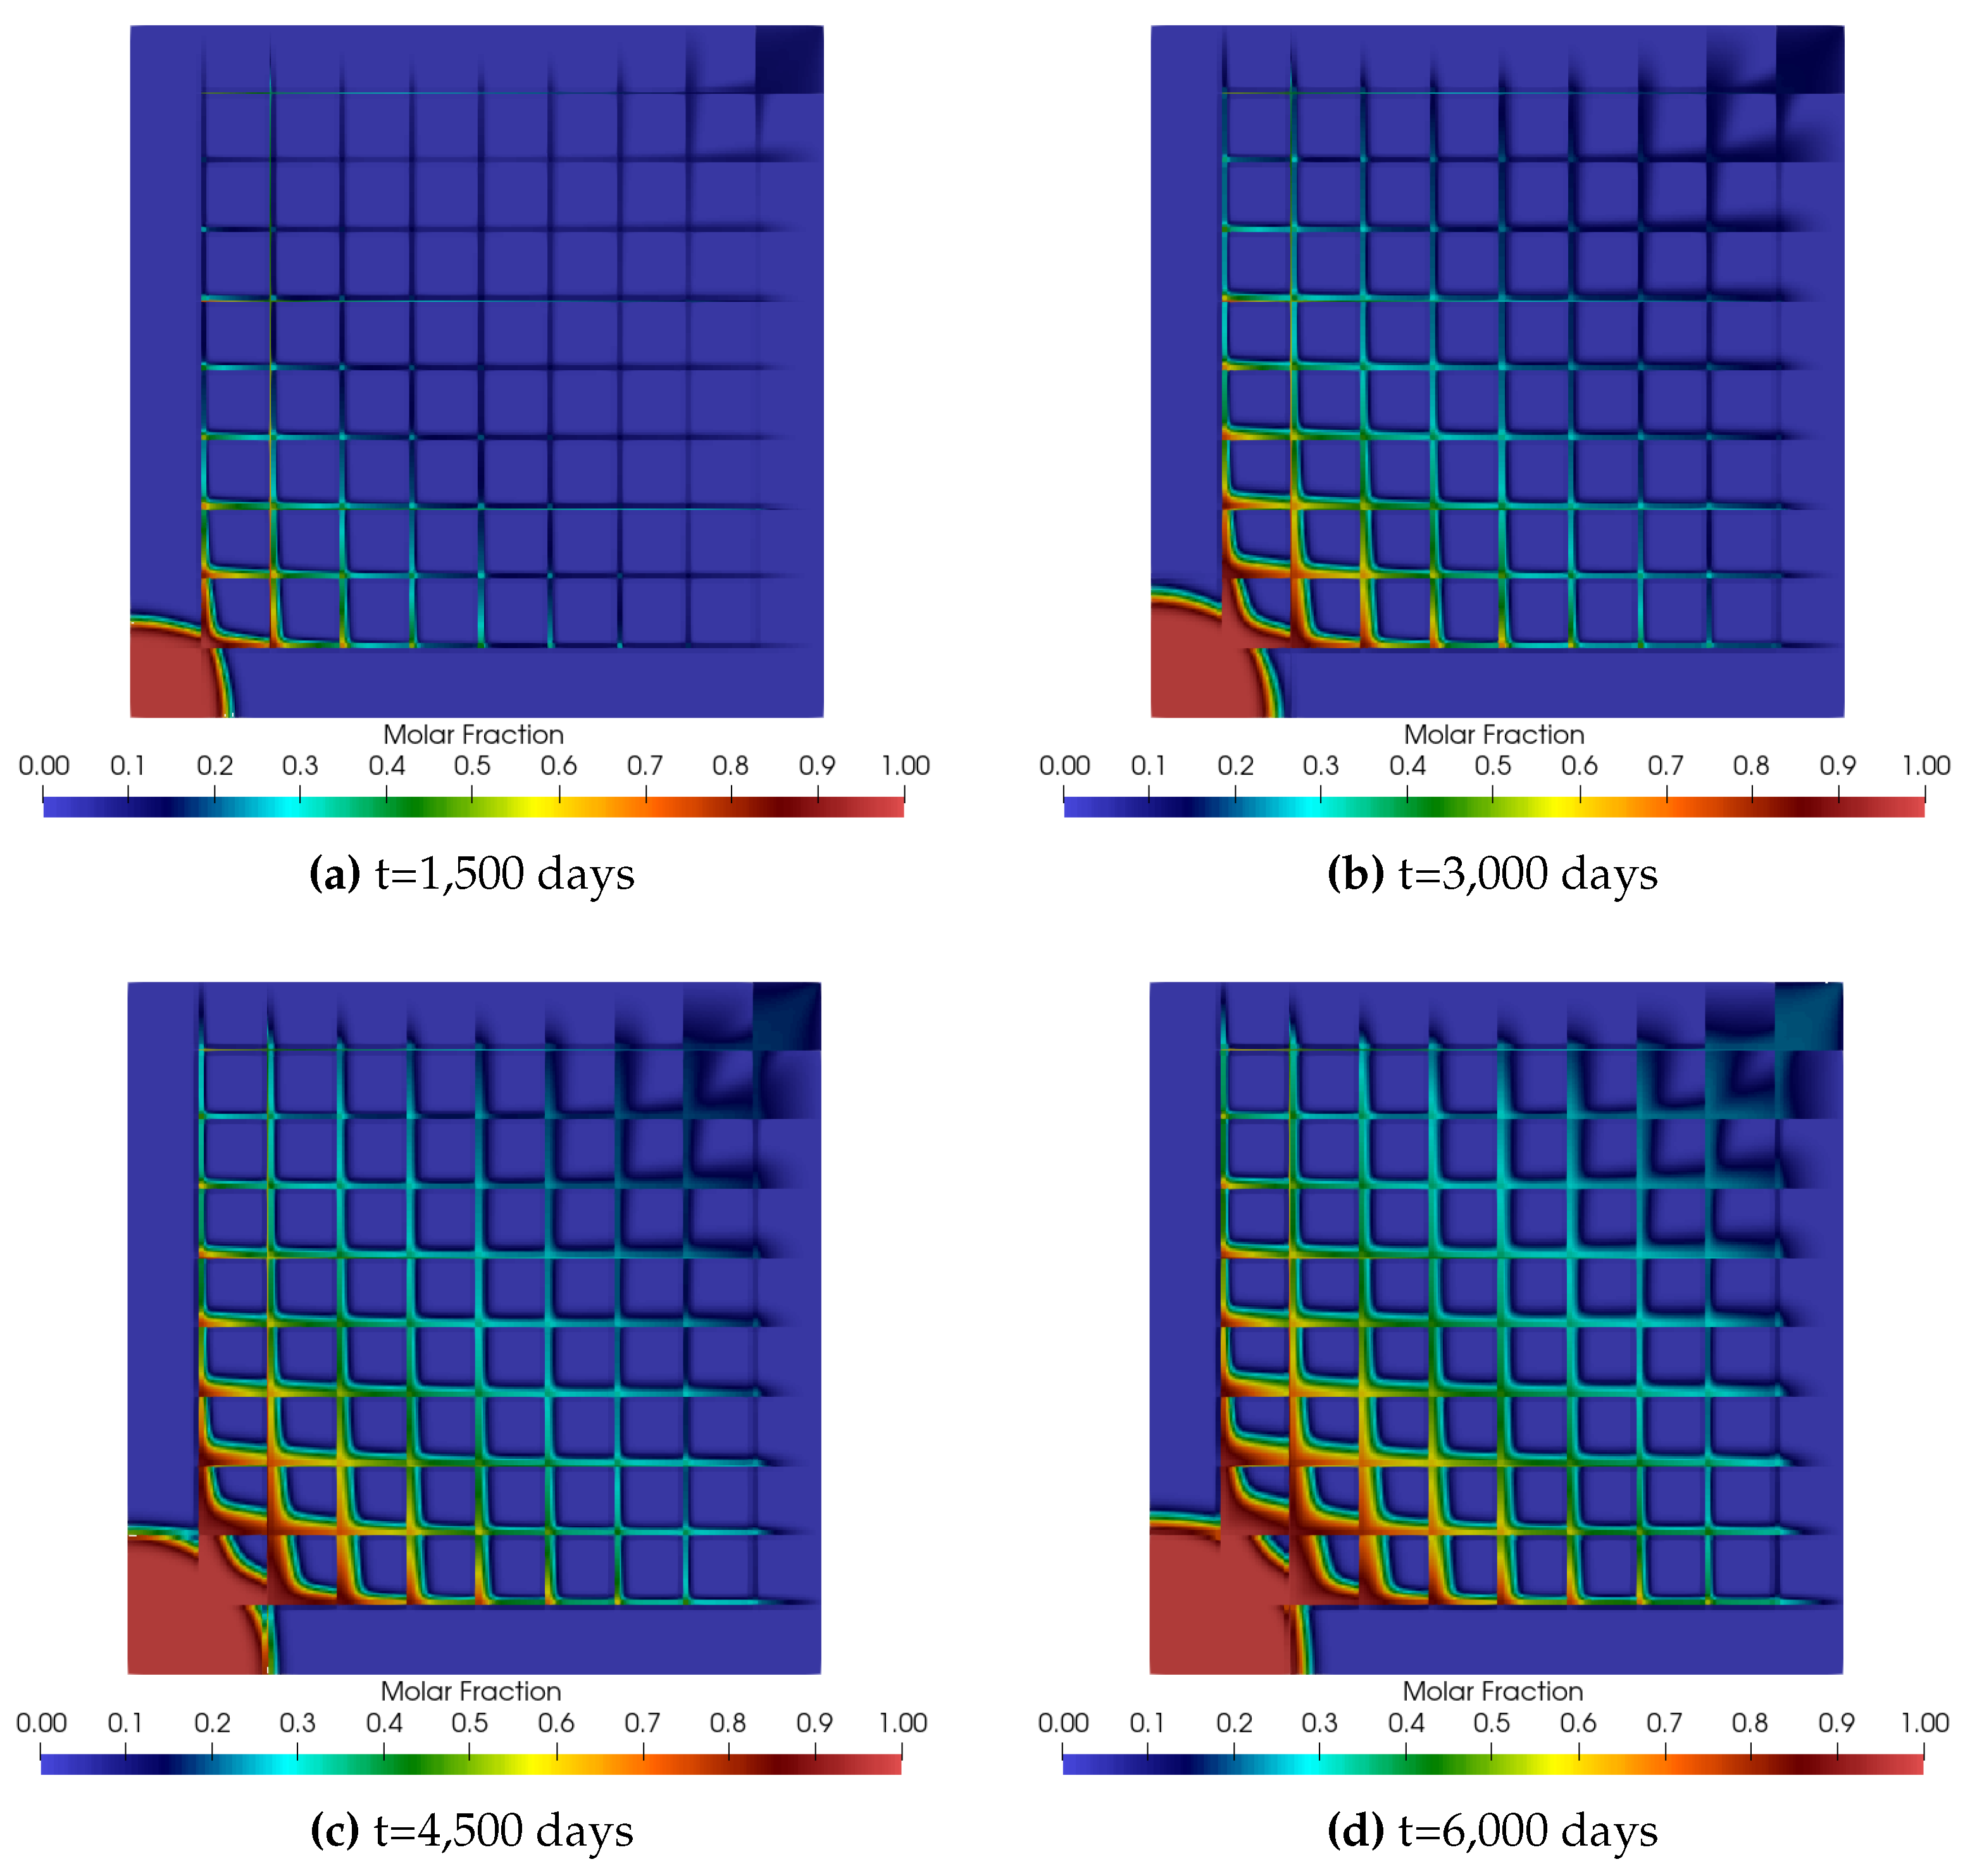
Unfortunately, depending on the parameters and properties chosen, the variation range of the mixture’s Knudsen number does not provide changes that differentiate this case from that of flow using Darcy’s classical law, see Figure 5.
We can not visually notice the differences in the mole fraction values when we compare these two cases. We believe that cumulative effects appear in the long term in the amount of gas produced. However, we cannot verify this in the present work.
Finally, we would like to show the results of the simulations encompassing all the effects added to our model. Although separately, they may have a greater or lesser influence on the flow of injected carbon dioxide, their combination will lead to a different methane gas production scenario in the long term.
From what we have discerned, inertial effects most affected the flow, followed by those arising from effective stress. Differently, the gas slip did not introduce changes that could modify the flow from that obtained with Darcy’s law without any modification incorporated.
The reader can see for themselves, in Figure 6, how these effects changed the mole fraction field due to the combination of them all.
To begin with, we found that the first region between the fractures in the injection region, bottom left corner, is practically filled by CO2, unlike when we did not consider any effect. In the methane production region, as we are injecting and producing the same volume of gas, CO2 may arrive earlier in the production zone, and we recover the injected CO2 along with the CH4.
Therefore, we can say that gas production will not be the same when we disregard the combined effects and should be higher than in reality.

6. Conclusions

We address the numerical simulation of single-phase two-component gas flow in a naturally fractured tight reservoir having low permeability and porosity values.
Our main objective was to show the implications for the production of using classical Darcy’s law in simulating flow in these types of reservoirs, especially in the presence of fractures. We know that they are responsible for introducing preferential paths for flow, presenting Reynolds numbers higher than those of regions without fractures.
Therefore, we incorporated inertial, effective stress, and gas slippage effects. In the first case, the apparent permeability values vary as a function of the Reynolds number and have an upper limit value. When it comes to the effects of effective stress, permeability values grow exponentially depending on the difference between the current and initial pressure values prevailing in the reservoir. Finally, the correction due to gas slip depends on the value of the flow’s Knudsen number and has an upper limit.
We chose a reference case to represent a naturally fractured tight gas reservoir (sugar cube configuration) and to allow us to perform simulations in a domain with zero flow conditions at the boundaries and injection flow rates (CO2) and production (CH4) prescribed.
Compared to the case of simulation using unmodified Darcy’s law, we verified that the distribution of the molar fraction of carbon dioxide presented a different pattern when we considered all effects simultaneously. This fact indicates that production is affected and that future predictions based on simulations made without taking their influence into account may be incorrect.
From the specific case considered, we found that the inertial and effective stress effects were dominant, with the first being the one that most influenced the flow. On the other hand, we did not observe variations when considering gas slippage.
Finally, in future work, we intend to do a quantitative study on the importance of these effects, besides including the possibility of gas adsorption and a well-reservoir coupling technique.

Author Contributions

Conceptualization, de Souza, G., Amaral Souto, H. P. and Pires, A. P.; methodology, de Souza, G., Amaral Souto, H. P. and Pires, A. P.; software, Debossam, J. G. S., de Freitas, M. M. and de Souza, G.; validation, Debossam, J. G. S., de Souza, G., Amaral Souto, H. P. and Pires, A. P.; formal analysis, Debossam, J. G. S., de Freitas, M. M., de Souza, G., Amaral Souto, H. P. and Pires, A. P.; investigation, Debossam, J. G. S., de Freitas, M. M., de Souza, G., Amaral Souto, H. P. and Pires, A. P.; writing—original draft preparation, Amaral Souto, H. P.; writing—review and editing, de Freitas, M. M., de Souza, G., Amaral Souto, H. P. and Pires, A. P.; visualization, de Freitas, M. M., de Souza, G. and Amaral Souto, H. P.

Data Availability Statement

Data will be available on request.

Acknowledgments

The authors gratefully thanks Rio de Janeiro State University, Coordination for the Improvement of Higher Education Personnel (CAPES) - Finance Code 001, and National Council for Scientific and Carlos Chagas Filho Foundation for Research Support of the State of Rio de Janeiro (FAPERJ) for their support.

Conflicts of Interest

The authors declare no conflicts of interest.

Abbreviations

The following abbreviations are used in this manuscript:
EGR Enhanced Gas Recovery
CG Conjugate Gradient Method
CSEGR CO2 Storage with Enhanced Gas Recovery
BiCGSTAB Biconjugate Gradient Stabilized Method
DFN Discrete Fracture Networks
FVM Finite Volume Method

References

  1. Bear, J. Modeling Phenomena of Flow and Transport in Porous Media; Springer: Cham, 2018. [Google Scholar]
  2. Halsey, T.C. Computational sciences in the upstream oil and gas industry. Philosophical Transactions of Royal Society 2016, 374, 1–12. [Google Scholar] [CrossRef] [PubMed]
  3. Boudet, H.; Clarke, C.; Bugden, D.; Maibach, E.; Roser-Renouf, C.; Leiserowitz, A. Fracking controversy and communication: Using national survey data to understand public perceptions of hydraulic fracturing. Energy Policy 2014, 65, 57–67. [Google Scholar] [CrossRef]
  4. Zhao, Y.; Zhang, L.; Shan, B. Mathematical model of fractured horizontal well in shale gas reservoir with rectangular stimulated reservoir volume. Journal of Natural Gas Science and Engineering 2018, 59, 67–79. [Google Scholar] [CrossRef]
  5. Sheng, G.; Javadpour, F.; Su, Y. Effect of microscale compressibility on apparent porosity and permeability in shale gas reservoirs. International Journal of Heat and Mass Transfer 2018, 120, 56–65. [Google Scholar] [CrossRef]
  6. Shi, J.; Li, X.; Li, Q.; Wang, F.; Sepehrnoori, K. Gas permeability model considering rock deformation and slippage in low permeability water-bearing gas reservoirs. Journal of Petroleum Science and Engineering 2014, 120, 61–72. [Google Scholar] [CrossRef]
  7. Moghaddam, R.N.; Jamiolahmady, M. Fluid transport in shale gas reservoirs: Simultaneous effects of stress and slippage on matrix permeability. International Journal of Coal Geology 2016, 163, 87–99. [Google Scholar] [CrossRef]
  8. Afagwu, C.; Abubakar, I.; Kalam, S.; Al-Afnan, S.F.; Awotunde, A.A. Pressure-transient analysis in shale gas reservoirs: A review. Journal of Natural Gas Science and Engineering 2020, 78, 103319. [Google Scholar] [CrossRef]
  9. Miao, Y.; Li, X.; Zhou, Y.; Lee, J.; Sun, Z.; Chang, Y.; Wang, S.; Hou, C. A new rate-transient analysis model for shale gas reservoirs coupled the effect of slip flow and surface diffusion. International Journal of Heat and Mass Transfer 2018, 124, 1–10. [Google Scholar] [CrossRef]
  10. Li, B.; Zhou, F.; Fan, W.; Ren, D.; Li, H.; Li, M. Experimental investigation and theoretical modeling of stress-dependent permeability in naturally fractured tight gas reservoir. Journal of Petroleum Science and Engineering 2020, 188, 106949. [Google Scholar] [CrossRef]
  11. Wang, L.; Wang, S.; Zhang, R.; Wang, C.; Xiong, Y.; Zheng, X.; Li, S.; Jin, K.; Rui, Z. Review of multi-scale and multi-physical simulation technologies for shale and tight gas reservoirs. Journal of Natural Gas Science and Engineering 2017, 37, 560–578. [Google Scholar] [CrossRef]
  12. Fu, J.; Su, Y.; Li, L.; Wang, W.; Wang, C.; Li, D. Productivity model with mechanisms of multiple seepage in tight gas reservoir. Journal of Petroleum Science and Engineering 2022, 209, 109825. [Google Scholar] [CrossRef]
  13. Zhang, Y.; Jin, Y.; Yang, D. Semi-analytical modeling of transient pressure behaviour for a multifractured horizontal well in a gas reservoir with a complex fracture network by considering effects of slippage, stress-sensitivity, and gas adsorption/desorption. Journal of Petroleum Science and Engineering 2022, 214, 110504. [Google Scholar] [CrossRef]
  14. Song, H.; Cao, Y.; Yu, M.; Wang, Y.; Killough, J.E.; Leung, J. Impact of permeability heterogeneity on production characteristics in water-bearing tight gas reservoirs with threshold pressure gradient. Journal of Natural Gas Science and Engineering 2015, 22, 172–181. [Google Scholar] [CrossRef]
  15. Guria, C. Pressure- and temperature-dependent Klinkenberg slippage effect in porous media to non-ideal gases. Geoenergy Science and Engineering 2023, 224, 211629. [Google Scholar] [CrossRef]
  16. Rubin, C.; Zamirian, M.; Takbiri-Borujeni, A.; Gu, M. Investigation of gas slippage effect and matrix compaction effect on shale gas production evaluation and hydraulic fracturing design based on experiment and reservoir simulation. Fuel 2019, 241, 12–24. [Google Scholar] [CrossRef]
  17. Ding, J.; Yang, S.; Nie, X.; Wang, Z. Dynamic threshold pressure gradient in tight gas reservoir. Journal of Natural Gas Science and Engineering 2014, 20, 155–160. [Google Scholar] [CrossRef]
  18. Friedel, T.; Voigt, H.D. Investigation of non-Darcy flow in tight-gas reservoirs with fractured wells. Journal of Petroleum Science and Engineering 2006, 54, 112–128. [Google Scholar] [CrossRef]
  19. Clarkson, C.; Jensen, J.; Chipperfield, S. Unconventional gas reservoir evaluation: What do we have to consider? Journal of Natural Gas Science and Engineering 2012, 8, 9–33. [Google Scholar] [CrossRef]
  20. Ye, Z.; Chen, D.; Wang, J. Evaluation of the non-Darcy effect in coalbed methane production. Fuel 2014, 121, 1–10. [Google Scholar] [CrossRef]
  21. Wang, C.; Li, Z.P.; Li, H.; Wei, Q.; Bai, R.T. A new method to calculate the productivity of fractured horizontal gas wells considering non-Darcy flow in the fractures. Journal of Natural Gas Science and Engineering 2015, 26, 981–991. [Google Scholar] [CrossRef]
  22. Farahani, M.; Saki, M.; Ghafouri, A.; Khaz’ali, A.R. Laboratory measurements of slippage and inertial factors in carbonate porous media: A case study. Journal of Petroleum Science and Engineering 2018, 162, 666–673. [Google Scholar] [CrossRef]
  23. Feng, R.; Chen, S.; Bryant, S.; Liu, J. Stress-dependent permeability measurement techniques for unconventional gas reservoirs: Review, evaluation, and application. Fuel 2019, 256, 115987. [Google Scholar] [CrossRef]
  24. Wang, J.; Yu, L.; Yuan, Q. Experimental study on permeability in tight porous media considering gas adsorption and slippage effect. Fuel 2019, 253, 561–570. [Google Scholar] [CrossRef]
  25. Luo, H.; Li, H.; Zhou, X.; Li, Y.; Li, Y.; Zhu, X. Modeling temperature behavior of multistage fractured horizontal well with two-phase flow in low-permeability gas reservoirs. Journal of Petroleum Science and Engineering 2019, 173, 1187–1209. [Google Scholar] [CrossRef]
  26. Liu, G.; Xie, S.; Tian, W.; Wang, J.; Li, S.; Wang, Y.; Yang, D. Effect of pore-throat structure on gas-water seepage behaviour in a tight sandstone gas reservoir. Fuel 2022, 310, 121901. [Google Scholar] [CrossRef]
  27. Sun, H.; Ouyang, W.; Zhu, S.; Wan, Y.; Tang, Y.; Cao, W. A new numerical well test method of multi-scale discrete fractured tight sandstone gas reservoirs and its application in the Kelasu Gas Field of the Tarim Basin. Natural Gas Industry B 2023, 10, 103–113. [Google Scholar] [CrossRef]
  28. Tang, C.; Zhou, W.; Chen, Z.; Wei, J. Numerical simulation of CO2 sequestration in shale gas reservoirs at reservoir scale coupled with enhanced gas recovery. Energy 2023, 277, 127657. [Google Scholar] [CrossRef]
  29. Tapia, J.F.D.; Lee, J.Y.; Ooi, R.E.; Foo, D.C.; Tan, R.R. A review of optimization and decision-making models for the planning of CO2 capture, utilization and storage (CCUS) systems. Sustainable Production and Consumption 2018, 13, 1–15. [Google Scholar] [CrossRef]
  30. Zhao, X.; Chen, Z.; Wang, B.; Liao, X.; Li, D.; Zhou, B. A Multi-medium and Multi-mechanism model for CO2 injection and storage in fractured shale gas reservoirs. Fuel 2023, 345, 128167. [Google Scholar] [CrossRef]
  31. Liu, S.Y.; Ren, B.; Li, H.Y.; Yang, Y.Z.; Wang, Z.Q.; Wang, B.; Xu, J.; Agarwal, R. CO2 storage with enhanced gas recovery (CSEGR): A review of experimental and numerical studies. Petroleum Science 2022, 19, 594–607. [Google Scholar] [CrossRef]
  32. Haq, B.; Salahu Muhammed, N.; Liu, J.; Tong Chua, H. Enhanced natural gas production using CO2 injection: Application to sustainable hydrogen production. Fuel 2023, 347, 128474. [Google Scholar] [CrossRef]
  33. Aminu, M.D.; Manovic, V. A modelling study to evaluate the effect of impure CO2 on reservoir performance in a sandstone saline aquifer. Heliyon 2020, 6, E04597. [Google Scholar] [CrossRef] [PubMed]
  34. Wang, Y.; Vuik, C.; Hajibeygi, H. CO2 Storage in deep saline aquifers: impacts of fractures on hydrodynamic trapping. International Journal of Greenhouse Gas Control 2022, 113, 103552. [Google Scholar] [CrossRef]
  35. Parvin, S.; Masoudi, M.; Sundal, A.; Miri, R. Continuum scale modelling of salt precipitation in the context of CO2 storage in saline aquifers with MRST compositional. International Journal of Greenhouse Gas Control 2020, 99, 103075. [Google Scholar] [CrossRef]
  36. Zeng, F.; Zhao, G. Semianalytical Model for Reservoirs with Forchheimer’s Non-Darcy Flow. Society of Petroleum Engineers Reservoir Evaluation & Engineering 2008, 11, 280–291. [Google Scholar] [CrossRef]
  37. Amao, A.M. Mathematical Model for Darcy-Forchheimer Flow with Applications to Well Performance Analysis. Master’s thesis, Texas Tech University, Lubbock, Texas, USA, 2007. [Google Scholar]
  38. Barree, R.D.; Conway, M.W. Beyond Beta Factors: A Complete Model for Darcy, Forchheimer, and Trans-Forchheimer Flow in Porous Media. Society of Petroleum Engineers Annual Technical Conference and Exhibition;, 2004. [CrossRef]
  39. Lai, B.; Miskimins, J.L.; Wu, Y.S. Non-Darcy Porous Media Flow According to the Barree and Conway’s Model: Laboratory and Numerical Modeling Studies. Society of Petroleum Engineers Rocky Mountain Petroleum Technology Conference;, 2009. [CrossRef]
  40. Souza, G.; Amaral Souto, H.P. A comparative study of non-Darcy flows in naturally fractured gas reservoirs. Journal of the Brazilian Society of Mechanical Sciences and Engineering 2016, 38, 1701–1715. [Google Scholar] [CrossRef]
  41. Zhang, Y.; Yang, D. Modeling two-phase flow behaviour in a shale gas reservoir with complex fracture networks and flow dynamics. Gas Science and Engineering 2023, 119, 205112. [Google Scholar] [CrossRef]
  42. Civan, F.; Rai, C.S.; Sondergeld, C.H. Shale-Gas Permeability and Diffusivity Inferred by Improved Formulation of Relevant Retention and Transport Mechanisms. Transport in Porous Media 2011, 86, 925–944. [Google Scholar] [CrossRef]
  43. Florence, F.A.; Rushing, J.A.; Newsham, K.E.; Blasingame, T.A. Improved Permeability Prediction Relations for Low-Permeability Sands. SPE Rocky Mountain Petroleum Technology Conference / Low Permeability Reservoirs Symposium. 2007. [Google Scholar] [CrossRef]
  44. Wang, S.; Lukyanov, A.A.; Wu, Y.S. Second-order gas slippage model for the Klinkenberg effect of multicomponent gas at finite Knudsen numbers up to 1. Fuel 2019, 235, 1275–1286. [Google Scholar] [CrossRef]
  45. de Queiroz, R.Z.H.G.; do Rosário, R.C.D.; de Souza, G.; Amaral Souto, H.P. On the numerical simulation of wellbore pressure in gas reservoirs incorporating the phenomena of slippage, formation damage and wellbore storage. International Journal of Advanced Engineering Research and Science 2020, 7, 224–239. [Google Scholar] [CrossRef]
  46. Secchi, S.; Schrefler, B.A. A method for 3-D hydraulic fracturing simulation. International Journal of Fracture 2012, 178, 245–258. [Google Scholar] [CrossRef]
  47. Chen, Z. Reservoir Simulation – Mathematical Techniques in Oil Recovery; Society of Industrial and Applied Mathematics, 2007. [Google Scholar]
  48. Debossam, J.G.S.; dos Santos Heringer, F.D.; de Souza, G.; Amaral Souto, H.P. Numerical simulation of single-phase two-components flow in naturally fractured oil reservoirs. Coupled Systems Mechanics 2019, 8, 129–146. [Google Scholar] [CrossRef]
  49. Debossam, J.G.S.; de Souza, G.; Amaral Souto, H.P.; Pires, A.P. Numerical simulation of single-phase two-component non-Darcy flow in naturally fractured reservoirs for enhanced gas recovery and carbon dioxide storage. Brazilian Journal of Chemical Engineering 2023, 41, 197–219. [Google Scholar] [CrossRef]
  50. Böttcher, N.; Singh, A.K.; Kolditz, O.; Liedl, R. Non-isothermal, compressible gas flow for the simulation of an enhanced gas recovery application. Journal of Computational and Applied Mathematics 2012, 236, 4933–4943. [Google Scholar] [CrossRef]
  51. Soave, G. Equilibrium constants from a modified Redlich-Kwong equation of state. Chemical Engineering Science 1972, 27, 1197–1203. [Google Scholar] [CrossRef]
  52. Lohrenz, J.; Bray, B.G.; Clark, C.R. Calculating viscosities of reservoir fluids from their compositions. Journal of Petroleum Technology 1964, 16, 1171–1176. [Google Scholar] [CrossRef]
  53. Versteeg, H.K.; Malalasekera, W. An introduction to Computational Fluid Dynamics: the finite volume method; Pearson, 2007. [Google Scholar]
  54. Ertekin, T.; Abou-Kassem, J.; King, G. Basic Applied Reservoir Simulation; Society of Petroleum Engineers: Richardson, USA, 2001. [Google Scholar]
  55. Biryukov, D.; Kuchuk, F.J. Transient Pressure Behavior of Reservoirs with Discrete Conductive Faults and Fractures. Transport in Porous Media 2012, 95, 239–268. [Google Scholar] [CrossRef]
  56. Vennemo, S. Multiscale Simulation of Thermal Flow in Porous Media. Master’s thesis, Norwegian University of Science and Technology, Trondheim, Norway, 2016. [Google Scholar]
  57. Saad, Y. Iterative Methods for Sparse Linear Systems, 2nd ed.Society of Industrial and Applied Mathematics, 2003. [Google Scholar]
  58. Warren, J.E.; Root, P.J. The behavior of naturally fractured reservoirs. Society of Petroleum Engineers Journal 1963, 3, 245–255. [Google Scholar] [CrossRef]
  59. Barenblatt, G.; Zheltov, I.; Kochina, I. Basic concepts in the theory of seepage of homogeneous liquids in fissured rocks [strata]. Journal of Applied Mathematics and Mechanics 1960, 24, 1286–1303. [Google Scholar] [CrossRef]
  60. do Rosário, R.C.D.; de Souza, G.; Amaral Souto, H.P. A comparative study of some well-reservoir coupling models in the numerical simulation of oil reservoirs. International Journal of Advanced Engineering Research and Science 2020, 7, 126–148. [Google Scholar] [CrossRef]
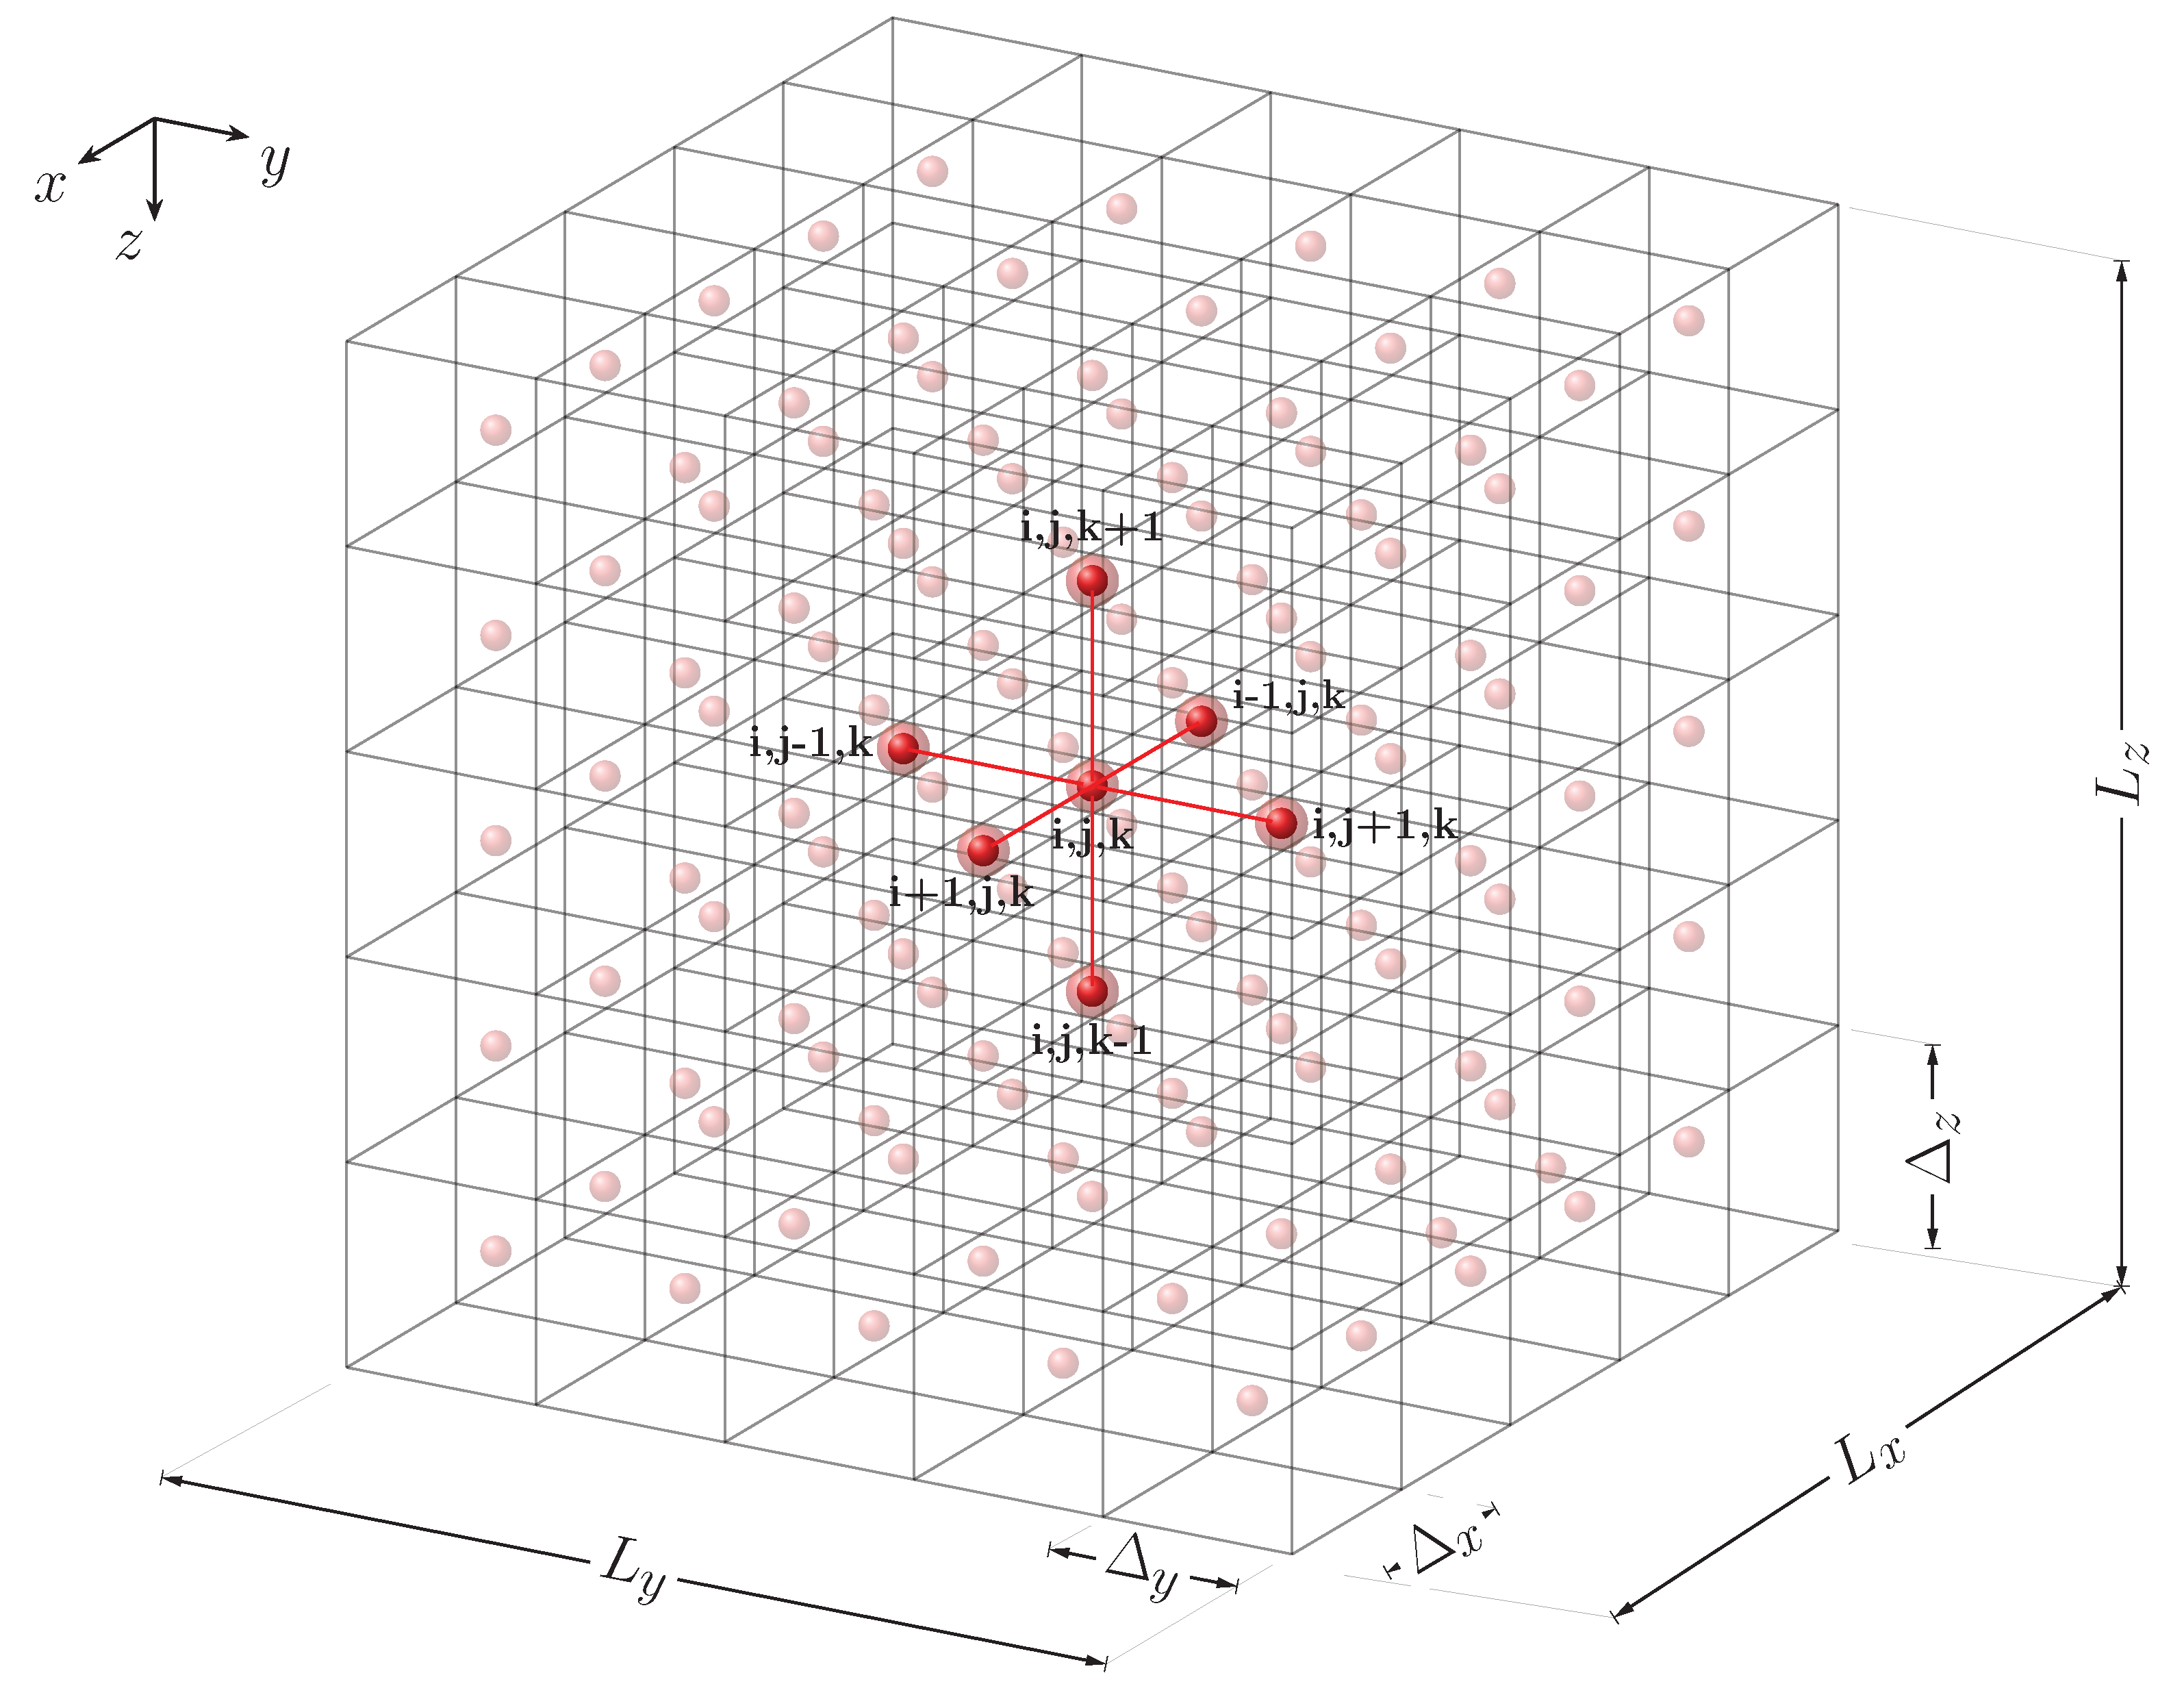
Figure 1. Three-dimensional mesh.
Preprints 112779 g001
Figure 2. Carbon dioxide mole fraction for sugar cube configuration: classical Darcy’s law.
Preprints 112779 g002
Figure 3. Carbon dioxide mole fraction for sugar cube configuration: inertial effects.
Preprints 112779 g003
Figure 4. Carbon dioxide mole fraction for sugar cube configuration: effective stress.
Preprints 112779 g004
Figure 5. Carbon dioxide mole fraction for sugar cube configuration: gas slippage.
Preprints 112779 g005
Figure 6. Carbon dioxide mole fraction for sugar cube configuration: all effects combined.
Preprints 112779 g006
Table 1. Common data for all simulations.
Parameter Unit Value
c ϕ kPa−1 3 10−11
D m m2/s 1 10−8
k m r 0.013
k r mDarcy 0.1
L c m 1,000
L x = L y m 1,000
L z m 10
p 0 MPa 30
Q s c mol/day 50 103
T 0 K 394
γ kPa−1 3 10−5
ζ 1.2
η 2.958
τ m−1 2
τ c m−1 5,000
ϕ r 0.1
Table 2. Fluid properties.
Parameter Unit CO2 CH4
p c MPa 7.38 4.61
T c K 304.1 190.6
ω 0.239 0.0116
Table 3. Fracture properties.
Parameter Unit Value
L f m 1,000
w m 0.01
k f mDarcy 7.0 104
ϕ f 0.75
Disclaimer/Publisher’s Note: The statements, opinions and data contained in all publications are solely those of the individual author(s) and contributor(s) and not of MDPI and/or the editor(s). MDPI and/or the editor(s) disclaim responsibility for any injury to people or property resulting from any ideas, methods, instructions or products referred to in the content.
Copyright: This open access article is published under a Creative Commons CC BY 4.0 license, which permit the free download, distribution, and reuse, provided that the author and preprint are cited in any reuse.
Alerts
Prerpints.org logo

Preprints.org is a free preprint server supported by MDPI in Basel, Switzerland.

Subscribe

© 2025 MDPI (Basel, Switzerland) unless otherwise stated