
Submitted:
22 July 2024
Posted:
23 July 2024
You are already at the latest version
Abstract
This article aims to analyze household energy data to predict electricity self-sufficiency and identify the key features that impact it. For this purpose, we use SHAP (Shapley Additive Explanations), LightGBM (Light Gradient Boosting Machine), and a correlation heatmap-based framework to analyze 12 months of energy and questionnaire survey data collected from over 200 smart houses in Kitakyushu, Japan. We use the SHAP summary plot to identify the impact-wise order of key features influencing the electricity self-sufficiency rate (ESSR). Using SHAP, we demonstrated that key features are; housing types, average monthly electricity bill, floor heating, electric capacity, number of washing and drying machines, fee plans, occupation of household head, total floor area, average monthly gas bill, cooking equipment, etc. Furthermore, we adopted the LightGBM classifier with $\ell^1$ regularization to extract the most significant features and predict the electricity self-sufficiency rate of households. This LightGBM-based model can also predict the electricity self-sufficiency rate of households that did not participate in the questionnaire survey. A heat map is also used to analyze the correlation among household variables. The findings discussed in this article offer valuable insights for energy policymakers to achieve the targets of energy self-sufficient houses.
Keywords:
SHAP
; LightGBM
; $\ell^1$ regularization
; electricity self-sufficiency rate
; household energy data
; time-series data
; questionnaire survey
; renewable energy sources
; Net zero-energy houses
; correlation matrix
; energy policies
; smart houses
; HEMS
1. Introduction
In recent years, population growth, rapid urbanization, economic growth, and advancements in healthcare systems have led to an exponential rise in global electricity demand [1]. According to several articles, global electricity demand is expected to rise drastically in the next few decades [2]. Coal, oil, and natural gas continue to be the primary sources of energy used for generating electricity worldwide [3]. The use of these fossil fuels in electricity generation deteriorates the environment by emitting harmful greenhouse gases (GHGs) such as carbon dioxide (CO), methane, etc [4,5]. Coal power generation is the largest contributor to global greenhouse gas (GHG) emissions, as carbon dioxide released from coal combustion alone accounted for the lion’s share of global warming [6]. Coal, the most carbon-intensive fossil fuel, has historically been the primary choice for electricity generation due to its widespread availability and relatively low cost. The combustion of coal releases substantial amounts of carbon dioxide (CO) and other atmospheric pollutants, contributing significantly to global warming, resulting in adverse effects such as rising temperatures, climate change, altered weather patterns, and accelerated melting of polar ice caps and glaciers [7,8].
Global warming presents a formidable threat to the sustainability of life on Earth, necessitating immediate and concerted efforts to mitigate its effects and transition towards more sustainable energy sources and practices. The escalating concerns over global warming and its profound ramifications for the environment have sparked an urgent call for transformative actions worldwide across various sectors of society [9,10,11,12,13]. In the joint statement of the G20 summit held in New Delhi in 2023, member nations also emphasized the importance of adopting carbon-efficient, climate-adaptive, and eco-friendly development pathways. The G20 nations also agreed to the effective implementation of the Paris Agreement (2015) and its objective to keep the rise in global average temperature significantly below 2°C (3.6°F) compared to pre-industrial levels [14].
The residential sector’s electricity usage constitutes a substantial share of global power consumption [15]. At the forefront of this global challenge lies the imperative to transition towards a low-carbon society. Among the myriad contributors to carbon emissions, household energy consumption wields significant influence, collectively accounting for a substantial portion of global carbon emissions.
Efforts to mitigate this impact introduced the concept of net-zero energy houses (ZEHs), representing a significant shift towards sustainable and eco-conscious living. A nearly zero-energy house (ZEH) aims to generate sufficient renewable energy for self-sufficiency, eliminating the need for reliance on the grid and achieving autonomy in generating nearly 100% of its clean energy. Achieving the goal of nearly zero-carbon homes requires a systematic approach involving the meticulous management of energy resources, household consumption patterns, and the widespread integration of renewable technologies.
Governments are formulating energy policies to achieve households’ electricity self-sufficiency targets. These strategies involve installing renewable sources like solar panels or fuel cells at home and using behavioral approaches such as surveys to raise awareness about energy savings.
Electricity self-sufficiency is the capability of a household to generate or produce enough electricity to fulfill its requirements without heavy reliance on external sources. Achieving electricity self-sufficiency typically involves adopting renewable energy technologies like solar panels, fuel cells, etc., to generate domestic electricity. By doing so, households reduce dependence on traditional energy sources such as grid electricity or fossil fuels, thereby increasing resilience and independence in meeting their electricity needs.
Due to its potential benefits, electricity self-sufficiency is desirable for households and also enhances energy security by reducing vulnerability to disruptions in price fluctuations. Moreover, electricity self-sufficiency promotes environmental sustainability by curbing greenhouse gas emissions and lessening dependence on finite fossil fuel reserves.
Achieving the targets of household electricity self-sufficiency requires strategic planning, substantial investment, and supportive policy frameworks to develop robust, resilient, and eco-friendly electrical energy infrastructure. Transitioning towards renewable energy sources and prioritizing energy efficiency measures are crucial steps in realizing this goal at the household level.
1.1. Related Work
Research in this field is at an early stage, as governments of various countries have only recently acknowledged the threat of global warming and started backing research efforts related to climate change. As a result, limited articles are available on enhancing household electricity self-sufficiency.
As explained below, a few authors have analyzed household energy data and demonstrated how installing renewable energy sources, such as solar systems and fuel cells, at home can improve electricity self-sufficiency and the factors affecting it. Colmenar et al. discussed mathematical models to evaluate the profitability of photovoltaic systems to boost household electricity self-sufficiency in Spain. By utilizing photovoltaic systems, households can produce their own electricity, supplementing grid power and feeding excess energy back into the grid for remuneration. This approach empowers households to become more self-sufficient in meeting their electricity needs while promoting the use of renewable energy [16]. Camargo et al. enhanced electricity self-sufficiency using PV and battery systems by optimizing the sizes of these components based on technical requirements and weather-dependent scenarios. The authors identified the most efficient combinations of PV and battery sizes through linear optimization modeling to ensure a reliable electricity supply [17]. Li et al. discuss methods like solar tracking panels and energy storage systems to enhance self-sufficiency rates. The study recommends creating a local grid by connecting rooftops within an area to enhance energy independence [18]. Harke et al. investigate electricity self-sufficiency by estimating PV area and battery capacity requirements for households in Germany. It explores cost optimization strategies and models hourly electricity consumption using representative data. This article used the Fourier series and statistical models to model the hourly electricity demand for households [19]. Nishimura et al. increased electricity self-sufficiency by integrating solar panels and fuel cells. They proposed a system where surplus power generated by solar panels during peak production periods is used to produce hydrogen through electrolysis [20]. Bruni et al. increased electricity self-sufficiency in their Matlab/Simulink-based study by introducing a novel definition of energy efficiency parameters and evaluating the performance of energy conversion components such as PV modules and fuel cells [21]. Ozcan et al. discuss Turkey’s decreasing self-sufficiency in electricity generation due to reliance on imported fossil fuels and underutilizing of renewable energy sources (RES) [22].
All the models mentioned above are based on theories, mathematical modeling, statistics, analytical methods, and simulations. They demonstrate that households can enhance their electricity self-sufficiency by utilizing renewable sources such as fuel and solar cells. Furthermore, as explained below, some articles applied machine learning techniques to analyze energy consumption data.
Beckel et al. explore using supervised machine learning to analyze smart meter data for inferring household characteristics, such as socio-economic status and appliance stock [23]. Edwards et al. discuss using a gate network to determine expert networks for accurate energy consumption predictions using feedforward neural networks (FFNN), LS-SVM etc [24]. Thakur et al. used algorithms XGBoost, CatBoost, and LightGBM for analyzing energy consumption [25]. Chou et al. provide a detailed analysis of energy consumption forecasting in residential buildings using machine learning like ANNs, gradient boosting machines (GBM), etc. [26]. The above articles used traditional machine learning techniques to analyze household energy data and had no clue about electricity self-sufficiency or the questionnaire survey.
1.2. Research Gap
As outlined in the literature review, most researchers used mathematical modeling, statistical analyses, and various analytical methods to analyze household energy data and identify key factors influencing household electricity self-sufficiency. While some studies applied traditional machine learning techniques to analyze household energy data and did not provide definitive insights into electricity self-sufficiency. Moreover, the aforementioned studies did not incorporate questionnaire surveys to explore how behavioral approaches could contribute to achieving nearly zero-energy houses.
1.3. Motivation
Global warming is a critical environmental issue and is responsible for the gradual rise in Earth’s average temperature, primarily due to the accumulation of greenhouse gases in the atmosphere. Incorporating smart household energy management systems, adopting behavioral changes to reduce energy consumption, etc. can further enhance the electrical self-sufficiency of households. These combined efforts can help in the realization of nearly zero-energy houses as well. The Jono district in Kitakyushu City, Japan, has several smart houses equipped with solar panels and fuel cells, which is the perfect place for our research to understand how household energy data analysis and questionnaire survey results can be utilized to achieve the target of nearly zero-energy houses. Therefore, we collected real data (original data collected by us) from these households. In our study, we utilized the SHAP, heatmap, and LightGBM-based approaches to uncover nuanced insights and correlations essential to the realization of energy self-sufficient houses.
1.4. Novelty and Contributions
To address the identified research gap, we conducted a comprehensive study involving the collection of original household energy and questionnaire survey data from the Jono district of Kitakyushu, Japan. In this article, we use SHAP, LightGBM with regularization and a heat map-based maidan framework to scrutinize household energy and questionnaire survey data.
Initially, we utilized LightGBM-based SHAP summary plot analysis to rank the importance of features derived from household energy and questionnaire survey data. Subsequently, we implemented a LightGBM with regularization-based analysis to pinpoint the factors most significantly impacting the electricity self-sufficiency rate, establishing correlations between these factors and the self-sufficiency rate. This LightGBM model can also predict the electricity self-sufficiency of households not included in the survey. In the above analysis, we used LighGBM because it’s a cutting-edge machine learning framework, recently developed by Microsoft, renowned for its efficiency and performance in predictive modeling tasks [27].
To further explore the interrelationships among survey questions, we analyzed the questionnaire data using a correlation matrix-based heatmap. This comprehensive framework provides valuable insights for energy policymakers and researchers, facilitating the development of strategies to achieve net-zero energy houses.
1.5. Organization of this Article
The work has been organized in the following manner:
1. LightGBM SHAP-based Feature Analysis: This study utilized the SHAP summary plot to highlight important household features in order of rank of feature importance from top to bottom.
2. LightGBM-based Prediction Model: In the SHAP model, we observed several factors affecting electricity self-sufficiency. Among these features, we aimed to identify which ones have the most significant impact on ESSR, that’s why we used regularization to discard comparatively less important features (although these discarded features cannot be completely ignored).
Figure 1.
Schematic diagram presenting the organization of this article.
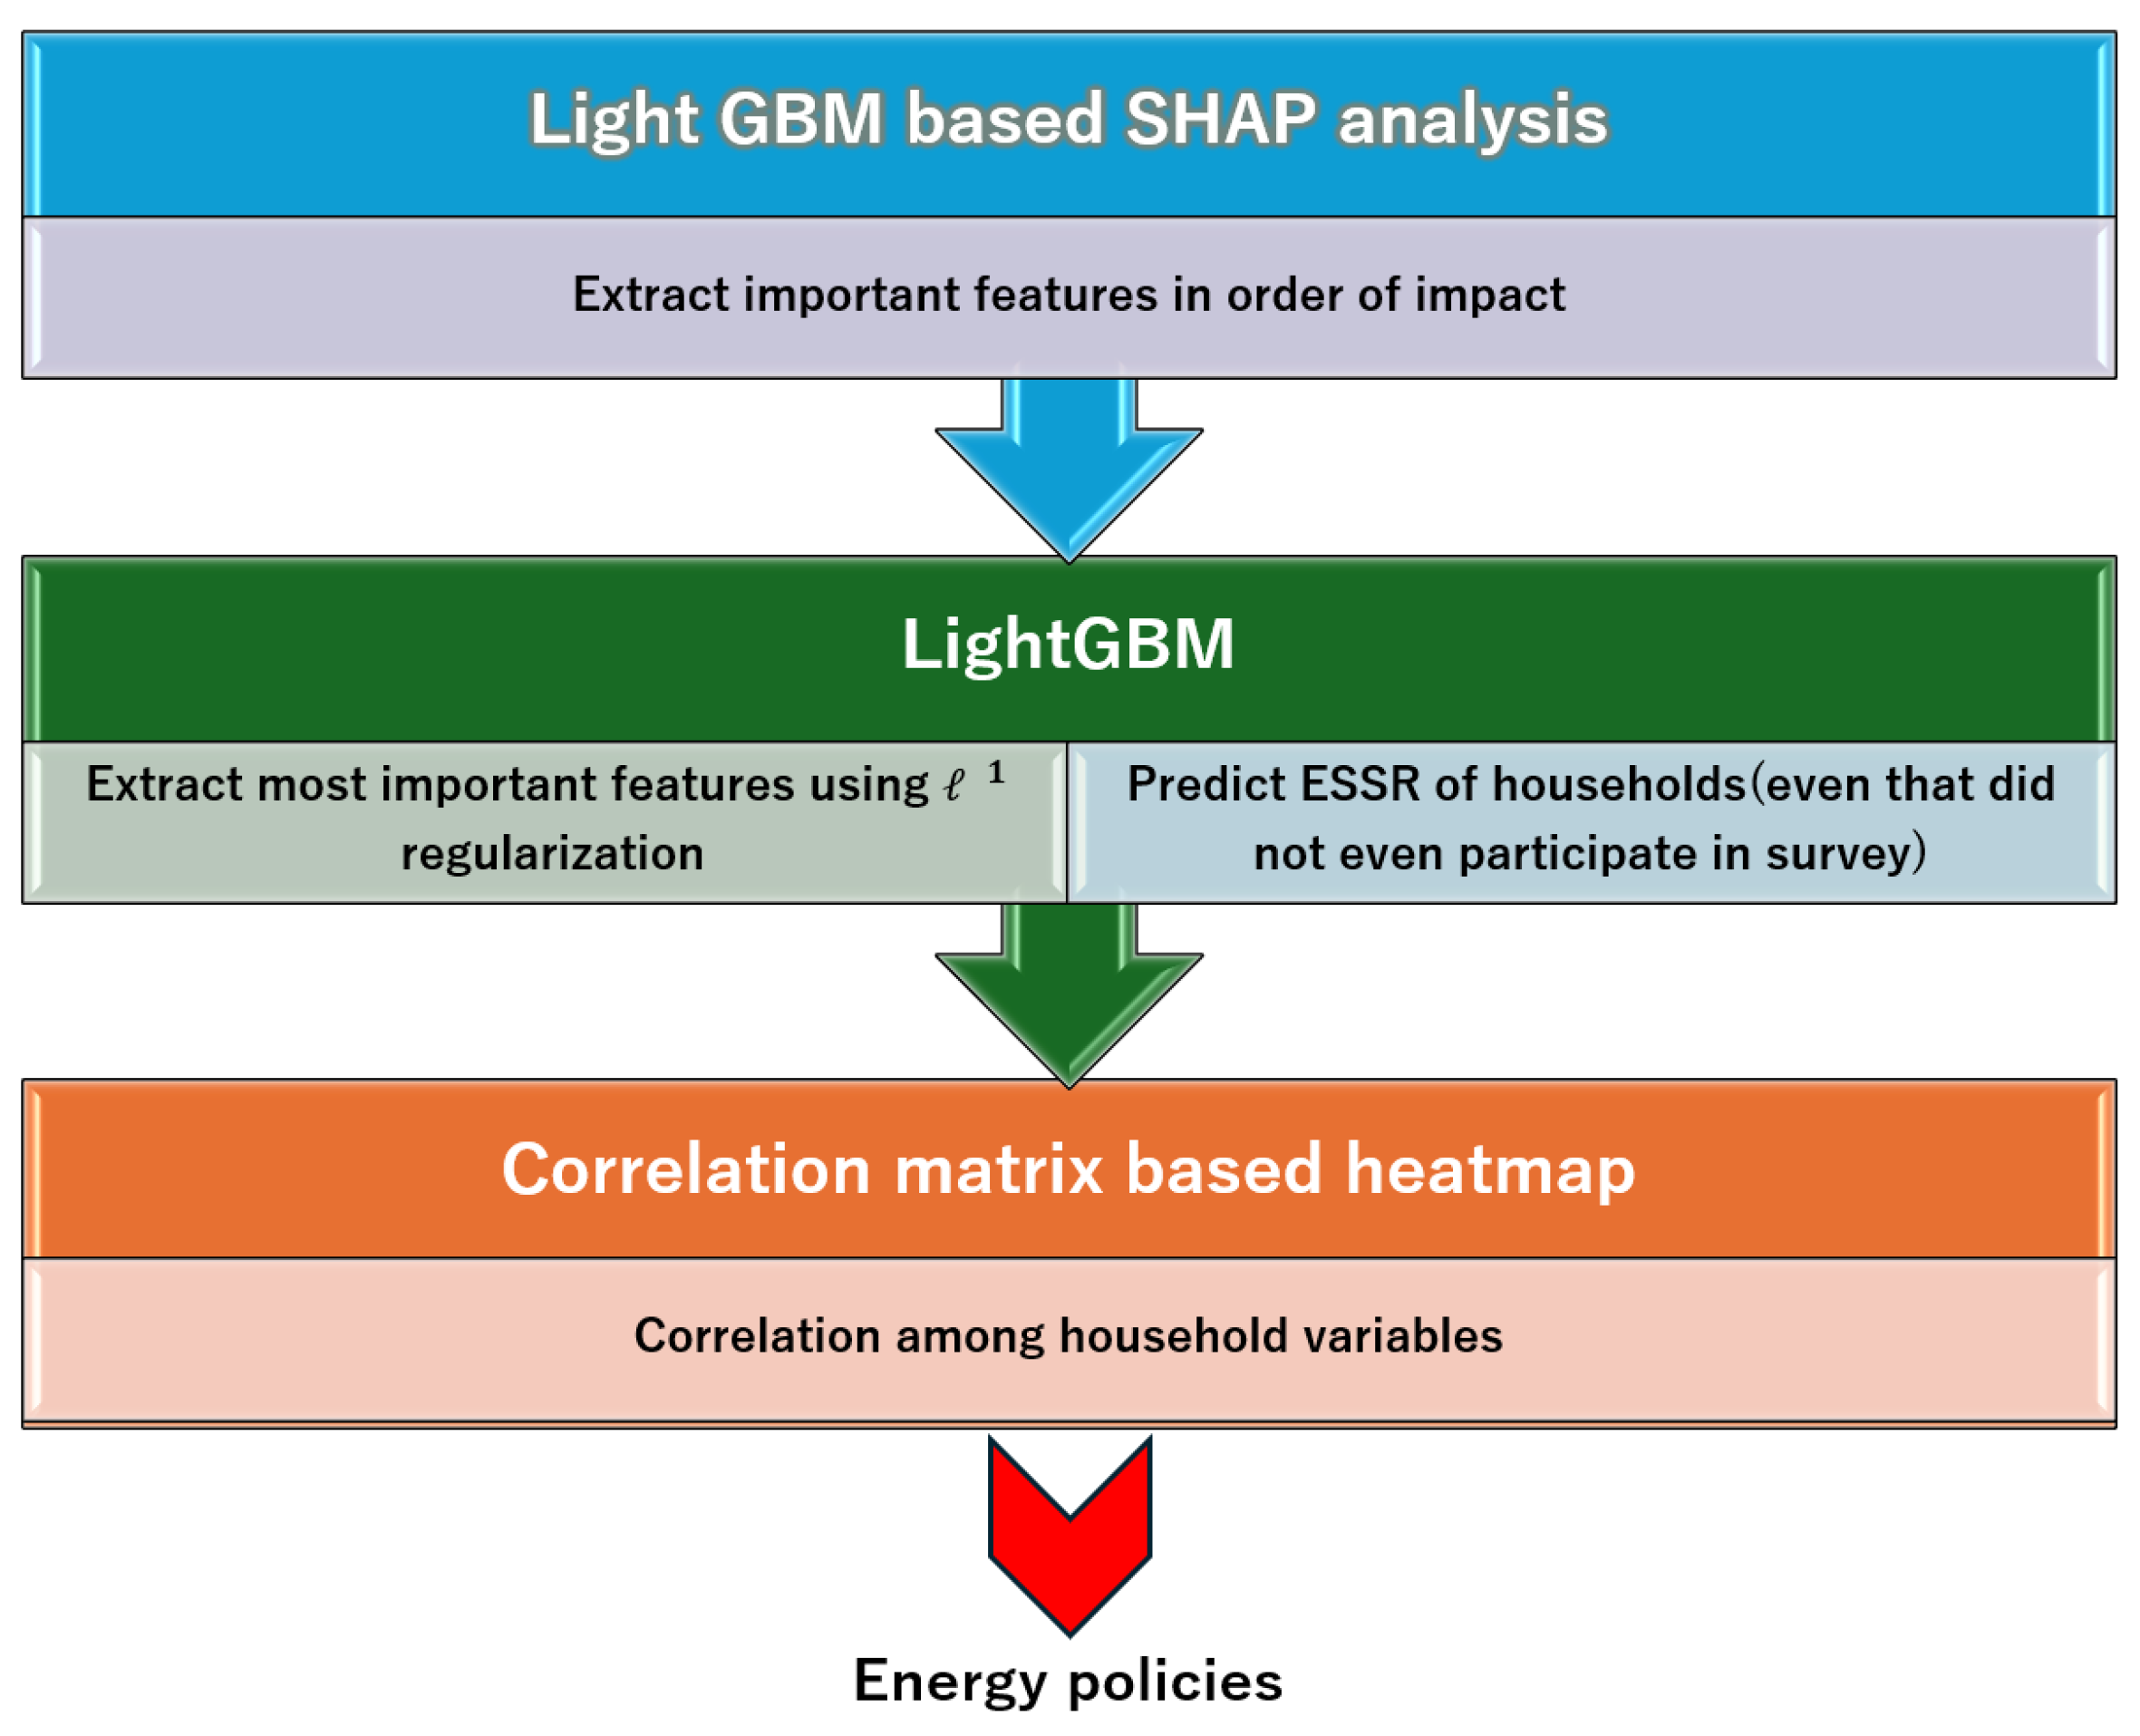
After applying LightGBM, we classified and extracted important features from one year of household energy and questionnaire survey data collected from more than 200 households in Kitakyushu City, Japan. We used regularization to discard the less important features. Furthermore, this model can forecast the zero electricity self-sufficiency rate of households omitted from the questionnaire survey while pinpointing the predominant factors influencing electricity self-sufficiency.
3. Understanding the Correlation of Various Variables in Questionnaire Survey Data: We analyzed the questionnaire survey data using a correlation matrix-based heatmap to understand the relationships among different variables.
2. Materials and Methods
2.1. Data Collection and Description
This article scrutinizes household electricity data obtained from smart meters and questionnaire survey results. The energy data was recorded every 30-minute interval over one year, from April 1, 2022, to March 31, 2023, across 578 smart homes in Kitakyushu. The household energy data consists of three types, as shown in the table below.

Table 1.
Household electrical energy data description.
| Variables | Energy type | Unit |
|---|---|---|
| Electrical energy generated from solar panels | Watt-hour | |
| Electrical energy generated from fuel cells | Watt-hour | |
| Total electrical energy consumption | Watt-hour |
Total household electrical energy consumption over 12 months of different households can be visualized in Figure 2
Each household has its unique ID number, and due to privacy concerns, we cannot disclose any information regarding household ID.
2.2. Questionnaire Survey
In our analysis, we also incorporate the findings from a 22-question questionnaire survey concerning various household characteristics, such as the number of appliances and housing type. Some key survey questions and their response options are detailed below:
-
Survey Question 1: Please tell the type of housing in which you reside. Please select the most suitable answer from the options provided:
- Single-storey detached house.
- Double-storey detached house.
- Triple-storey detached house.
- Apartment (owned).
- Apartment (rented).
-
Survey Question 2: Do you have a floor heating system installed in your residence? Please choose the most appropriate answer from the options below:
- No, it is not installed.
- Yes, electric floor heating systems are installed (e.g., all-electric homes).
- Yes, gas-powered floor heating systems with hot water circulation are installed (e.g., homes equipped with ENE-FARM, etc).
- Yes, other hot water floor heating systems are installed (e.g., homes with OM Solar panels).
- Survey Question 3: Please provide the average monthly household electricity bill in Yen.
We collected the household energy data in CSV format. For the CSV file-based questionnaire survey, we assigned numeric values ranging from 1 to 5 to each response option, corresponding to the option number for each survey question.
2.3. Data Pre-Processing
The household energy data was collected from an intervention experiment involving 578 households in Kitakyushu City. Out of these, 151 households had critical inaccuracies in their data, which we excluded from the dataset.
Among the remaining 427 households, 201 answered the survey question. We use 201 households to estimate the Electricity self-sufficiency rate (ESSR) for households using the LightGBM classifier.
2.4. Electricity Self-Sufficiency Rate
We use 201 households to calculate the Electricity self-sufficiency rate (ESSR) of households. The electricity self-sufficiency rate (ESSR) of households is a metric that indicates the proportion of a household’s total electricity consumption that is met by its own renewable energy sources, such as solar panels, fuel cells, etc. This rate provides insights into how independent a household is from the electricity grid and measures its ability to sustain its energy needs through self-generated power. Electricity self-sufficiency rate can be influenced by various factors as given below:
- Renewable Energy Sources: The use of solar panels, fuel cells, Inverters, or other renewable energy installations that can generate electricity or heat for the household.
- Energy Storage Systems: The presence of batteries or other storage systems that can store energy produced during peak production times for use during periods when production is low.
- Energy Efficiency Measures: The implementation of energy-saving practices and technologies, such as high-efficiency appliances, LED lighting, proper insulation, and smart thermostats.
- Geographical Location: The availability and effectiveness of renewable energy sources vary by location. For example, solar power is more effective in regions with abundant sunlight.
The electricity self-sufficiency rate (ESSR) for households is calculated using the following formula:
Where:
- Electricity Produced by Household (Wh): Represents the amount of electricity generated by the household’s renewable energy sources, measured in watt-hours (Wh).
- Total Electricity Consumption of Household (Wh): Denotes the total amount of electricity consumed by the household from all sources, including both self-generated electricity and any additional electricity drawn from the grid or other external sources, measured in watt-hours (Wh).
By multiplying ESSR by 100, we can express ESSR in percentage (%) too.
For the electricity self-sufficiency rate (ESSR), we use the below-mentioned equation:
where ESSR stands for electricity self-sufficiency rate and , , and , are variables described in Table 1.
2.5. Model Development
2.5.1. Feature Analysis Based on SHAP (SHapley Additive exPlanations):
We use the LightgBM-based SHAP summary plot to identify key factors that influenced the electricity self-sufficiency rate of households. The SHAP summary plot provides a visual representation of feature importance [28]. Each dot represents a Shapley value for a given feature and instance. The color coding shows the feature value, where red denotes a high value and blue signifies a low value. The features can be ranked based on their SHAP values. Features with higher SHAP values are considered more important.
A SHAP summary plot is a combination of feature importance with feature effects to provide a comprehensive overview of how features influence the model’s predictions.
SHAP values provide a unified measure of feature importance, grounded in cooperative game theory. The SHAP value for feature i is:
where:
- is the SHAP value for feature i.
- S is a subset of features excluding i.
- N is the set of all features.
- is the value function for the subset S.
The value function k is typically the expected value of the model’s output conditioned on the feature subset S.
2.5.2. LightGBM:
We used the LightGBM-based model to identify factors that affect ESSR most significantly and predict households’ electricity self-sufficiency rate.
LightGBM employs a gradient-boosting algorithm that focuses on building decision trees in a novel way. Unlike traditional gradient-boosting methods that grow trees depth-wise, LightGBM uses a leaf-wise growth strategy. This approach selects the leaf with the maximum loss reduction, leading to faster convergence and reduced memory usage [29].
By leveraging histogram-based algorithms, it bins continuous feature values into discrete bins, which speeds up training without compromising accuracy. This makes LightGBM particularly suited for tasks involving high-dimensional data or millions of instances.
Another advantage of LightGBM is its flexibility and scalability. It can be parallelized across multiple CPU cores or GPUs, making it suitable for both training and deployment in production environments where real-time predictions are required. The framework also includes built-in mechanisms for dealing with missing data and regularization techniques to prevent overfitting, ensuring robust model performance. LightGBM’s features can be summarised as below:
- Gradient-based One-Side Sampling (GOSS): LightGBM retains instances with large gradients while randomly sampling instances with smaller gradients. This approach reduces the number of data points processed and accelerates computation without significantly compromising accuracy.
- Exclusive Feature Bundling (EFB): LightGBM combines mutually exclusive features—features that rarely have non-zero values simultaneously—to decrease the total number of features and enhance training efficiency.
- Histogram-based Decision Tree Learning: LightGBM employs a histogram-based technique to determine optimal split points by converting continuous feature values into discrete bins. This method simplifies the learning process and accelerates training.
- Leaf-wise Tree Growth: In contrast to traditional level-wise tree growth methods, such as those used by XGBoost, LightGBM adopts a leaf-wise strategy. It selects the leaf with the highest delta loss for expansion, resulting in deeper trees and improved accuracy.
The objective function in LightGBM (Light Gradient Boosting Machine) is critical in guiding the model’s training process. It defines how the model’s predictions are evaluated and optimized during the iterative boosting process.
The objective function () in LightGBM involves minimizing the loss function, concerning the model’s predictions, which can be written mathematically as:
where:
- is the loss function
- is the prediction for instance i,
- is the regularization term for the k-th tree ,
- n is the no. of instances
- N is the no. of trees.
Instead of the traditional level-wise (breadth-first) tree growth used in algorithms like XGBoost, LightGBM uses a leaf-wise growth strategy for decision trees. It selects the leaf with the maximum delta loss to grow, leading to deeper trees and better accuracy as compared to other tree-based machine learning algorithms.
The gain from splitting a node is given by:
where:
- and are the sums of the gradients for the left and right splits, respectively,
- and are the sums of the second-order gradients (Hessians) for the left and right splits, respectively,
- is the regularization parameter,
- is the regularization term for the number of leaves.
The objective function in LightGBM guides the training process by balancing the model’s predictive accuracy (through the loss function) with its complexity (through regularization). By optimizing this objective function during training, LightGBM efficiently builds a boosted ensemble of trees that generalize well to unseen data while maintaining computational efficiency and scalability [30].
We use LightGBM to analyze household energy data from 201 households, aiming to pinpoint the key features that predict the electricity self-sufficiency rate.
Using the following input and output variables:
- Input variables - Survey responses (option number 1–5 for each survey question)
- Output variable - Electricity self-sufficiency rate
- Evaluation function - Mean absolute error (MAE)
We apply regularization to induce sparsity in the model’s coefficients [31]. This technique modifies the model’s loss function by adding a penalty term, which promotes the selection of only the most relevant features for prediction. We validate the performance of the LightGBM-based model using the Stratified k-fold cross-validation (cv) method. The mean absolute error, which is LightGBM’s default for regression, served as the cost function in our model.
Ultimately, we identify features of importance for predicting the electricity self-sufficiency rate of various households.
2.5.3. Correlation Matrix Based Heatmap:
To understand the relationships among household energy variables we also analyzed questionnaire survey data using the correlation heatmap matrix,
A correlation heatmap is a visual representation of the correlation matrix, where each cell in the matrix shows the correlation between two variables as explained below:
Correlation Coefficient
The correlation coefficient r between two variables x and y is calculated as:
where:
- and are individual sample points
- and are the means of x and y, respectively
- n is the number of data points
Correlation Matrix
The correlation matrix for n variables is given by:
where is the correlation coefficient between variable i and variable j.
Each cell in the matrix represents the correlation coefficient between two variables, with values ranging from -1 (strong negative correlation) to +1 (strong positive correlation). Values close to 0 indicate little to no linear relationship between the variables. The diagonal line of red cells indicates perfect self-correlation. Here’s a paraphrased version:
A correlation matrix displays the correlation coefficients between various variables, indicating the strength and direction of their linear relationships. Energy policymakers can use this matrix to pinpoint variables with strong correlations.
3. Results and Discussion
Self-sufficiency in detached houses refers to the ability of a residential property to meet its energy needs independently without relying heavily on external energy sources. Electricity is an essential component of modern households, necessary for powering various appliances and systems required for daily life. Integrating renewable energy sources such as solar panels and fuel cells into houses enhances self-sufficiency by providing alternative, sustainable sources of electricity. Solar panels harness sunlight to generate electricity, reducing dependency on conventional grid power and decreasing carbon emissions. On the other hand, fuel cells convert hydrogen or other fuels into electricity with minimal environmental impact. By installing these renewable energy systems, houses can reduce their reliance on traditional energy sources and contribute to a more sustainable and resilient energy infrastructure.
Figure 3 illustrates the electricity self-sufficiency rate for 201 households that participated in the questionnaire survey. This graph indicates that the electricity self-sufficiency rate for several households is equal to or exceeds one, suggesting that renewable energy sources can significantly improve the electricity self-sufficiency of detached houses.
From Figure 3, we can summarize that incorporating solar panels and fuel cells into detached houses profoundly impacts their electricity self-sufficiency rate. Solar panels harness solar energy to generate electricity, enabling houses to produce power and reduce reliance on the grid. Solar panels decrease electricity costs and contribute to a more sustainable energy ecosystem by diminishing dependence on non-renewable sources. Fuel cells complement solar energy by providing a reliable backup power source, particularly useful during low solar generation or grid outages. When integrated into detached houses, these renewable energy technologies enhance self-sufficiency, fostering resilience and environmental sustainability. Moreover, in the context of net-zero-energy houses (nZEH), which aim to produce as much clean electrical energy as they consume over a given period, adopting solar panels and fuel cells plays a pivotal role in achieving this goal.
Figure 4 summarizes the SHAP plot for a Light GBM (Gradient Boosting Machine) analysis of household energy data. A shape plot is a visual representation of the impact of different features on the model’s output. It illustrates the contribution of each feature to the model’s predictions.
In the SHAP plot, features are listed along the y-axis, and the corresponding SHAP values are represented by horizontal bars. The color of each bar indicates whether a feature has a negative or positive impact on the model’s output. The bar’s length represents the impact’s magnitude – longer bars indicate features with a greater influence on the model’s predictions.
Figure 4 explains the influence of different household characteristics (important features) on the model’s output (electrical self-sufficiency rate). The graph presents a spectrum of factors ranging from ’housing type’ to the ’number of electric water heaters,’ along with their corresponding effects on the model’s output, rated on a low to high impact scale. The graph utilizes a numerical scale ranging from -0.50 to 0.25 to represent SHAP values, with markers indicating each factor’s position in terms of its impact, from low to high. This visualization provides valuable insights into the complex relationships between household characteristics and their specified impacts accordingly.
As shown in Figure 4, the Mean absolute error (MAE) of the housing types, average monthly electricity bill, floor heating, electric capacity, number of washing and drying machines, fee plans, occupation of household head, total floor area, average monthly gas bill, cooking equipment, etc., are the key features that affect electricity self-sufficiency rate.
Policymakers can use this analysis to develop targeted strategies promoting energy efficiency and achieving net-zero energy homes. For example, creating guidelines and incentives for households with higher energy consumption patterns, encouraging the adoption of energy-efficient appliances, and designing tiered energy-saving programs can effectively reduce energy usage. These focused interventions not only address the immediate factors affecting electricity self-sufficiency but also contribute to broader goals of sustainability and meeting national and global energy efficiency targets.
This comprehensive analysis is a crucial resource for researchers, policymakers, and individuals interested in understanding the interplay between household dynamics and broader societal or environmental outcomes.
Figure 5 shows the importance values of the key features identified by the LightGBM classifier(after applying regularization for discarding less important features). We use Mean Absolute Error (MAE) to derive statistical features from the time series-based household energy data and questionnaire survey results. Our LightGBM-based model uses eight CVs, and the MAE is 0.21
The findings presented in Figure 5 reveal that the LightGBM-based model extracts critical features such as the mean absolute error of the type of housing (survey question 1), floor heating system (survey question 2), and average monthly electricity bill (survey question 3) are the most significant features in predicting the electricity self-sufficiency rate of households. This analysis not only identifies the factors that influence ESSR but also enables policymakers to formulate effective energy policies aimed at enhancing self-sufficiency in households. By leveraging insights derived from this model, policymakers can design intervention strategies focused on reducing carbon emissions from residential areas. Moreover, this method allows us to establish a relationship between ESSR and survey questions, thereby identifying key factors influencing household self-sufficiency. It can also predict the ESSR of households not participating in the survey. This approach represents a step forward towards fostering sustainability and resilience in the residential energy sector, aligning with broader environmental conservation goals.
Figure 6 depicts a correlation between electricity self-sufficiency rate and housing type (survey question related to the type of house). It shows the high electricity sufficiency rate for households that selected options 1 and 2, i.e., houses with roofs. These houses, which have solar panels installed on the roof, are a significant reason for the high value of the electricity sufficiency rate. From this correlation, we can infer the electricity sufficiency rate of households that did not participate in the survey.
Figure 7 depicts the correlation between the electricity self-sufficiency rate and survey questions related to the type of floor heating.
Figure 8 illustrates the relationship between ESSR and the average monthly electricity bill. From this relationship, we can also determine the average monthly electricity bill of households that did not participate in the questionnaire survey.
These findings collectively provide a robust foundation for policymakers, researchers, and stakeholders to design strategies to foster sustainability, resilience, and reduced carbon emissions in the residential energy sector. Energy policies, such as incentives, subsidies, and regulatory frameworks, further incentivize the adoption of renewable energy technologies in residential properties, accelerating the transition towards sustainable and self-sufficient housing. These policies promote innovation, investment, and consumer awareness, facilitating the widespread adoption of solar panels, fuel cells, and other clean energy solutions. In summary, the integration of solar panels and fuel cells not only enhances the electricity self-sufficiency of houses but also contributes to the realization of zero-energy houses and aligns with supportive energy policies aimed at advancing sustainability goals.
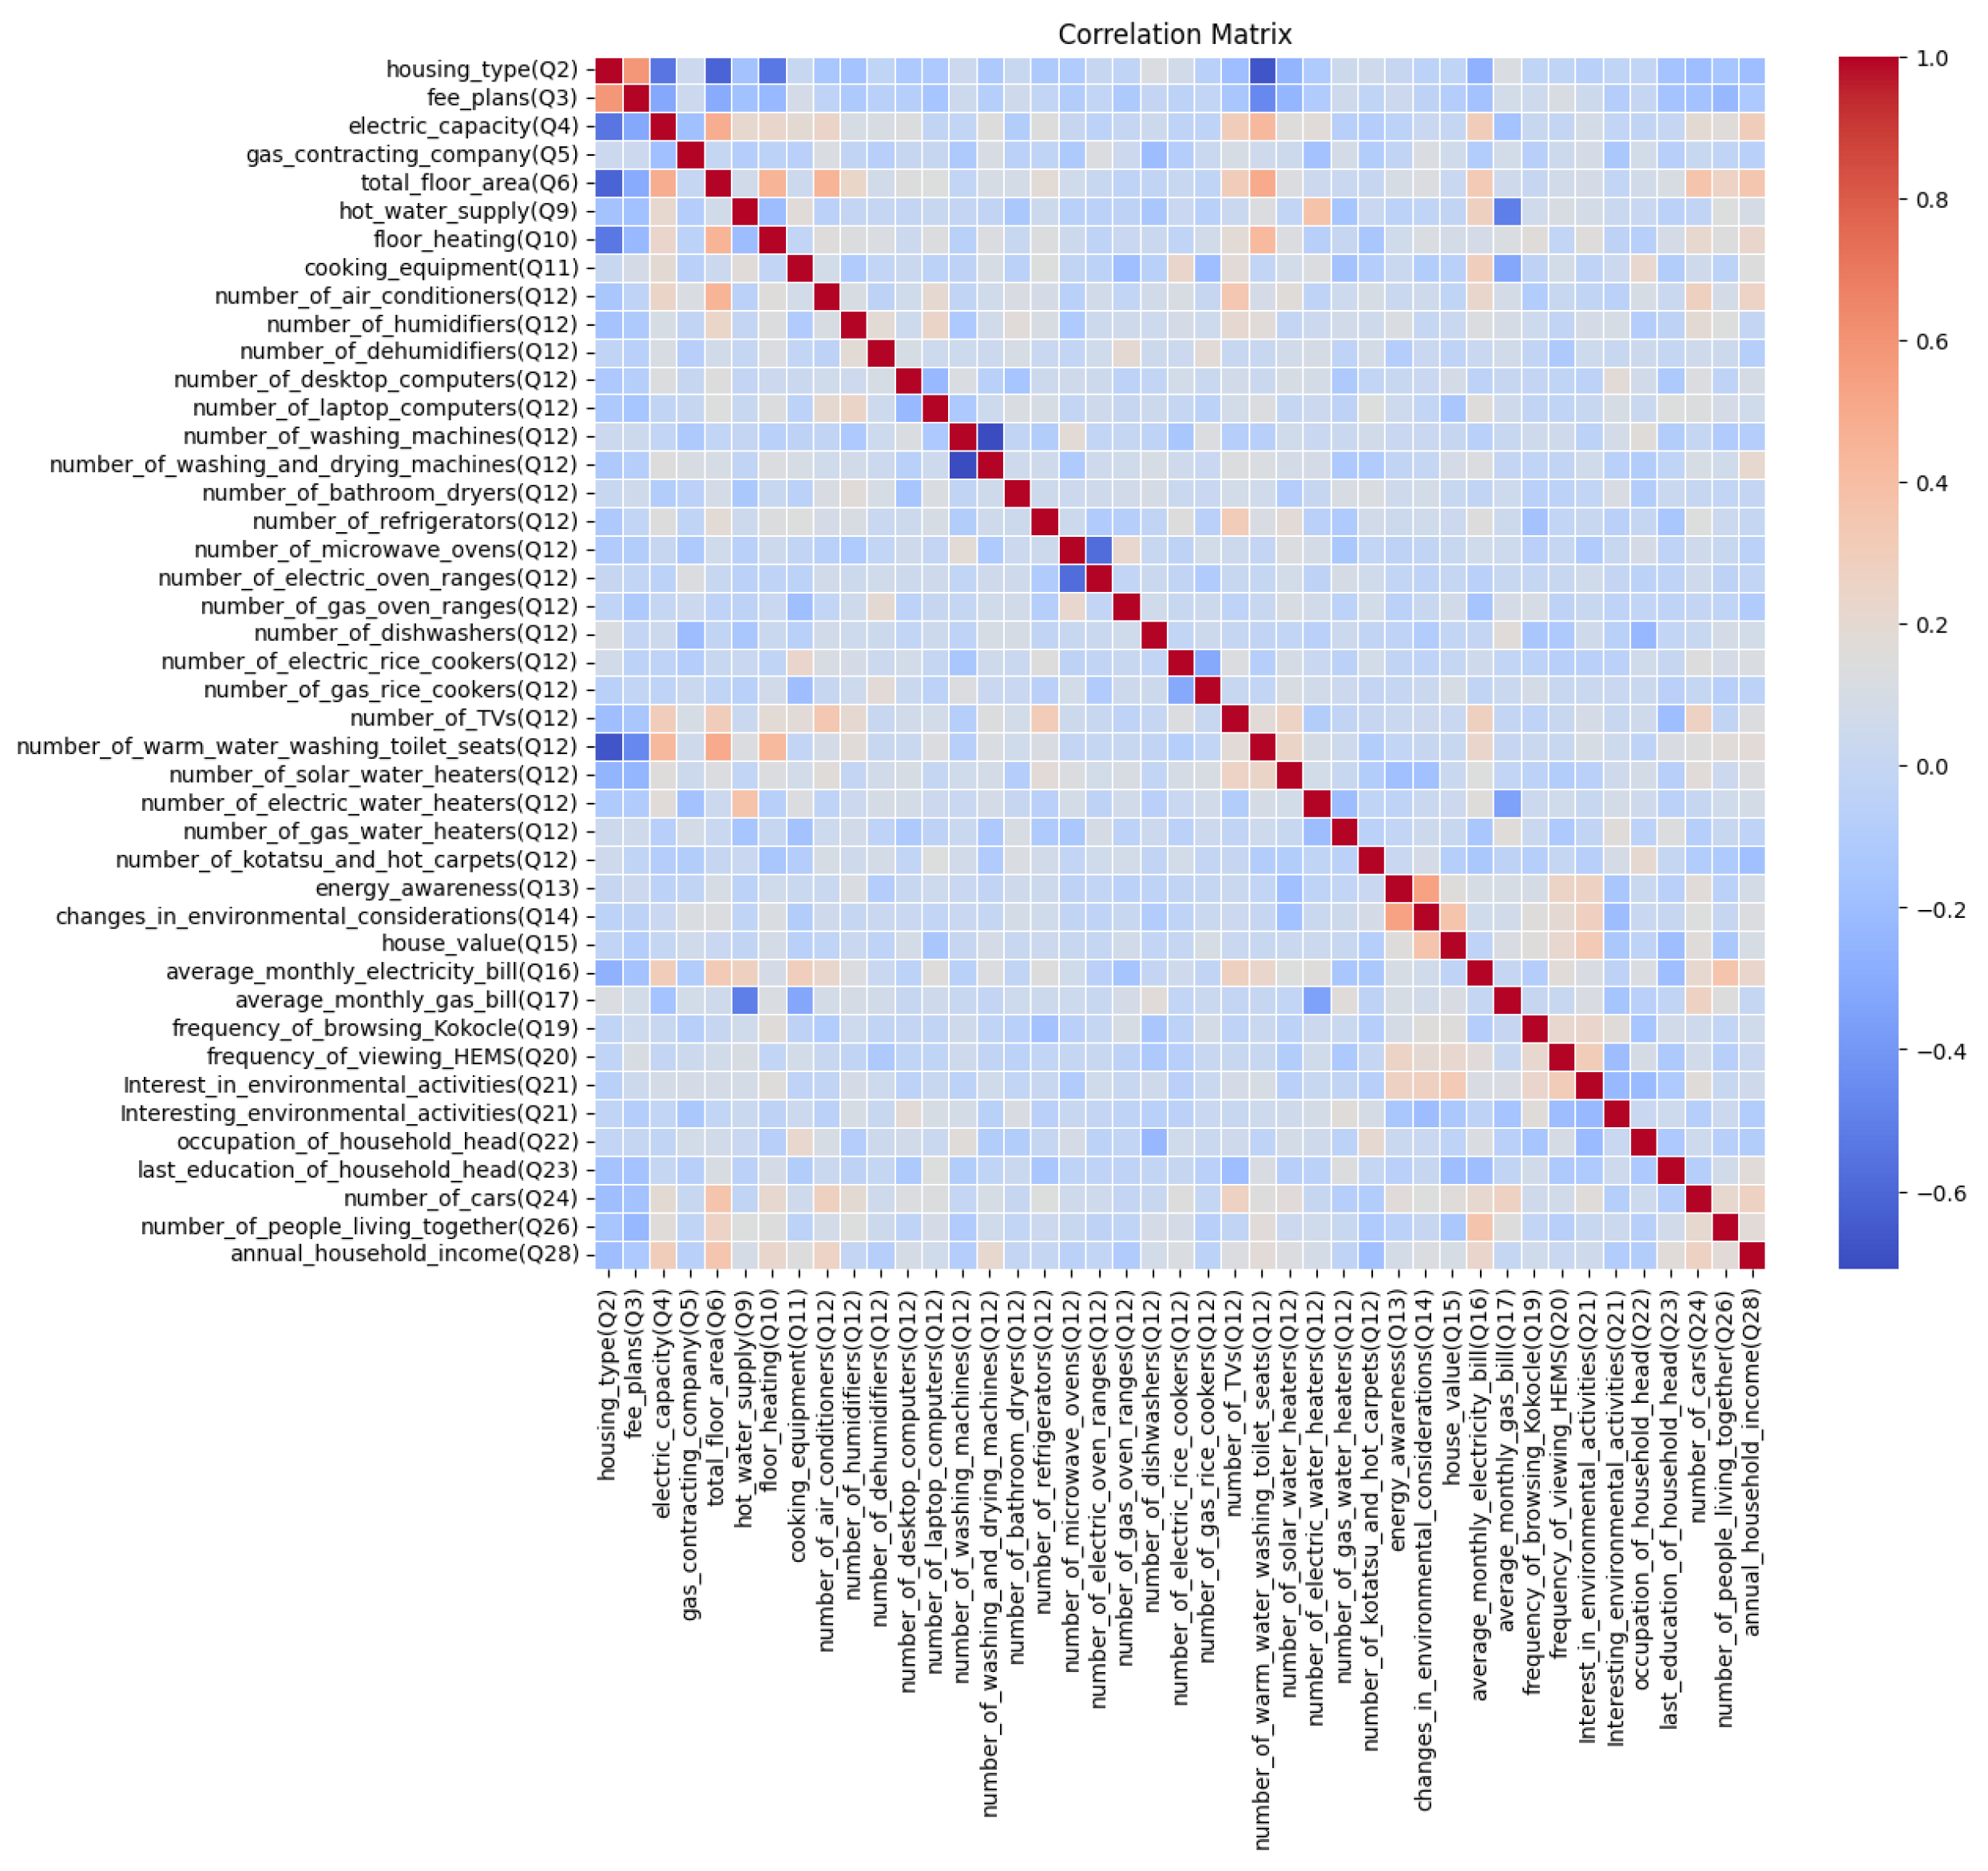
We also analyzed questionnaire survey data using a correlation matrix to understand how household characteristics are correlated with each other. Figure 9 shows the heat map for showing the correlation among different household variables.
The correlation matrix reveals several significant relationships among household energy variables, and a few of them are explained here. The data shows a negative correlation between the frequency of viewing HEMS and the number of home appliances, indicating that households using HEMS to monitor and optimize their energy usage tend to have fewer appliances. Similarly, a negative correlation between HEMS frequency and energy awareness suggests that individuals who actively monitor their energy consumption are already knowledgeable about energy usage. Similarly, a negative correlation between the monthly electricity bill and energy awareness suggests that households with higher electricity bills tend to have lower environmental awareness. Conversely, there is a positive correlation between HEMS frequency and participation in environmental activities, highlighting that those who frequently use HEMS are also more engaged in sustainability efforts. Additionally, energy awareness is positively correlated with participation in environmental activities, suggesting that informed individuals are more likely to be environmentally active.
To enhance the electricity self-sufficiency rate and achieve zero-energy homes, several strategies can be implemented based on these correlations, and policymakers can focus on both positive and negative areas. Integrated energy efficiency programs should address electricity consumption by incentivizing energy-efficient appliances, improving insulation, and promoting smart thermostats and energy management systems. The promotion of solar energy and monitoring systems should include subsidizing solar panel installations and training on using HEMS, encouraging households to monitor their energy usage regularly. Environmental awareness campaigns should target households with high energy consumption and low environmental consciousness by launching educational campaigns and offering workshops on energy conservation and sustainability. Lastly, feedback and incentive systems should encourage frequent interaction with HEMS and energy-saving behaviors by providing real-time energy consumption data and offering financial incentives or rewards for reducing energy consumption or achieving sustainability milestones. By addressing these correlations, a comprehensive approach can be developed to reduce energy consumption and promote the adoption of zero-energy homes. By addressing both the highly positive and negative correlations, these policies can create a comprehensive approach to reducing energy consumption and promoting the adoption of zero-energy homes.
4. Conclusions
This article uses SHAP, LightGBM, and a correlation matrix-based framework to analyze energy and questionnaire survey data collected from more than 200 households. We use LightGBM-based SHAP analysis to find out the key features affecting the electricity self-sufficiency rate. Policymakers can design energy policies based on the impact-wise order of key features. From SHAP analysis, we concluded that features such as floor heating, housing type, average monthly electricity bill, total floor area, etc. are crucial in determining the electricity self-sufficiency rate. Further, we used a regularization-based LightGBM model to identify the most significant features. We also calculated the electricity self-sufficiency rate (ESSR) of households who participated in the questionnaire survey, and further correlation was established between important features extracted from the LightGBM classifier and ESSR. This model can also be used to predict the ESSR of households that did not participate in the survey. Policymakers can utilize these insights to create targeted strategies promoting energy efficiency and achieving net-zero energy homes. As suggested from the heat map, encouraging the adoption of energy-efficient appliances or designing tiered energy-saving programs, etc., can effectively reduce energy usage and enhance the electricity self-sufficiency of households.
This model can help identify the critical factors significantly impacting the ESSR of residential buildings. These factors can play an important role in determining households’ energy consumption patterns, making them crucial considerations for household energy conservation strategies. Researchers can also use this LightGBM-based framework to extract important insights from various kinds of energy data (electricity, gas, water, etc.) and commercial buildings to calculate energy self-sufficiency. The findings from this research are encouraging and can be utilized to formulate effective intervention strategies aimed at achieving zero-energy houses. This article may assist policymakers in making energy-saving policies and researchers in analyzing household energy data effectively to reduce residential energy consumption.
Author Contributions
Conceptualization, N.K.S. and M.N.; methodology, N.K.S. and M.N.; software, N.K.S.; validation, N.K.S.; formal analysis, N.K.S.; investigation, N.K.S.; resources, M.N.; data curation, M.N.; writing—original draft preparation, N.K.S.; writing—review and editing, M.N.; visualization, N.K.S. and M.N.; supervision, M.N.; project administration, M.N.; funding acquisition, M.N. All authors have read and agreed to the published version of the manuscript.
Funding
This work was partly supported by JSPS KAKENHI Grant Nos. 23H01436, 22H00512, 22H01653, 22KK0155, and also the Japanese Ministry of Environment.
Institutional Review Board Statement
Not applicable.
Informed Consent Statement
Not applicable.
Data Availability Statement
Data is unavailable due to privacy restrictions.
Acknowledgments
We would like to express our gratitude to Yoshiaki Ushifusa and Takuya Fukushima for their invaluable support.
Conflicts of Interest
The authors declare no conflict of interest.
Abbreviations
The following abbreviations are used in this manuscript:
| SHAP | SHapley Additive exPlanations |
| HEMS | Home energy management systems |
| nZEHs | Net Zero energy houses |
| LightGBM | Light Gradient boosting machine |
| ESSR | Electricity self-sufficiency rate |
| MAE | Mean absolute error |
| RES | Renewable energy resources |
| ANN | Artificial neural network |
| FFNN | Feedforward Neural Networks |
References
- Zhang, X.; Zhang, H.; Yuan, J. Economic growth, energy consumption, and carbon emission nexus: fresh evidence from developing countries. Environ. Sci. Pollut. Res. 2019, 26 (25), 26367–26380. [CrossRef] [PubMed]
- Chanthakett, A.; Arif, M. T.; Khan, M. M. K.; Subhani, M. Hydrogen production from municipal solid waste using gasification method. In Hydrogen Energy Conversion and Management; Elsevier, 2024; pp 103–131. [CrossRef]
- Singh, N. K.; Fukushima, T.; Nagahara, M. Gradient Boosting Approach to Predict Energy-Saving Awareness of Households in Kitakyushu. Energies 2023, 16 (16), 5998. [CrossRef]
- High Efficiency Plants and Building Integrated Renewable Energy Systems. In Handbook of Energy Efficiency in Buildings; Elsevier, 2019; pp 441–595. [CrossRef]
- Naterer, G. F.; Dincer, I.; Zamfirescu, C. Hydrogen Production from Nuclear Energy; Springer London: London, 2013b. [CrossRef]
- Yoro, K. O.; Daramola, M. O. CO2 emission sources, greenhouse gases, and the global warming effect. In Advances in Carbon Capture; Elsevier, 2020; pp 3–28. [CrossRef]
- Nejat, P.; Jomehzadeh, F.; Taheri, M.M.; Gohari, M.; Abd Majid, M.Z. A global review of energy consumption, CO2 emissions and policy in the residential sector (with an overview of the top ten CO2 emitting countries). Renew. Sustain. Energy Rev. 2015, 43, 843–862. [CrossRef]
- Tian, J.; Yu, L.; Xue, R.; Zhuang, S.; Shan, Y. Global low-carbon energy transition in the post-COVID-19 era. Appl. Energy 2022b, 307, 118205. [CrossRef] [PubMed]
- Singh, N. K.; Fukushima, T.; Nagahara, M. Gradient Boosting Approach to Predict Zero Carbon Achievement of Households in Kitakyushu. In 2023 9th International Conference on Control, Decision and Information Technologies (CoDIT), Rome, Italy, July 3–6, 2023; IEEE, 2023. [CrossRef]
- Santamouris, M.; Cartalis, C.; Synnefa, A.; Kolokotsa, D. On the impact of urban heat island and global warming on the power demand and electricity consumption of buildings—A review. Energy Build. 2015, 98, 119–124. [CrossRef]
- Dong, K.; Hochman, G.; Timilsina, G. R. Do drivers of CO2 emission growth alter overtime and by the stage of economic development? Energy Policy 2020, 140, 111420. [CrossRef]
- Schleussner, C.-F.; Rogelj, J.; Schaeffer, M.; Lissner, T.; Licker, R.; Fischer, E. M.; Knutti, R.; Levermann, A.; Frieler, K.; Hare, W. Science and policy characteristics of the Paris Agreement temperature goal. Nat. Clim. Chang. 2016, 6 (9), 827–835. [CrossRef]
- Moodley, P.; Trois, C. Lignocellulosic biorefineries: the path forward. In Sustainable Biofuels; Elsevier, 2021; pp 21–42. [CrossRef]
- Guzović, Z.; Duić, N.; Piacentino, A.; Markovska, N.; Mathiesen, B. V.; Lund, H. Paving the way for the Paris Agreement: Contributions of SDEWES science. Energy 2022, 125617. [CrossRef]
- Ashouri, M.; Haghighat, F.; Fung, B. C. M.; Lazrak, A.; Yoshino, H. Development of building energy saving advisory: A data mining approach. Energy Build. 2018, 172, 139–151. [CrossRef]
- Colmenar-Santos, A.; Campíñez-Romero, S.; Pérez-Molina, C.; Castro-Gil, M. Profitability analysis of grid-connected photovoltaic facilities for household electricity self-sufficiency. Energy Policy 2012, 51, 749–764. [CrossRef]
- Ramirez Camargo, L.; Nitsch, F.; Gruber, K.; Dorner, W. Electricity self-sufficiency of single-family houses in Germany and the Czech Republic. Appl. Energy 2018, 228, 902–915. [CrossRef]
- Li, S.-Y.; Han, J.-Y. The impact of shadow covering on the rooftop solar photovoltaic system for evaluating self-sufficiency rate in the concept of nearly zero energy building. Sustain. Cities Soc. 2022, 80, 103821. [CrossRef]
- Harke, F.; Otto, P. Solar Self-Sufficient Households as a Driving Factor for Sustainability Transformation. Sustainability 2023, 15, 2734. [CrossRef]
- Nishimura, A., Tanikaga, S., Hirota, M., & Hu, E. (2018). Energy characteristics of an integrated power generation system with photovoltaic and fuel cell. Smart Grid and Renewable Energy, 9(4), 57-73. [CrossRef]
- Bruni, G., Cordiner, S., & Mulone, V. (2014). Domestic distributed power generation: Effect of sizing and energy management strategy on the environmental efficiency of a photovoltaic-battery-fuel cell system. Energy, 77, 133-143. [CrossRef]
- Ozcan, M. (2018). The role of renewables in increasing Turkey’s self-sufficiency in electrical energy. Renewable and Sustainable Energy Reviews, 82, 2629-2639. [CrossRef]
- Beckel, C.; Sadamori, L.; Staake, T.; Santini, S. Revealing household characteristics from smart meter data. Energy 2014, 78, 397–410. [CrossRef]
- Edwards, R. E., New, J., & Parker, L. E. (2012). Predicting future hourly residential electrical consumption: A machine learning case study. Energy and Buildings, 49, 591-603. [CrossRef]
- Thakur, A., Shukla, K. A., Choudhary, A., & Atrey, J. (2023, July). Predictive Analysis of Energy Consumption and Electricity Demand Using Machine Learning Techniques. In 2023 International Conference on Smart Systems for applications in Electrical Sciences (ICSSES) (pp. 1-6). IEEE.
- Chou, J.-S.; Tran, D.-S. Forecasting energy consumption time series using machine learning techniques based on usage patterns of residential householders. Energy 2018, 165, 709–726. [CrossRef]
- Wang, B., Wang, Y., Qin, K., & Xia, Q. (2018, June). Detecting transportation modes based on LightGBM classifier from GPS trajectory data. In 2018 26th International conference on geoinformatics (pp. 1-7). IEEE.
- Nohara, Y.; Matsumoto, K.; Soejima, H.; Nakashima, N. Explanation of machine learning models using shapley additive explanation and application for real data in hospital. Comput. Methods Programs Biomed. 2022, 214, 106584. [CrossRef]
- Ke, G., Meng, Q., Finley, T., Wang, T., Chen, W., Ma, et al & Liu, T. Y. (2017). Lightgbm: A highly efficient gradient boosting decision tree. Advances in neural information processing systems, 30.
- Wang, Y.; Wang, T. Application of Improved LightGBM Model in Blood Glucose Prediction. Appl. Sci. 2020, 10 (9), 3227. [CrossRef]
- Nagahara, M. Sparsity Methods for Systems and Control; now Publishers: Norwell, MA, USA, 2020.
Figure 2.
Total electrical energy consumption.
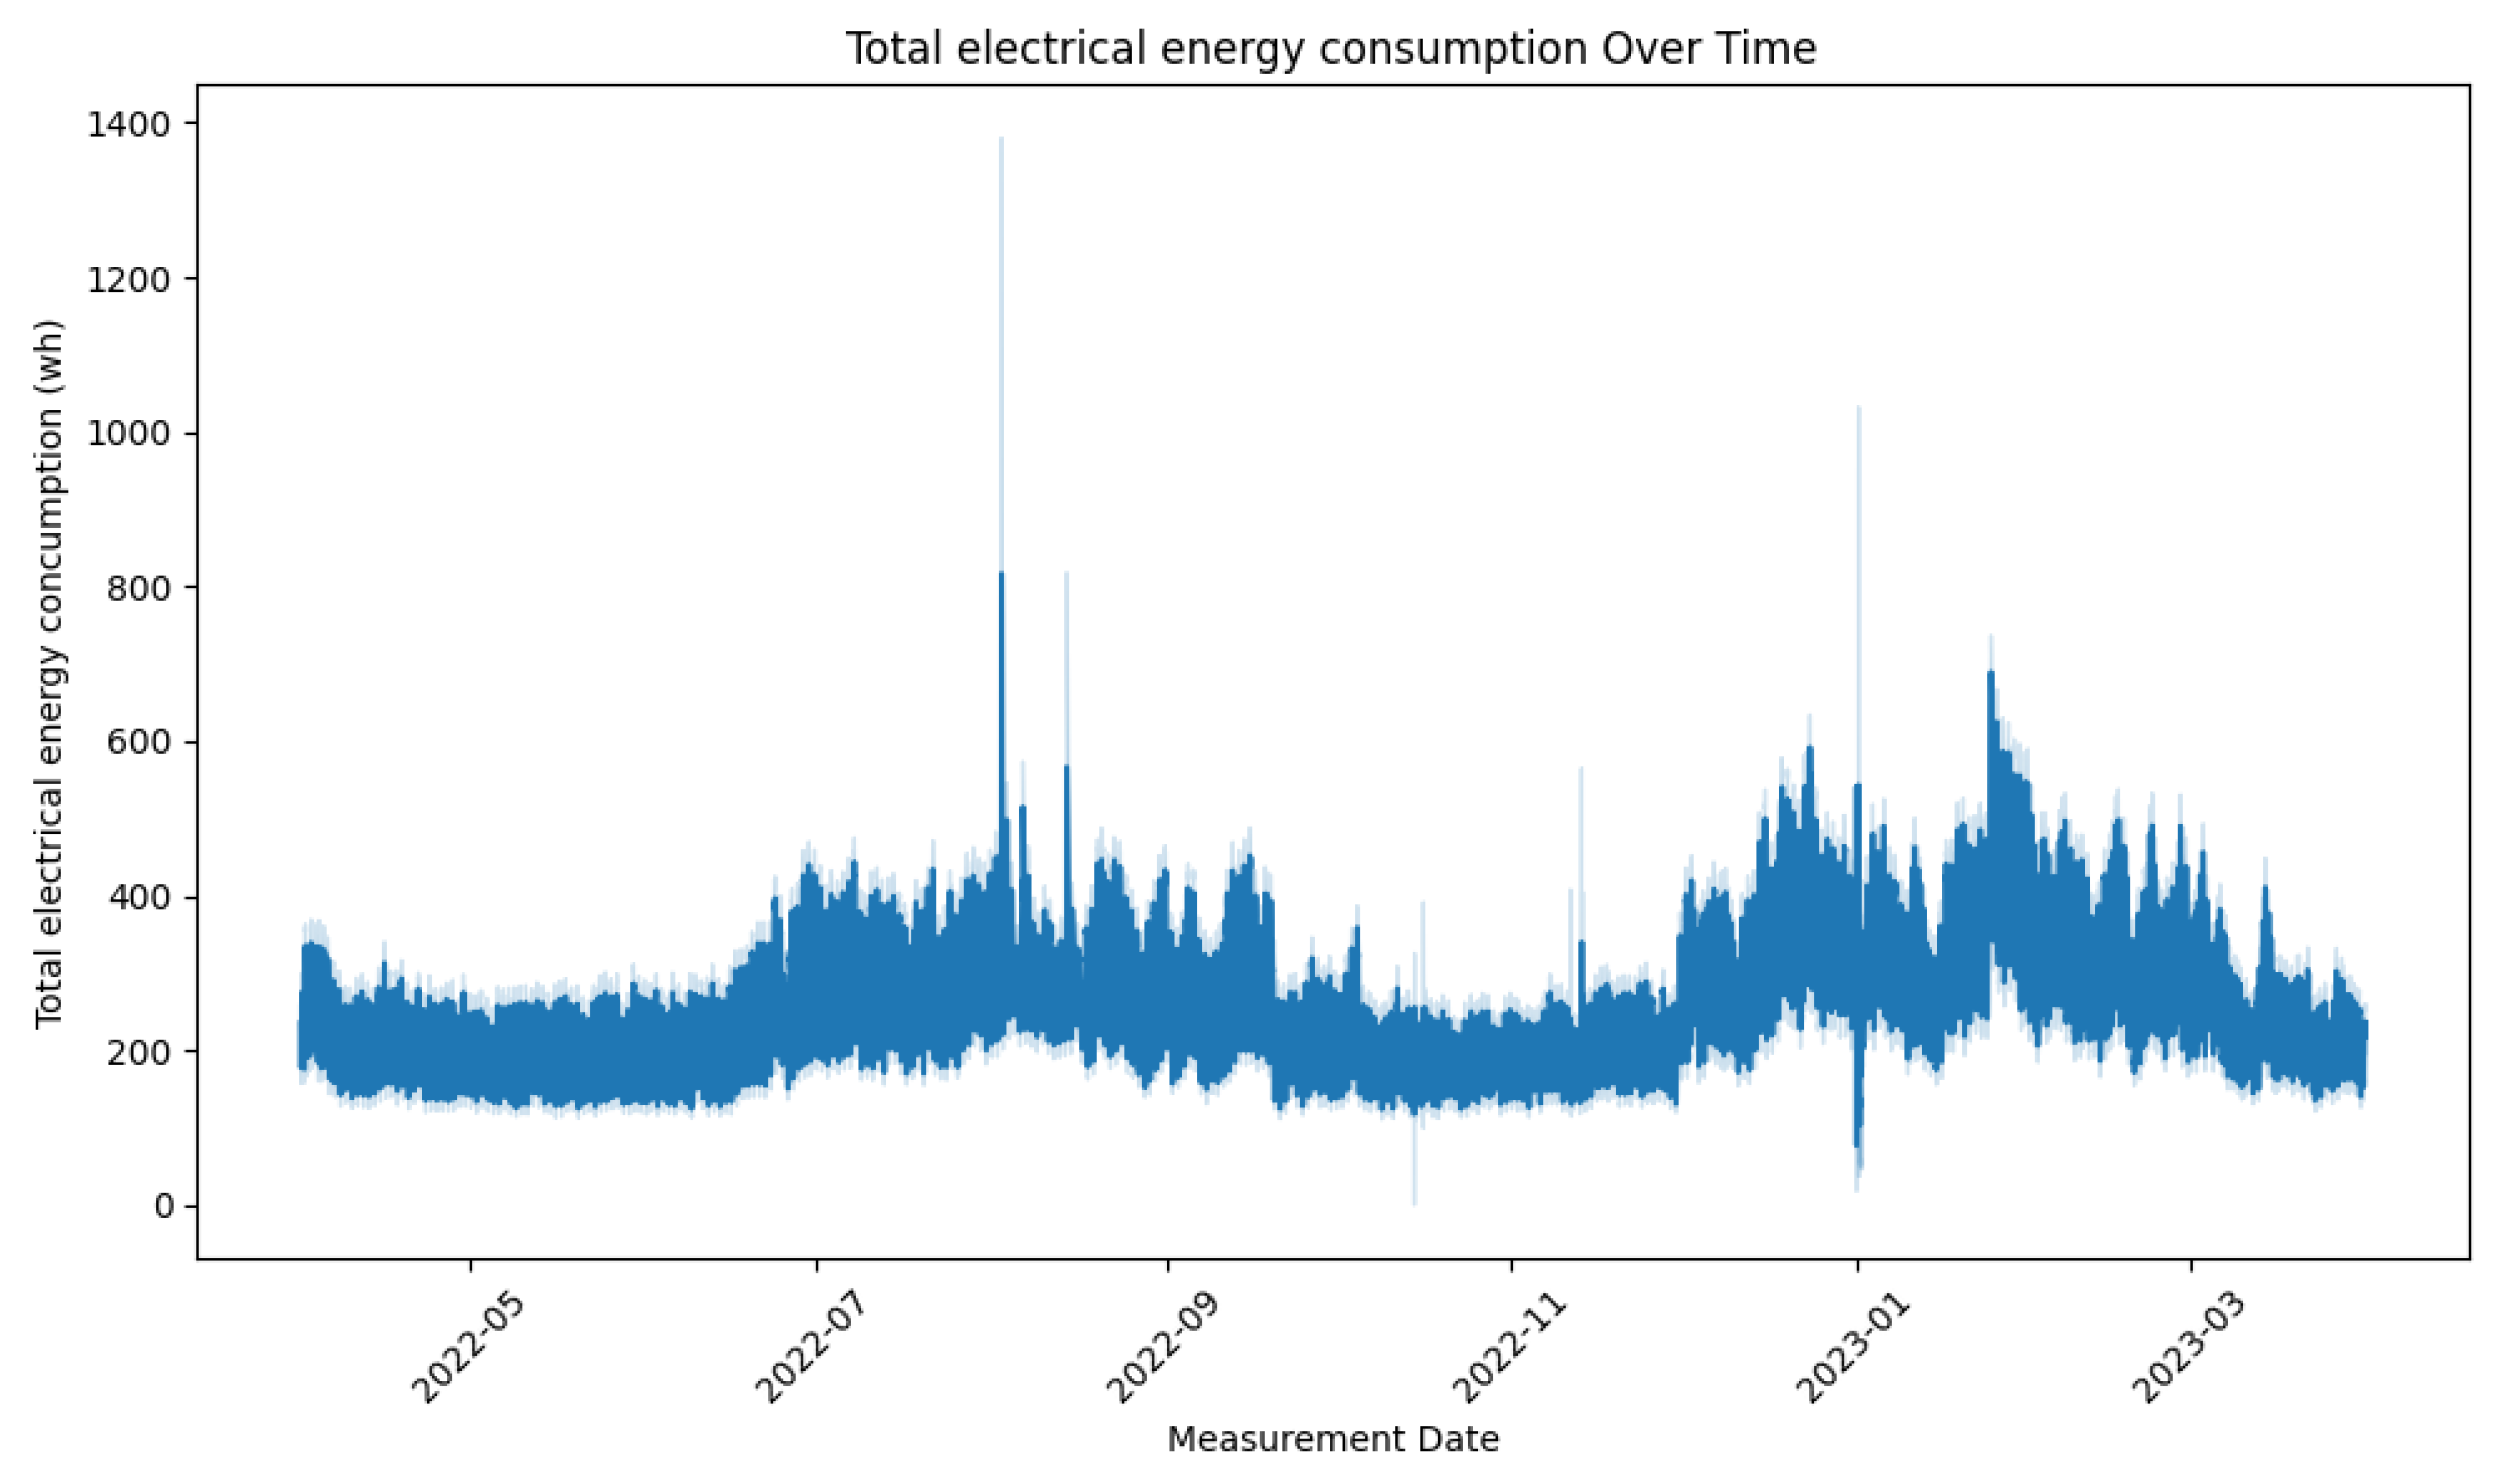
Figure 3.
Electricity self-sufficiency rate (ESSR).
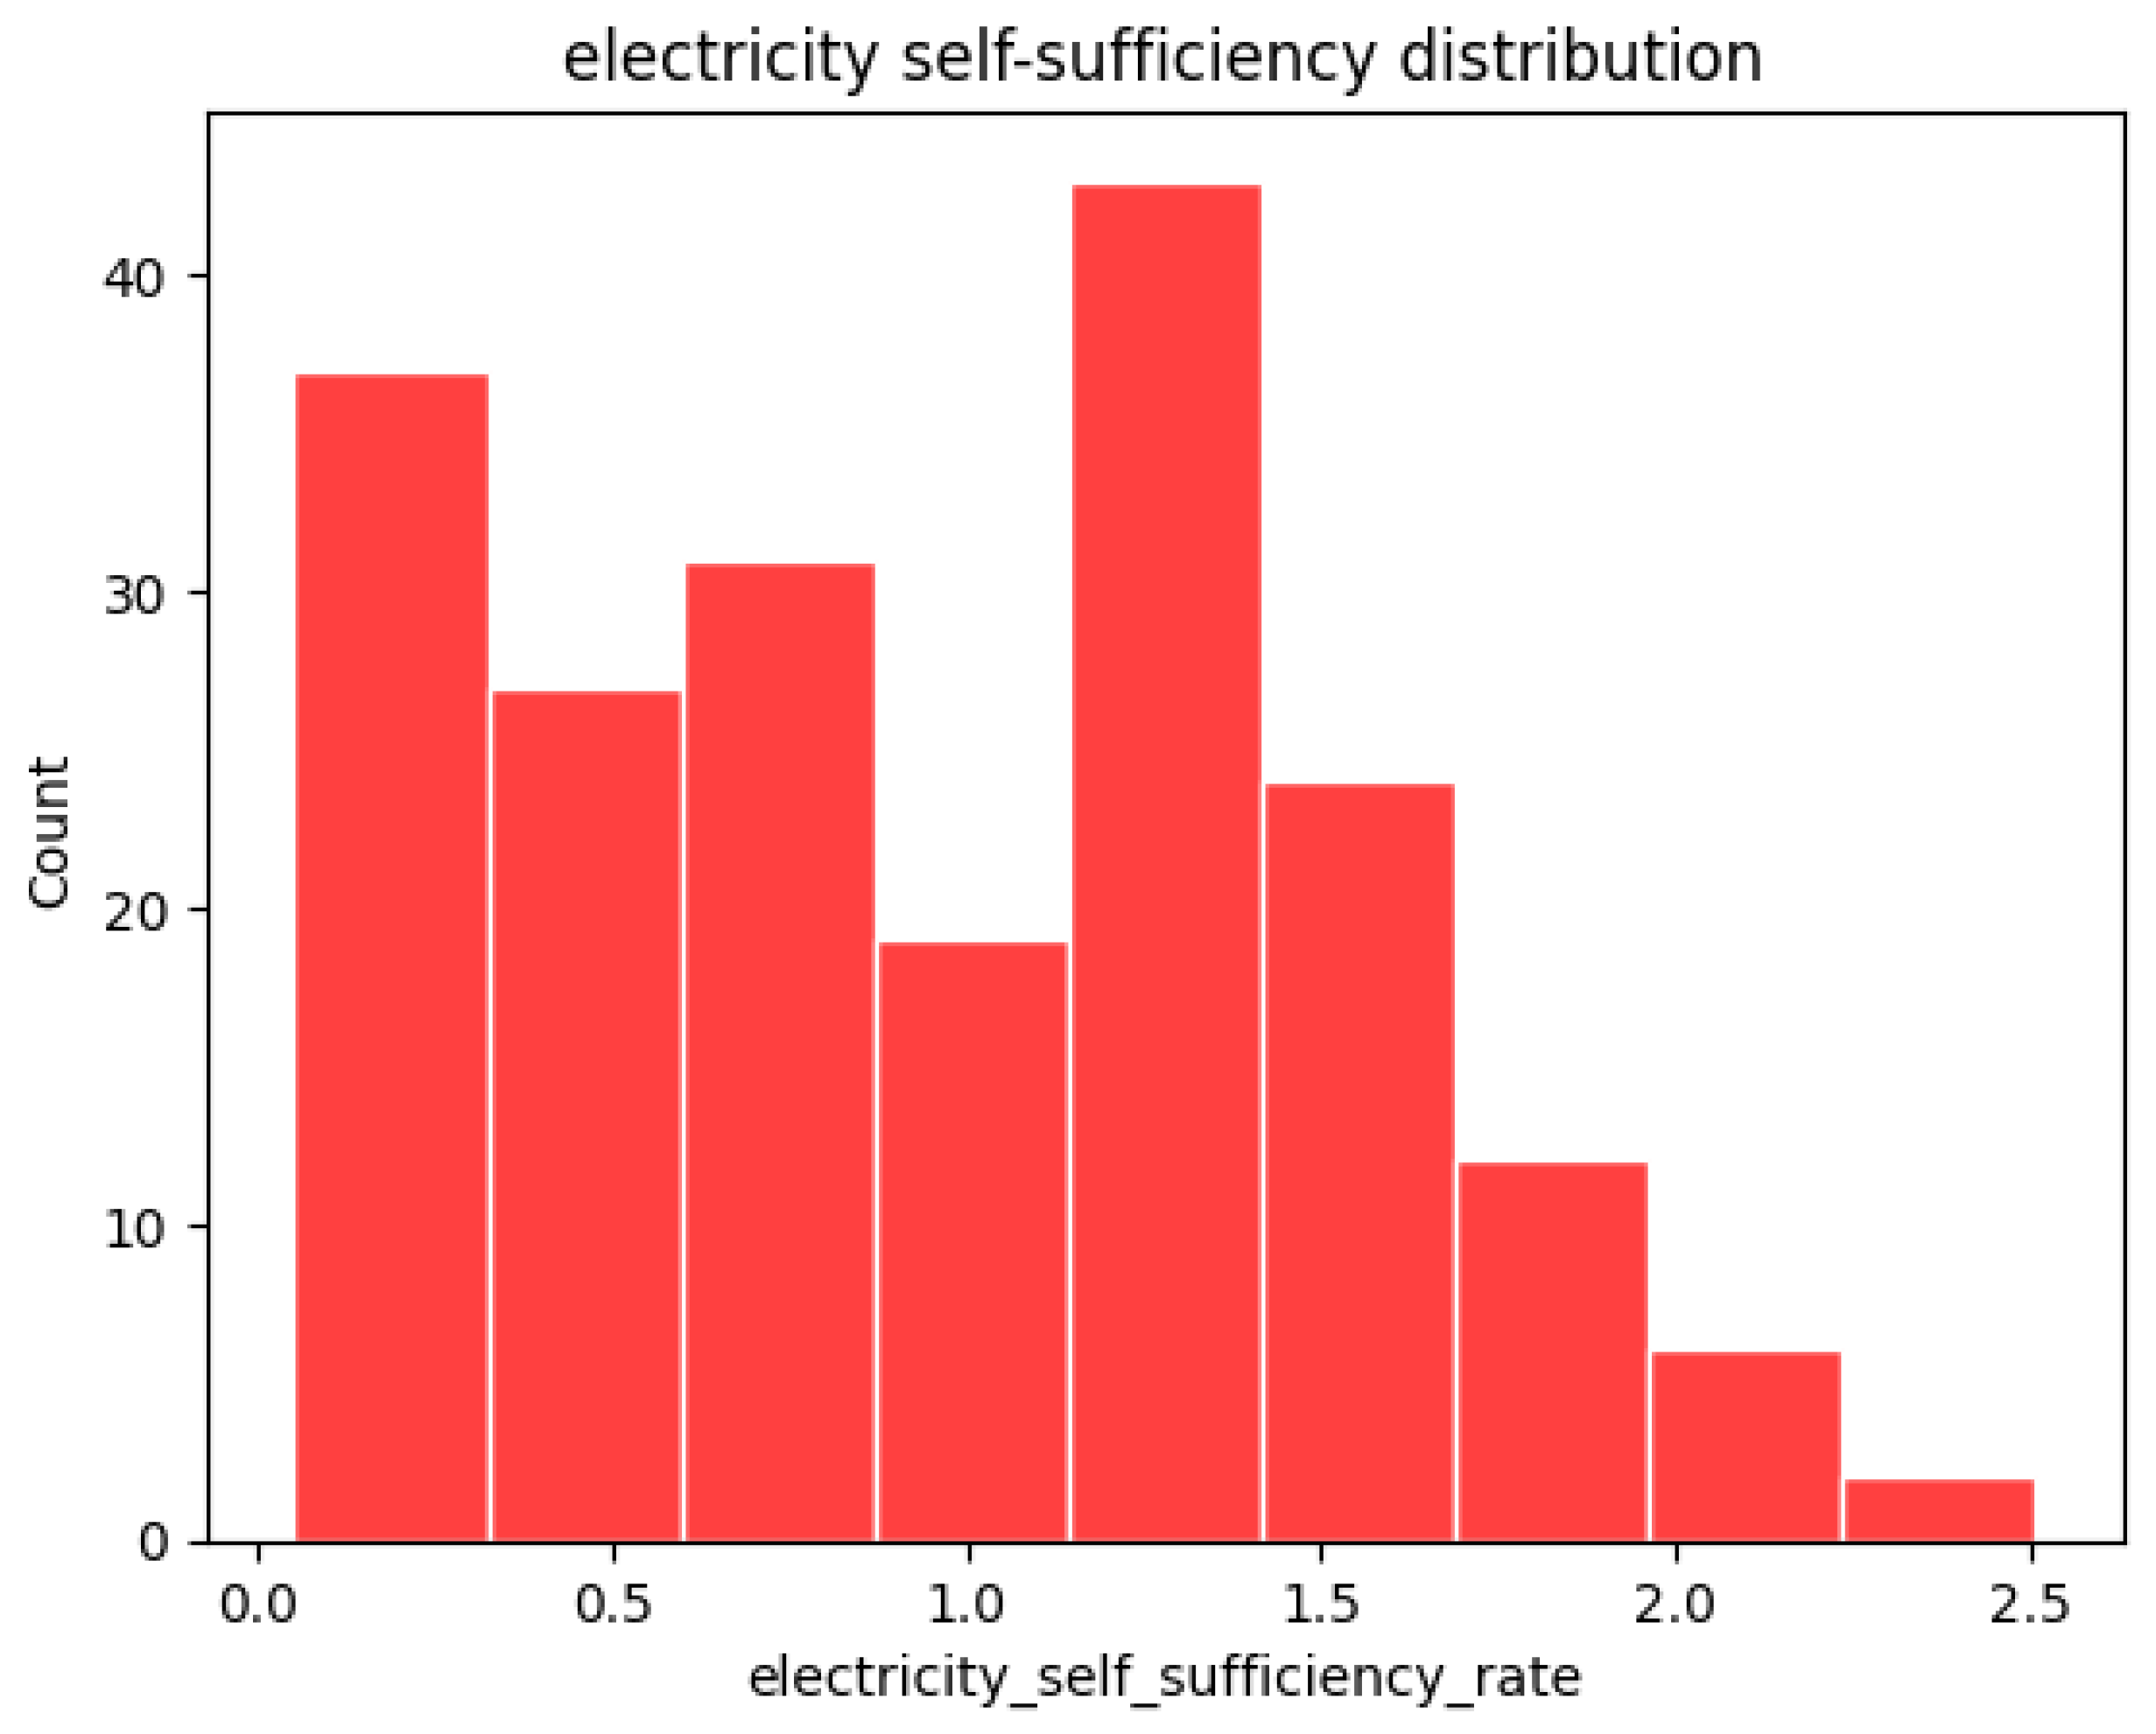
Figure 4.
LightGBM based SHAP plot.
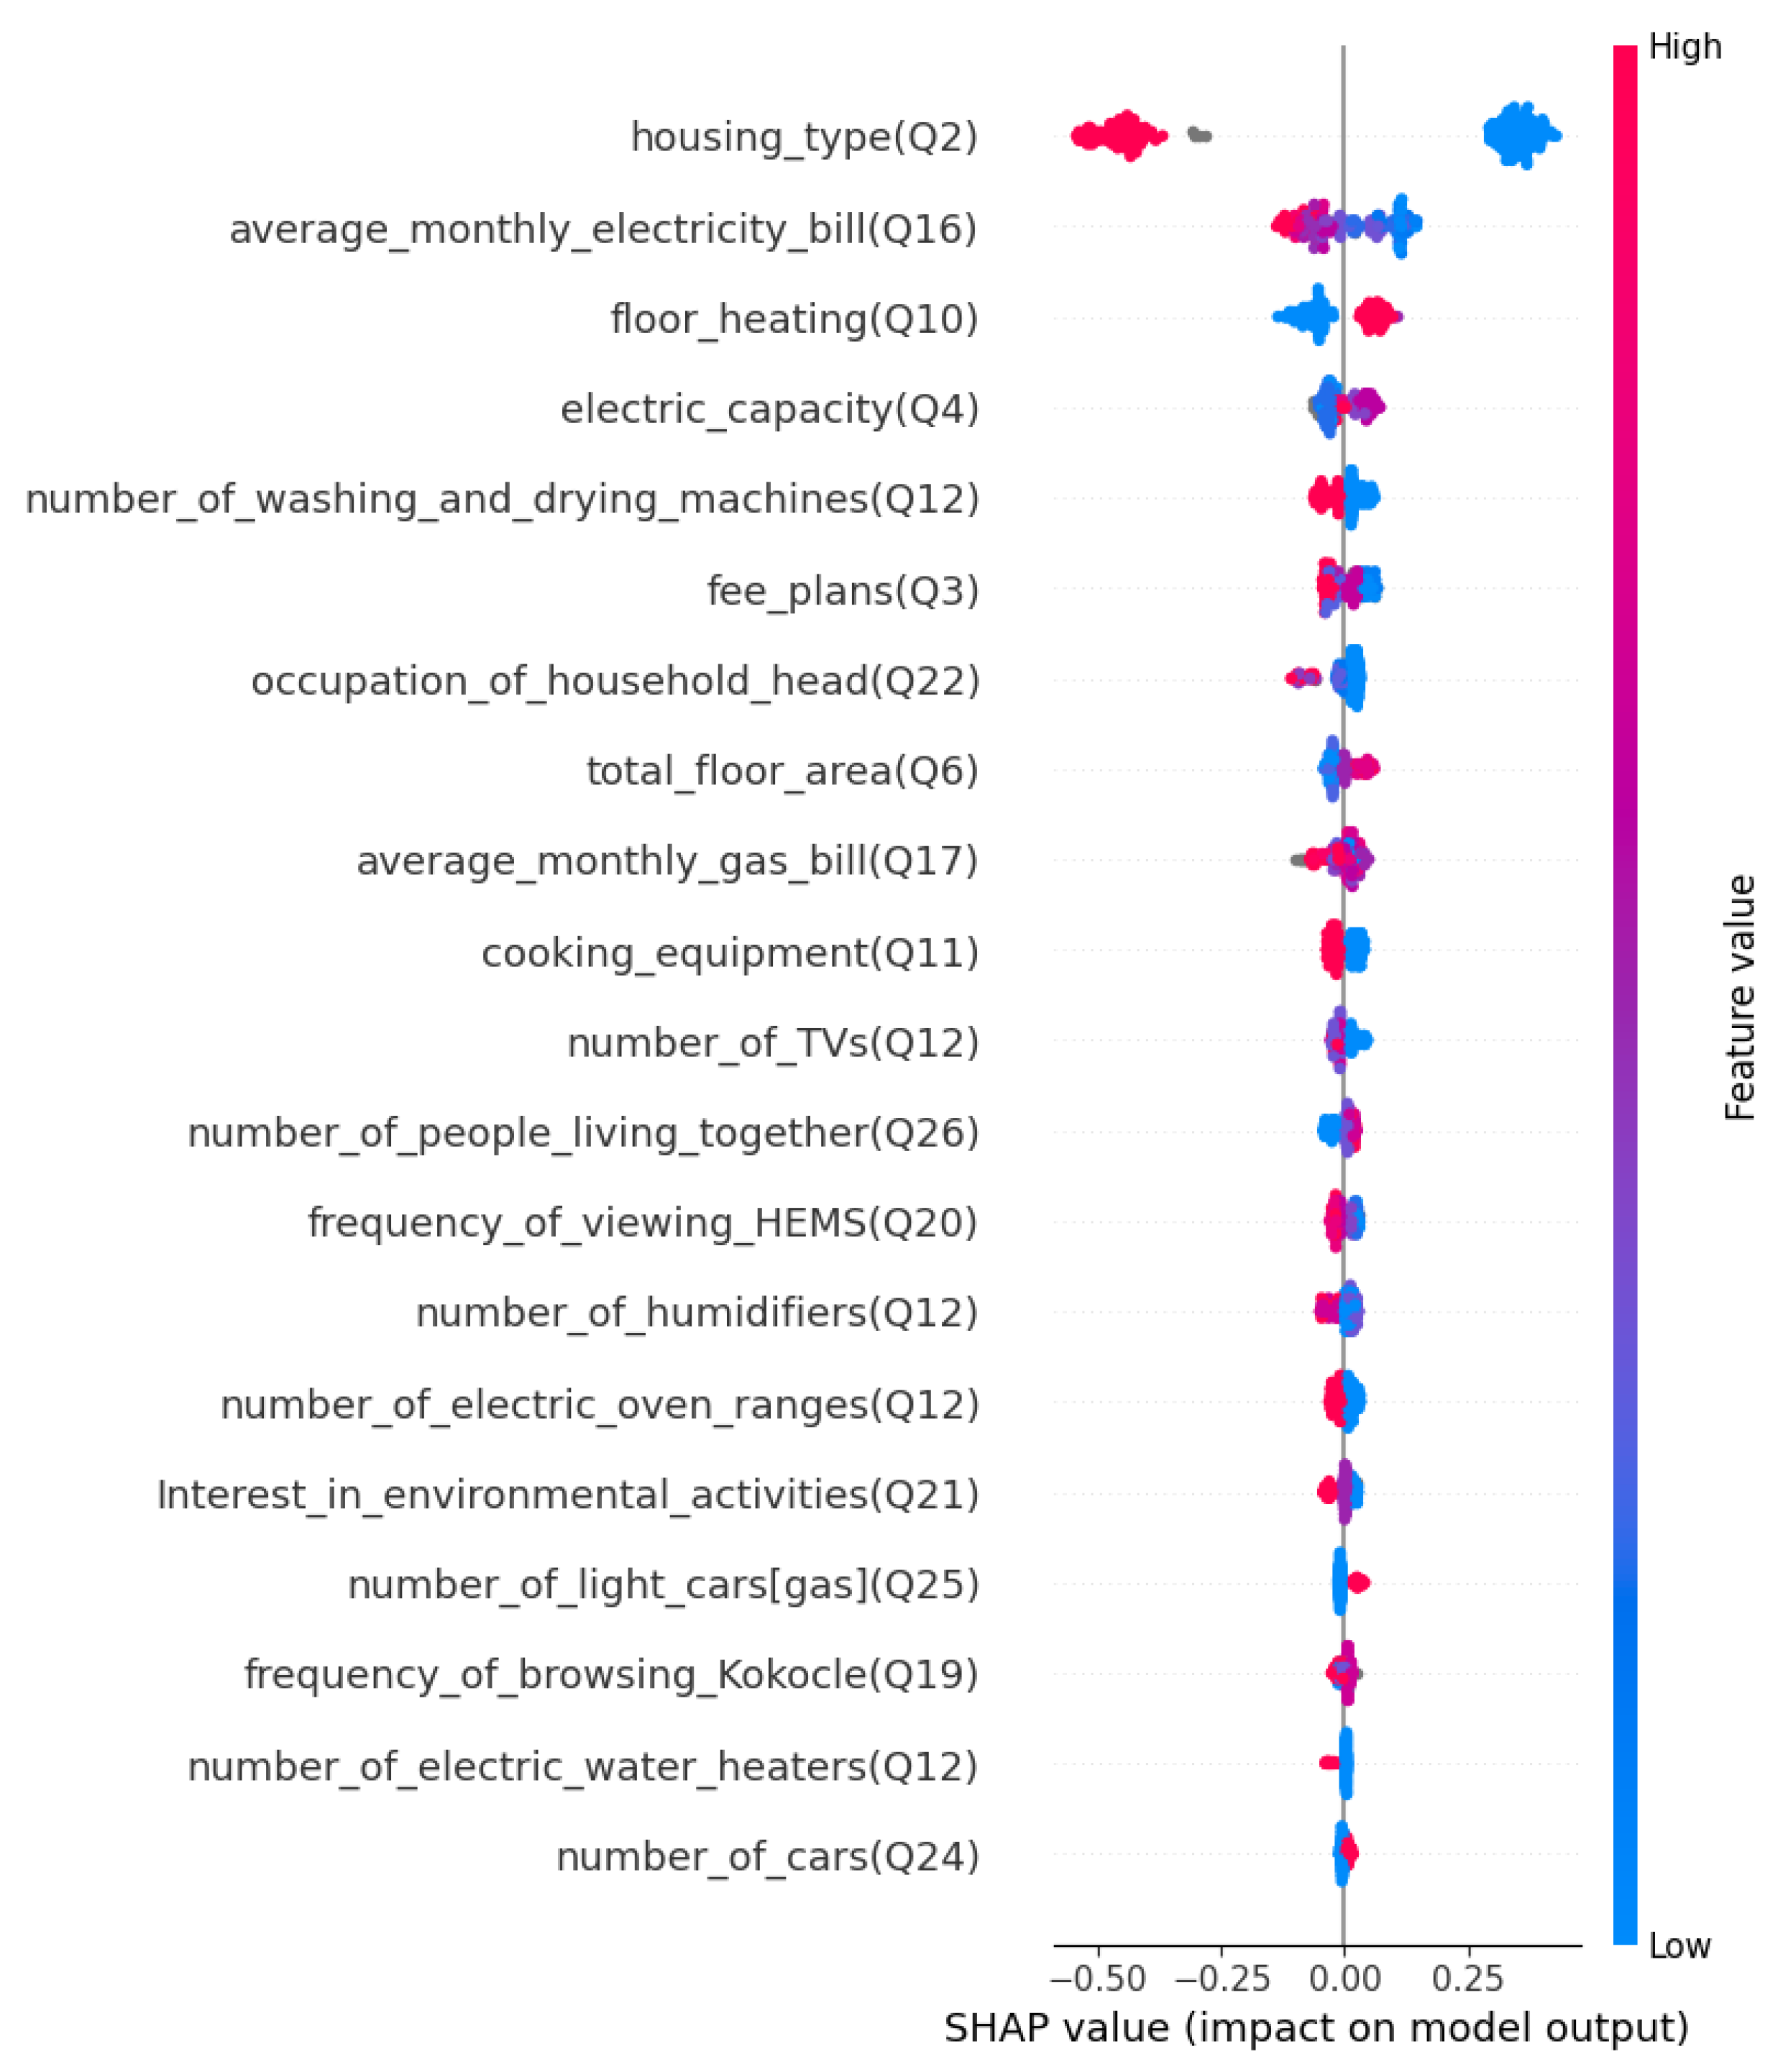
Figure 5.
Extraction of the most importance features through LightGBM ( regularization).
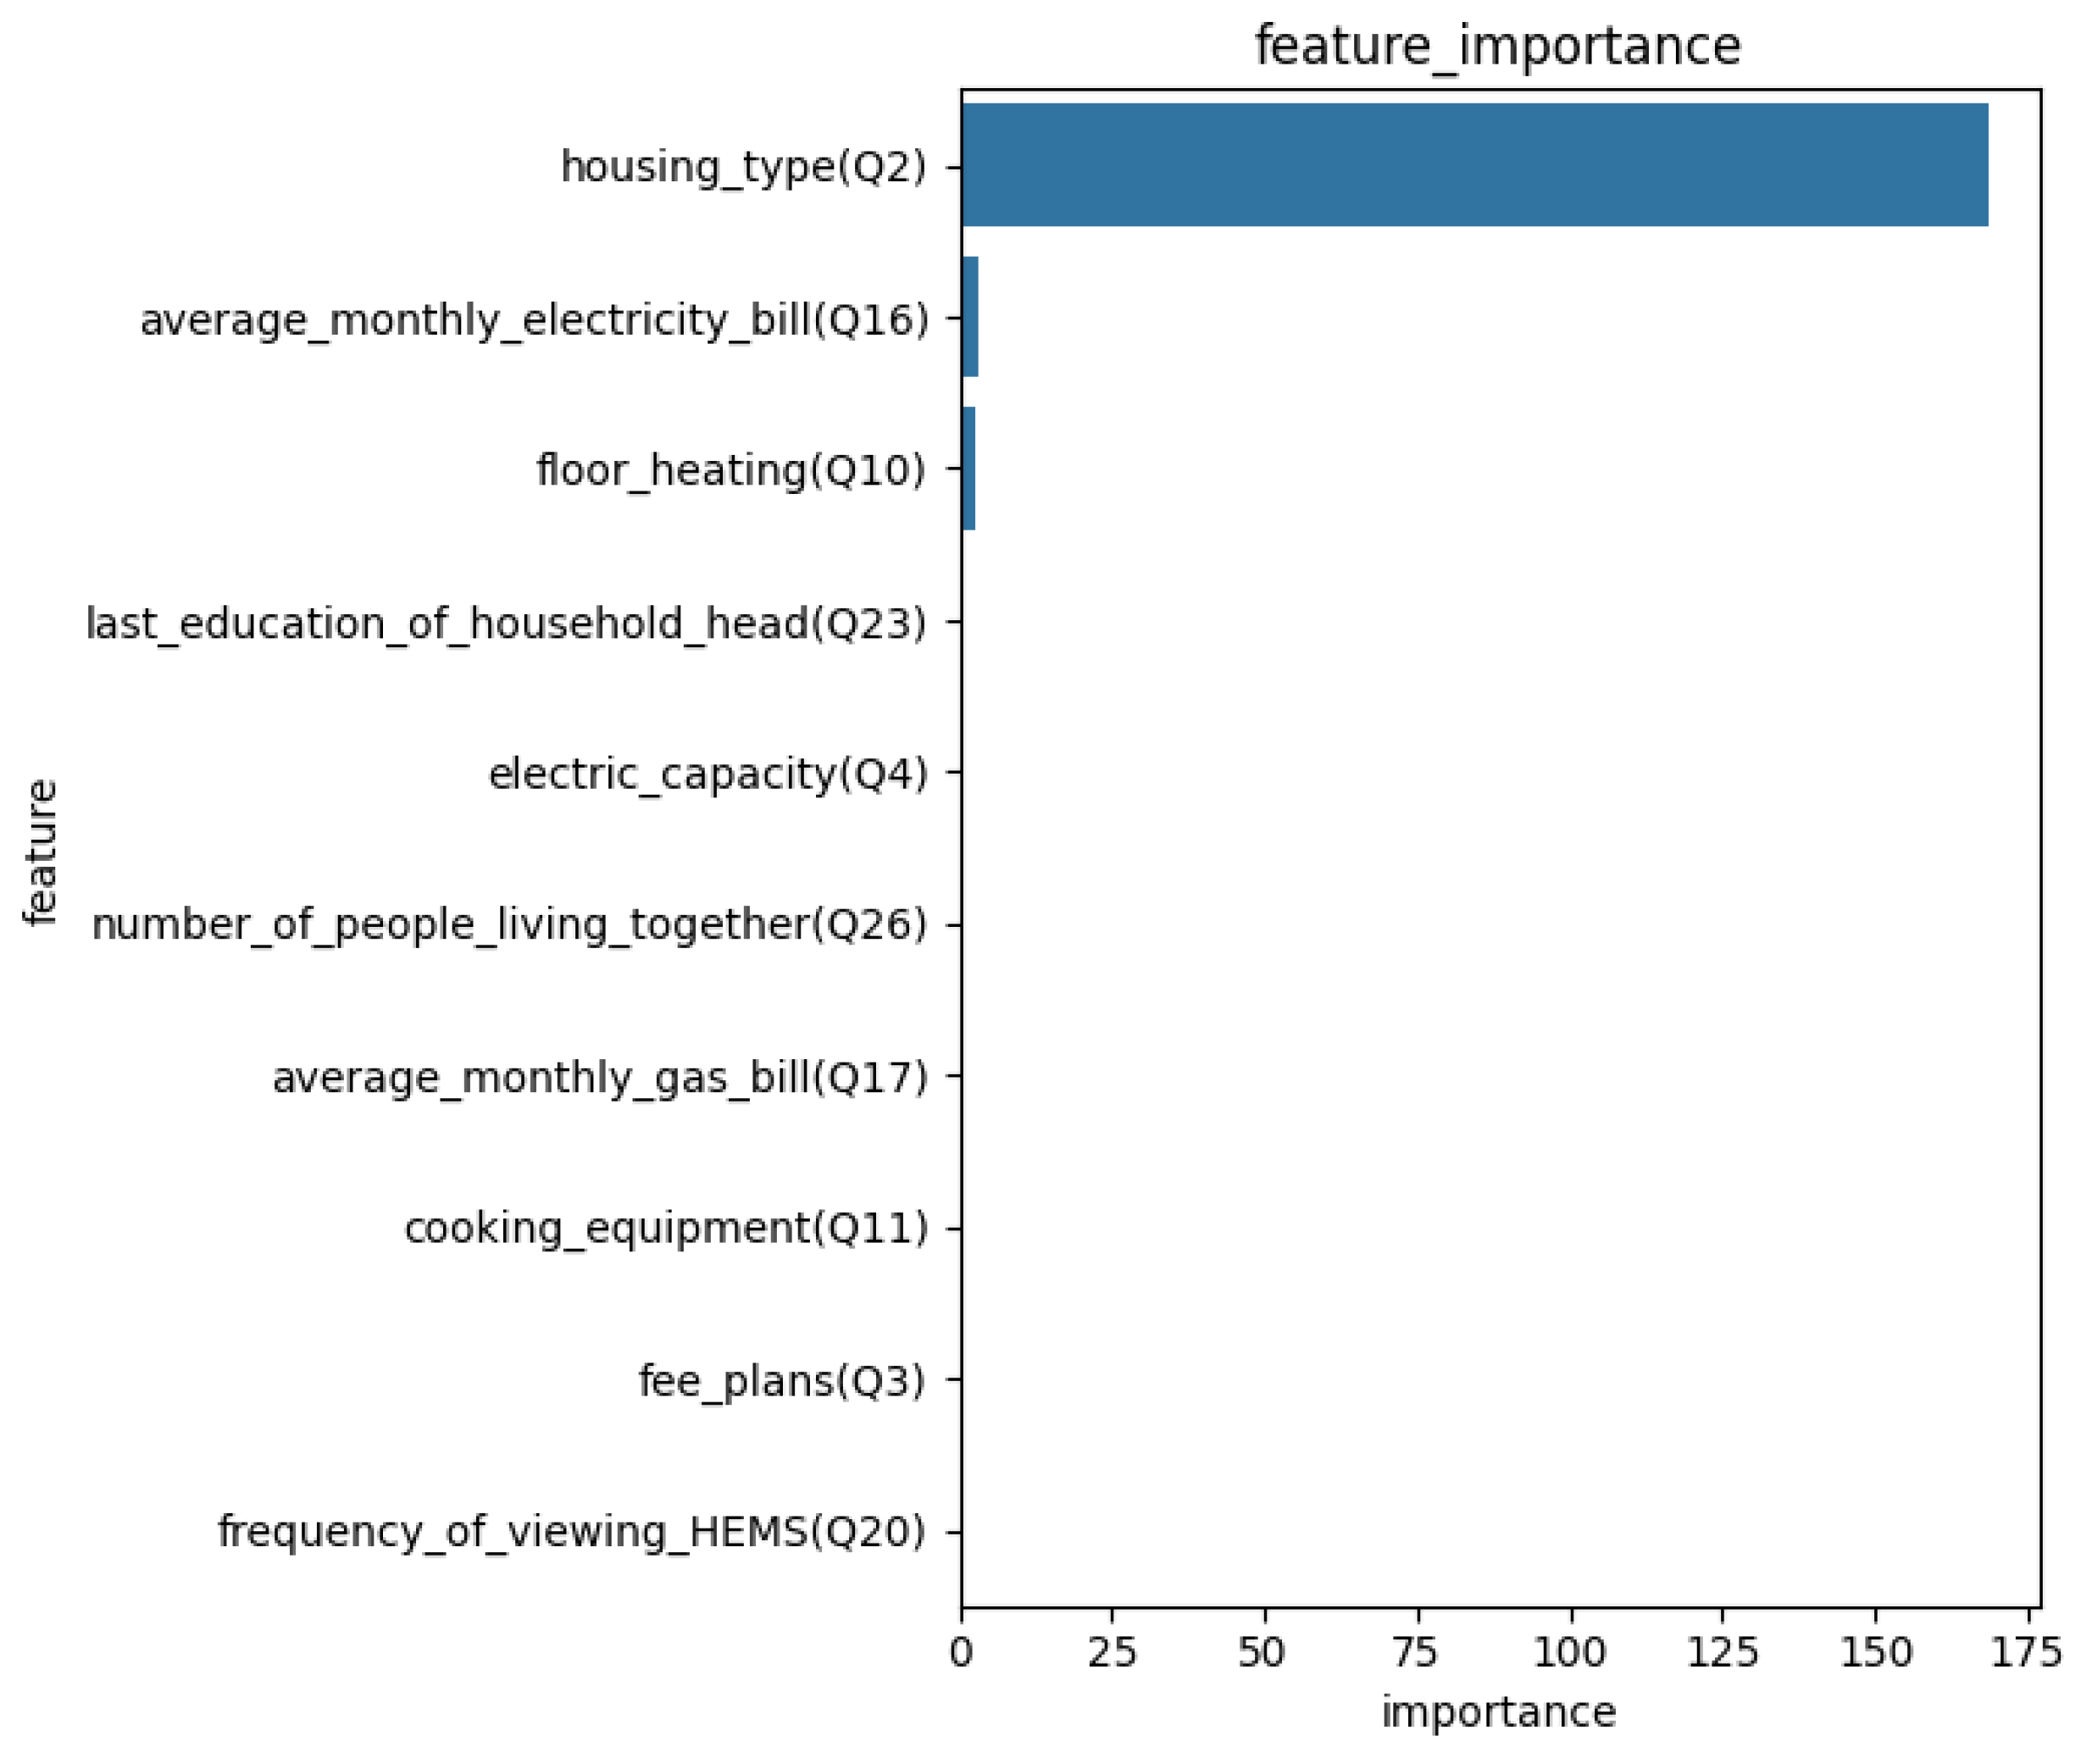
Figure 6.
Violin plot for the statistical relationship between an extracted feature (survey question related to the type of house) and ESSR.
Figure 6.
Violin plot for the statistical relationship between an extracted feature (survey question related to the type of house) and ESSR.
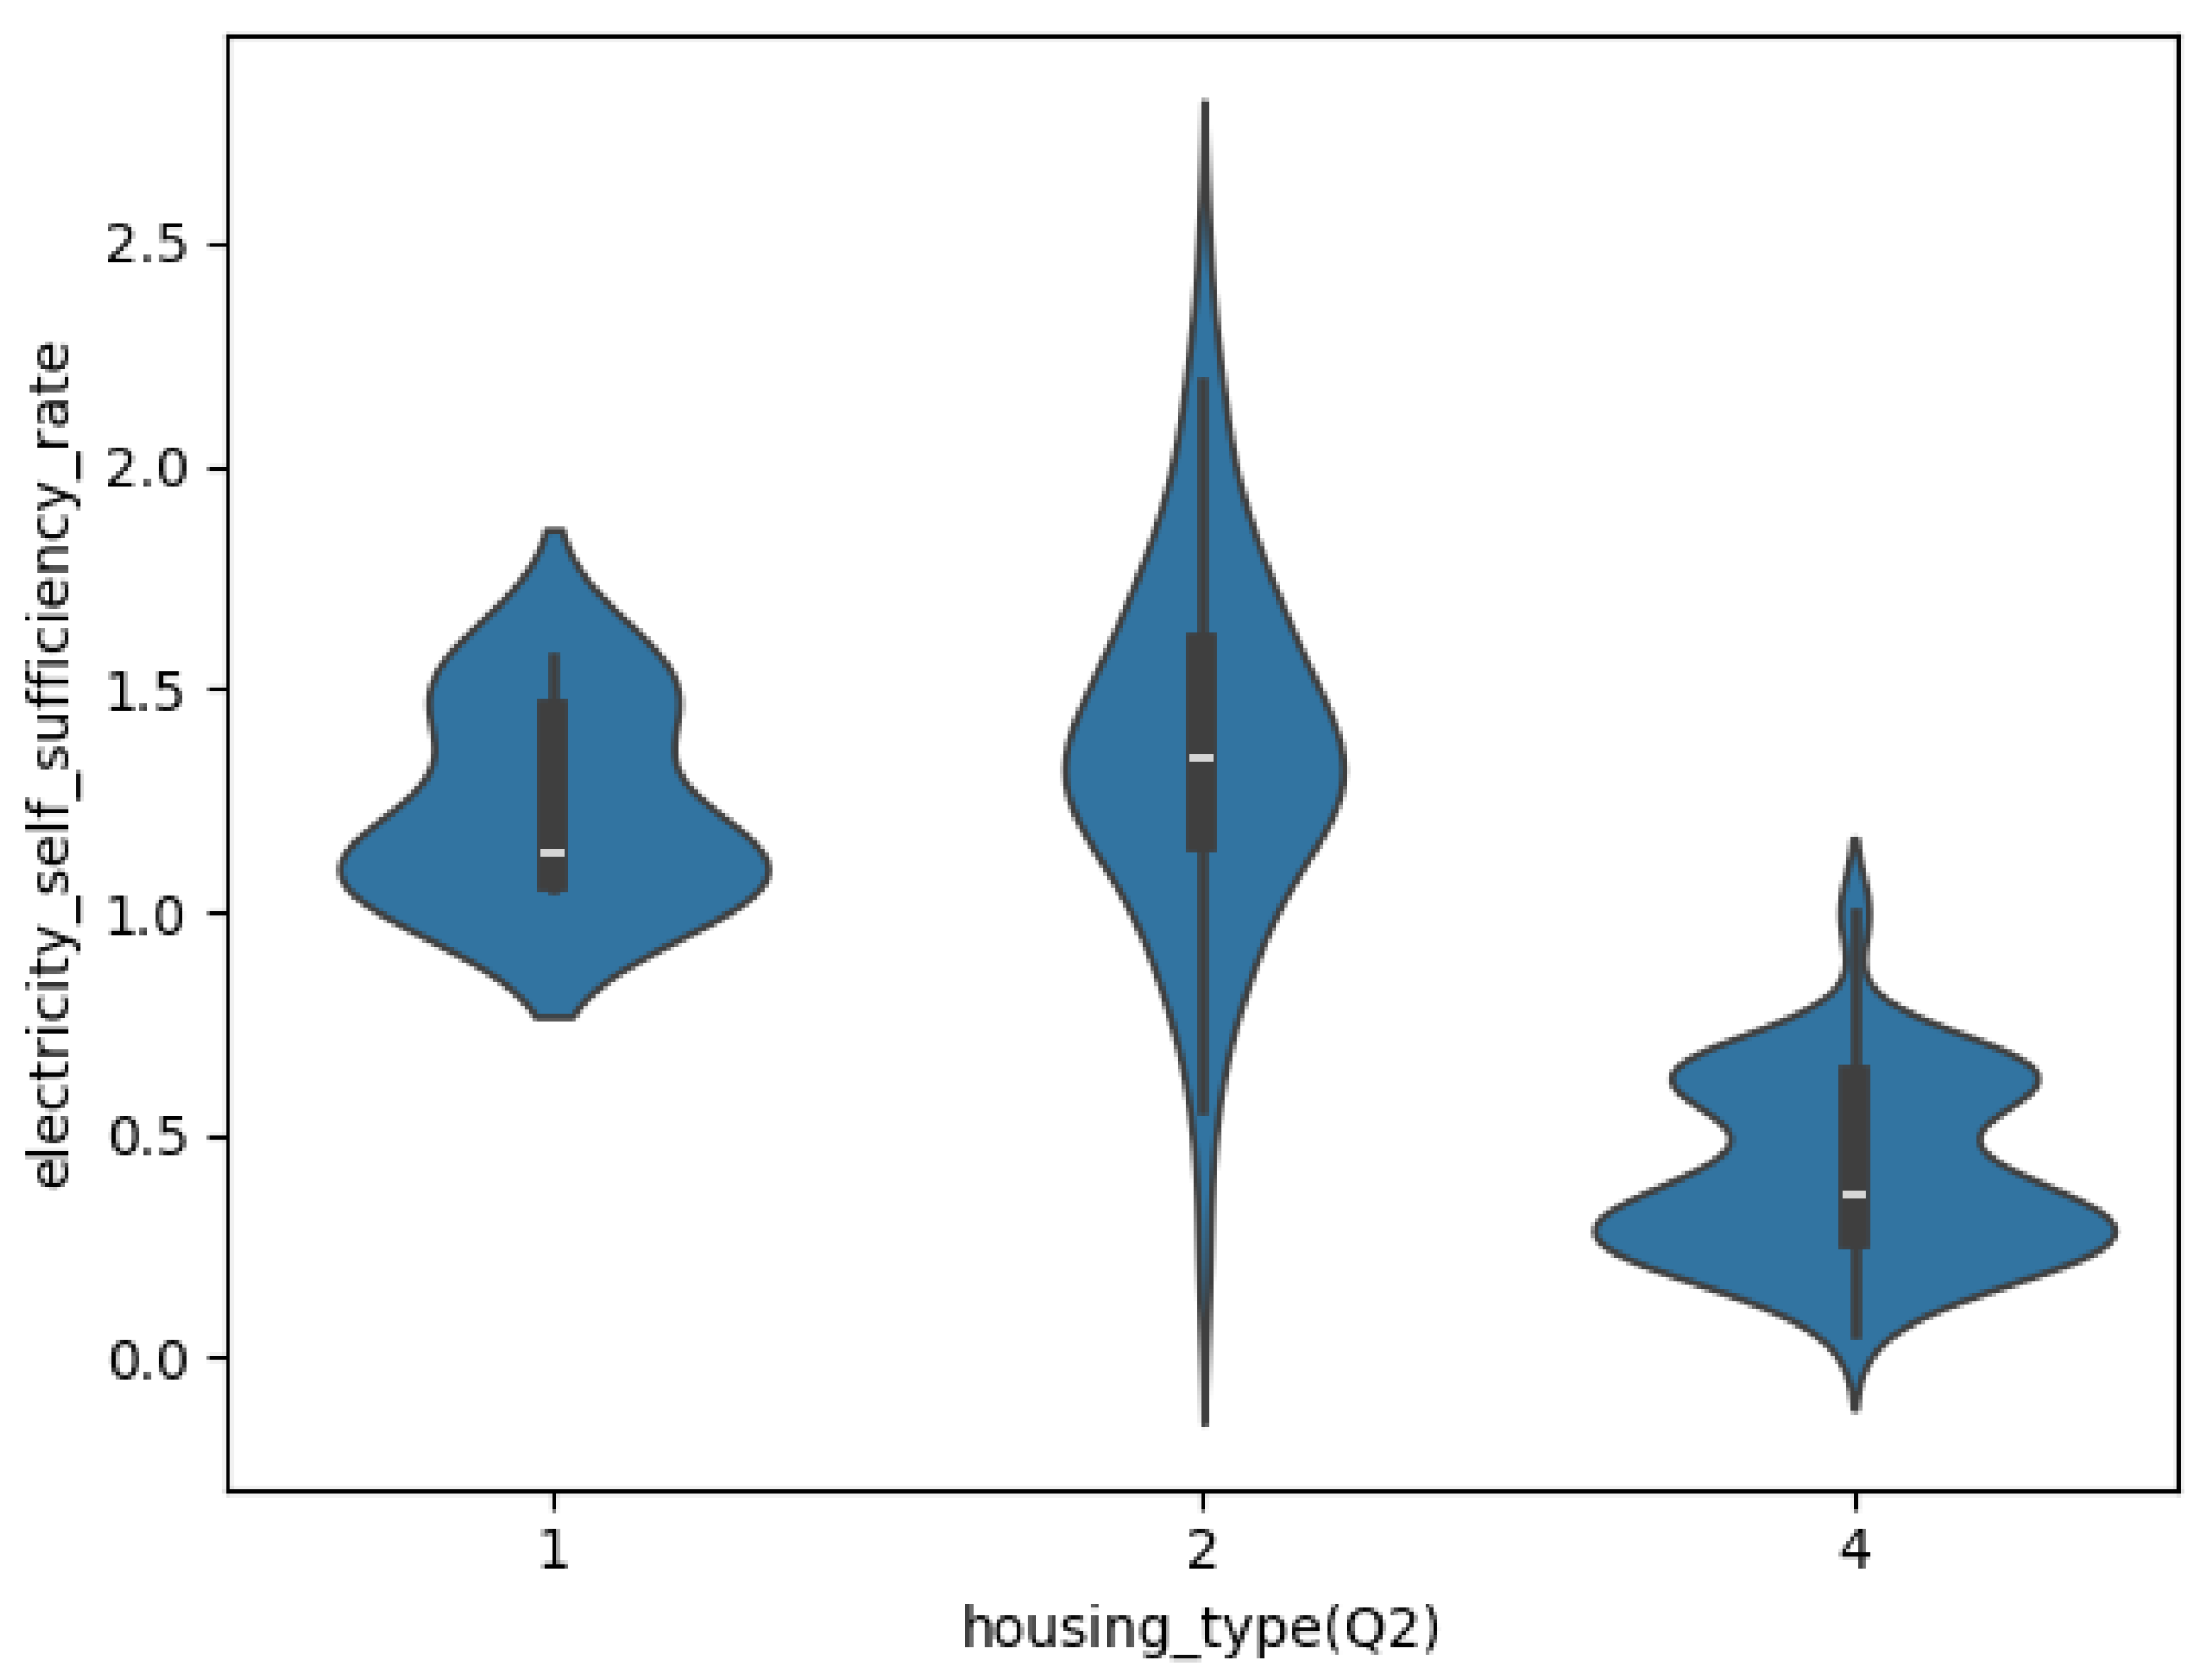
Figure 7.
Violin plot for the statistical relationship between an extracted feature (survey question related to the type of floor heating system) and ESSR.
Figure 7.
Violin plot for the statistical relationship between an extracted feature (survey question related to the type of floor heating system) and ESSR.
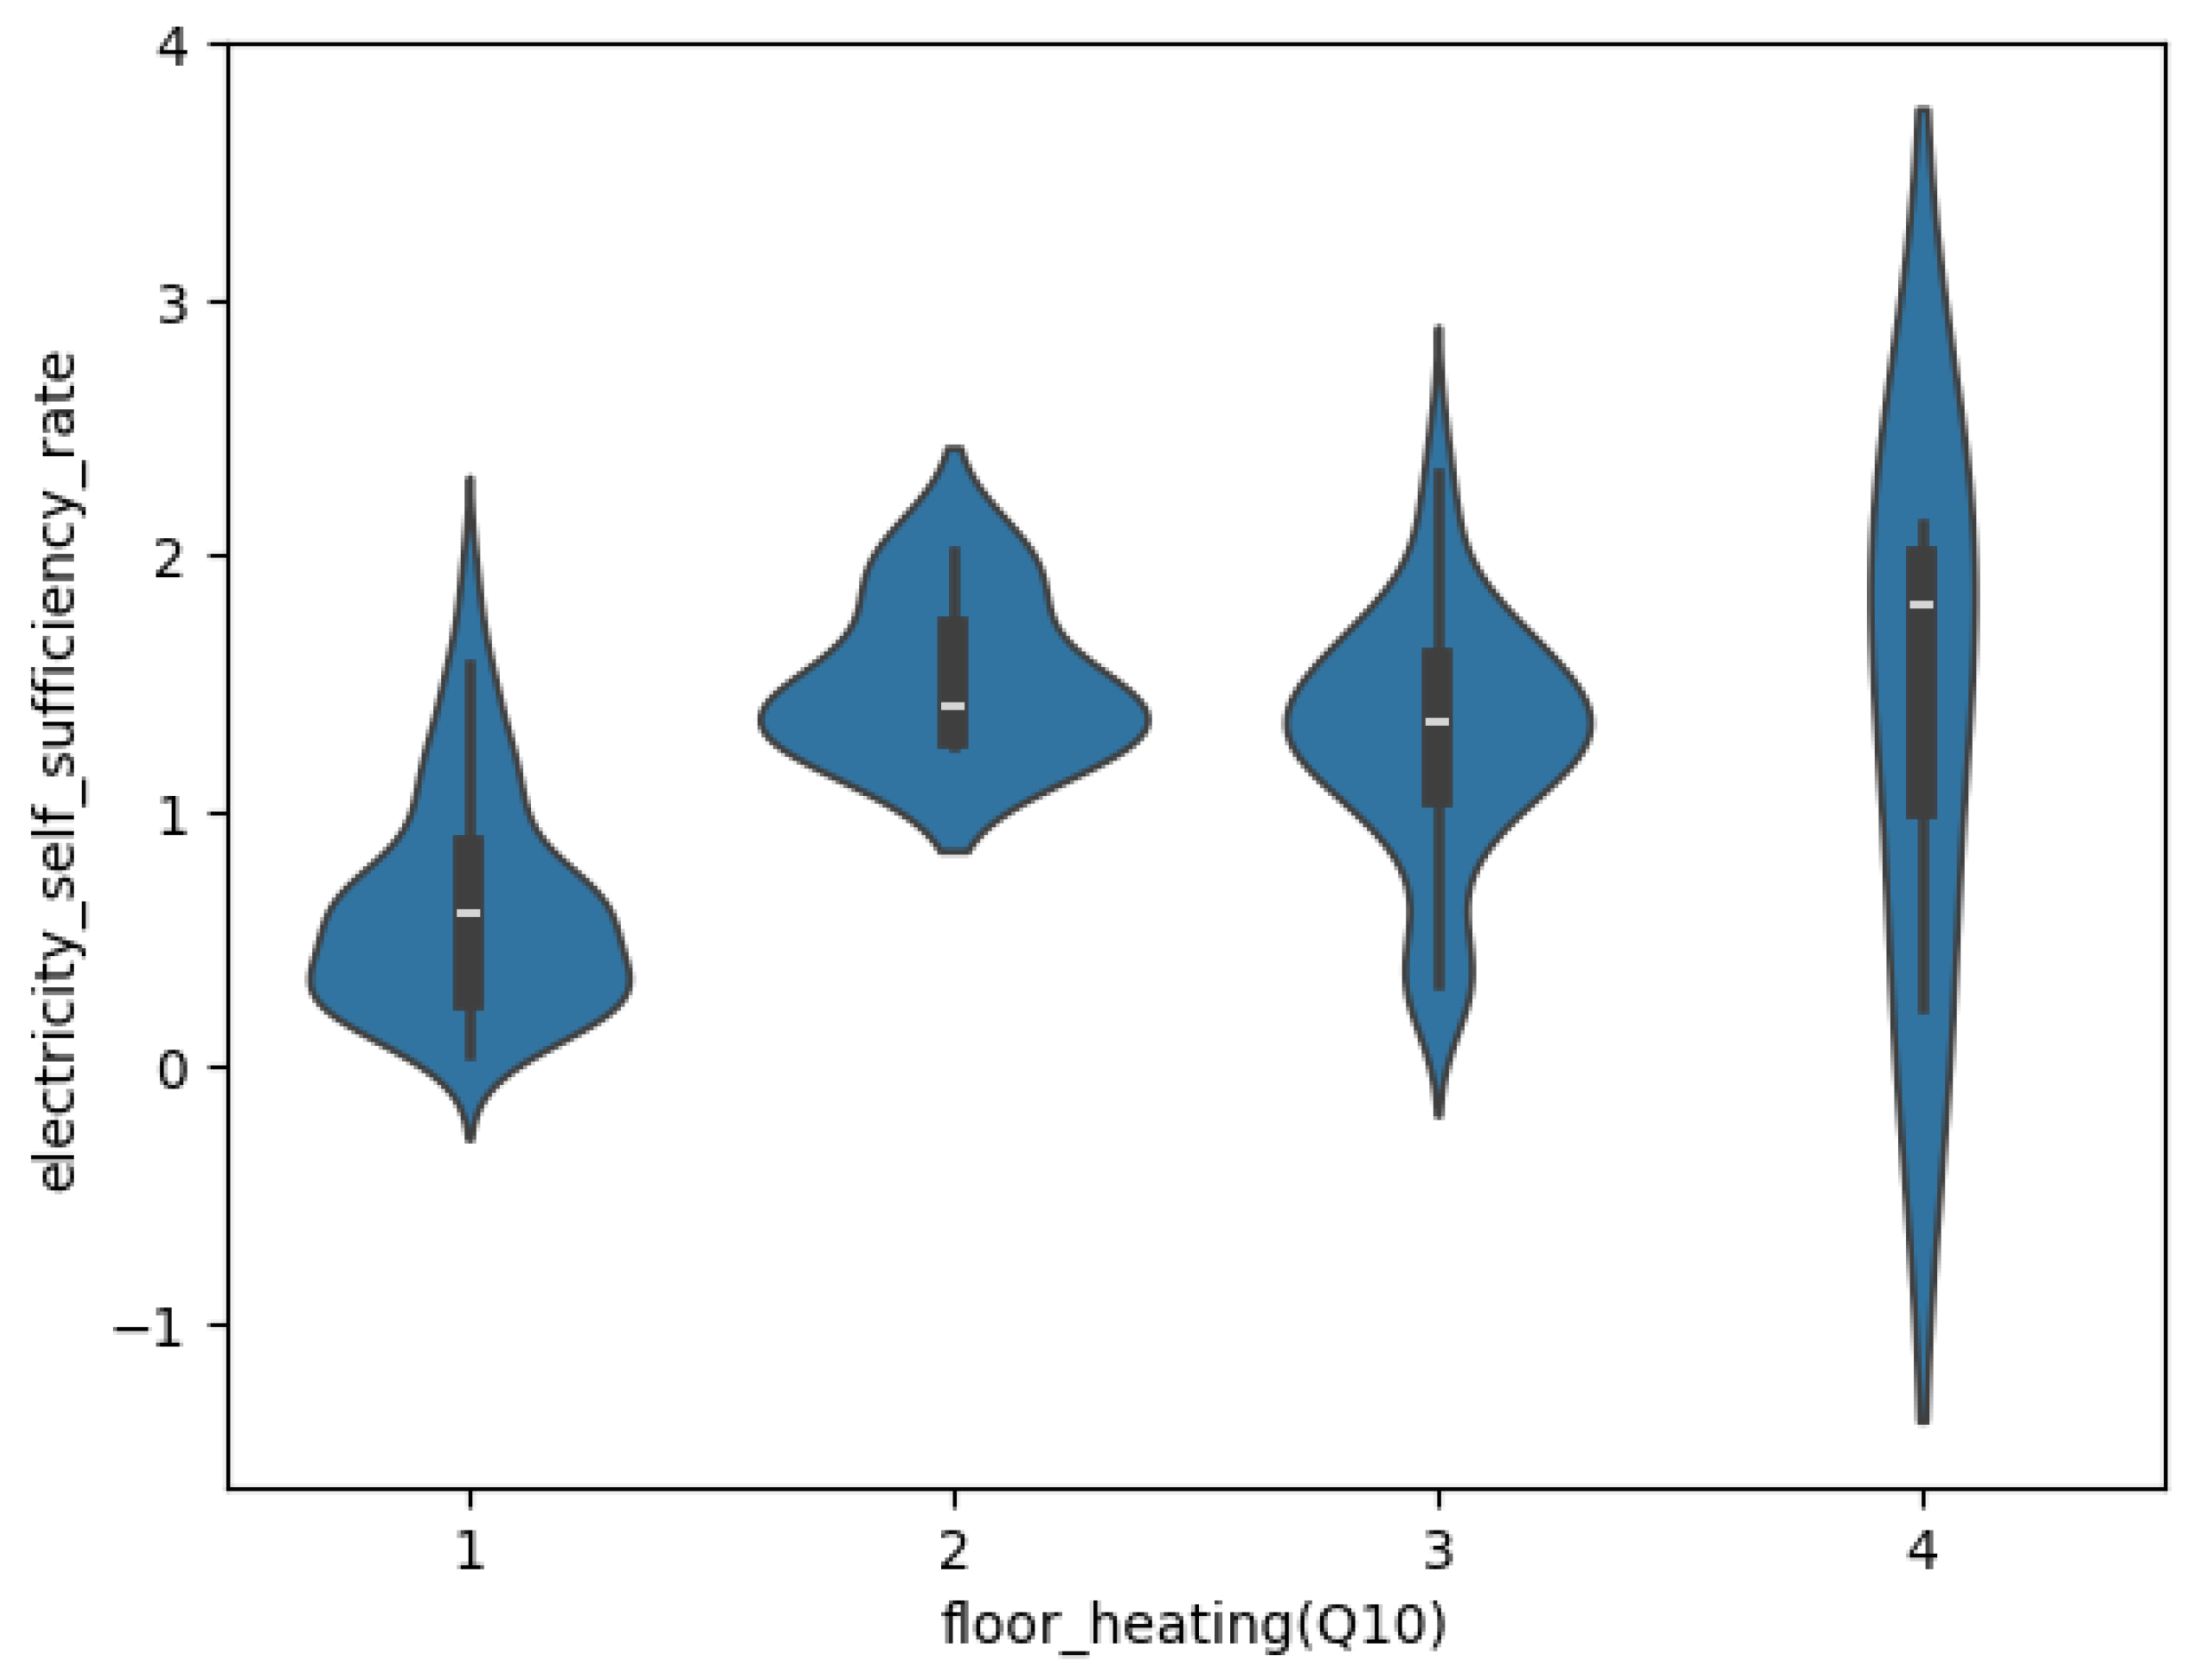
Figure 8.
correlation between the electricity self-sufficiency rate and average monthly electricity bill.
Figure 8.
correlation between the electricity self-sufficiency rate and average monthly electricity bill.
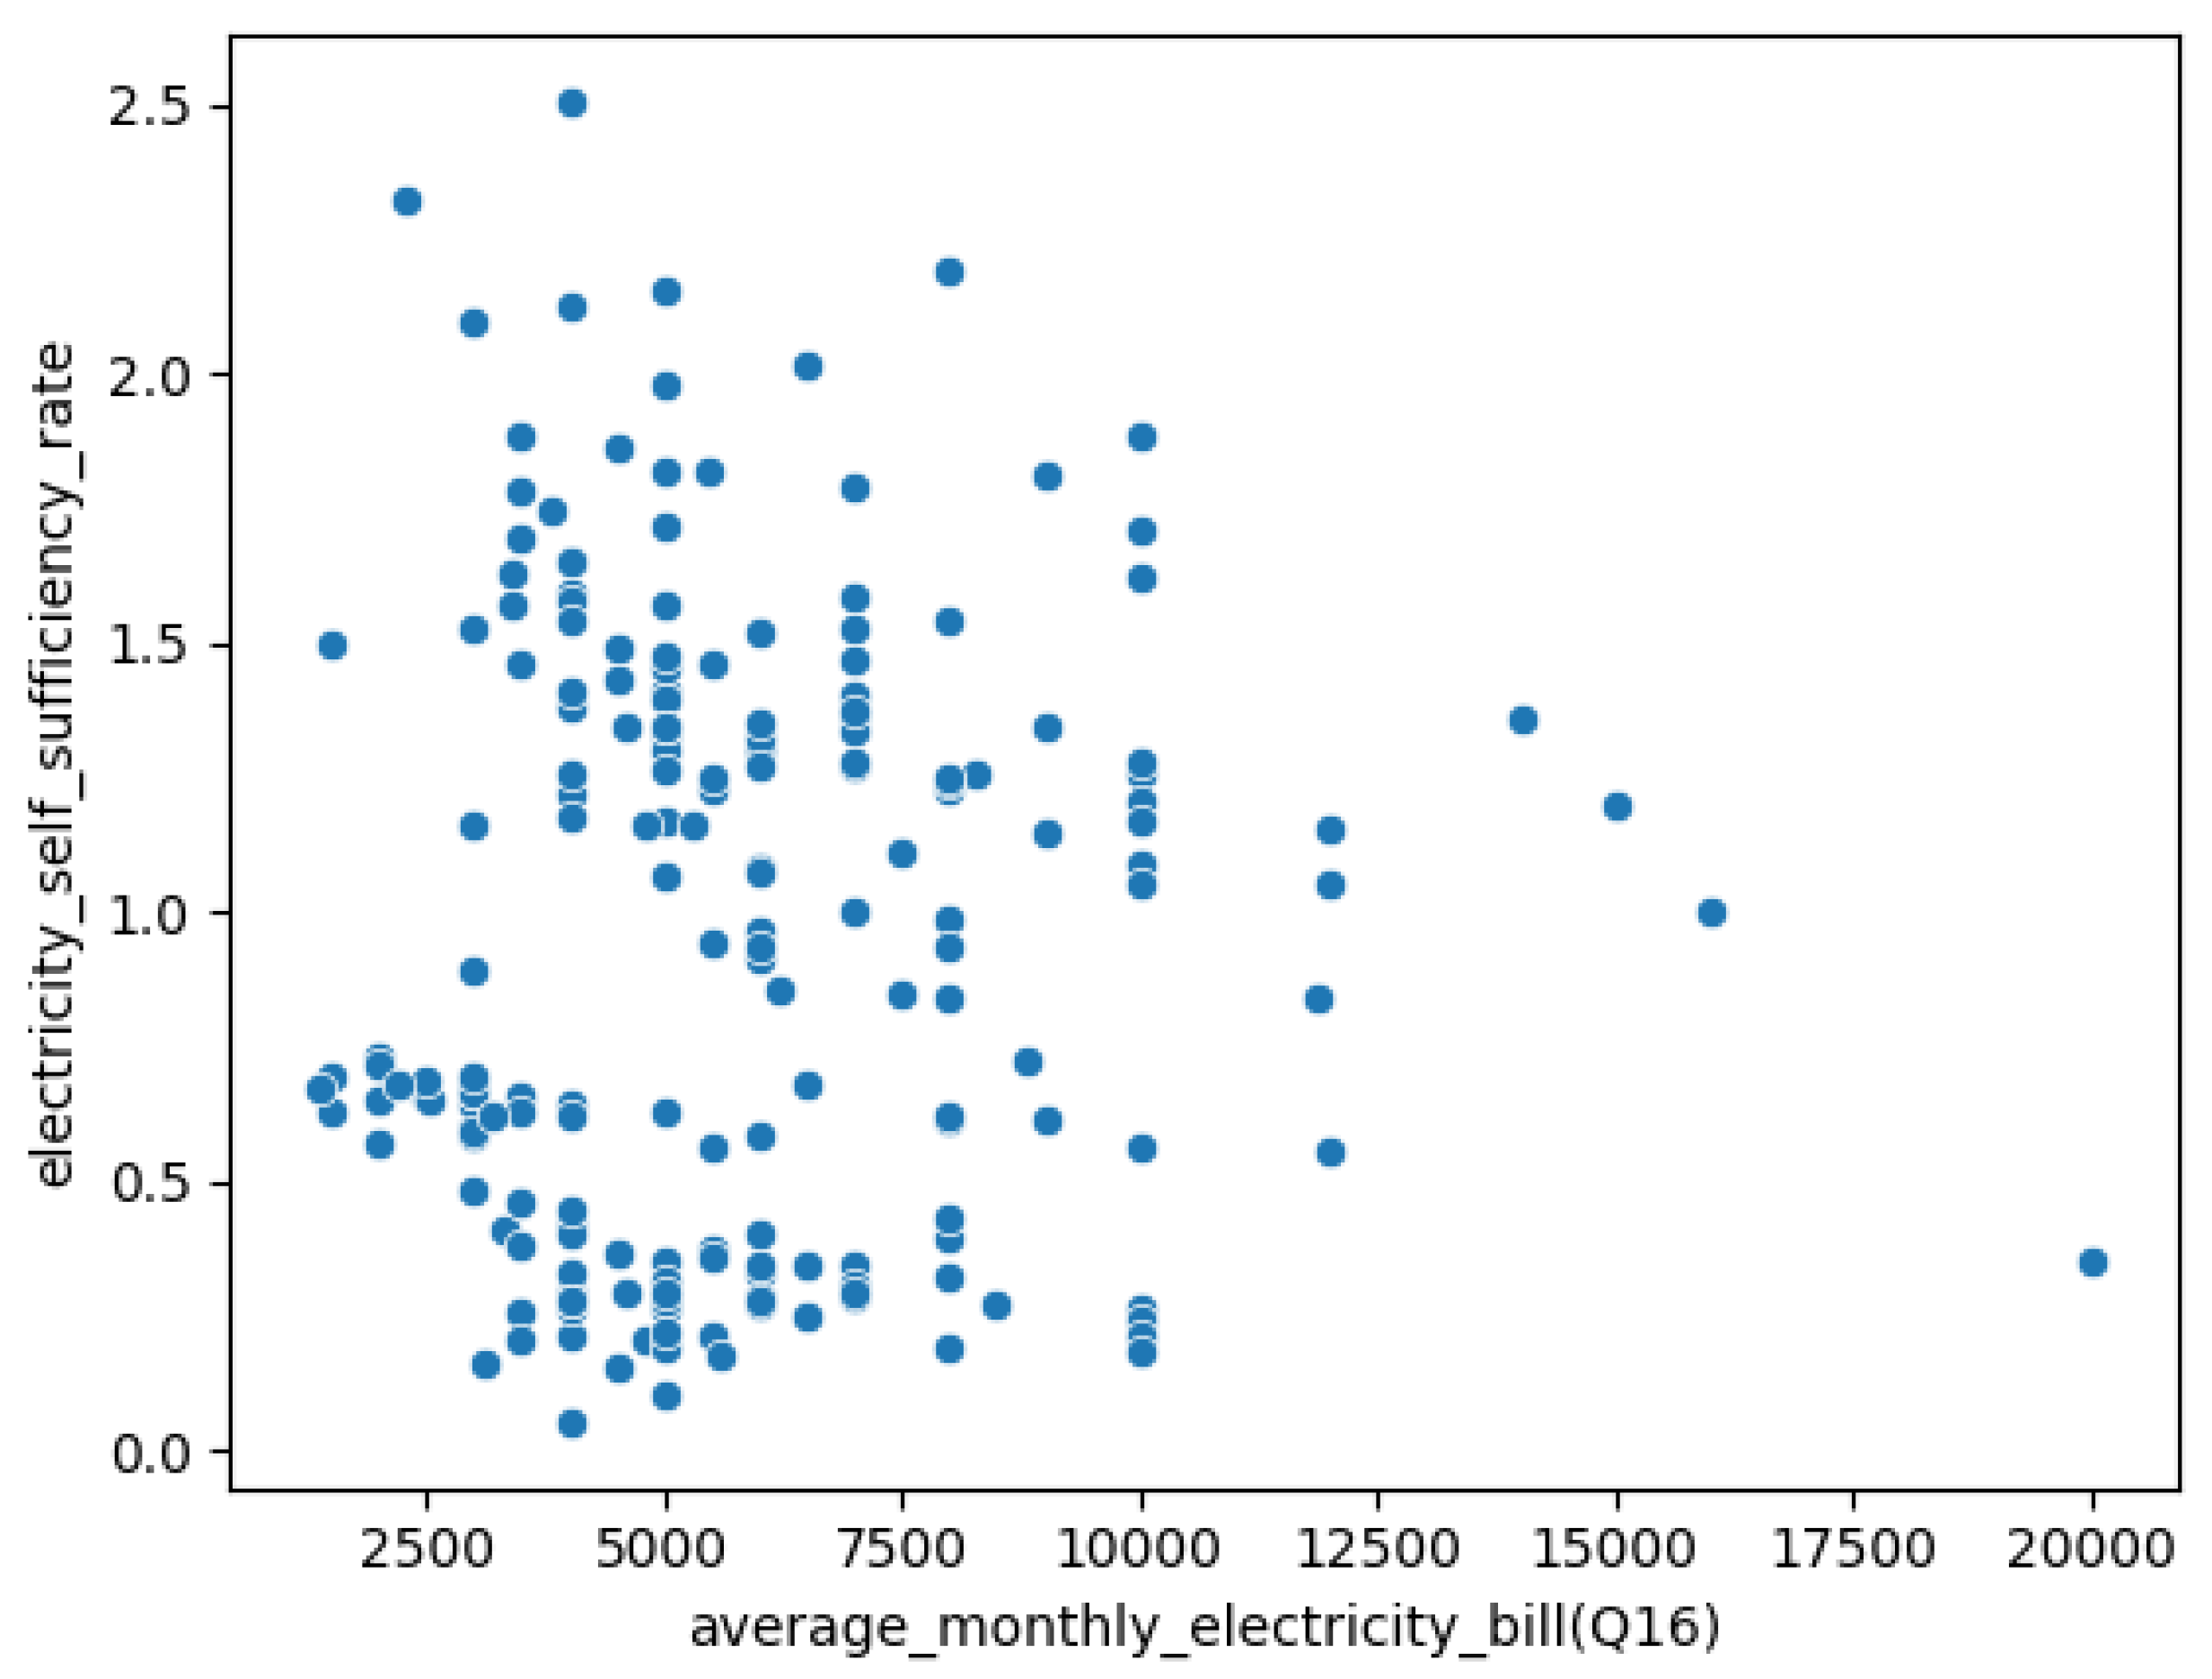
Figure 9.
Correlation matrix based heatmap.
Disclaimer/Publisher’s Note: The statements, opinions and data contained in all publications are solely those of the individual author(s) and contributor(s) and not of MDPI and/or the editor(s). MDPI and/or the editor(s) disclaim responsibility for any injury to people or property resulting from any ideas, methods, instructions or products referred to in the content. |
© 2024 by the authors. Licensee MDPI, Basel, Switzerland. This article is an open access article distributed under the terms and conditions of the Creative Commons Attribution (CC BY) license (http://creativecommons.org/licenses/by/4.0/).
Copyright: This open access article is published under a Creative Commons CC BY 4.0 license, which permit the free download, distribution, and reuse, provided that the author and preprint are cited in any reuse.


