Submitted:
22 July 2024
Posted:
23 July 2024
You are already at the latest version
Abstract
Keywords:
1. Introduction
2. Experimental Section
2.1. Materials and Reagents
2.2. Fabrication of PVDF Electrospinning Solutions and TPE-Doped PVDF Electrospinning Solutions
2.3. Fabrication of PVDF and TPE-Doped PVDF Nanofiber Membranes
2.4. Characterization
2.5. Training of Neural Network for Fiber Diameter Prediction
2.6. Gray Value Method for Thermal Sensitivity Measurement
3. Result and Discussion
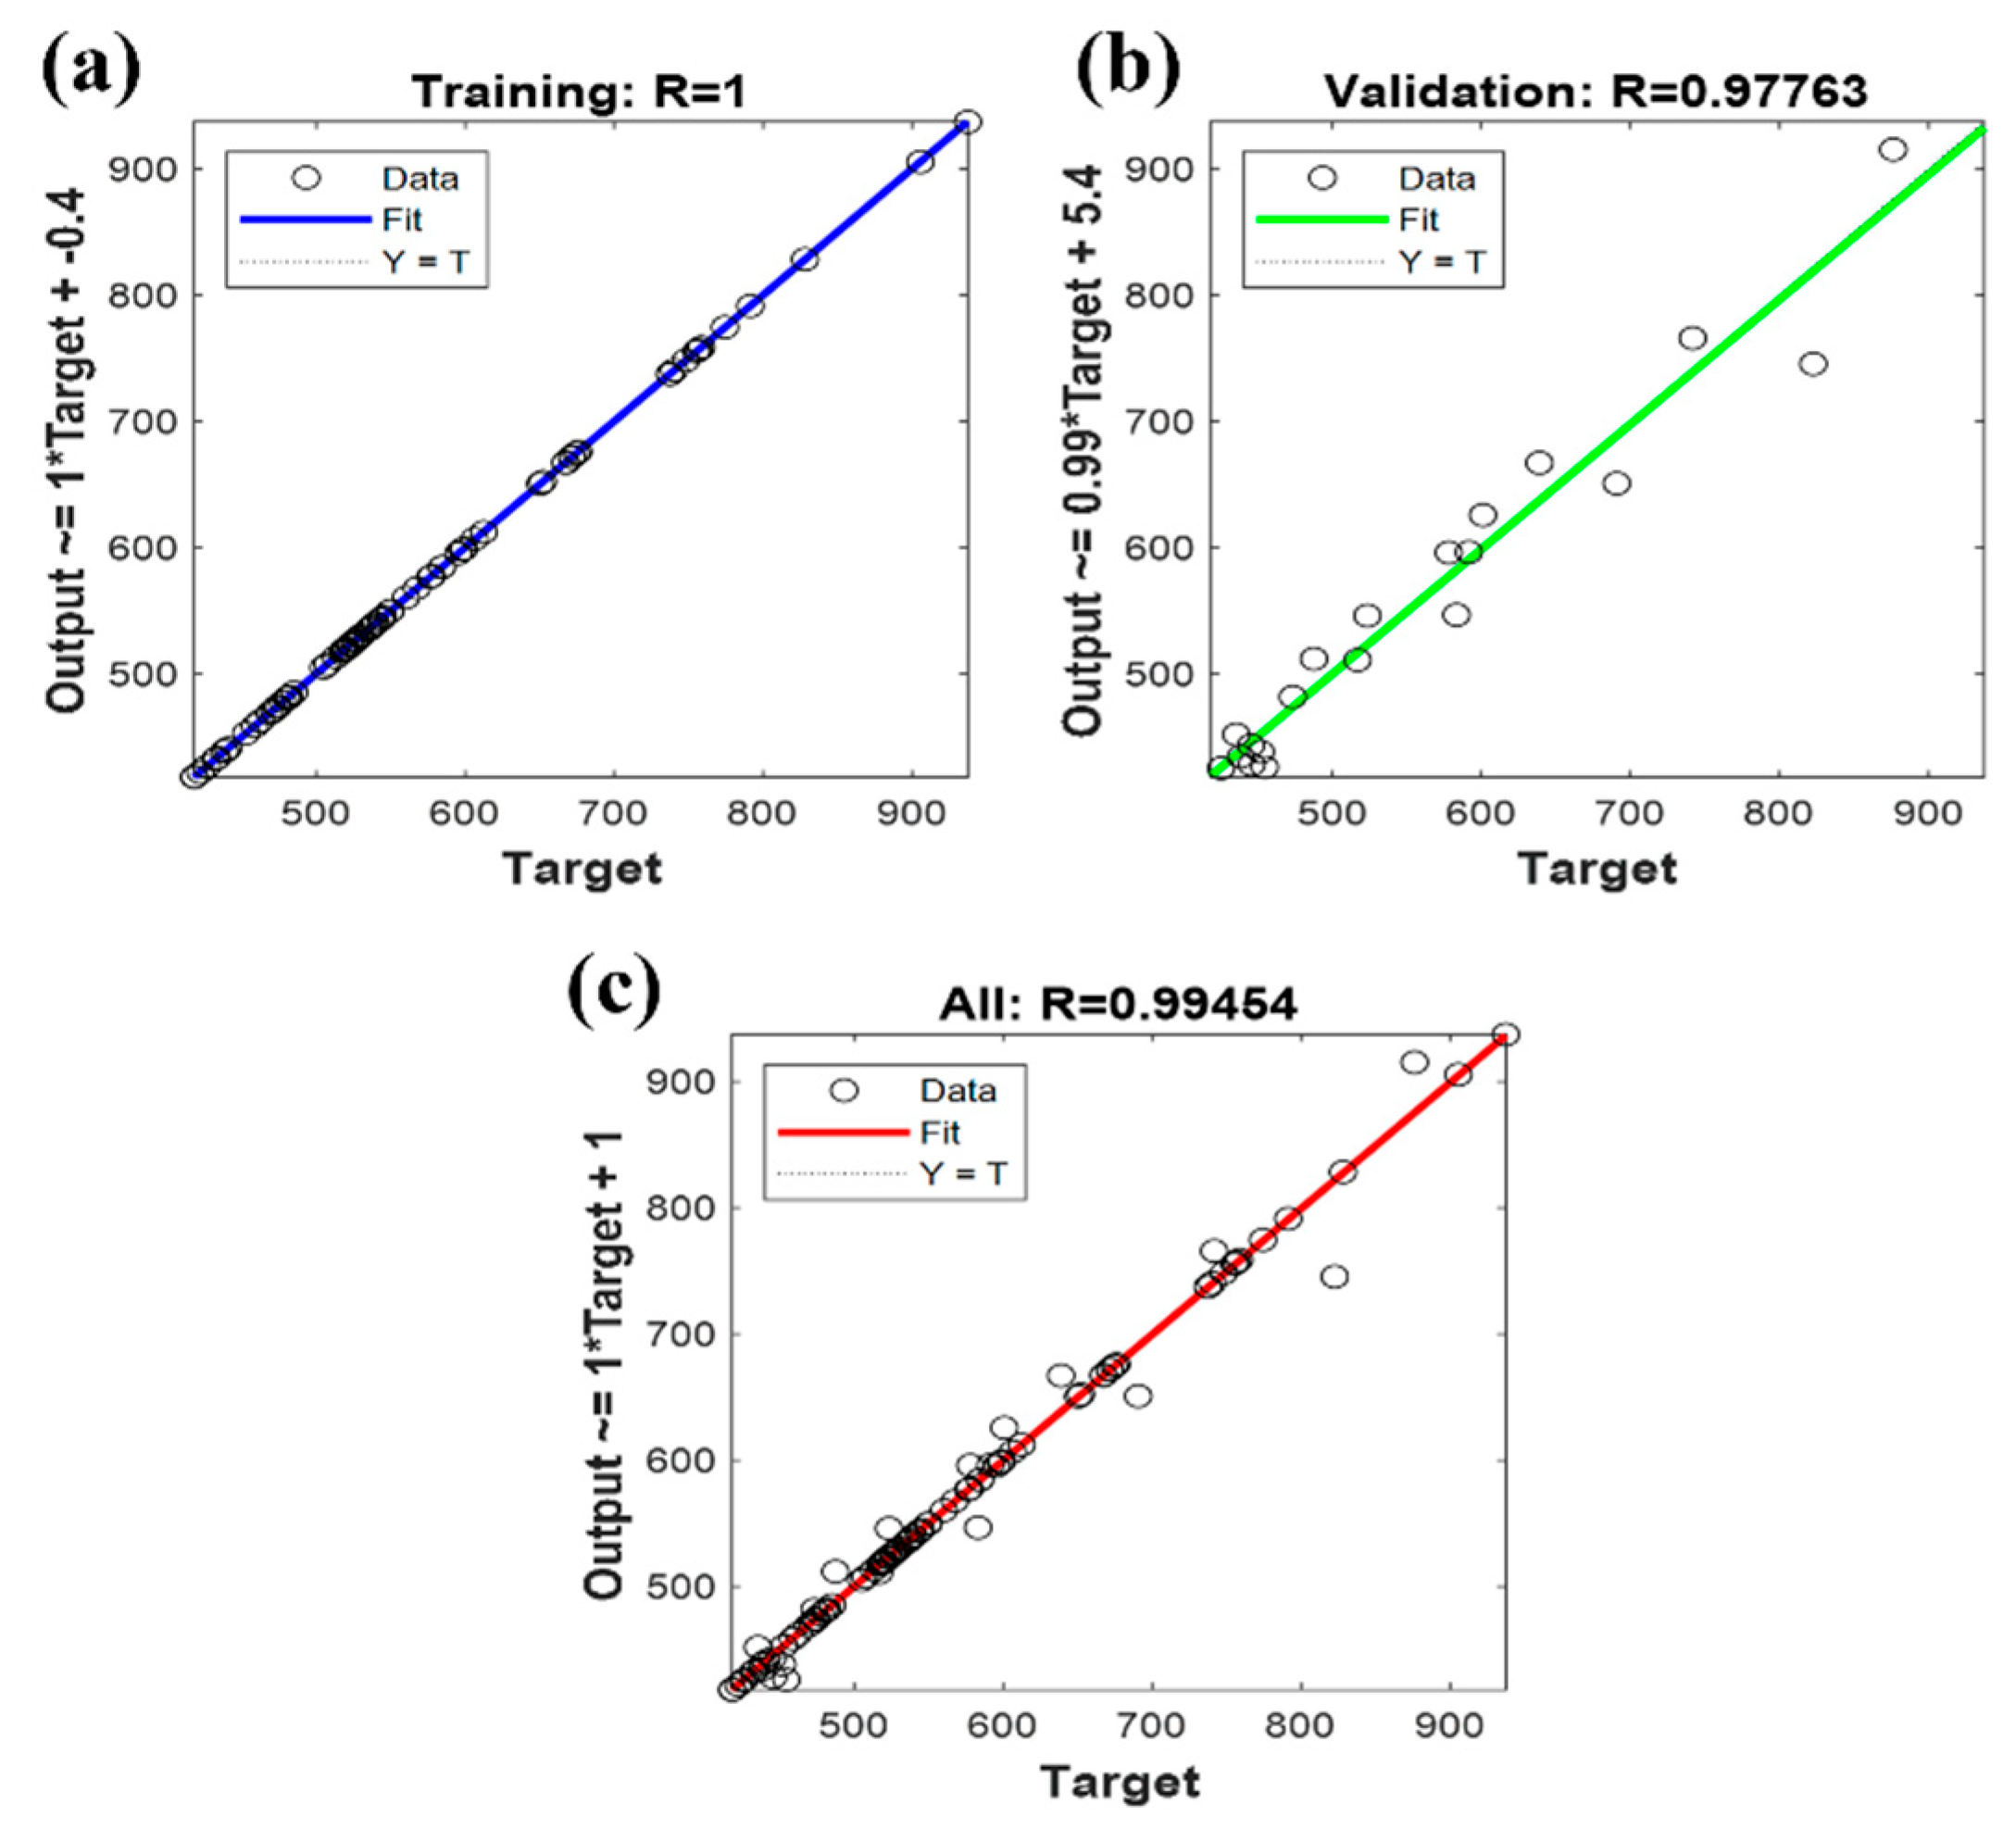
3.1. Comparison of Different Neural Network Prediction Results
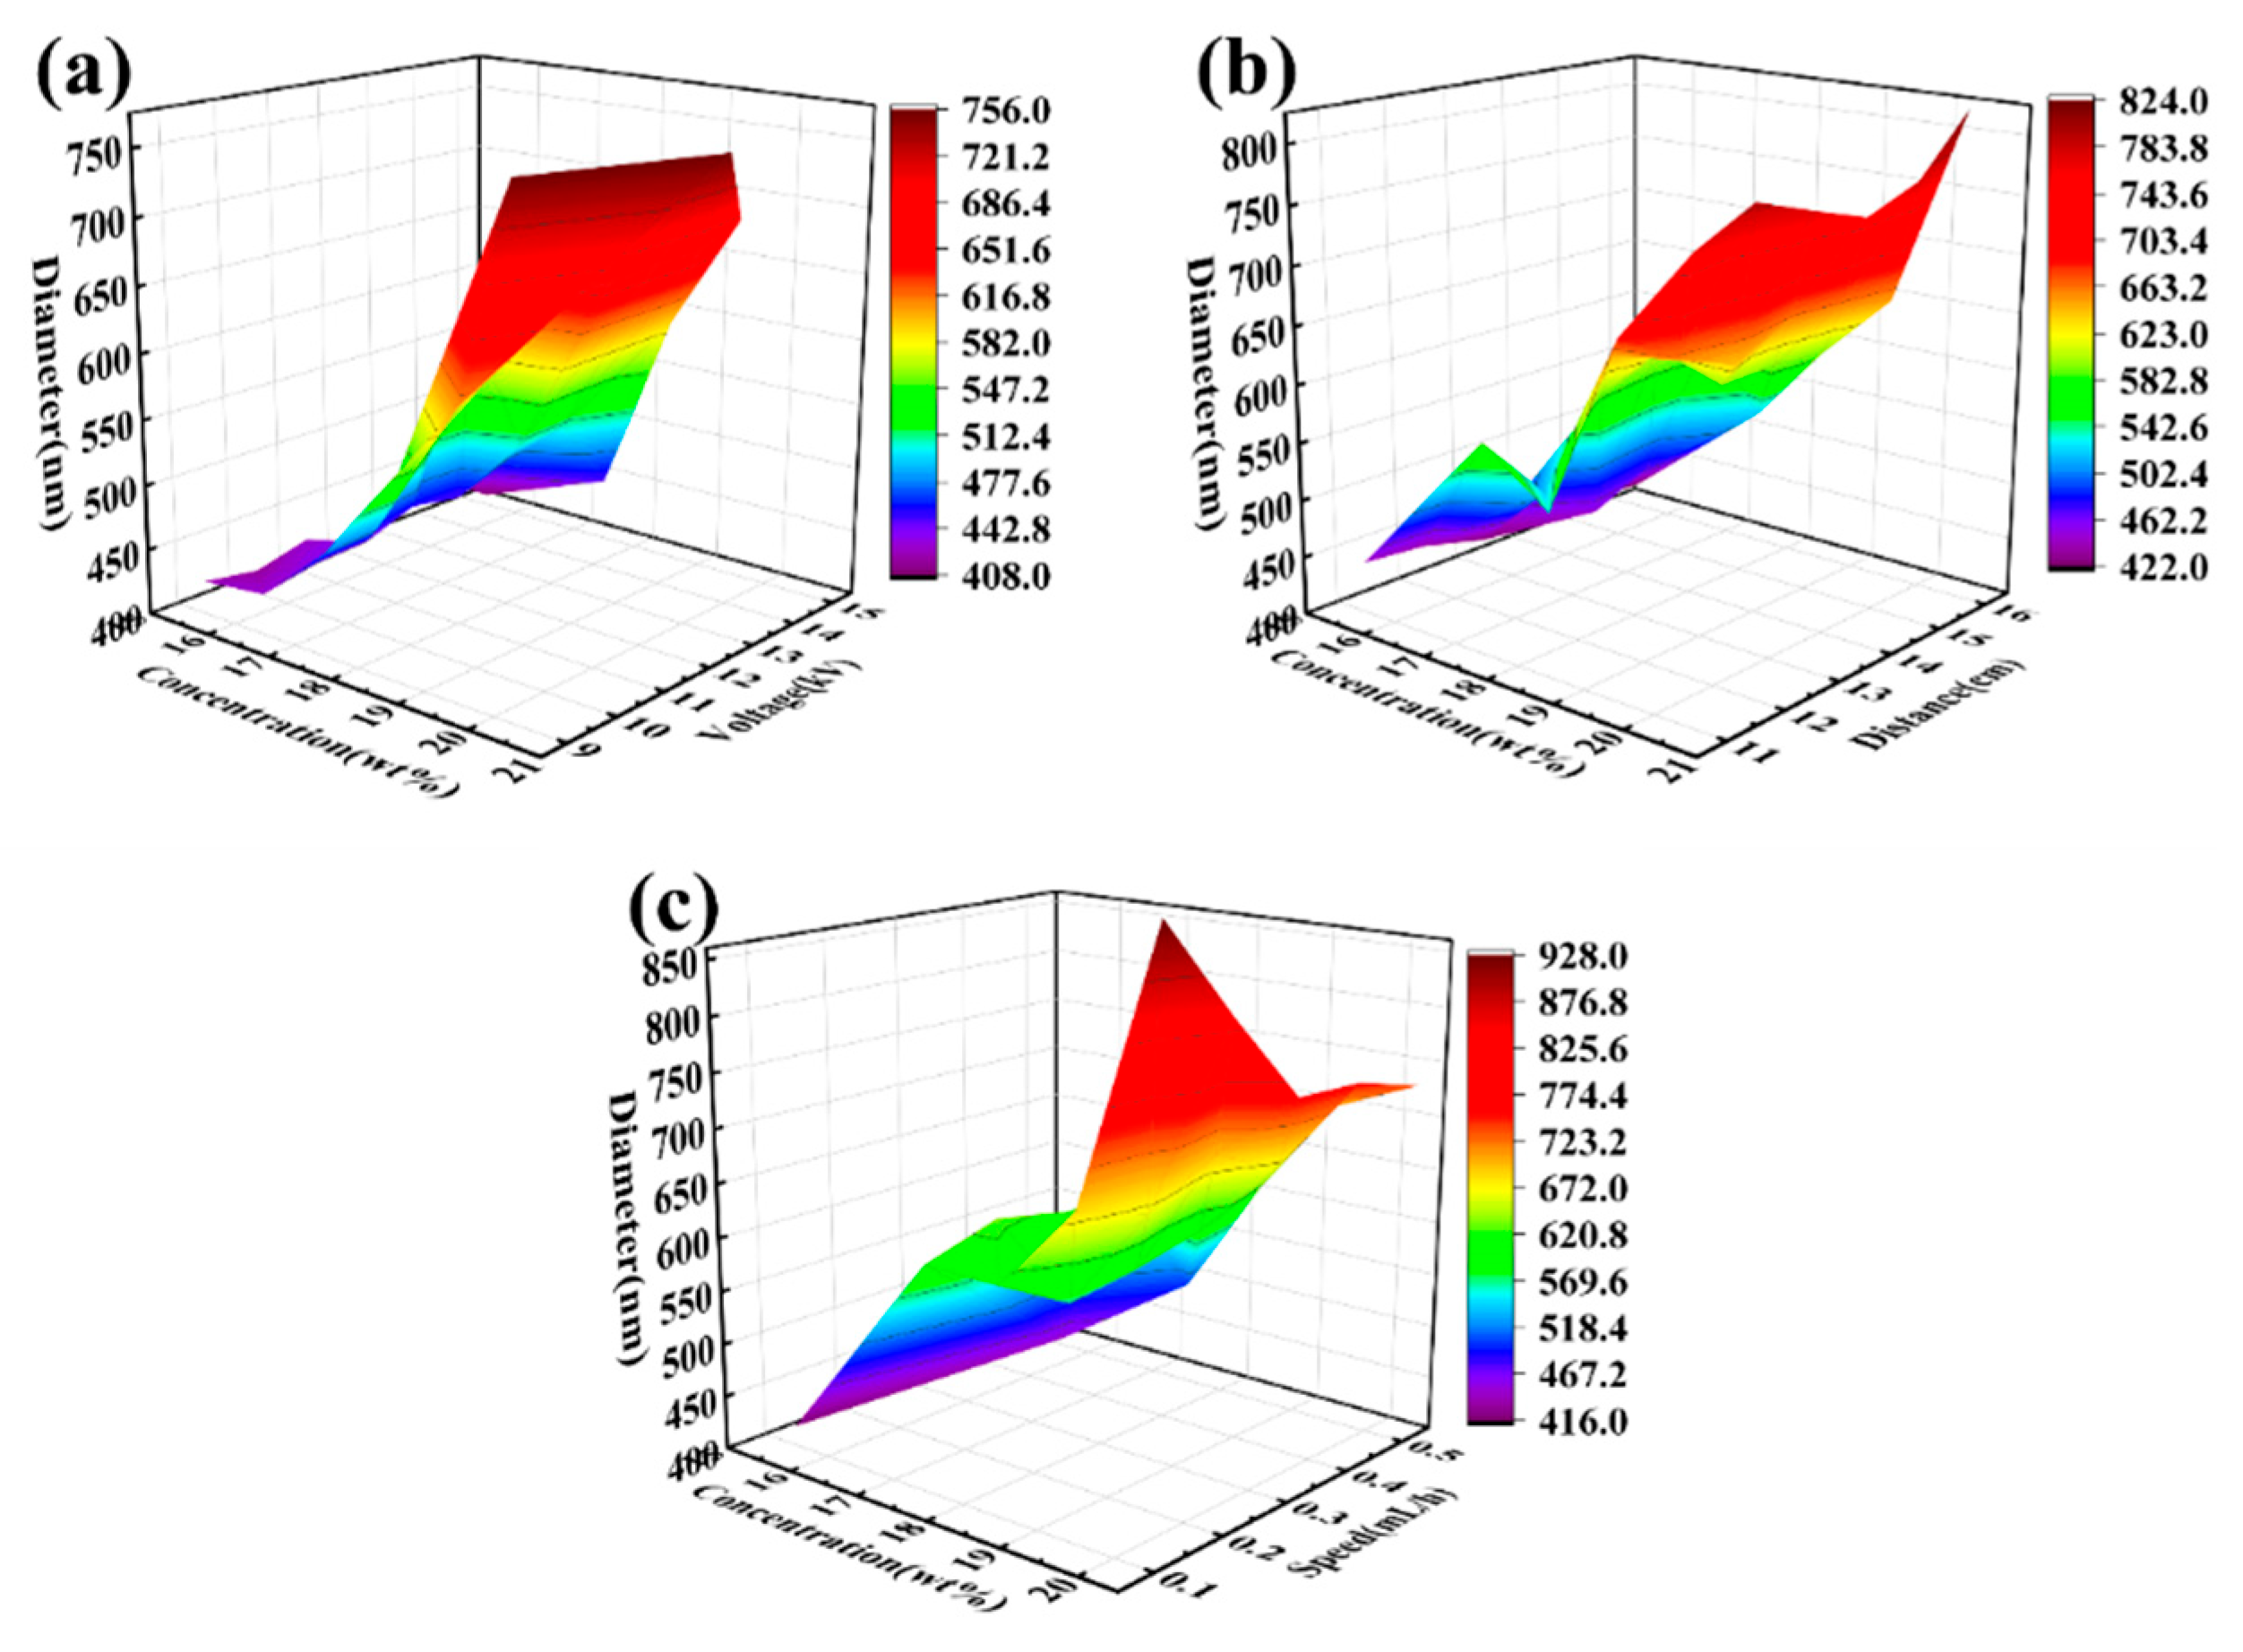
3.2. Interactions among Electrospinning Process Parameters
3.3. Effect of PVDF Concentration on Viscosity, Surface Tension, and Conductivity of Spinning Solutions
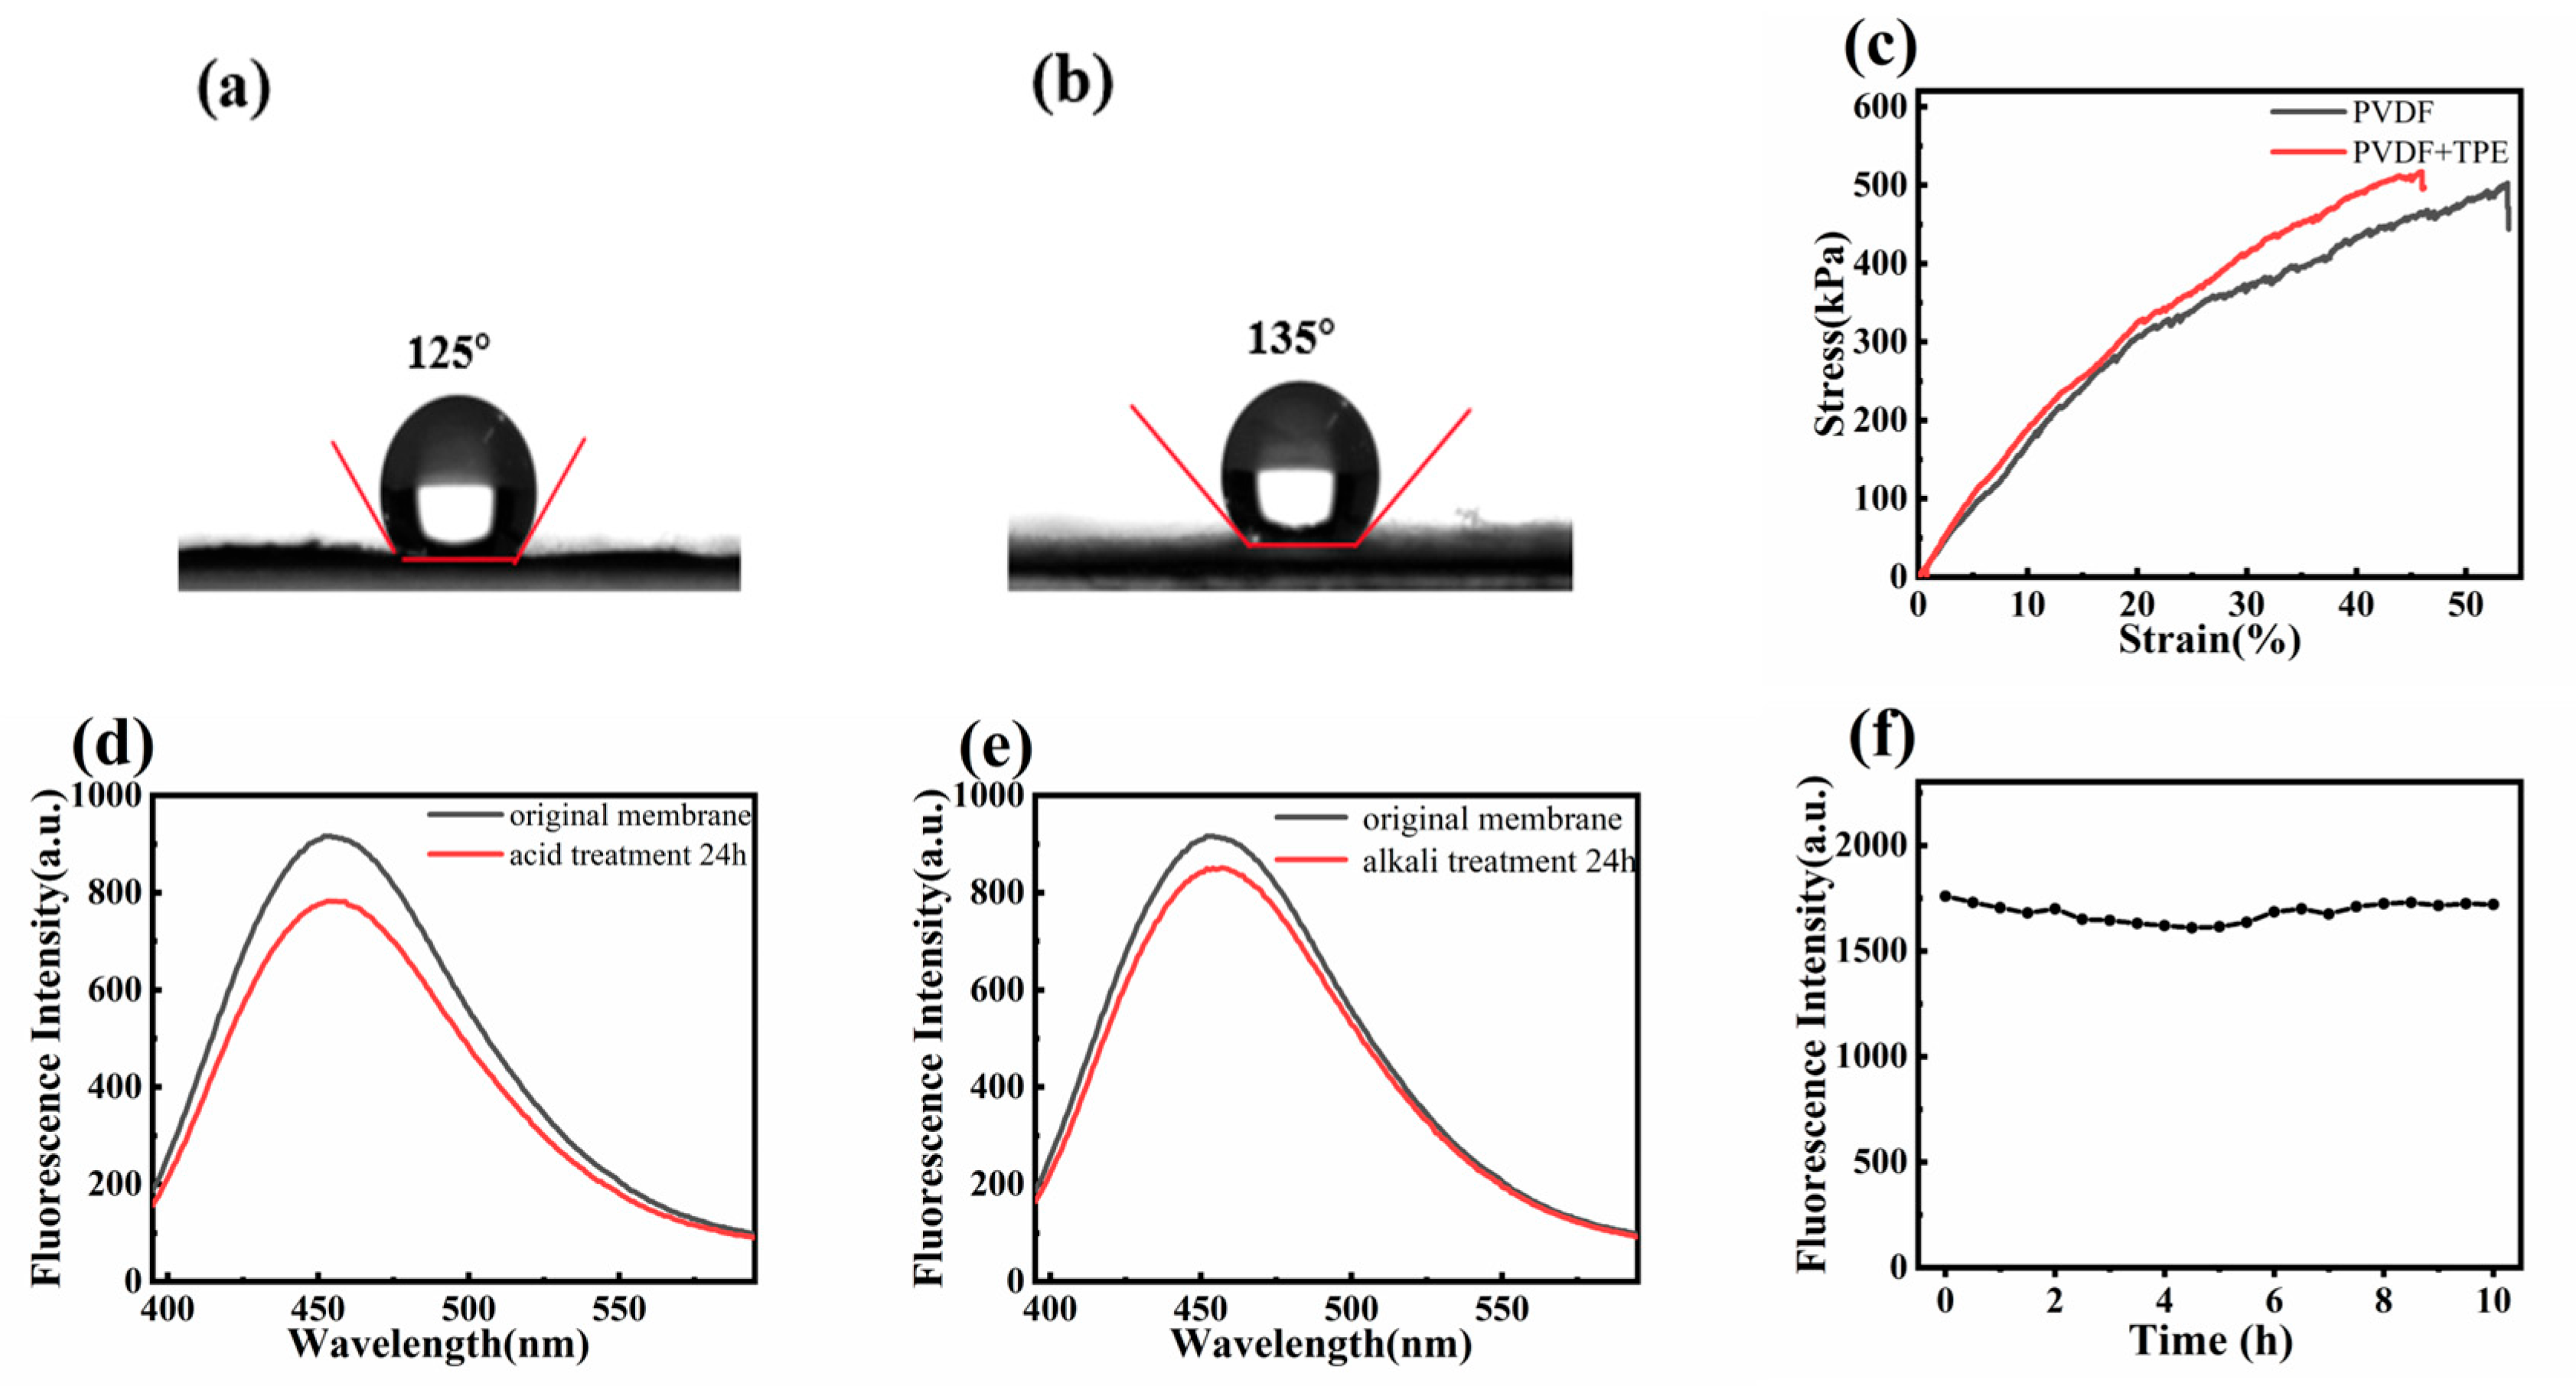
3.4. Surface and Stability Properties of Nanofiber Membranes
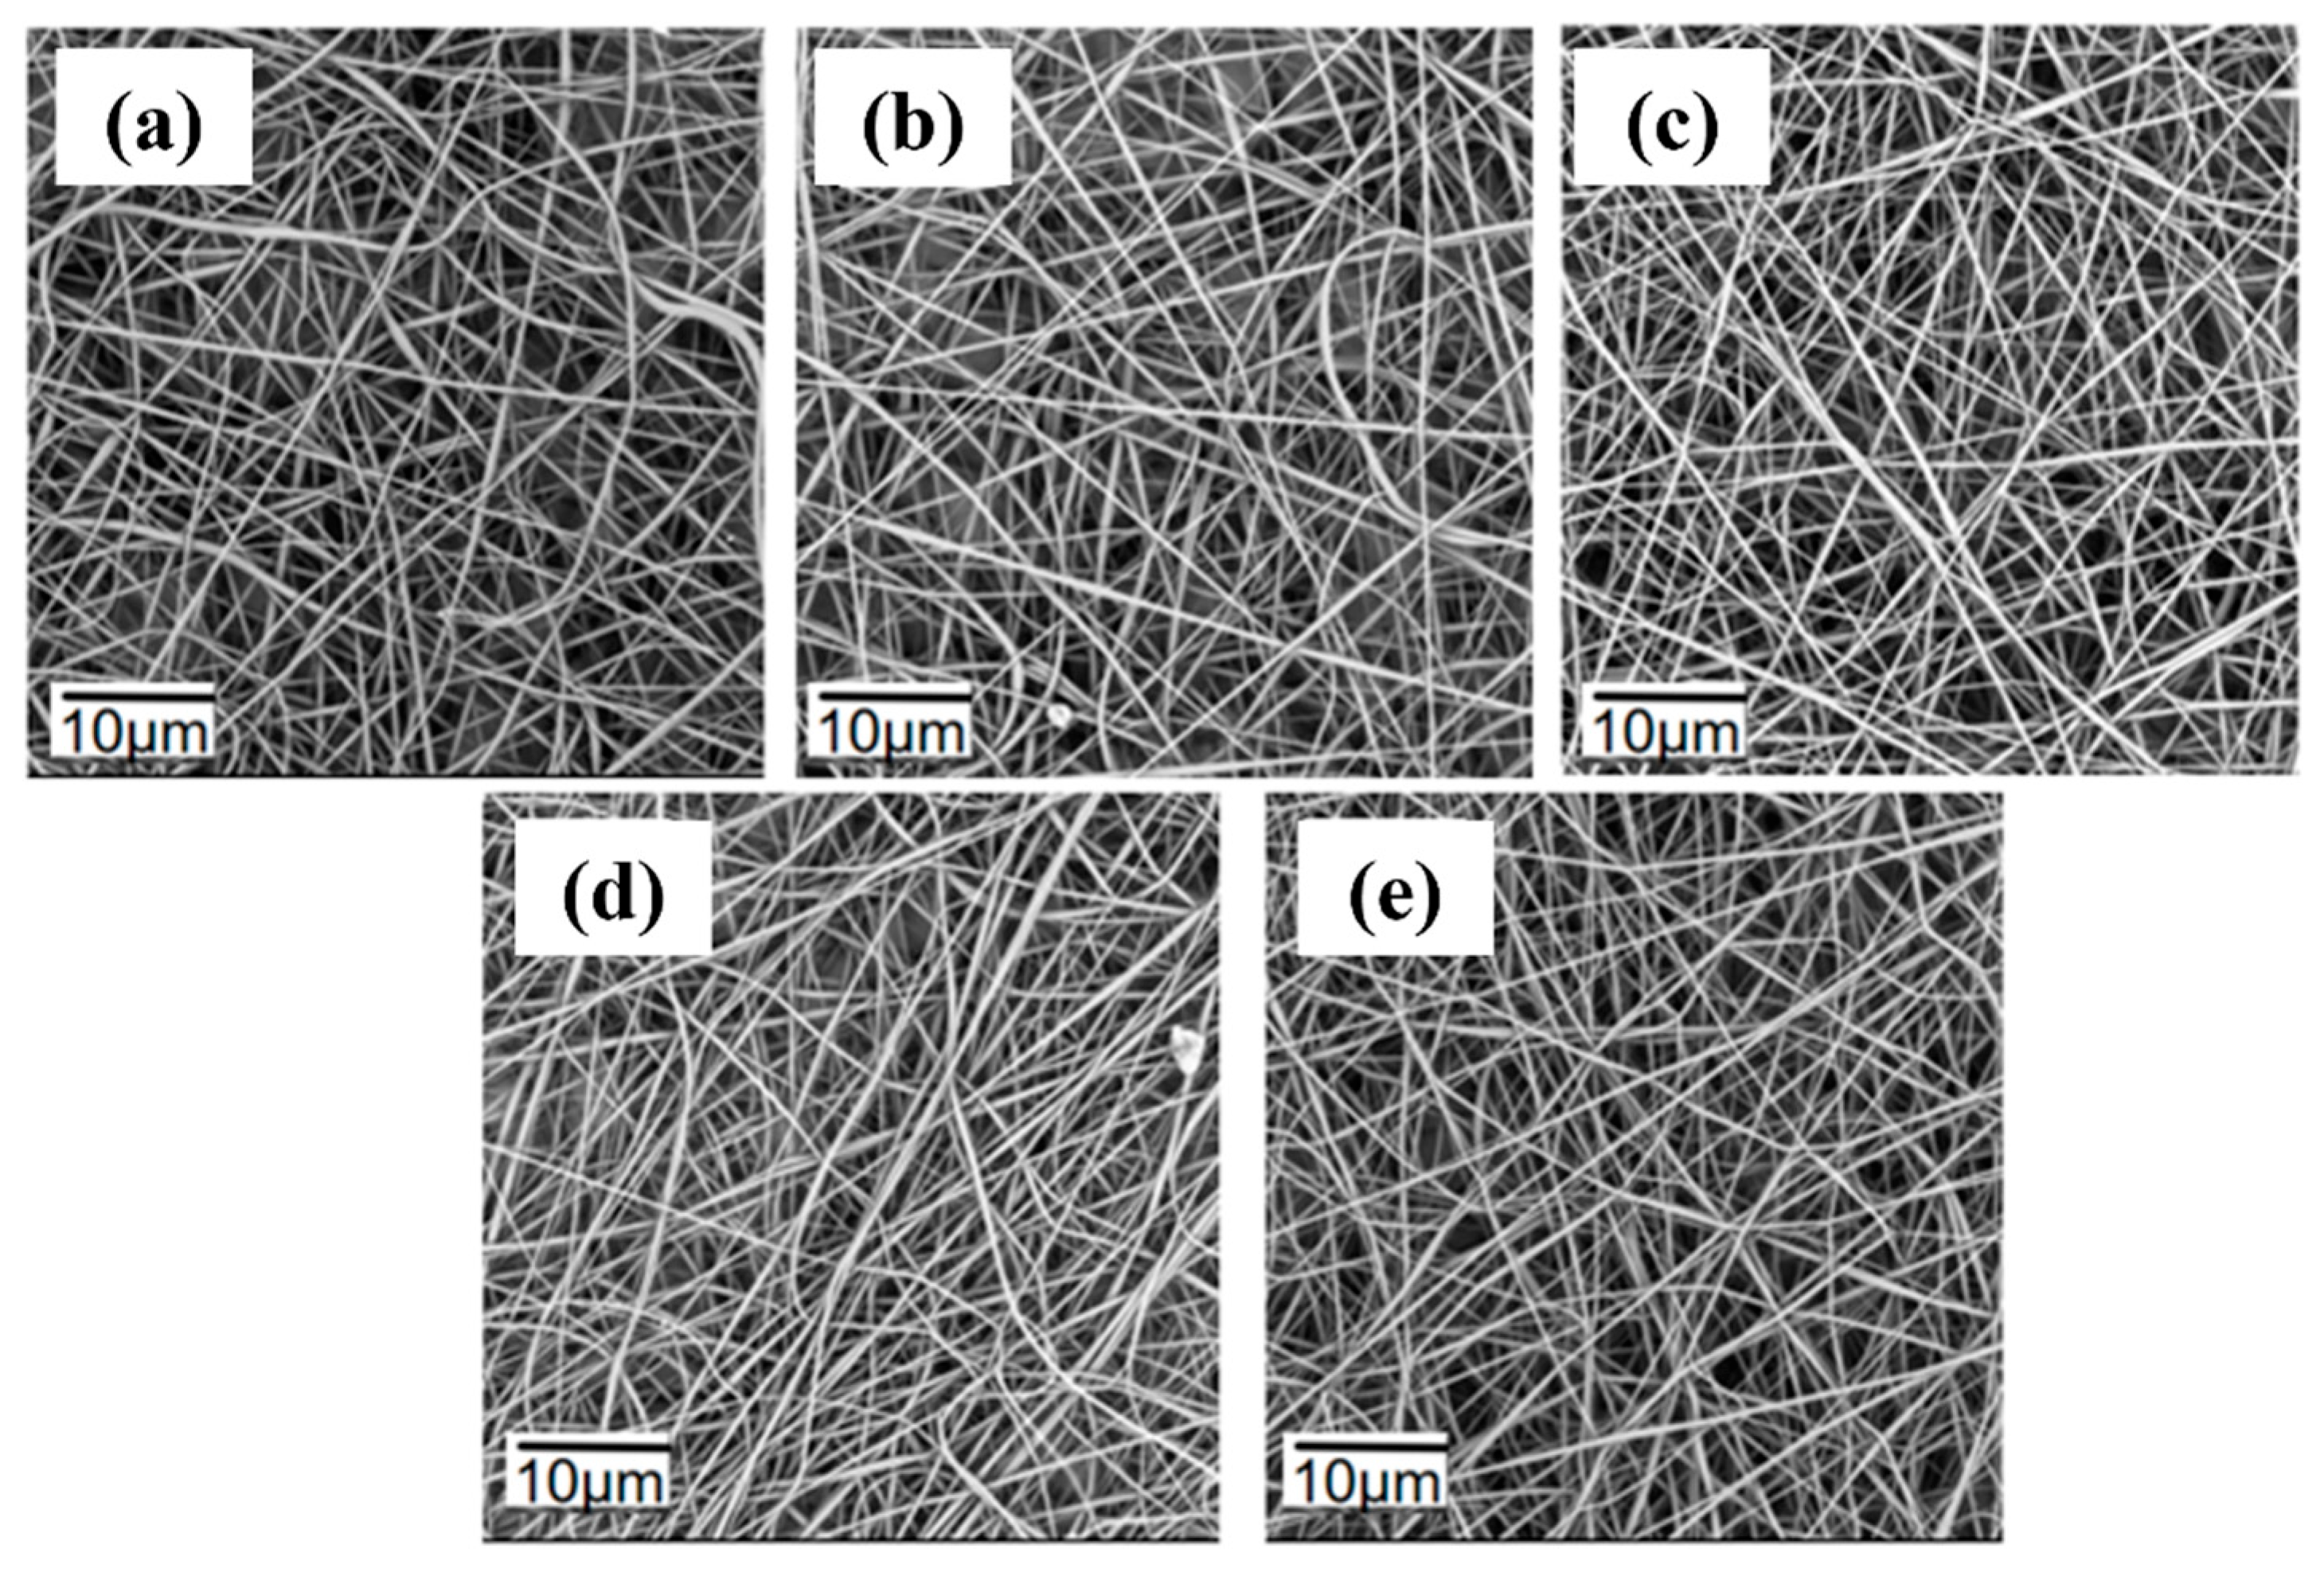
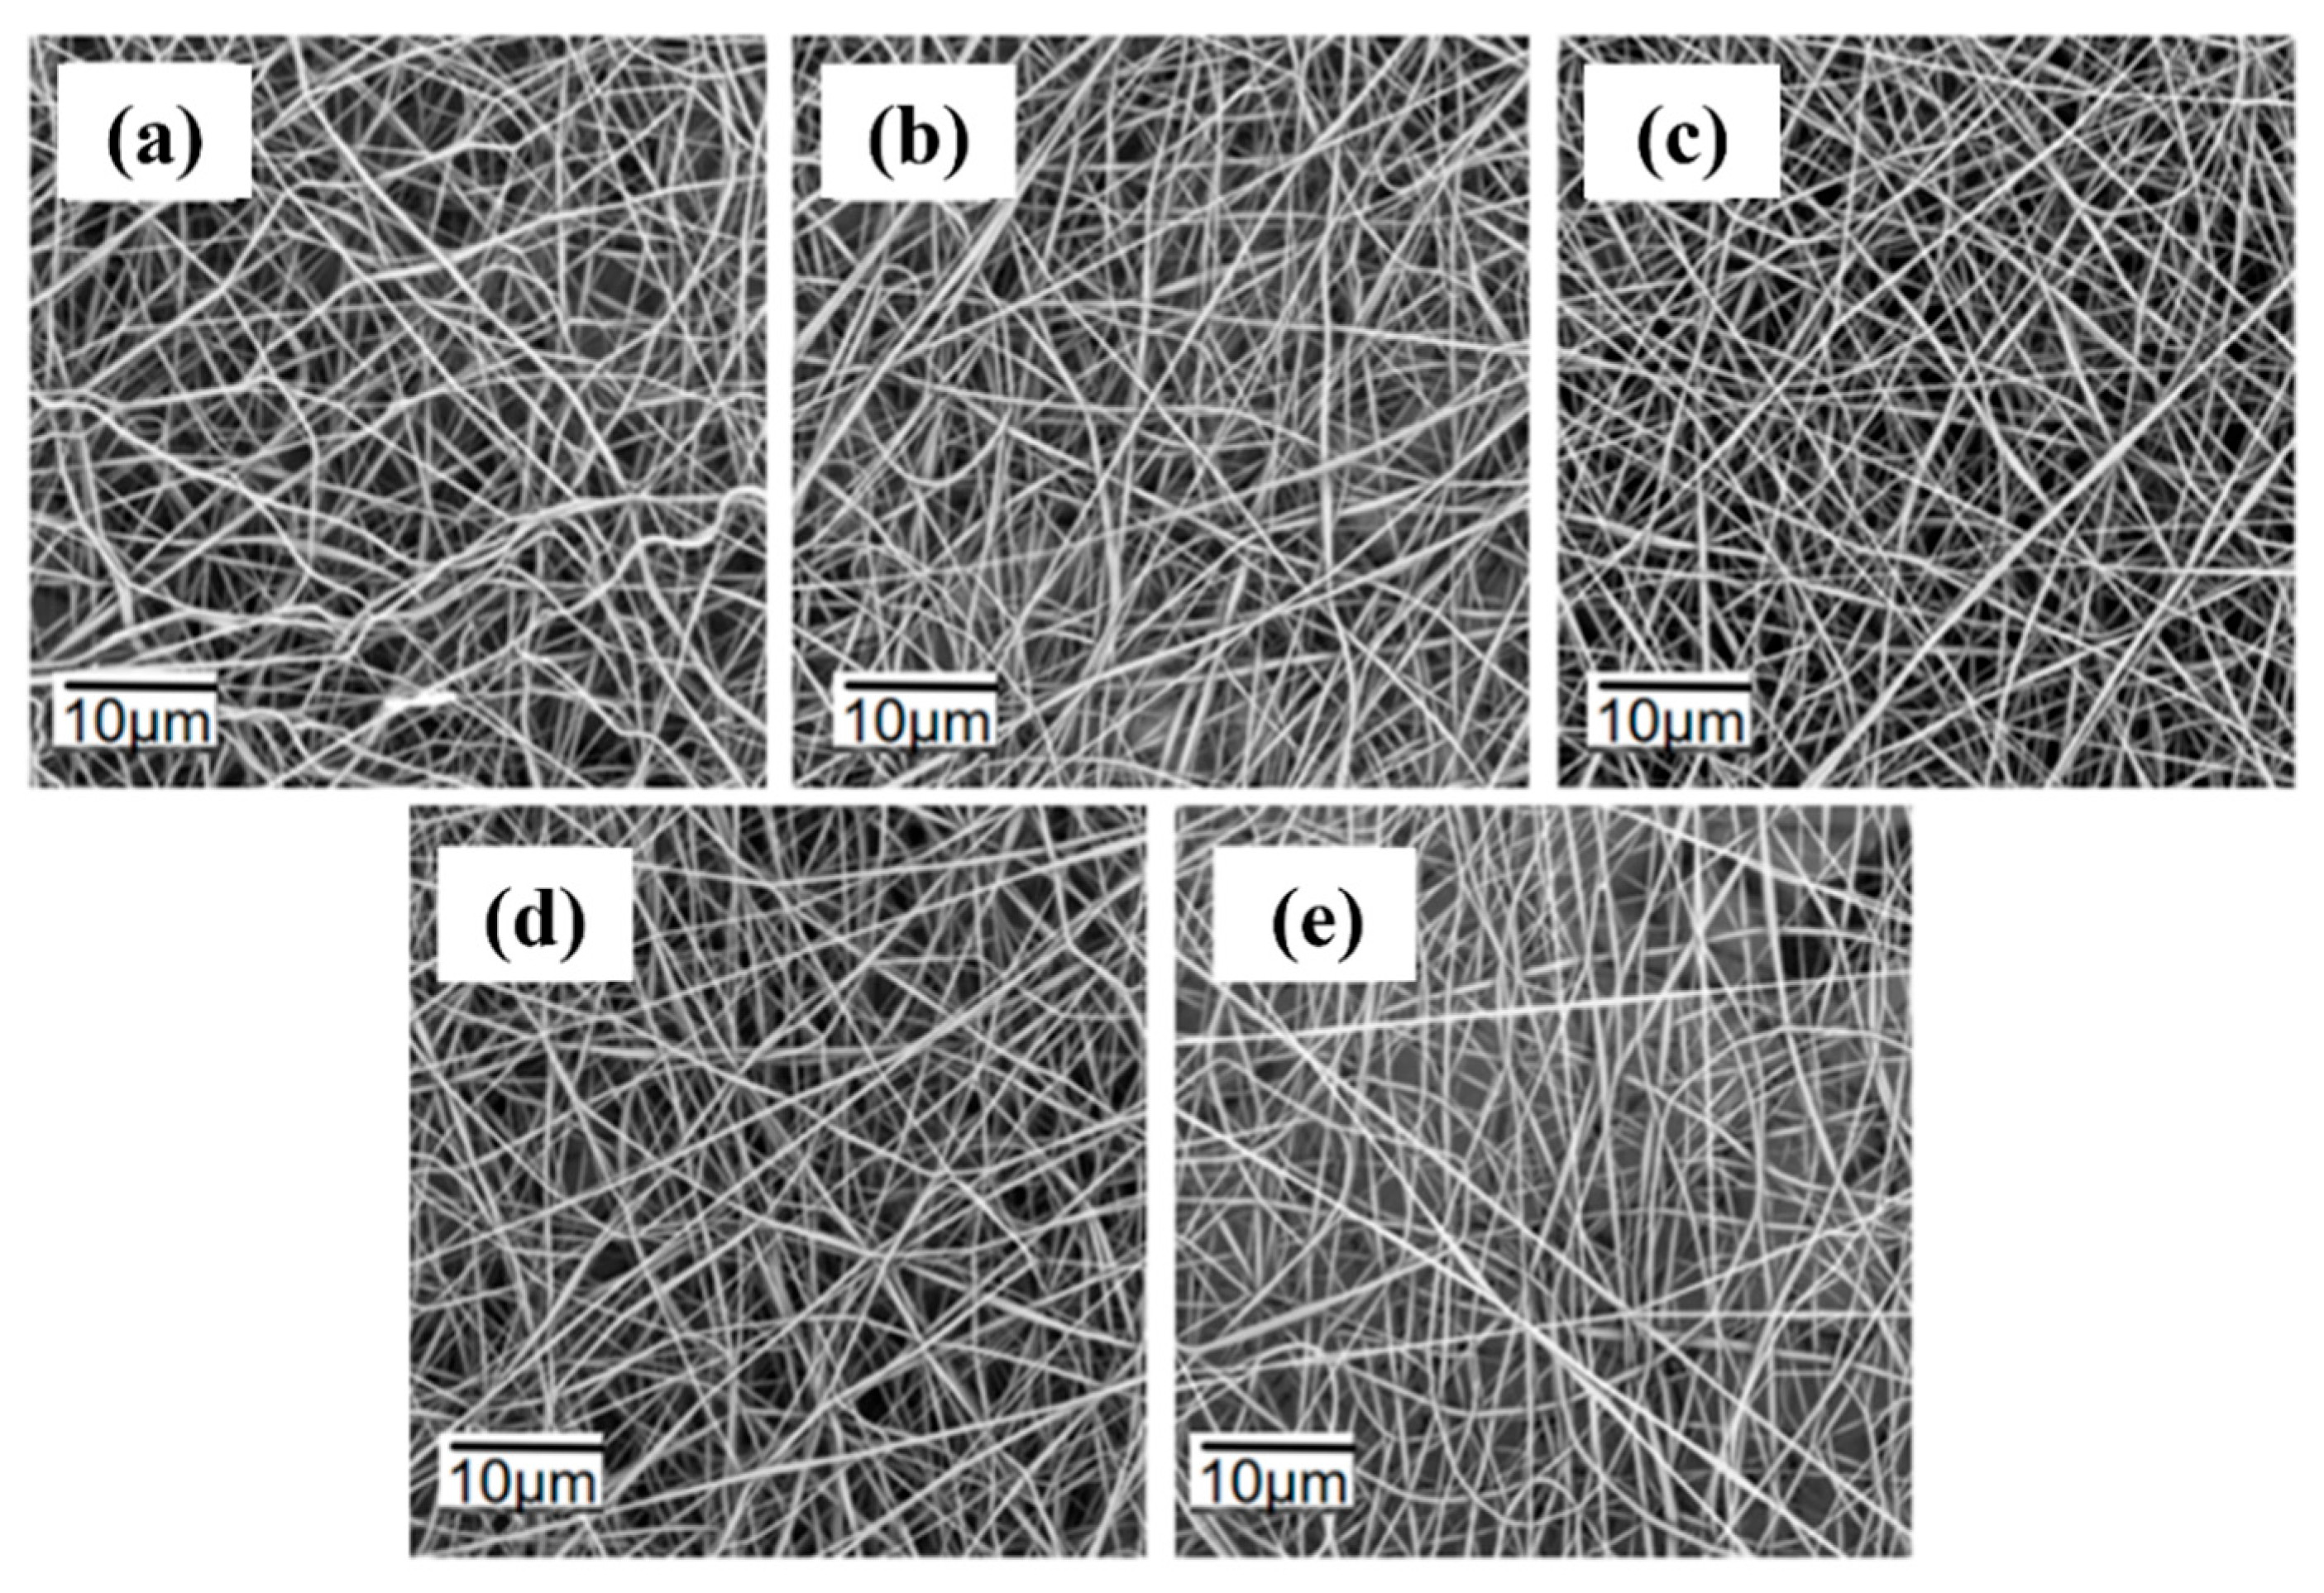
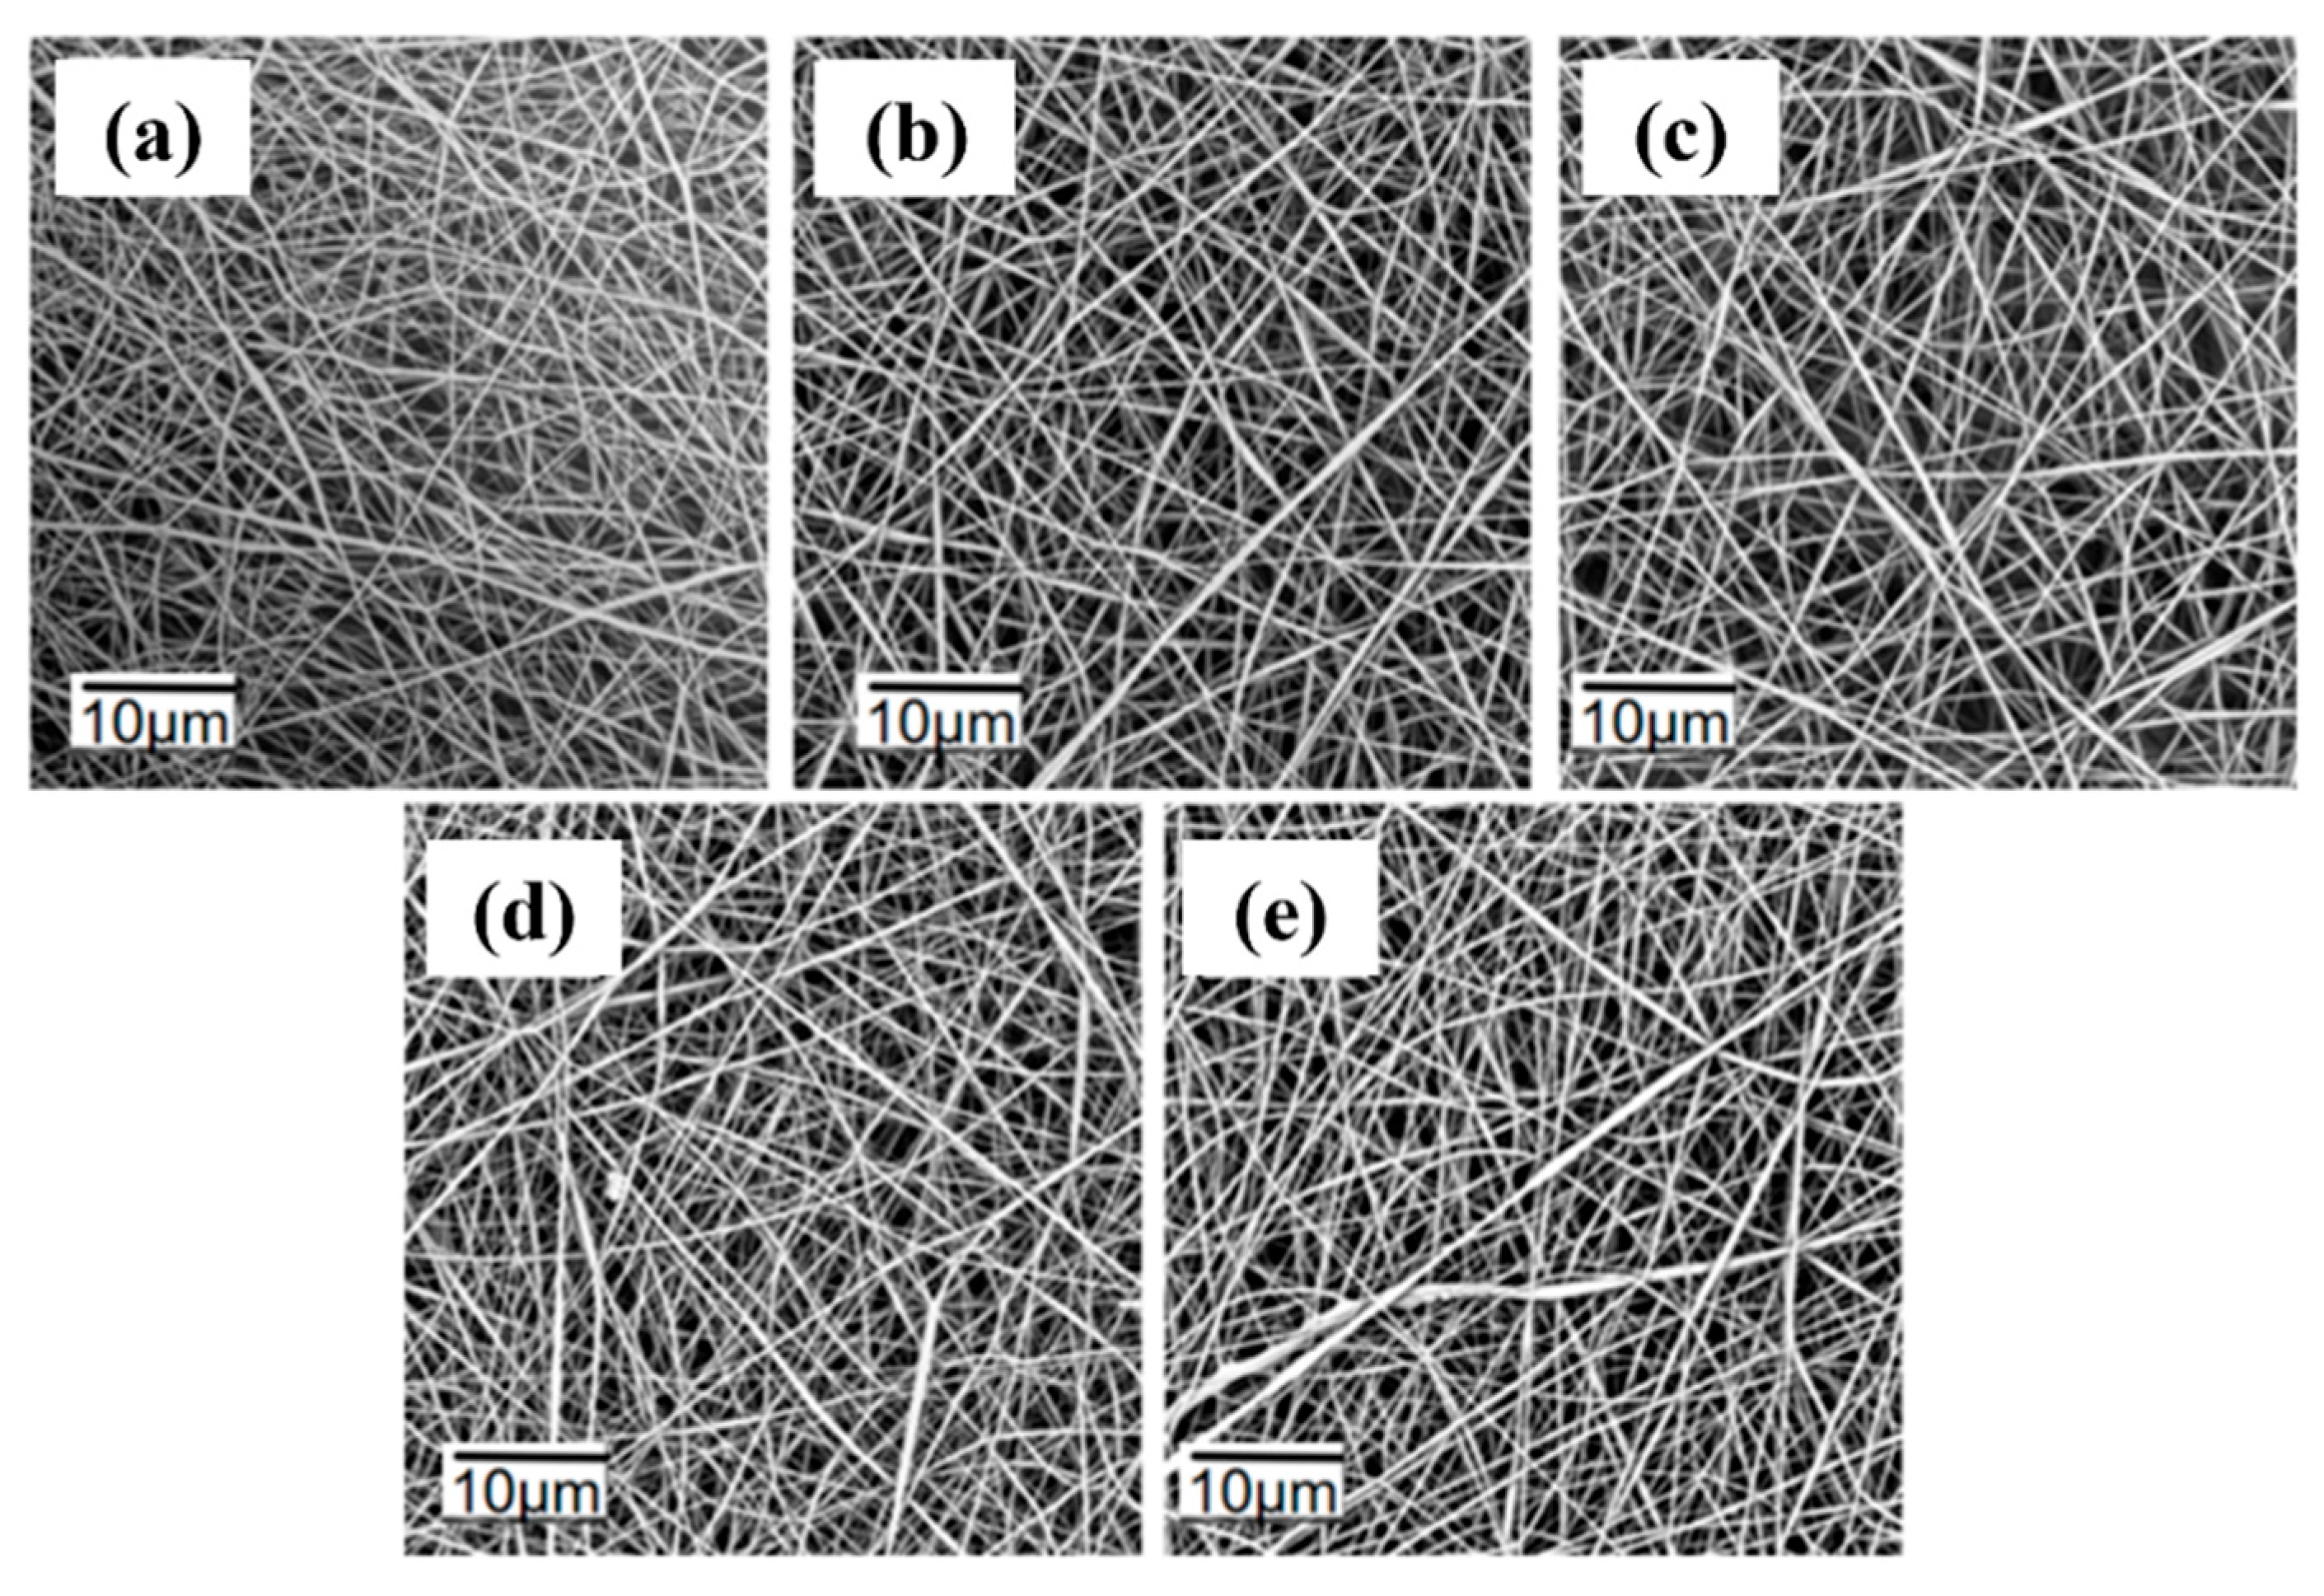
3.5. Morphological Analysis of Fluorescent Nanofiber Membranes
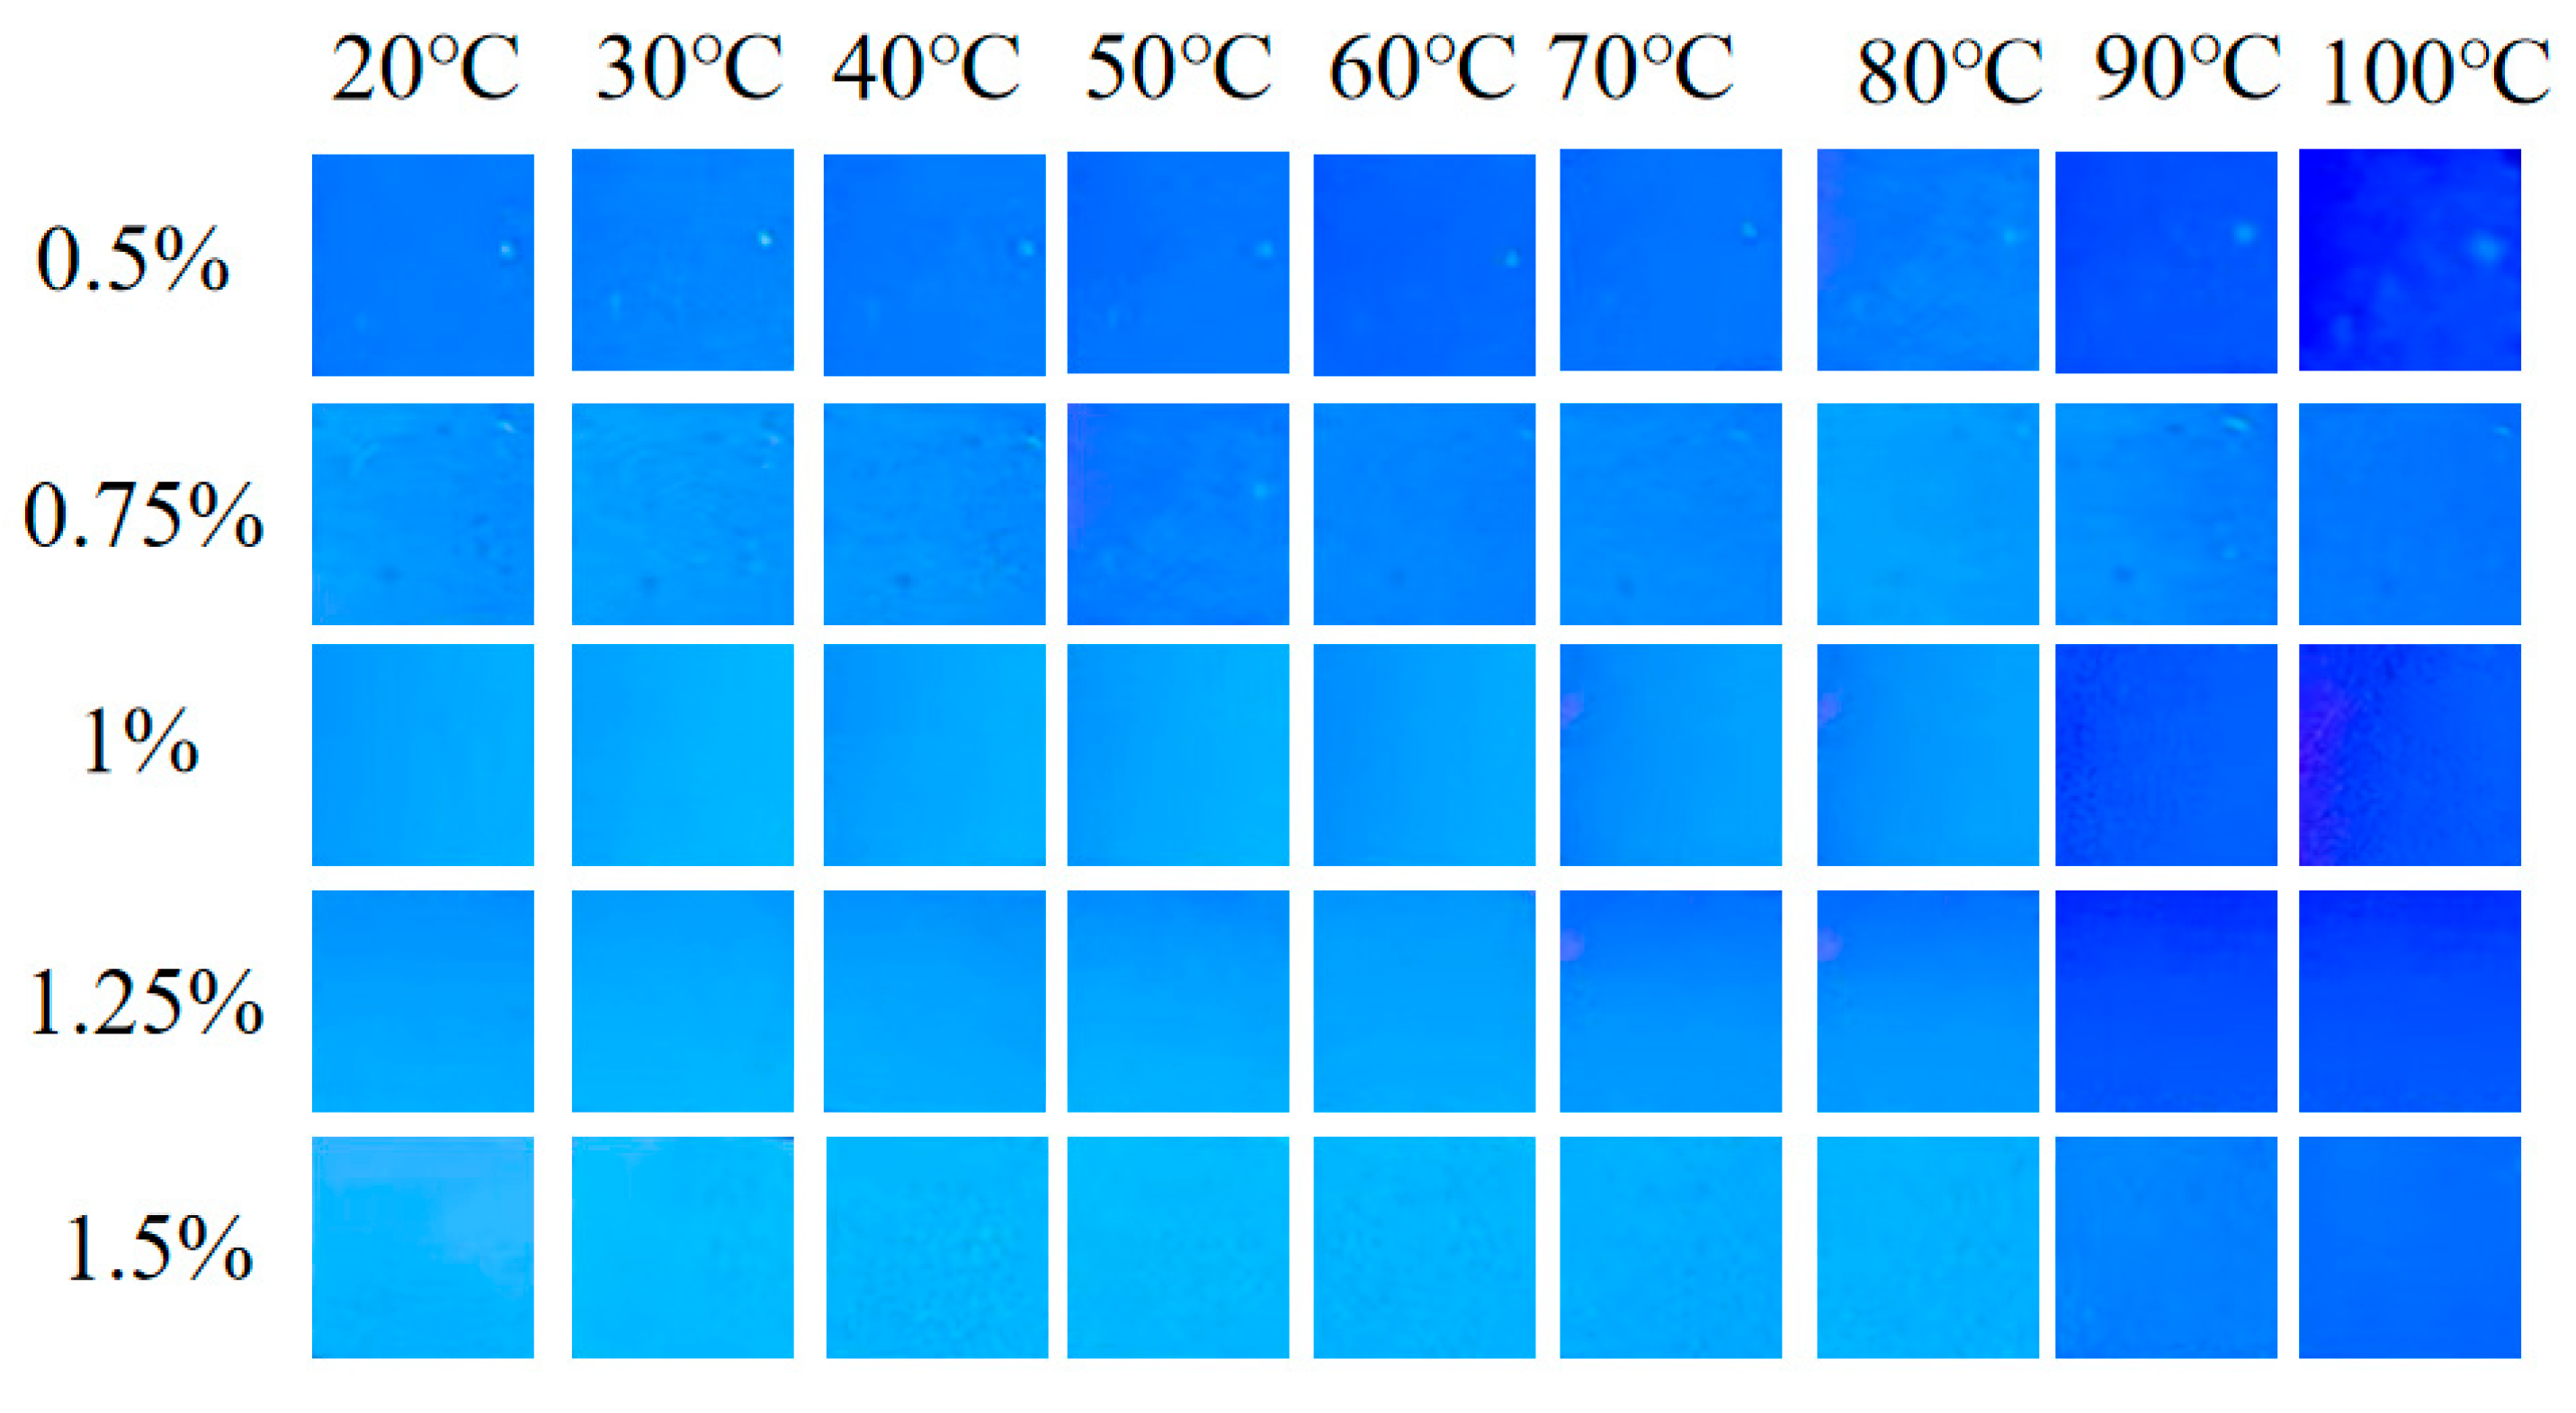
3.6. Thermal Sensitivity Analysis of Fluorescent Nanofiber Membranes
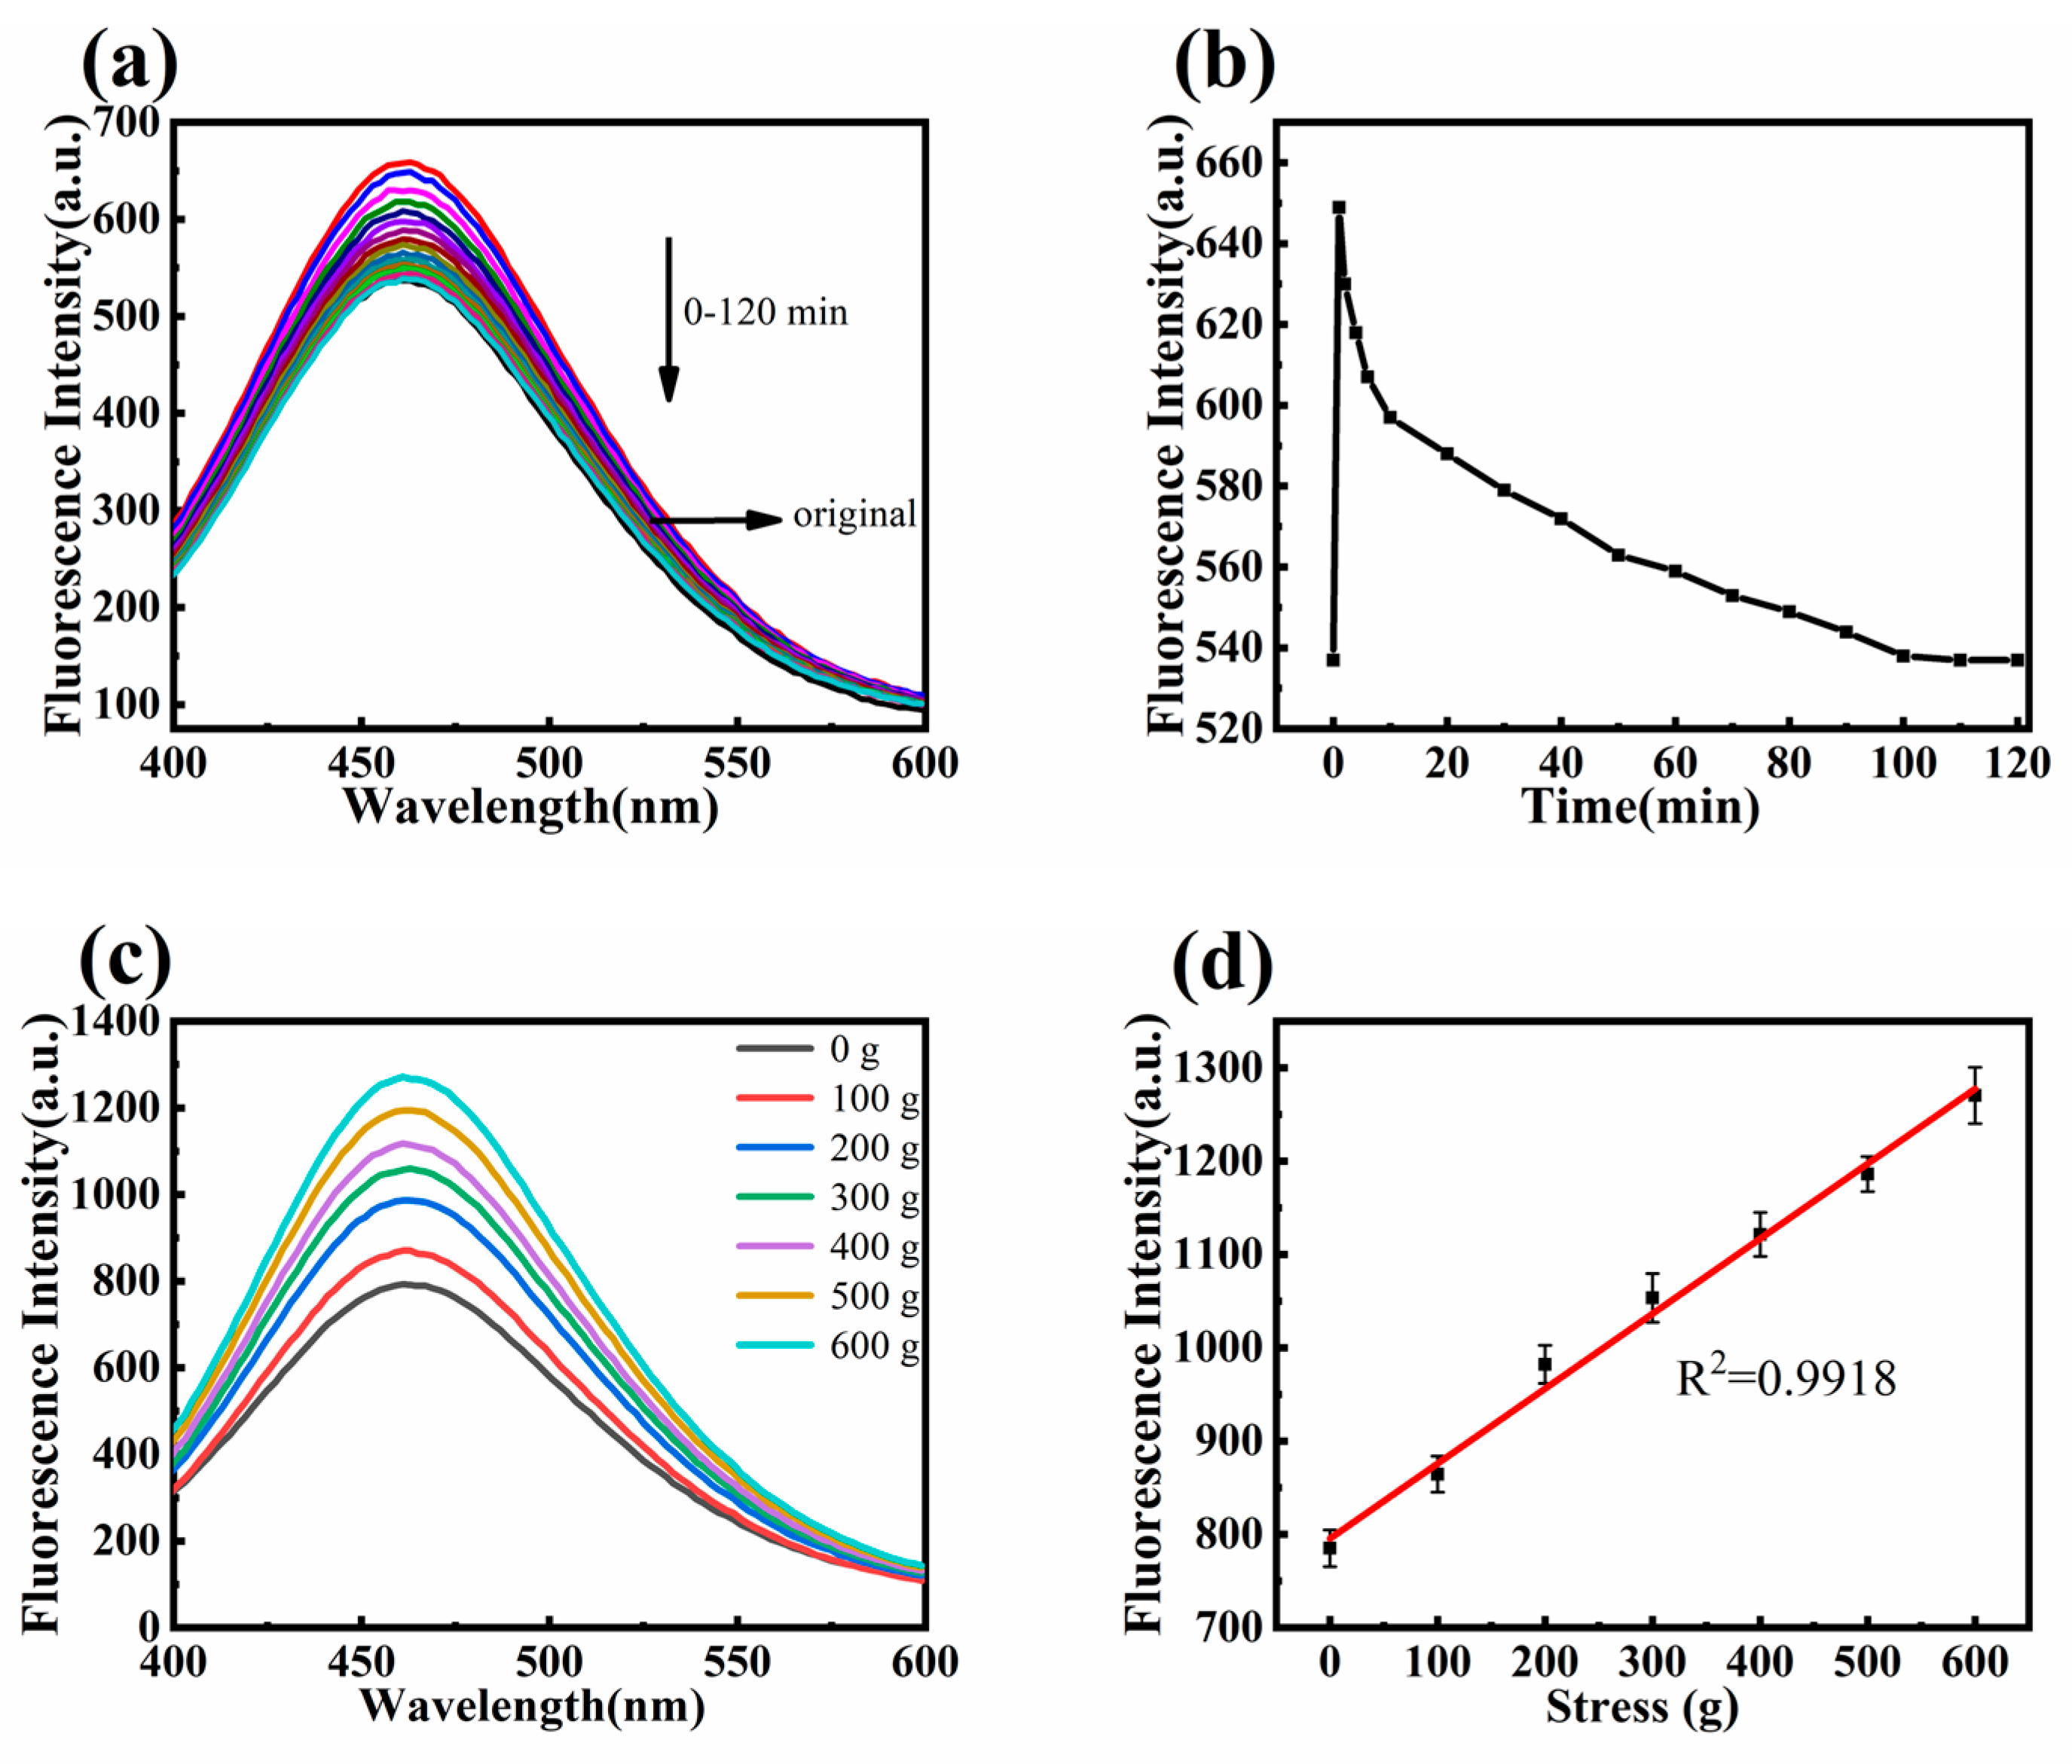
3.7. Pressure Sensitivity Analysis of Fluorescent Nanofiber Membranes
4. Conclusion
Supplementary Materials
Acknowledgments
References
- Zhang, M.X.; Song, W.L.; Tang, Y.X.; Xu, X.Z.; Huang, Y.N.; Yu, D.G. Polymer-Based Nanofiber-Nanoparticle Hybrids and Their Medical Applications. Polymers 2022, 14, 27. [Google Scholar] [CrossRef] [PubMed]
- Huang, J.T.; Liu, Y.W.; Lin, J.H.; Su, J.T.; Redshaw, C.; Feng, X.; Min, Y.G. Novel pyrene-based aggregation-induced emission luminogen (AIEgen) composite phase change fibers with satisfactory fluorescence anti-counterfeiting, temperature sensing, and high-temperature warning functions for solar-thermal energy storage. Adv. Compos. Hybrid Mater 2023, 6, 15. [Google Scholar] [CrossRef]
- Yang, Y.F.; Zhao, C.L.; Chen, X.D.; Yang, S.X.; Zhang, R.M.; Wang, Y.Q.; Wang, K.; Qian, J.; Long, L.L. Development of near-infrared fluorescent sensor and portable measuring device for on-site quantitation of Cys in food samples. Sens. Actuator B-Chem 2024, 414, 7. [Google Scholar] [CrossRef]
- Xue, K.; Wang, C.; Wang, J.X.; Lv, S.Y.; Hao, B.Y.; Zhu, C.L.; Tang, B.Z. A Sensitive and Reliable Organic Fluorescent Nanothermometer for Noninvasive Temperature Sensing. J. Am. Chem. Soc 2021, 143, 14147–14157. [Google Scholar] [CrossRef] [PubMed]
- Qi, F.X.; Xu, L.; He, Y.; Yan, H.; Liu, H. PVDF-Based Flexible Piezoelectric Tactile Sensors: Review. Cryst. Res. Technol. 2023, 58, 17. [Google Scholar] [CrossRef]
- Hujer, J.; Dancova, P.; Korinek, T.; Muller, M. Photolithographically Home-Made PVDF Sensor for Cavitation Impact Load Measurement. Processes 2021. [Google Scholar] [CrossRef]
- Hari, M.A.; Karumuthil, S.C.; Rajan, L. Optimization of PVDF nanocomposite based flexible piezoelectric tactile sensors: A comparative investigation. Sens. Actuator A-Phys 2023, 353, 7. [Google Scholar]
- Hernández-Rivera, D.; Rodríguez-Roldán, G.; Mora-Martínez, R.; Suaste-Gómez, E. A Capacitive Humidity Sensor Based on an Electrospun PVDF/Graphene Membrane. Sensors 2017, 17, 11. [Google Scholar] [CrossRef] [PubMed]
- Ooyama, Y.; Sugino, M.; EnoKi, T.; Yamamoto, K.; Tsunoji, N.; Ohshita, J. Aggregation-induced emission (AIE) characteristic of water-soluble tetraphenylethene (TPE) bearing four sulfonate salts. New J. Chem 2017, 41, 4747–4749. [Google Scholar] [CrossRef]
- Yang, Z.Y.; Qin, W.; Leung, N.L.C.; Arseneault, M.; Lam, J.W.Y.; Liang, G.D.; Sung, H.H.Y.; Williams, I.D.; Tang, B.Z. A mechanistic study of AIE processes of TPE luminogens: intramolecular rotation vs configurational isomerization. J. Mater. Chem. C 2016, 4, 99–107. [Google Scholar] [CrossRef]
- Wang, N.; Yao, H.; Tao, Q.; Sun, J.; Ma, H.; Wang, Y.; Zhou, C.C.; Fan, H.Y.; Shao, H.X.; Qin, A.J. TPE based aggregation induced emission fluorescent sensors for viscosity of liquid and mechanical properties of hydrogel. Chin. Chem. Lett 2022, 33, 252–256. [Google Scholar] [CrossRef]
- Ji, F.Y.; Wang, P.L.; Li, Z.R.; Ji, K.X.; Wang, D.Y.; Ma, Q. Cu superparticle-based aggregation induced enhancement strategy with PVDF-HFP/CeVO4 NP sensing interface for miR-103a detection. Talanta 2024, 276, 9. [Google Scholar] [CrossRef] [PubMed]
- Sobhan, M.A.; Lebedev, A.; Chng, L.L.; Anariba, F. Rapid Fabrication of Photoluminescent Electrospun Nanofibers without the Need of Chemical Polymeric Backbone Modifications. J. Nanomater. 2018, 2018, 7. [Google Scholar] [CrossRef]
- Peng, X.; Dai, Z.; Zhang, Q.; Gao, S.; Li, N. Intelligent microsphere-gel structures: Pioneering multi-range temperature sensing technology. Appl Mater Today 2024, 38, 102244. [Google Scholar] [CrossRef]
- Al-Abduljabbar, A.; Farooq, I. Electrospun Polymer Nanofibers: Processing, Properties, and Applications. Polymers 2022, 15. [Google Scholar] [CrossRef] [PubMed]
- Vinh, N.; Kim, H.-M. Electrospinning Fabrication and Performance Evaluation of Polyacrylonitrile Nanofiber for Air Filter Applications. Appl Sci-Basel 2016, 6. [Google Scholar] [CrossRef]
- Choi, S.Y.; Han, E.M.; Park, K.H. Porosity Control of Electrospun PAN/PMMA Nanofiber Webs. Mol Cryst Liq Cryst 2019, 688, 68–74. [Google Scholar] [CrossRef]
- Zhang, Q.; Zhou, R.; Peng, X.; Li, N.; Dai, Z. Development of Support Layers and Their Impact on the Performance of Thin Film Composite Membranes (TFC) for Water Treatment. Polymers 2023, 15. [Google Scholar] [CrossRef] [PubMed]
- Liu, H.; Jiang, W.; Yang, Z.; Chen, X.; Yu, D.-G.; Shao, J. Hybrid Films Prepared from a Combination of Electrospinning and Casting for Offering a Dual-Phase Drug Release. Polymers 2022, 14. [Google Scholar] [CrossRef]
- Yu, S.; Milam-Guerrero, J.; Tai, Y.; Yang, S.; Choi, Y.Y.; Nam, J.; Myung, N.V. Maximizing Polyacrylonitrile Nanofiber Piezoelectric Properties through the Optimization of Electrospinning and Post-thermal Treatment Processes. Appl Polym Mater 2021, 4, 635–644. [Google Scholar] [CrossRef]
- de Almeida, D.S.; Duarte, E.H.; Hashimoto, E.M.; Turbiani, F.R.B.; Muniz, E.C.; de Souza, P.R.; Gimenes, M.L.; Martins, L.D. Development and characterization of electrospun cellulose acetate nanofibers modified by cationic surfactant. Polymer Testing 2020, 81. [Google Scholar] [CrossRef]
- Shi, S.; Si, Y.; Han, Y.; Wu, T.; Iqbal, M.I.; Fei, B.; Li, R.K.Y.; Hu, J.; Qu, J. Recent Progress in Protective Membranes Fabricated via Electrospinning: Advanced Materials, Biomimetic Structures, and Functional Applications. Adv Mater 2022, 34. [Google Scholar] [CrossRef] [PubMed]
- Zhu, F.; Zheng, Y.-M.; Zhang, B.-G.; Dai, Y.-R. A critical review on the electrospun nanofibrous membranes for the adsorption of heavy metals in water treatment. J Hazard Mater:2021, 401.
- Bhatta, T.; Sharma, S.; Shrestha, K.; Shin, Y.; Seonu, S.; Lee, S.; Kim, D.; Sharifuzzaman, M.; Rana, S.M.S.; Park, J.Y. Siloxene/PVDF Composite Nanofibrous Membrane for High-Performance Triboelectric Nanogenerator and Self-Powered Static and Dynamic Pressure Sensing Applications. Adv. Funct. Mater 2022, 32, 15. [Google Scholar] [CrossRef]
- Xiong, J.P.; Wang, L.; Liang, F.H.; Li, M.Y.; Yabuta, Y.; Iqbal, M.A.; Mayakrishnan, G.; Shi, J.; Kim, I.S. Flexible Piezoelectric Sensor Based on Two-Dimensional Topological Network of PVDF/DA Composite Nanofiber Membrane. Adv. Fiber Mater 2024, 17. [Google Scholar] [CrossRef]
- Chen, H.; Li, N.; Lin, Y.S.; Dai, Z. Research progress on nanofiber-based support layers in forward/osmosis composite membranes. Fine Chemicals 2023, 10, 1–12. [Google Scholar]
- Wang, T.; Kumar, S. Electrospinning of polyacrylonitrile nanofibers. J Appl Polym Sci 2006, 102, 1023–1029. [Google Scholar] [CrossRef]
- Du, J.; Shintay, S.; Zhang, X. Diameter control of electrospun polyacrylonitrile/iron acetylacetonate ultrafine nanofibers. J Polym Sci Pol Phys 2008, 46, 1611–1618. [Google Scholar] [CrossRef]
- Chang, W.M.; Wang, C.C.; Chen, C.Y. The combination of electrospinning and forcespinning: Effects on a viscoelastic jet and a single nanofiber. Chem Eng J 2014, 244, 540–551. [Google Scholar] [CrossRef]
- Papkov, D.; Delpouve, N.; Delbreilh, L.; Araujo, S.; Stockdale, T.; Mamedov, S.; Maleckis, K.; Zou, Y.; Andalib, M.N.; Dargent, E.; et al. Quantifying Polymer Chain Orientation in Strong and Tough Nanofibers with Low Crystallinity: Toward Next Generation Nanostructured Superfibers. ACS Nano 2019, 13, 4893–4927. [Google Scholar] [CrossRef]
- Kirecci, A.; Özkoç, Ü.; Içoglu, H.I. Determination of optimal production parameters for polyacrylonitrile nanofibers. J Appl Polym Sci 2012, 124, 4961–4968. [Google Scholar] [CrossRef]
- Armaghani, D.J.; Asteris, P.G. A comparative study of ANN and ANFIS models for the prediction of cement-based mortar materials compressive strength. Neural Comput Appl 2020, 33, 4501–4532. [Google Scholar] [CrossRef]
- Premasudha, M.; Bhumi Reddy, S.R.; Lee, Y.J.; Panigrahi, B.B.; Cho, K.K.; Nagireddy Gari, S.R. Using artificial neural networks to model and interpret electrospun polysaccharide (Hylon VII starch) nanofiber diameter. J Appl Polym Sci 2020, 138. [Google Scholar] [CrossRef]
- Santos, A.F.; Aguado, R.; Corazza, M.L.; Tarrés, Q.; Sanchez-Salvador, J.-L.; Blanco, A.; Negro, C.; Delgado-Aguilar, M. Artificial neural network for aspect ratio prediction of lignocellulosic micro/nanofibers. Cellulose 2022, 29, 5609–5622. [Google Scholar] [CrossRef]
- Ahmad, T.; Chen, H.X. A review on machine learning forecasting growth trends and their real-time applications in different energy systems. Sust. Cities Soc 2020, 54, 27. [Google Scholar] [CrossRef]
- Lakshmi Narayana, P.; Wang, X.S.; Yeom, J.T.; Maurya, A.K.; Bang, W.S.; Srikanth, O.; Harinatha Reddy, M.; Hong, J.K.; Subba Reddy, N.G. Correlating the 3D melt electrospun polycaprolactone fiber diameter and process parameters using neural networks. J Appl Polym Sci 2021, 138. [Google Scholar] [CrossRef]
- Samadian, H.; Zakariaee, S.S.; Faridi-Majidi, R. Evaluation of effective needleless electrospinning parameters controlling polyacrylonitrile nanofibers diameter via modeling artificial neural networks. J. Text. Inst 2019, 110, 477–486. [Google Scholar] [CrossRef]
- Khatti, T.; Naderi-Manesh, H.; Kalantar, S.M. Prediction of diameter in blended nanofibers of polycaprolactone-gelatin using ANN and RSM. Fiber Polym 2017, 18, 2368–2378. [Google Scholar] [CrossRef]
- Ma, M.; Zhou, H.C.; Gao, S.H.; Li, N.; Guo, W.J.; Dai, Z. Analysis and Prediction of Electrospun Nanofiber Diameter Based on Artificial Neural Network. Polymers 2023, 15. [Google Scholar] [CrossRef] [PubMed]
- Wang, F.J.; Elbadawi, M.; Tsilova, S.L.; Gaisford, S.; Basit, A.W.; Parhizkar, M. Machine learning to empower electrohydrodynamic processing. Mater. Sci. Eng. C-Mater. Biol. Appl 2022, 132, 14. [Google Scholar] [CrossRef]
- Rubio, J.D. Stability Analysis of the Modified Levenberg-Marquardt Algorithm for the Artificial Neural Network Training. Ieee T Neur Net Lear 2021, 32, 3510–3524. [Google Scholar] [CrossRef]
- Sherwani, F.; Ibrahim, B.; Asad, M.M. Hybridized classification algorithms for data classification applications: A review. Egypt. Inform. J 2021, 22, 185–192. [Google Scholar] [CrossRef]
- Reddy, B.S.; In, K.H.; Panigrahi, B.B.; Paturi, U.M.R.; Cho, K.K.; Reddy, N.S. Modeling tensile strength and suture retention of polycaprolactone electrospun nanofibrous scaffolds by artificial neural networks. Mater Today Commun 2021, 26. [Google Scholar] [CrossRef]
- Malayeri, M.; Nasiri, F.; Haghighat, F.; Lee, C.S. Optimization of photocatalytic oxidation reactor for air purifier design: Application of artificial neural network and genetic algorithm. Chem Eng J 2023, 462, 12. [Google Scholar] [CrossRef]
- Narayana, P.L.; Wang, X.S.; Yeom, J.T.; Maurya, A.K.; Bang, W.S.; Srikanth, O.; Reddy, M.H.; Hong, J.K.; Reddy, N.G.S. Correlating the 3D melt electrospun polycaprolactone fiber diameter and process parameters using neural networks. J Appl Polym Sci 2021, 138, 10. [Google Scholar]
- Armaghani, D.J.; Asteris, P.G. A comparative study of ANN and ANFIS models for the prediction of cement-based mortar materials compressive strength. Neural Comput. Appl 2021, 33, 4501–4532. [Google Scholar] [CrossRef]
- Armaghani, D.J.; Mirzaei, F.; Shariati, M.; Trung, N.T.; Shariati, M.; Trnavac, D. Hybrid ANN-based techniques in predicting cohesion of sandy-soil combined with fiber. Geomech. Eng 2020, 20, 191–205. [Google Scholar]
- Han, Y.; Liu, B.; Wu, Y.F.; Mao, Y.Y.; Zhao, L.L.; Nan, T.; Wang, J.; Zhang, Y.L.; Tang, R.; Liu, Y.; et al. High-sensitivity high-temperature sensor based on multi-microspheres improved Michelson interferometer. Opt. Commun 2021, 491, 7. [Google Scholar] [CrossRef]
- Wang, K.; He, Q.; Yang, D.R.; Pi, X.D. Erbium-Hyperdoped Silicon Quantum Dots: A Platform of Ratiometric Near-Infrared Fluorescence. Adv. Opt. Mater 2022, 10, 9. [Google Scholar] [CrossRef]
- Chen, M.H.; He, Y.C.; Liang, H.H.; Zhou, H.Y.; Wang, X.; Heng, X.B.; Zhang, Z.S.; Gan, J.L.; Yang, Z.M. Stretchable and Strain-Decoupled Fluorescent Optical Fiber Sensor for Body Temperature and Movement Monitoring. ACS Photonics 2022, 9, 1415–1424. [Google Scholar] [CrossRef]
- Listewnik, P.; Bechelany, M.; Wierzba, P.; Szczerska, M. Optical-Fiber Microsphere-Based Temperature Sensors with ZnO ALD Coating-Comparative Study. Sensors 2021, 21, 11. [Google Scholar] [CrossRef]
- Yang, Y.; Zhang, X.B.; Zhang, Q.; Xie, Y.; Wang, Z.J.; Yu, Y.; Wang, Y.; Dong, Y.H.; Huang, Y.; Wang, T.Y. Packaged Temperature Sensor Based on Fluorescent Microsphere With an Embedded Fiber Microlens. IEEE Photonics Technol. Lett 2023, 35, 398–401. [Google Scholar] [CrossRef]
- Yu, J.B.; Lewis, E.; Brambilla, G.; Wang, P.F. Temperature Sensing Performance of Microsphere Resonators. Sensors 2018, 18, 15. [Google Scholar] [CrossRef] [PubMed]
- Nguyen, T.V.; Nguyen, T.D.; Mai, H.H.; Pham, N.V.; Ta, V.D.; Nguyen, T.A. Biological miniature temperature sensor based on monodisperse microsphere lasers fabricated by soft microfluidic technology. J. Phys. D-Appl. Phys 2022, 55, 5. [Google Scholar] [CrossRef]



| Component Materials | Structure | Average particle size | Temperature measurement method | Temperature range | Sensitivity |
|---|---|---|---|---|---|
| SiO2 | Arrays | 220 µm | Ratio of FL | 100-800 ℃ | 0.15 nm/°C[48] |
| Er3+- Silica | Core-shell | 4 µm | Emission intensity | 4-204 ℃ | -0.53/K[49] |
| Y2O3@Er3+/Yb3+- Silica | Core-shell | 800 µm | Current ratio | -10-60 ℃ | 1.3 % /℃[50] |
| ZnO - Silica | Shell-core | 100 µm | Peak position | 100-300 ℃ | 0.019 nm/℃[51] |
| Er3--Yb3+@ Tellurite glass | Hollow | 50 µm | Ratio of FL Intensity | 30-110 ℃ | 1.11×10⁻²/K[52] |
| PS | Solid | 91.7 µm | WGM Wavelength shift | 20-70 ℃ | 0.61796 nm/°C[53] |
| PDMS | Solid | 85 µm | Laser wavelength | 25-50 ℃ | 0.47 nm/°C[54] |
| This work | Solid | 680 nm | Gray value | 20-100 ℃ | -0.638 gray value/℃ |
| This work | Solid | 680 nm | FL emission value | 20-100 ℃ | -7.3 a.u./℃ |
Disclaimer/Publisher’s Note: The statements, opinions and data contained in all publications are solely those of the individual author(s) and contributor(s) and not of MDPI and/or the editor(s). MDPI and/or the editor(s) disclaim responsibility for any injury to people or property resulting from any ideas, methods, instructions or products referred to in the content. |
© 2024 by the authors. Licensee MDPI, Basel, Switzerland. This article is an open access article distributed under the terms and conditions of the Creative Commons Attribution (CC BY) license (http://creativecommons.org/licenses/by/4.0/).


