Submitted:
22 July 2024
Posted:
24 July 2024
You are already at the latest version
Abstract
Keywords:
1. Introduction
2. Results
2.1. Functionalized Nanoparticles FM
2.2. Functionalized Nanoparticles FN
3. Materials and Methods
3.1. Synthesis of Nanoparticles
3.2. Functionalization of Nanoparticles
3.3. Characterization of Nanoparticles
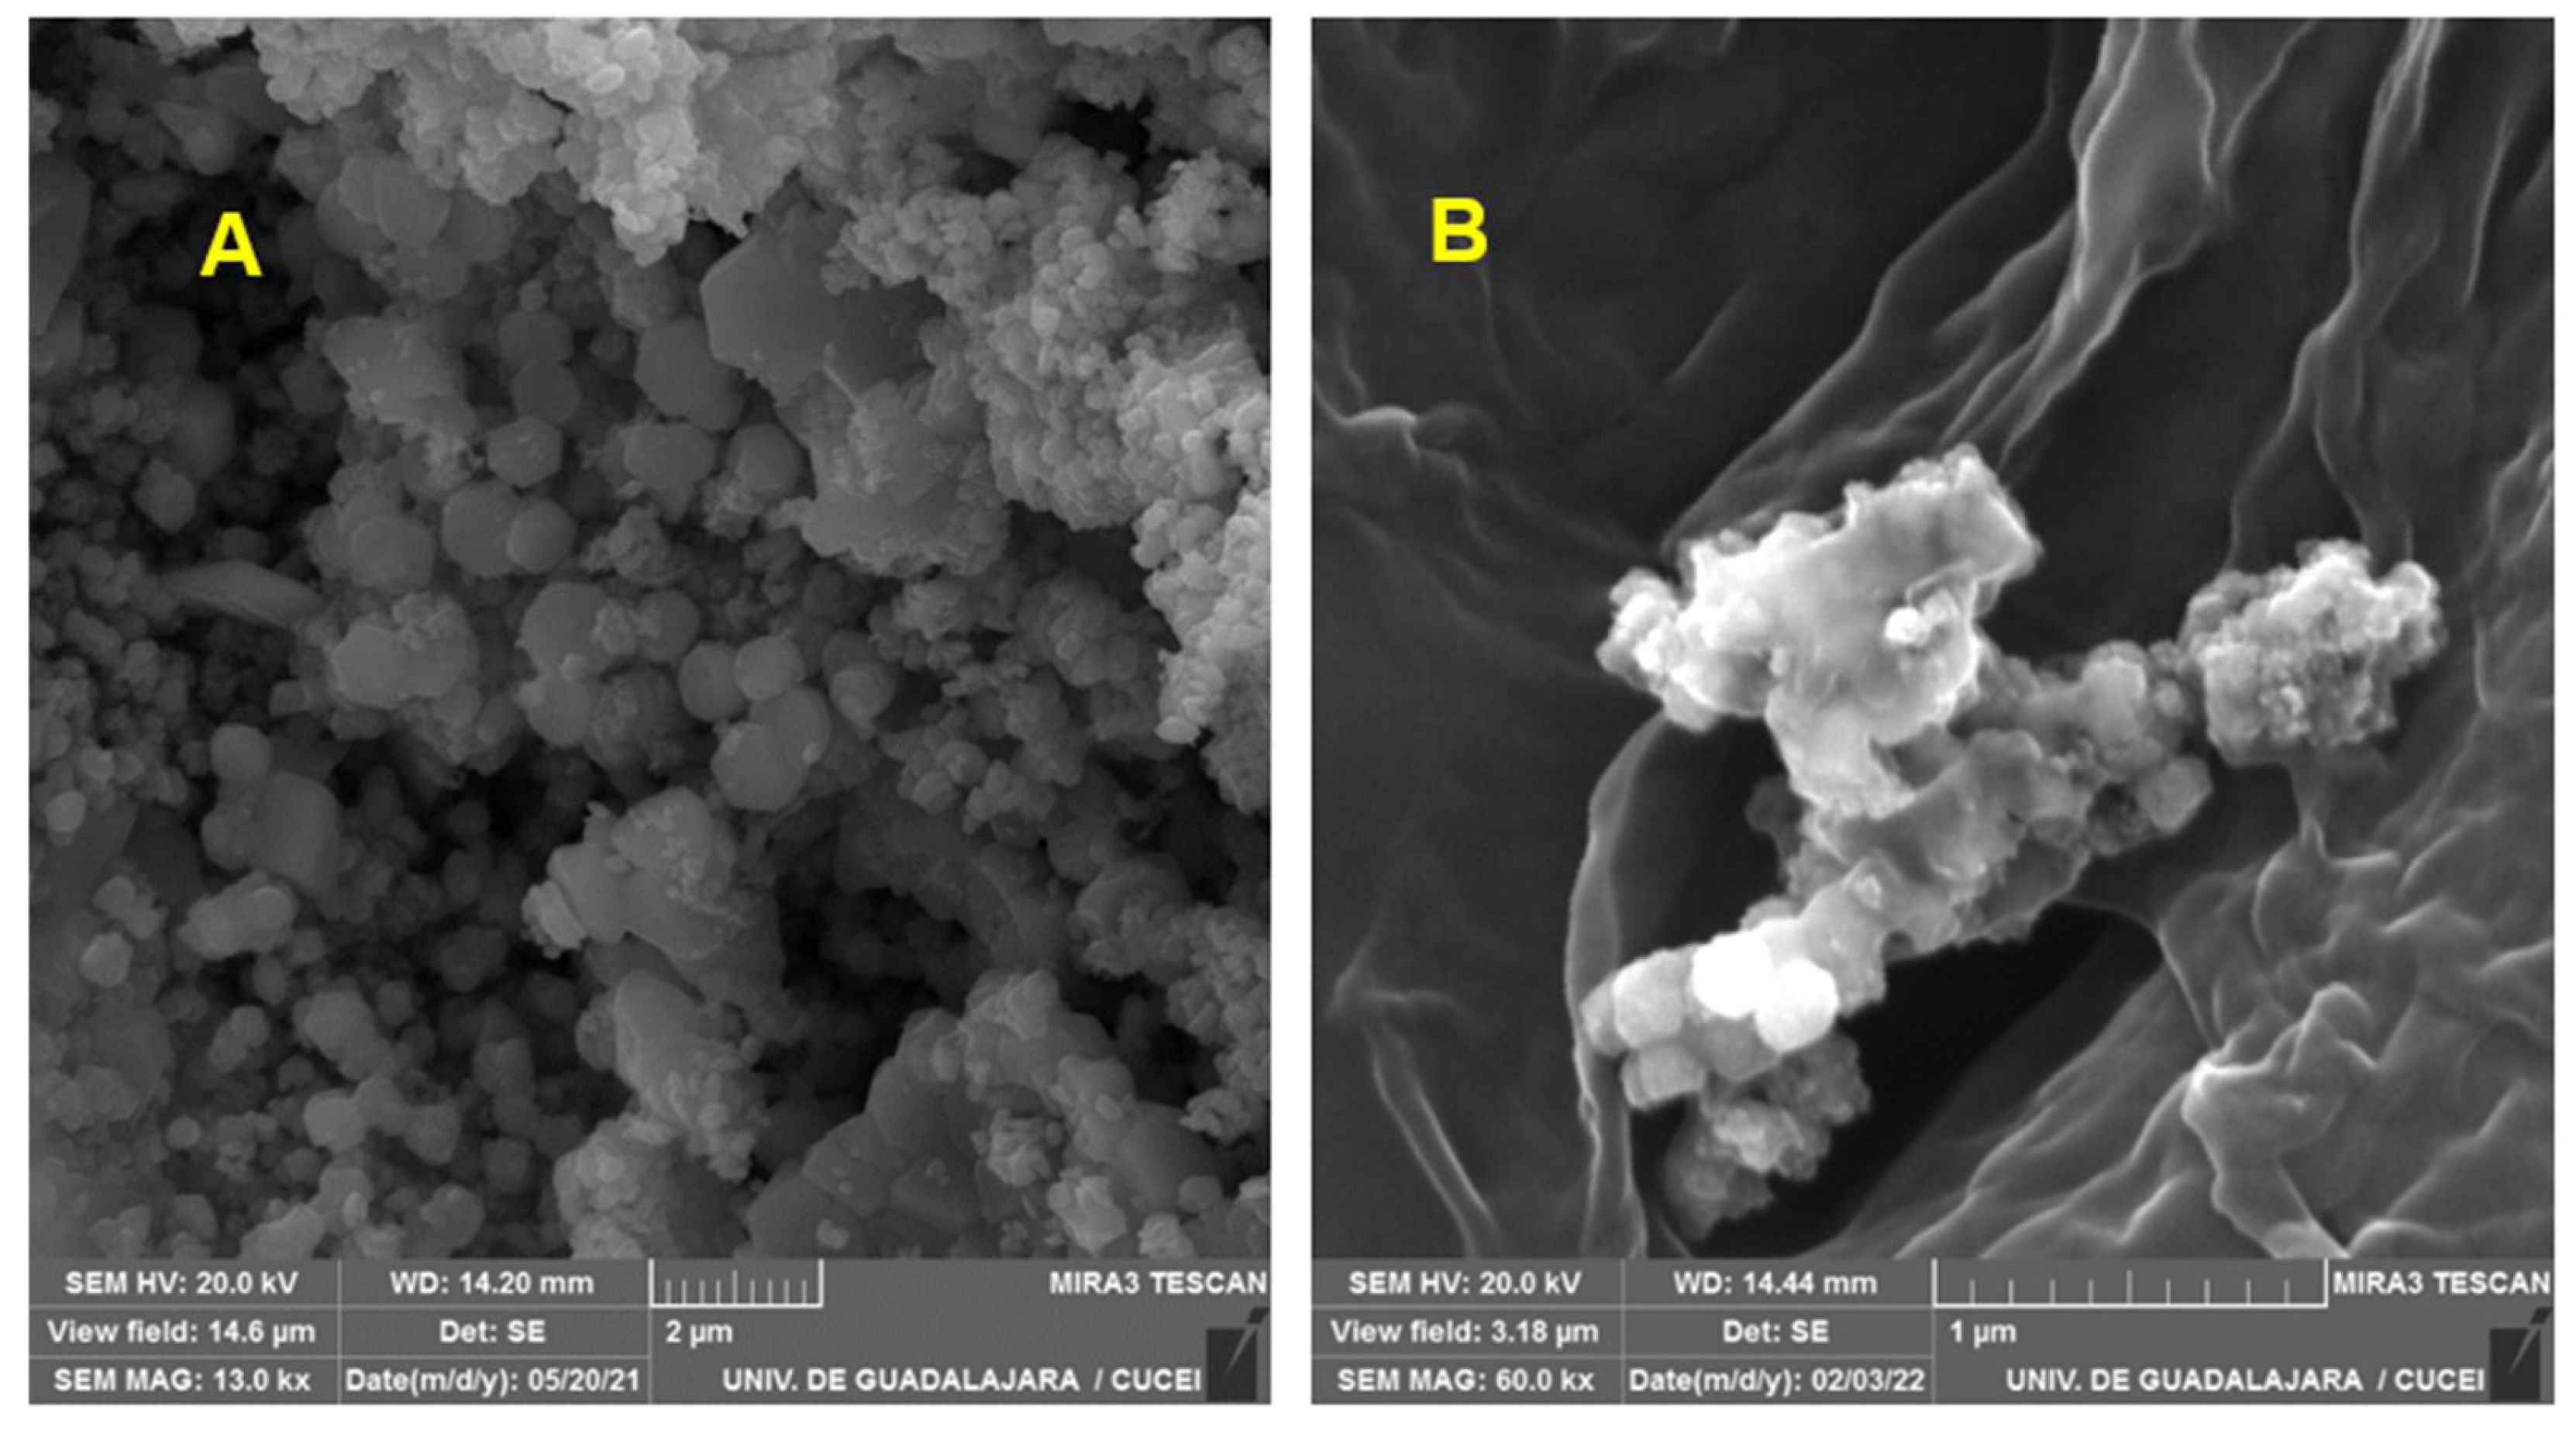
3.3.1. Scanning Electron Microscopy (SEM)
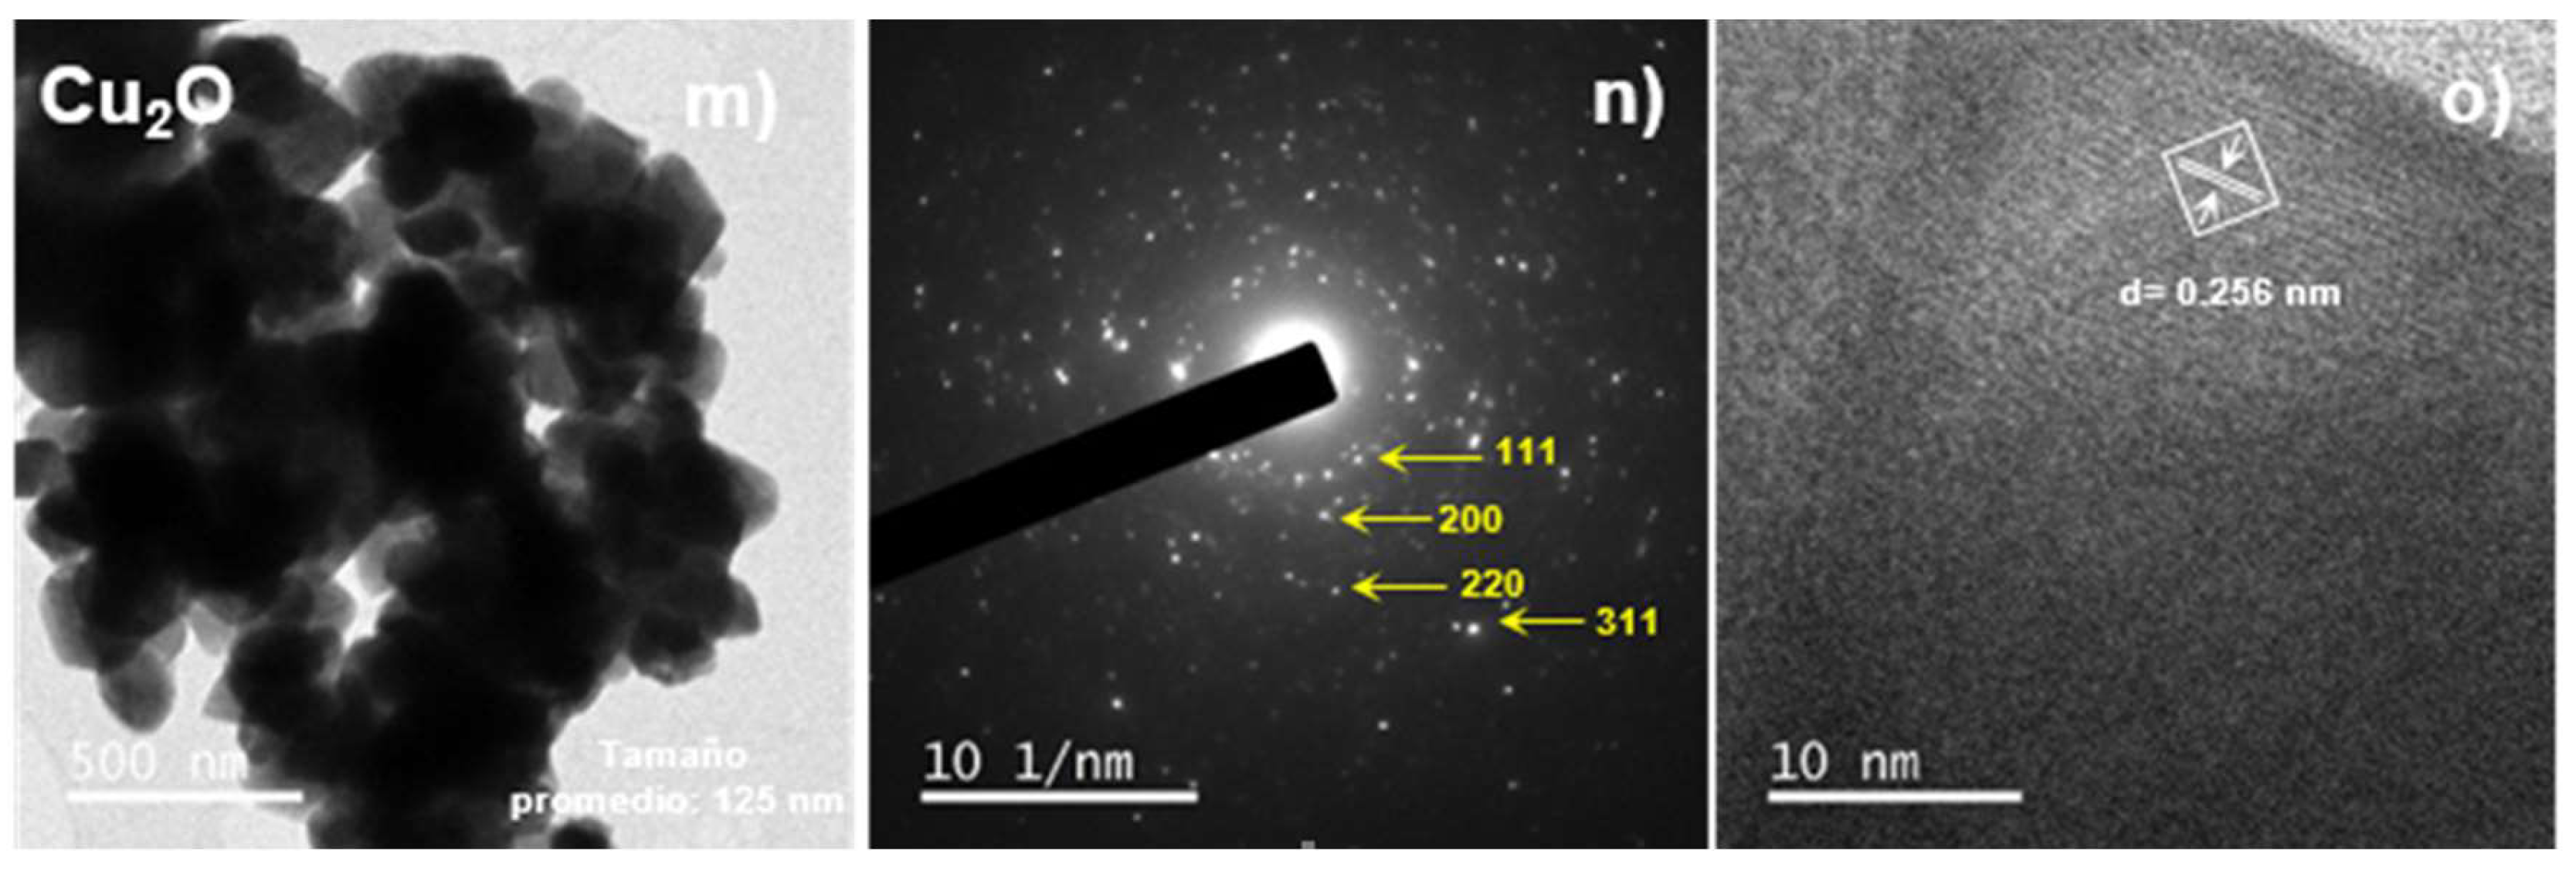
3.3.2. Transmission Electron Microscopy (TEM)
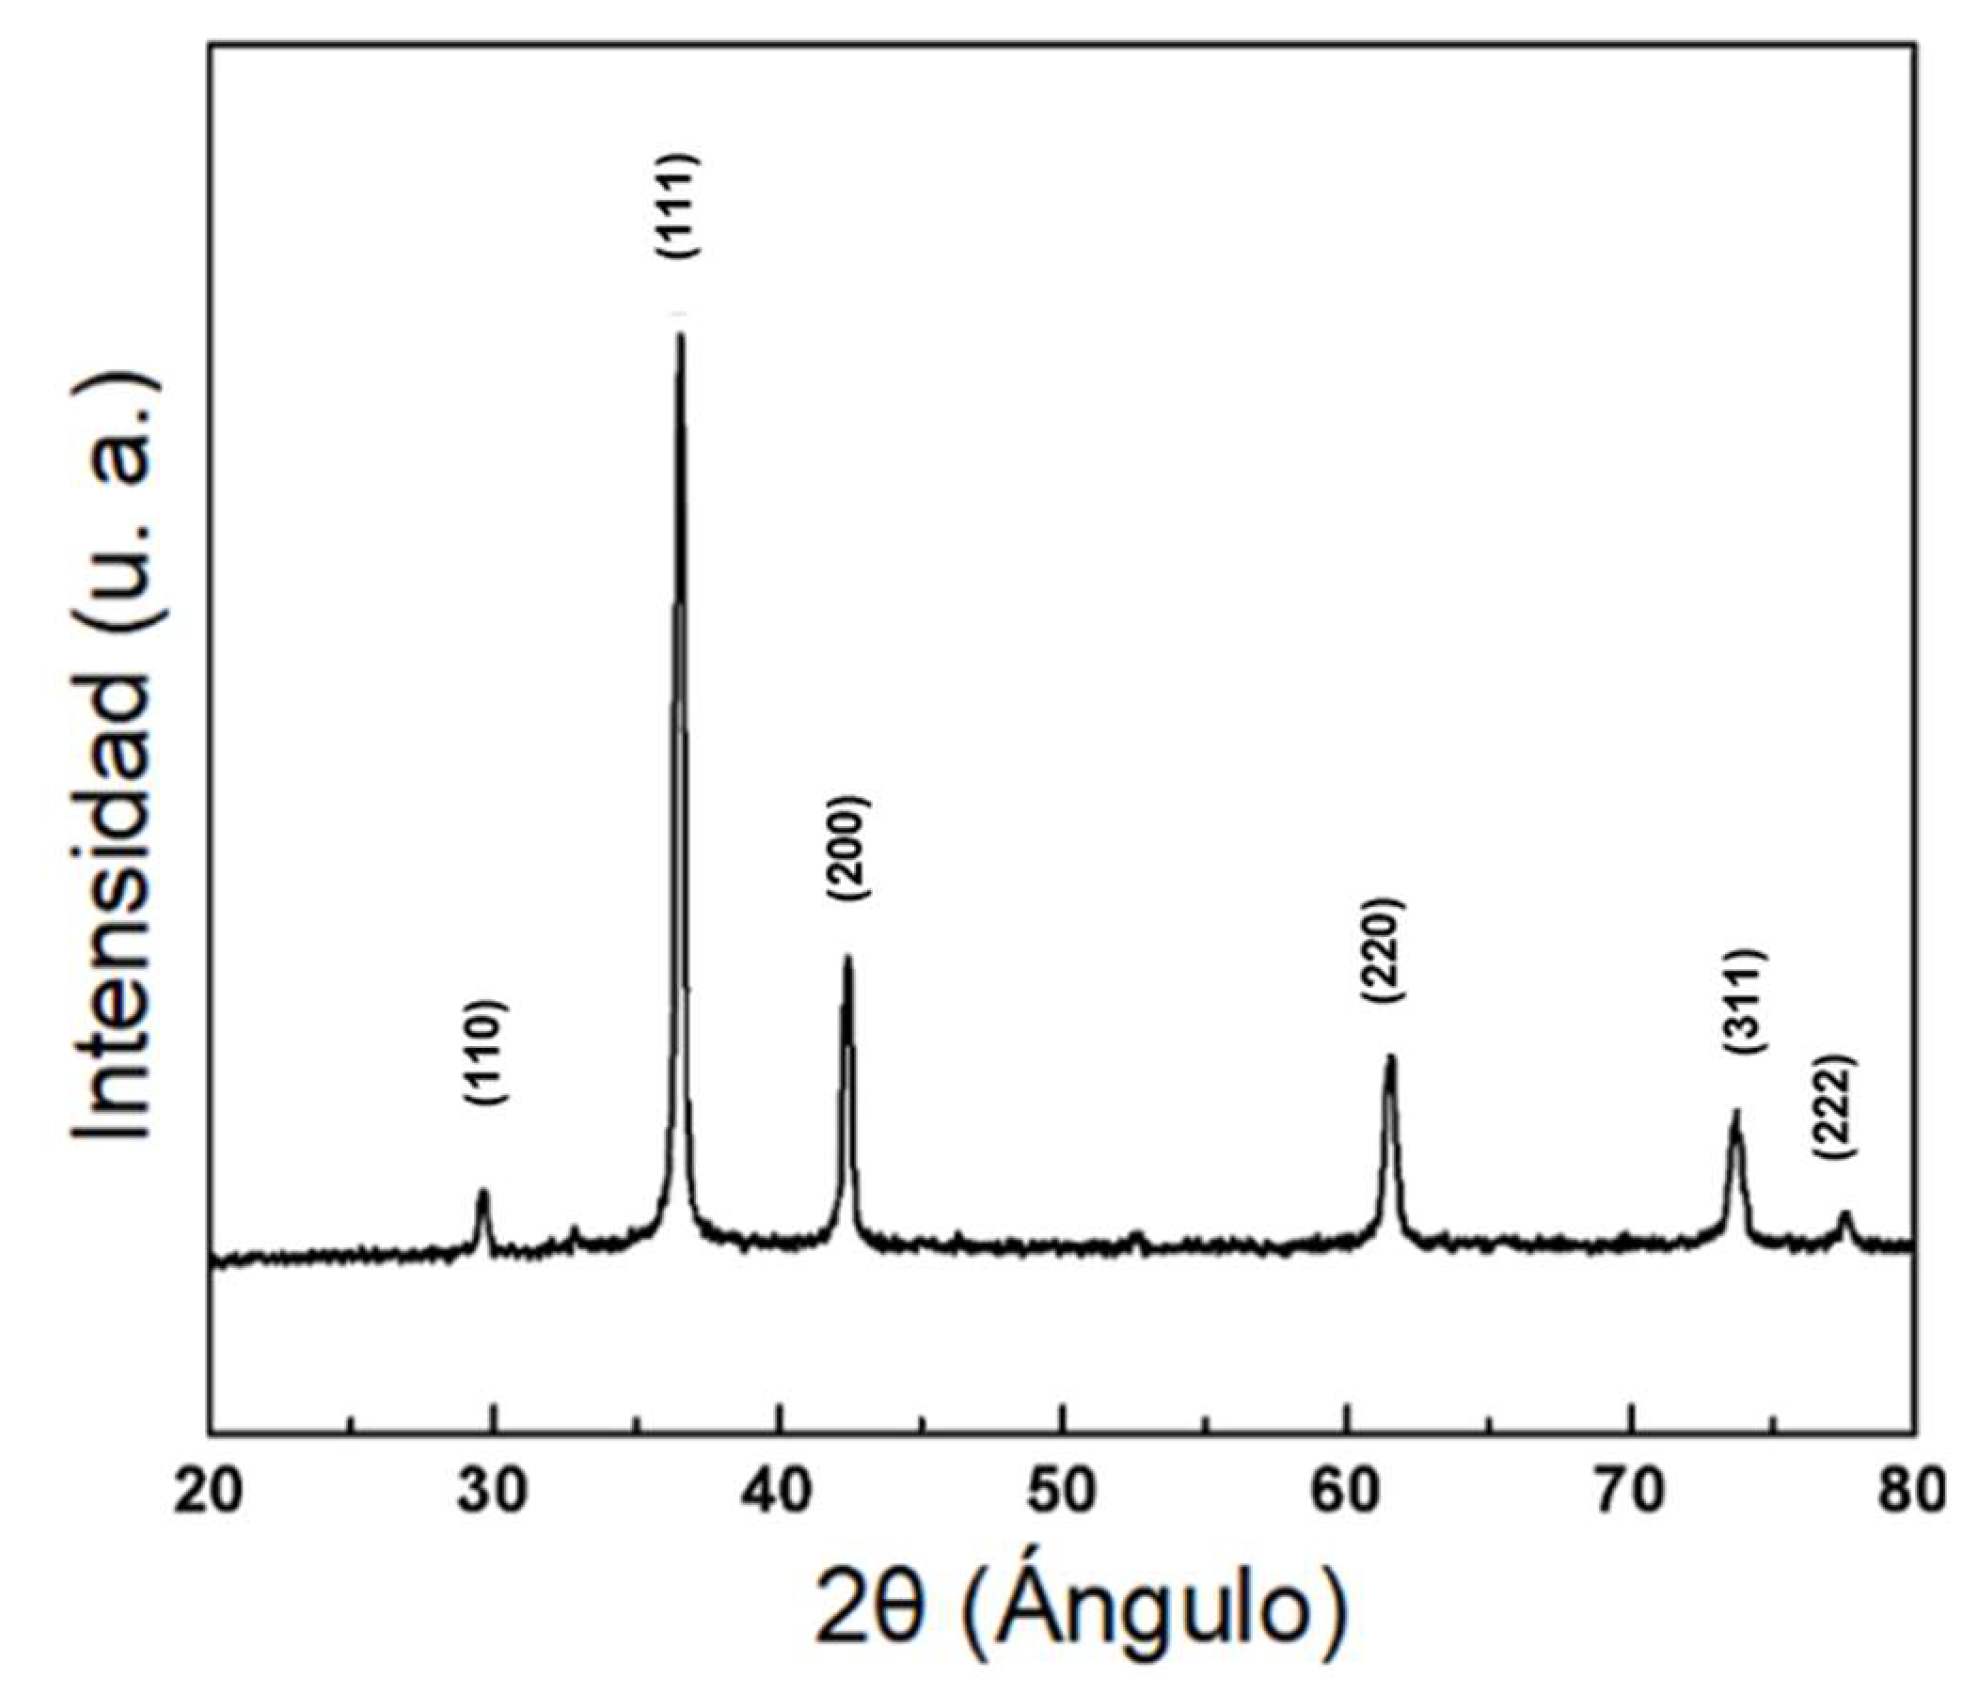
3.3.3. X-ray Diffraction (XRD)
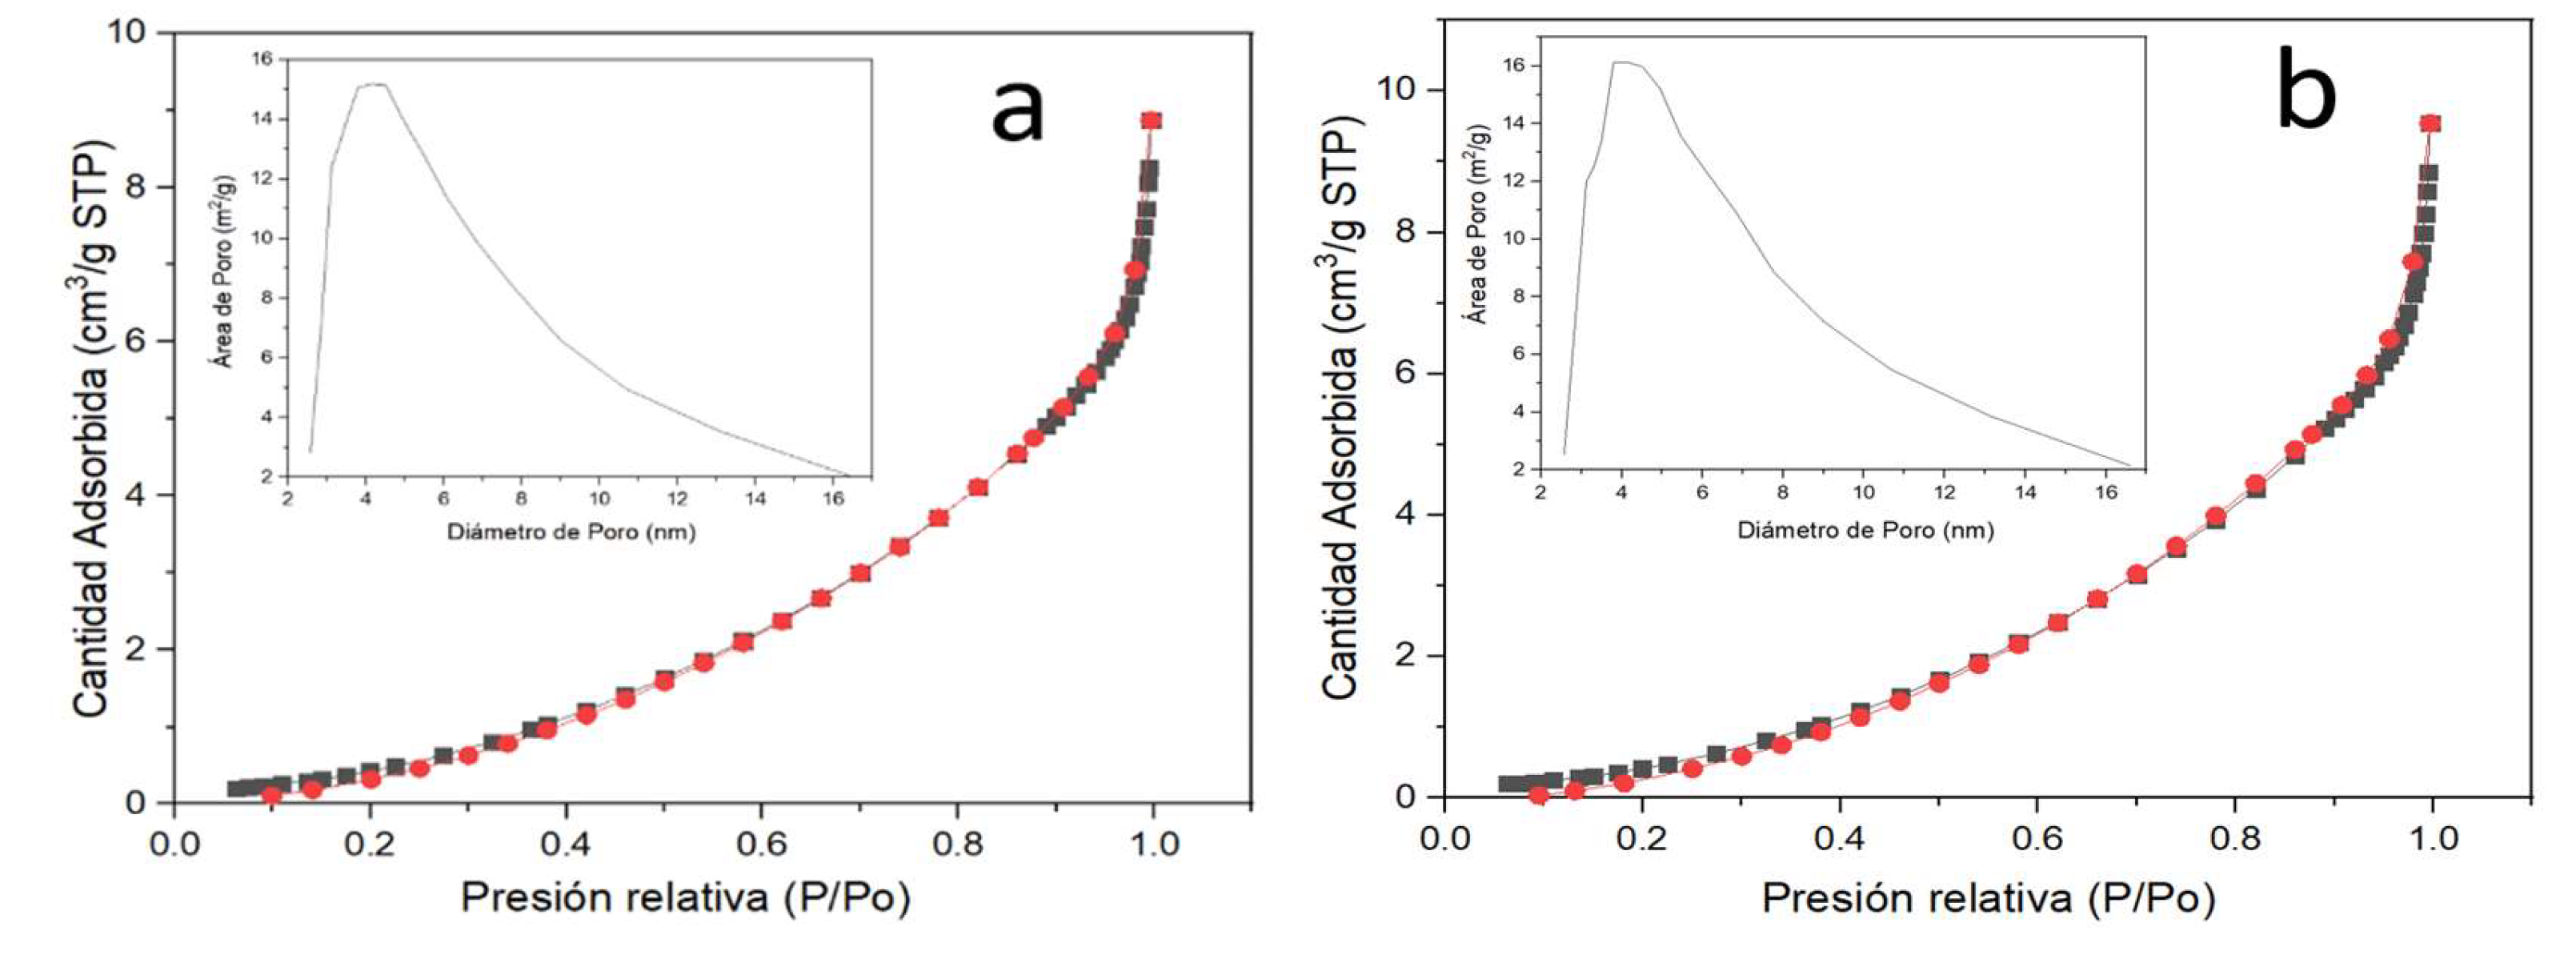
3.3.4. Nitrogen Physisorption (BET Method)
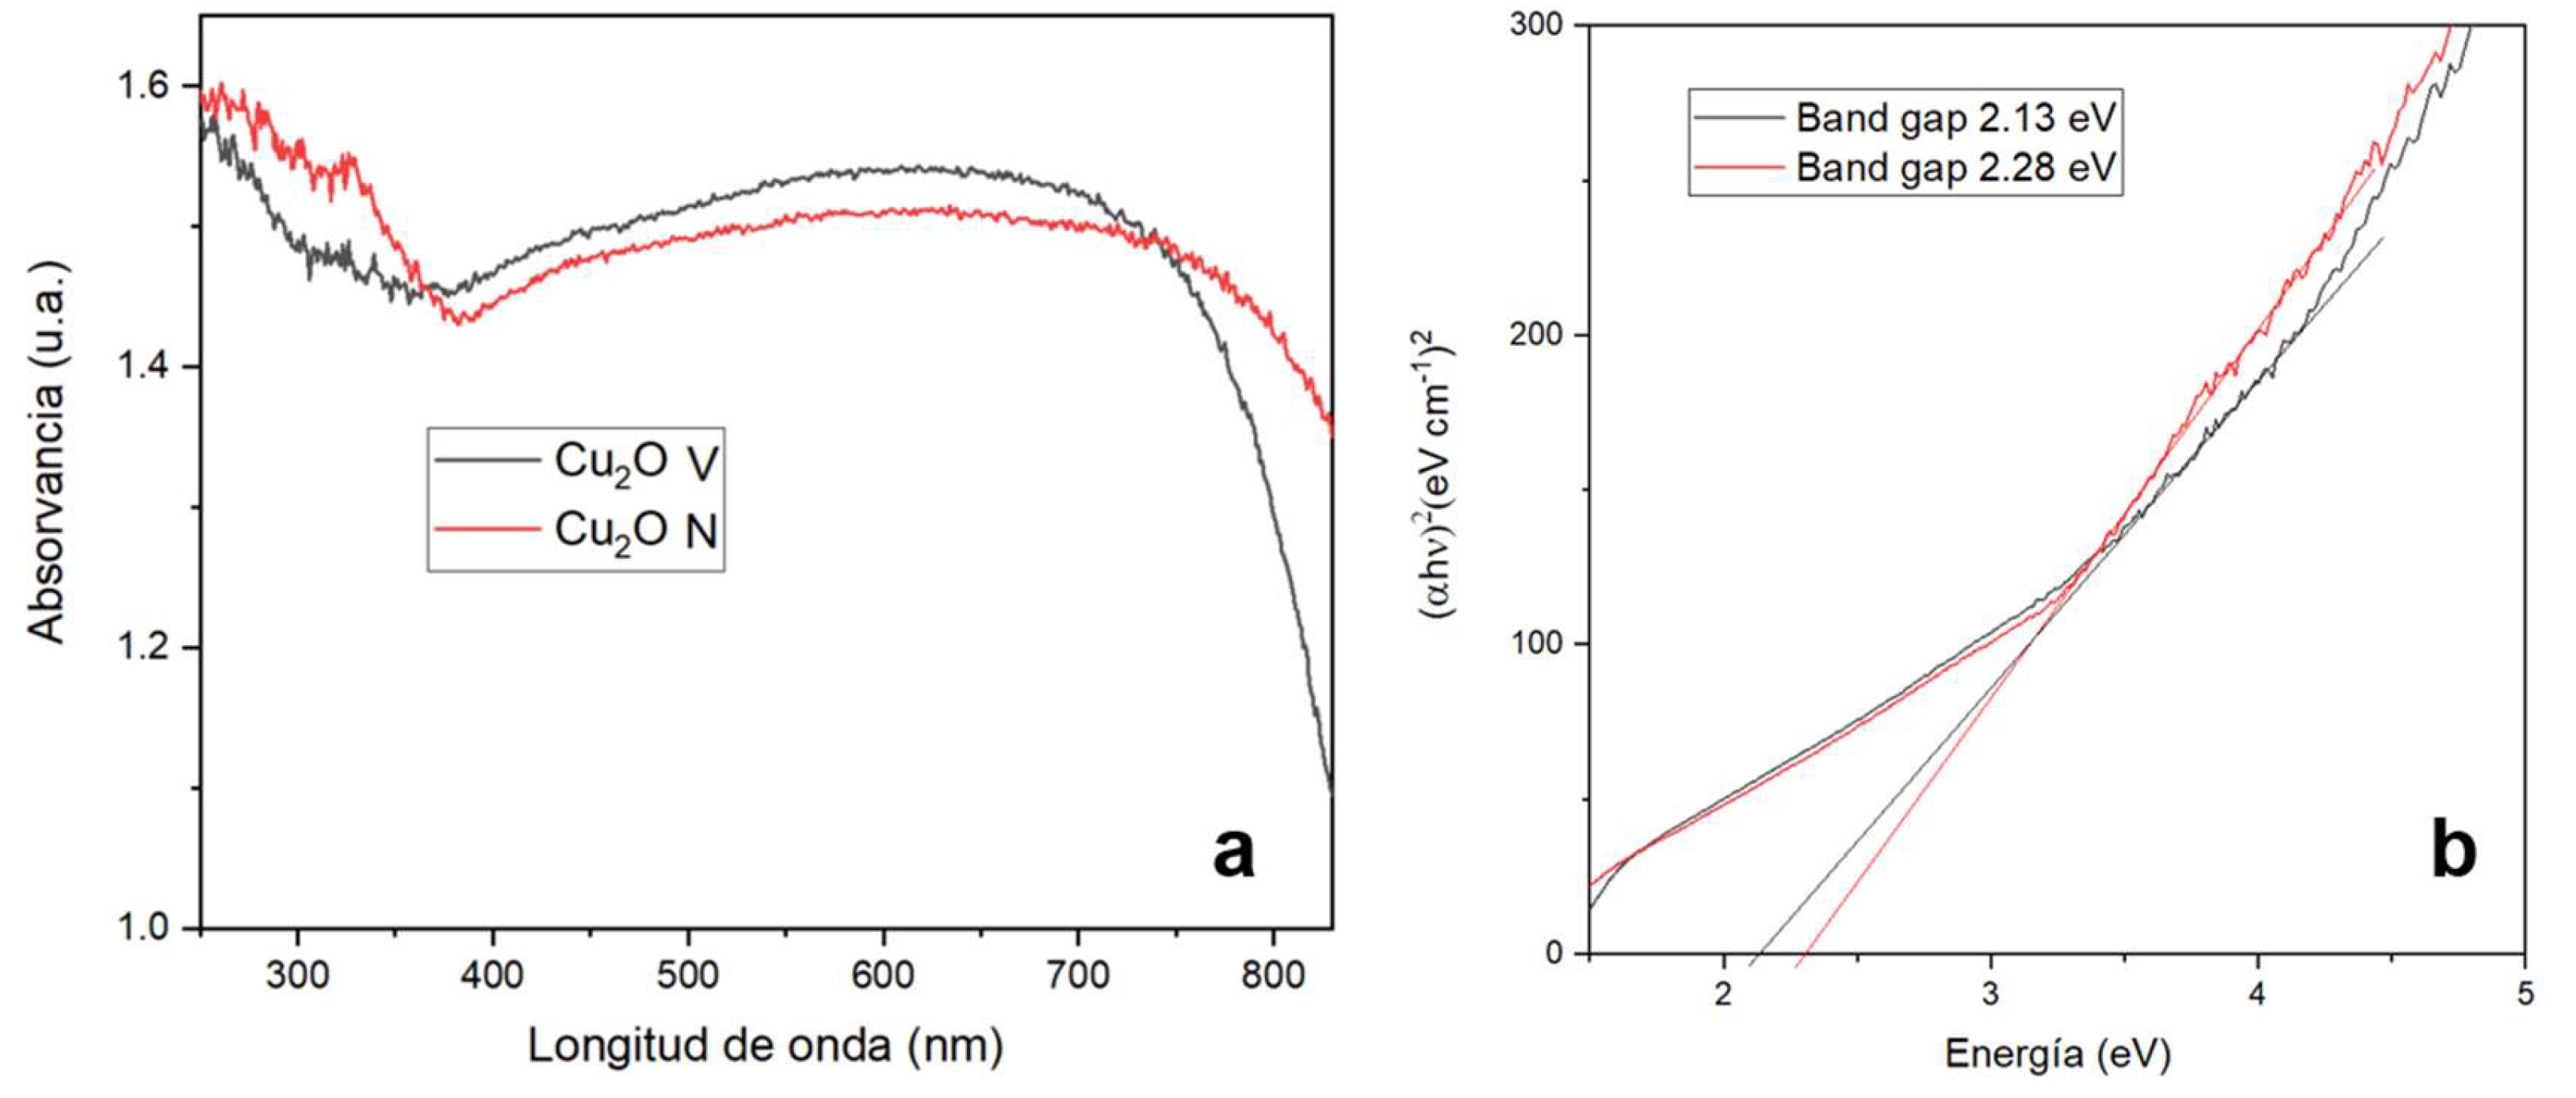
3.3.5. UV-Vis Spectroscopy
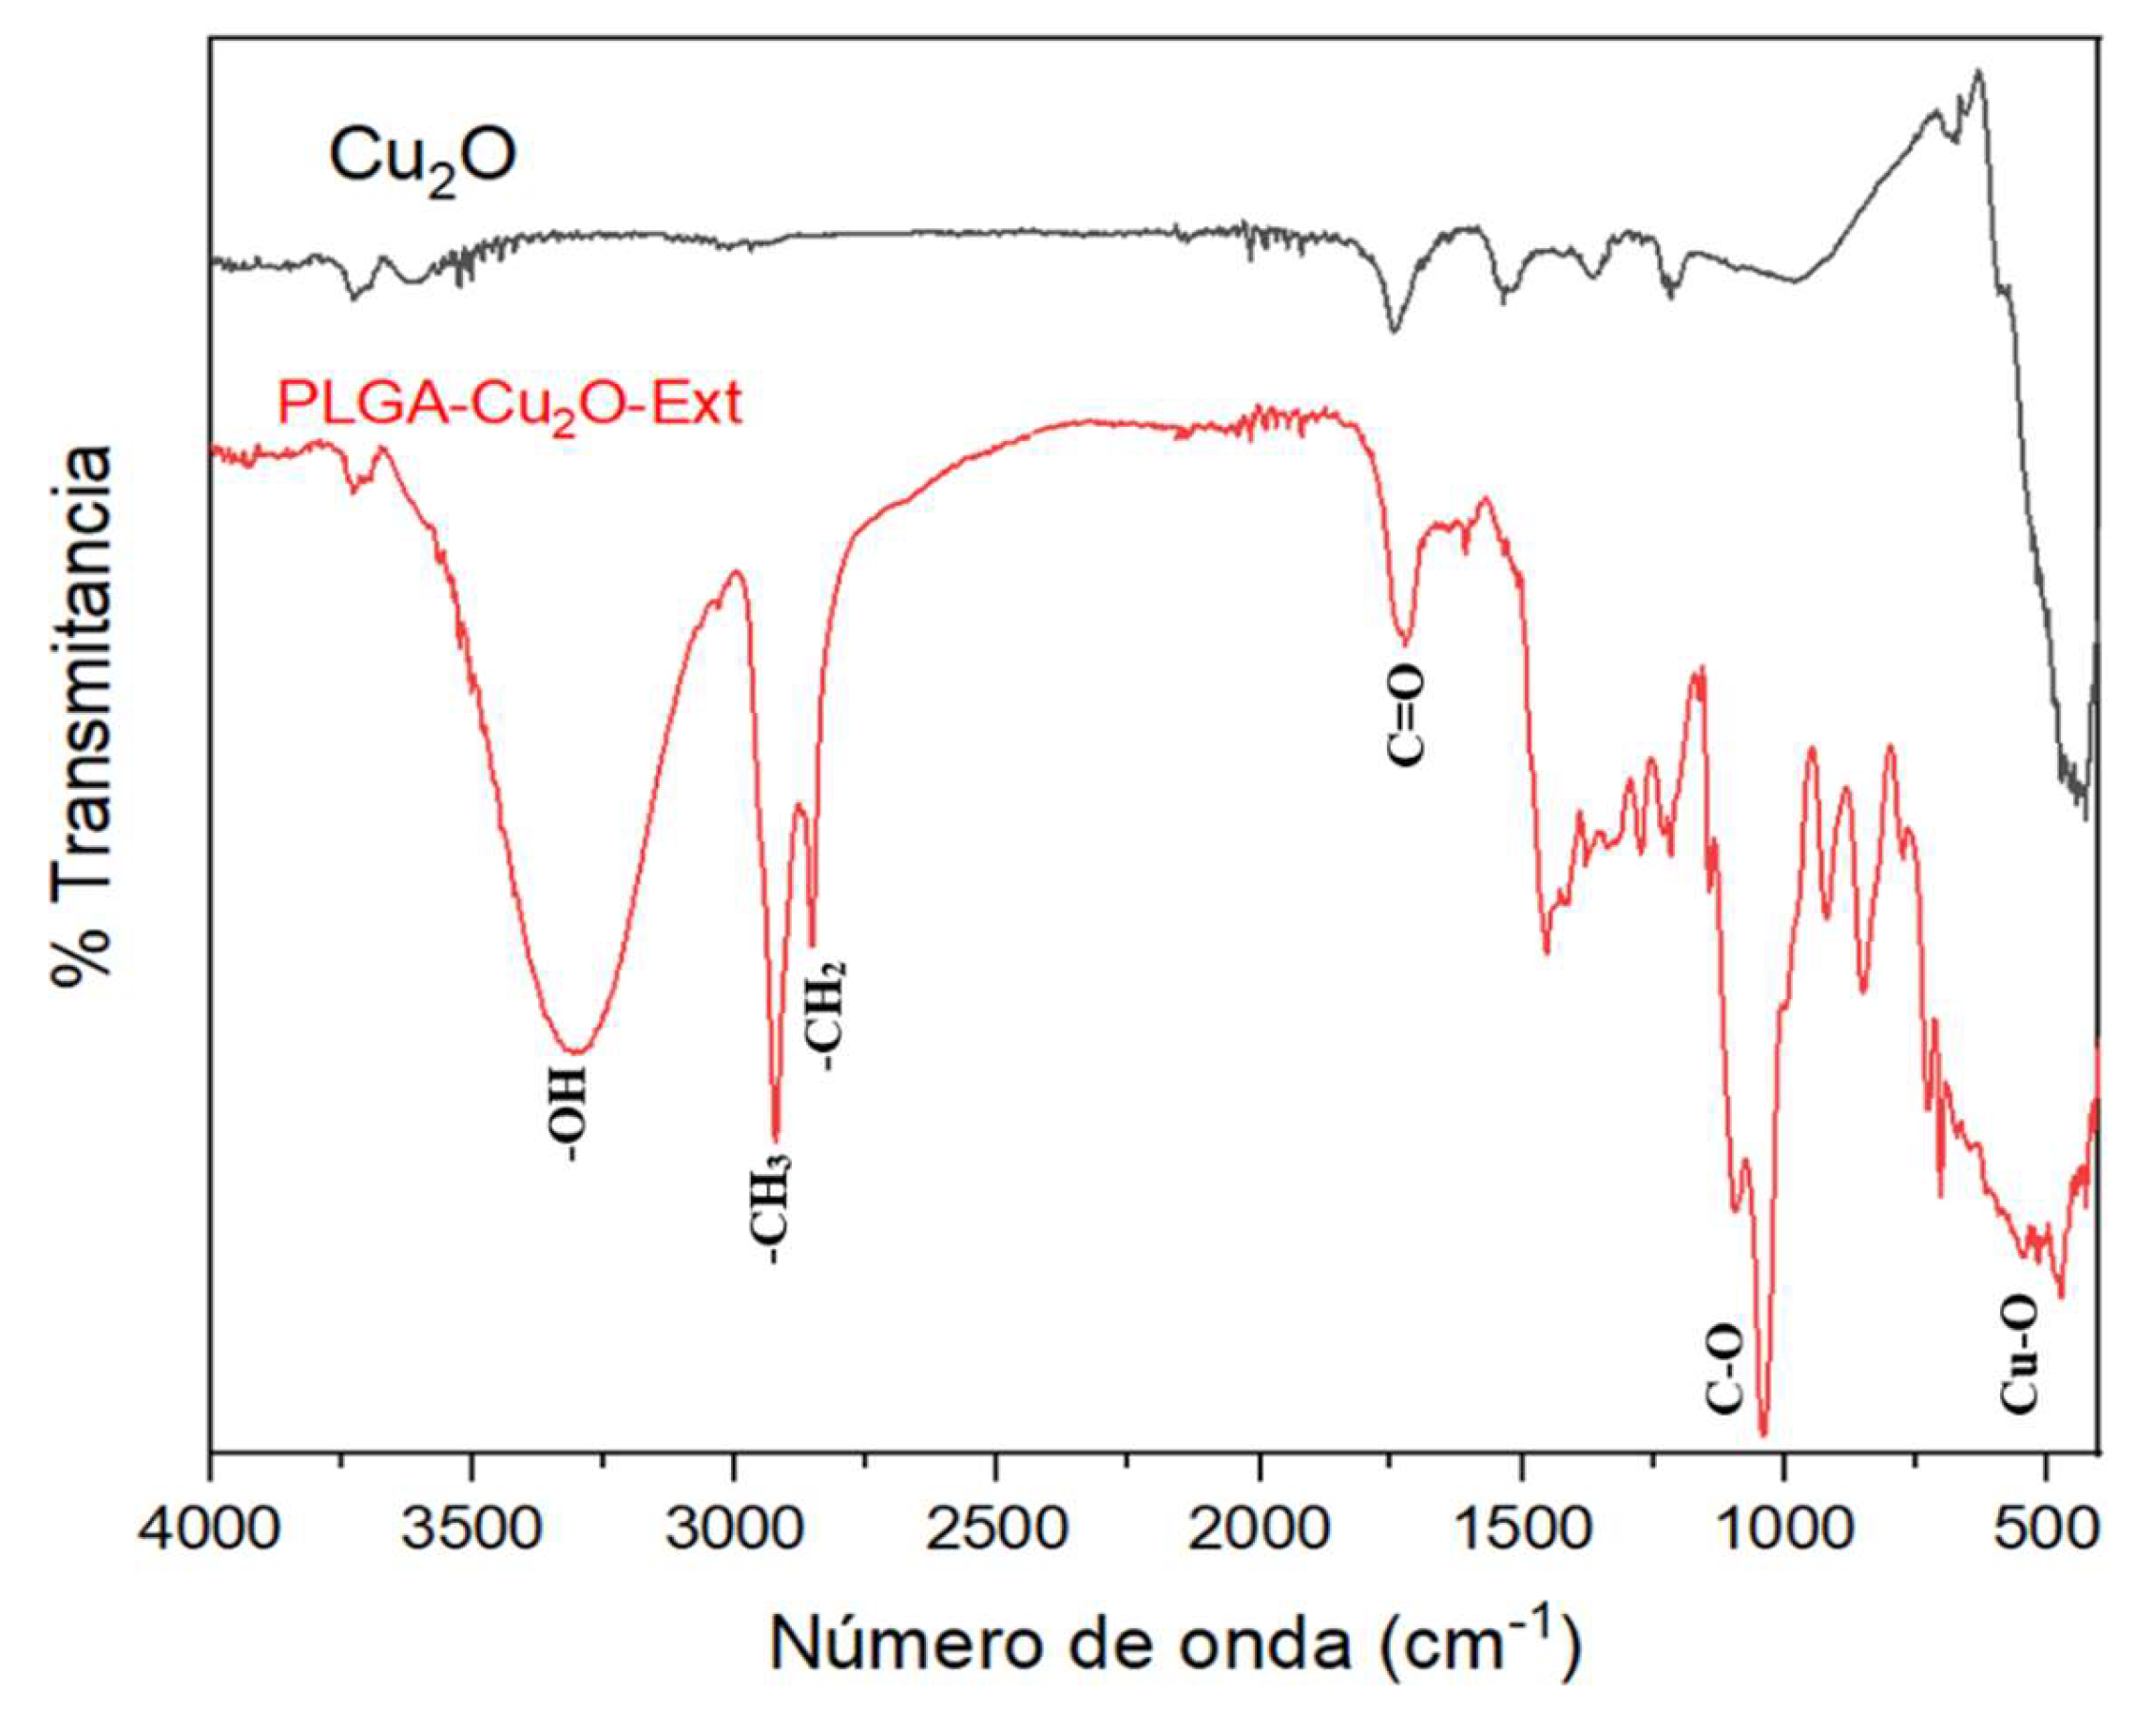
3.3.6. Fourier Transform Infrared Spectroscopy (FT-IR)
4. Conclusions
Author Contributions
Funding
Institutional Review Board Statement
Informed Consent Statement
Acknowledgments
Conflicts of Interest
References
- Medina-Palacios, S.E.; Vitales-Noyola, M.; López-González, E.; González-Amaro, A.M.; Méndez-González, V.; Pozos-Guillén, A. Root canal microorganisms and their antibiotic susceptibility in patients with persistent endodontic infections, with and without clinical symptoms. Odontology 2021, 109, 596–604. [Google Scholar] [CrossRef] [PubMed]
- Elshafie, H.S.; Aliberti, L.; Amato, M.; De Feo, V.; Camele, I. Chemical composition and antimicrobial activity of chia (Salvia hispanica L.) essential oil. Eur. Food Res. Technol. 2018, 244, 1675–1682. [Google Scholar] [CrossRef]
- Sharma, K.; Mahato, N.; Cho, M.H.; Lee, Y.R. Converting citrus wastes into value-added products: Economic and environmently friendly approaches. Nutrition 2017, 34, 29–46. [Google Scholar] [CrossRef] [PubMed]
- Zangara, A. The psychopharmacology of huperzine A: an alkaloid with cognitive enhancing and neuroprotective properties of interest in the treatment of Alzheimer’s disease. Pharmacol. Biochem. Behav. 2003, 75, 675–686. [Google Scholar] [CrossRef] [PubMed]
- Janczarek, M.; Endo, M.; Zhang, D.; Wang, K.; Kowalska, E. Enhanced Photocatalytic and Antimicrobial Performance of Cuprous Oxide/Titania: The Effect of Titania Matrix. Materials (Basel). 2018, 11, 2069. [Google Scholar] [CrossRef] [PubMed]
- Li, Y.; Chen, X.; Li, L. Facile thermal exfoliation of Cu sheets towards the CuO/Cu2O heterojunction: A cost-effective photocatalyst with visible-light response for promising sustainable applications. RSC Adv. 2019, 9, 33395–33402. [Google Scholar] [CrossRef] [PubMed]
- Babayevska, N.; Przysiecka, Ł.; Iatsunskyi, I.; Nowaczyk, G.; Jarek, M.; Janiszewska, E.; Jurga, S. ZnO size and shape effect on antibacterial activity and cytotoxicity profile. Sci. Rep. 2022, 12. [Google Scholar] [CrossRef] [PubMed]
- Goldschmidt, G.M.; Krok-Borkowicz, M.; Zybała, R.; Pamuła, E.; Telle, R.; Conrads, G.; Schickle, K. Biomimetic in situ precipitation of calcium phosphate containing silver nanoparticles on zirconia ceramic materials for surface functionalization in terms of antimicrobial and osteoconductive properties. Dent. Mater. 2021, 37, 10–18. [Google Scholar] [CrossRef]
- Perez-Cacho, P.R.; Rouseff, R.L. Fresh squeezed orange juice odor: A review. Crit. Rev. Food Sci. Nutr. 2008, 48, 681–695. [Google Scholar] [CrossRef]
- Mobeen Amanulla, A.; Sundaram, R. Green synthesis of TiO2 nanoparticles using orange peel extract for antibacterial, cytotoxicity and humidity sensor applications. In Proceedings of the Materials Today: Proceedings; Elsevier Ltd, 2019; Vol. 8; pp. 323–331. [Google Scholar]
- Krishnaraj, C.; Jagan, E.G.; Rajasekar, S.; Selvakumar, P.; Kalaichelvan, P.T.; Mohan, N. Synthesis of silver nanoparticles using Acalypha indica leaf extracts and its antibacterial activity against water borne pathogens. Colloids Surfaces B Biointerfaces 2010, 76, 50–56. [Google Scholar] [CrossRef]
- Alarif, W.M.; Shaban, Y.A.; Orif, M.I.; Ghandourah, M.A.; Turki, A.J.; Alorfi, H.S.; Tadros, H.R.Z. Green Synthesis of TiO2 Nanoparticles Using Natural Marine Extracts for Antifouling Activity. Mar. Drugs 2023, 21, 62. [Google Scholar] [CrossRef] [PubMed]
- Kuo, C.H.; Chen, C.H.; Huang, M.H. Seed-Mediated Synthesis of Monodispersed Cu2O Nanocubes with Five Different Size Ranges from 40 to 420 nm. Adv. Funct. Mater. 2007, 17, 3773–3780. [Google Scholar] [CrossRef]
- Kandjani, A.E.; Sabri, Y.M.; Periasamy, S.R.; Zohora, N.; Amin, M.H.; Nafady, A.; Bhargava, S.K. Controlling Core/Shell Formation of Nanocubic p-Cu2O/n-ZnO Toward Enhanced Photocatalytic Performance. Langmuir 2015, 31, 10922–10930. [Google Scholar] [CrossRef] [PubMed]
- Chen, L.; Zhang, Y.; Zhu, P.; Zhou, F.; Zeng, W.; Lu, D.D.; Sun, R.; Wong, C. Copper Salts Mediated Morphological Transformation of Cu2O from Cubes to Hierarchical Flower-like or Microspheres and Their Supercapacitors Performances. Sci. Reports 2015 51 2015, 5, 1–7. [Google Scholar] [CrossRef] [PubMed]
- Huang, W.C.; Lyu, L.M.; Yang, Y.C.; Huang, M.H. Synthesis of Cu2O nanocrystals from cubic to rhombic dodecahedral structures and their comparative photocatalytic activity. J. Am. Chem. Soc. 2012, 134, 1261–1267. [Google Scholar] [CrossRef] [PubMed]
- Liang, C.; Li, X.; Han, J.; Ye, N.; Liu, H.; Feng, H.; Huang, L.; Liu, Y.; Peng, X. Hierarchical Cu/Cu2O structure derived from hexagonal Cu9S5 nanocrystal with enhanced electrocatalytic ability for hydrogen evolution reaction. J. Alloys Compd. 2021, 883, 160816. [Google Scholar] [CrossRef]
- Ho, W.C.J.; Tay, Q.; Qi, H.; Huang, Z.; Li, J.; Chen, Z. Photocatalytic and Adsorption Performances of Faceted Cuprous Oxide (Cu2O) Particles for the Removal of Methyl Orange (MO) from Aqueous Media. Mol. 2017, Vol. 22, Page 677 2017, 22, 677. [Google Scholar] [CrossRef] [PubMed]
- Gao, Y.; Zhang, L.; van Hoof, A.J.F.; Hensen, E.J.M. On the surface-dependent oxidation of Cu2O during CO oxidation: Cu2+ is more active than Cu+. Appl. Catal. A Gen. 2020, 602. [Google Scholar] [CrossRef]
- Babouri, L.; Belmokre, K.; Kabir, A.; Abdelouas, A.; Khettabi, R.; El Mendili, Y. Microstructure and crystallographic properties of Cu77Zn21 alloy under the effect of heat treatment. Mater. High Temp. 2019, 36, 165–172. [Google Scholar] [CrossRef]
- Sudha, V.; Murugadoss, G.; Thangamuthu, R. Structural and morphological tuning of Cu-based metal oxide nanoparticles by a facile chemical method and highly electrochemical sensing of sulphite. Sci. Rep. 2021, 11. [Google Scholar] [CrossRef]
- Kuo, C.H.; Chen, C.H.; Huang, M.H. Seed-Mediated Synthesis of Monodispersed Cu2O Nanocubes with Five Different Size Ranges from 40 to 420 nm. Adv. Funct. Mater. 2007, 17, 3773–3780. [Google Scholar] [CrossRef]
- Chen, L.; Zhang, Y.; Zhu, P.; Zhou, F.; Zeng, W.; Lu, D.D.; Sun, R.; Wong, C. Copper Salts Mediated Morphological Transformation of Cu2O from Cubes to Hierarchical Flower-like or Microspheres and Their Supercapacitors Performances. Sci. Reports 2015 51 2015, 5, 1–7. [Google Scholar] [CrossRef]
- Dhonge, B.P.; Ray, S.S.; Mwakikunga, B. Electronic to protonic conduction switching in Cu2O nanostructured porous films: The effect of humidity exposure. RSC Adv. 2017, 7, 21703–21712. [Google Scholar] [CrossRef]
- Yu, Y.; Zhang, L.; Wang, J.; Yang, Z.; Long, M.; Hu, N.; Zhang, Y. Preparation of hollow porous Cu2O microspheres and photocatalytic activity under visible light irradiation. Nanoscale Res. Lett. 2012, 7. [Google Scholar] [CrossRef]
- Saad, N.A.; Dar, M.H.; Ramya, E.; Naraharisetty, S.R.G.; Narayana Rao, D. Saturable and reverse saturable absorption of a Cu2O–Ag nanoheterostructure. J. Mater. Sci. 2019, 54, 188–199. [Google Scholar] [CrossRef]
- Dong, K.; He, J.; Liu, J.; Li, F.; Yu, L.; Zhang, Y.; Zhou, X.; Ma, H. Photocatalytic performance of Cu2O-loaded TiO2/rGO nanoheterojunctions obtained by UV reduction. J. Mater. Sci. 2017, 52, 6754–6766. [Google Scholar] [CrossRef] [PubMed]
- Xiang, W.; Lei, M.; Wang, S.; Zhang, W.; Dong, Y. In-situ synthesis of ultrafine Cu2O nanoparticles onto MnO2 nanosheets for efficient non-enzymatic electrochemical sensing of hydrogen peroxide. J. Appl. Electrochem. 2023, 53, 1777–1785. [Google Scholar] [CrossRef]
- Badawy, S.M.; El-Khashab, R.A.; Nayl, A.A. Synthesis, characterization and catalytic activity of Cu/Cu2O nanoparticles prepared in aqueous medium. Bull. Chem. React. Eng. Catal. 2015, 10, 169–174. [Google Scholar] [CrossRef]
- Du, C.; Xiao, M. Cu2O nanoparticles synthesis by microplasma. Sci. Reports 2014 41 2014, 4, 1–5. [Google Scholar] [CrossRef]
- Li, P.; Liu, L.; Qin, D.; Luo, C.; Li, G.; Hu, J.; Jiang, H.; Zhang, W. Cu2O concave hexapod microcrystals: selective facet etching and highly improved photocatalytic performance. J. Mater. Sci. 2019, 54, 2876–2884. [Google Scholar] [CrossRef]
- Nethravathi, P.C.; Suresh, D.; Manjula, M.V.; Devaraja, S.; Mohan, S. Ag-Cu2O decorated reduced graphene oxide nanocomposite for photocatalytic water splitting, methylene blue dye degradation, electrochemical nitrite sensing, photoluminescence and selected biological applications. Biomass Convers. Biorefinery 2024, 14, 5711–5734. [Google Scholar] [CrossRef]
- Sima, Z.; Ma, Z.; Song, P.; Wang, Q. Ultra-low concentration detection of NH3 using rGO/Cu2O nanocomposites at low temperature. J. Mater. Sci. Mater. Electron. 2021, 32, 22617–22628. [Google Scholar] [CrossRef]
- Yuan, Z.; Zhang, Y.; Chen, H.; Xu, C. CTAB-assisted synthesis of eight-horn-shaped Cu2O crystals via a simple solution approach. J. Mater. Sci. Mater. Electron. 2018, 29, 4256–4260. [Google Scholar] [CrossRef]
- Li, H.; Su, Z.; Hu, S.; Yan, Y. Free-standing and flexible Cu/Cu2O/CuO heterojunction net: A novel material as cost-effective and easily recycled visible-light photocatalyst. Appl. Catal. B Environ. 2017, 207, 134–142. [Google Scholar] [CrossRef]
- Li, J.; He, M.; Yan, J.; Liu, J.; Zhang, J.; Ma, J. Room Temperature Engineering Crystal Facet of Cu2O for Photocatalytic Degradation of Methyl Orange. Nanomaterials 2022, 12, 1697. [Google Scholar] [CrossRef] [PubMed]
- Alegría, M.; Aliaga, J.; Ballesteros, L.; Sotomayor-Torres, C.; González, G.; Benavente, E. Layered Nanocomposite 2D-TiO2 with Cu2O Nanoparticles as an Efficient Photocatalyst for 4-Chlorophenol Degradation and Hydrogen Evolution. Top. Catal. 2021, 64, 167–180. [Google Scholar] [CrossRef]
- Bouachma, S.; Ayouz-Chebout, K.; Kechouane, M.; Manseri, A.; Yaddadene, C.; Menari, H.; Gabouze, N. Synthesis of PSi-n/CuO-p/Cu2O-n heterostructure for CO2 gas sensing at room temperature. Appl. Phys. A Mater. Sci. Process. 2022, 128. [Google Scholar] [CrossRef]
- Xia, Y.; He, Z.; Su, J.; Hu, K. Construction of novel Cu 2 O/PbBiO 2 Br composites with enhanced photocatalytic activity. J. Mater. Sci. Mater. Electron. 2019, 30, 9843–9854. [Google Scholar] [CrossRef]
- Pellegrino, A.L.; Lo Presti, F.; Smecca, E.; Valastro, S.; Greco, G.; Di Franco, S.; Roccaforte, F.; Alberti, A.; Malandrino, G. A Low Temperature Growth of Cu2O Thin Films as Hole Transporting Material for Perovskite Solar Cells. Materials (Basel). 2022, 15, 7790. [Google Scholar] [CrossRef]
- Babu, S.G.; Vinoth, R.; Praveen Kumar, D.; Shankar, M.V.; Chou, H.L.; Vinodgopal, K.; Neppolian, B. Influence of electron storing, transferring and shuttling assets of reduced graphene oxide at the interfacial copper doped TiO2 p–n heterojunction for increased hydrogen production. Nanoscale 2015, 7, 7849–7857. [Google Scholar] [CrossRef]
- Chinnaiah, K.; Maik, V.; Kannan, K.; Potemkin, V.; Grishina, M.; Gohulkumar, M.; Tiwari, R.; Gurushankar, K. Experimental and Theoretical Studies of Green Synthesized Cu2O Nanoparticles Using Datura Metel L. J. Fluoresc. 2022, 32, 559–568. [Google Scholar] [CrossRef] [PubMed]
- Aseeri, J.; Alandis, N.M.; Mekhamer, W.; Alam, M. Miscibility studies of polystyrene/polyvinyl chloride blend in presence of organoclay. Open Chem. 2019, 17, 927–935. [Google Scholar] [CrossRef]
- Apata, I.E.; Tawade, B.V.; Cummings, S.P.; Pradhan, N.; Karim, A.; Raghavan, D. Comparative Study of Polymer-Grafted BaTiO3 Nanoparticles Synthesized Using Normal ATRP as Well as ATRP and ARGET-ATRP with Sacrificial Initiator with a Focus on Controlling the Polymer Graft Density and Molecular Weight. Mol. 2023, Vol. 28, Page 4444 2023, 28, 4444. [Google Scholar] [CrossRef] [PubMed]
- Paneru, S.; Kumar, D. A Novel Electrochemical Biosensor Based on Polyaniline-Embedded Copper Oxide Nanoparticles for High-Sensitive Paraoxon-Ethyl (PE) Detection. Appl. Biochem. Biotechnol. 2023, 195, 4485–4502. [Google Scholar] [CrossRef] [PubMed]
- Sadeghi-Avalshahr, A.; Nokhasteh, S.; Molavi, A.M.; Khorsand-Ghayeni, M.; Mahdavi-Shahri, M. Synthesis and characterization of collagen/ PLGA biodegradable skin scaffold fibers. Regen. Biomater. 2017, 4, 309–314. [Google Scholar] [CrossRef] [PubMed]
- Długosz, O.; Lis, K.; Matyjasik, W.; Radomski, P.; Pulit-Prociak, J.; Banach, M. Cu2O Nanoparticles Deposited on Y2O3 and CuO: Synthesis and Antimicrobial Properties. J. Clust. Sci. 2023, 34, 2153–2165. [Google Scholar] [CrossRef]
- Wan, F.; Bohr, A.; Maltesen, M.J.; Bjerregaard, S.; Foged, C.; Rantanen, J.; Yang, M. Critical solvent properties affecting the particle formation process and characteristics of celecoxib-loaded PLGA microparticles via spray-drying. Pharm. Res. 2013, 30, 1065–1076. [Google Scholar] [CrossRef] [PubMed]
- Pérez-Larios, A.; Torres-Ramos, I.; Zanella, R.; Rico, J.L. Ti-Co mixed oxide as photocatalysts in the generation of hydrogen from water. Int. J. Chem. React. Eng. 2021, 0. [Google Scholar] [CrossRef]
- Torres-Ramos, M.I.; Martín-Marquez, M.F.; Leal-Moya, M.D.C.; Ghotekar, S.; Sánchez-Burgos, J.A.; Pérez-Larios, A. PLGA-TiO2 as a Carrier System for Drug Release. Int. J. Mol. Sci. 2022, Vol. 23, Page 10755 2022, 23, 10755. [Google Scholar] [CrossRef]
- A. ; Marizcal-Barba, A.; Limón-Rocha, I.; Barrera, A.; Eduardo Casillas, J.; González-Vargas, O.A.; Luis Rico, J.; Martinez-Gómez, C.; Pérez-Larios, A. TiO2-La2O3 as Photocatalysts in the Degradation of Naproxen. Inorganics 2022, Vol. 10, Page 67 2022, 10, 67. [Google Scholar] [CrossRef]

| Listeria monocytogenes | Enterococcus faecalis | Staphylococcus aureus | Salmonella paratyphi | Escherichia coli | ||||||
| MIC | MBC | MIC | MBC | MIC | MBC | MIC | MBC | MIC | MBC | |
| FM | 80 | 160 | 40 | 60 | 40 | 640 | 40 | 640 | 80 | 320 |
| FN | 20 | 80 | 40 | 60 | 40 | 320 | 20 | 160 | 40 | 160 |
Disclaimer/Publisher’s Note: The statements, opinions and data contained in all publications are solely those of the individual author(s) and contributor(s) and not of MDPI and/or the editor(s). MDPI and/or the editor(s) disclaim responsibility for any injury to people or property resulting from any ideas, methods, instructions or products referred to in the content. |
© 2024 by the authors. Licensee MDPI, Basel, Switzerland. This article is an open access article distributed under the terms and conditions of the Creative Commons Attribution (CC BY) license (http://creativecommons.org/licenses/by/4.0/).


