Submitted:
19 August 2024
Posted:
20 August 2024
You are already at the latest version
Abstract

Keywords:
Introduction
Experimental
Materials
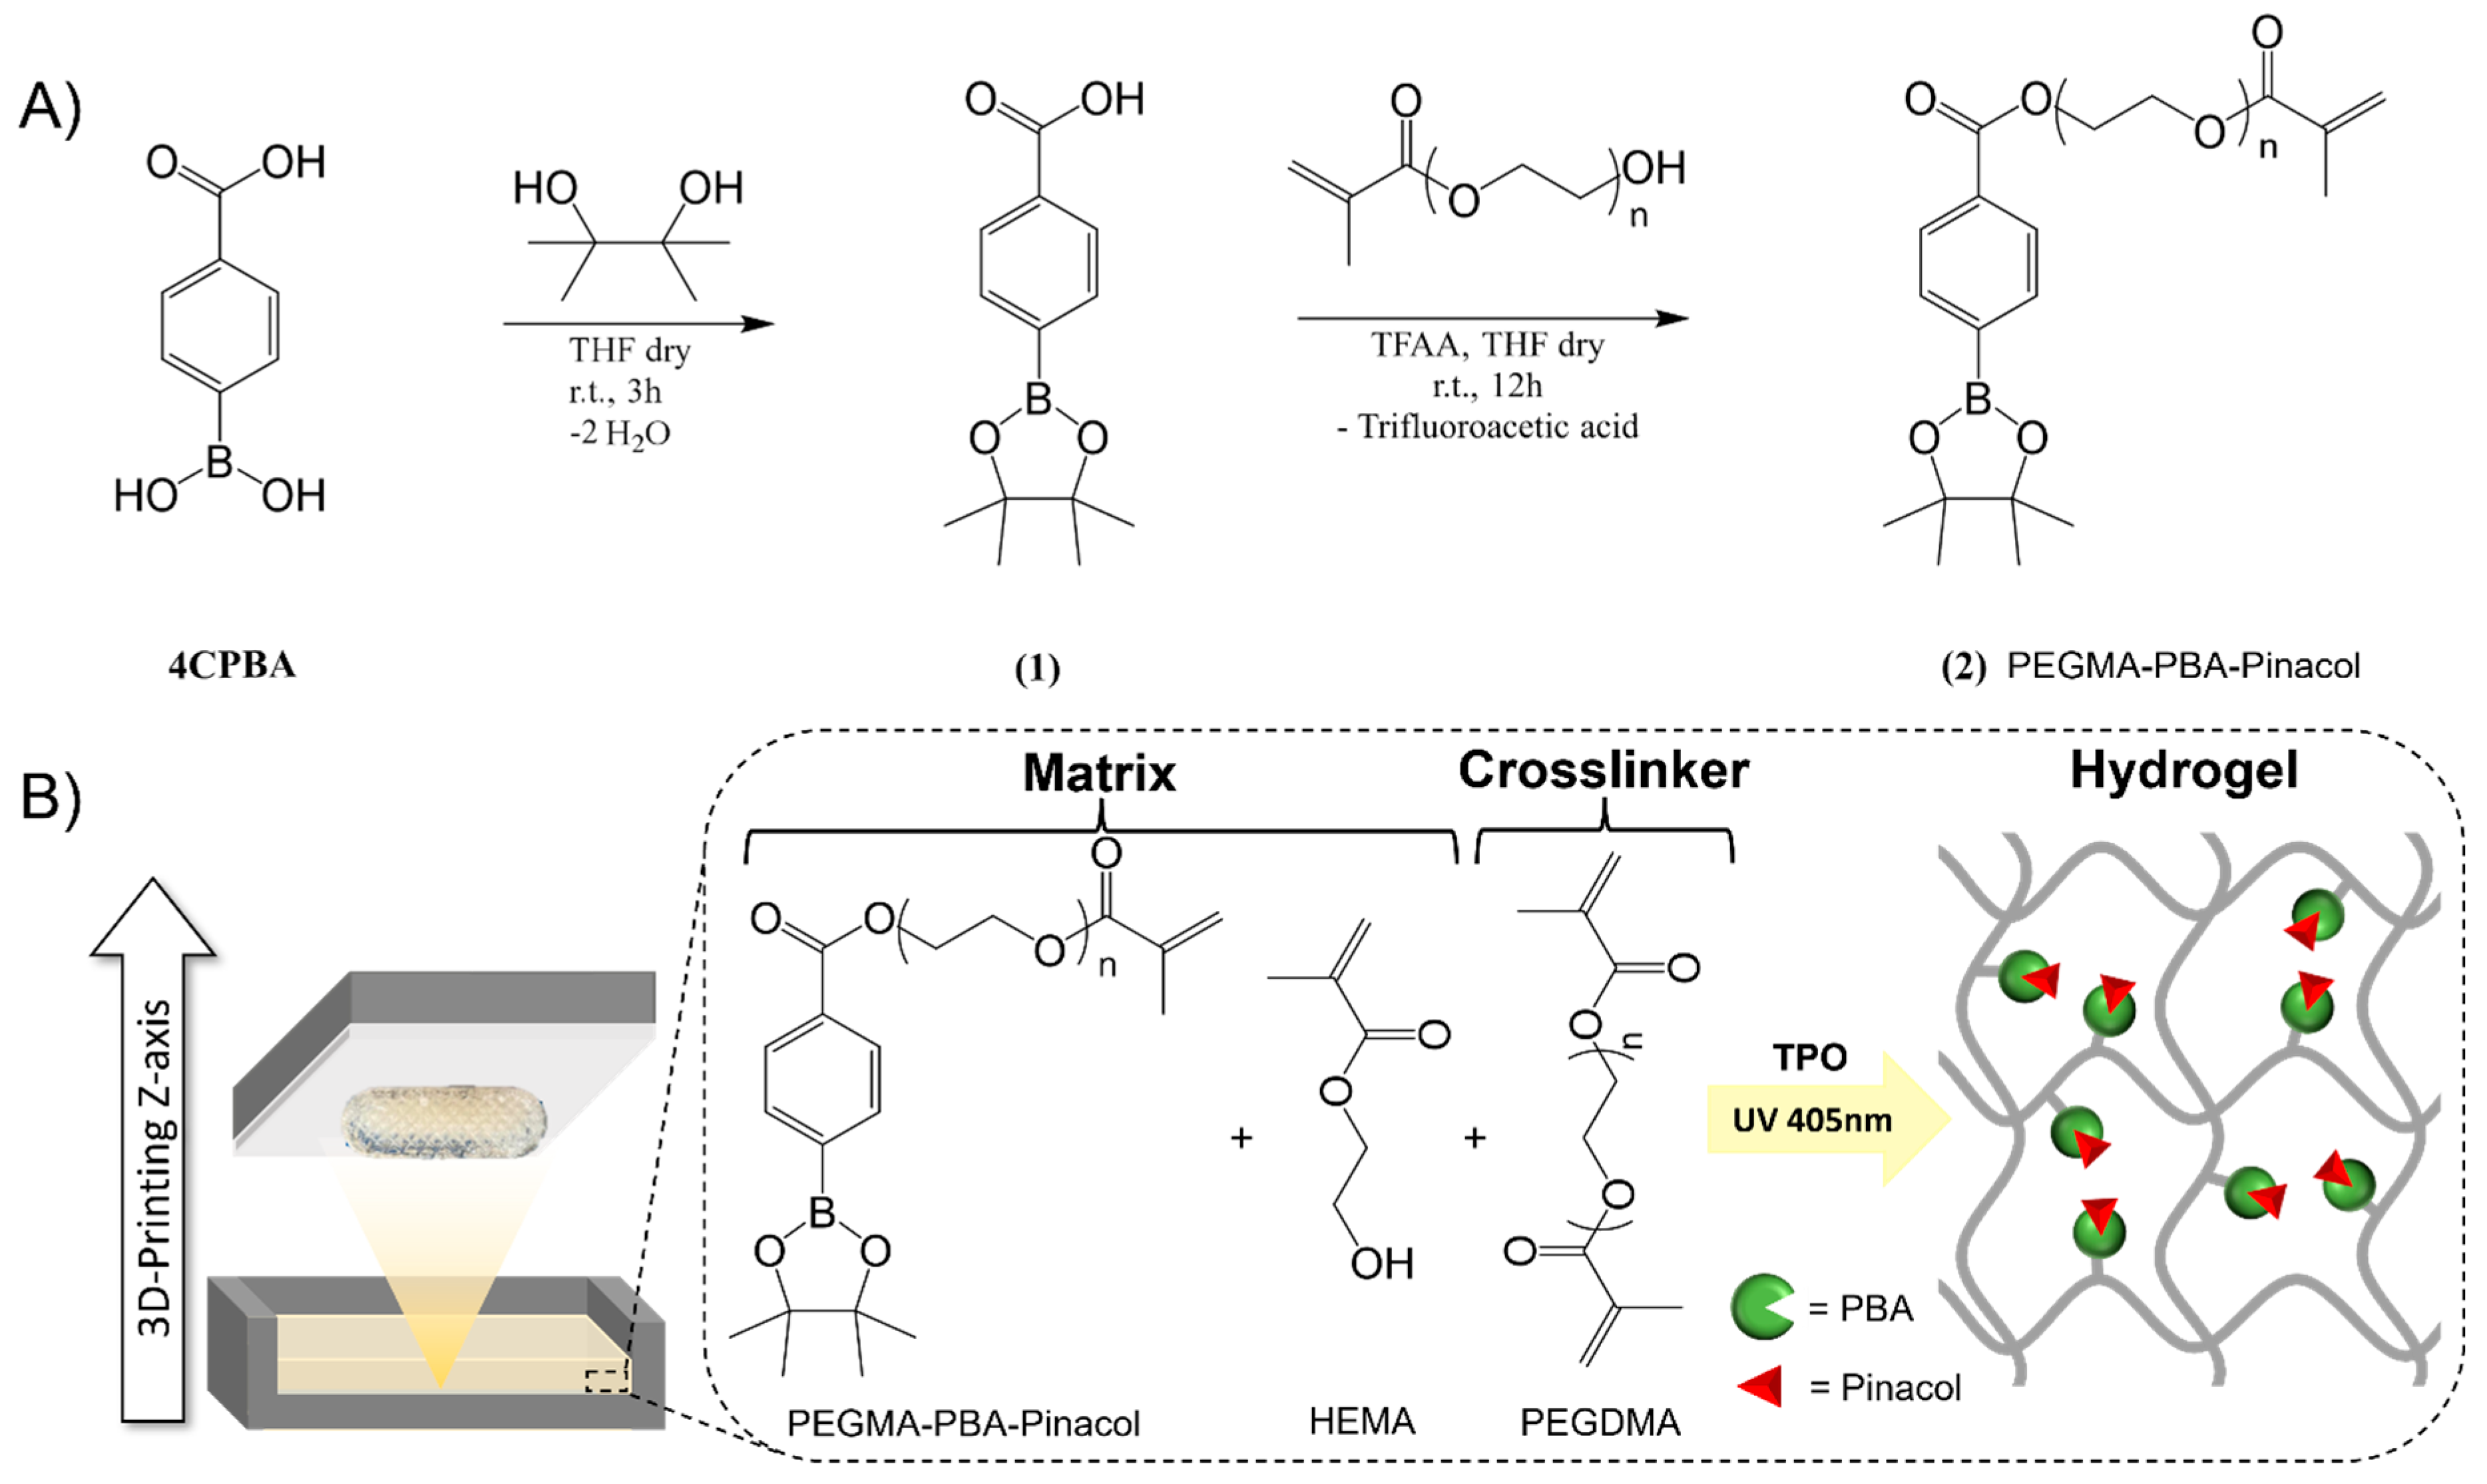
Synthesis of phenylboronic acid-based methacrylate
3D printing of bioinert phenylboronic acid-containing hydrogels
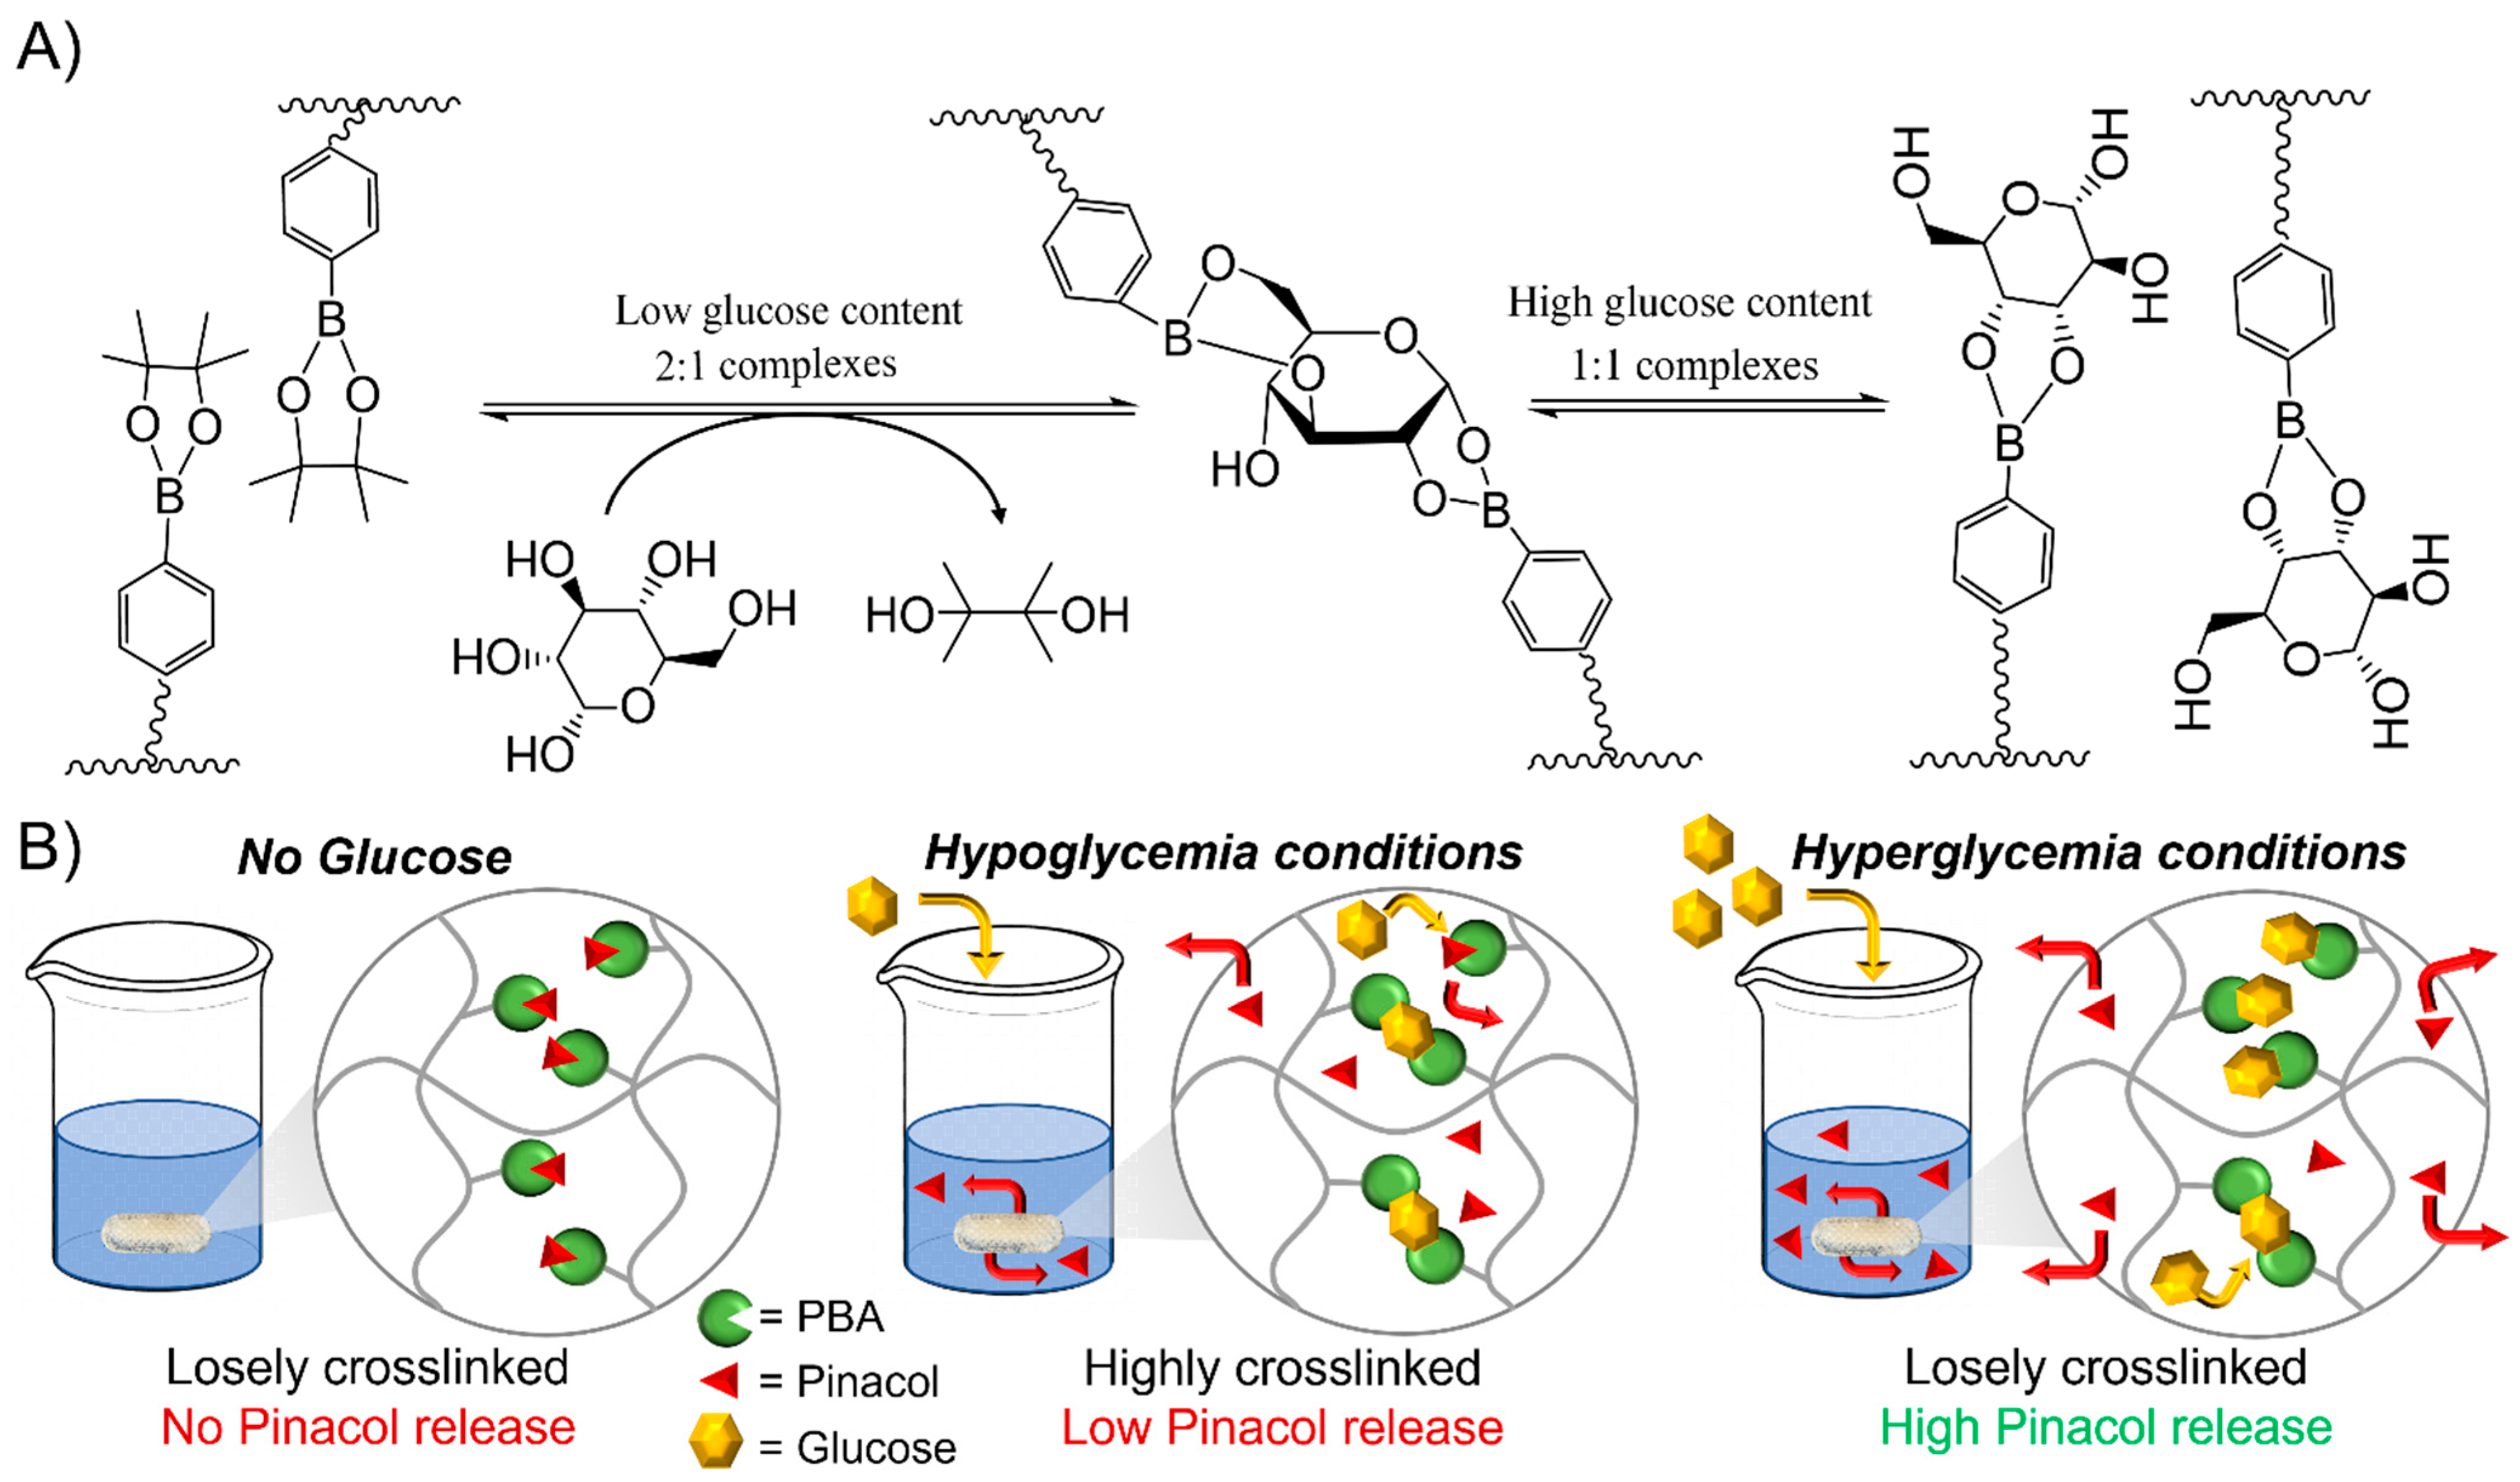
Transesterification of phenylboronic pinacol ester with glucose
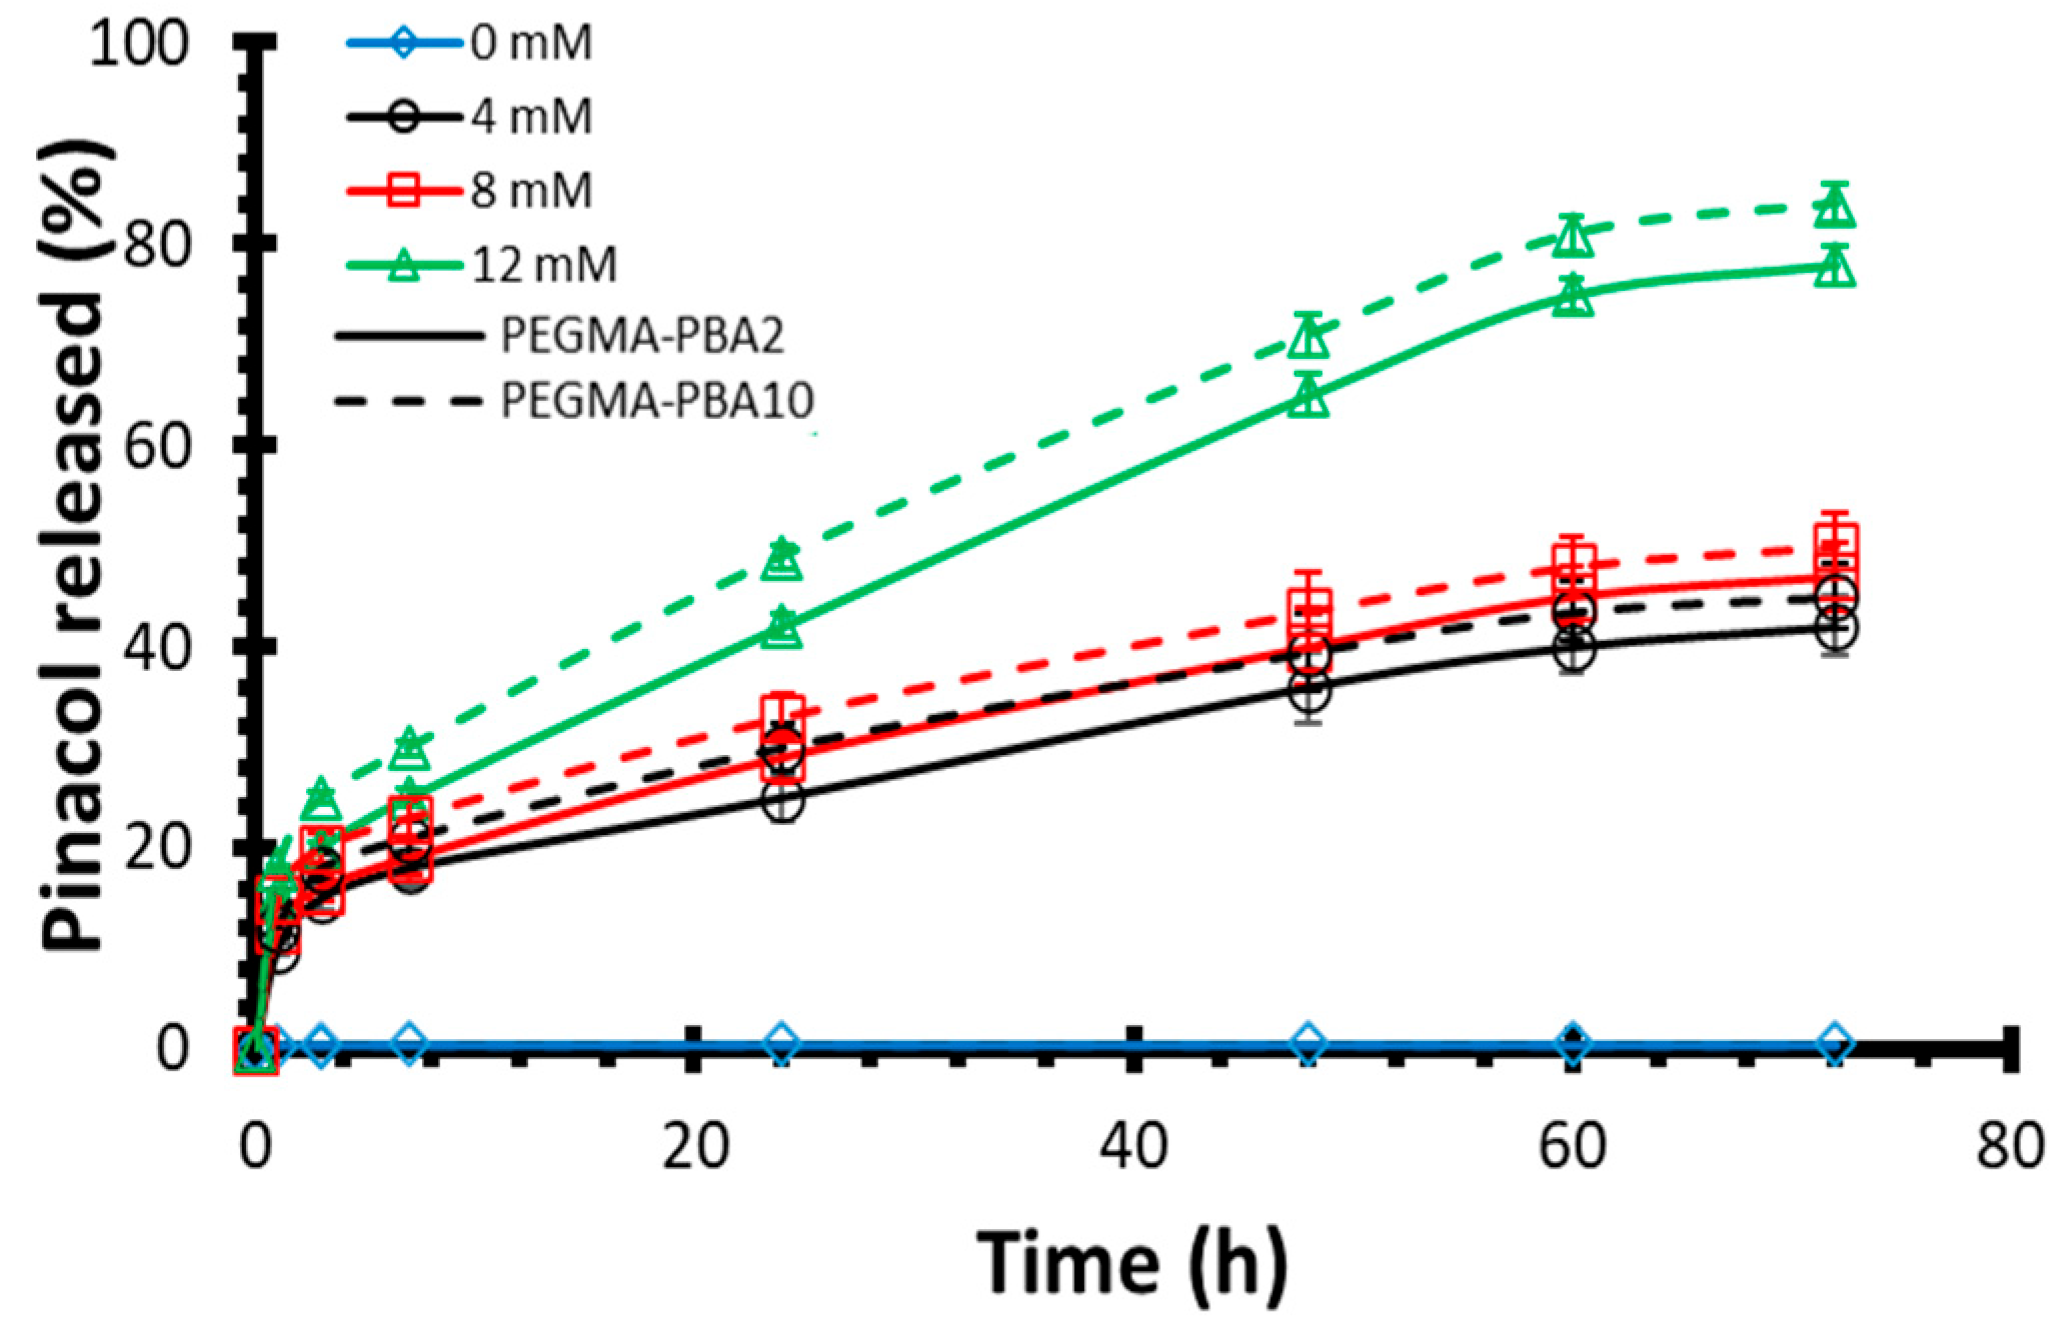
In vitro drug release testing
Additional techniques
Results and Discussion
3D-printed bioinert phenylboronic acid-containing hydrogels
Glucose Responsiveness Features
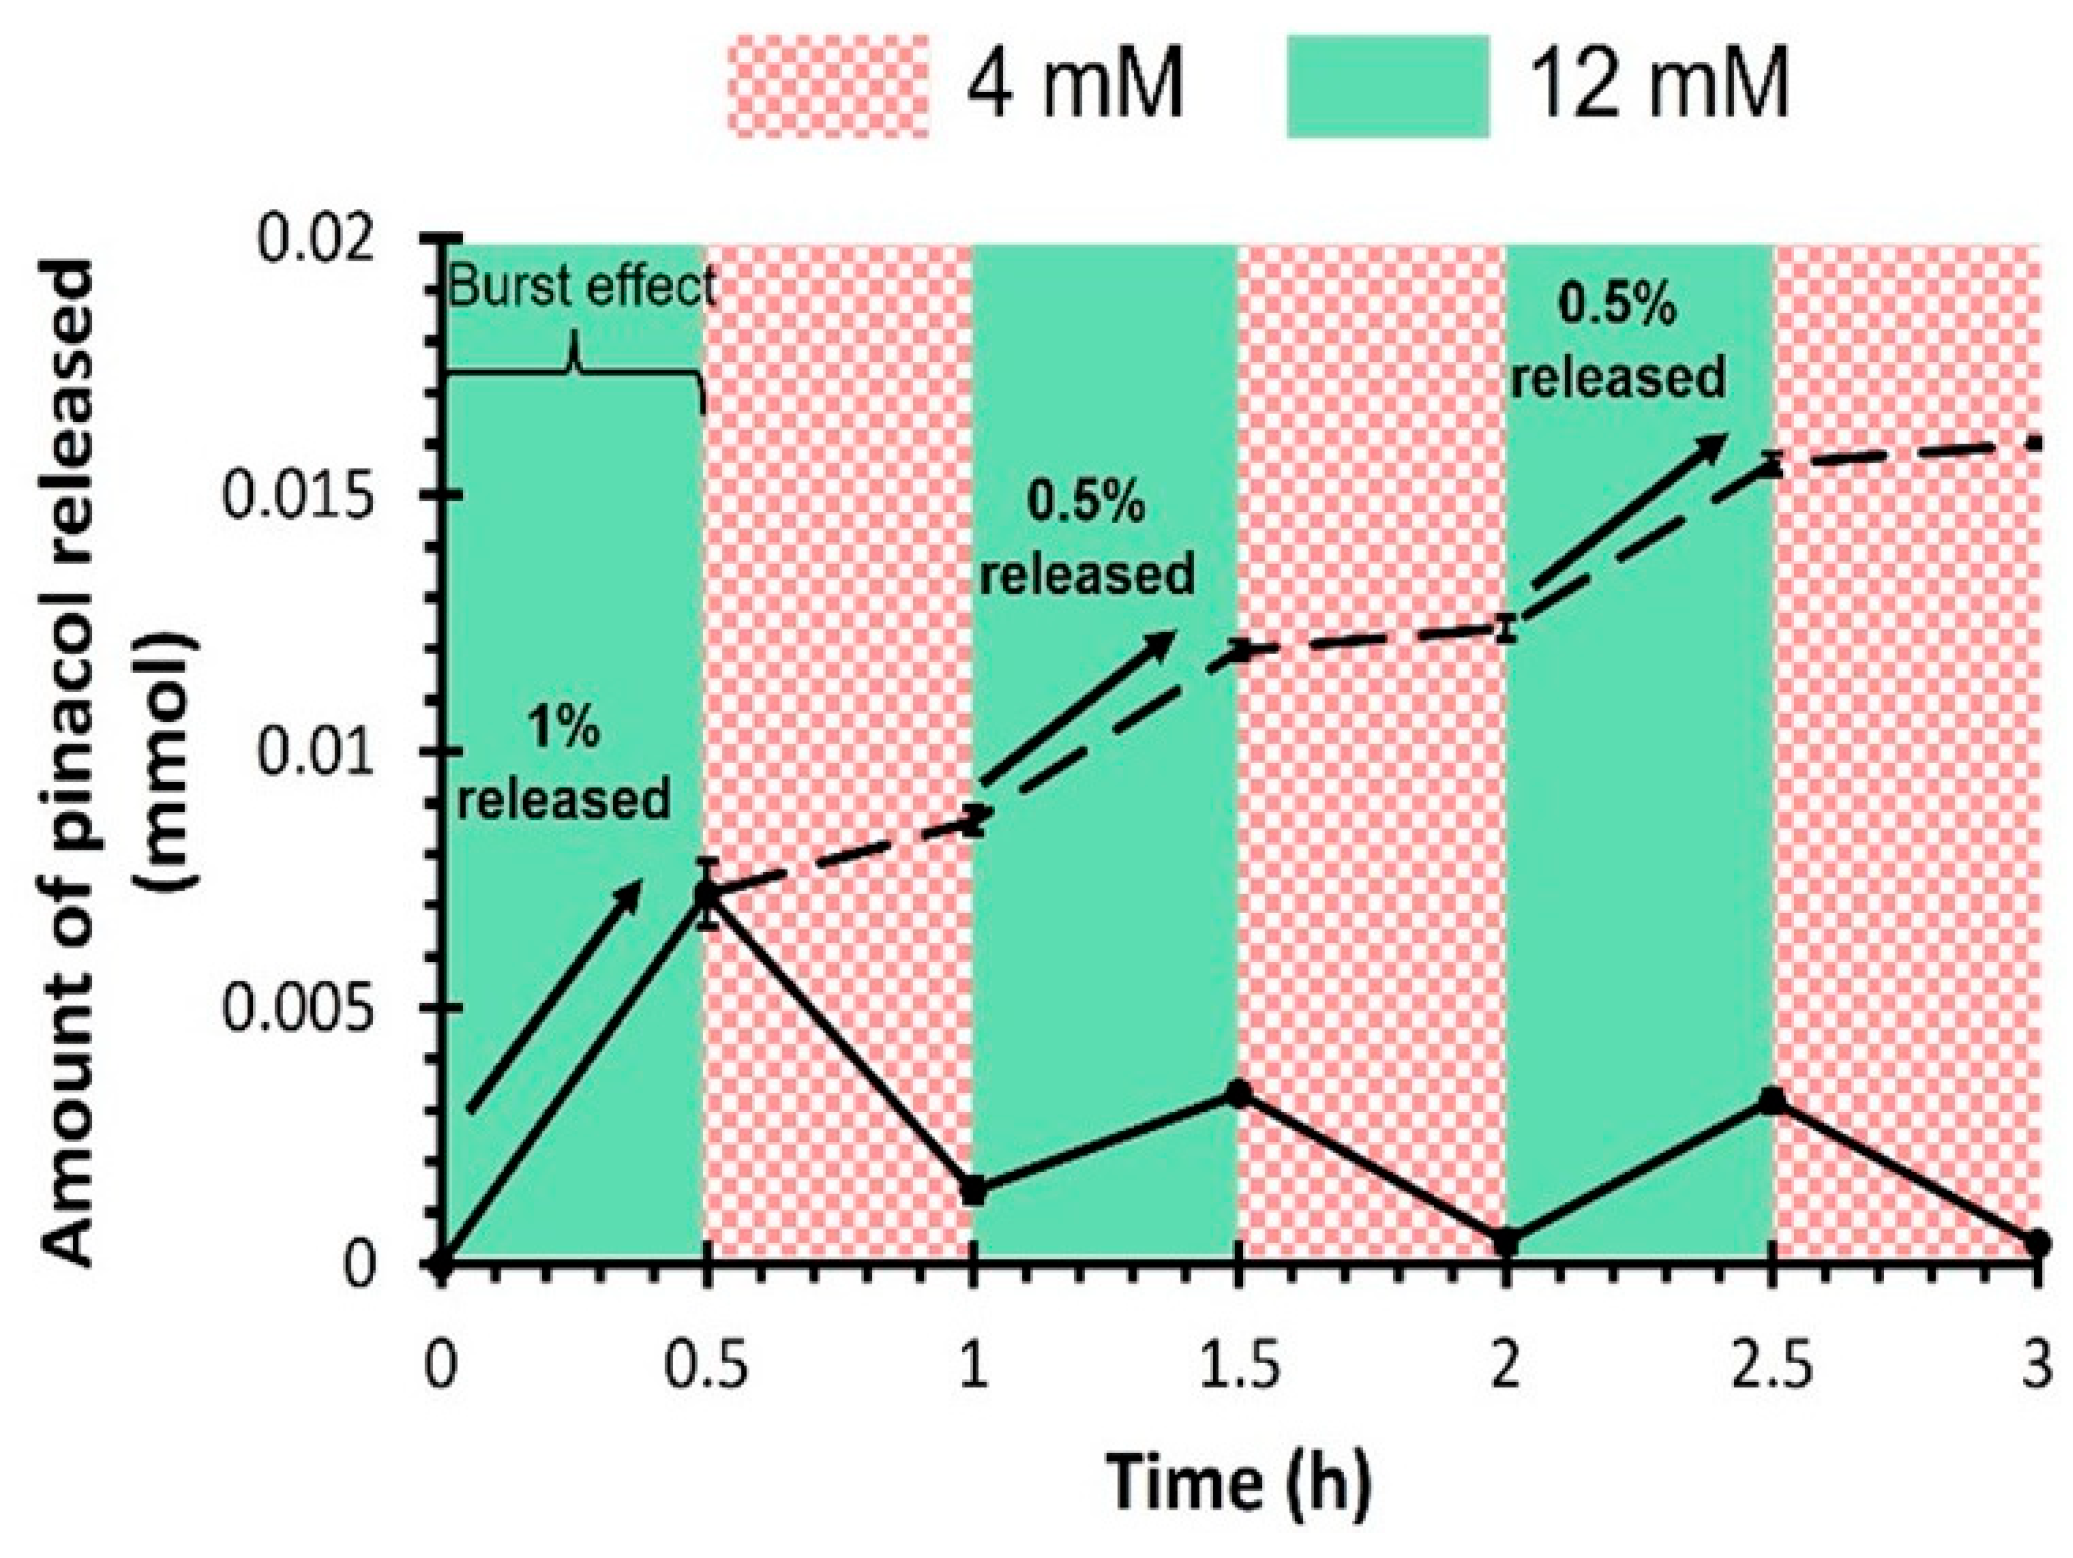
Drug release kinetics
Conclusions
Supplementary Materials
Acknowledgements
Conflicts of Interest
References
- Cho, N.H.; Shaw, J.E.; Karuranga, S.; Huang, Y.; da Rocha Fernandes, J.D.; Ohlrogge, A.W.; Malanda, B. Diabetes Res Clin Pract 2018, 138, 271–281. [CrossRef] [PubMed]
- Mehrabbeik, A.; Namiranian, N.; Azizi, R.; Aghaee Meybody, M.; Shariati, M.; Mahmoudi Kohani, H.A. Int J Endocrinol Metab 2022, 20, e128392.
- Johnson-Rabbett, B.; Seaquist, E.R. Journal of Diabetes 2019, 11, 711–718.
- Gordijo, C.R.; Koulajian, K.; Shuhendler, A.J.; Bonifacio, L.D.; Huang, H.Y.; Chiang, S.; Ozin, G.A.; Giacca, A.; Wu, X.Y. Advanced Functional Materials 2011, 21, 73–82. [CrossRef]
- Chu, M.K.L.; Chen, J.; Gordijo, C.R.; Chiang, S.; Ivovic, A.; Koulajian, K.; Giacca, A.; Wu, X.Y.; Sun, Y. Lab on a Chip 2012, 12, 2533–2539. [CrossRef]
- Jarosinski, M.A.; Dhayalan, B.; Rege, N.; Chatterjee, D.; Weiss, M.A. Diabetologia 2021, 64, 1016–1029. [CrossRef] [PubMed]
- Ballerstadt, R.; Evans, C.; McNichols, R.; Gowda, A. Biosensors and Bioelectronics 2006, 22, 275–284. [CrossRef]
- Yin, R.; Tong, Z.; Yang, D.; Nie, J. Journal of Controlled Release 2011, 152, e163–e165. [CrossRef]
- Xu, M.; Huang, J.; Jiang, S.; He, J.; Wang, Z.; Qin, H.; Guan, Y.-Q. International Journal of Biological Macromolecules 2022, 202, 296–308. [CrossRef] [PubMed]
- Wang, J.; Wang, Z.; Yu, J.; Kahkoska, A.R.; Buse, J.B.; Gu, Z. Advanced Materials 2020, 32, 1902004. [CrossRef]
- Wang, J.; Ye, Y.; Yu, J.; Kahkoska, A.R.; Zhang, X.; Wang, C.; Sun, W.; Corder, R.D.; Chen, Z.; Khan, S.A.; Buse, J.B.; Gu, Z. ACS Nano 2018, 12, 2466–2473. [CrossRef] [PubMed]
- Luo, F.-Q.; Chen, G.; Xu, W.; Zhou, D.; Li, J.-X.; Huang, Y.-C.; Lin, R.; Gu, Z.; Du, J.-Z. Nano Research 2021, 14, 2689–2696. [CrossRef]
- Wang, Y.; Fan, Y.; Zhang, M.; Zhou, W.; Chai, Z.; Wang, H.; Sun, C.; Huang, F. Biomacromolecules 2020, 21, 1507–1515. [CrossRef] [PubMed]
- Liu, Q.; Rauth, A.M.; Wu, X.Y. Int. J. Pharm. 2007, 339, 148–156. [CrossRef]
- Wen, J.; Anderson, S.M.; Du, J.; Yan, M.; Wang, J.; Shen, M.; Lu, Y.; Segura, T. Advanced Materials 2011, 23, 4549–4553. [CrossRef]
- Dutta, K.; Hu, D.; Zhao, B.; Ribbe, A.E.; Zhuang, J.; Thayumanavan, S. Journal of the American Chemical Society 2017, 139, 5676–5679. [CrossRef]
- Sharma, G.; Sharma, A.R.; Nam, J.-S.; Doss, G.P.C.; Lee, S.-S.; Chakraborty, C. Journal of Nanobiotechnology 2015, 13, 74.
- Horgan, A.M.; Marshall, A.J.; Kew, S.J.; Dean, K.E.S.; Creasey, C.D.; Kabilan, S. Biosensors and Bioelectronics 2006, 21, 1838–1845. [CrossRef] [PubMed]
- Ngo, Y.-L. T.; Choi, W.M.; Chung, J.S.; Hur, S.H. Sensors and Actuators B: Chemical 2019, 282, 36–44. [CrossRef]
- Tang, Z.; Guan, Y.; Zhang, Y. Polym. Chem. 2014, 5, 1782–1790. [CrossRef]
- Meng, H.; Zheng, J.; Wen, X.; Cai, Z.; Zhang, J.; Chen, T. Macromol. Rapid Commun. 2015, 36, 533–537. [CrossRef]
- Matsumoto, A.; Ishii, T.; Nishida, J.; Matsumoto, H.; Kataoka, K.; Miyahara, Y. Angewandte Chemie International Edition 2012, 51, 2124–2128. [CrossRef] [PubMed]
- Yin, W.; Wang, Y.; Xiao, Y.; Mao, A.; Lang, M. Eur. Polym. J. 2022, 173, 111235. [CrossRef]
- Wu, Q.; Wang, L.; Yu, H.; Wang, J.; Chen, Z. Chem. Rev. 2011, 111, 7855–7875. [CrossRef]
- Yang, T.; Ji, R.; Deng, X.-X.; Du, F.-S.; Li, Z.-C. Soft Matter 2014, 10, 2671–2678. [CrossRef] [PubMed]
- Yesilyurt, V.; Webber, M.J.; Appel, E.A.; Godwin, C.; Langer, R.; Anderson, D.G. Advanced Materials 2016, 28, 86–91. [CrossRef]
- Dong, Y.; Wang, W.; Veiseh, O.; Appel, E.A.; Xue, K.; Webber, M.J.; Tang, B.C.; Yang, X.-W.; Weir, G.C.; Langer, R.; Anderson, D.G. Langmuir 2016, 32, 8743–8747. [CrossRef]
- Yu, J.; Wang, J.; Zhang, Y.; Chen, G.; Mao, W.; Ye, Y.; Kahkoska, A.R.; Buse, J.B.; Langer, R.; Gu, Z. Nature Biomedical Engineering 2020, 4, 499–506. [CrossRef]
- Marco-Dufort, B.; Willi, J.; Vielba-Gomez, F.; Gatti, F.; Tibbitt, M.W. Biomacromolecules 2021, 22, 146–157. [CrossRef]
- Xiang, Y.; Xian, S.; Ollier, R.C.; Yu, S.; Su, B.; Pramudya, I.; Webber, M.J. Journal of Controlled Release 2022, 348, 601–611. [CrossRef]
- Alexeev, V.L.; Sharma, A.C.; Goponenko, A.V.; Das, S.; Lednev, I.K.; Wilcox, C.S.; Finegold, D.N.; Asher, S.A. Analytical Chemistry 2003, 75, 2316–2323. [CrossRef]
- Zhang, C.; Losego, M.D.; Braun, P.V. Chemistry of Materials 2013, 25, 3239–3250. [CrossRef]
- Achilli, C.; Ciana, A.; Fagnoni, M.; Balduini, C.; Minetti, G. Open Chemistry 2013, 11, 137–139. [CrossRef]
- Trivedi, M.; Jee, J.; Silva, S.; Blomgren, C.; Pontinha, V.M.; Dixon, D.L.; Van Tassel, B.; Bortner, M.J.; Williams, C.; Gilmer, E.; Haring, A.P.; Halper, J.; Johnson, B.N.; Kong, Z.; Halquist, M.S.; Rocheleau, P.F.; Long, T.E.; Roper, T.; Wijesinghe, D.S. Additive Manufacturing 2018, 23, 319–328. [CrossRef]
- Zhang, J.; Vo, A.Q.; Feng, X.; Bandari, S.; Repka, M.A. AAPS PharmSciTech 2018, 19, 3388–3402. [CrossRef]
- Domsta, V.; Seidlitz, A. Molecules 2021, 26, 4066. [CrossRef]
- Sadia, M.; Arafat, B.; Ahmed, W.; Forbes, R.T.; Alhnan, M.A. Journal of Controlled Release 2018, 269, 355–363. [CrossRef]
- Arafat, B.; Wojsz, M.; Isreb, A.; Forbes, R.T.; Isreb, M.; Ahmed, W.; Arafat, T.; Alhnan, M.A. European Journal of Pharmaceutical Sciences 2018, 118, 191–199. [CrossRef]
- Verstraete, G.; Samaro, A.; Grymonpré, W.; Vanhoorne, V.; Van Snick, B.; Boone, M.N.; Hellemans, T.; Van Hoorebeke, L.; Remon, J.P.; Vervaet, C. Int. J. Pharm. 2018, 536, 318–325. [CrossRef]
- Kyobula, M.; Adedeji, A.; Alexander, M.R.; Saleh, E.; Wildman, R.; Ashcroft, I.; Gellert, P.R.; Roberts, C.J. Journal of Controlled Release 2017, 261, 207–215. [CrossRef]
- Tayebi, L.; Rasoulianboroujeni, M.; Moharamzadeh, K.; Almela, T.K.D.; Cui, Z.; Ye, H. Materials Science and Engineering: C 2018, 84, 148–158. [CrossRef]
- Visscher, L.E.; Dang, H.P.; Knackstedt, M.A.; Hutmacher, D.W.; Tran, P.A. Materials Science and Engineering: C 2018, 87, 78–89. [CrossRef] [PubMed]
- Ambrosi, A.; Pumera, M. Chemical Society Reviews 2016, 45, 2740–2755. [CrossRef] [PubMed]
- Economidou, S.N.; Lamprou, D.A.; Douroumis, D. Int. J. Pharm. 2018, 544, 415–424. [CrossRef] [PubMed]
- Mizuno, Y.; Takasawa, K.; Hanada, T.; Nakamura, K.; Yamada, K.; Tsubaki, H.; Hara, M.; Tashiro, Y.; Matsuo, M.; Ito, T.; Hikima, T. Biomedical Microdevices 2021, 23, 38.
- Xenikakis, I.; Tsongas, K.; Tzimtzimis, E.K.; Katsamenis, O.L.; Demiri, E.; Zacharis, C.K.; Georgiou, D.; Kalogianni, E.P.; Tzetzis, D.; Fatouros, D.G. Journal of Drug Delivery Science and Technology 2022, 67, 102891. [CrossRef]
- Arora, A.; Prausnitz, M.R.; Mitragotri, S. Int. J. Pharm. 2008, 364, 227–236. [CrossRef]
- Chen, W.; Li, H.; Shi, D.; Liu, Z.; Yuan, W. Frontiers in Pharmacology 2016, 7.
- Dorsey, P.J.; Rubanov, M.; Wang, W.; Schulman, R. ACS Macro Letters 2019, 8, 1133–1140. [CrossRef]
- Jin, X.; Zhu, D.D.; Chen, B.Z.; Ashfaq, M.; Guo, X.D. Adv. Drug Delivery Rev. 2018, 127, 119–137. [CrossRef]
- Liu, H.; Li, W.; Liu, C.; Tan, J.; Wang, H.; Hai, B.; Cai, H.; Leng, H.-J.; Liu, Z.-J.; Song, C.-L. Biofabrication 2016, 8, 045012.
- Goyanes, A.; Buanz, A.B.M.; Hatton, G.B.; Gaisford, S.; Basit, A.W. European Journal of Pharmaceutics and Biopharmaceutics 2015, 89, 157–162. [CrossRef] [PubMed]
- Filipović, V.V.; Božić Nedeljković, B.Đ.; Vukomanović, M.; Tomić, S.L. Polymer Testing 2018, 68, 270–278. [CrossRef]
- Tzeng, J.-J.; Yang, T.-S.; Lee, W.-F.; Chen, H.; Chang, H.-M. Polymers 2021, 13, 822. [CrossRef] [PubMed]
- Pan, W.; Wallin, T.J.; Odent, J.; Yip, M.C.; Mosadegh, B.; Shepherd, R.F.; Giannelis, E.P. Journal of Materials Chemistry B 2019, 7, 2855–2864. [CrossRef] [PubMed]
- Odent, J.; Wallin, T.J.; Pan, W.; Kruemplestaedter, K.; Shepherd, R.F.; Giannelis, E.P. Advanced Functional Materials 2017, 1701807-n/a. [CrossRef]
- Asai, F.; Seki, T.; Sugawara-Narutaki, A.; Sato, K.; Odent, J.; Coulembier, O.; Raquez, J.-M.; Takeoka, Y. ACS Applied Materials & Interfaces 2020, 12, 46621–46628.
- Robinson, L.L.; Self, J.L.; Fusi, A.D.; Bates, M.W.; Read de Alaniz, J.; Hawker, C.J.; Bates, C.M.; Sample, C.S. ACS Macro Letters 2021, 10, 857–863. [CrossRef]
- Wu, M.; Zhang, Y.; Huang, H.; Li, J.; Liu, H.; Guo, Z.; Xue, L.; Liu, S.; Lei, Y. Materials Science and Engineering: C 2020, 117, 111299. [CrossRef]
- Mayer, J.P.; Zhang, F.; DiMarchi, R.D. Peptide Science 2007, 88, 687–713. [CrossRef]
- Hashimoto, M.; Takada, K.; Kiso, Y.; Muranishi, S. Pharmaceutical Research 1989, 6, 171–176. [CrossRef]
- Korich, A.L.; Iovine, P.M. Dalton Transactions 2010, 39, 1423–1431. [CrossRef]
- Stacey, M.; Bourne, E.J.; Tatlow, J.C.; Tedder, J.M. Nature 1949, 164, 705–705. [CrossRef]
- Wang, C.; Lin, B.; Zhu, H.; Bi, F.; Xiao, S.; Wang, L.; Gai, G.; Zhao, L. Molecules 2019, 24, 1089. [CrossRef] [PubMed]
- DeRosa, M.E.; Baker, L.S.; Melock, T.L.; Yang, B. Progress in Organic Coatings 2021, 158, 106353. [CrossRef]
- Hill, L.W. Progress in Organic Coatings 1997, 31, 235–243. [CrossRef]
- Schurz, J. Prog. Polym. Sci. 1991, 16, 1–53. [CrossRef]
- Jensen, S.S.; Jensen, H.; Cornett, C.; Møller, E.H.; Østergaard, J. Journal of Pharmaceutical and Biomedical Analysis 2014, 92, 203–210. [CrossRef]
- Li, J.; Mooney, D.J. Nature Reviews Materials 2016, 1, 16071. [CrossRef]
- Bhattacharjee, S. Therapeutic Delivery 2021, 12, 21–36. [CrossRef]
- Bove, L.; D'Aniello, C.; Gorrasi, G.; Guadagno, L.; Vittoria, V. Polymer 1996, 37, 5309–5311. [CrossRef]


Disclaimer/Publisher’s Note: The statements, opinions and data contained in all publications are solely those of the individual author(s) and contributor(s) and not of MDPI and/or the editor(s). MDPI and/or the editor(s) disclaim responsibility for any injury to people or property resulting from any ideas, methods, instructions or products referred to in the content. |
© 2024 by the authors. Licensee MDPI, Basel, Switzerland. This article is an open access article distributed under the terms and conditions of the Creative Commons Attribution (CC BY) license (http://creativecommons.org/licenses/by/4.0/).


