Submitted:
22 July 2024
Posted:
23 July 2024
You are already at the latest version
Abstract
Keywords:
1. Introduction
2. Materials and Methods
2.1. Cavity and Control Mechanism
2.2. Hot-Wire Measurements
2.3. Acoustic Measurements
2.4. PIV Velocity Measurements
3. Results
3.1. Acoustic Field
3.2. Kinematic Field
3.3. Cross-Correlation Maps
3.4. Proper Orthogonal Decomposition (POD)
5. Conclusions
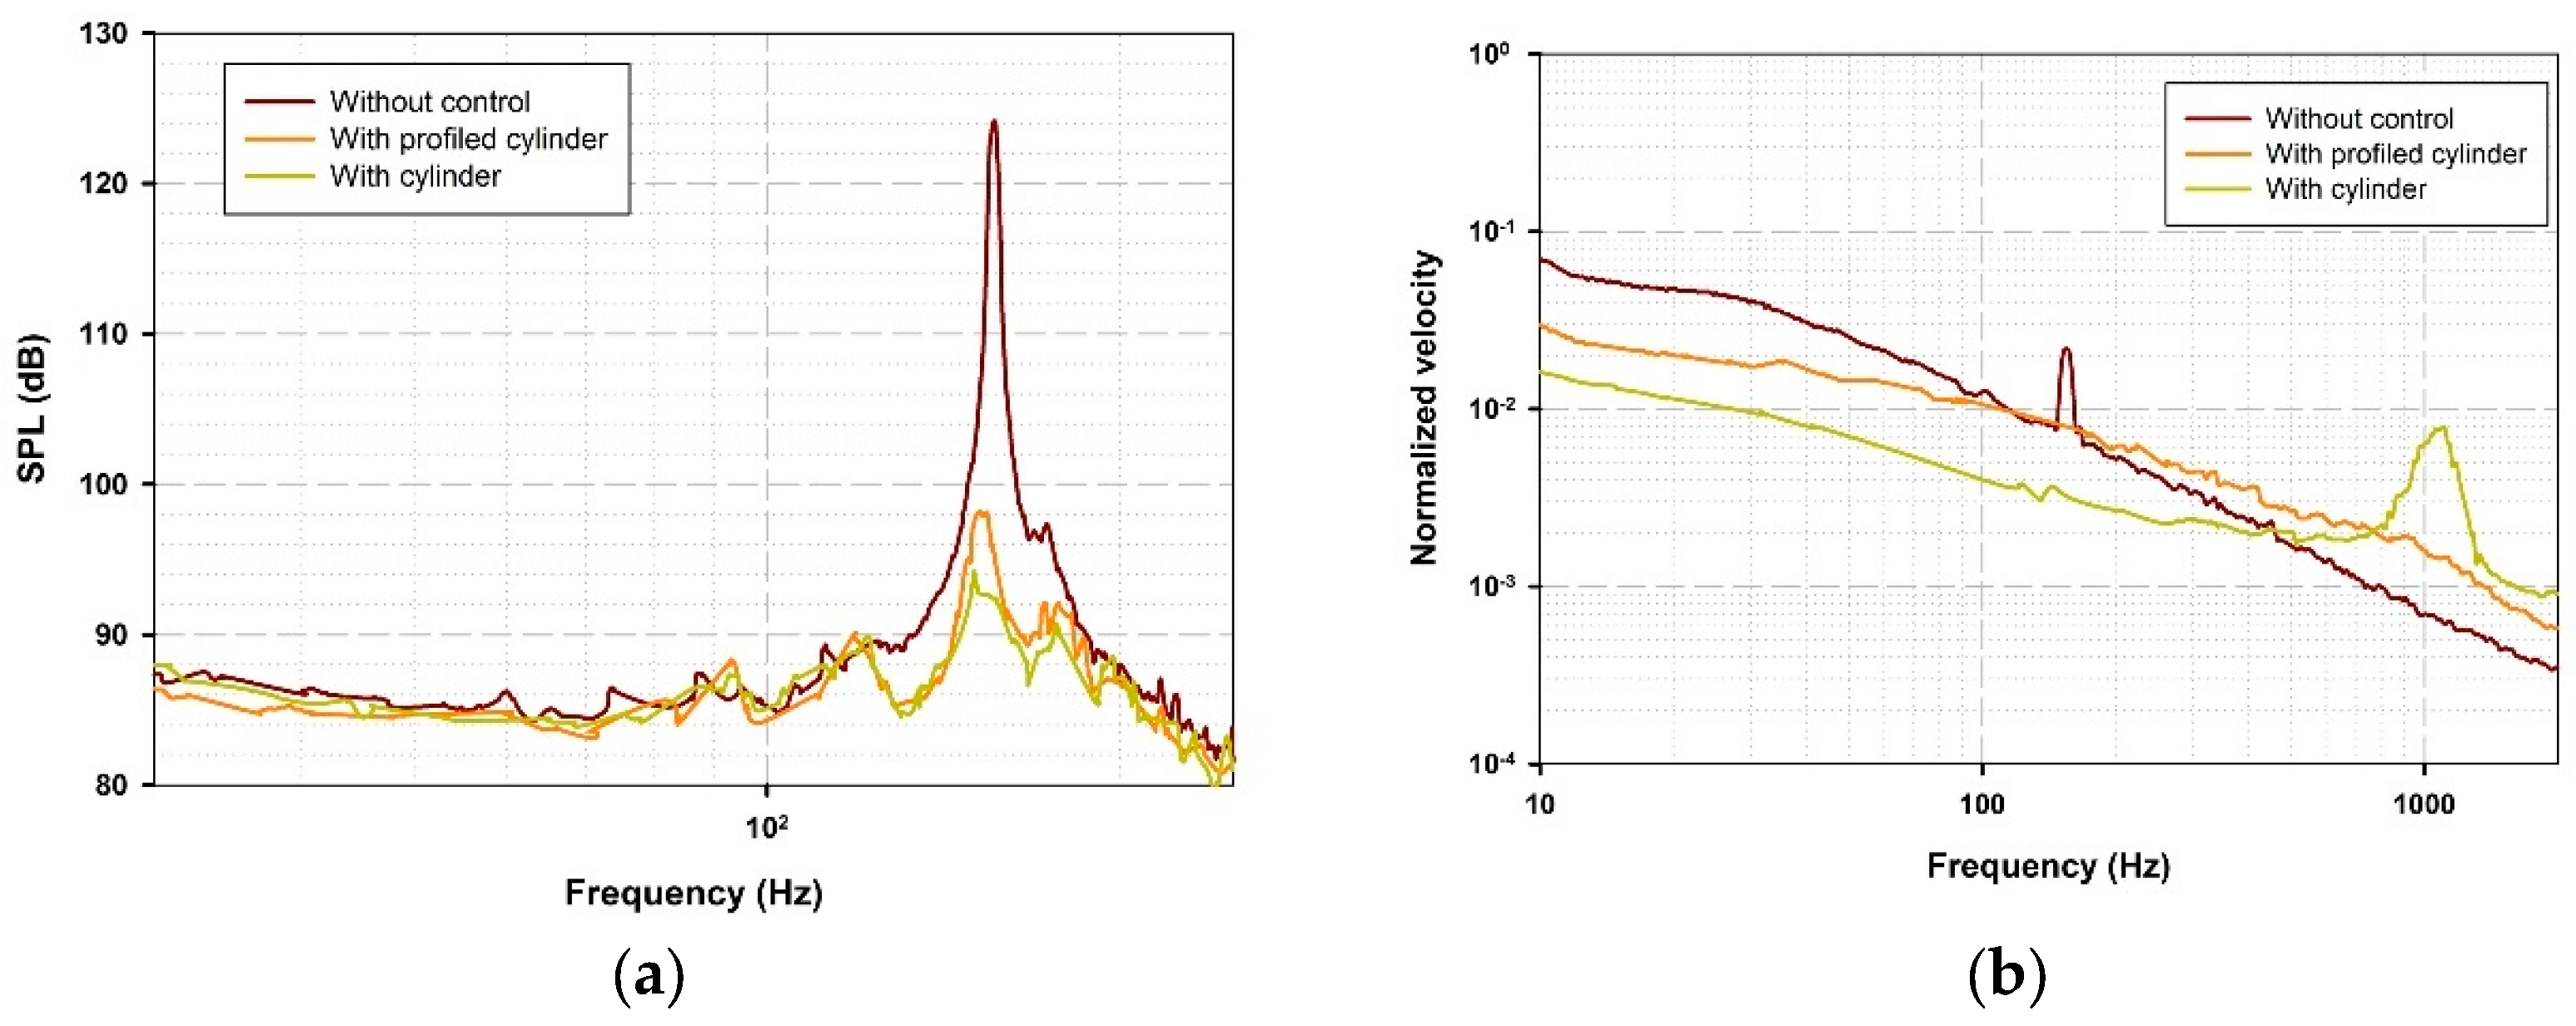
- Achieving a similar significant reduction in noise with both the cylindrical and profiled cylindrical configurations confirms that this reduction is not attributable to high-frequency forcing;
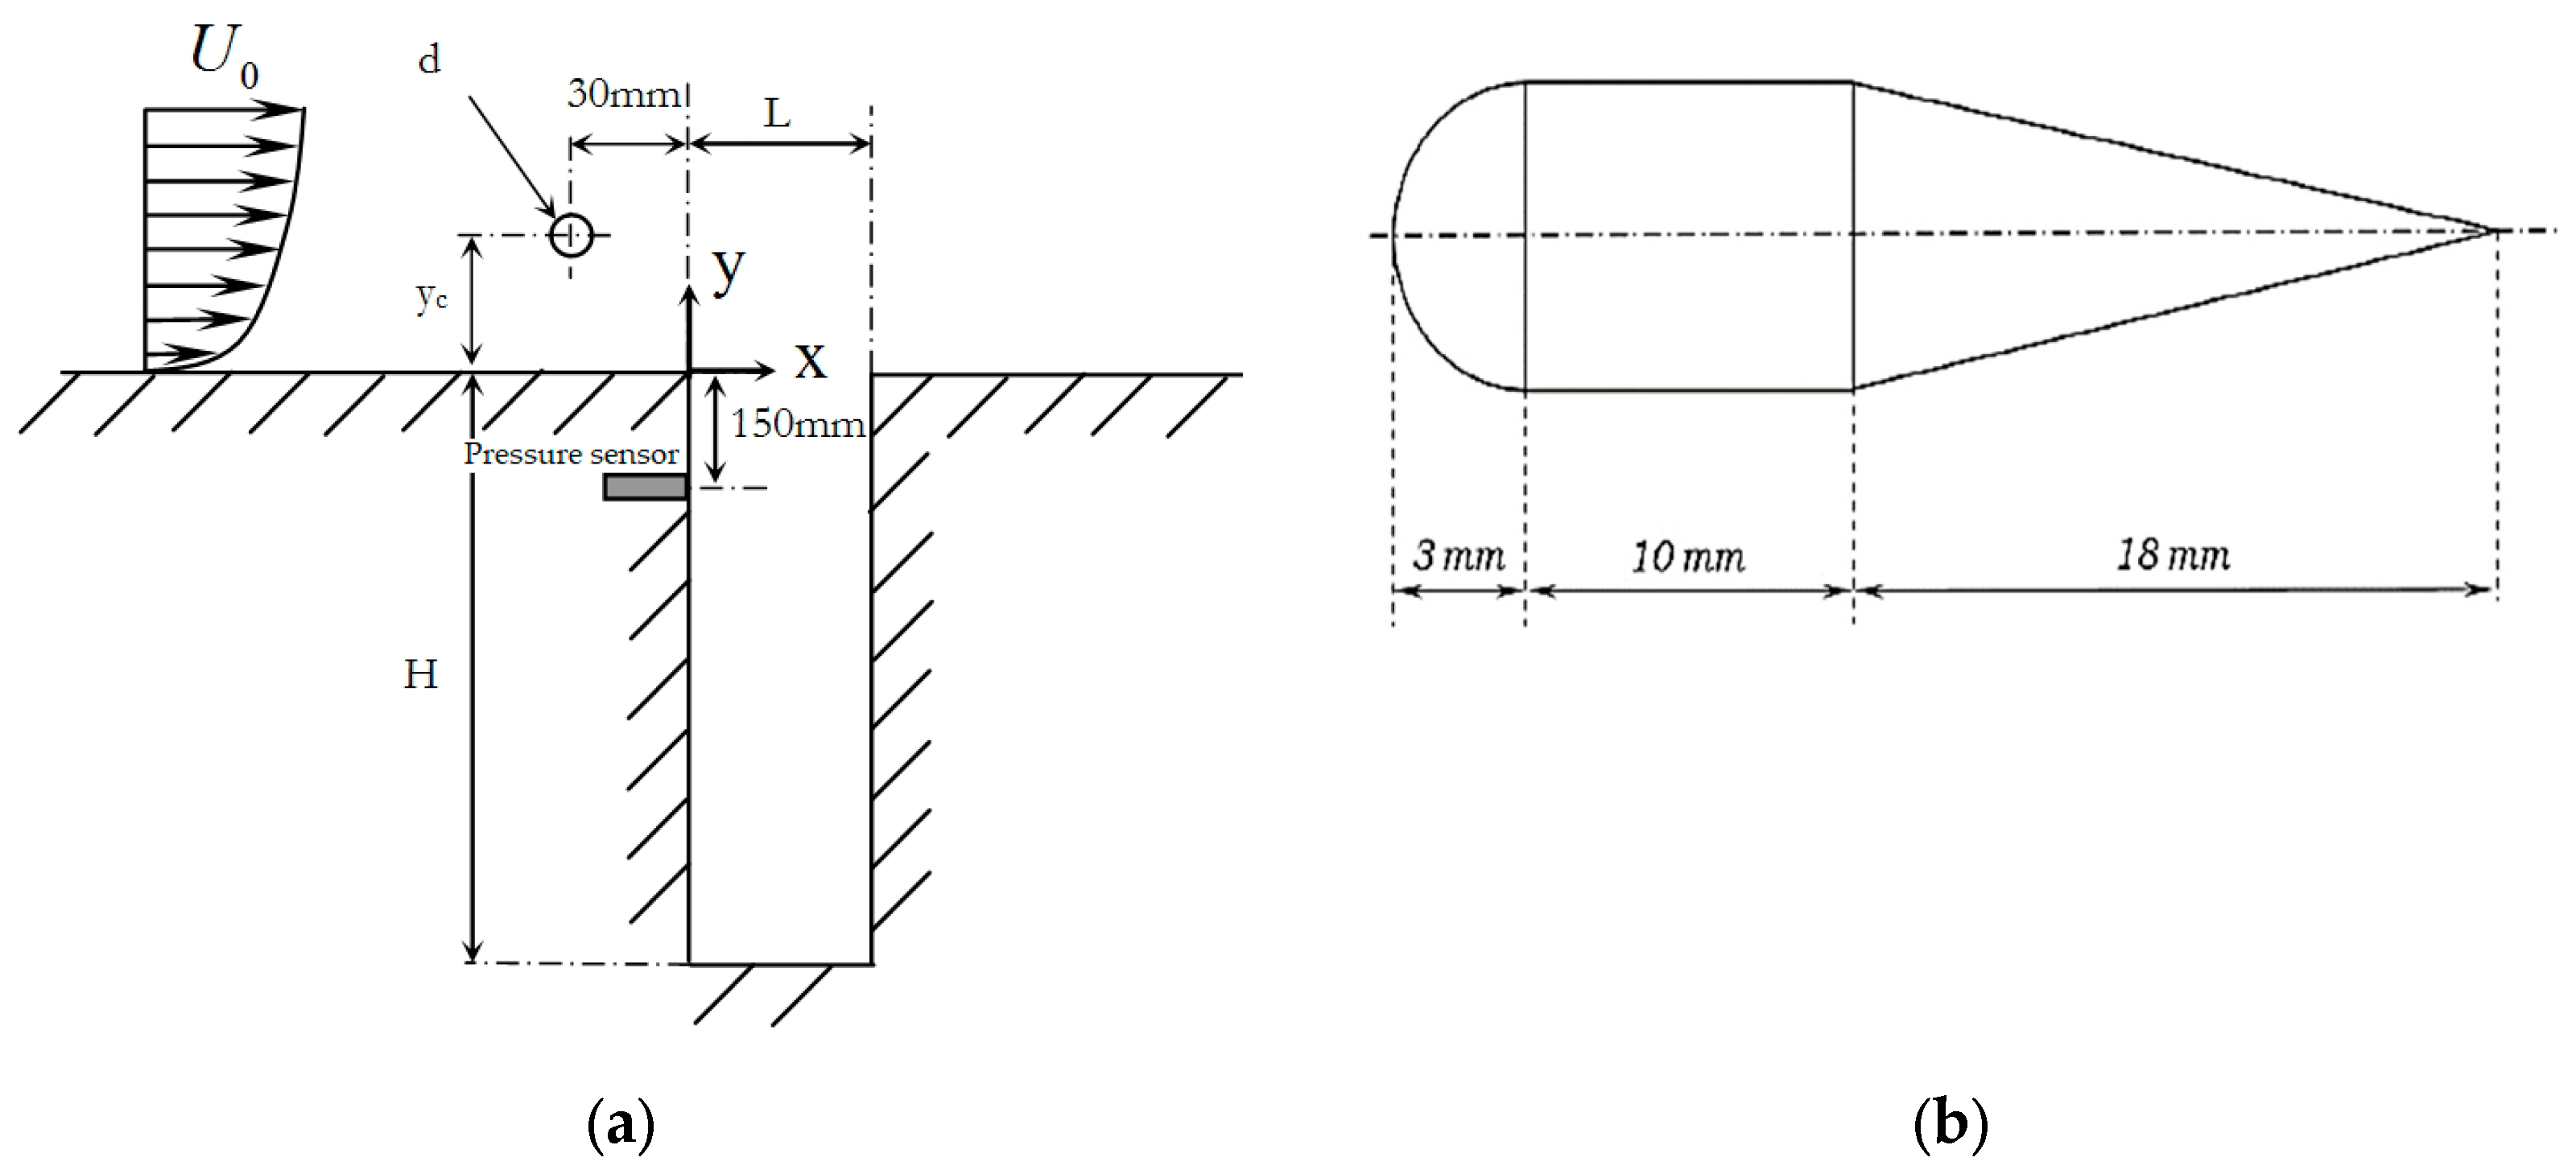
- Vorticity distribution suggests that the presence of the profiled cylinder introduces minimal disturbance within the cavity shear layer compared to the circular cylinder;
- The distribution of normalized Turbulent Kinetic Energy (TKE) significantly decreases with the profiled cylinder, indicating lower TKE compared to the uncontrolled flow;
- Lambda-2 fields reveal two primary vortex paths in the case of control with a cylinder: one linked to vortices in the cavity shear layer, and the other related to the cylinder shedding;
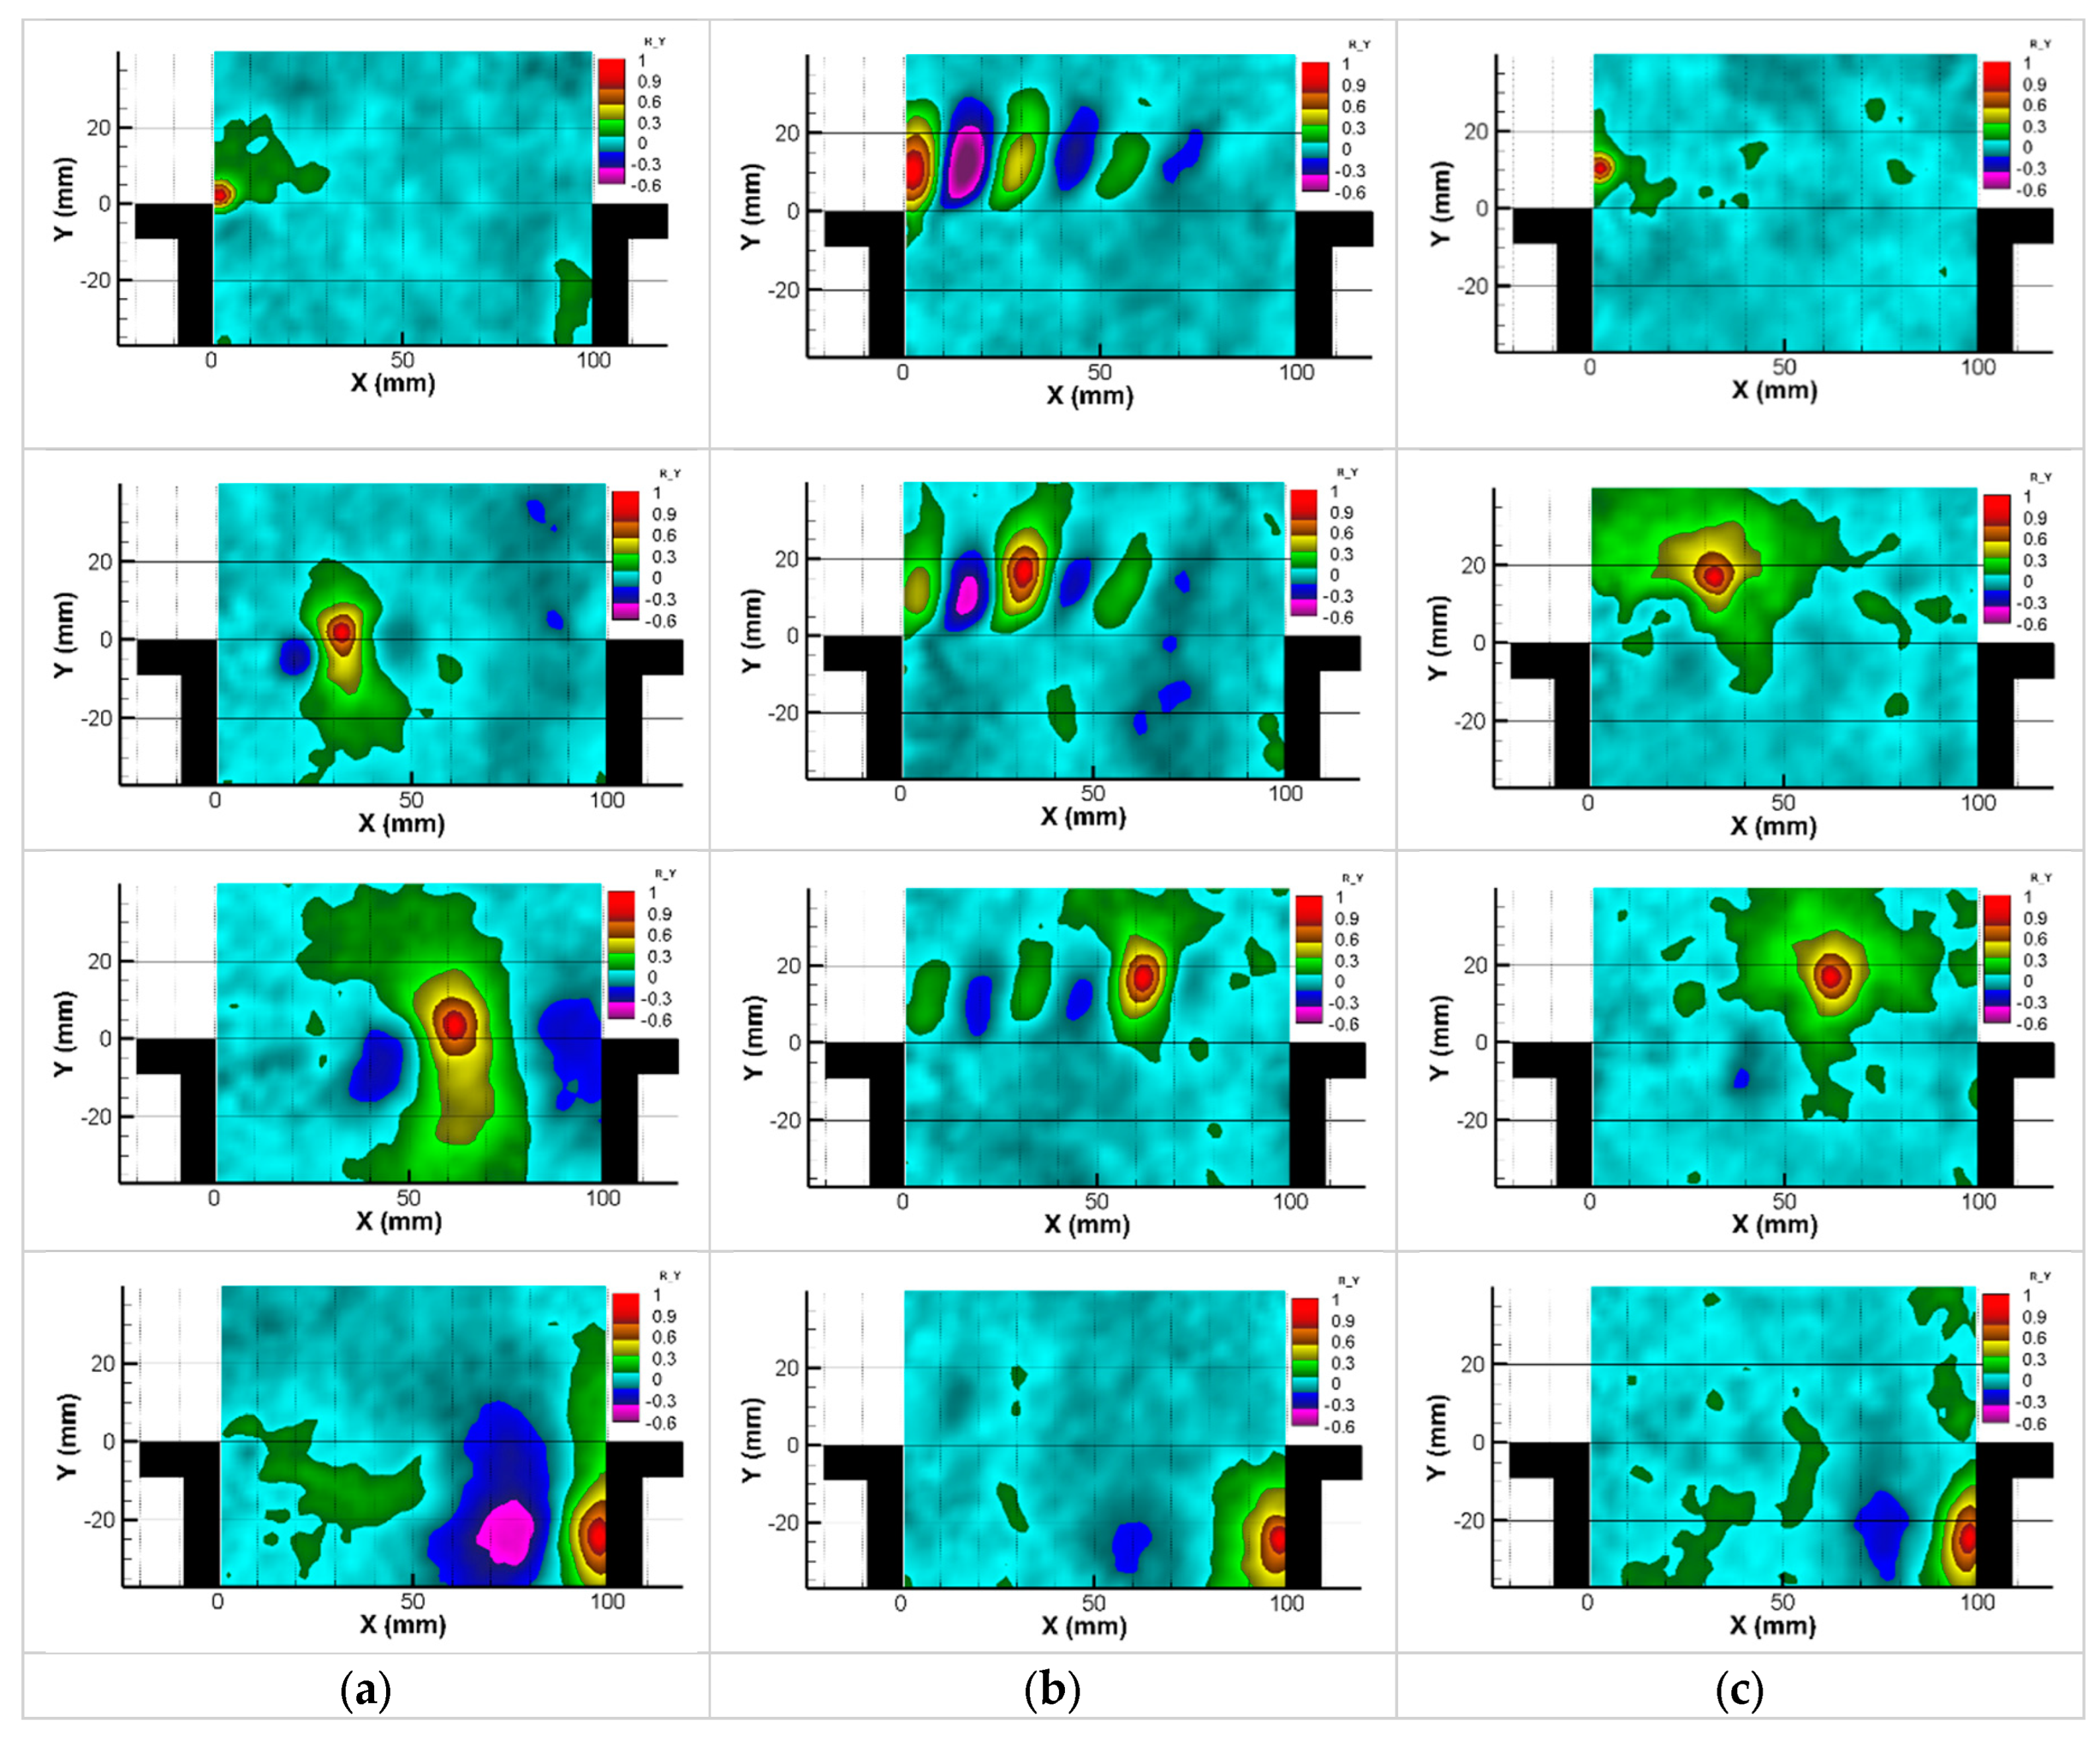
- Cross-correlation maps validate that effective control of Aero-Acoustic coupling does not necessitate high-frequency forcing;
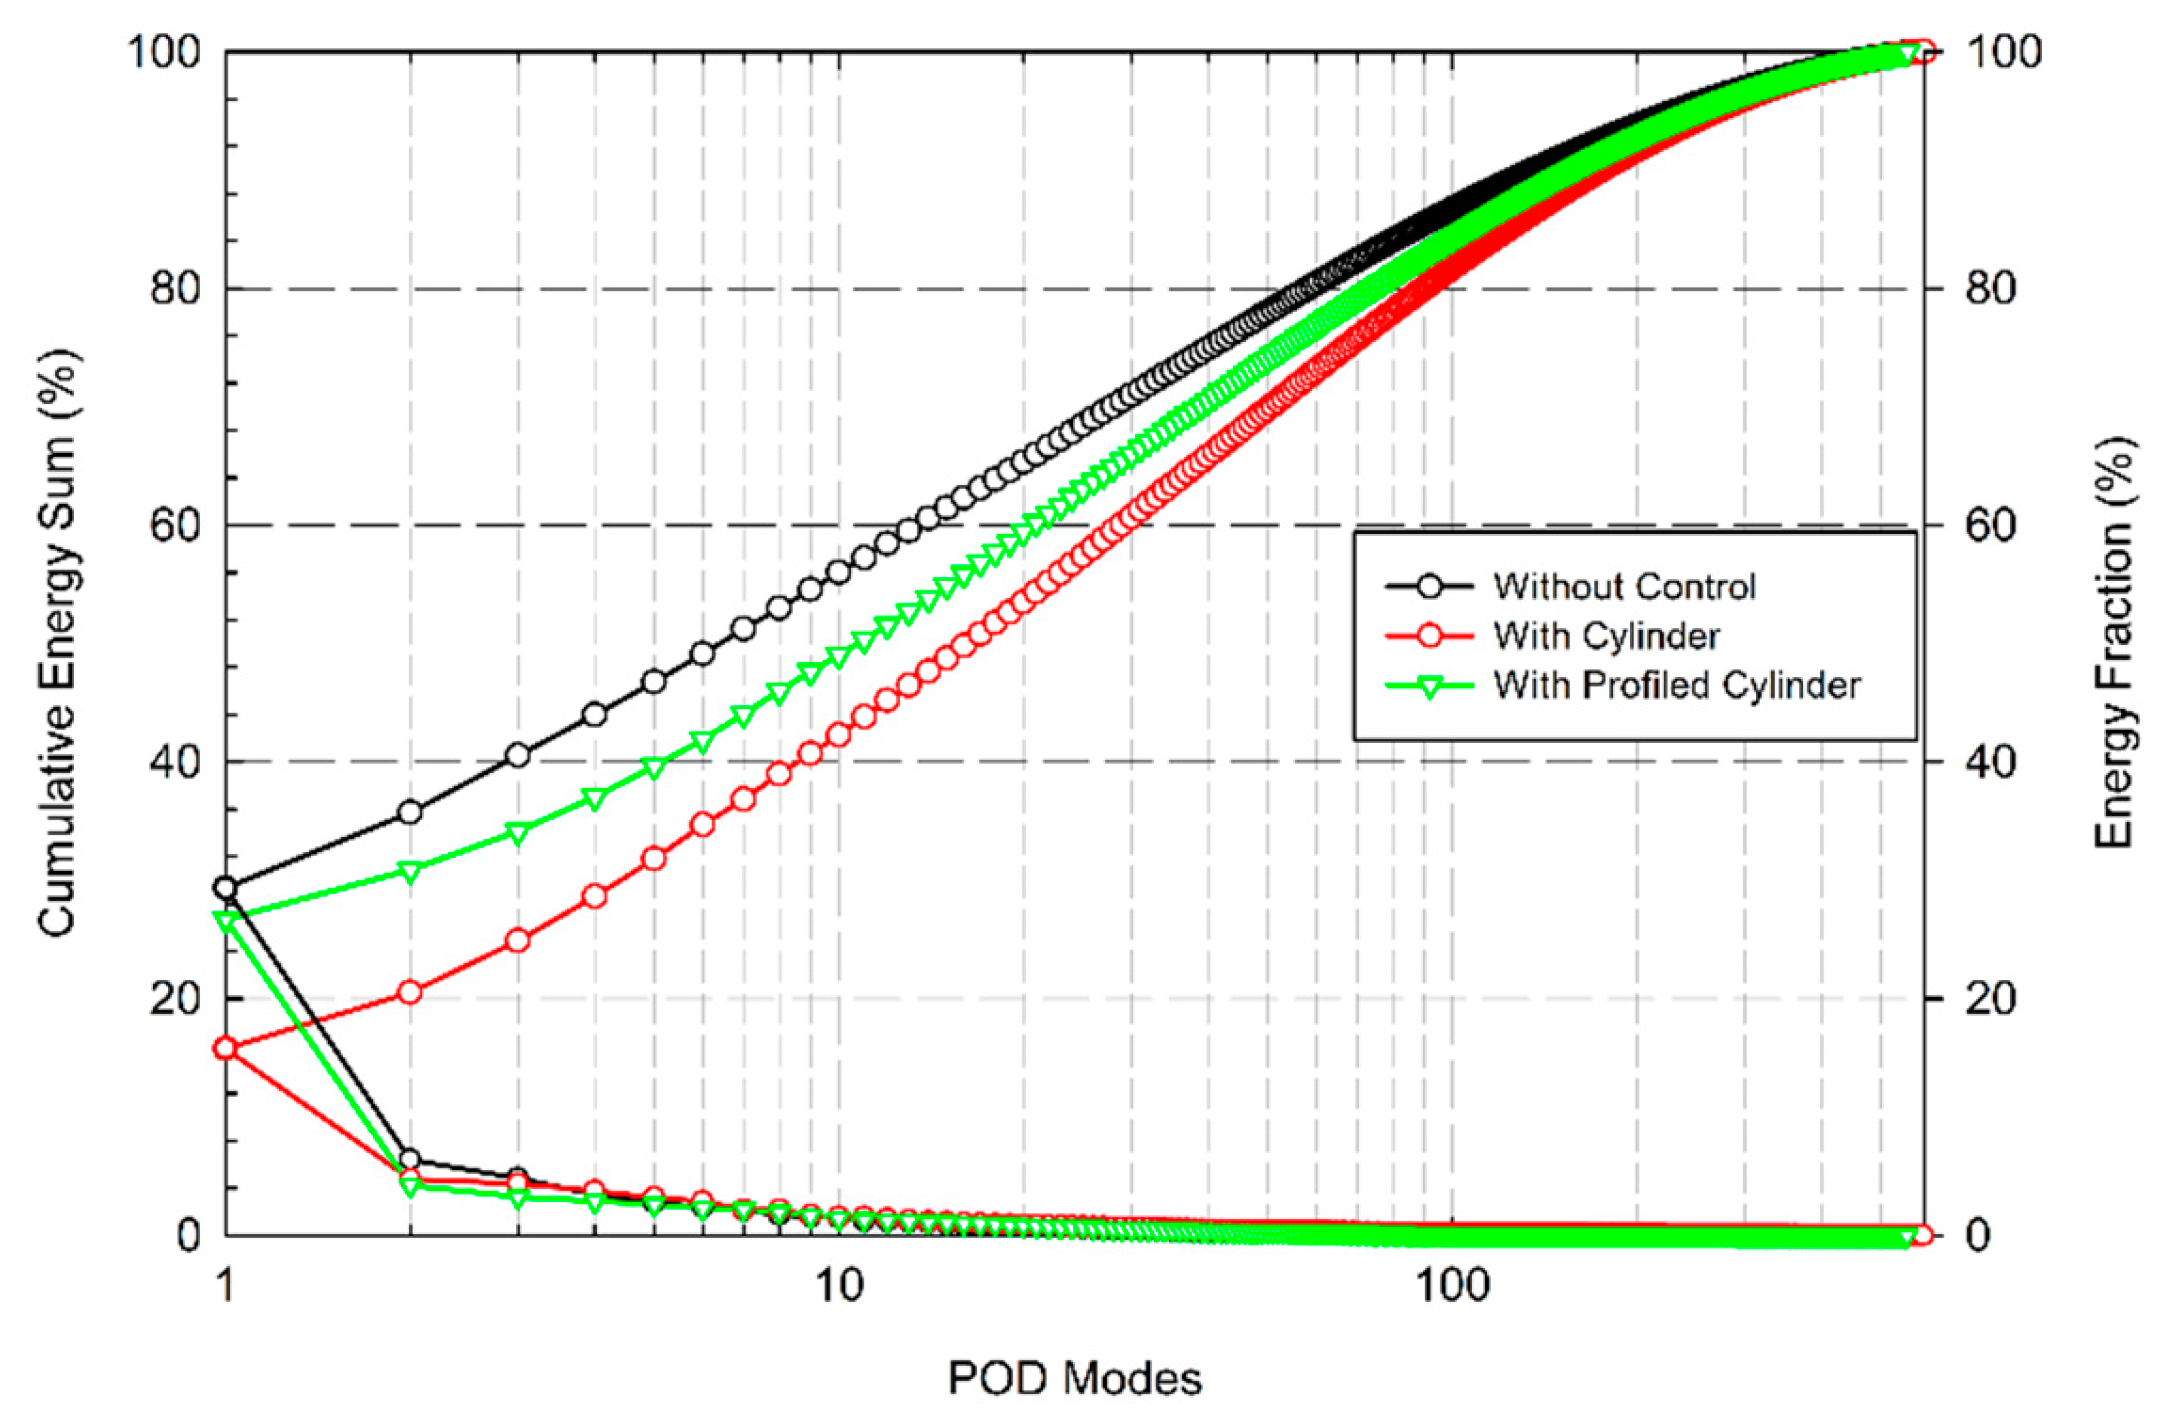
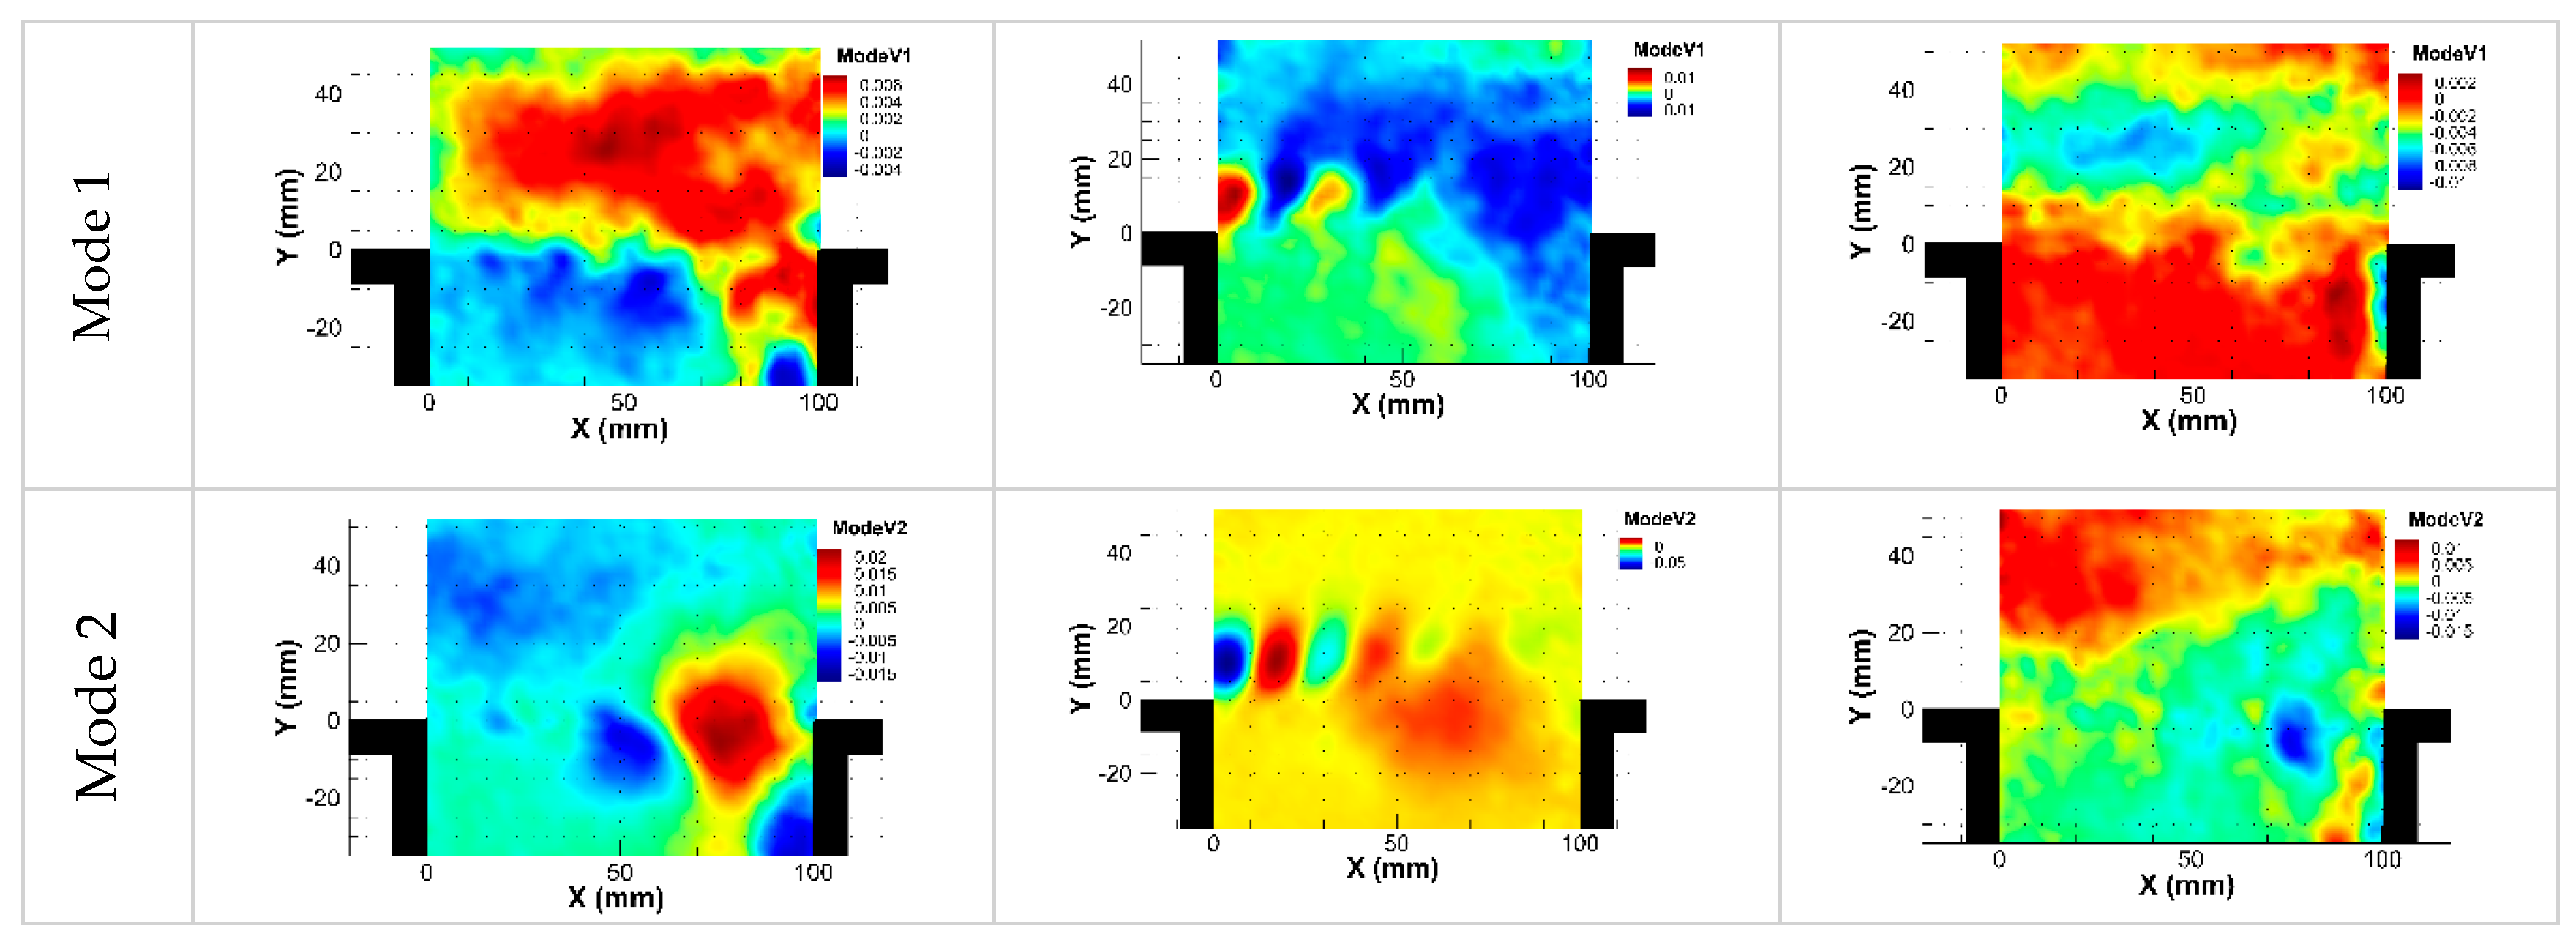
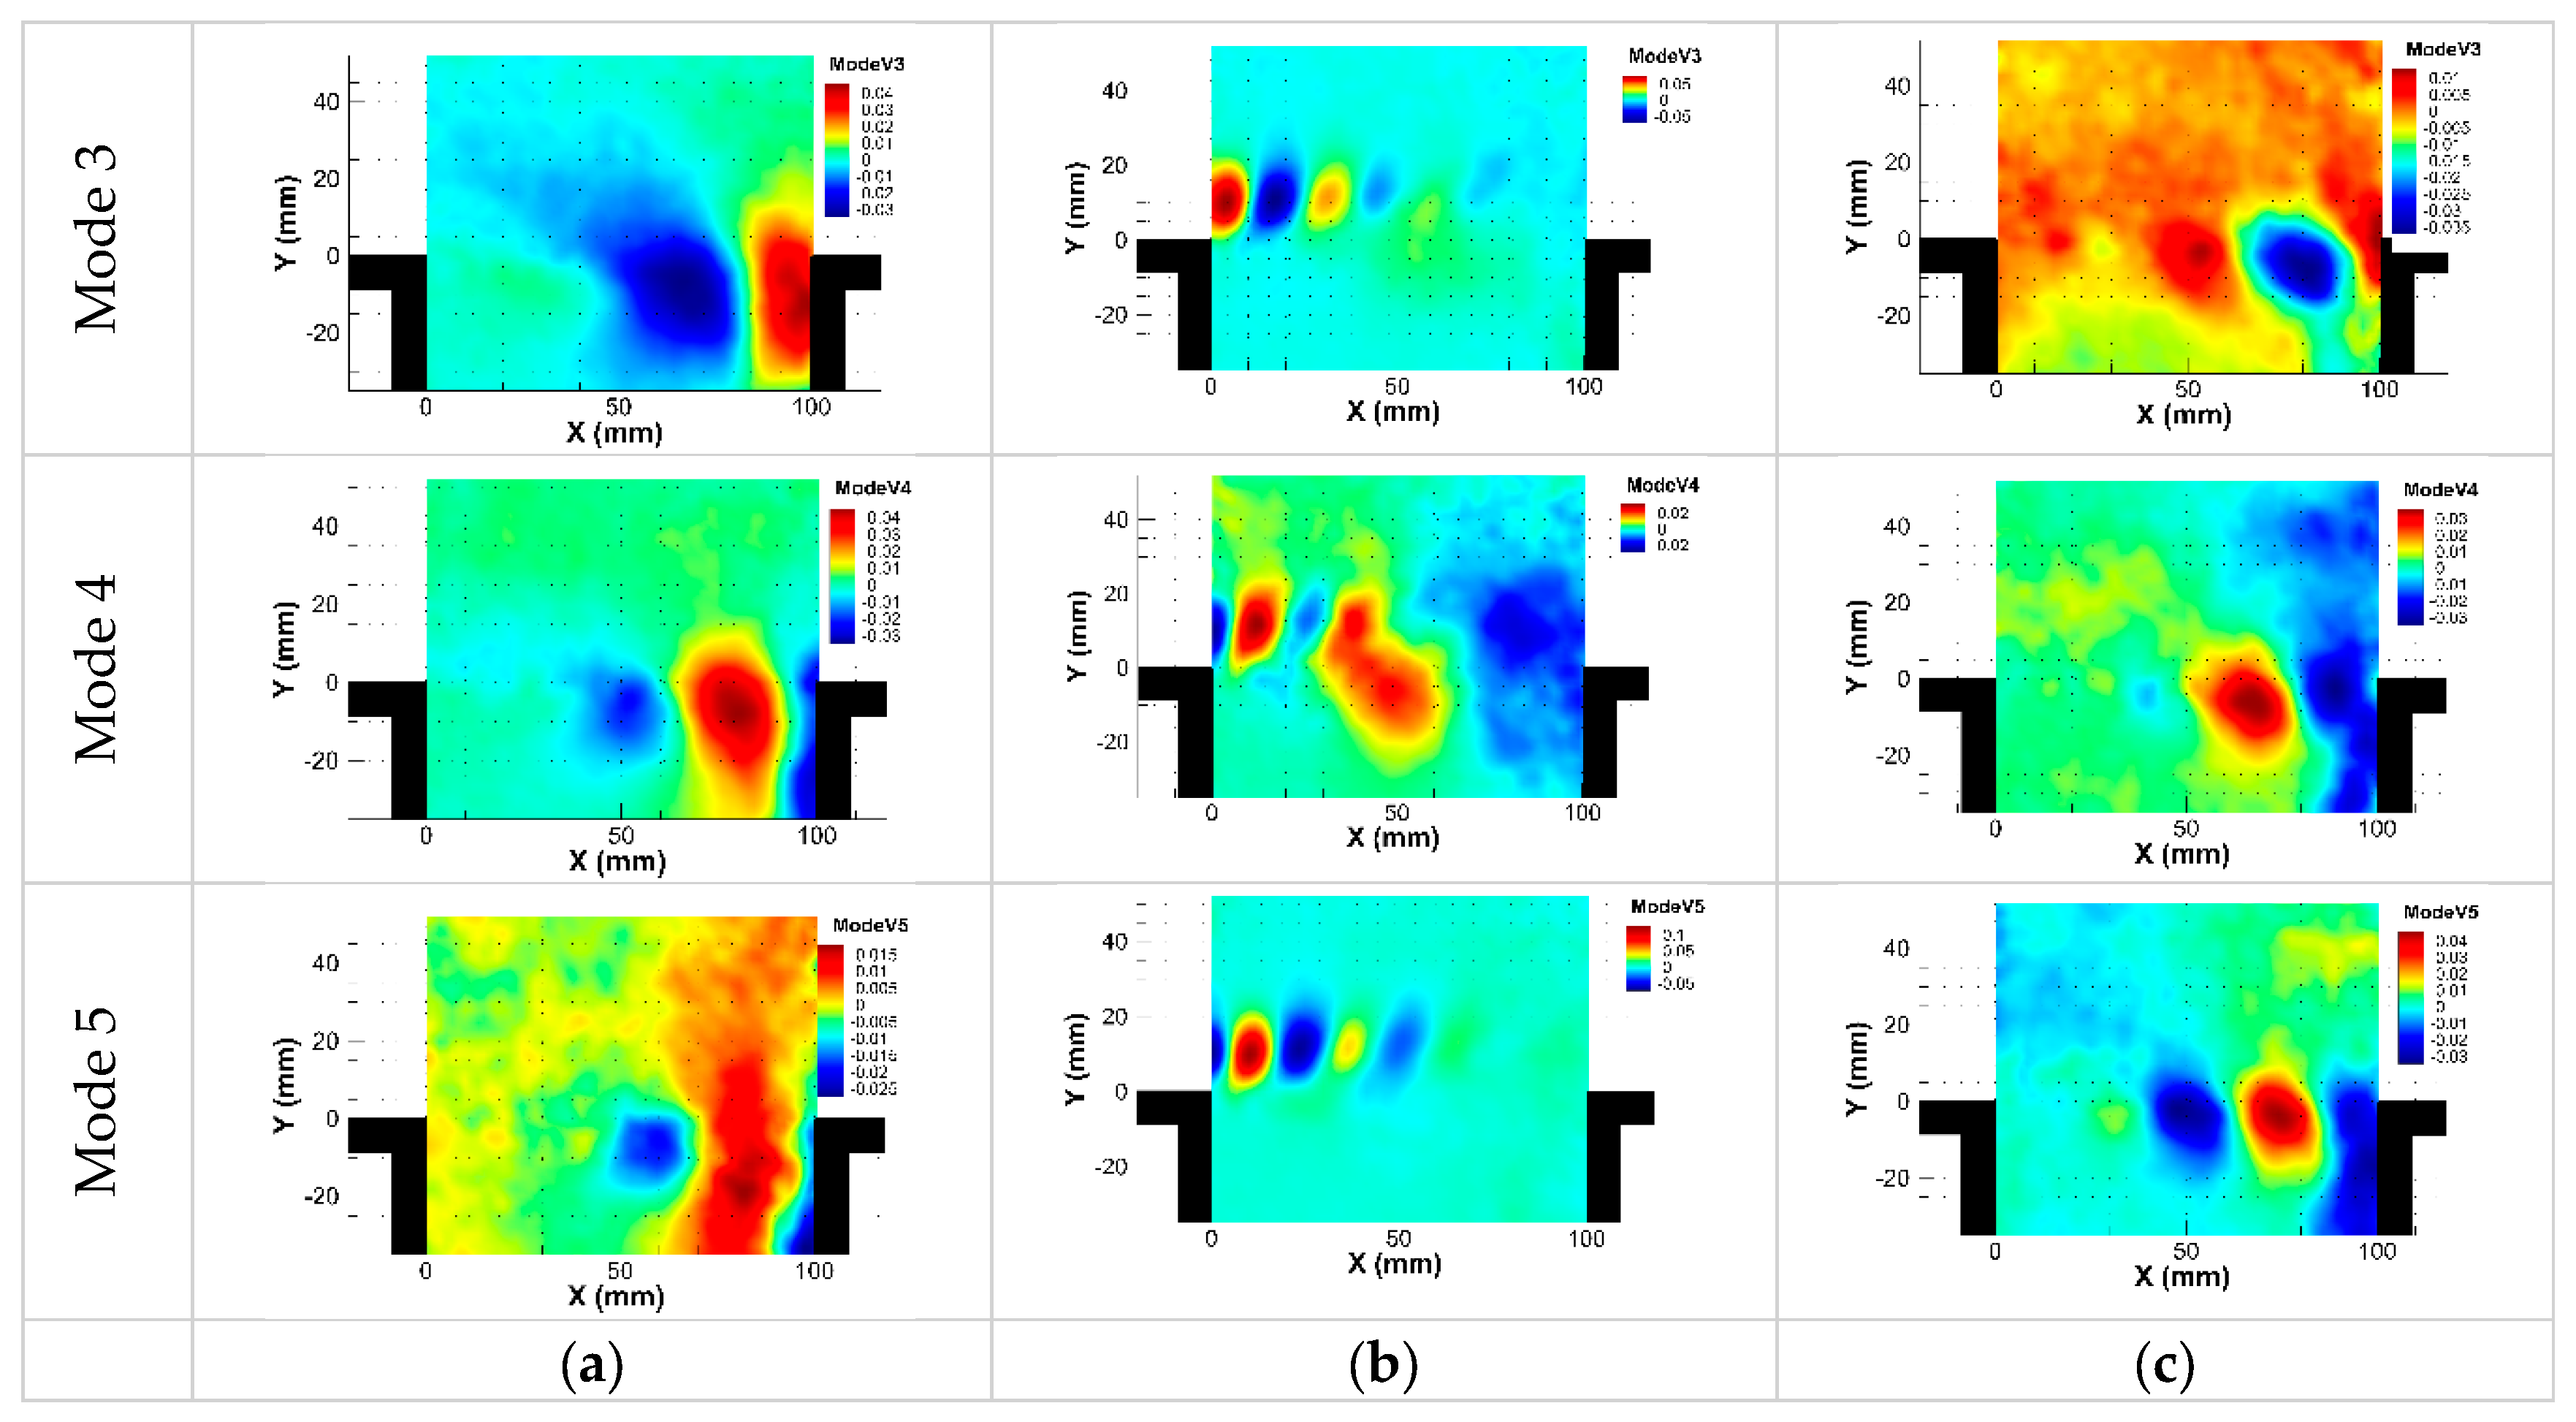
- Snapshot POD analysis indicates that in the absence of control and with control using a profiled cylinder, the first POD mode contains nearly 30% of the flow's KE, while only 15% of the KE is contained in the first POD mode when using the standard cylinder. This aligns with the decreased vorticity distribution in the shear layer of the flow controlled with the cylinder, resulting in weakened vortical structures. Consequently, the POD projection attributes less energy to the first POD modes since they are associated with these coherent structures;
- Spatial modes reveal that the higher KE content shifts towards modes where vortical structures are oriented upward near the cavity trailing edge. This may partially explain the weak and less organized pressure waves following the impingement of vortices with the controlled flow compared to the uncontrolled case;
- Many perspectives could be proposed:
- In this study, the focus was on reducing noise near deep cavities. It is worth noting that this noise reduction, achieved by adding a cylinder upstream of the cavity, may lead to an increase in drag and therefore could be detrimental to aerodynamic efficiency. Measurement of friction (estimation of drag) should be considered with the aim of optimizing both aerodynamic and aero-acoustic aspects;
- Investigating energetic transfers from the aerodynamic field towards the acoustic field with and without the control mechanisms would be of interest for a future investigation.
References
- A. Powell, On edge tones and associated phenomena, (1953). https://www.ingentaconnect.com/search/article?option2=author&value2=Powell%2c+Alan&pageSize=10&index=7 (accessed February 28, 2020).
- K. Krishnamurty, Acoustic radiation from two-dimensional rectangular cutouts in aerodynamic surfaces, 1955.
- H.H. Assoum, J. Hamdi, M.E. Hassan, K. Abed-Meraim, M.E. Kheir, T. Mrach, S.E. Asmar, A. Sakout, Turbulent kinetic energy and self-sustaining tones: Experimental study of a rectangular impinging jet using high Speed 3D tomographic Particle Image Velocimetry, Journal of Mechanical Engineering and Sciences 14 (2020) 6322–6333. [CrossRef]
- J. Hamdi, H.H. Assoum, K. Abed-Meraïm, A. Sakout, Volume reconstruction of a plane jet impinging on a slotted plate using the phase averaging technique, Energy Procedia 139 (2017) 404–409. [CrossRef]
- H.H. Assoum, M. El Hassan, K. Abed-Meraim, A. Sakout, The vortex dynamics and the self sustained tones in a plane jet impinging on a slotted plate, European Journal of Mechanics - B/Fluids 48 (2014) 231–235. [CrossRef]
- B. El Zohbi, H.H. Assoum, M. Alkheir, N. Afyouni, K.A. Meraim, A. Sakout, M. El Hassan, Experimental investigation of the Aero-Acoustics of a rectangular jet impinging a slotted plate for different flow regimes, Alexandria Engineering Journal 87 (2024) 404–416. [CrossRef]
- N.E. Afyouni, M. Alkheir, H. Assoum, B. El Zohbi, K. Abed-Meraim, A. Sakout, M. El Hassan, Effect of a Control Mechanism on the Interaction between a Rectangular Jet and a Slotted Plate: Experimental Study of the Aeroacoustic Field, Fluids 8 (2023). [CrossRef]
- H.H. Assoum, M. El Kheir, N. Eldin Afyouni, B. El Zohbi, K. Abed Meraim, A. Sakout, M. El Hassan, Control of a rectangular impinging jet: Experimental investigation of the flow dynamics and the acoustic field, Alexandria Engineering Journal 79 (2023) 354–365. [CrossRef]
- M. Alkheir, H.H. Assoum, J. Hamdi, T. Mrach, M.E. Hassan, A. Sakout, Experimental study of the vortex organization in a rectangular impinging jet in the presence of self-sustained tones, Energy Reports 8 (2022) 1486–1492.
- H.H. Assoum, J. Hamdi, M. Alkheir, K. Abed Meraim, A. Sakout, B. Obeid, M. El Hassan, Tomographic Particle Image Velocimetry and Dynamic Mode Decomposition (DMD) in a Rectangular Impinging Jet: Vortex Dynamics and Acoustic Generation, Fluids 6 (2021) 429.
- A.H. Jabado, H.H. Assoum, A. Hammoud, K.A. Meraim, A. Sakout, M. El Hassan, Review-Heat Transfer Inside Cavity Flows Trends, in: IOP Conf. Ser. Earth Environ. Sci., IOP Publishing Ltd, 2022. [CrossRef]
- A.H. Jabado, M. El Hassan, H.H. Assoum, A. Hammoud, K.A. Meraim, A. Sakout, A review of cavity heat transfer under separated/reattached flow conditions, Energy Rep. 8 (2022) 949–956. [CrossRef]
- A. Charwat, J. Roos, F. Dewey Jr, J. Hitz, An investigation of separated flows-Part I: The pressure field, Journal of the Aerospace Sciences 28 (1961) 457–470.
- J. Rossiter, The effects of cavities on the buffeting of aircraft, RAE Technical Memorandum No. Aero 754 (1962).
- L. East, Aerodynamically induced resonance in rectangular cavities, Journal of Sound and Vibration 3 (1966) 277–287.
- H. Plumblee, J. Gibson, L. Lassiter, A theoretical and experimental investigation of the acoustic response of cavities in an aerodynamic flow, Flight Dynamics Laboratory, Aeronautical Systems Division, Air Force Systems …, 1962.
- H.H. Heller, D. Holmes, E.E. Covert, Flow-induced pressure oscillations in shallow cavities, Journal of Sound and Vibration 18 (1971) 545–553.
- D. Rockwell, E. Naudascher, Review—Self-Sustaining Oscillations of Flow Past Cavities, J. Fluids Eng 100 (1978) 152–165. [CrossRef]
- M. El Hassan, L. Labraga, L. Keirsbulck, Aero-acoustic oscillations inside large deep cavities, (2007).
- M. El Hassan, L. Keirsbulck, L. Labraga, Non-oscillating/oscillating shear layer over a large deep cavity at low-subsonic speeds, Flow, Turbulence and Combustion 82 (2009) 359–374.
- M. El Hassan, L. Keirsbulck, L. Labraga, Aero-acoustic coupling inside large deep cavities at low-subsonic speeds, Journal of Fluids Engineering 131 (2009).
- J. Sinha, K. Arora, Review of the flow-field analysis over cavities, in: IEEE, 2017: pp. 870–876.
- V. Sarohia, Experimental investigation of oscillations in flows over shallow cavities, Aiaa Journal 15 (1977) 984–991.
- J. Rossiter, Wind-tunnel experiments on the flow over rectangular cavities at subsonic and transonic speeds, (1964).
- S. Lawson, G. Barakos, Review of numerical simulations for high-speed, turbulent cavity flows, Progress in Aerospace Sciences 47 (2011) 186–216.
- N. Vikramaditya, J. Kurian, Pressure oscillations from cavities with ramp, AIAA Journal 47 (2009) 2974–2984.
- J.C. Kok, B.I. Soemarwoto, H. van der Ven, X-LES simulations using a high-order finite-volume scheme, Notes on Numerical Fluid Mechanics and Multidisciplinary Design 97 (2008) 87.
- M. El Hassan, L. Keirsbulck, Passive control of deep cavity shear layer flow at subsonic speed, Canadian Journal of Physics 95 (2017) 894–899.
- M. El Hassan, L. Keirsbulck, L. Labraga, M. Lippert, Control of deep cavity tones using a spanwise cylinder at low-subsonic speeds, HEFAT 2008 (2008).
- L.N. Cattafesta III, Q. Song, D.R. Williams, C.W. Rowley, F.S. Alvi, Active control of flow-induced cavity oscillations, Progress in Aerospace Sciences 44 (2008) 479–502.
- M. Stanek, J. Ross, J. Odedra, J. Peto, High Frequency Acoustic Suppression - The Mystery of the Rod-in-Crossflow Revealed, in: 41st Aerospace Sciences Meeting and Exhibit, American Institute of Aeronautics and Astronautics, 2003. [CrossRef]
- M. Stanek, G. Raman, V. Kibens, J. Ross, J. Odedra, J. Peto, Control of cavity resonance through very high frequency forcing, in: 6th Aeroacoustics Conference and Exhibit, American Institute of Aeronautics and Astronautics, 2000. [CrossRef]
- M. Stanek, G. Raman, J. Ross, J. Odedra, J. Peto, F. Alvi, V. Kibens, High Frequency Acoustic Suppression - The Role of Mass Flow & The Notion of Superposition, in: 8th AIAA/CEAS Aeroacoustics Conference & Exhibit, American Institute of Aeronautics and Astronautics, n.d. [CrossRef]
- L. Shaw, R. Clark, D. Talmadge, F-111 generic weapons bay acoustic environment, Journal of Aircraft 25 (1988) 147–153. [CrossRef]
- J.L. Lumley, The structure of inhomogeneous turbulent flows, Atmospheric Turbulence and Radio Wave Propagation (1967) 166–178.
- J. Weiss, A tutorial on the proper orthogonal decomposition, in: 2019: p. 3333.
- G. Berkooz, P. Holmes, J.L. Lumley, The proper orthogonal decomposition in the analysis of turbulent flows, Annual Review of Fluid Mechanics 25 (1993) 539–575.
- Â.M. Ribau, N.D. Gonçalves, L.L. Ferrás, A.M. Afonso, Flow Structures Identification through Proper Orthogonal Decomposition: The Flow around Two Distinct Cylinders, Fluids 6 (2021) 384.
- J. Delville, Characterization of the organization in shear layers via the Proper Orthogonal Decomposition, Appl. Sci. Res. 53 (1994) 263–281. [CrossRef]
- J. Hamdi, H. Assoum, K. Abed-Meraïm, A. Sakout, Volume reconstruction of an impinging jet obtained from stereoscopic-PIV data using POD, European Journal of Mechanics-B/Fluids 67 (2018) 433–445.
- B. Podvin, Y. Fraigneau, F. Lusseyran, P. Gougat, A Reconstruction Method for the Flow Past an Open Cavity, J. Fluids Eng 128 (2005) 531–540. [CrossRef]
- Colonius, R. Murray, POD based models of self-sustained oscillations in the flow past an open cavity, in: 2000: p. 1969.
- S. Lawson, G. Barakos, A. Simpson, Understanding cavity flows using proper orthogonal decomposition and signal processing, Journal of Algorithms & Computational Technology 4 (2010) 47–69.
- M. El Hassan, L. Keirsbulck, Passive control of deep cavity shear layer flow at subsonic speed, Can. J. Phys. 95 (2017) 894–899. [CrossRef]


Disclaimer/Publisher’s Note: The statements, opinions and data contained in all publications are solely those of the individual author(s) and contributor(s) and not of MDPI and/or the editor(s). MDPI and/or the editor(s) disclaim responsibility for any injury to people or property resulting from any ideas, methods, instructions or products referred to in the content. |
© 2024 by the authors. Licensee MDPI, Basel, Switzerland. This article is an open access article distributed under the terms and conditions of the Creative Commons Attribution (CC BY) license (http://creativecommons.org/licenses/by/4.0/).


