1. Introduction
Nowadays, transportation and vehicle engineering play an increasingly important role in everyday life and are subject to continuous development. The vehicles use a variety of sensors and sensor networks to gather information. Szűcs and Hézer provided an overview of their current development trends and challenges and necessary improvements in technologies [
1].
Cognitive Mobility studies are, in fact, the interconnection of the following research areas: transportation, vehicle engineering, artificial intelligence, information technology and social sciences [
2,
3]. Vehicle-to-Everything (V2X) technology, which implements communication between infrastructure and sensor networks of vehicles, is one of the key areas of cognitive mobility research.
The Vehicular Ad-hoc NETworks (VANET) were used for Cognitive Mobility. They are a subcategory of Mobile Ad-hoc NETworks (MANET) and use wireless communication between vehicles as well as Road Side Units (RSUs) [
4,
5].
The maintenance management and vehicle engineers must meet strong technical reliability and economy requirements.
On the one hand, the maintenance cost can be the second largest component of company budget [
6]. From a financial viewpoint, therefore, it is paramount to determine the optimal number of spare parts.
On the other hand, the developers must determine which components are expediently technically modified to increase the reliability of the entire system. Analyzing the correlations between reliabilities of the system and its elements is helpful in the selection of the elements that have the greatest impact on system reliability.
There is considerable literature on maintenance and reliability theory with a great number of publications. For example, referring to the reliability of a technical object in a broad sense, the authors of paper [
7] defined it as the ability of equipment to be trouble-free, in operation, during the life cycle, in the execution of the set task. The subject of paper [
8] was an analysis of the maintenance of the railway vehicles used in rail passenger transport. The analysis used data on the failure rates of vehicles and it was conducted using reliability parameter indicators.
Reliability is the probability that equipment will meet the intended standards of performance and deliver the desired results within a specified period of time under specified (environmental) conditions [
9].
The objective of Payette and Abdul-Nour’s work was to review the concepts of reliability engineering and to highlight the importance of an integrated approach in the analyzing of complex systems [
10].
From a reliability point of view, there are two types of systems. Simple systems are the systems with simple interconnections (SwSI) that can be divided into a sequence of parallel and/or series subsystems [
11]. The systems that cannot be divided into identical sequences named System with Complex Interconnection (SwCI). The reliability of these systems cannot be determined by Fault Tree Analysis (FTA) and Reliability Block Diagram (RBD) methods. Myers investigated the reliability of digital fly-by-wire aircraft control as SwCI [
12]. According to Iordache, complex systems are composed of subsystems that have nonlinear interactions, resulting in multiple levels of organization [
13]. The applicable approach to correctly computing availability of the SwCI is the Bayesian True Table Method (BTTM). The Bayesian True Table is the sum of the probabilities of all possible states of the investigated system [
14].
The Monte Carlo method is an effective mathematical tool for solving deterministic problems with a series of random events. It was Metropolis and Ulam who first named this as Monte Carlo Simulation (MCS) [
15]. Pokorádi applied MCS to the investigation of uncertainties of maintenance processes [
16] and to the determination of accessibilities of temporal systems [
17].
This paper proposes a methodology of MCS-based investigation of uncertainty of SwCI reliability. The results of simulation can be used to following tasks:
to determine the required number of spare parts (RNSP) in the case of equipment with complex interconnection such as vehicle sensors (see Chapters 3.2 and 4.1);
to choose the most critical elements of SwCIs (such as V2X, VANET and vehicle sensors and sensor networks) from a system reliability point of view (see Chapters 3.3 and 4.2).
It is important to mention that non-realistic reliability data are used to describe the method so that the results can be clearly illustrated.
The paper is organized as follows:
Section 2 presents the core reliability model of MCS.
Section 3 lays out the methodology of the structural analysis.
Section 4 discusses functional analysis.
Section 5 offers conclusions deduced from the results of simulations. Finally, the author summarizes the main findings of this research and outlines some future research directions.
2. Core Model – Reliability of the System with Complex Interconnections
For the MCS the first step is to create the so-called core model.
The system and all its elements can have two states. In the case of the operating state (designated by “
+” in
Table 1), the system or an item can perform its required function. If the system or an item is in non-operating state (designated by “
–“ in BTT), it cannot perform its required function.
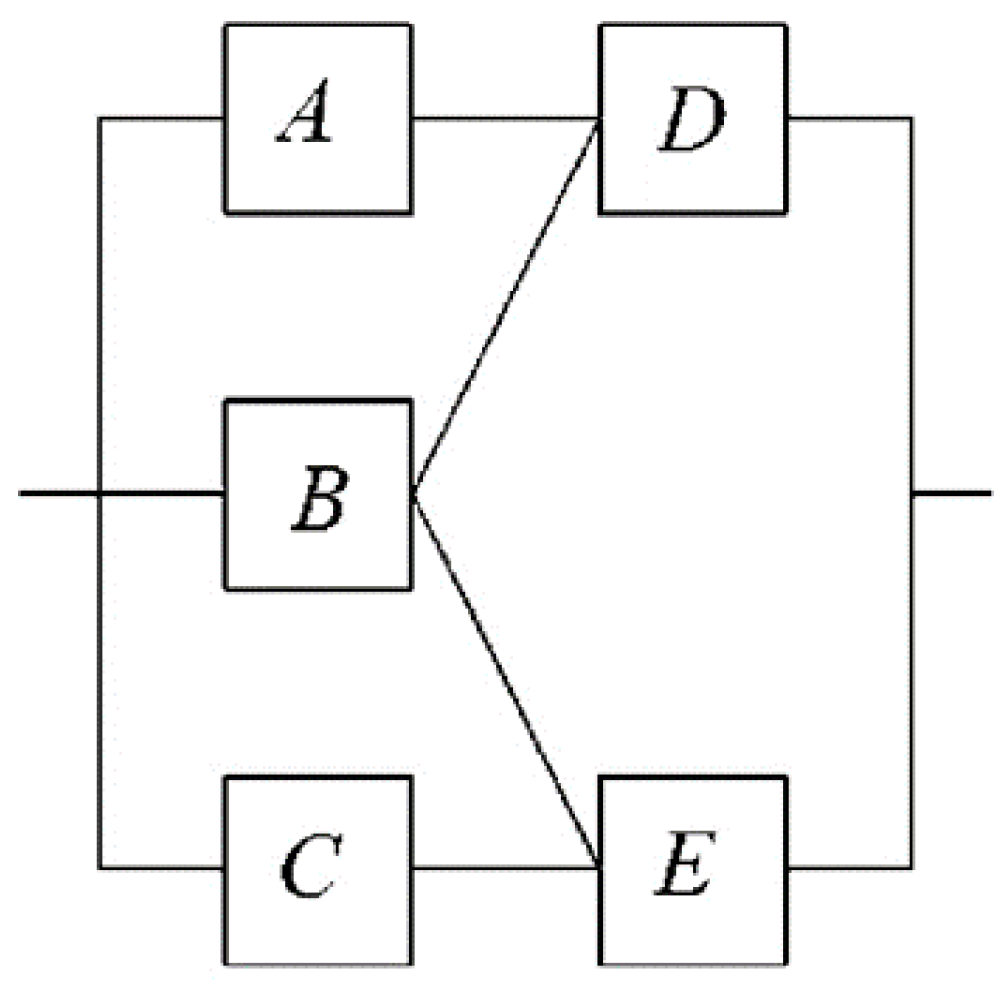
Table 1 shows BTT of the investigated SwCI (see
Figure 1) where
Qj denotes the probabilities of
jth system state.
From the “end-user” point of view, availability of equipment can be characterized by Time to Failure (TTF) that accumulated operating time from the first use, or from restoration, until failure. Generally, maintenance experts can easily register the performance indicators (e.g., working hours) between two consecutive failures. The mean value of TTFs is the Mean Time to Failure (MTTF). The failure rate
λi is numerically equal to the reciprocal of MTTF, i.e.:
Since the failure rate
λi of the
ith element is known, its reliability (the probability that the element can accomplish its task) can be determined by the equation
where t is the performance indicator interval of element. (During simulations, the performance indicator interval will be 8760 working hours, which is 1 year.) The connection between reliability and probability of failure is given below:
For the investigation of sensitivity and uncertainty of SwCIs reliability, the MTBF of elements will be used.
In
Table 1 there are 19 operable and 13 non-operable system states. Pokorádi confirmed that out of the two situations described above, the one which has the lower number of possible system states must be chosen to investigate system reliability [
14]. This statement will be important during the MCS of system reliabilities.
Applying
Table 1 and equation (3) as well as the experience of Pokorádi [
14], the system reliability can be determined by the following equation:
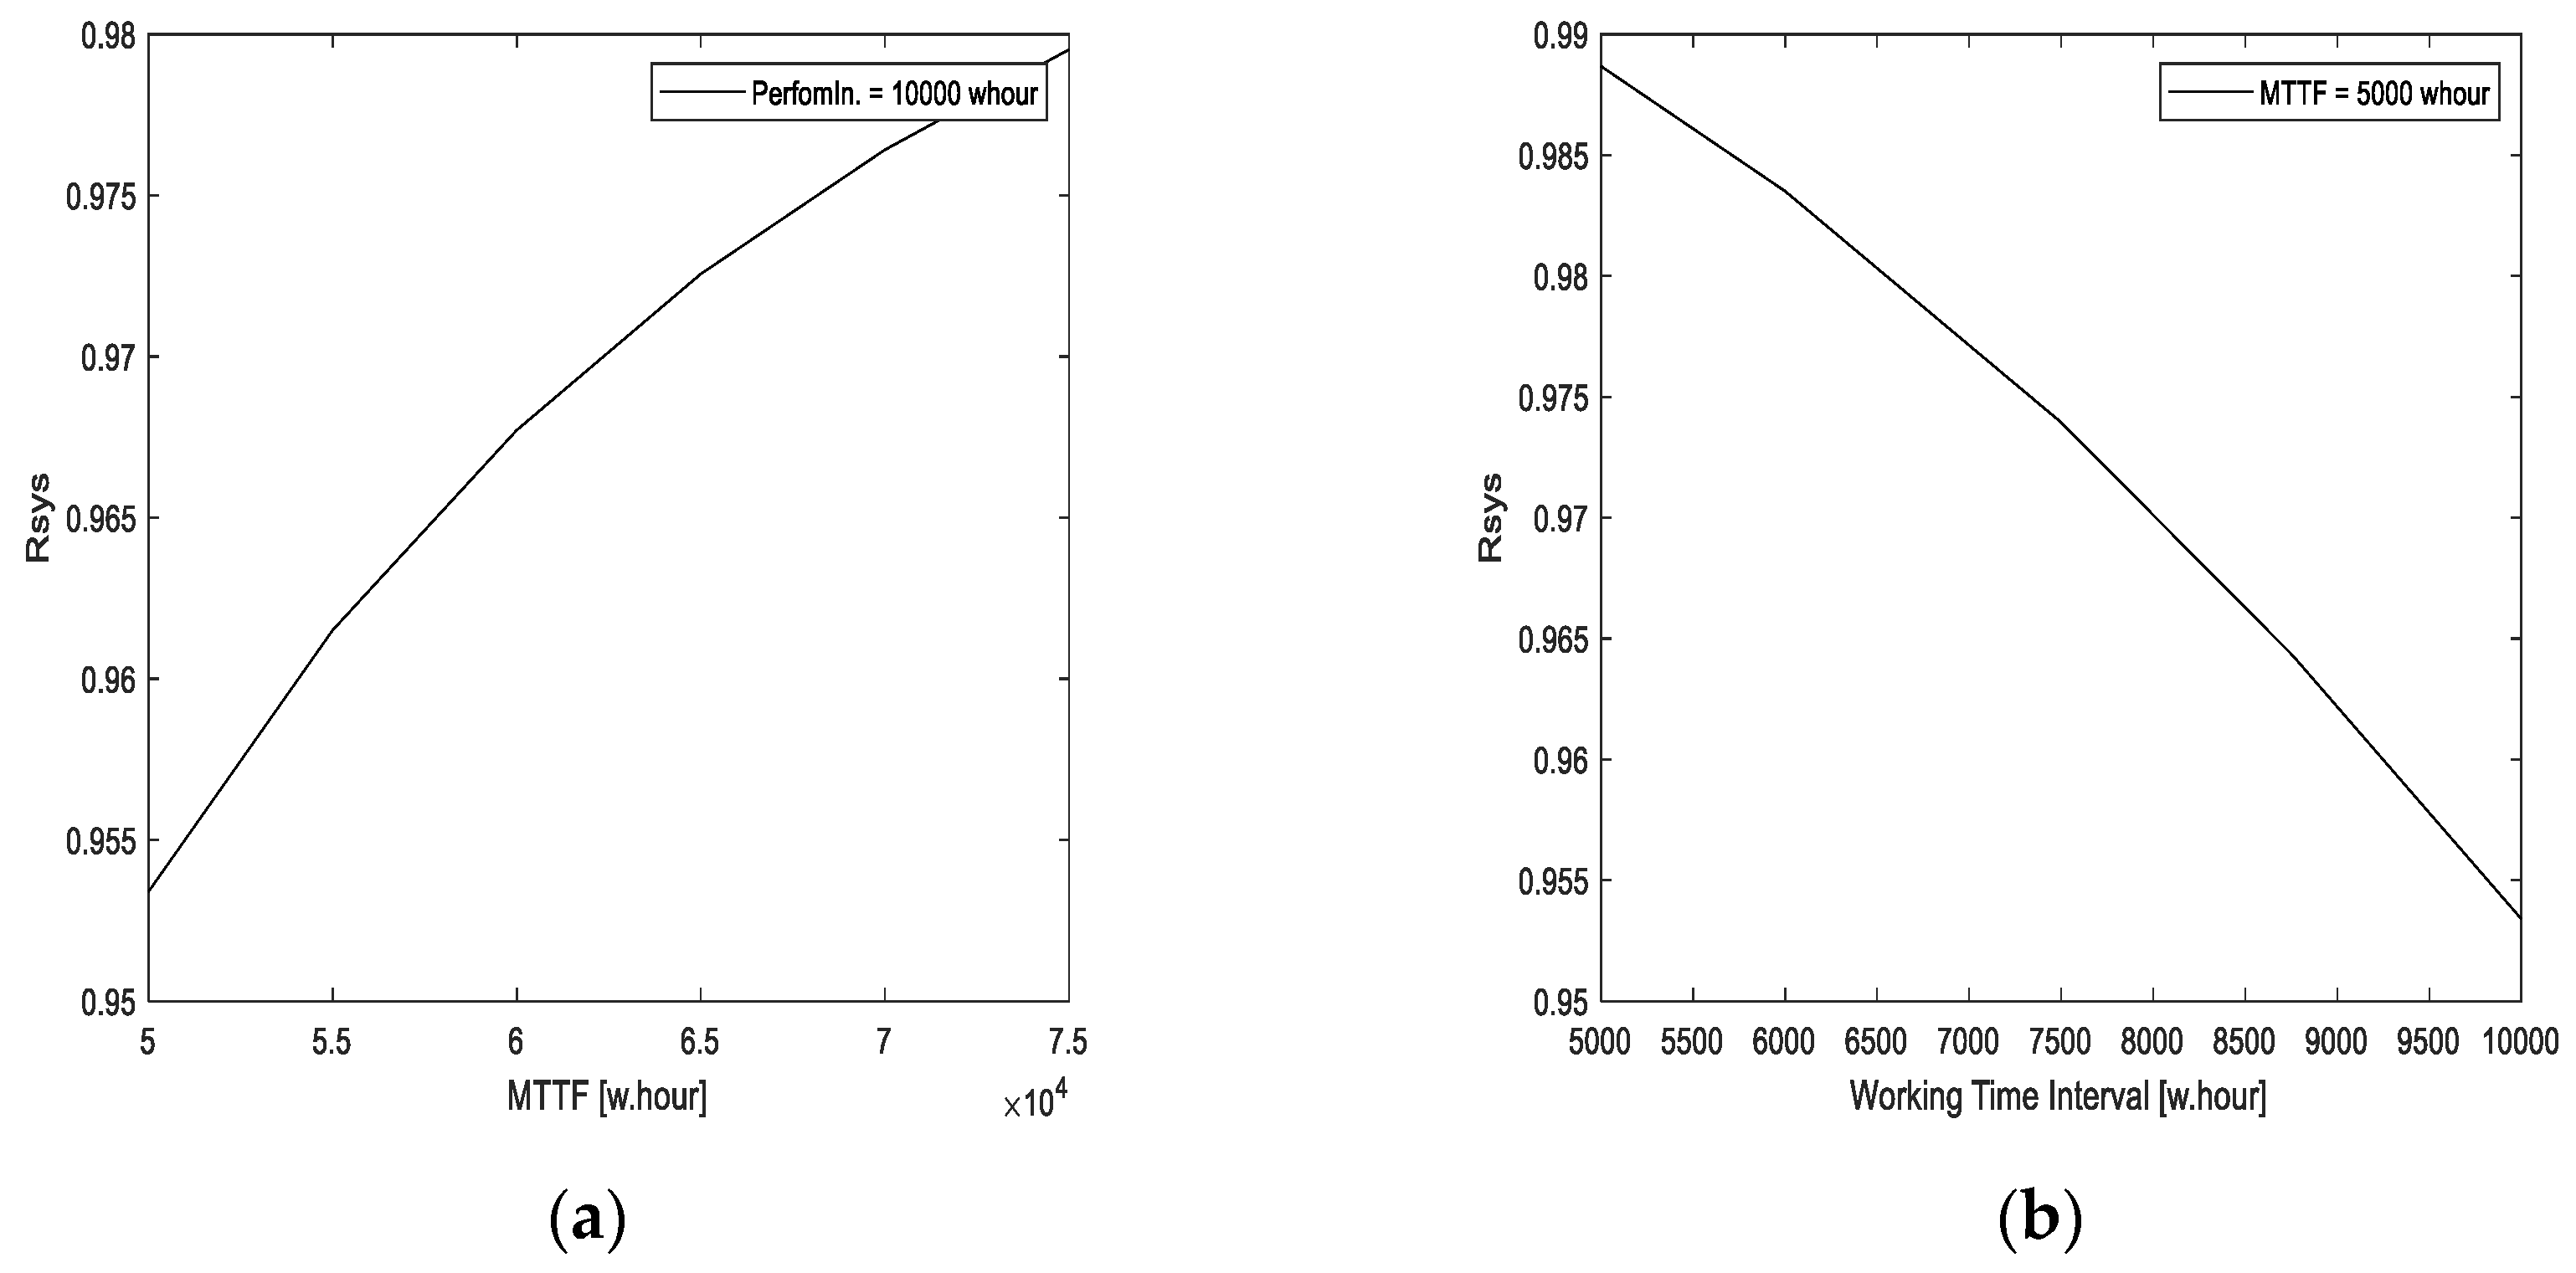
Figure 2 shows that the system reliabilities
Rsys depend on different MTTFs of components and performance indicator interval.
3. Structural Analysis
The “structural sensitivity” of a technical system reliability refers to the effect of reliability of given system element from structural point of view [
17]. The value of its coefficient is determined only by localization in the system structure – not reliability value – of the given component.
During the MCS, the concept of “momentary TTF”, and “momentary failure rate” must be introduced. Following the direction laid out in equations (1) and (2) the momentary failure rate and reliability of element can be calculated.
For the MCS-based determination of structural sensitivity of SwCI - assuming a normal probability distribution reliability – the core model was used with the following nominal input (mean value and standard deviation of components TTF) data:
The tasks are
to determine RNSP for 1 year (8760 working hours) of 50 000 equipment if the allowable probability of shortage of spare parts is 0.5 %;
to identify which element should be modified technically to increase system reliability
In accordance with common engineering practice, normal distributions of failure rates were assumed.
3.1. Simulation
The first task of MCS is to determine the optimal number of excitations. In the case of a small number of excitations, the elapsed time of the simulation is short, but the obtained results cannot have sufficient accuracy. In the case of a higher than optimal number of excitations, the obtained simulation results are accurate, but the elapsed time can be unreasonably long. In this study the number of excitations (random sample size) was determined as 1 000 000.
Table 2 summarizes the mean values and standard deviations of the excitations, as well as their relative differences from the nominal ones, as seen below:
The normally distributed probabilistic uncertainty of system reliability can be determined by statistical analysis of the MCS result:
3.2. Determination of the Requested Number of Spare Parts
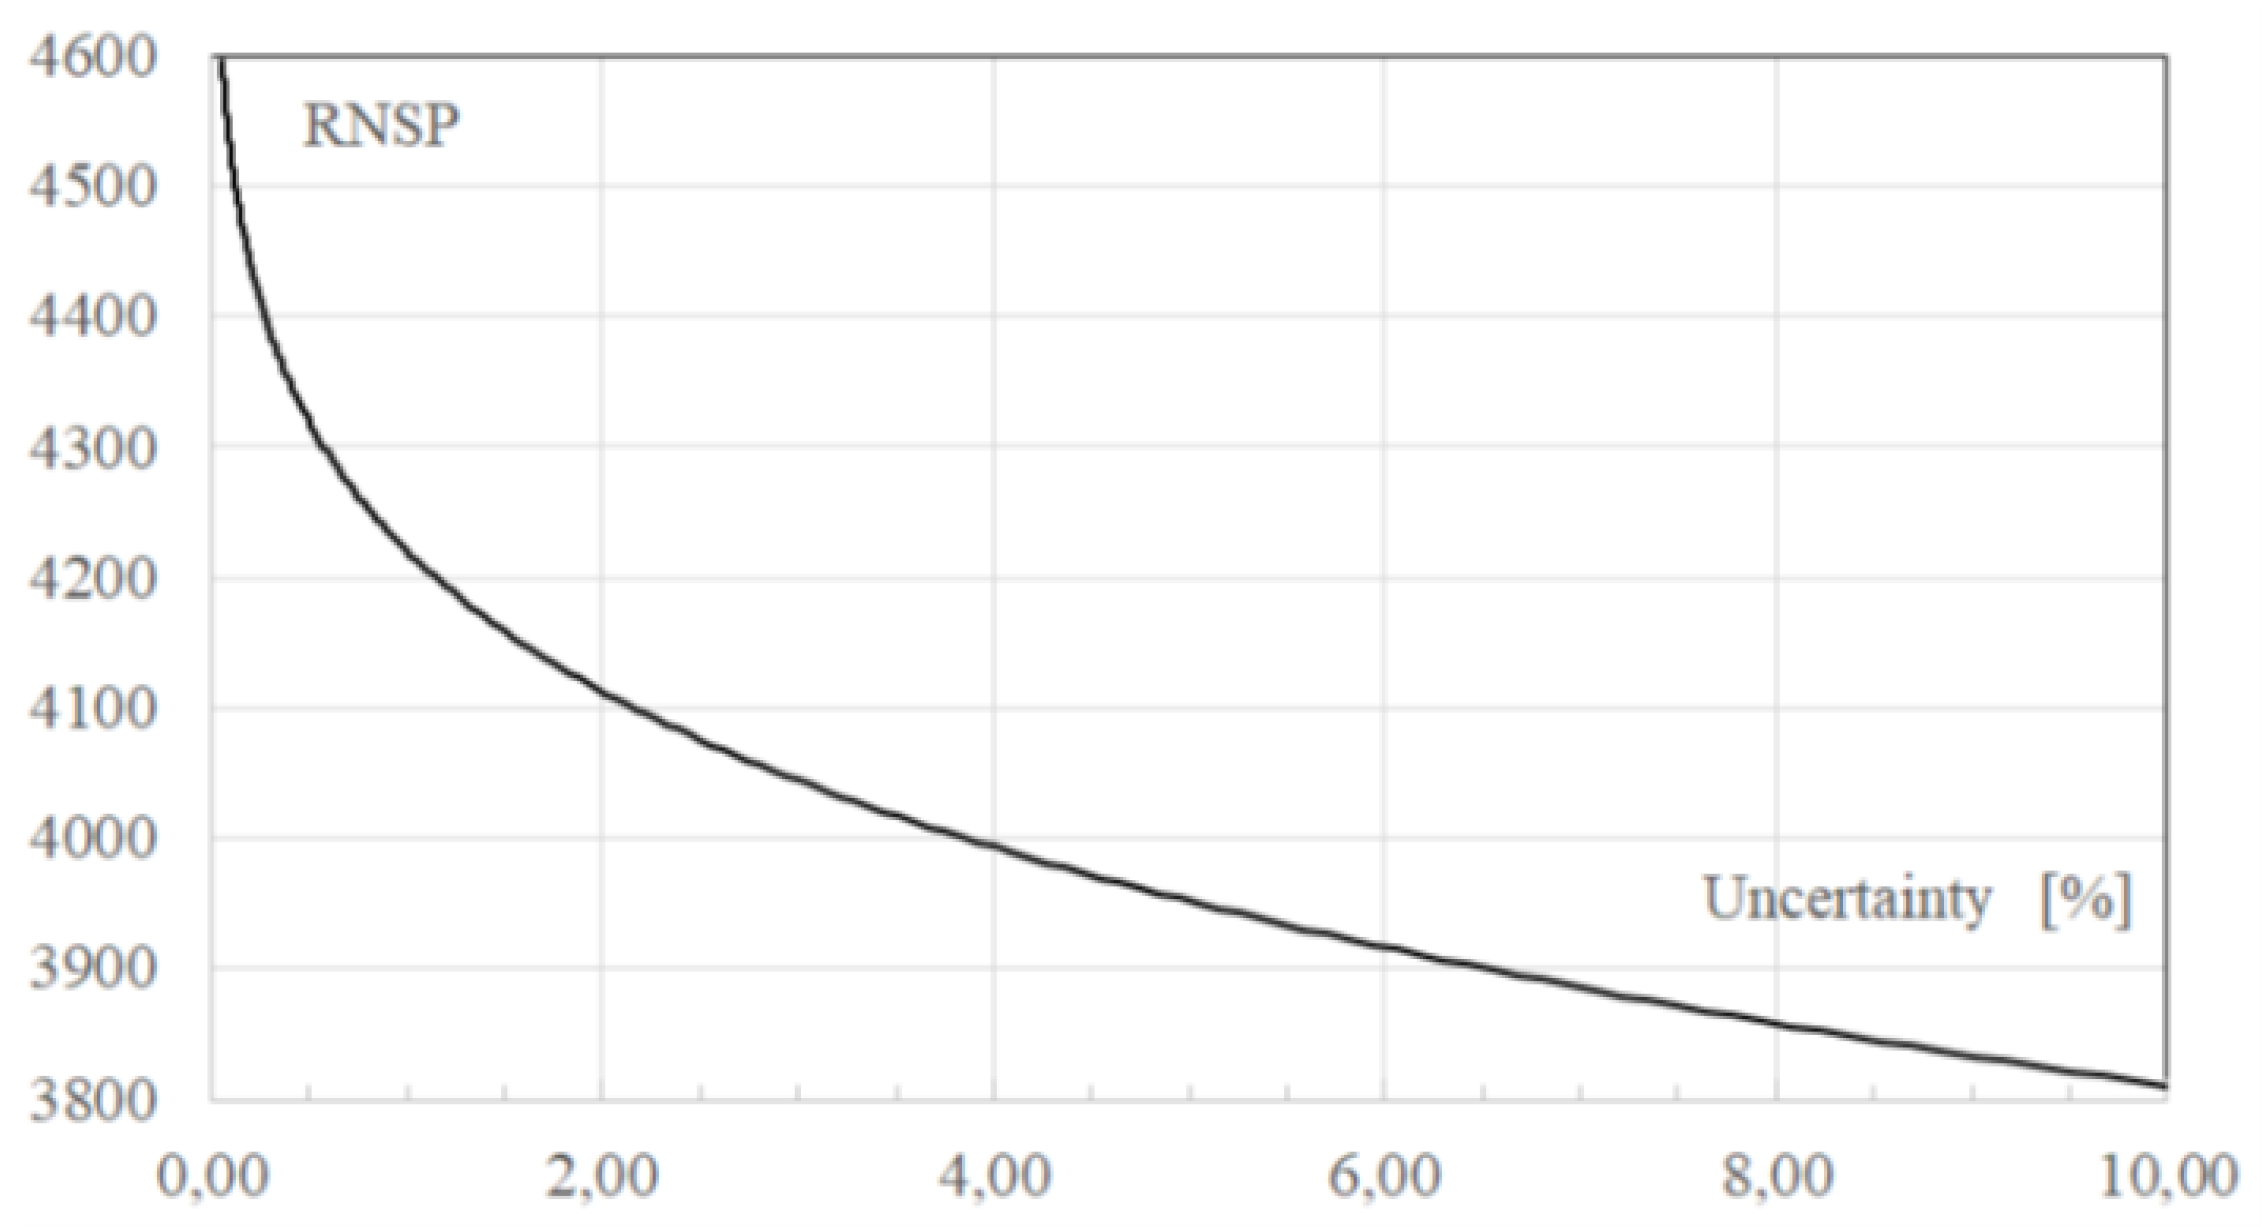
One of the key tasks of maintenance management is to determine the Required Number of Spare Parts (RNSP). If one has a low number of spare parts, it may not be possible to replace or repair faulty equipment because there are not enough spare parts. However, more than the optimal number of spare parts can lead to unnecessary maintenance costs and storage requirements. System reliability can be determined with uncertainty depicted by probability function determined above. To determine RNSP, the allowed probability of shortage must be known – depending on technical, economic and safety aspects.
For technological reasons, the end users of the investigated SwCI can only replace the system in one go. However, during their repair, it is possible to identify which elements have failed and caused the equipment to stop working. So, to determine the RNSP, the uncertainties of the full system reliability must be investigated.
Knowing the density function
f(Rsys) of system reliability, the RNSP can be determined. First, the so-called probability of RNSP
RRNSP must be determined using the mathematical relation
where
PAS is allowable probability of shortage.
Knowing
RRNSP, the following is a rounded number to upper integer:
where
N – the number of equipment in the system (in the present case:
N = 50 000).
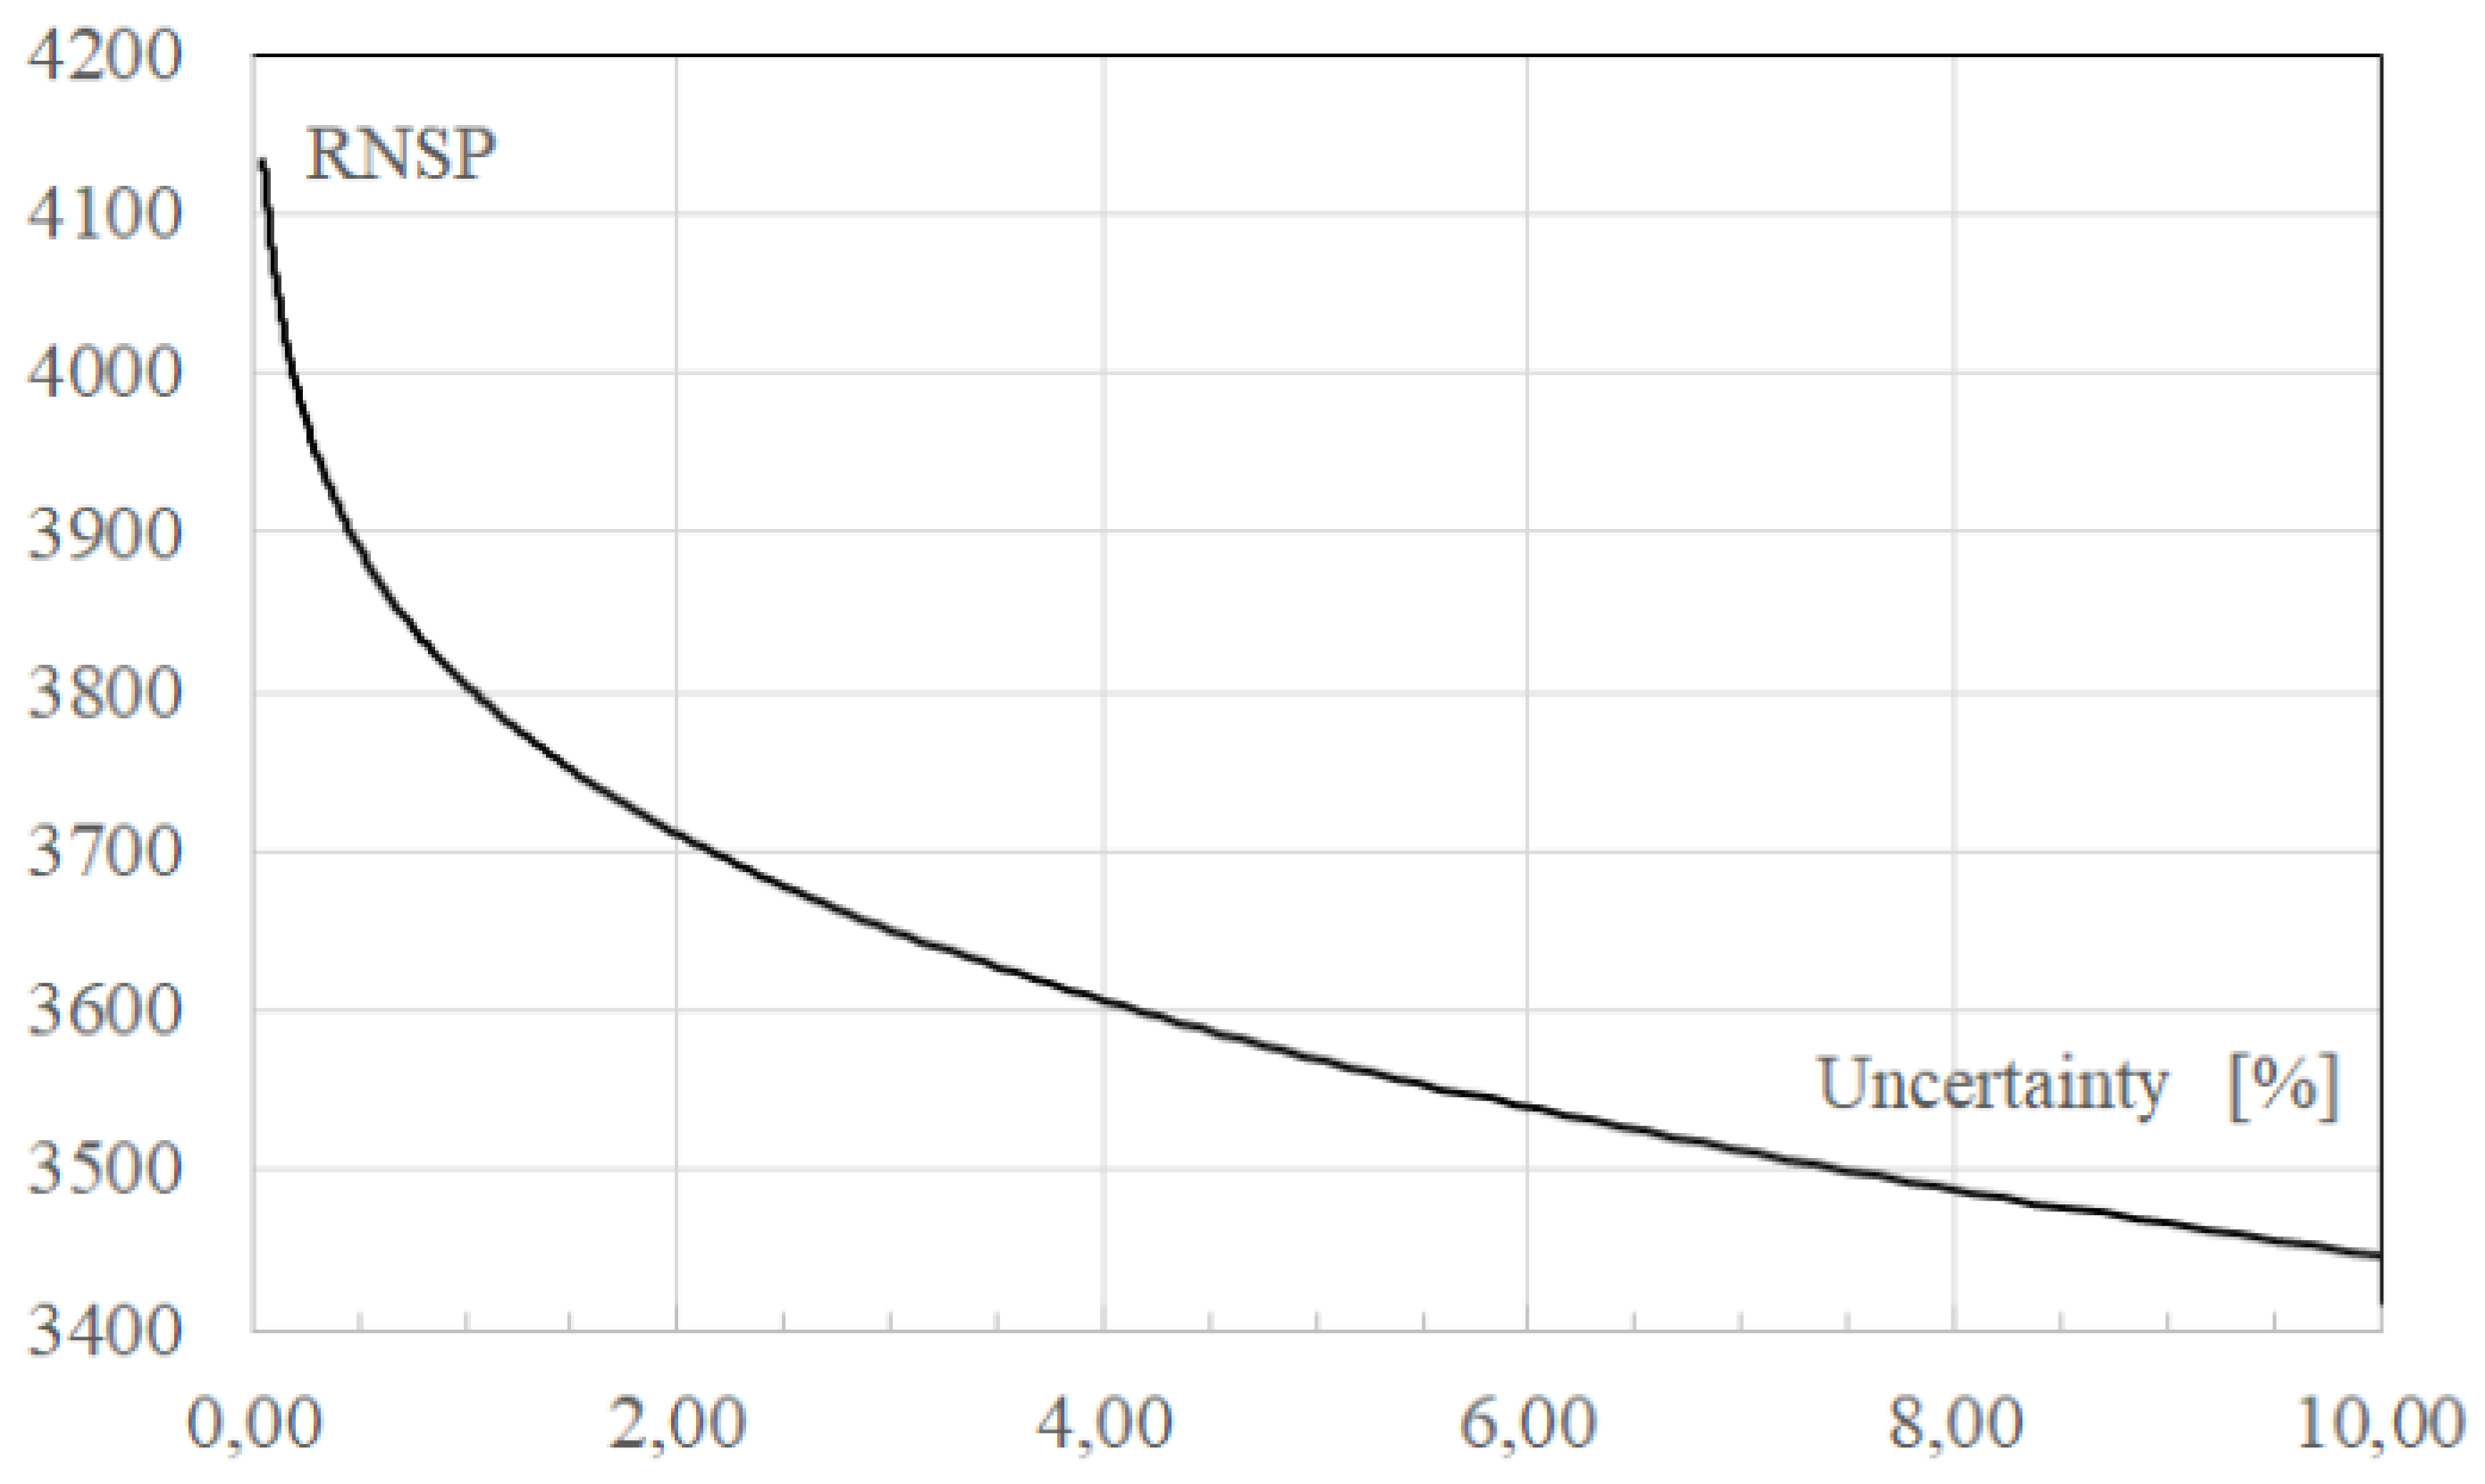
The RNSPs of different assessing uncertainty are given in
Table 3 and
Figure 3.
3.3. Correlation Analysis
The sensitivity of a system's reliability is characterized by its correlation with the reliability of a given element. The strength of linear stochastic interdependencies of two random variables can be characterized by their correlation coefficient. If these two parameters have a strong positive correlation coefficient, their values should most probably change in the same direction, conversely, in the case of a strong negative correlation, the coefficient they will change in the opposite direction. However, zero coefficient means that these two parameters are independent of each other.
The correlation coefficient
rημ can be estimated by the equation
where
x1;
x2; …
xn and
y1;
y2; …
yn samples which belong the variables
η and
μ [
18]. The MCS can be used to generate the sample sets mentioned above.
To determine the required number of spare parts, the reliability of the system has to be examined. Therefore, during this analysis, the correlation coefficients of the reliabilities of the elements and the system are determined and analyzed, not the correlations of their TTFs.
The author worked out the adaptation of linear mathematical diagnostic modeling methodology for setting-up the Linear Sensitivity Model of System Reliability (LSMoSR) [
14].
Table 4 and
Figure 4. display the correlation coefficients of MCS and – for comparison – linearized sensitivity coefficient of LSMoSR.
4. Functional Analysis
The functional sensitivity coefficient of a component – in contradistinction to the structural sensitivity coefficient – is influenced not only by its location in the system, but mainly by its reliability resulting from its functional role and physical location in the system.
Elements A, B and C, and D and E have different failure parameters due to their different functions and physical localization (different ambient physical impacts). Therefore, the sensitivity of the investigated SwCI became asymmetric.
Table 4 presents the main statistical data of the TTFs determined by data received from the repairing teams and data of functional simulation. Based on the above-stated in
Section 3.1, the excitation number was defined as one million. For simulation purposes, the core model was used.
4.1. Determination of the Requested Number of Spare Parts
The average value and standard deviation of the reliability of the system for a period of 1 year (8760 hours) is as follows:
The simulation results indicate that in order to guarantee less than 0.005 (0.5 %) probability of shortage, a minimum of 4596 spare parts should be purchased for 1 year time interval. For economic, maintenance and safety decisions (which are not the subject of this model study)
Table 5 and
Figure 5 outline the RNSP for different allowable probabilities of shortage.
4.2. Correlation Analysis
To determine which element must be modified technically for the increase of the system reliability the correlation analysis (see section 3.2.) was used. The results of the analysis are seen in
Table 7 and Figure 7 respectively.
Figure 6.
Comparison of Functional and Structural Correlation Coefficients.
Figure 6.
Comparison of Functional and Structural Correlation Coefficients.
5. Discussion
By analyzing the results of the simulations and analyses from an engineering point of view, the author has drawn the following conclusions:
5.1. Conclusions about Core Model
{1.1.} If MTTFs of elements increase, the system reliability will increase too.
{1.2} The system reliability decreases if the Performance Indicator Interval increases.
{1.3} Diagrams of
Figure 2 demonstrate that the investigated system reliability is non-linear and depends on the MTTFs of elements and the Performance Indicator Intervals.
(A system is linear if its operator has the following property: W{Cu} = CW{u}.)
{1.4} The BTT method can be used as a core model of MCSs.
{1.5} The disadvantage of this method is that the number of system states grows by an exponential function depending on the number of elements.
This may pose a problem during the following MCSs.
5.2. Conclusions about the Monte-Carlo Simulations
{2.1} In the case of identical MTTF, in the “first line” system reliability has a greater sensitivity to reliability of element B .
{2.2} In the case of identical MTTF, system reliability has greater sensitivity to the “second line” D and E elements than the "first line" elements.
{2.3} Comparing the results of correlation analysis and LMoSR [
14] revealed that the obtained sensitivity results of the used two methods have similar properties (see
Figure 3).
{2.4} The fundamental source of the magnitude difference between the two results mentioned above is the nonlinearity of the system's reliability model (see
Figure 2).
The LSMoSR method linearizes the core model, so it may result in numerical uncertainties. The MCS can manage this problem and provides a more satisfying result. However, MCS requires much more computing capacity than LSMoSR. If the aim of the analysis is “only” the selection of the most critical elements from the system reliability point of view, both methods yield adequate results.
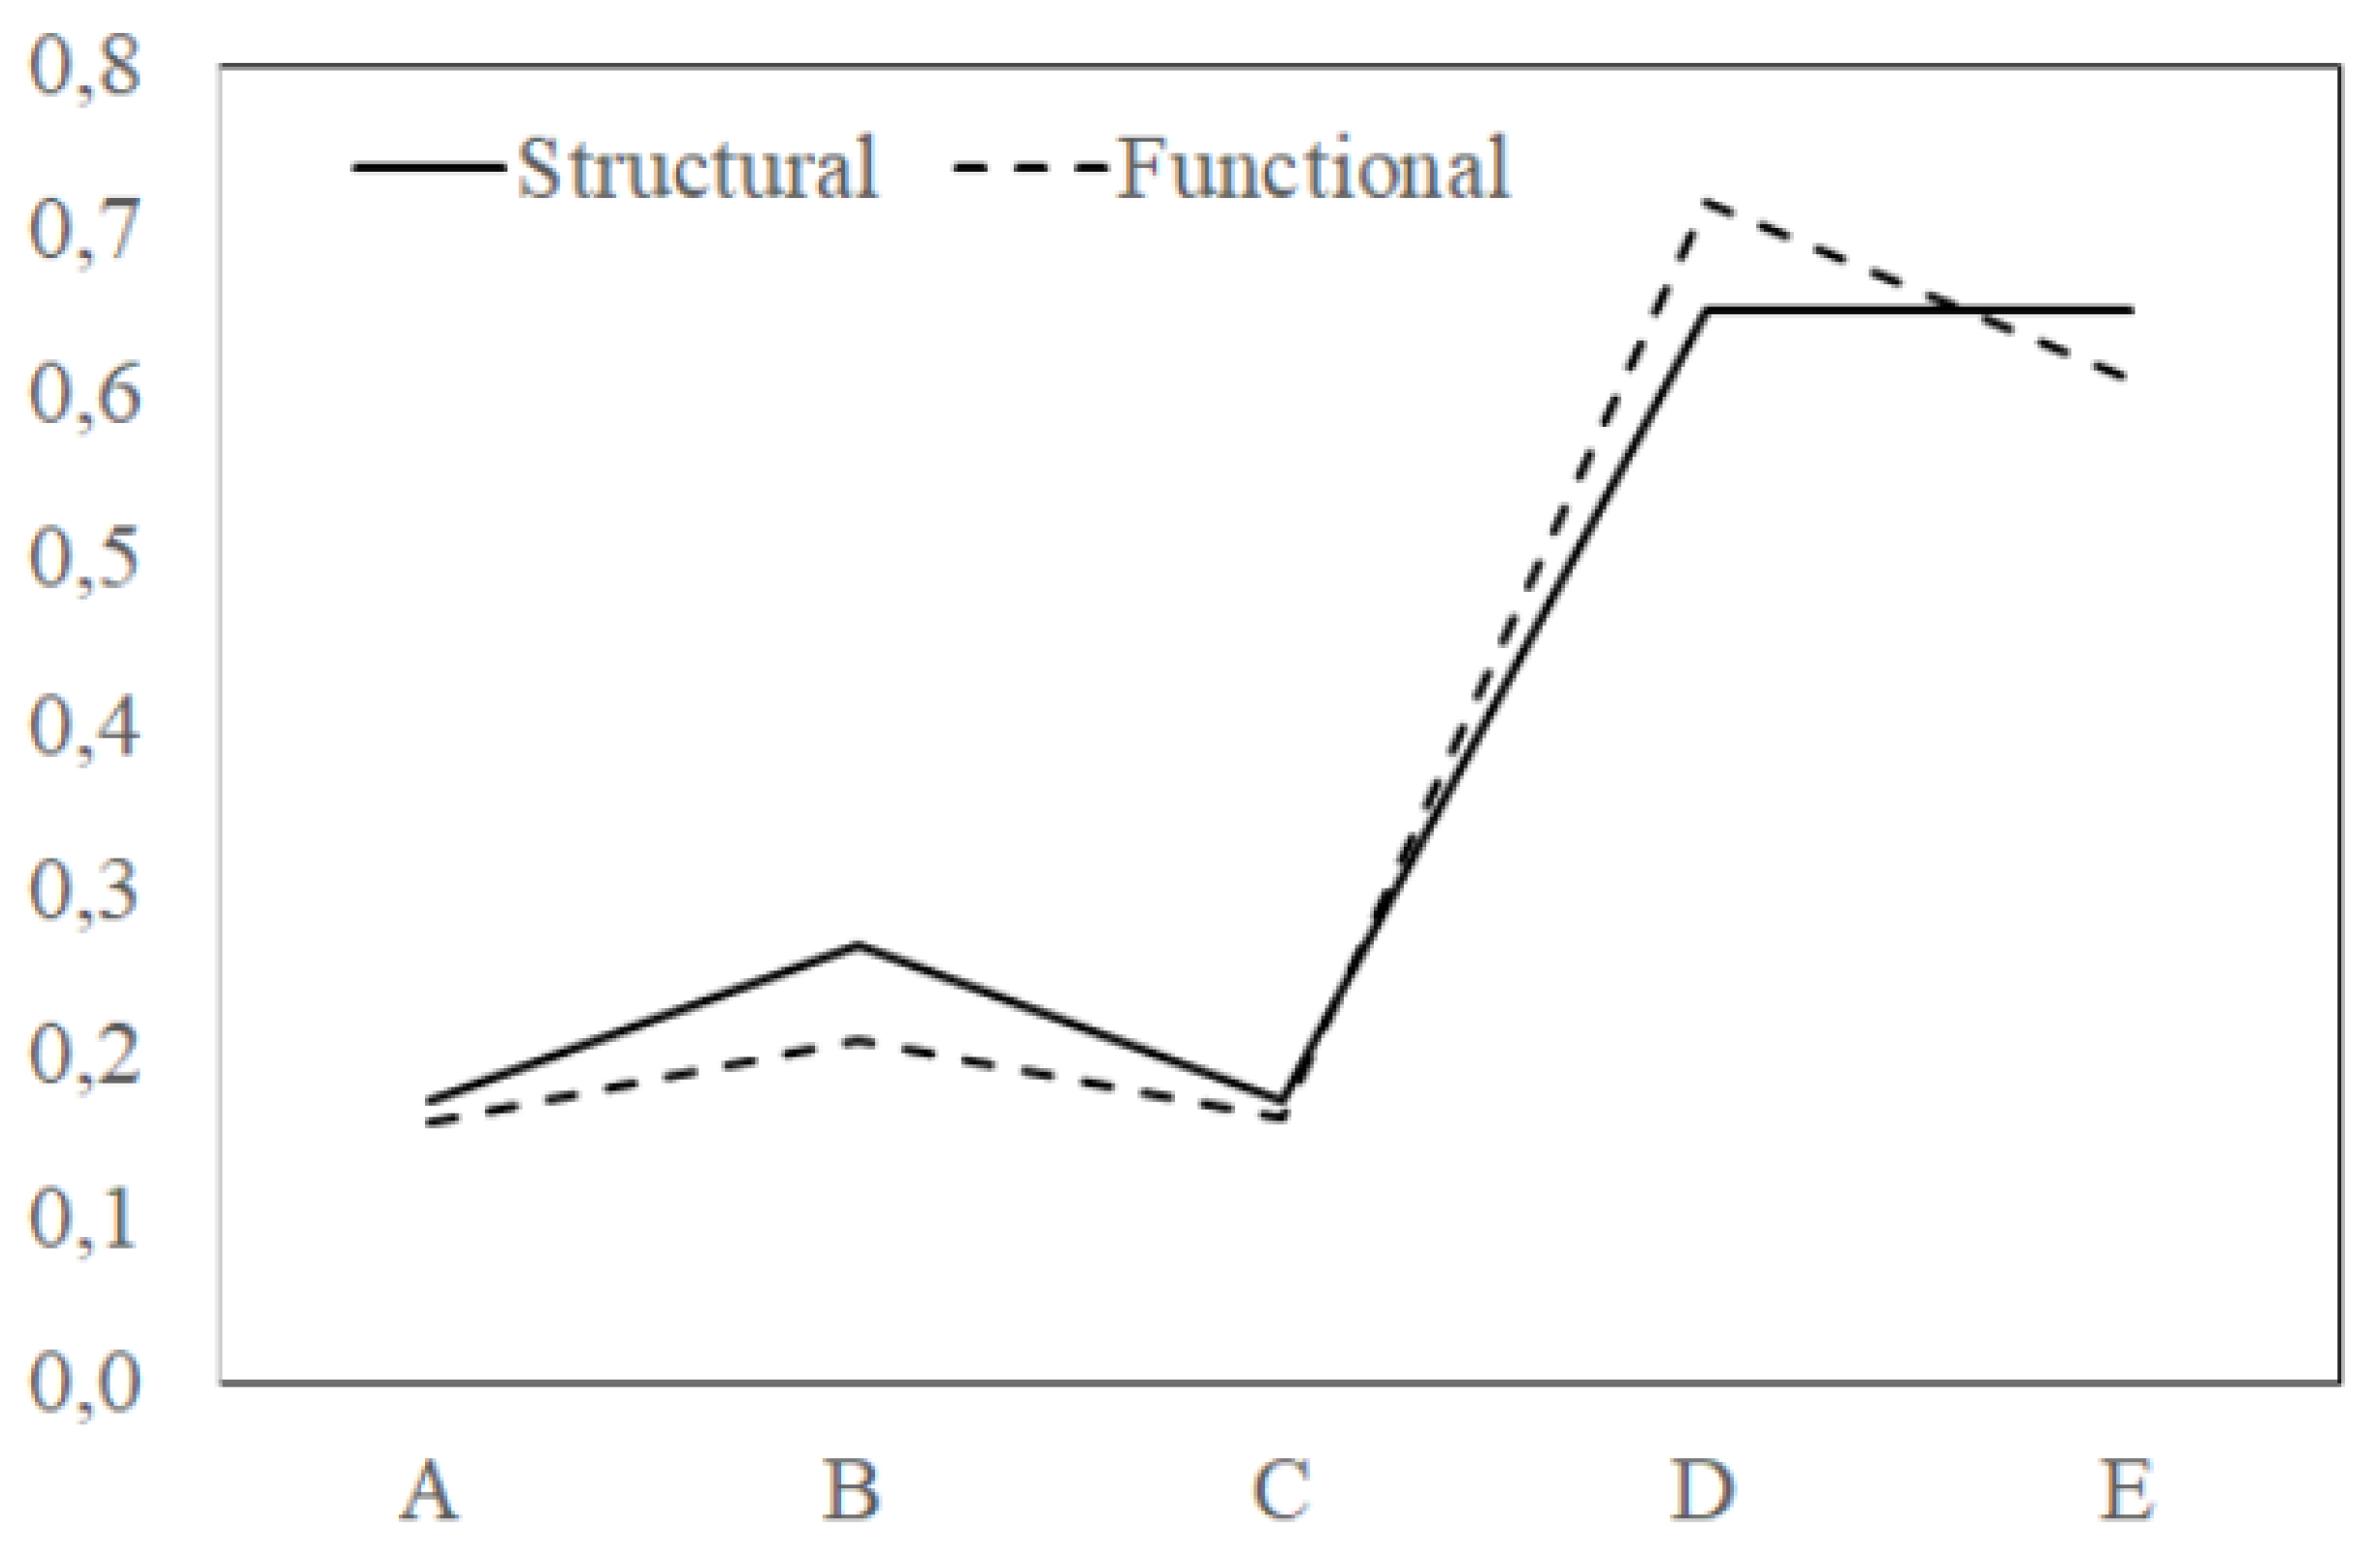
{2.5} The comparison of the structural and functional correlation analysis results (see
Figure 6) highlights the effects of different functional roles and physical locations of elements to system reliability.
There is a significant difference between the impacts of reliability of elements D and E to system reliability. This is the consequence of the difference between their functions in the system in the case of the analyzed work of the system.
{2.6} The results of MSC can be used to determine RNSP too – not only to investigate sensitivity of system reliability –, but it requires considerable calculation capacities.
6. Summary, Future Work
There are numerous SwCIs (such as vehicle sensor networks, V2Xs and VANETs) in modern transportation. The paper proposed an MCS-based method that can be applied to determine the RNSP of equipment of vehicle sensors; and critical elements of SwCIs (such as V2X, VNET and vehicle sensors and sensor networks) from a systems reliability point of view.
The author’s future scientific research related to this field of applied mathematics and technical reliability will include creating new methodologies to increase reliability of vehicle and transport systems and networks.
References
- Szűcs, H.; Hézer, J. Road Safety Analysis of Autonomous Vehicles An Overview. Period. Polytech. Transp. Eng. 2022, 50, 426–434. [Google Scholar] [CrossRef]
- Zöldy, M.; Baranyi, P. The Cognitive Mobility Concept. Infocommunications Journal 2023, 35–40. [Google Scholar] [CrossRef]
- Zöldy, M.; Baranyi, P.; Török, Á. Trends in Cognitive Mobility in 2022. Acta Polytech. Hung. 2024, 21, 189–202. [Google Scholar] [CrossRef]
- Boucetta, S.I.; Guichi, Y.; Johanyák, Z.C. Simulation-Based Comparison and Analysis of Time-Based and Topology-Based Emergency Dissemination Protocols in Vehicular Ad-hoc NETworks. In Proceedings of the 6th International Conference on Systems and Informatics (ICSAI 2019), Shanghai, China, 2–4 November 2019. [Google Scholar] [CrossRef]
- Boucetta, S.I.; Johanyák, Z.C. Review of Mobility Scenarios Generators for Vehicular Ad-Hoc Networks Simulators. J. Phys. Conf. Ser. 2021, 1935, 012006. [Google Scholar] [CrossRef]
- Otić, G. , Jovanov, G.; Adamović, Ž.; Jovanov, N.; Jaćimovski, St. Proactive Maintenance Model Based on the Law on Change of Mechanical Vibration. Acta Polytech. Hung. 2021, 18, 161–178. [Google Scholar] [CrossRef]
- Kurhan, M.; Kurhan, D.; Hmelevska, N. Maintenance Reliability of Railway Curves Using Their Design Parameters. Acta Polytech. Hung. 2022, 19, 115–127. [Google Scholar] [CrossRef]
- Ambriško, Ľ.; Šaderová, J.; Antal, R. Evaluation of Railway Vehicle Reliability Parameters. Acta Polytech. Hung. 2023, 20, 115–127. [Google Scholar] [CrossRef]
- Pokorni, S. Data -driven reliability and availability of electronic equipment. VOJNOTEHNIČKI GLASNIK / MILITARY TECHNICAL COURIER 2023, 71, 769–782. [Google Scholar] [CrossRef]
- Payette, M.; Abdul-Nour, G. Asset Management, Reliability and Prognostics Modeling Techniques. Sustainability 2023, 15, 7493. [Google Scholar] [CrossRef]
- Labašová, E. Reliability Assessment oh the Systems with Simple Interconnections. Research Papers Faculty of Materials Science and Technology Slovak University of Technology 2021, 29, 36–42. [Google Scholar] [CrossRef]
- Myers, A. Complex System Reliability; Springer-Verlag: London, UK, 2010; ISBN 978-1-84996-414-2. [Google Scholar]
- Iordache, O. Modeling Multi-level Systems; Springer-Verlag: Berlin, Germany, 2011; ISBN 978-3642423680. [Google Scholar]
- Pokorádi, L. Sensitivity analysis of reliability of Systems with Complex Interconnections. J. Loss Prev. Process Ind. 2014, 32, 436–442. [Google Scholar] [CrossRef]
- Metropolis, N.; Ulam, S. The Monte Carlo Method. J. Am. Stat. Assoc. 1949, 44, 335–341. [Google Scholar] [CrossRef] [PubMed]
- Pokorádi, L. Availability assessment with Monte-Carlo simulation of maintenance process model. Polytech. Univ. Buchar. Sci. Bull. Ser. D Mech. Eng. 2016, 78, 43–54. [Google Scholar]
- Pokorádi, L. Monte-Carlo Simulation-Based Accessibility Analysis of Temporal Systems. Symmetry 2022, 14, 983. [Google Scholar] [CrossRef]
- Korn, G.A.; Korn, T.M. Mathematical Handbook for Scientists and Engineers, 2nd ed.; Dover Publications: New York, USA, 2000. [Google Scholar]
|
Disclaimer/Publisher’s Note: The statements, opinions and data contained in all publications are solely those of the individual author(s) and contributor(s) and not of MDPI and/or the editor(s). MDPI and/or the editor(s) disclaim responsibility for any injury to people or property resulting from any ideas, methods, instructions or products referred to in the content. |
© 2024 by the authors. Licensee MDPI, Basel, Switzerland. This article is an open access article distributed under the terms and conditions of the Creative Commons Attribution (CC BY) license (http://creativecommons.org/licenses/by/4.0/).
