Submitted:
22 July 2024
Posted:
24 July 2024
You are already at the latest version
Abstract
Keywords:
1. Introduction
2. Study area description
2.1. Local setting
2.2. Geology and Hydrogeological setting
3. Material and methods
3.1. Electrical resistivity Sounding data acquisition
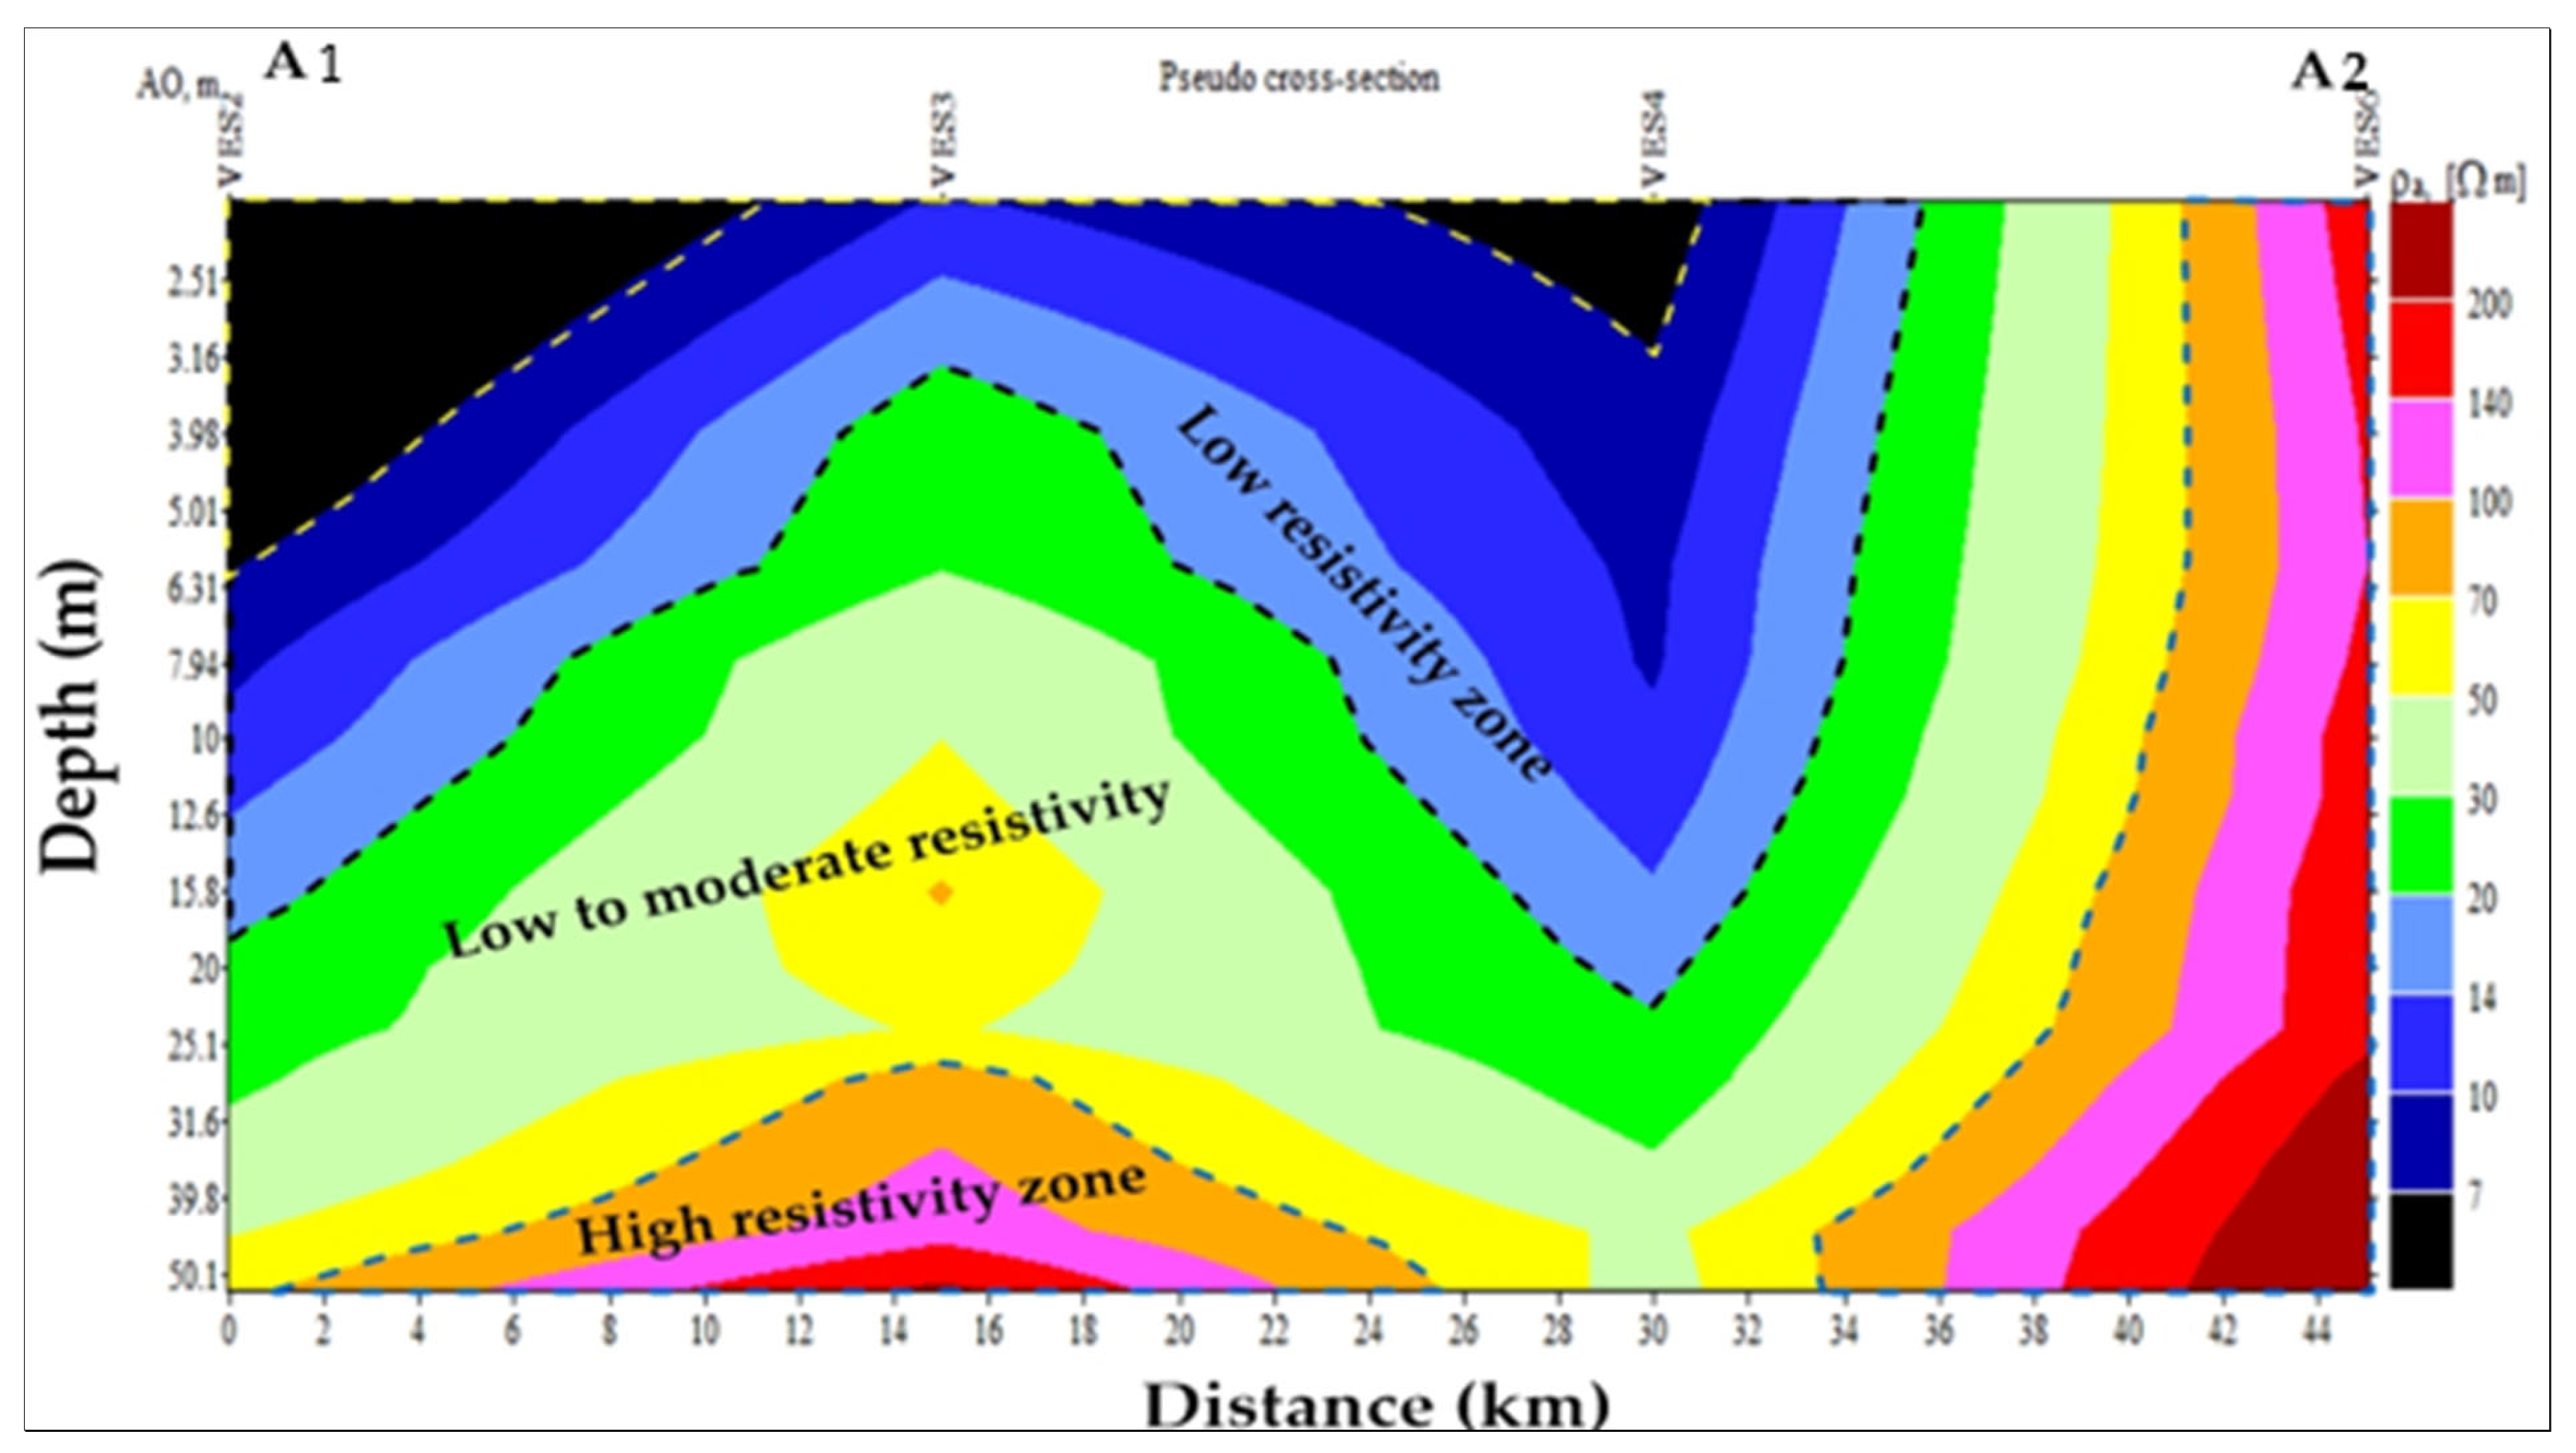
3.2. Ground magnetoteluric method
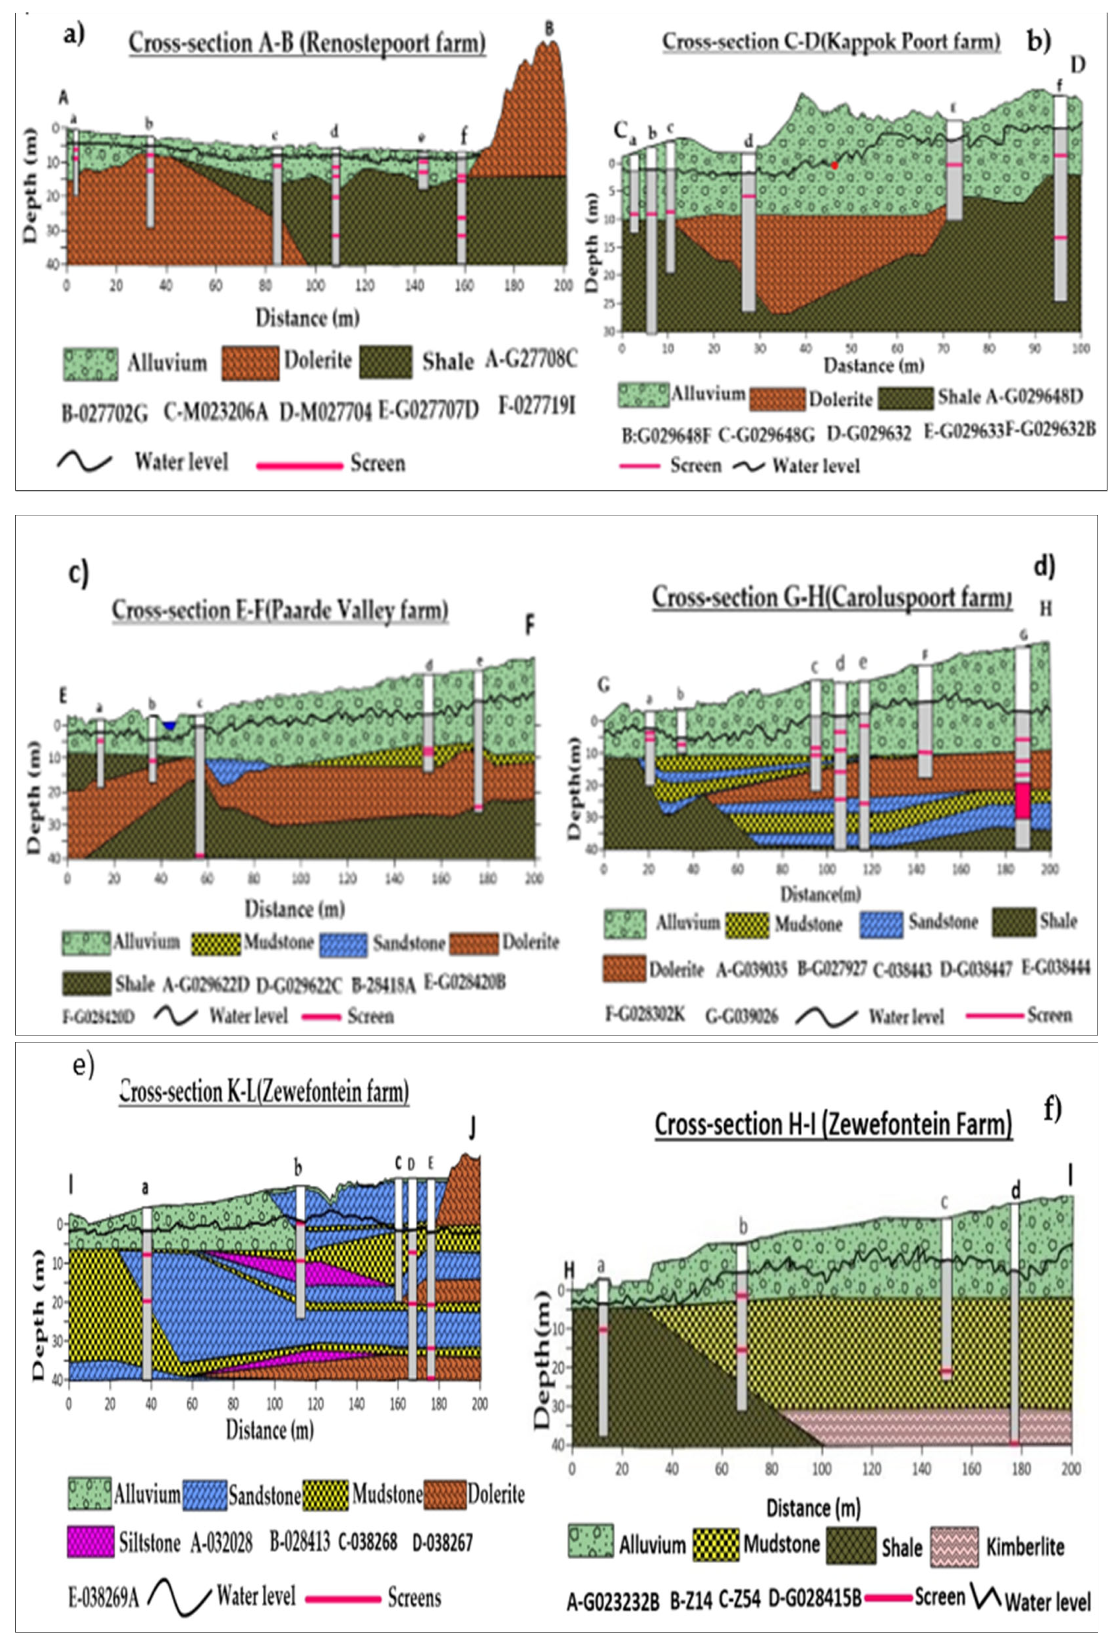
3.3. Lithological cross-section of the existing boreholes
4. Results and Discussion
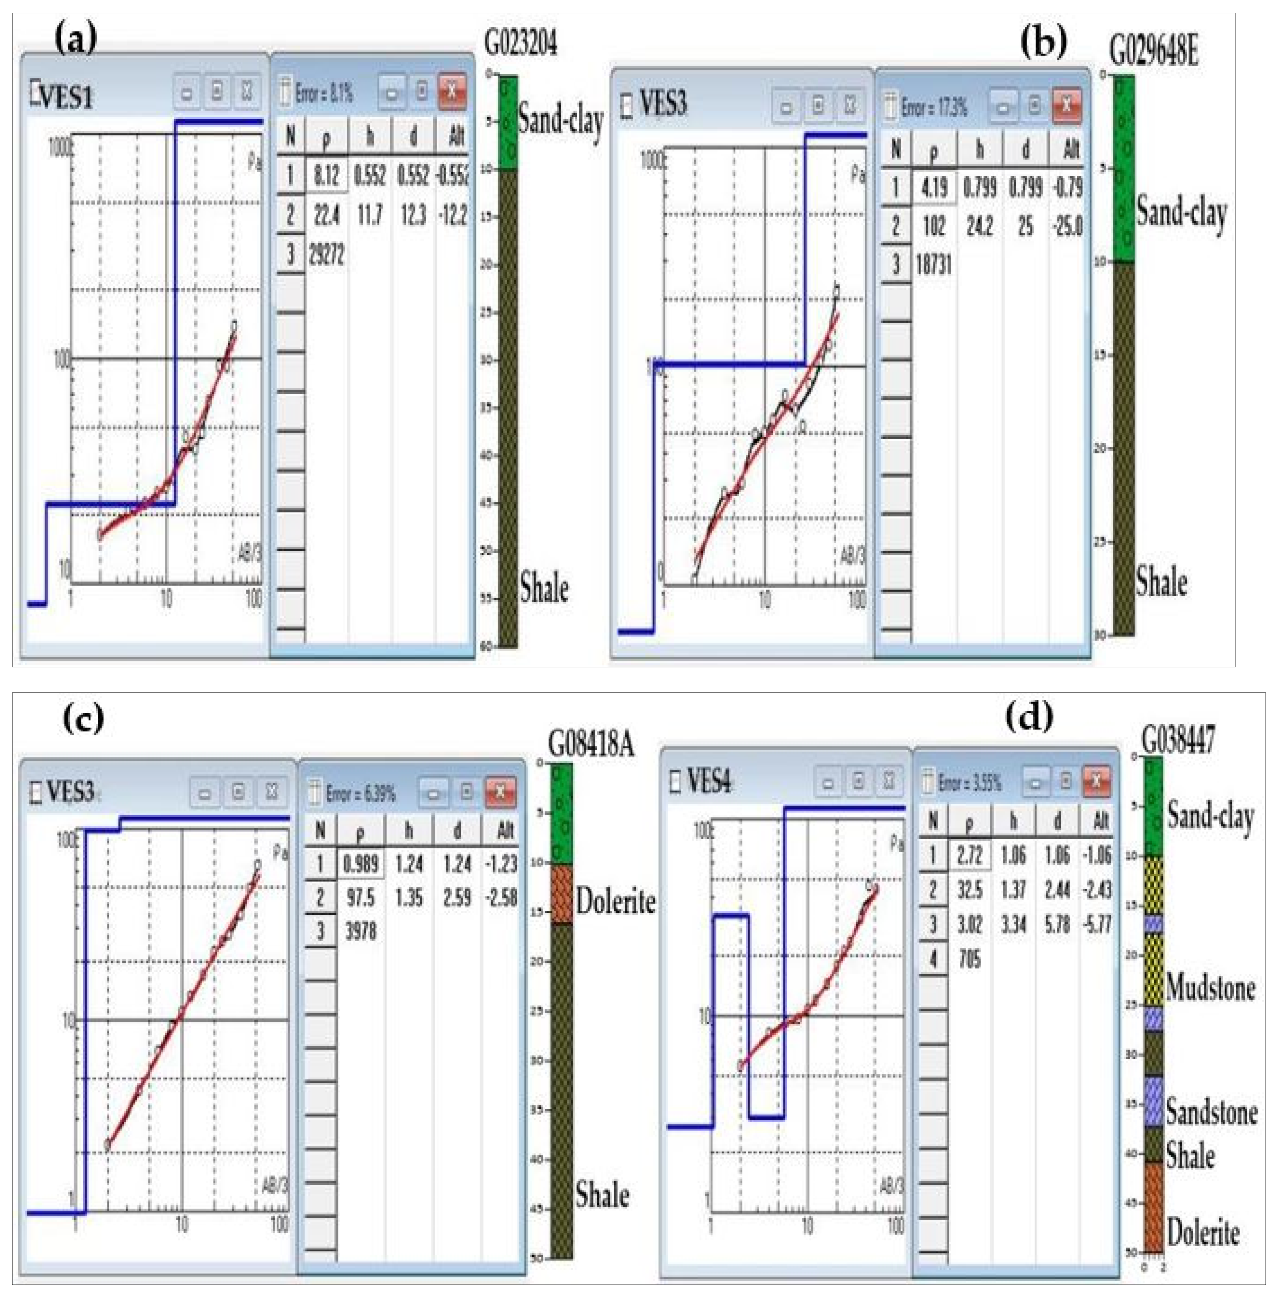
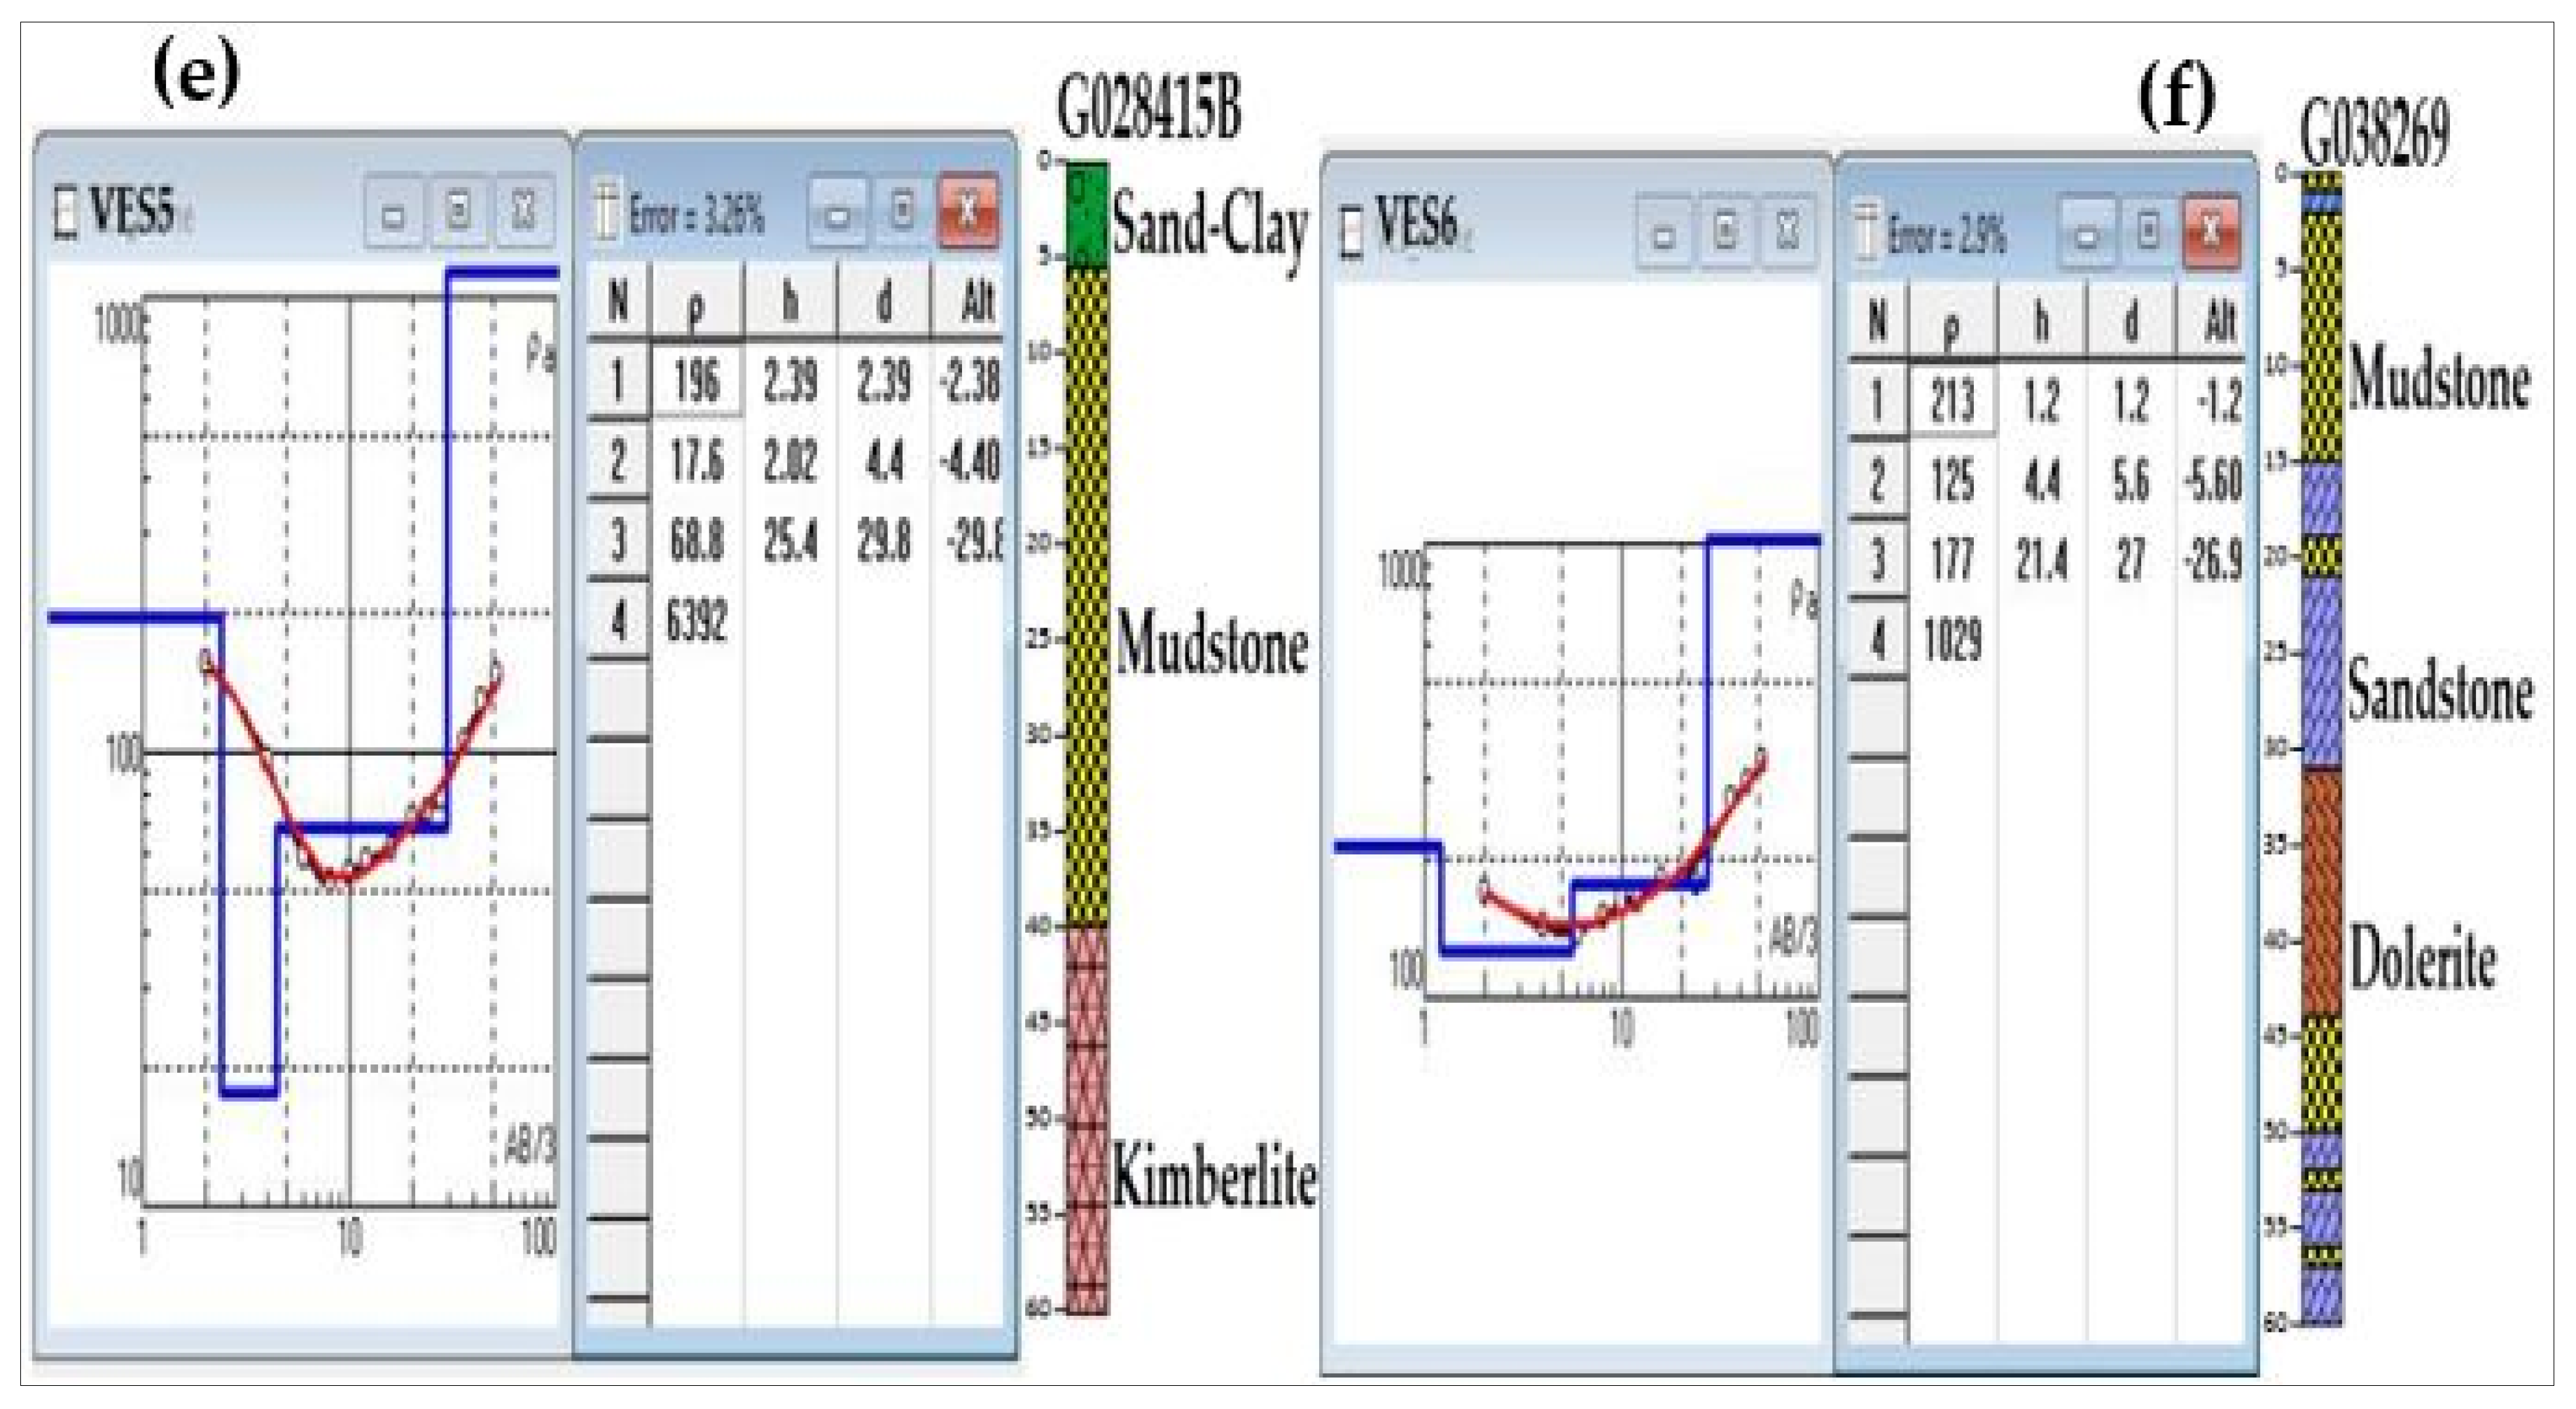
4.1. Electrical resistivity results and lithostratigraphic cross-section
5. Conclusions
Author Contributions
Funding
Institutional Review Board Statement
Informed Consent Statement
Data Availability Statement
Acknowledgments
Conflicts of Interest
Declaration
References
- A. C. Woodford, P. N. D. Sci, P. Visser, and N. Sci, “Geohydrological Assessment of De Aar’s Groundwater Resources Emthanjeni Municipality SRK Project Number 374624 SRK Consulting The Administrative Building Albion Spring 183 Main Road Rondebosch 7700 South Africa Postnet Suite #206 Private Bag X18 Rondebosch 7701 South Africa,” 2007.
- G. Bennett, M. Van Camp, C. Shemsanga, M. Kervyn, and K. Walraevens, “Delineation of the aquifer structure and estimation of hydraulic properties on the flanks of Mount Meru, Northern Tanzania,” Journal of African Earth Sciences, vol. 196, Dec. 2022. [CrossRef]
- H. F. Yeh, Y. S. Cheng, H. I. Lin, and C. H. Lee, “Mapping groundwater recharge potential zone using a GIS approach in Hualian River, Taiwan,” Sustainable Environment Research, vol. 26, no. 1, pp. 33–43, Jan. 2016. [CrossRef]
- S. A. S. Araffa, “Delineation of groundwater aquifer and subsurface structures on North Cairo, Egypt, using integrated interpretation of magnetic, gravity, geoelectrical and geochemical data,” Geophys J Int, vol. 192, no. 1, pp. 94–112, Jan. 2013. [CrossRef]
- S. Awad, S. Araffa, and J. Pek, “Delineating Groundwater Aquifer and Subsurface Structures Using Integrated Geophysical Interpretation at the Western Part of Gulf of Aqaba, Sinai, Egypt,” International Journal of Water Resources and Arid Environments, vol. 3, no. 1, pp. 51–62, 2014.
- M. G. Abdullahi, “The Application of Vertical Electrical Sounding (VES) for Groundwater Exploration in Tudun Wada Kano State, Nigeria,” Journal of Geology & Geosciences, vol. 04, no. 01, 2015. [CrossRef]
- U. Placide and G. R. Senthil Kumar, “Electrical resistivity data interpretation for groundwater detection in Tagudi Taluk of Cuddalore District, Tamil Nadu, India.” [Online]. Available: http://www.ijret.org.
- K. D. Oyeyemi, A. P. Aizebeokhai, M. Metwaly, O. Omobulejo, O. A. Sanuade, and E. E. Okon, “Assessing the suitable electrical resistivity arrays for characterization of basement aquifers using numerical modeling,” Heliyon, vol. 8, no. 5, May 2022. [CrossRef]
- M. H. Loke, D. F. Rucker, J. E. Chambers, P. B. Wilkinson, and O. Kuras, “Electrical resistivity surveys and data interpretation Encyclopedia of Solid Earth Geophysics, 2 nd Edition Harsh Gupta et al. (eds.) Springer.”.
- D. Tamunosiki, “Aquifer Delineation and Characterization using Geoelectric Method at Parts of Umuahia, Nigeria.” [Online]. Available: https://www.researchgate.net/publication/327645076.
- R. C. Rangel, J. L. Porsani, C. A. Bortolozo, and L. R. Hamada, “Electrical Resistivity Tomography and TDEM Applied to Hydrogeological Study in Taubaté Basin, Brazil,” International Journal of Geosciences, vol. 09, no. 02, pp. 119–130, 2018. [CrossRef]
- M. I. I. Mohamaden, “Delineating groundwater aquifer and subsurface structures by using geoelectrical data: Case study (Dakhla Oasis, Egypt),” NRIAG Journal of Astronomy and Geophysics, vol. 5, no. 1, pp. 247–253, Jun. 2016. [CrossRef]
- K. S. Banerjee, S. P. Sharma, A. K. Sarangi, and D. Sengupta, “Delineation of subsurface structures using resistivity, VLF and radiometric measurement around a U-tailings pond and its hydrogeological implication,” Physics and Chemistry of the Earth, vol. 36, no. 16, pp. 1345–1352, 2011. [CrossRef]
- J. R. Vegter, “" " A geohydrological investigation at caroluspoort, De Aar for the South African railways”Department of Water Afairs and Forestry, Directorate geohydrology, De Aa”1987”.
- A. Bairu, “Application of Vertical Electrical Sounding and Horizontal Profiling Methods to Decipher the Existing Subsurface Stratification in River Segen Dam Site, Tigray, Northern Ethiopia,” vol. 3, no. 10, 2013, [Online]. Available: www.iiste.org.
- T. A. Adagunodo, L. A. Sunmonu, A. A. Adeniji, O. P. Oladejo, and O. A. Alagbe, “Geoelectric Delineation of Aquifer Pattern in Crystalline Bedrock,” Open Transactions on Geosciences, vol. 2015, no. 1, pp. 1–16, Mar. 2015. [CrossRef]
- A. I. Riwayat, M. A. Ahmad Nazri, and M. H. Zainal Abidin, “Application of Electrical Resistivity Method (ERM) in Groundwater Exploration,” in Journal of Physics: Conference Series, Institute of Physics Publishing, Apr. 2018. [CrossRef]
- A. Niaz et al., “Application of electrical resistivity method in delineating aquifer properties along with vulnerability mapping in Gujrat District and surrounding areas of Punjab province.”.
- A. A. AL-Juboury, J. M. Thabit, and F. H. AL-Menshed, “Delineation the effect of saline groundwater on the resistivity of middle part of dammam formation southwest of samawah city, southern iraq,” Iraqi Journal of Science, vol. 60, no. 5, pp. 1095–1103, May 2019. [CrossRef]
- K. Sami and D. A. Hughes, “A comparison of recharge estimates to a fractured sedimentary aquifer in South Africa from a chloride mass balance and an integrated surface-subsurface model,” 1996.
- F. Matome and A. Sekiba, “Application of geophysical techniques in delineation of aquifers in the Beaufort West area, Western Karoo, South Africa,” 2019.
- “Vegter, J.R , Groundwater supply : “A digest of the past and an outlook for the future. Dept WaterPretoria.GH3775:https://www.dws.gov.za/ghreport/Home/Result.aspx?Search=%20FORMSOF%20(INFLECTIONAL,%20gh3775),De Aar ”1992.
- Woodford, A.C,“Development and management of available groundwater resources. Dept WaterPretoria.GH3837:https://www.dws.gov.za/ghreport/Home/Result.aspx?Search=%20FORMSOF%20(INFLECTIONAL,%20gh3837), De Aar”1993.
- Parsons, R.P, “An assessment of hydrochemical changes of groundwater around De Aar. Dept Water –PretoriaGH3628:https://www.dws.gov.za/ghreport/Home/Result.aspx?Search=%20FORMSOF%20(INFLECTIONAL,%20gh3628), De Aar”1989.
- D. Parwatiningtyas and A. Sjamsuri, “Proceeding of Ocean, Mechanical and Aerospace-Science and Engineering Application Of Resistivity Method Wenner Configuration For Determining Aquifer Position At Pasir Impun Area, Bandung, West Java,” 2015.
- I. A. Adeyemo, B. T. Ojo, and W. O. Raheem, “Comparison of Thickness and Depth Resolution Power of Wenner and Schlumberger Arrays: A Case Study of Temidire Quarters, Akure, Nigeria,” Journal of Geoscience and Environment Protection, vol. 05, no. 03, pp. 233–239, 2017. [CrossRef]
- V. Shevnin, O. Delgado Rodríguez, A. Mousatov, D. Flores Hernández, H. Zegarra Martínez, and A. Ryjov, “Estimation of soil petrophysical parameters from resistivity data: Application to oil-contaminated site characterization.”.
- P. R. Ikhane, K. O. Omosanya, A. A. Akinmosin, and A. B. Odugbesan, “Electrical Resistivity Imaging (ERI) of Slope Deposits and Structures in Some Parts of Eastern Dahomey Basin,” Journal of Applied Sciences, vol. 12, no. 8, pp. 716–726, Apr. 2012. [CrossRef]
- S. R. Chikabvumbwa, D. Sibale, R. Marne, S. W. Chisale, and L. Chisanu, “Geophysical investigation of dambo groundwater reserves as sustainable irrigation water sources: case of Linthipe sub-basin,” Heliyon, vol. 7, no. 11, Nov. 2021. [CrossRef]
- M. I. I. Mohamaden, “Delineating groundwater aquifer and subsurface structures by using geoelectrical data: Case study (Dakhla Oasis, Egypt),” NRIAG Journal of Astronomy and Geophysics, vol. 5, no. 1, pp. 247–253, Jun. 2016. [CrossRef]
- K. Omosanya, “A review of stratigraphic surfaces generated from multiple electrical sounding and profiling,” 2014. [Online]. Available: https://www.researchgate.net/publication/267269883.
- G. O. Mosuro et al., “Assessment of groundwater vulnerability to leachate infiltration using electrical resistivity method,” Appl Water Sci, vol. 7, no. 5, pp. 2195–2207, Sep. 2017. [CrossRef]
- “5.imimg.comdata5QSSZVSSELLER-33144667pqwt-s-300-water-detector”.
- S. O. Oyegoke, O. O. Ayeni, K. O. Olowe, A. S. Adebanjo, and O. O. Fayomi, “Effectiveness of geophysical assessment of boreholes drilled in basement complex terrain at Afe Babalola University, using Electromagnetic (E.M.) method,” Nigerian Journal of Technology, vol. 39, no. 1, pp. 36–41, Apr. 2020. [CrossRef]
- M. Gomo, “Use of electric potential difference in audio magnetotelluric (AMT) geophysics for groundwater exploration,” Groundw Sustain Dev, vol. 20, Feb. 2023. [CrossRef]
- W. O. Raji, E. A. Ayolabi, K. Aluko, W. Raji, and E. Ayolabi, “Application of 2-D Resistivity Survey to Groundwater Aquifer Delineation in a sedimentary terrain: Integration of Borehole Logs and 2D Electrical Resistivity Imaging in the Investigation of Saltwater Intrusion in Lagos Island, Southwestern Nigeria. View project Application of 2-D resistivity survey to groundwater aquifer delineation in a sedimentary terrain: A case study of south-western Nigeria,” 2017. [Online]. Available: https://www.researchgate.net/publication/325091526.
- H. Saibi, S. Khosravi, B. A. Cherkose, M. Smirnov, Y. Kebede, and A. R. Fowler, “Magnetotelluric data analysis using 2D inversion: A case study from Al-Mubazzarah Geothermal Area (AMGA), Al-Ain, United Arab Emirates,” Heliyon, vol. 7, no. 6, Jun. 2021. [CrossRef]
- N. A. Hassan, J. M. Gathenya, and J. M. Raude, “Estimating Groundwater Recharge Rates and Identifying Groundwater Recharge Zones in Kakia and Esamburbur Sub-Catchment Narok, Kenya,” Open Access Journal Journal of Sustainable Research in Engineering, vol. 7, no. 1, pp. 31–45.
- A. J. Khan et al., “European Journal of Molecular & Clinical Medicine An Integrated Geo-Physical Approach for Groundwater Investigation in Northwestern Part of Pakistan”.
- “Structural_Geology___Map_Interpretation_Ch4”.
- A. G. Isah, O. A. Akinbiyi, J. L. Ugwoke, N. C. Ayajuru, and R. O. Oyelola, “Detection of groundwater level and heavy metal contamination: A case study of Olubunku dumpsite and environs, Ede North, Southwestern Nigeria,” Journal of African Earth Sciences, vol. 197, Jan. 2023. [CrossRef]
- H. M. Nazifi and S. B. Lambon, “Geophysical Mapping of Groundwater Aquifers Beneath the Central Region of Ghana,” 2021.
- H. Garamoon and A. M. Ebraheem, “Application of Earth Resistivity, Hydrogeochemistry and Isotope Hydrology Methods for Assessment of Groundwater Recharge in Two Drainage Basins in Northeastern United Arab Emirates”. [CrossRef]
- C. Amos-Uhegbu, M. U. Igboekwe, G. U. Chukwu, K. O. Okengwu, and T. K. Eke, “Hydrogeophysical Delineation and Hydrogeochemical Characterization of the Aquifer Systems in Umuahia-South Area, Southern Nigeria,” 2012. [Online]. Available: www.sciencedomain.org.
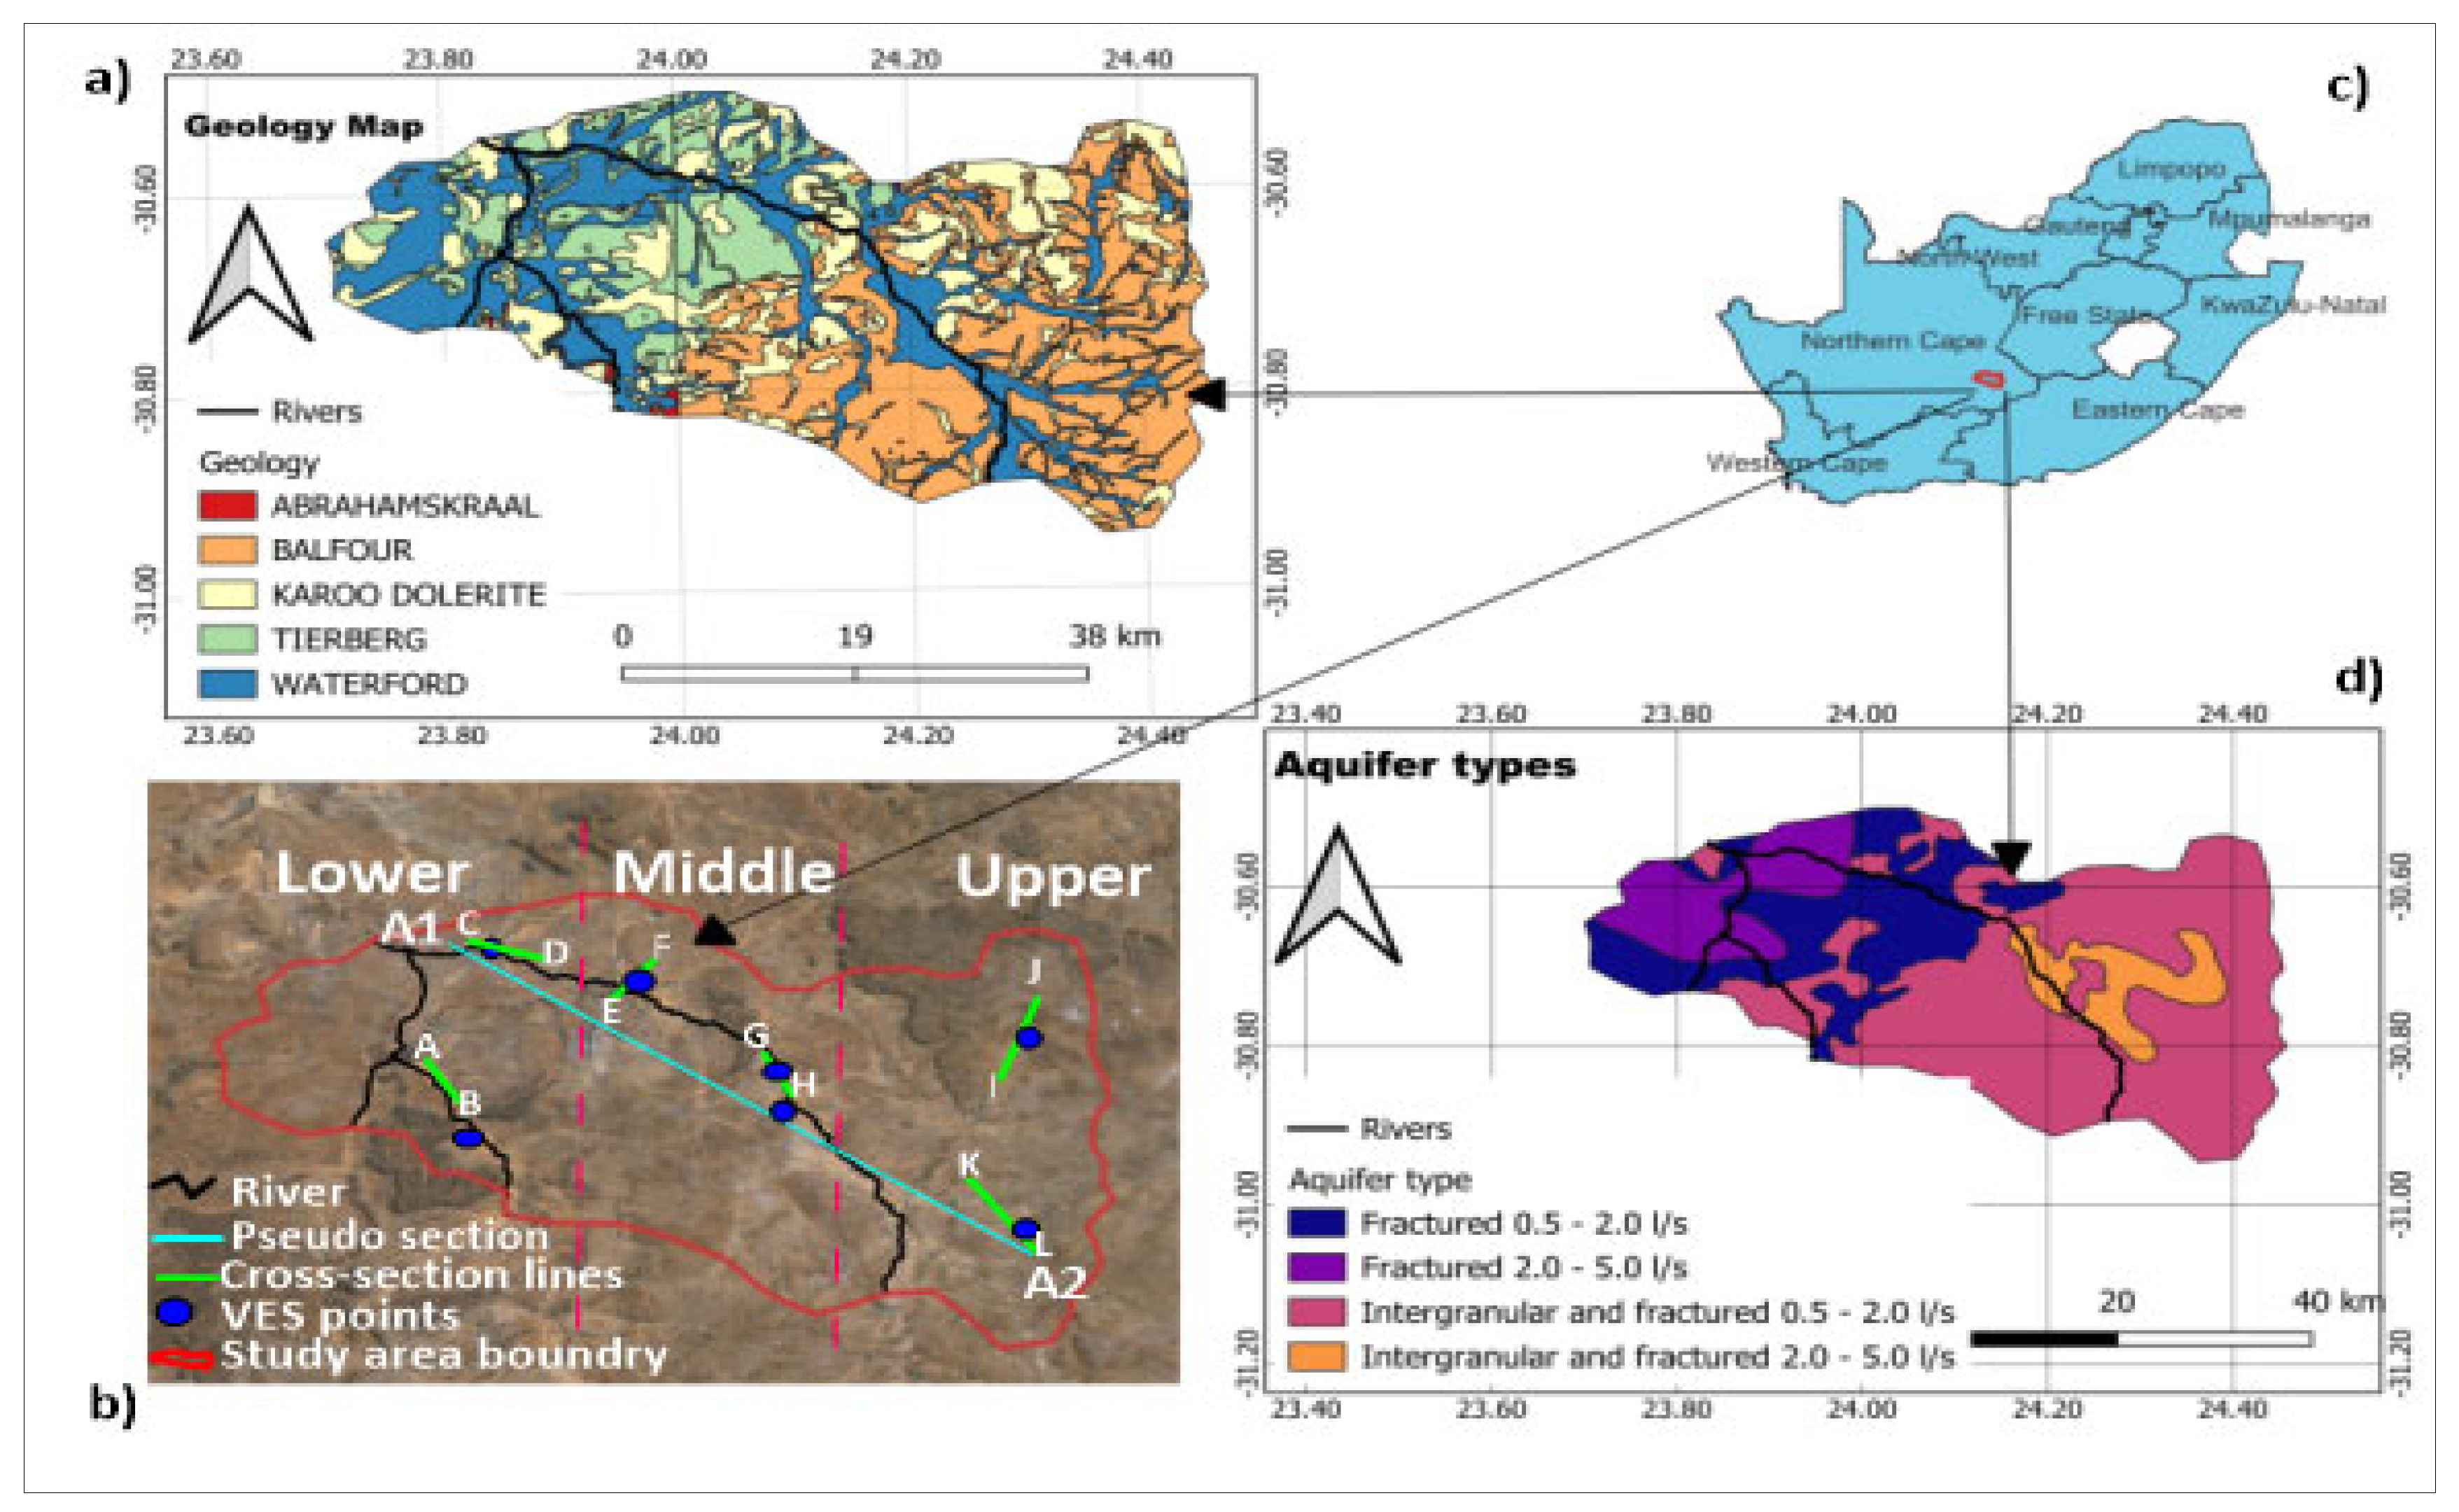
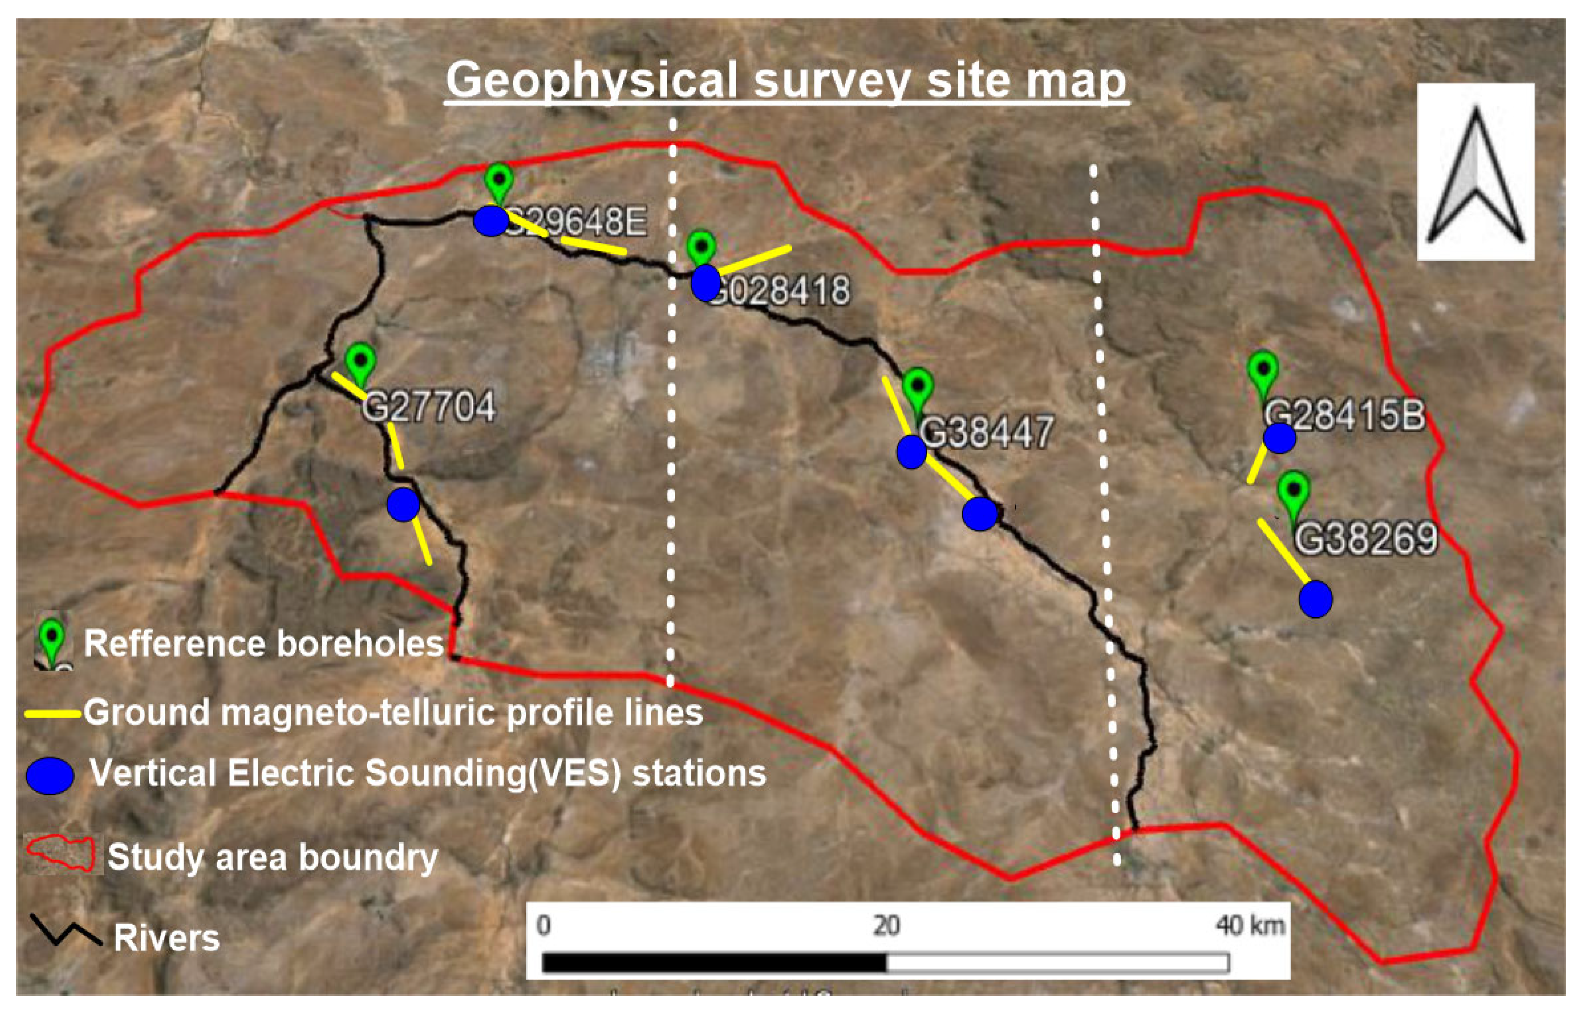
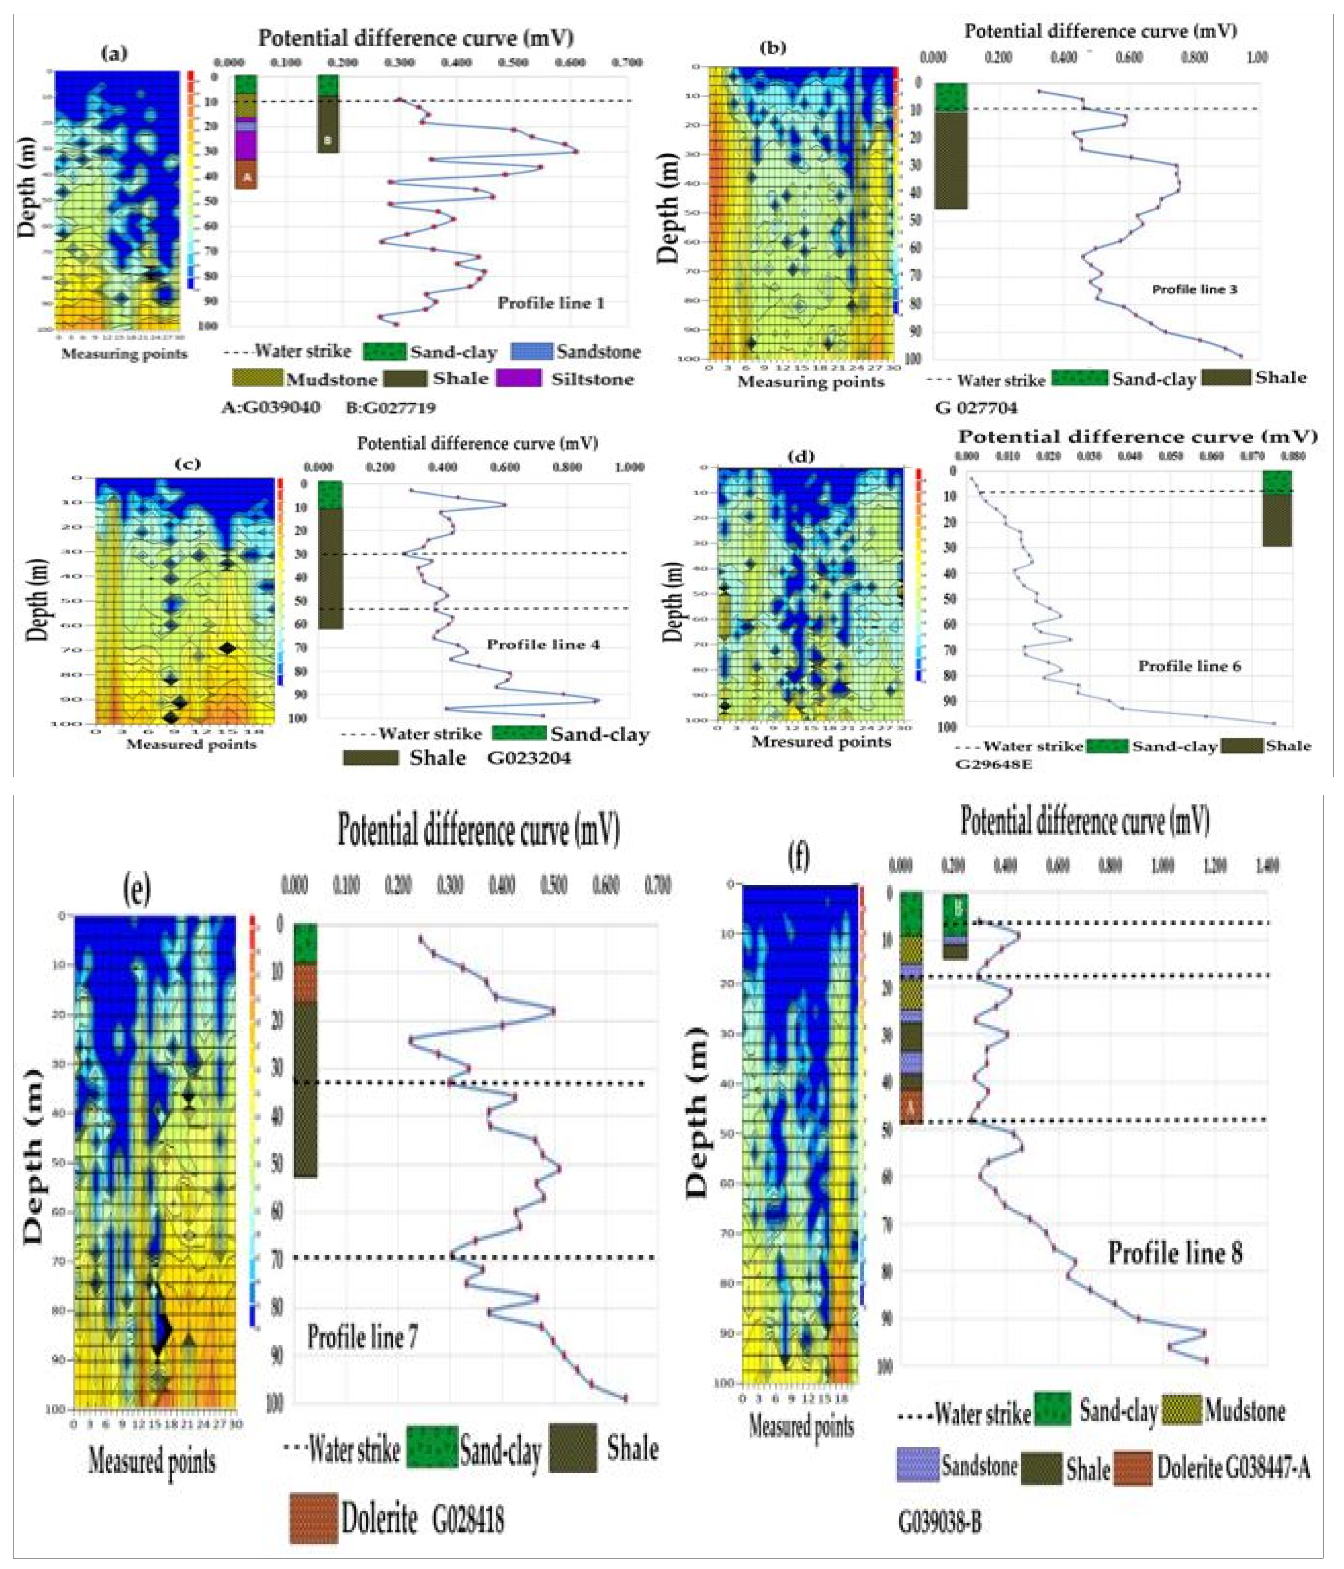
| Study sites | BH no | Y | X | Line | length(m) | Interval (m) |
Depth(m) | WL (m) | Elev. | Water Strike (m) |
Lithology | Casing (m) |
|---|---|---|---|---|---|---|---|---|---|---|---|---|
| Lower | G039040 | -30.666 | 23.8654 | 1 | 240 | 4 | 45 | 3.23 | 1220 | 4,7-11 | Silt-Clay, Mudstone | 12 |
| G27719I | -30.6679 | 23.8757 | 2 | 240 | 4 | 48 | 3.13 | 1227 | 4,9,12,24,42 | Sand, Shale, Dolerite | 6.5 | |
| G27704 | -30.6729 | 23.8778 | 3 | 320 | 3 | 45 | 5.14 | 1216 | 8, 10, 14, 30 | Sand-clay, Shale | 14.6 | |
| G23204 | -30.7045 | 23.9006 | 4 | 200 | 5 | 62 | 1233 | 10,18 | Shale | 10 | ||
| G29646C | -30.5556 | 23.95382 | 5 | 200 | 5 | 36 | 1183 | 6.5 | Clay | |||
| G29648E | -30.5506 | 23.9388 | 6 | 300 | 3 | 28 | 4.83 | 1190 | 8 | Sand | 10 | |
| Middle | G028418 | 30.5991 | 24.0596 | 7 | 250 | 6 | 24 | 3.86 | 1231 | 33 | Shale | |
| G38447 | -30.6886 | 24.1781 | 8 | 200 | 5 | 42 | 4.77 | 1261 | 5, 8, 17, 24 | Sand-clay, Mudstone | ||
| G39038 | -30.6609 | 24.1614 | 9 | 200 | 5 | 13 | 4.23 | 1256 | 4, 7- 9 | Sand-clay, Shale | ||
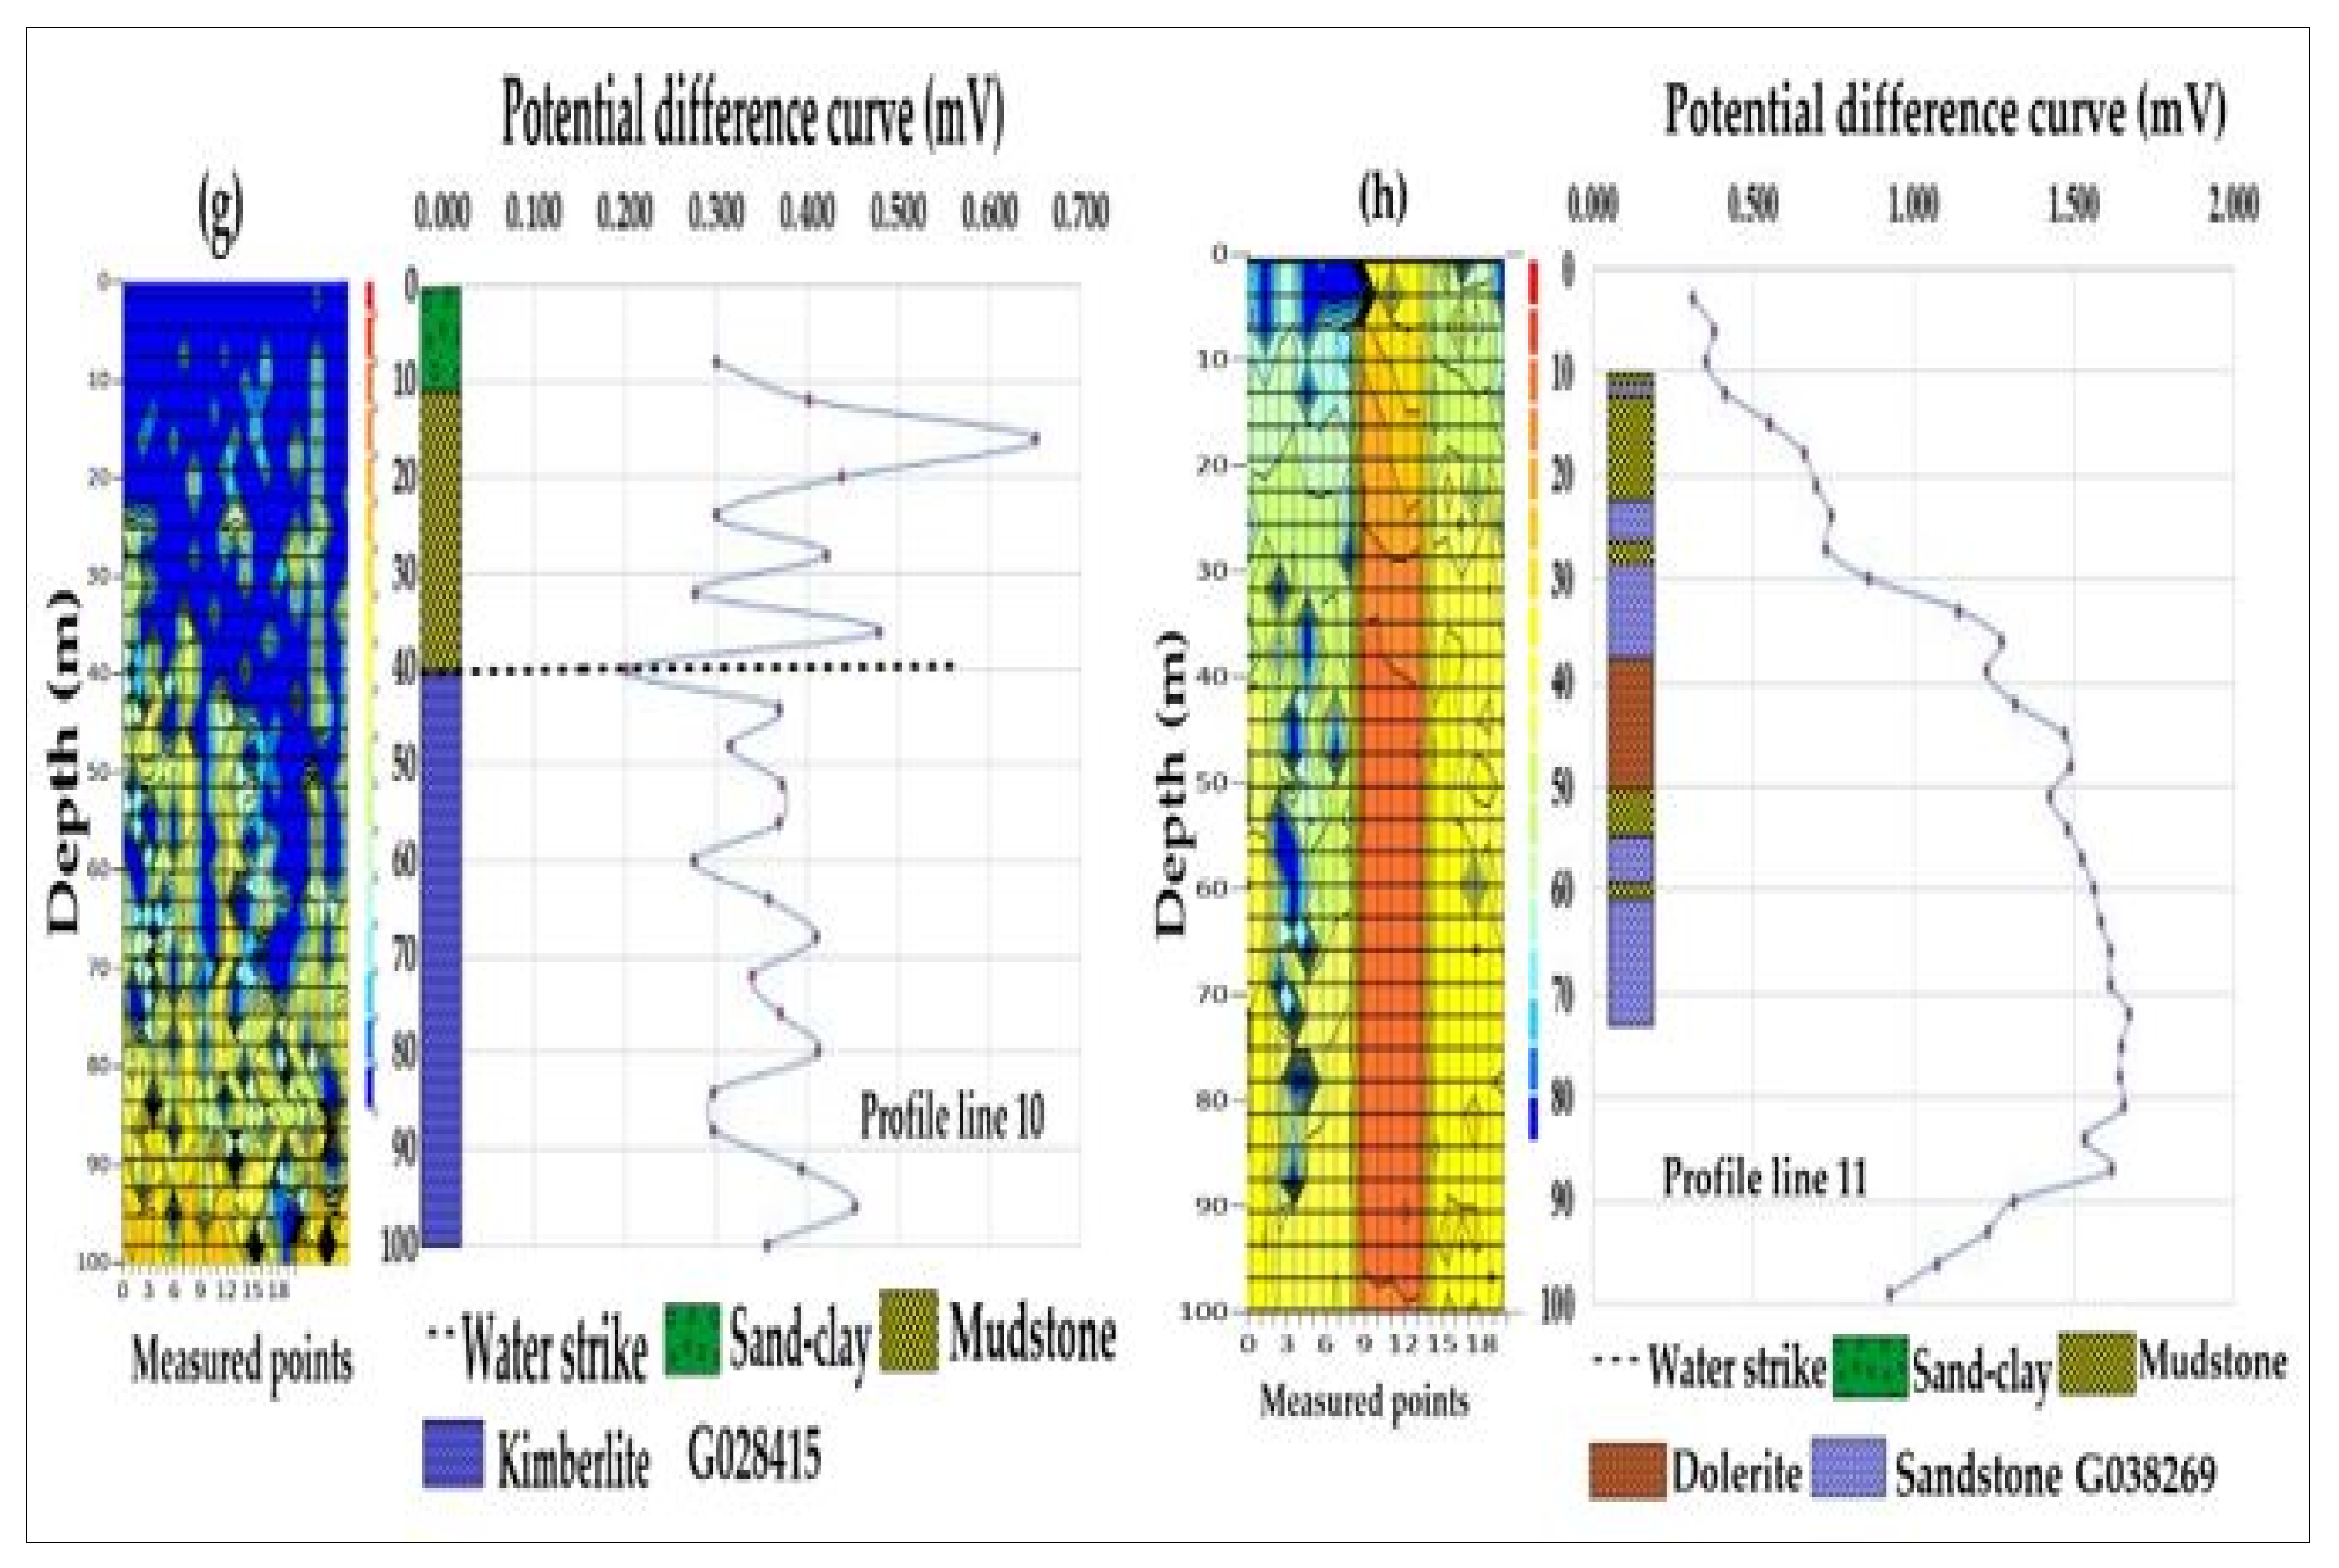
| Upper | G28415B | -30.6776 | 24.3648 | 10 | 250 | 6 | 103 | 7.03 | 1404 | 40 | Kimberlite | |
| G38269 | -30.7478 | 24.3667 | 11 | 250 | 6 | 60 | 9.89 | 1389 | 25, 29, 31 | Sandstone | 5.5 |
Disclaimer/Publisher’s Note: The statements, opinions and data contained in all publications are solely those of the individual author(s) and contributor(s) and not of MDPI and/or the editor(s). MDPI and/or the editor(s) disclaim responsibility for any injury to people or property resulting from any ideas, methods, instructions or products referred to in the content. |
© 2024 by the authors. Licensee MDPI, Basel, Switzerland. This article is an open access article distributed under the terms and conditions of the Creative Commons Attribution (CC BY) license (http://creativecommons.org/licenses/by/4.0/).


