Submitted:
23 July 2024
Posted:
24 July 2024
You are already at the latest version
Abstract
Keywords:
1. Introduction
- the reference cycle and also the most important cycle modifications are analyzed;
- the optimum operating conditions are more exhaustively explained by means of a comprehensive exergy analysis including the entire cycle, not just the irreversibility in the gas cooler;
- the performance is assessed with reference to a constant heat demand, while in the literature the compressor displacement is often taken constant, and taking into account a wide range of possible rated operating conditions (with regard to the temperature profile of the heat sink and the ambient temperature).
2. Methods
2.1. General Assumptions
2.2. Reference Cycle
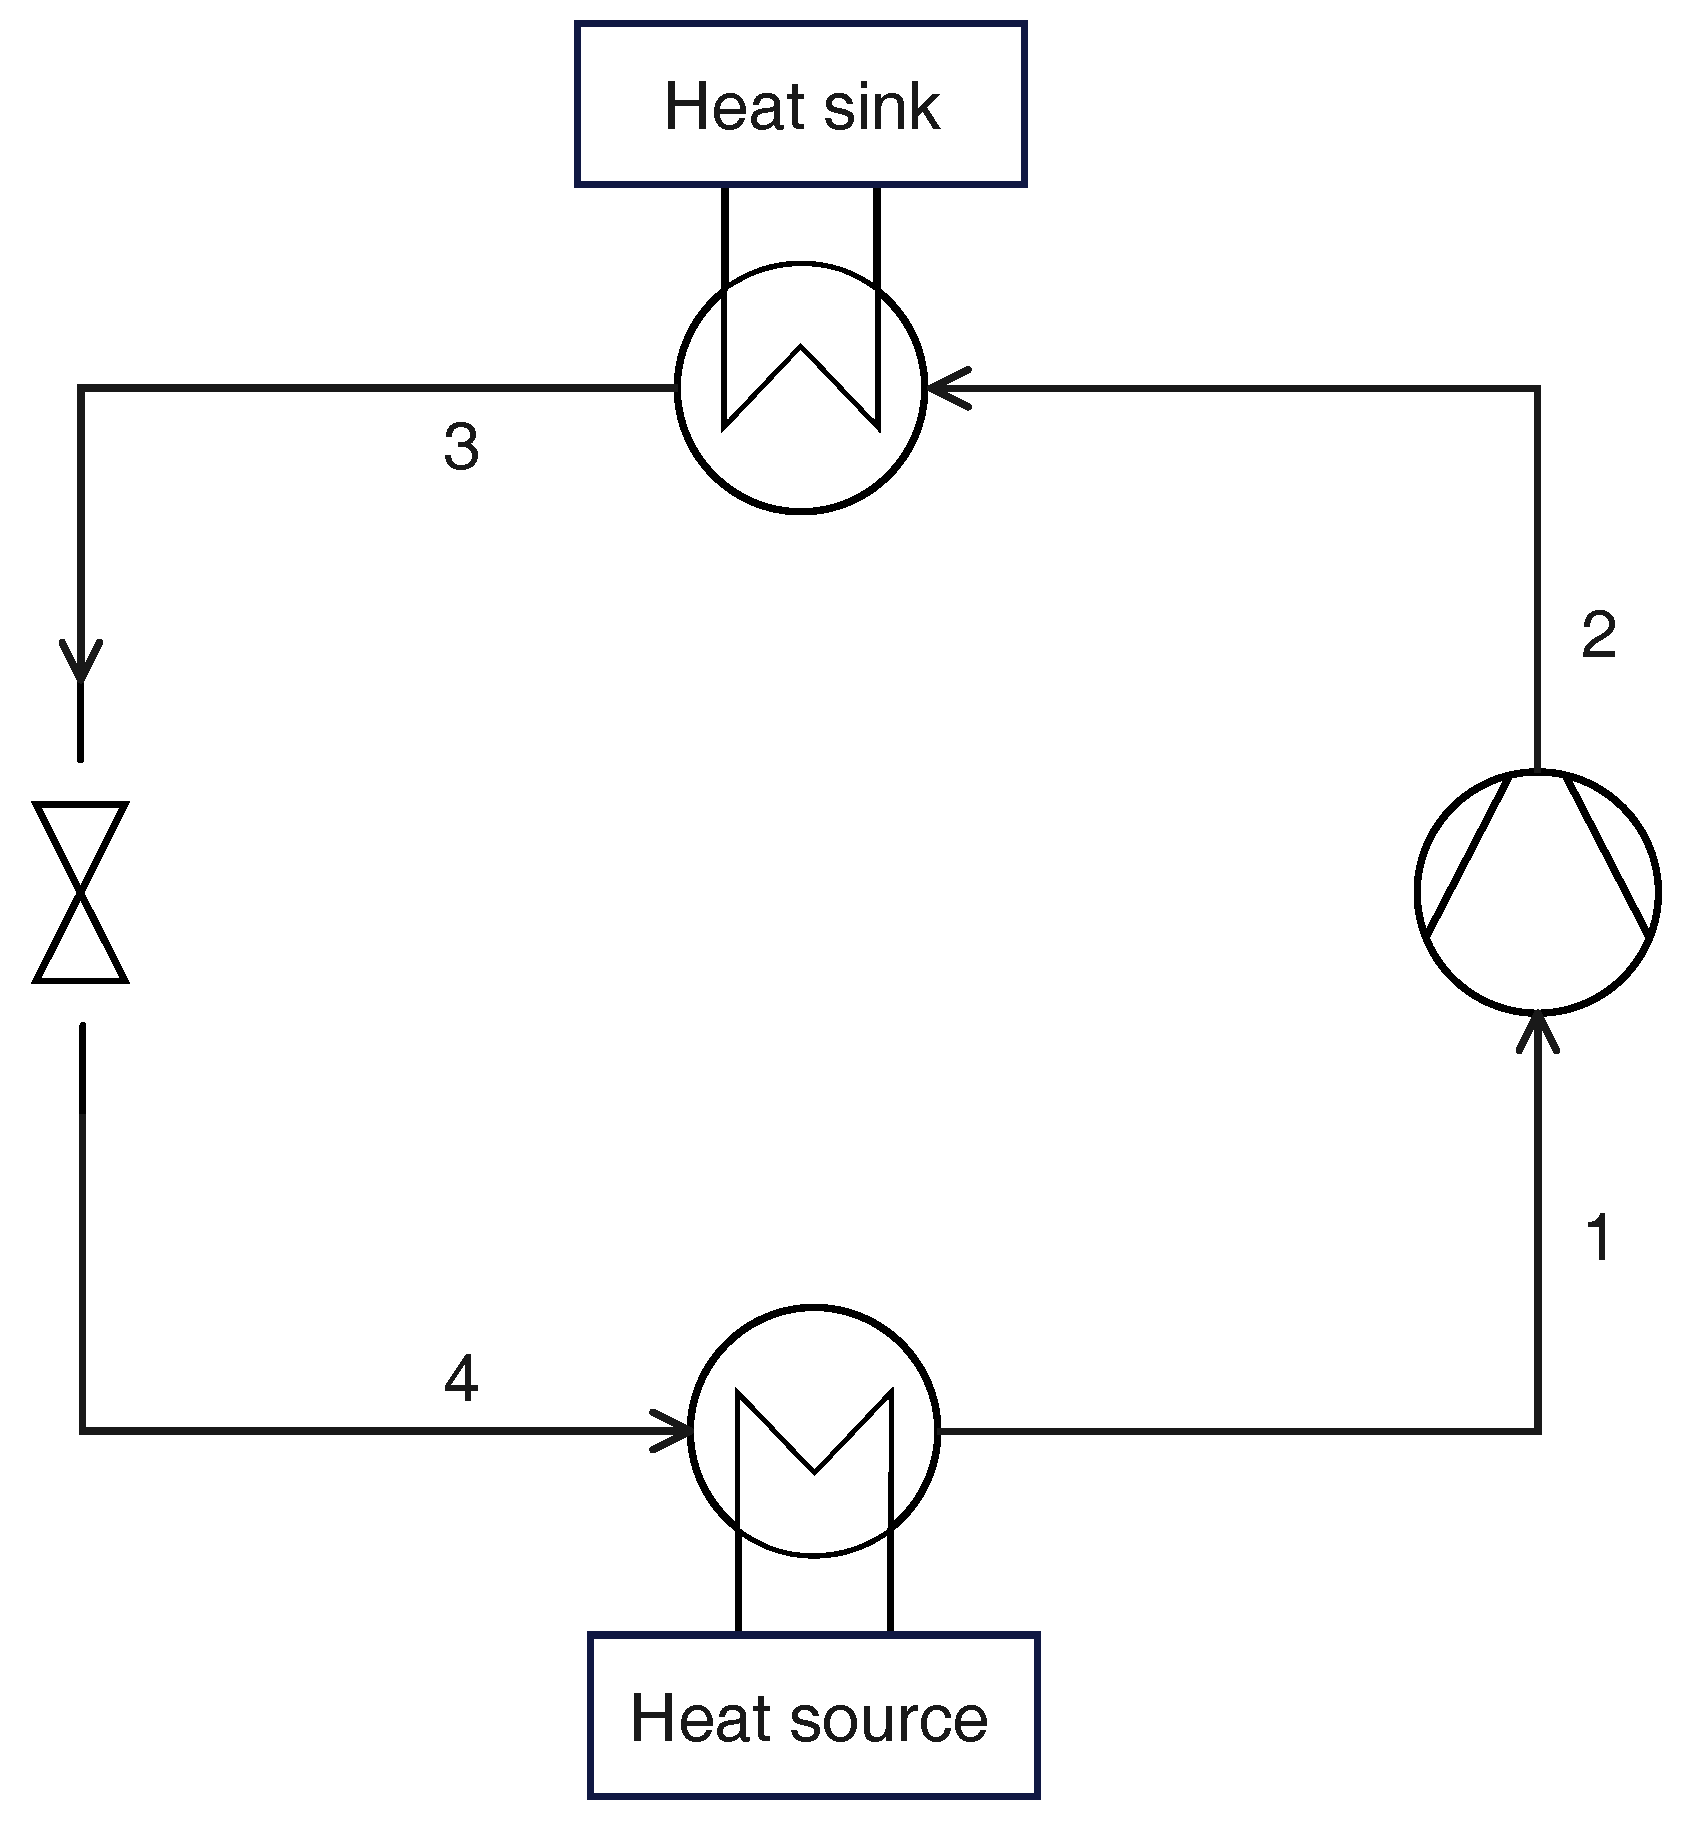
2.2.1. Thermodynamic States
- evaporation temperature , with the corresponding pressure ;
- superheating at the compressor inlet ;
- gas cooler pressure ;
- temperature at the gas cooler exit .
2.2.2. Cycle Performance
2.2.3. Design Parameters
- : rate of heat transferred in the gas cooler;
- : water inlet temperature at the gas cooler;
- : water temperature glide in the gas cooler;
- : minimum temperature difference between CO2 and water in the gas cooler;
- : air inlet temperature in the evaporator;
- : air temperature decrease in the evaporator;
- : minimum temperature difference between air and CO2 in the evaporator;
- : superheating at the compressor inlet;
- : compressor overall efficiency;
- : compressor mechanical efficiency;
- : gas cooler pressure.
2.2.4. Constrained Optimization
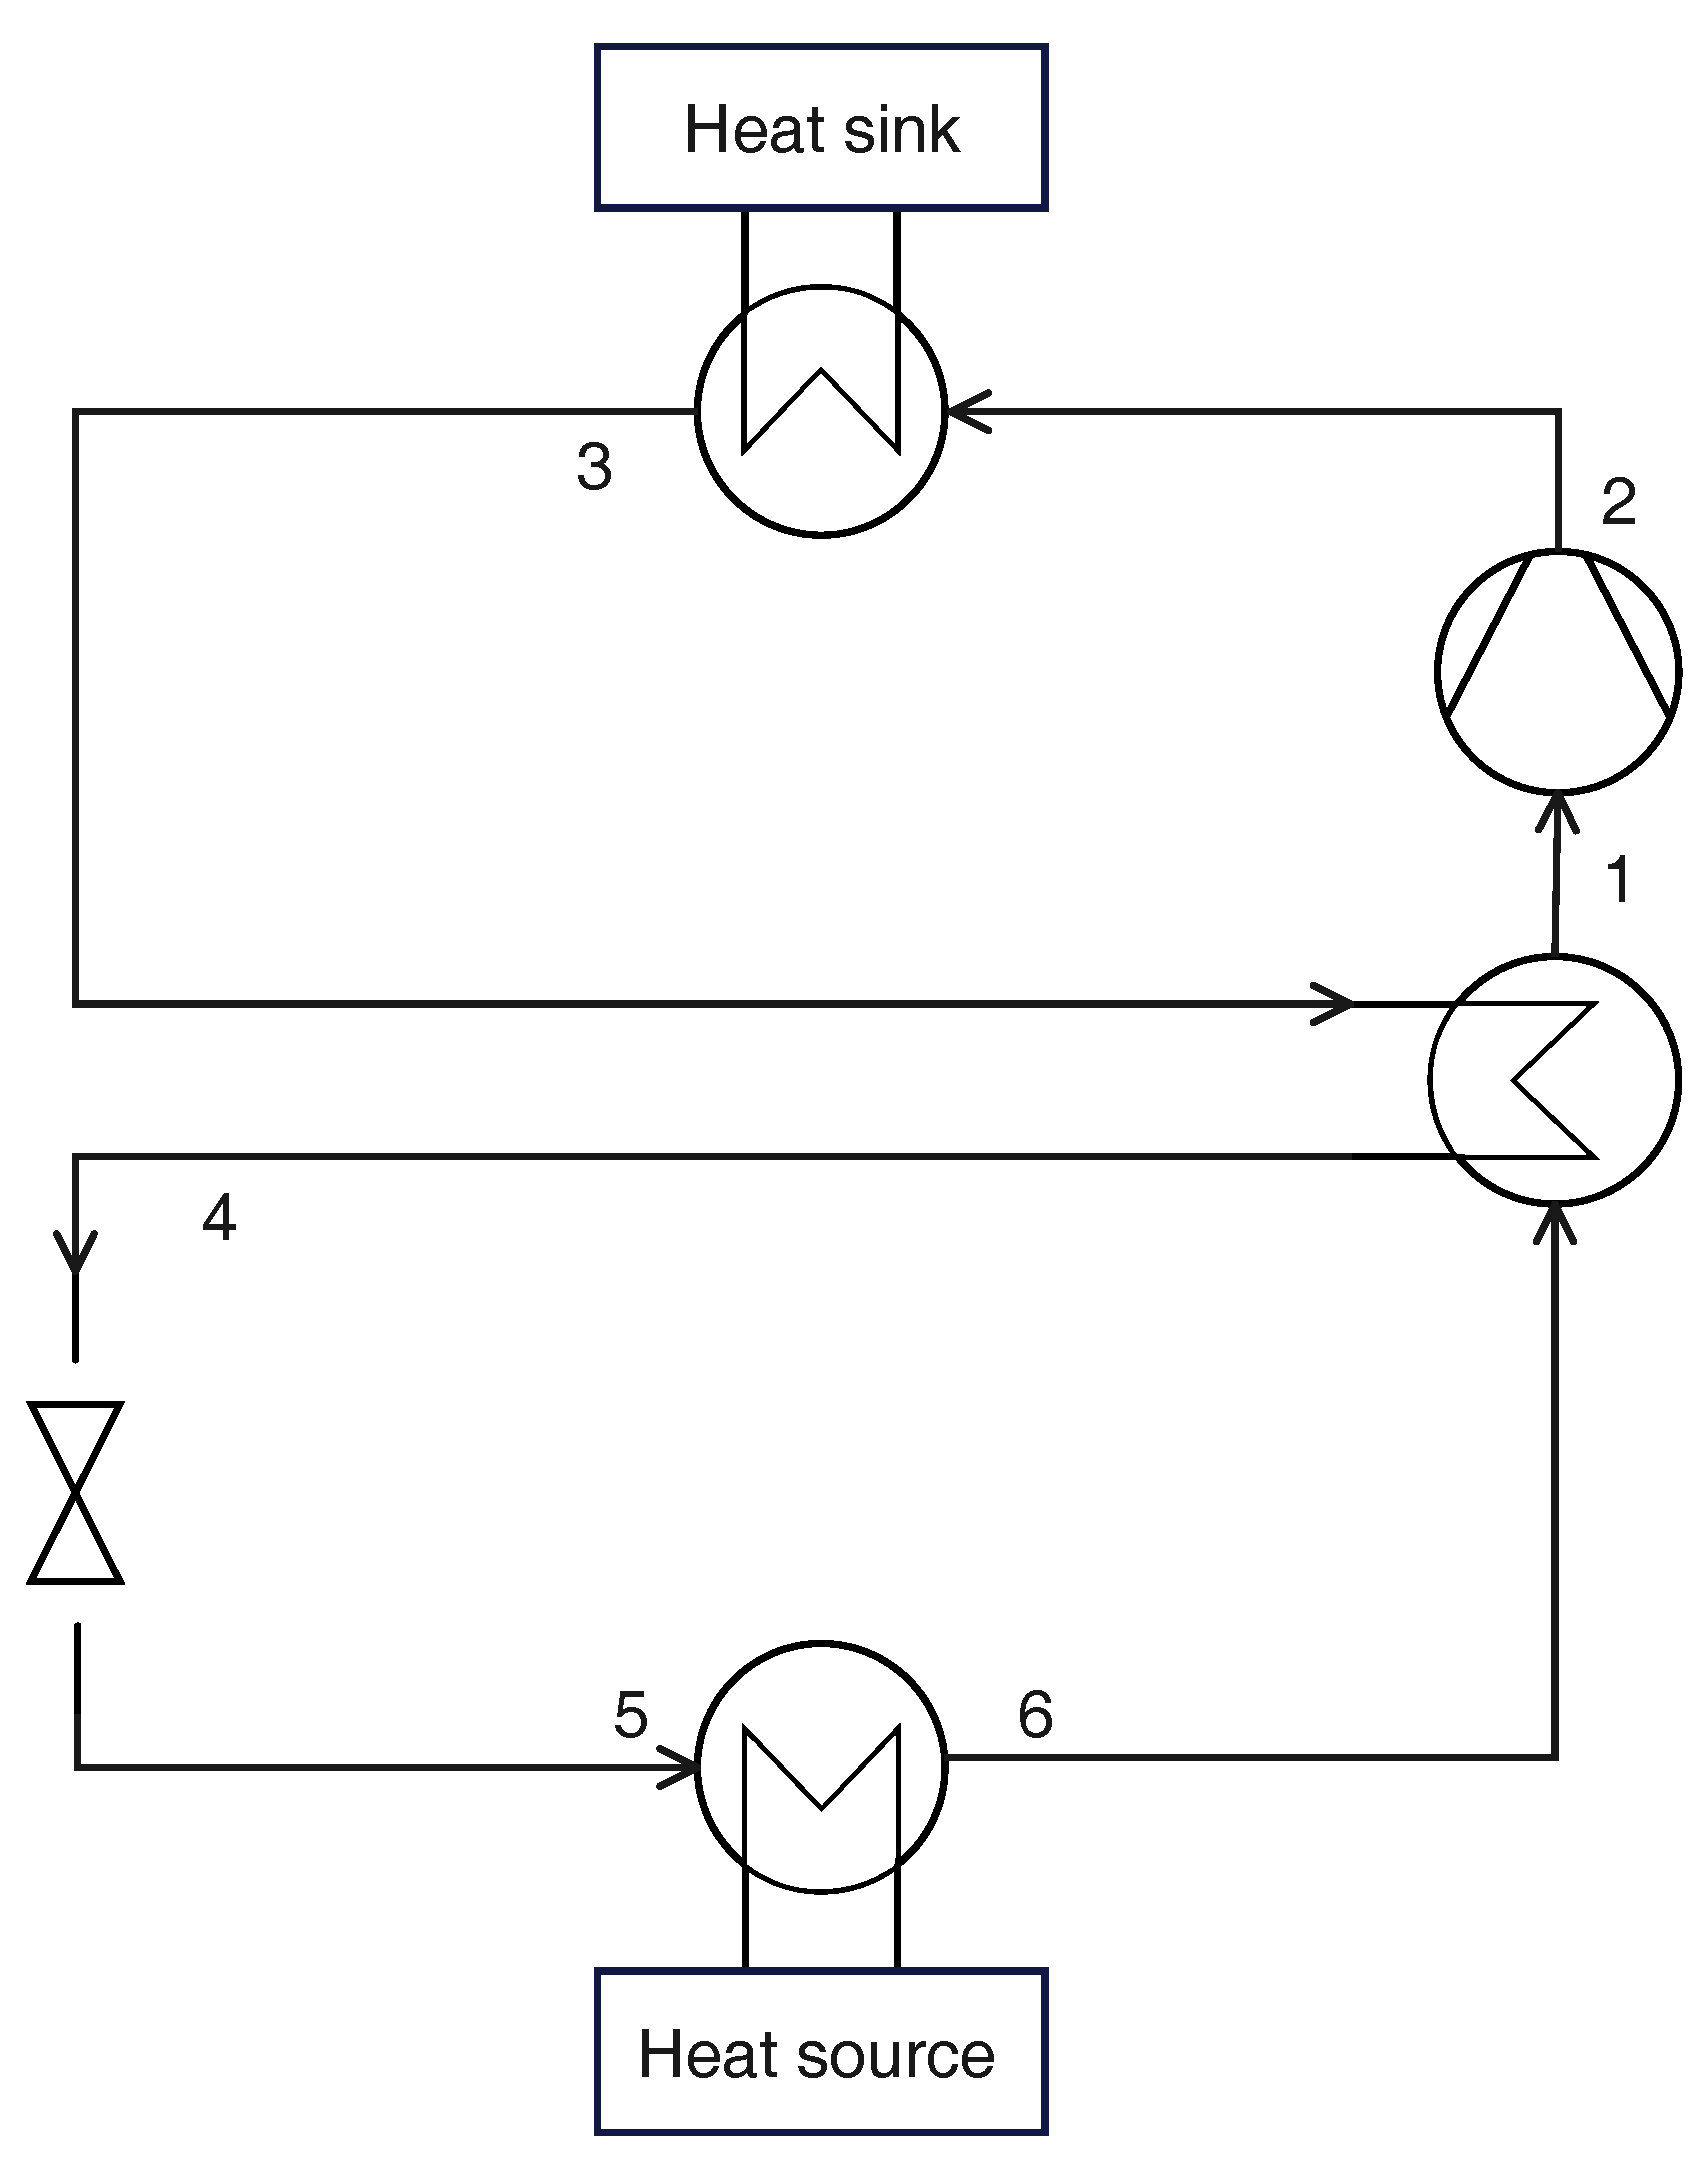
2.3. Cycle with Internal Heat Exchanger
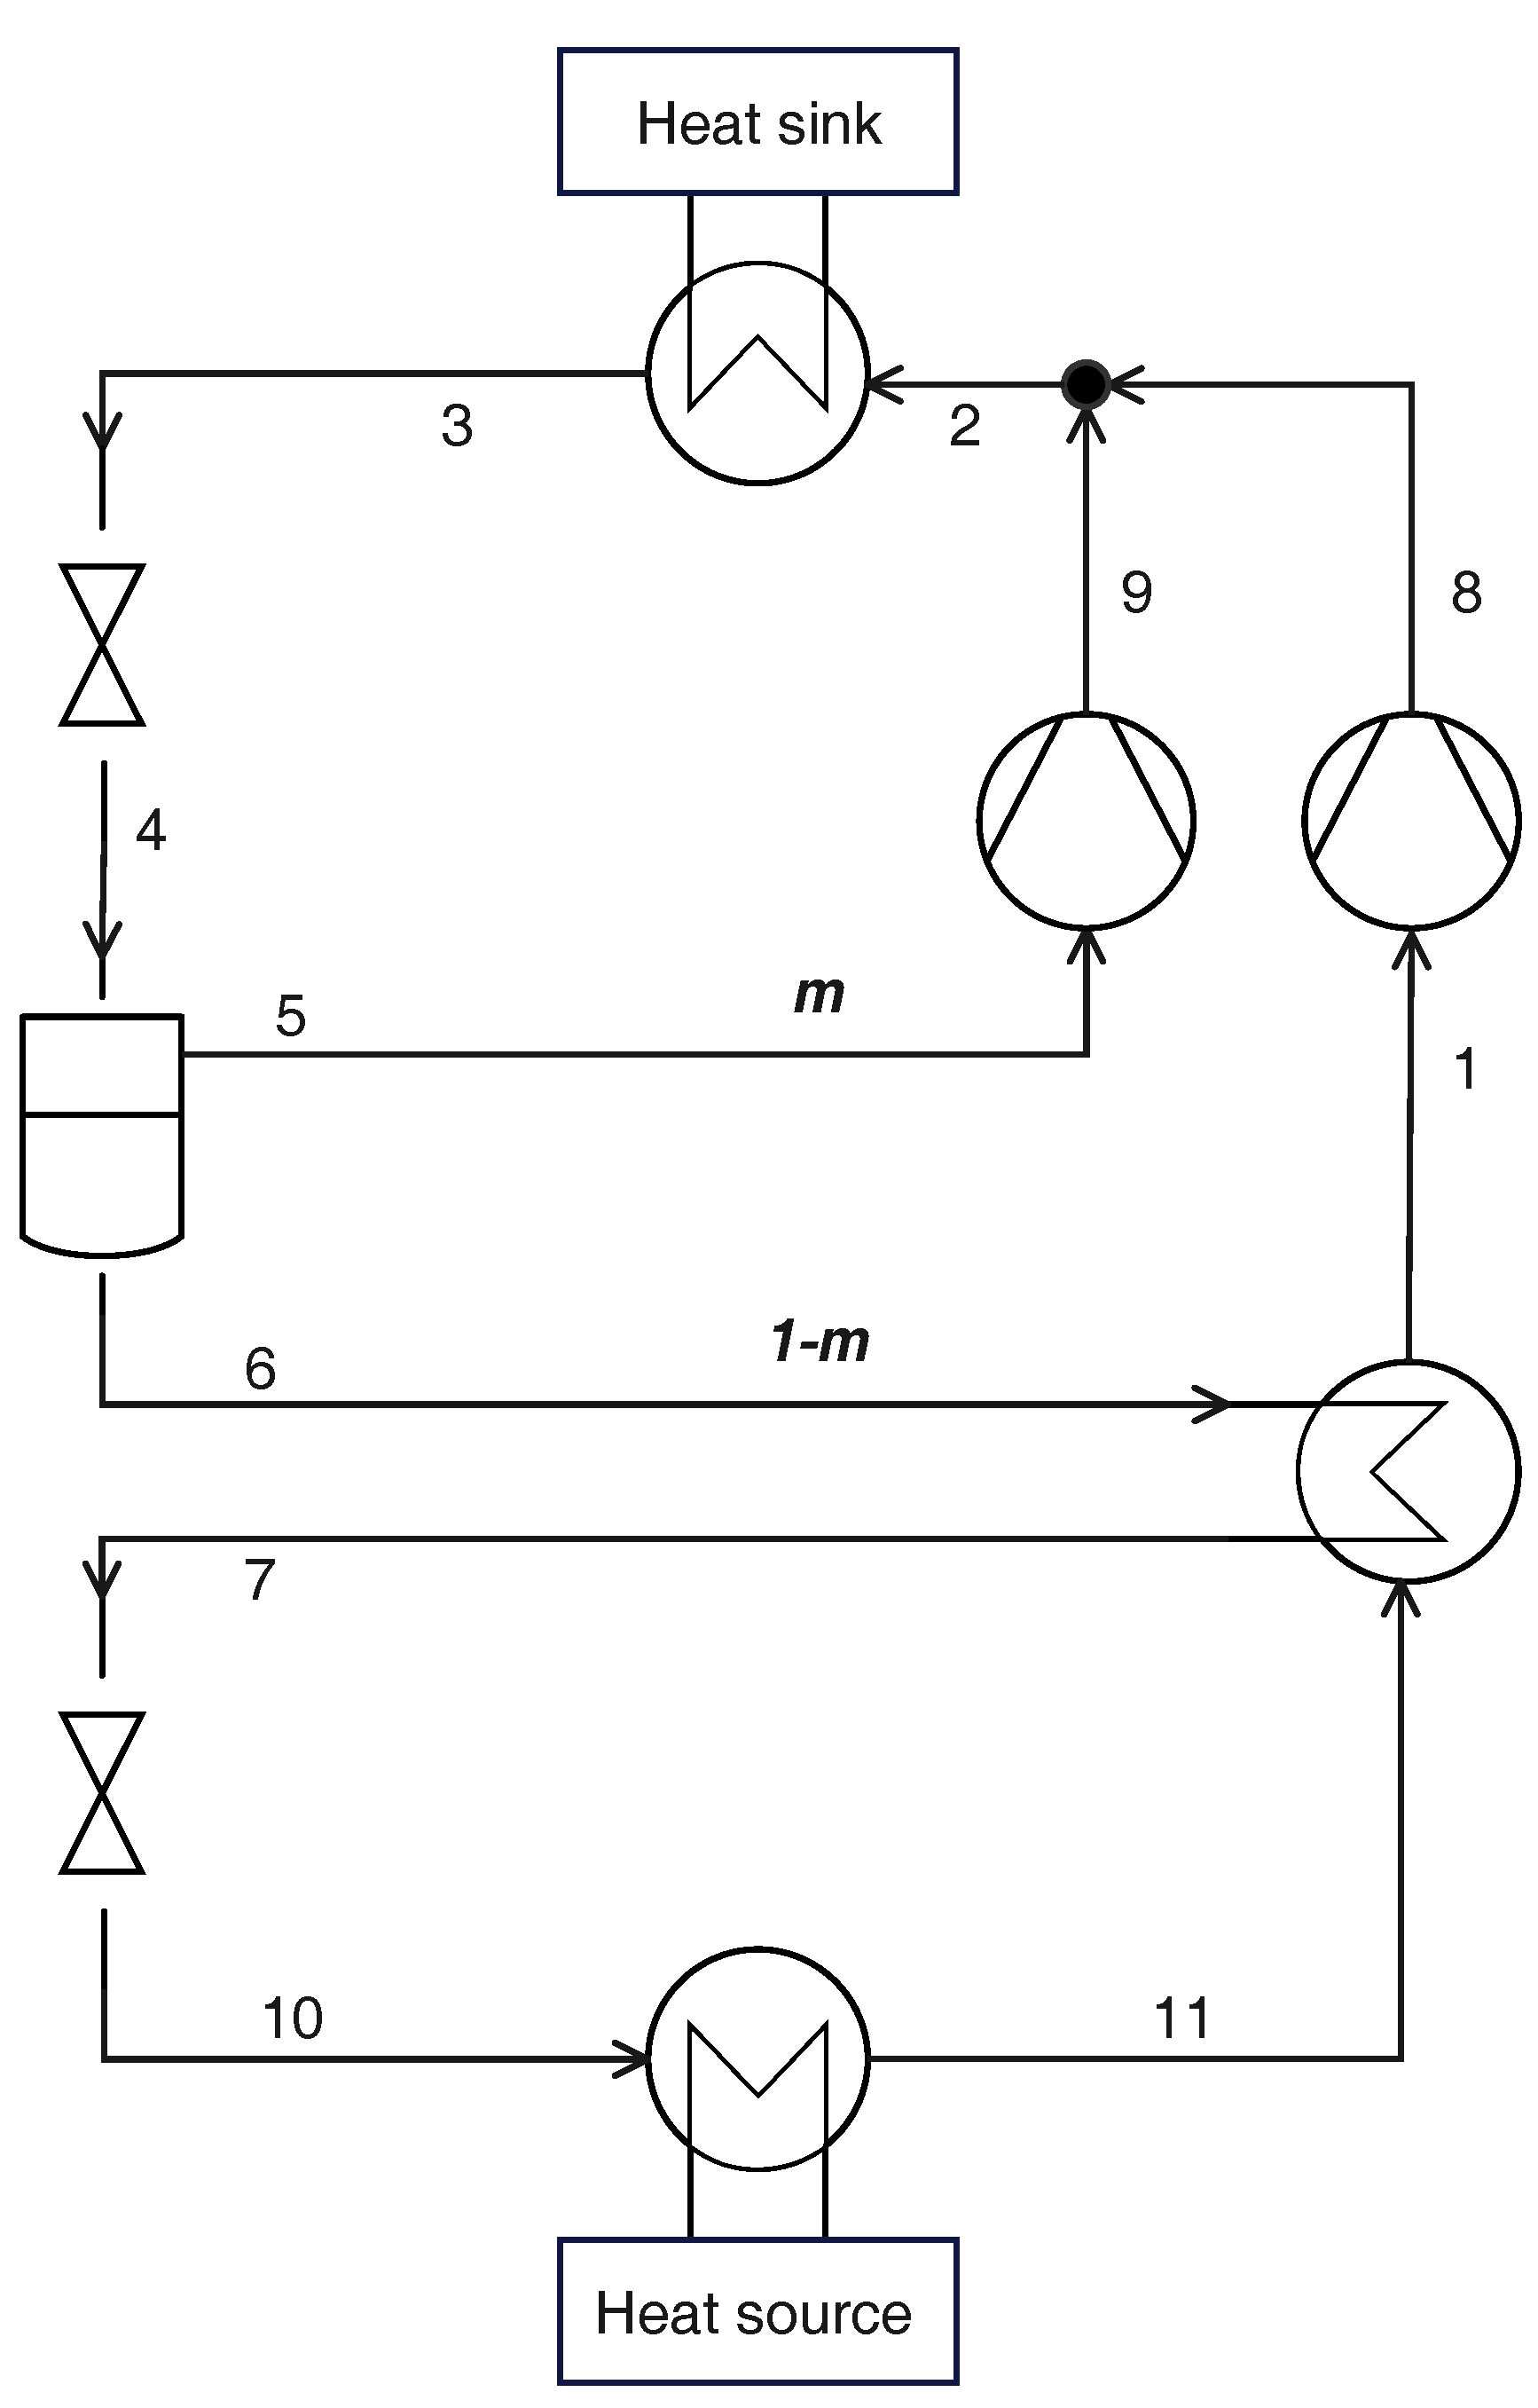
2.4. Parallel Compression
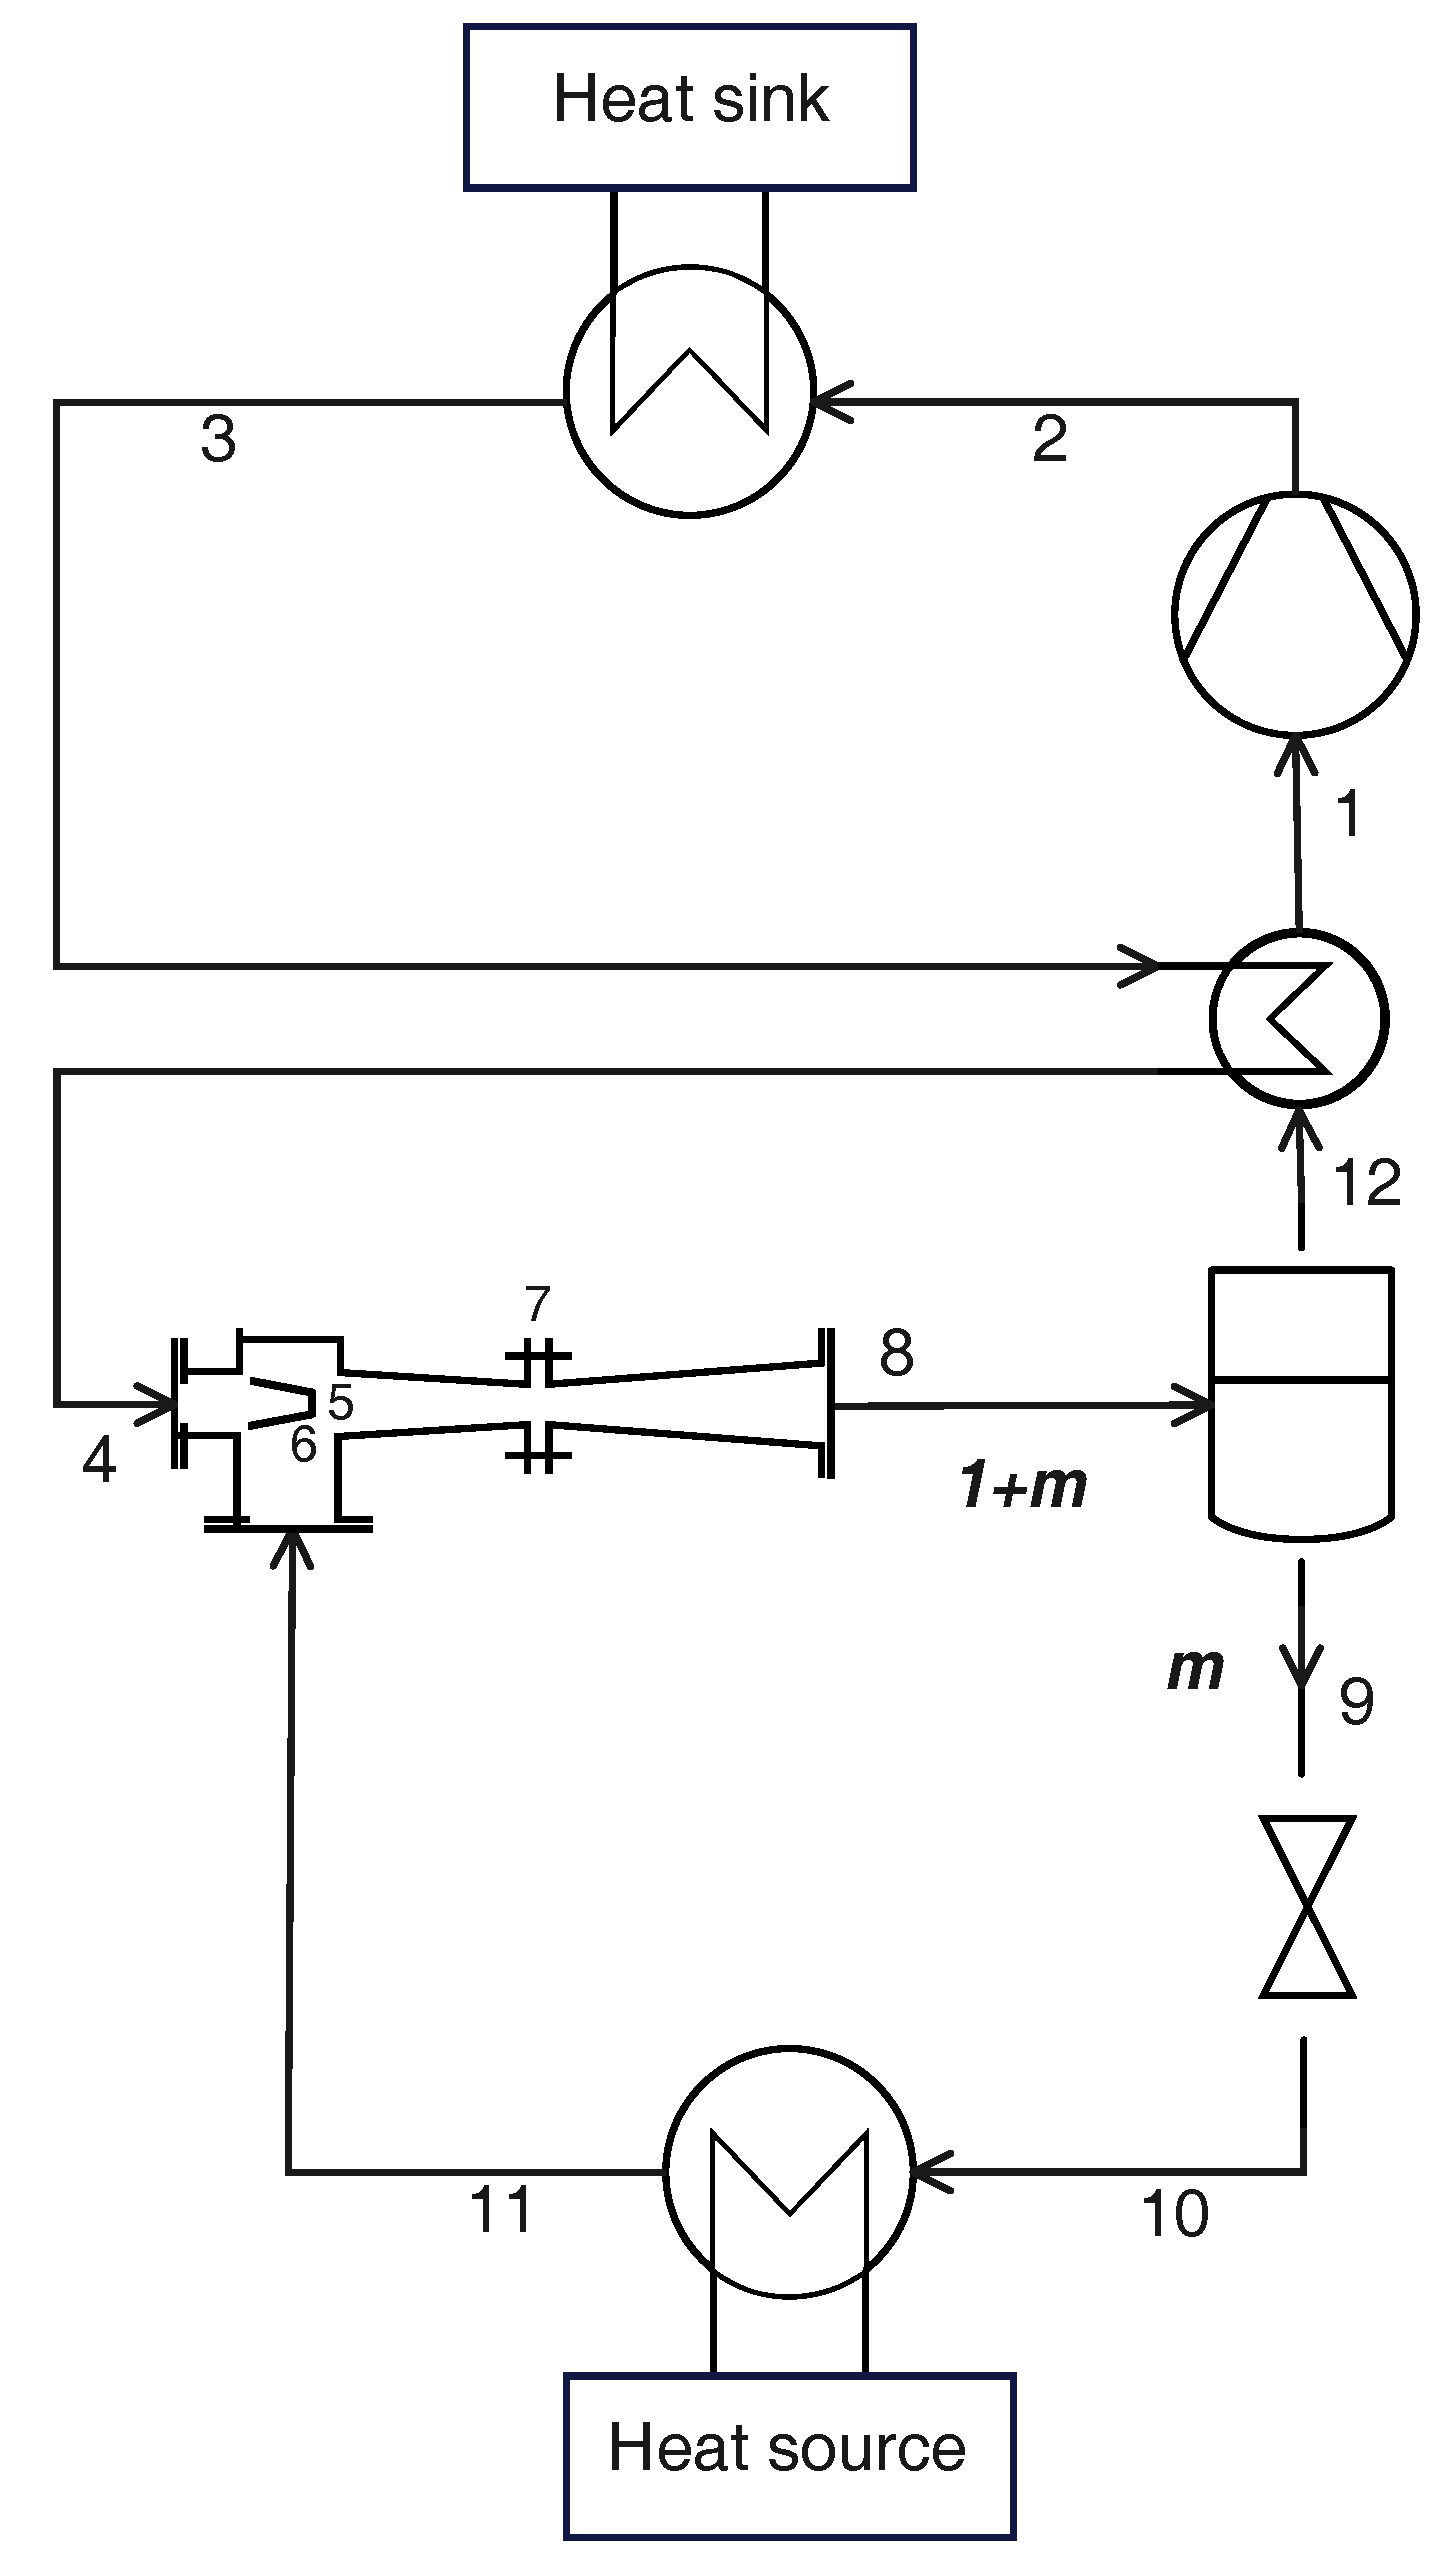
2.5. Cycle with Ejector
3. Results and Discussion
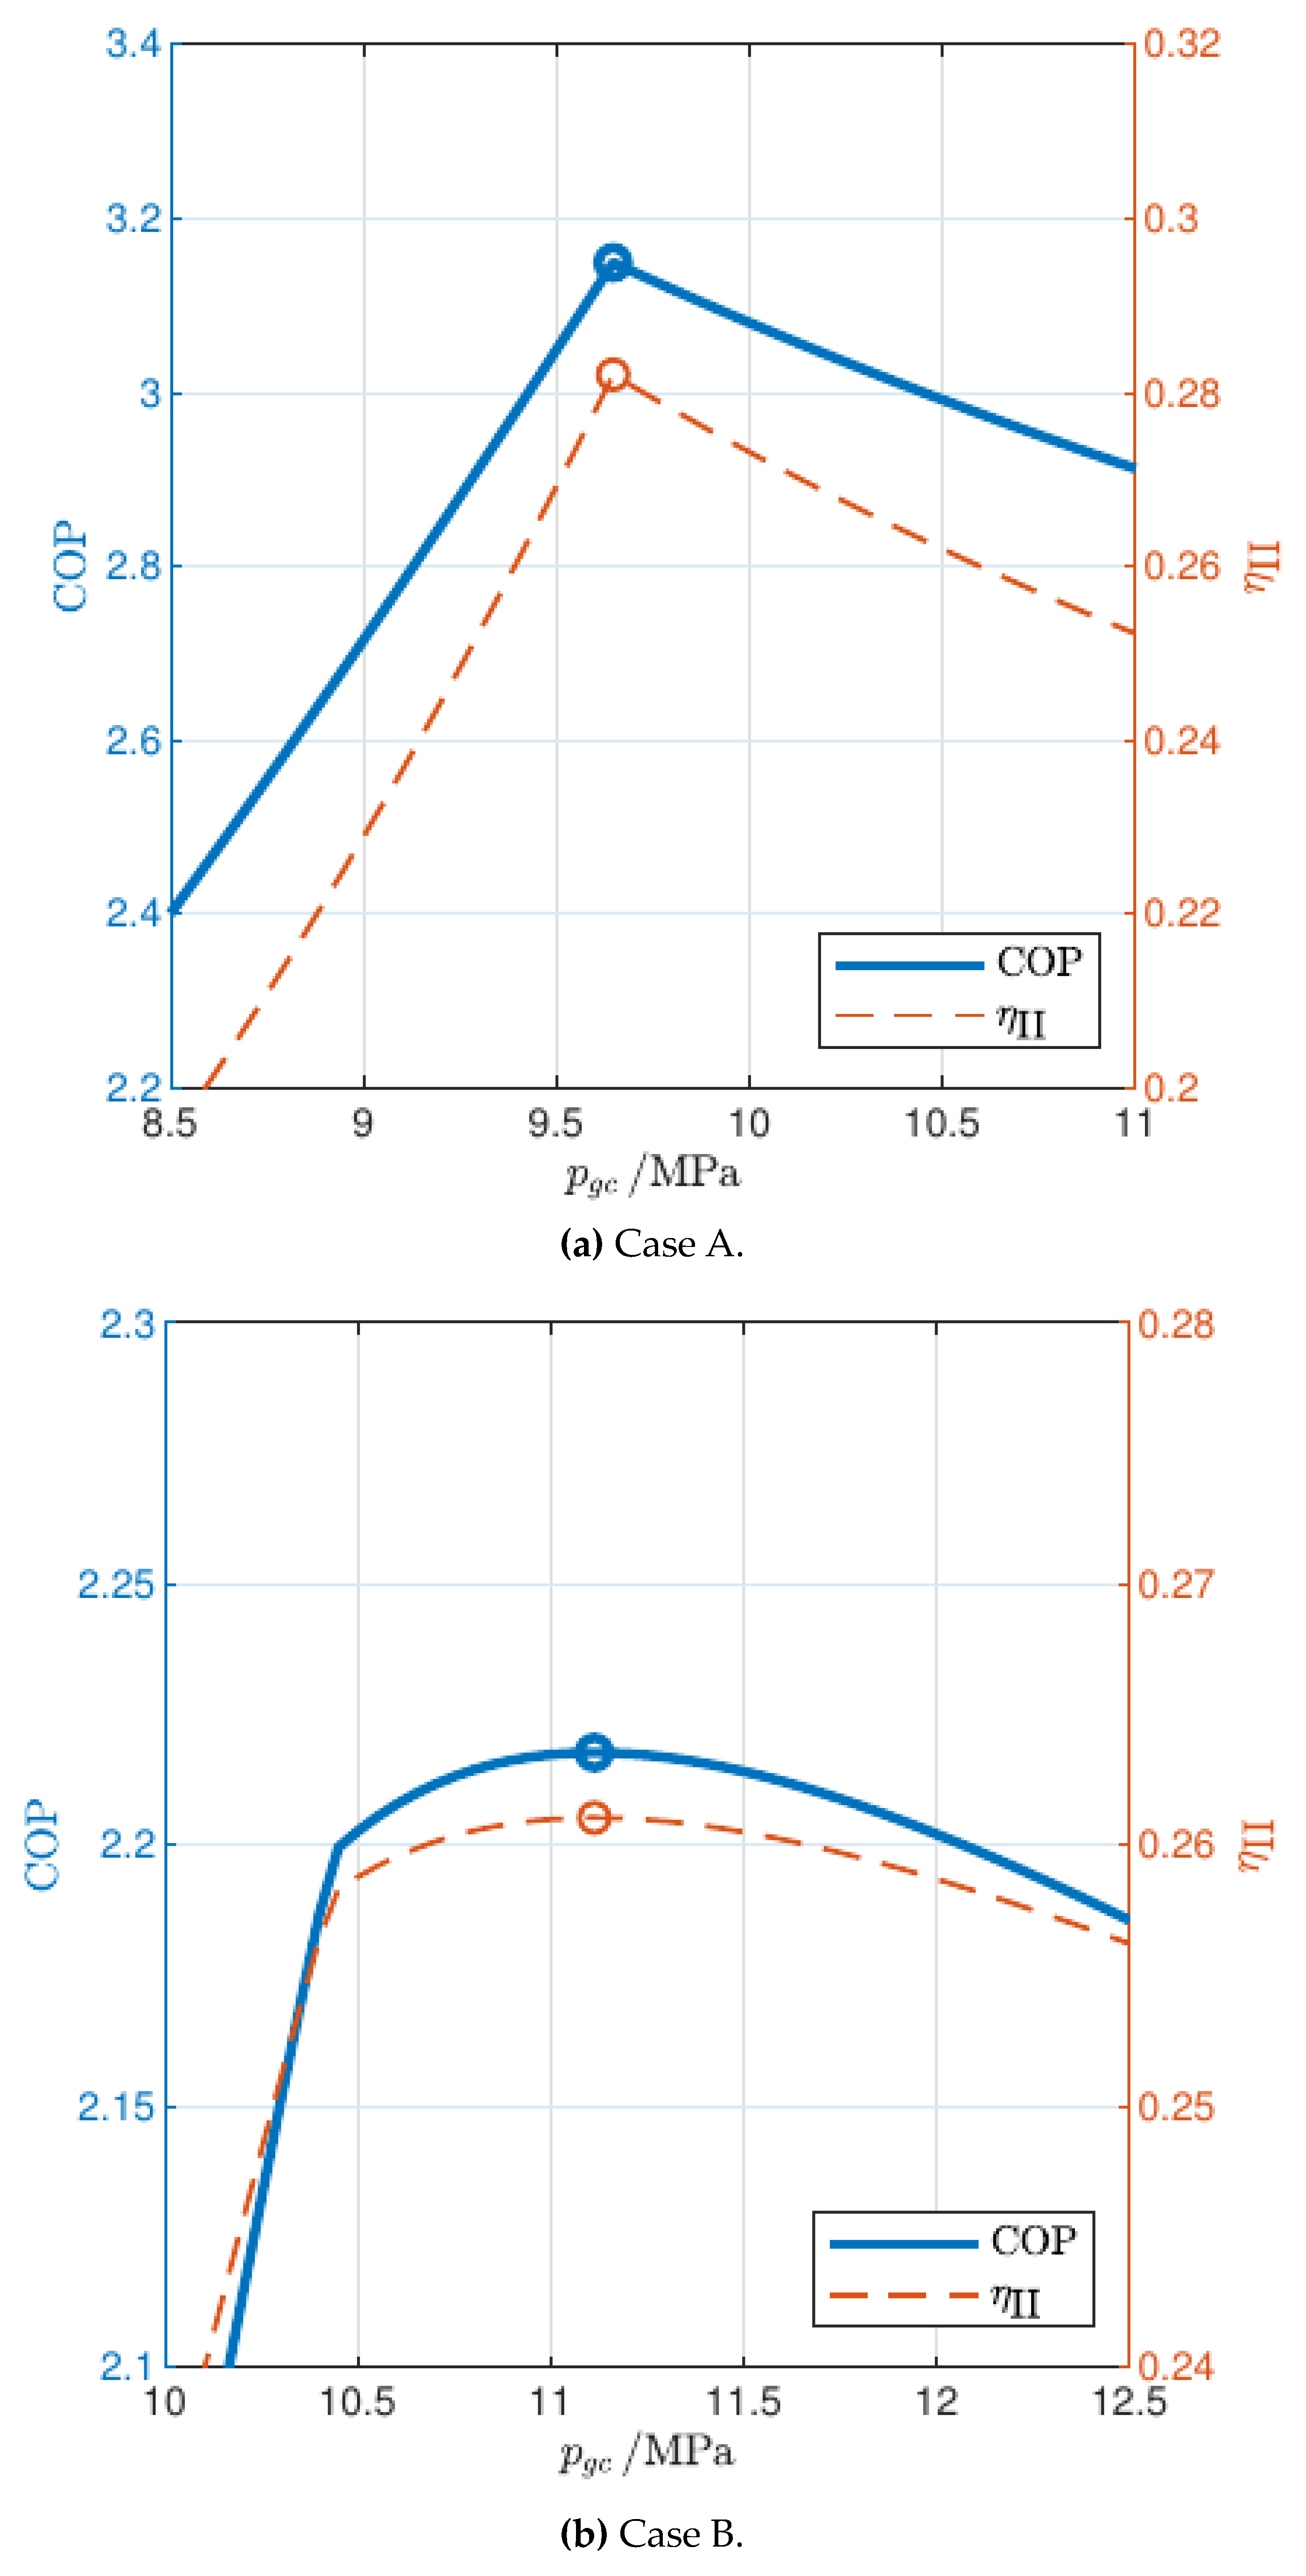
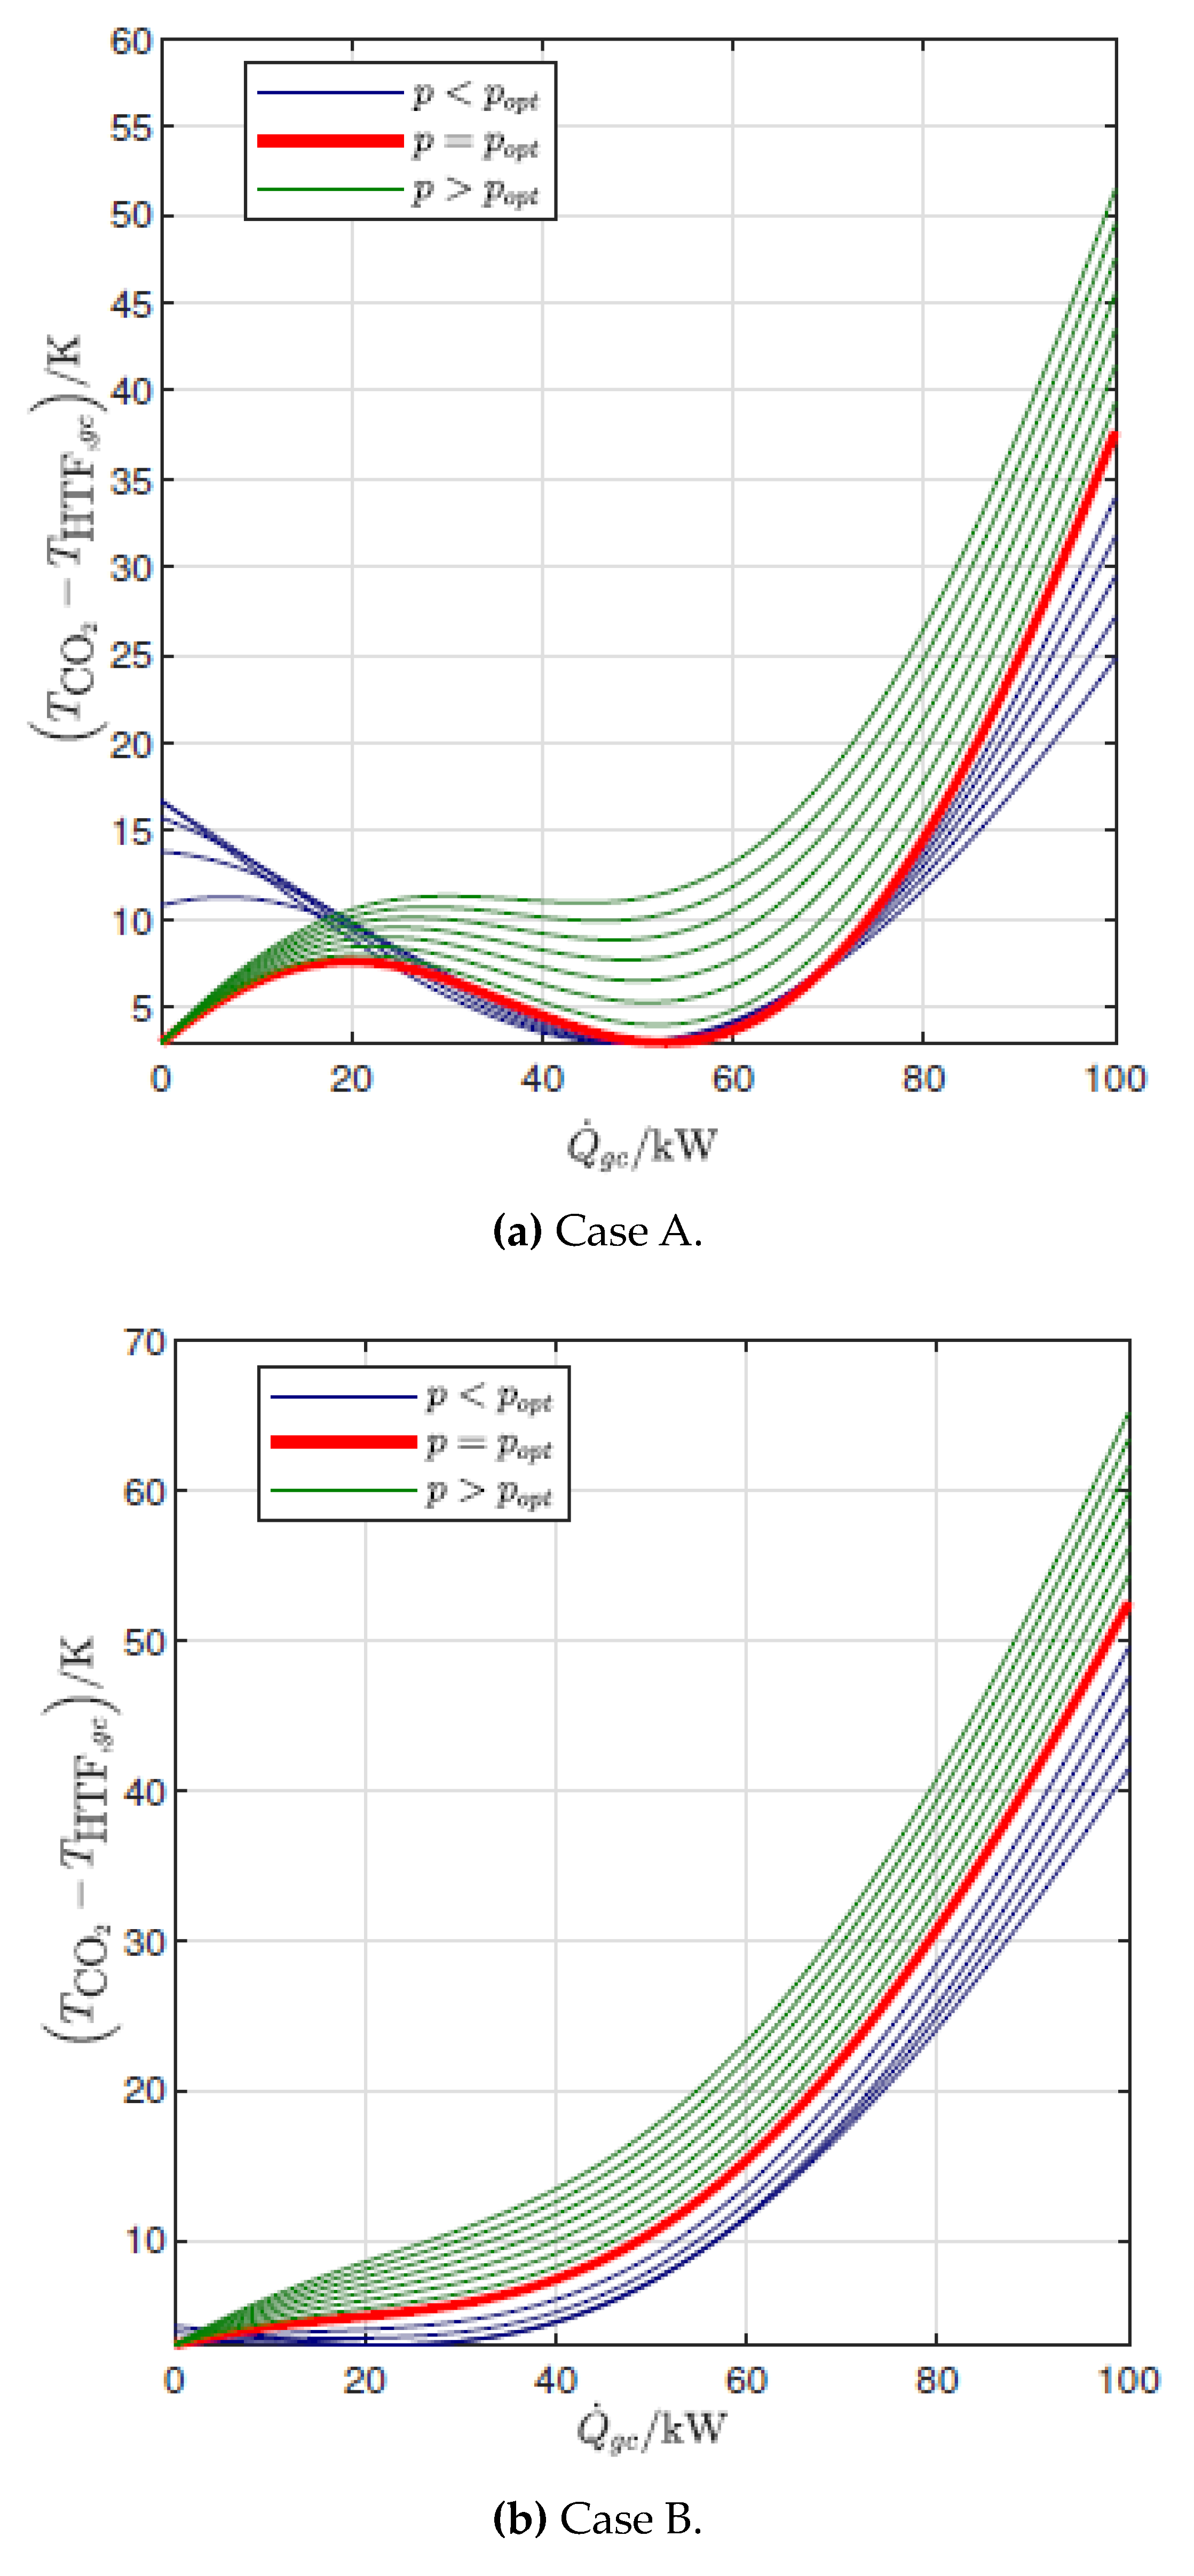
3.1. Influence of Gas Cooler Pressure (Cycle Optimization)
3.2. Optimized Cycles: Influence of End-User Temperature Profile and Ambient Temperature
3.2.1. Reference Cycle
3.2.2. Cycle Modifications
4. Conclusions
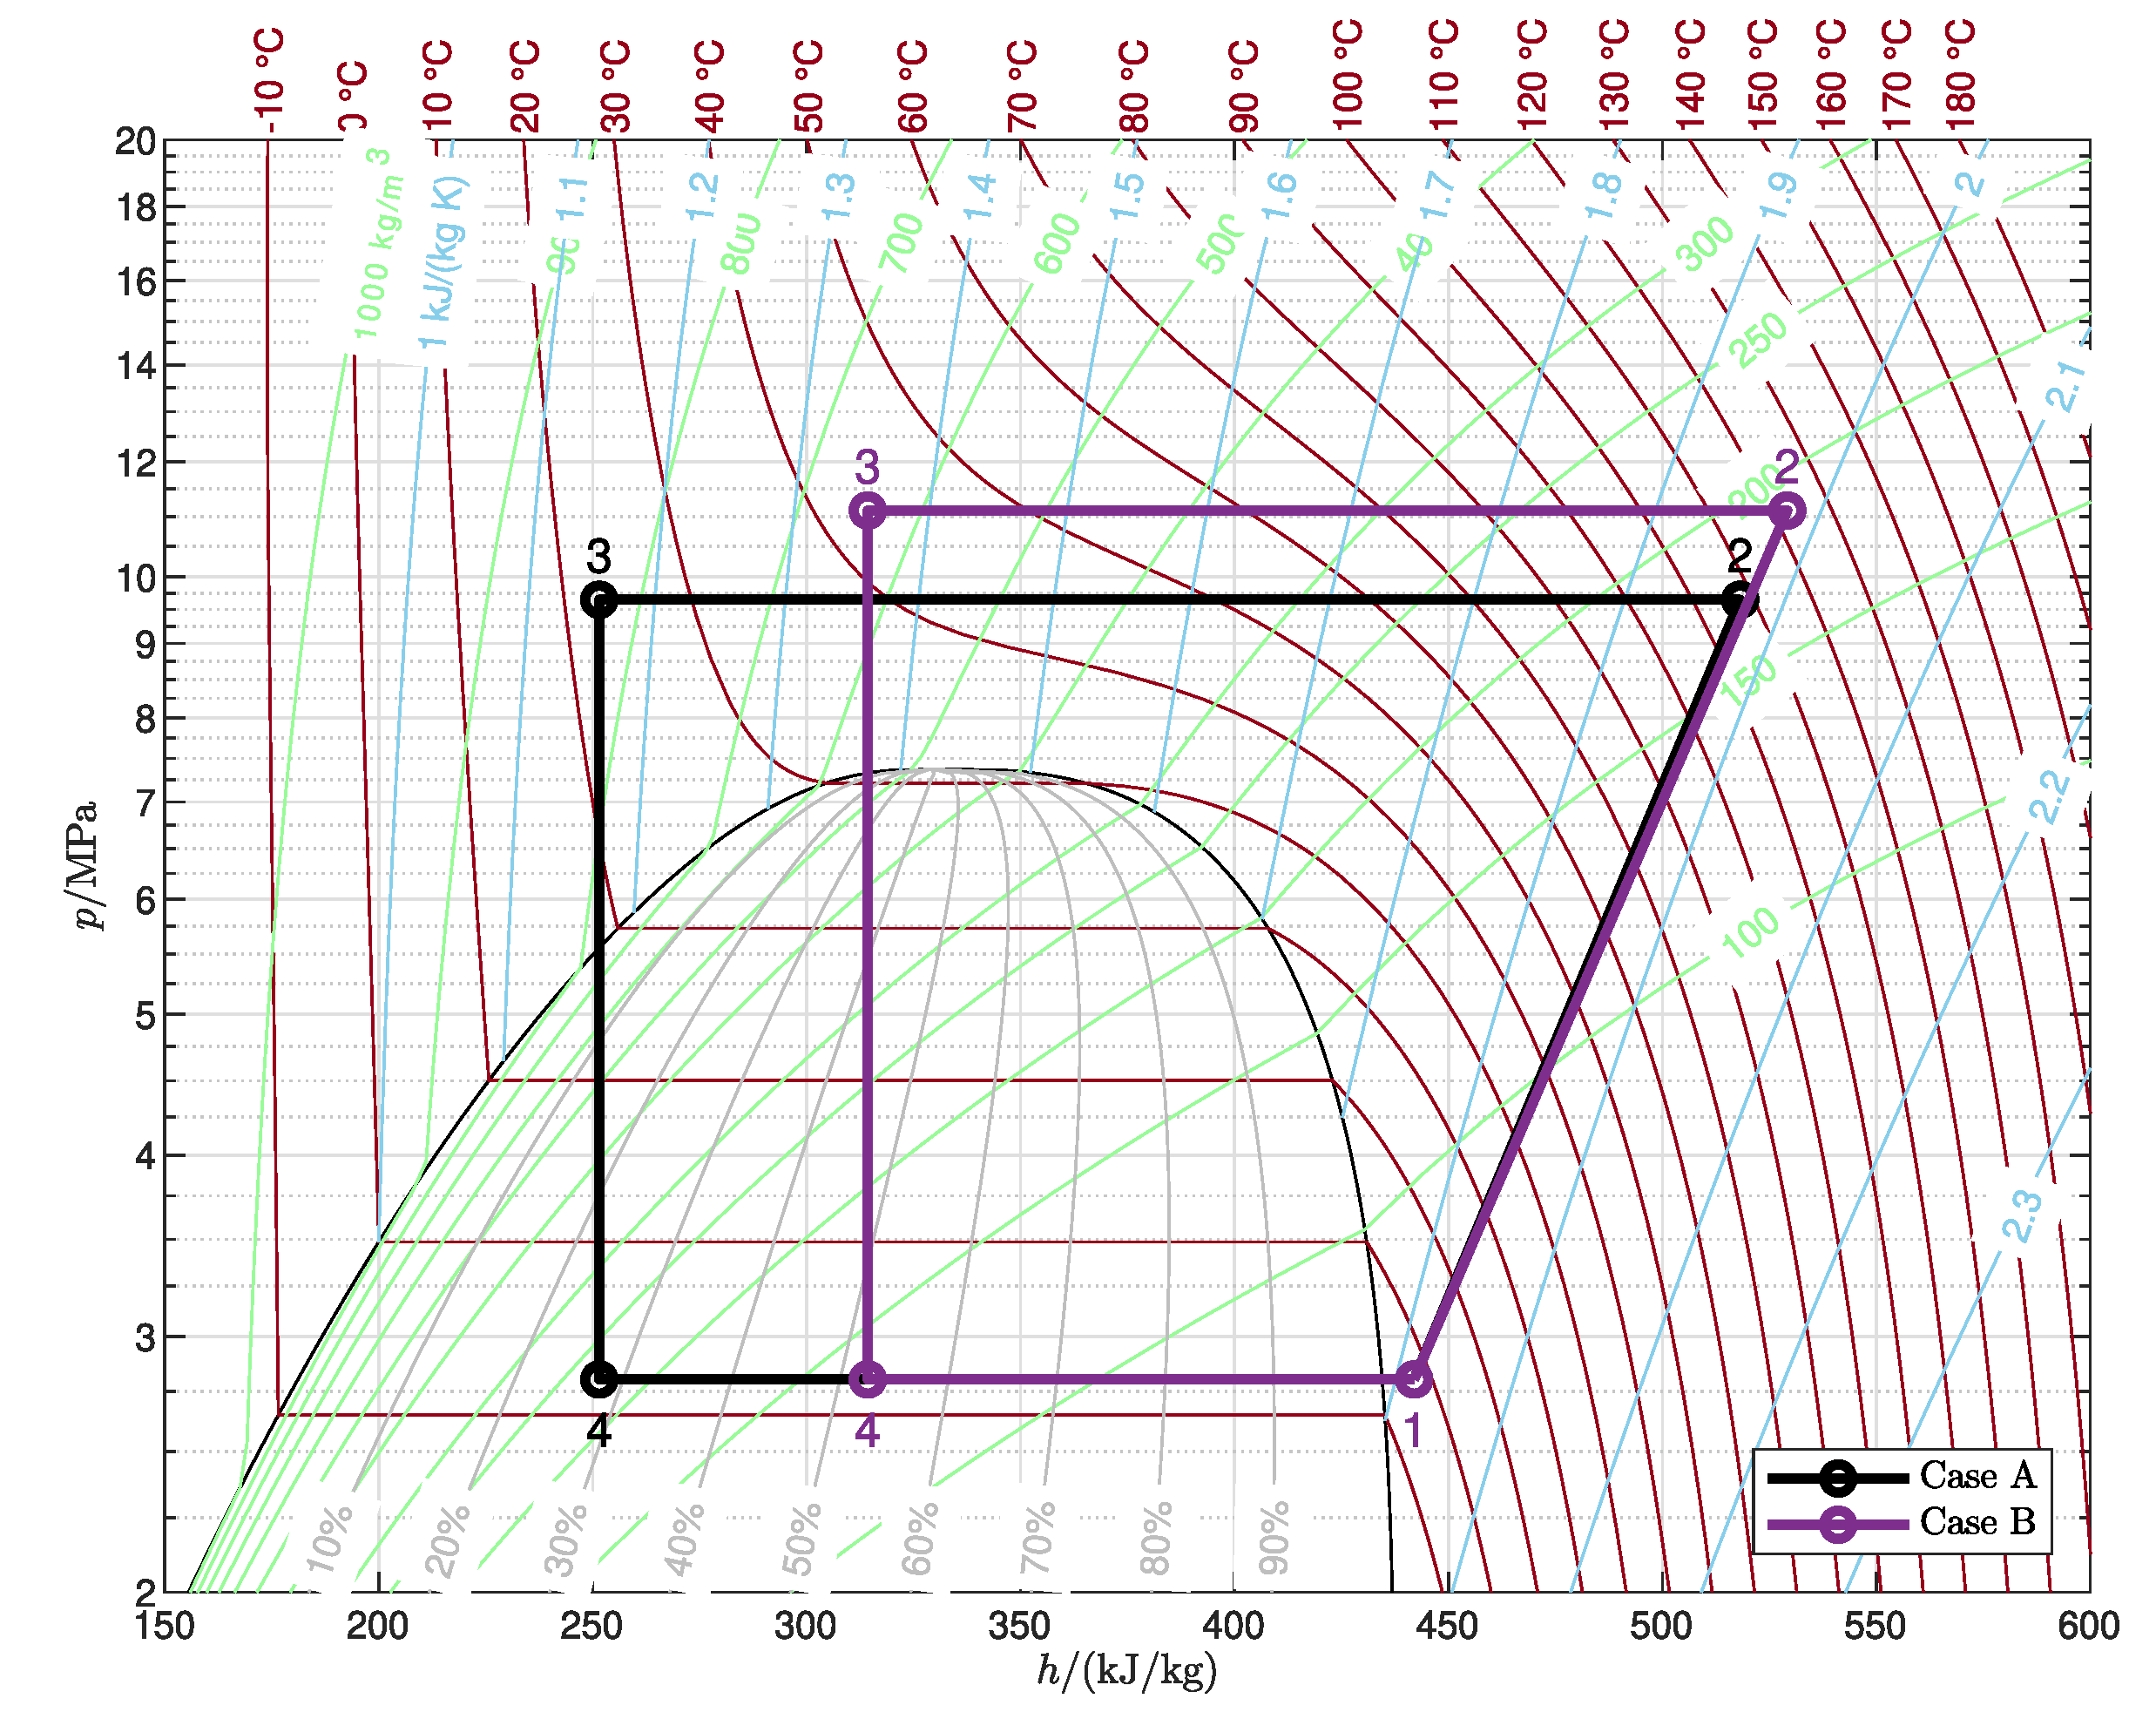
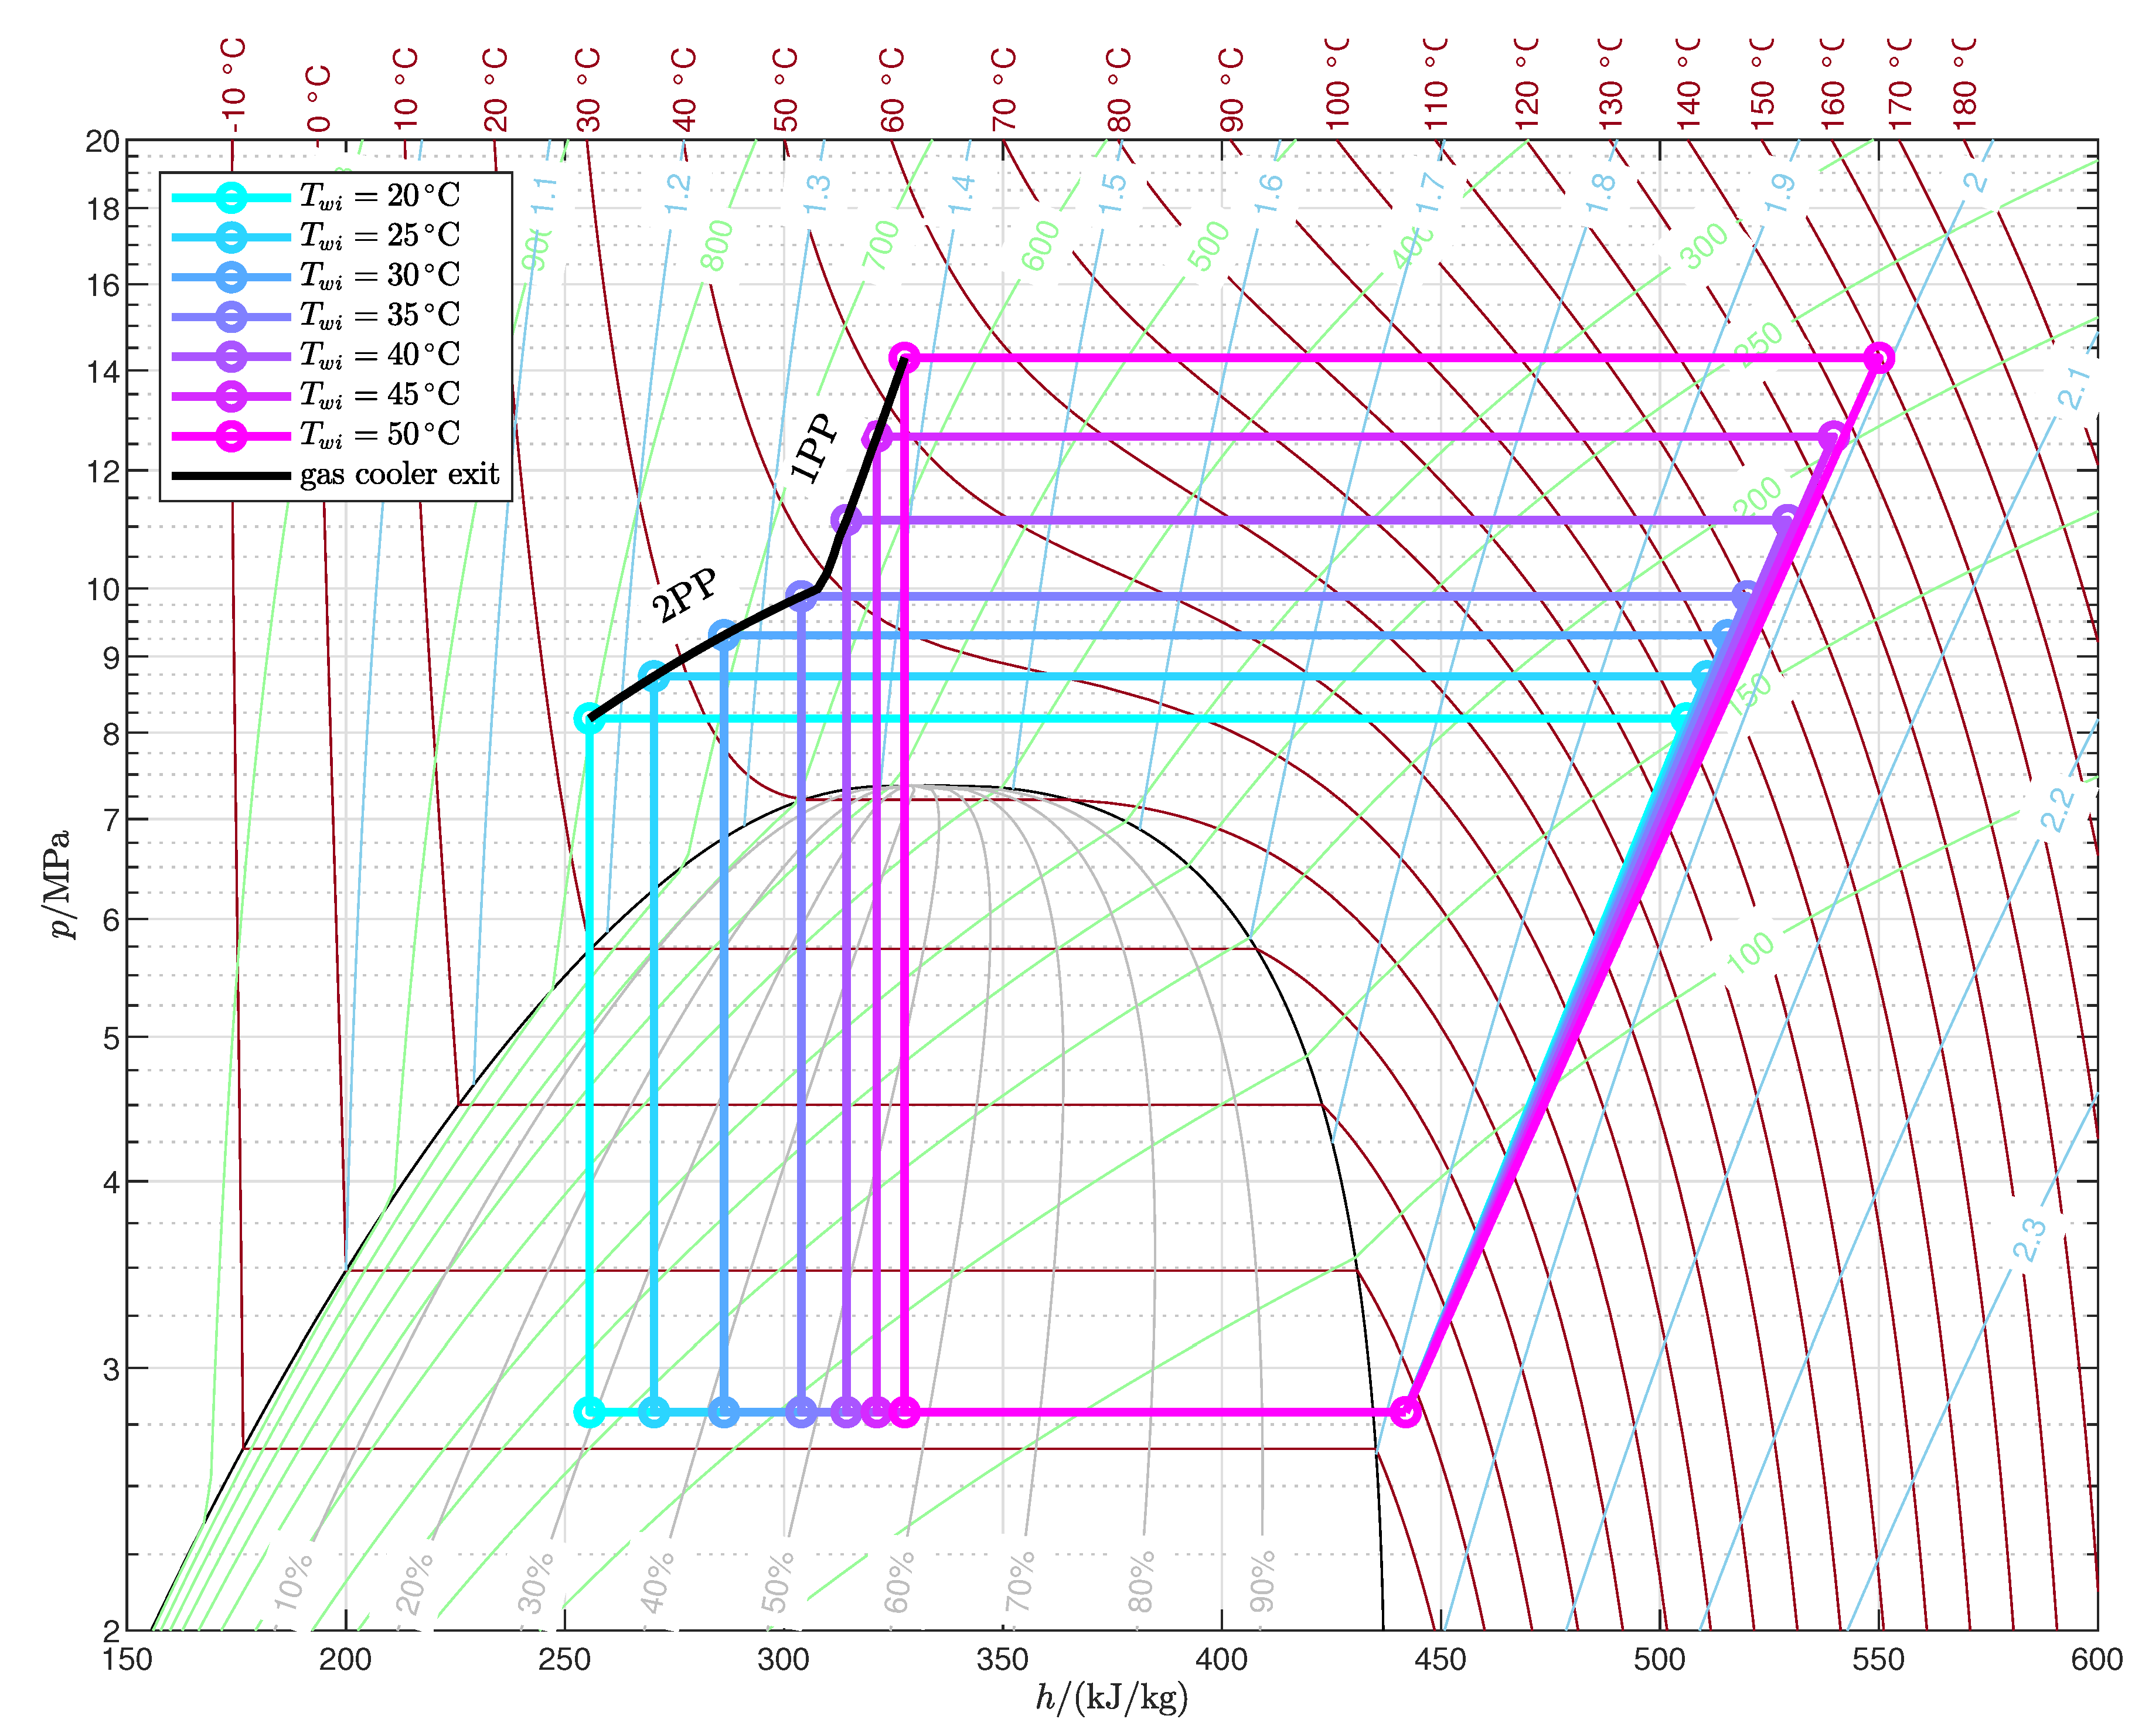
- The temperature profile of the end user determines the number and locations of pinch points in the gas cooler for the maximum COP configuration: for relatively low inlet temperature and high temperature glides, the optimal pressure is the one that gives rise to two pinch points, one at the cold end and another inside the gas cooler (2PP configurations), while for relatively high inlet temperatures and low temperature glides the optimal pressure is higher than the one that results in two pinch points, and in the optimum configuration there is only one pinch point in the gas cooler, located at the cold end (1PP configurations).
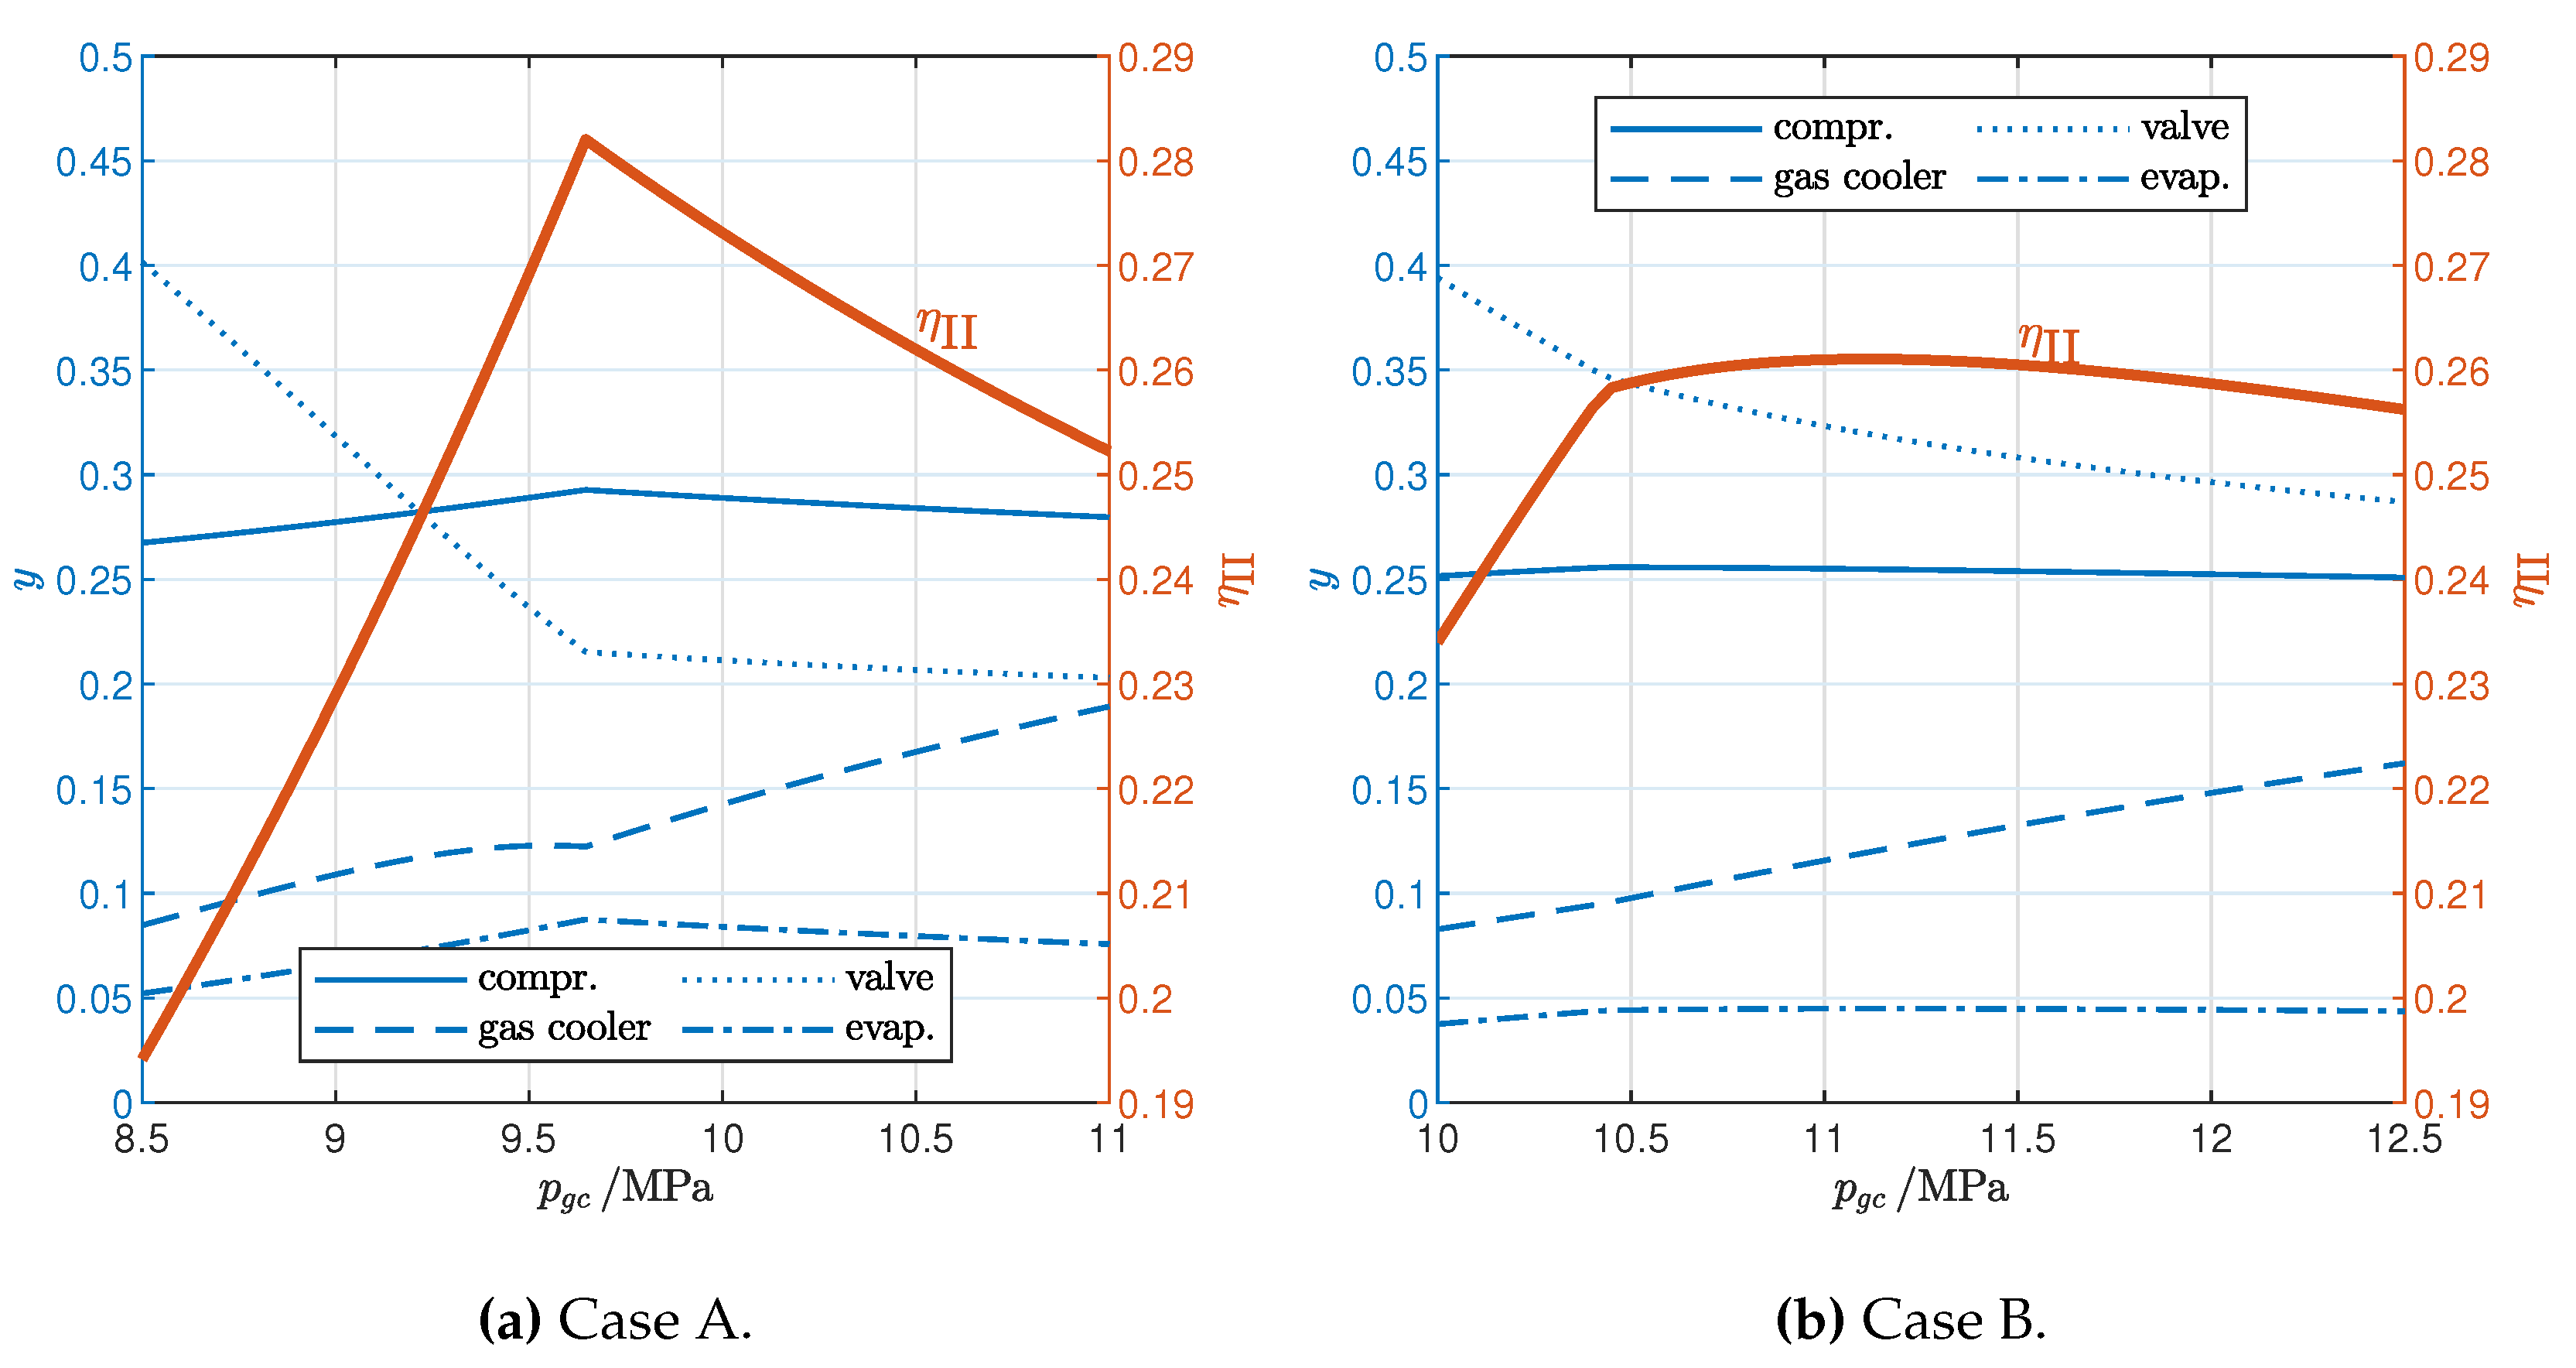
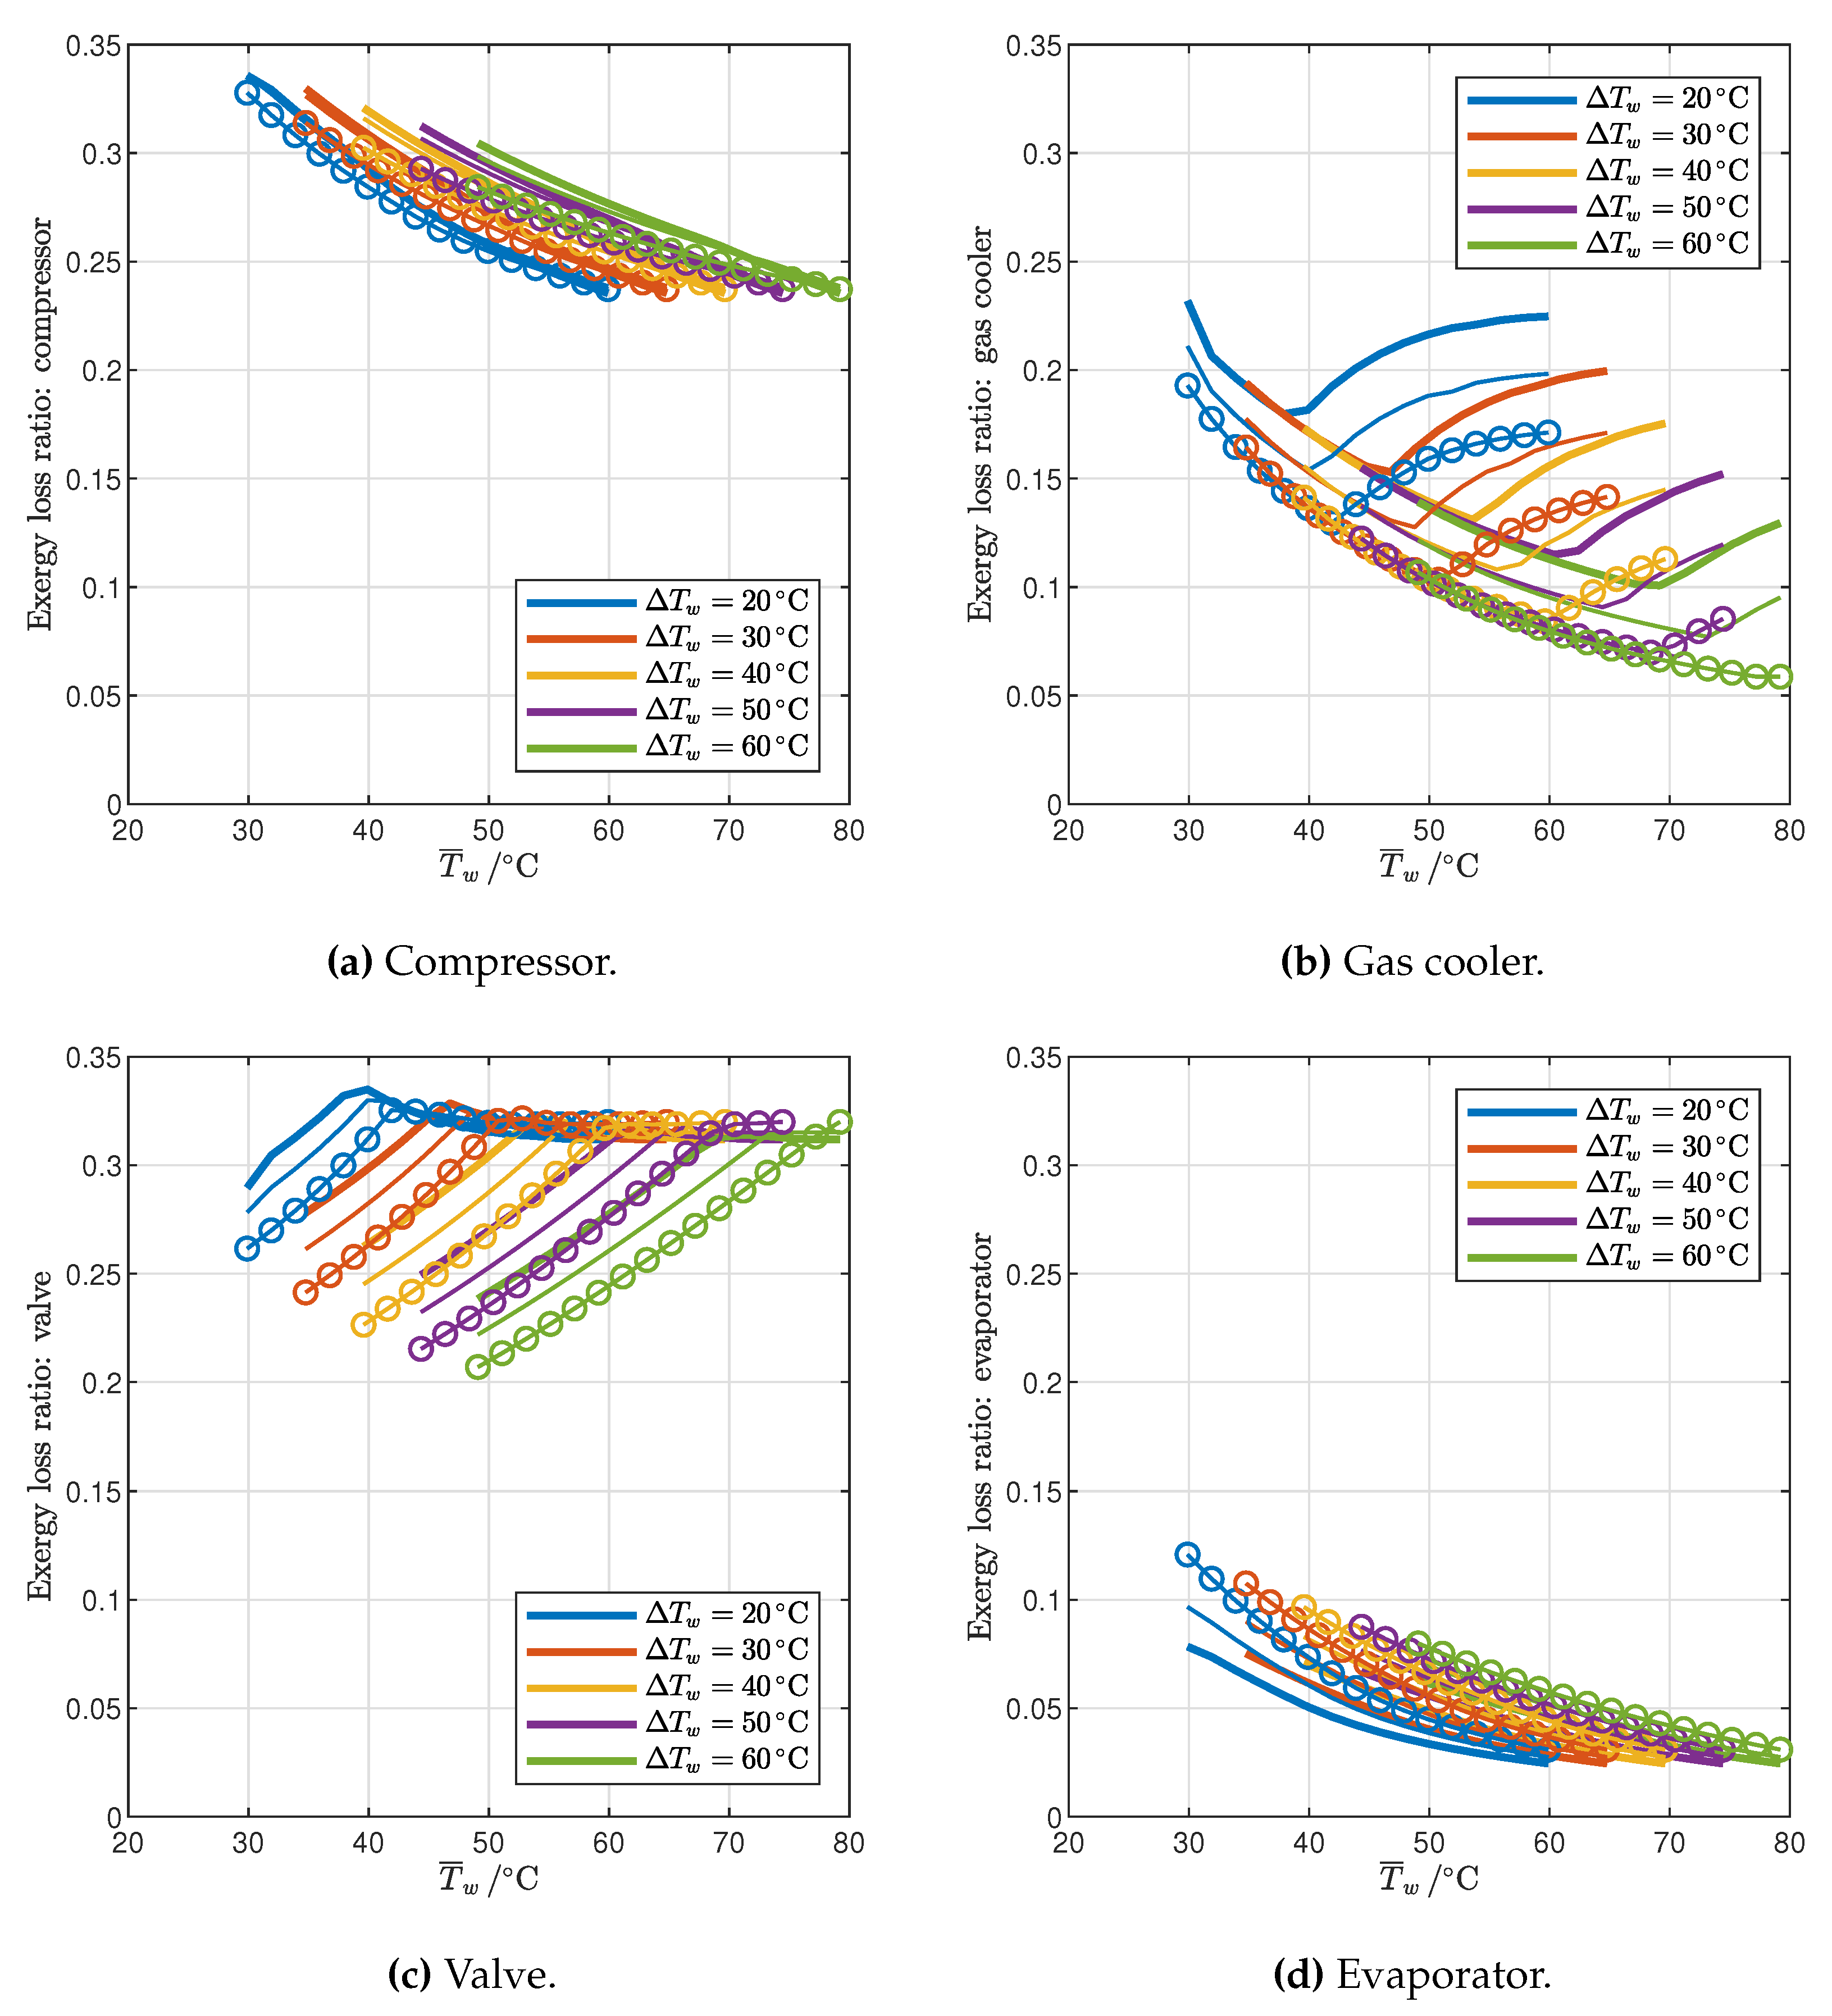
- The transition from the 2PP to the 1PP region mainly depends on the average water temperature and the temperature glide, and is explained by the exergy destruction that takes place not only in the gas cooler but also in the valve.
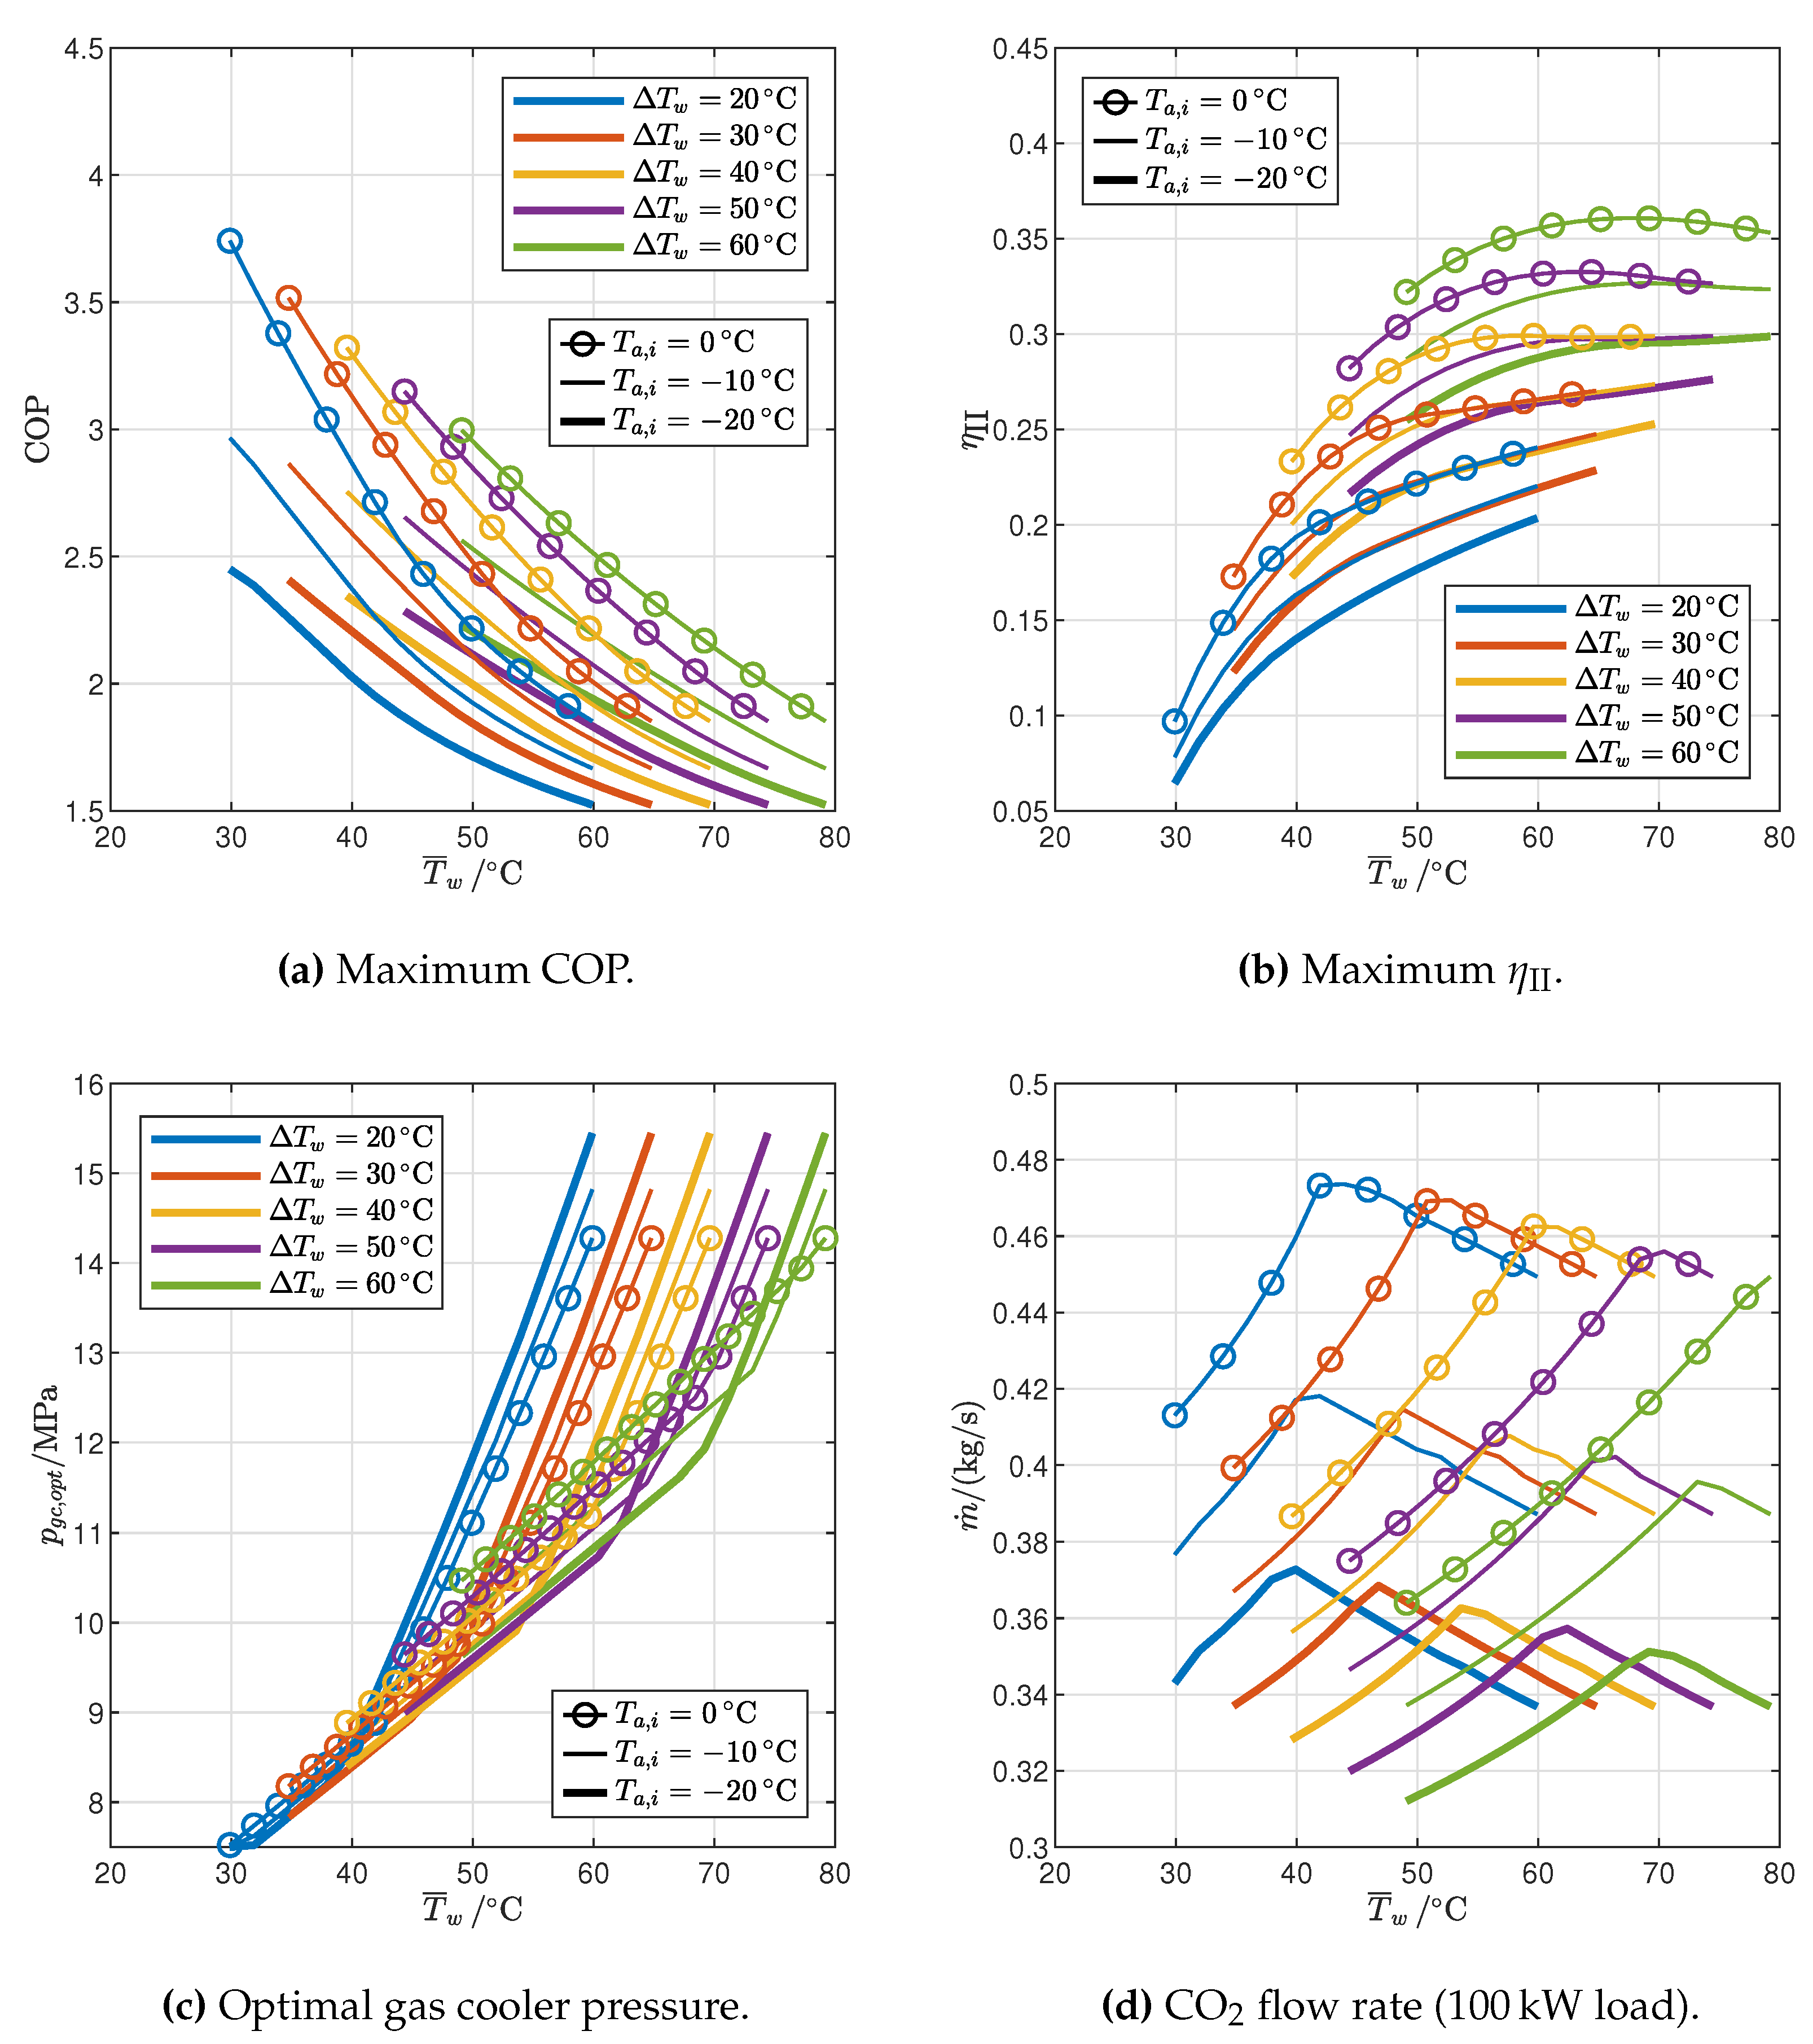
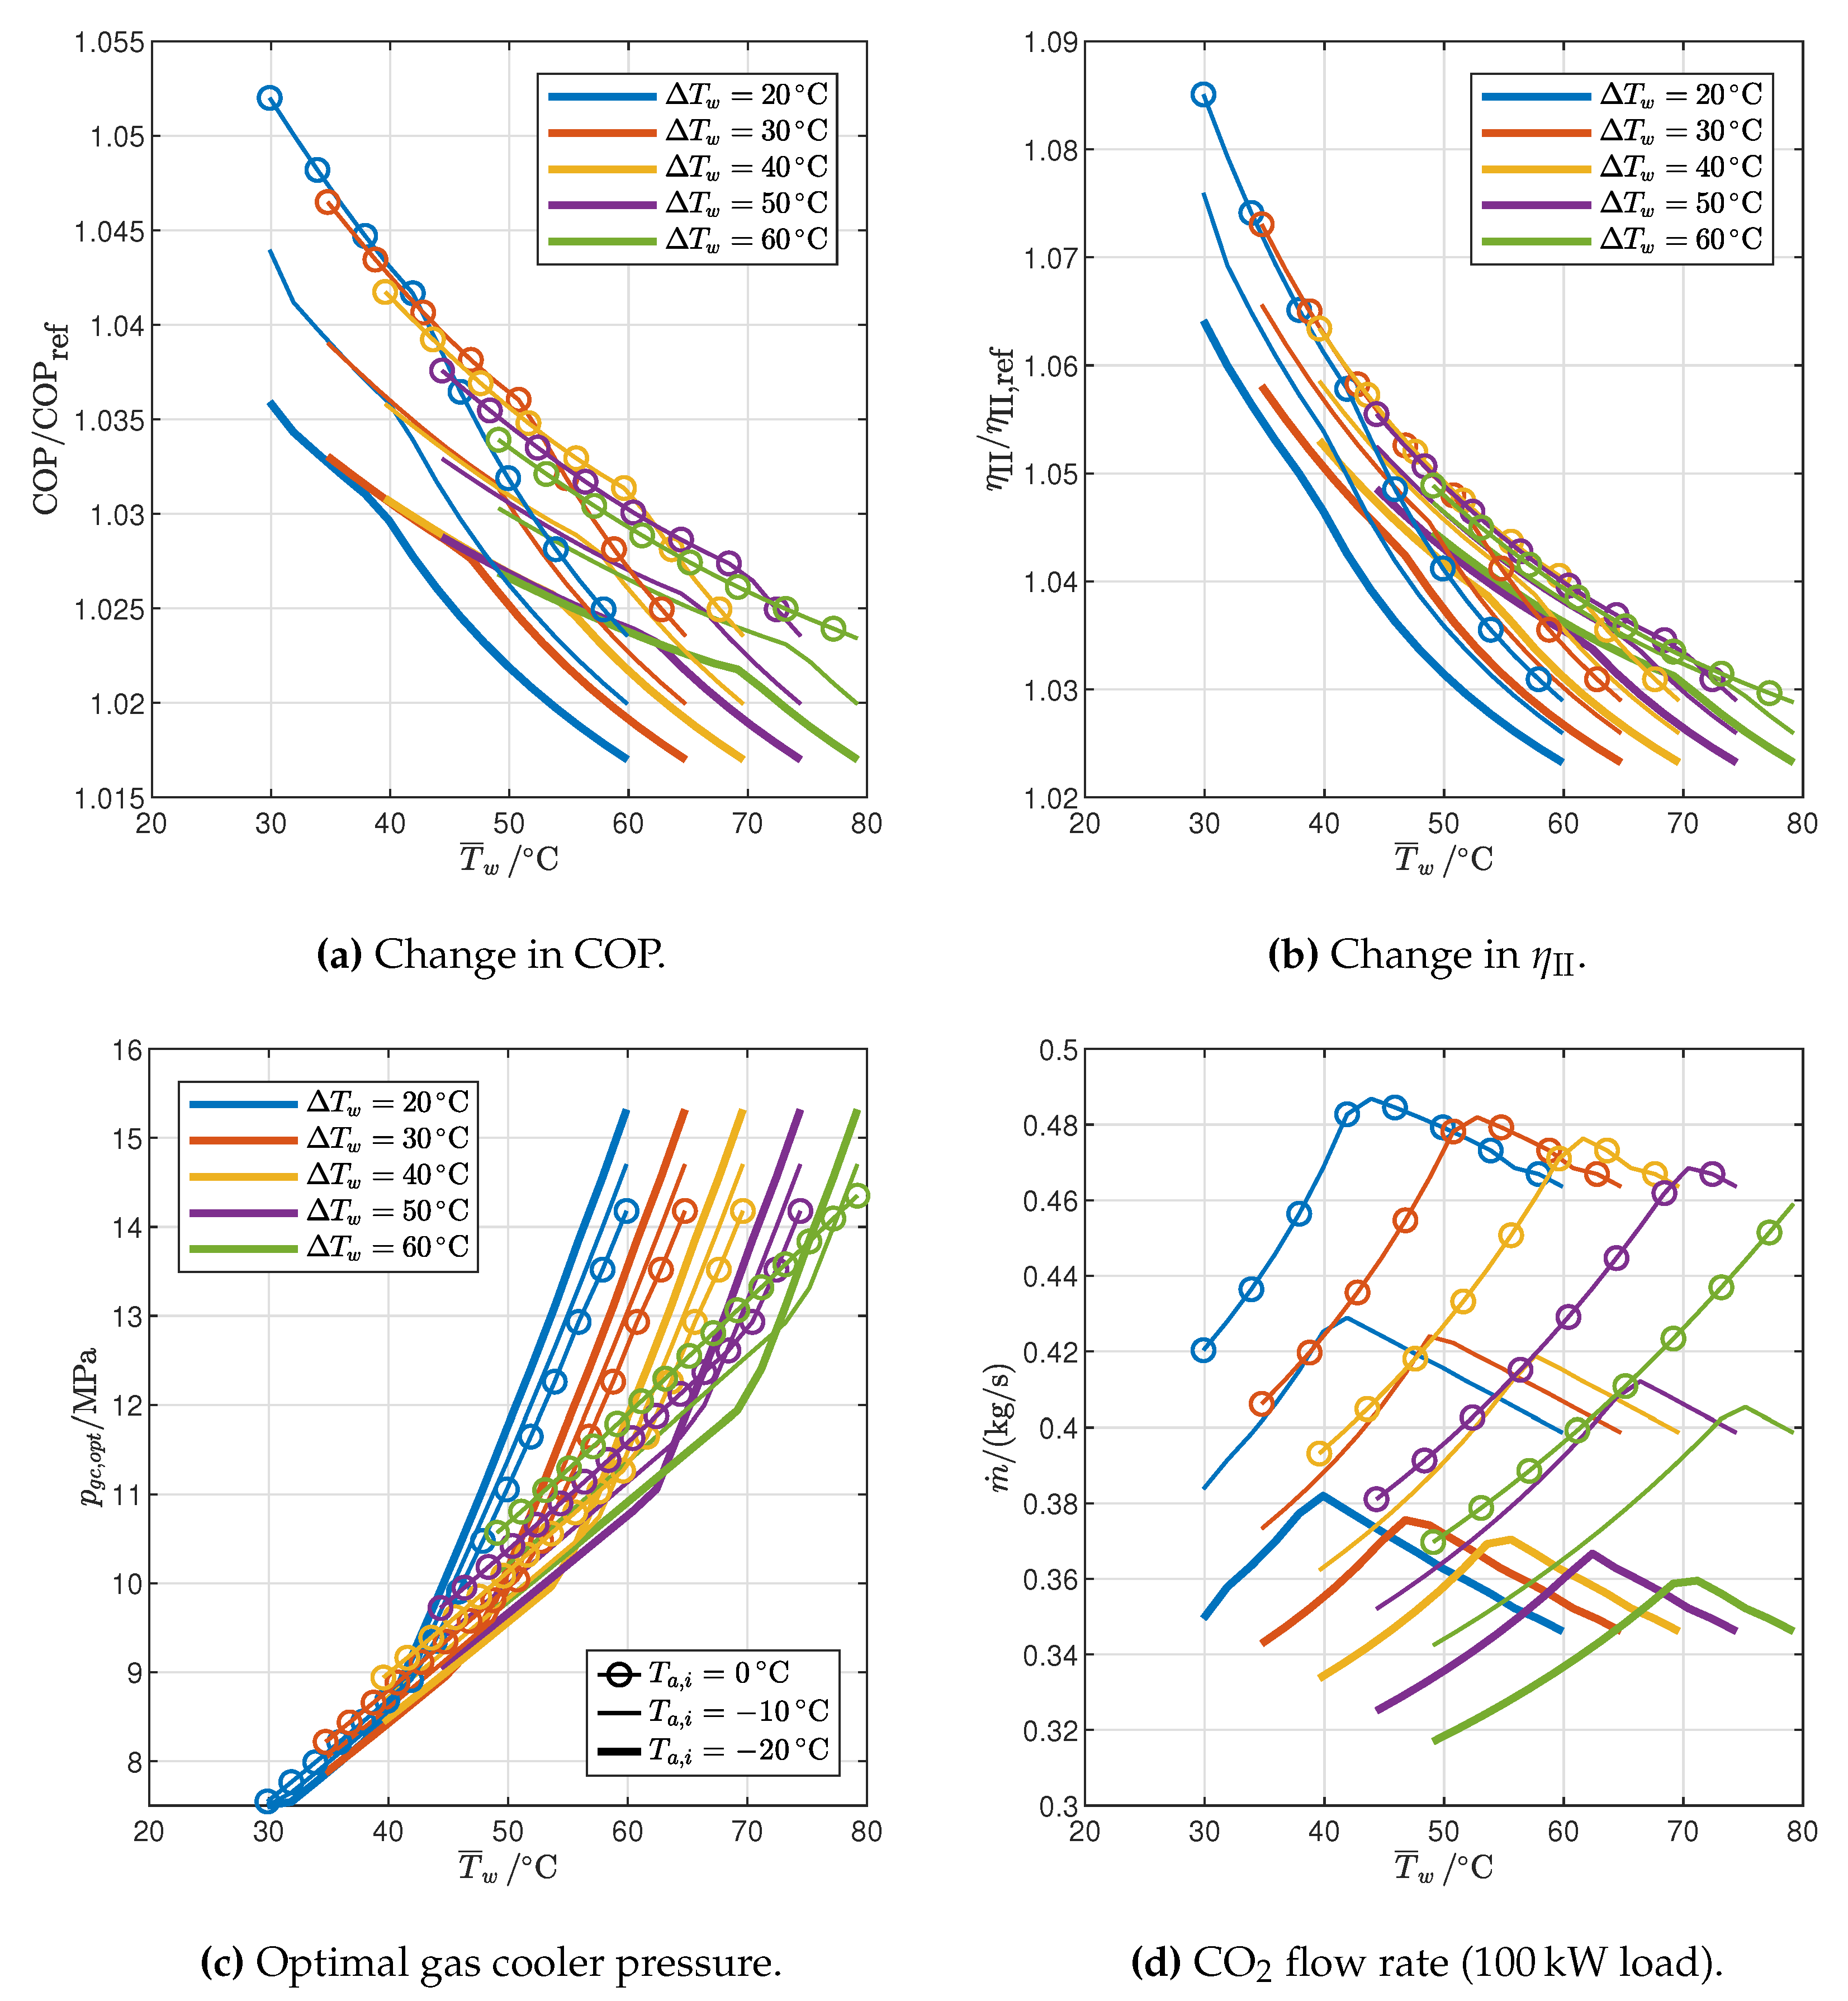
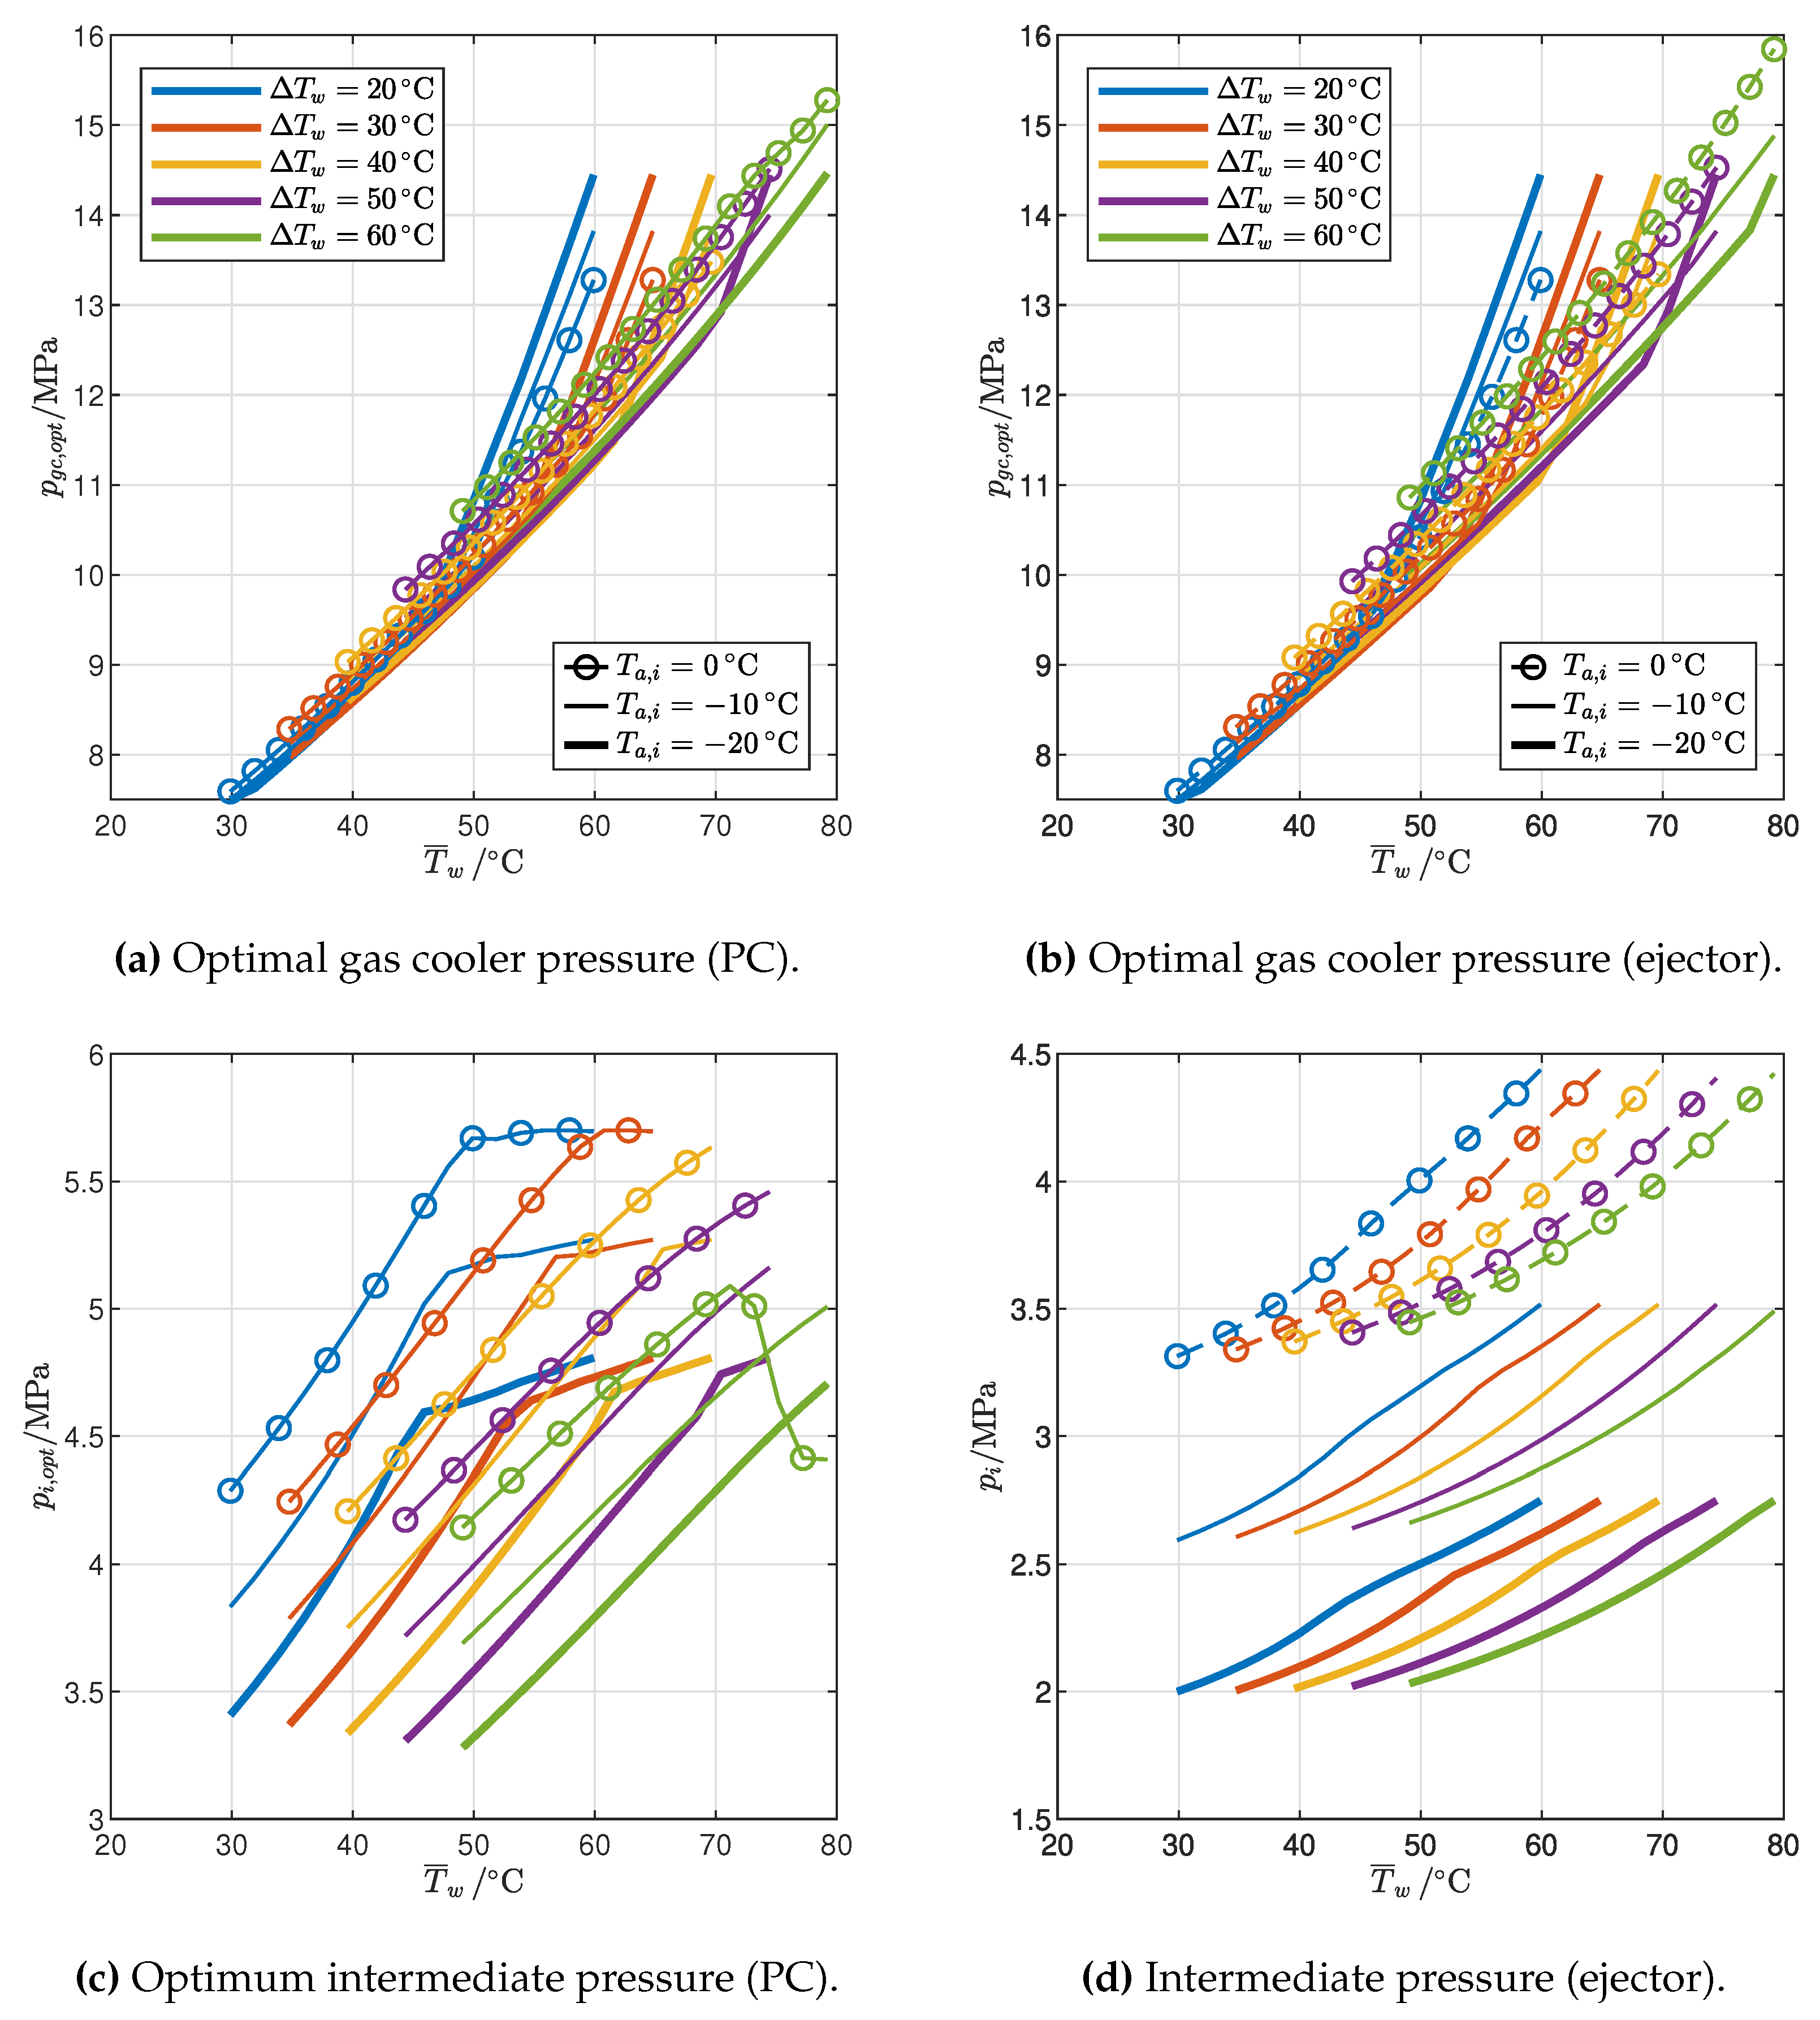
- The optimal gas cooler pressure increases with the average water temperature, but at different rates in the 2PP and 1PP regions. In particular, the rate of increase is much higher for 1PP configurations.
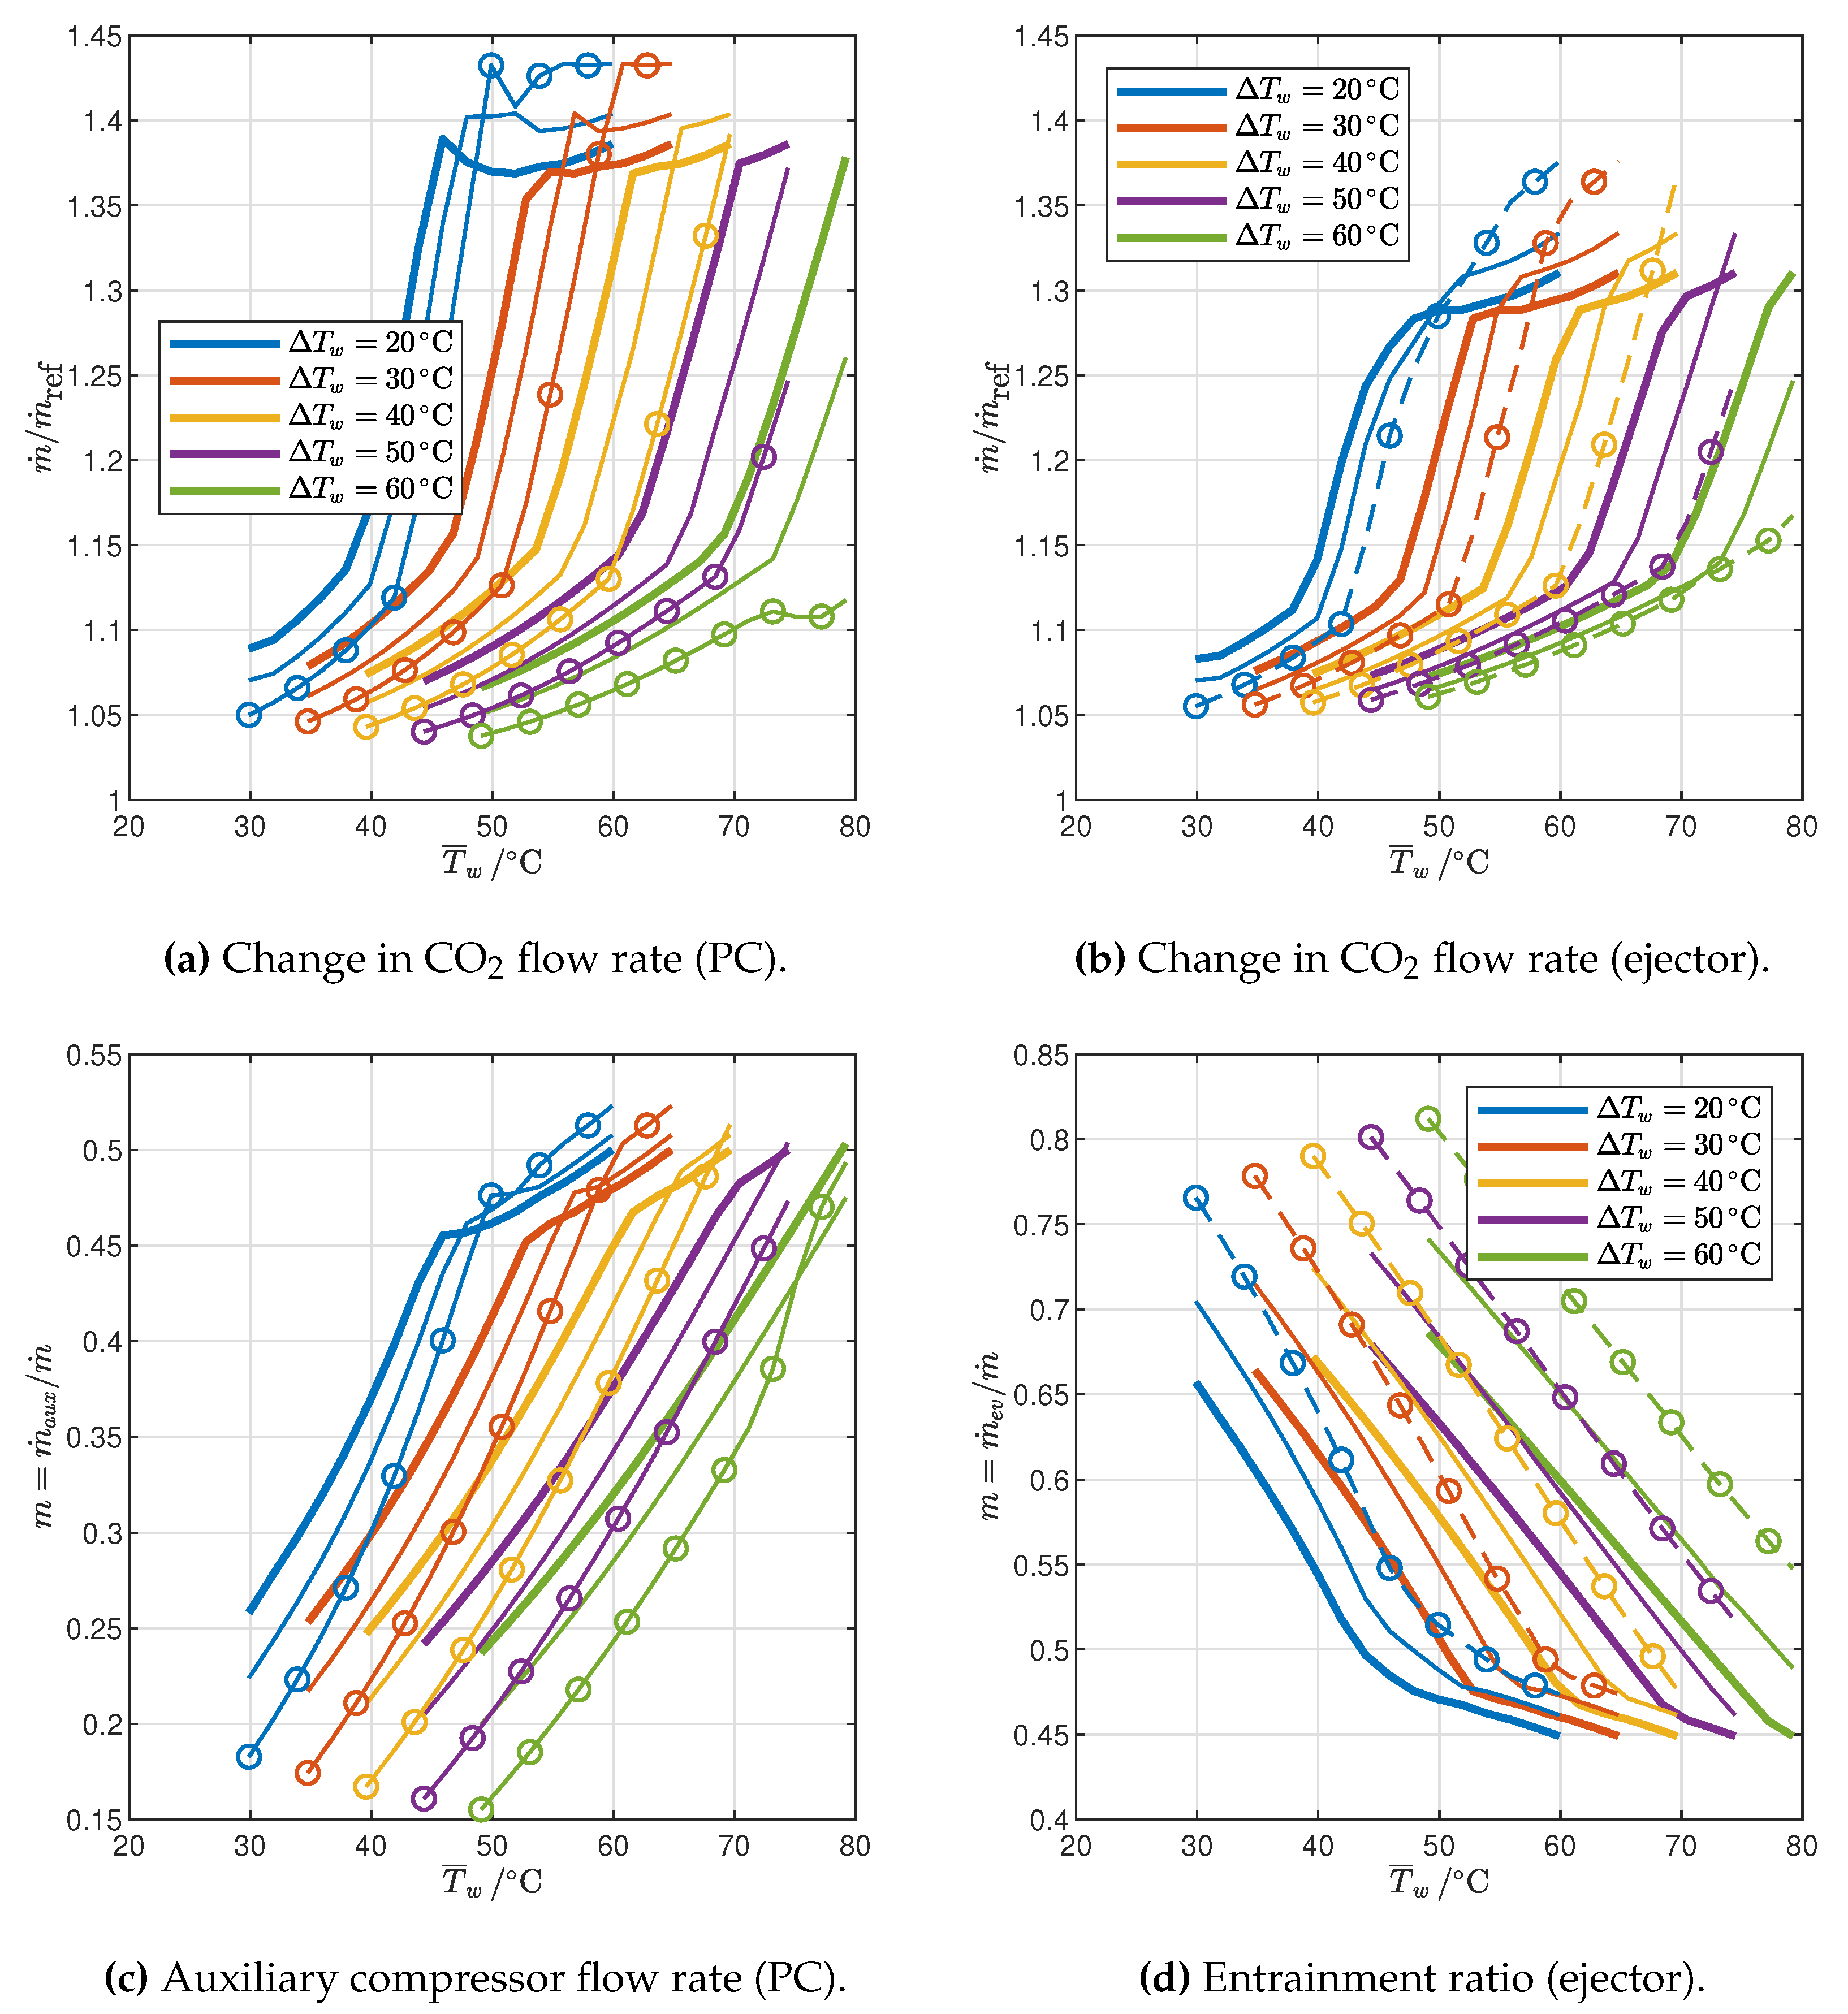
- The flow rate of CO2 changes with the average water temperature in different ways in the 2PP and 1PP regions: it increases in the former and decreases in the latter. Furthermore, it decreases with ambient air temperature.
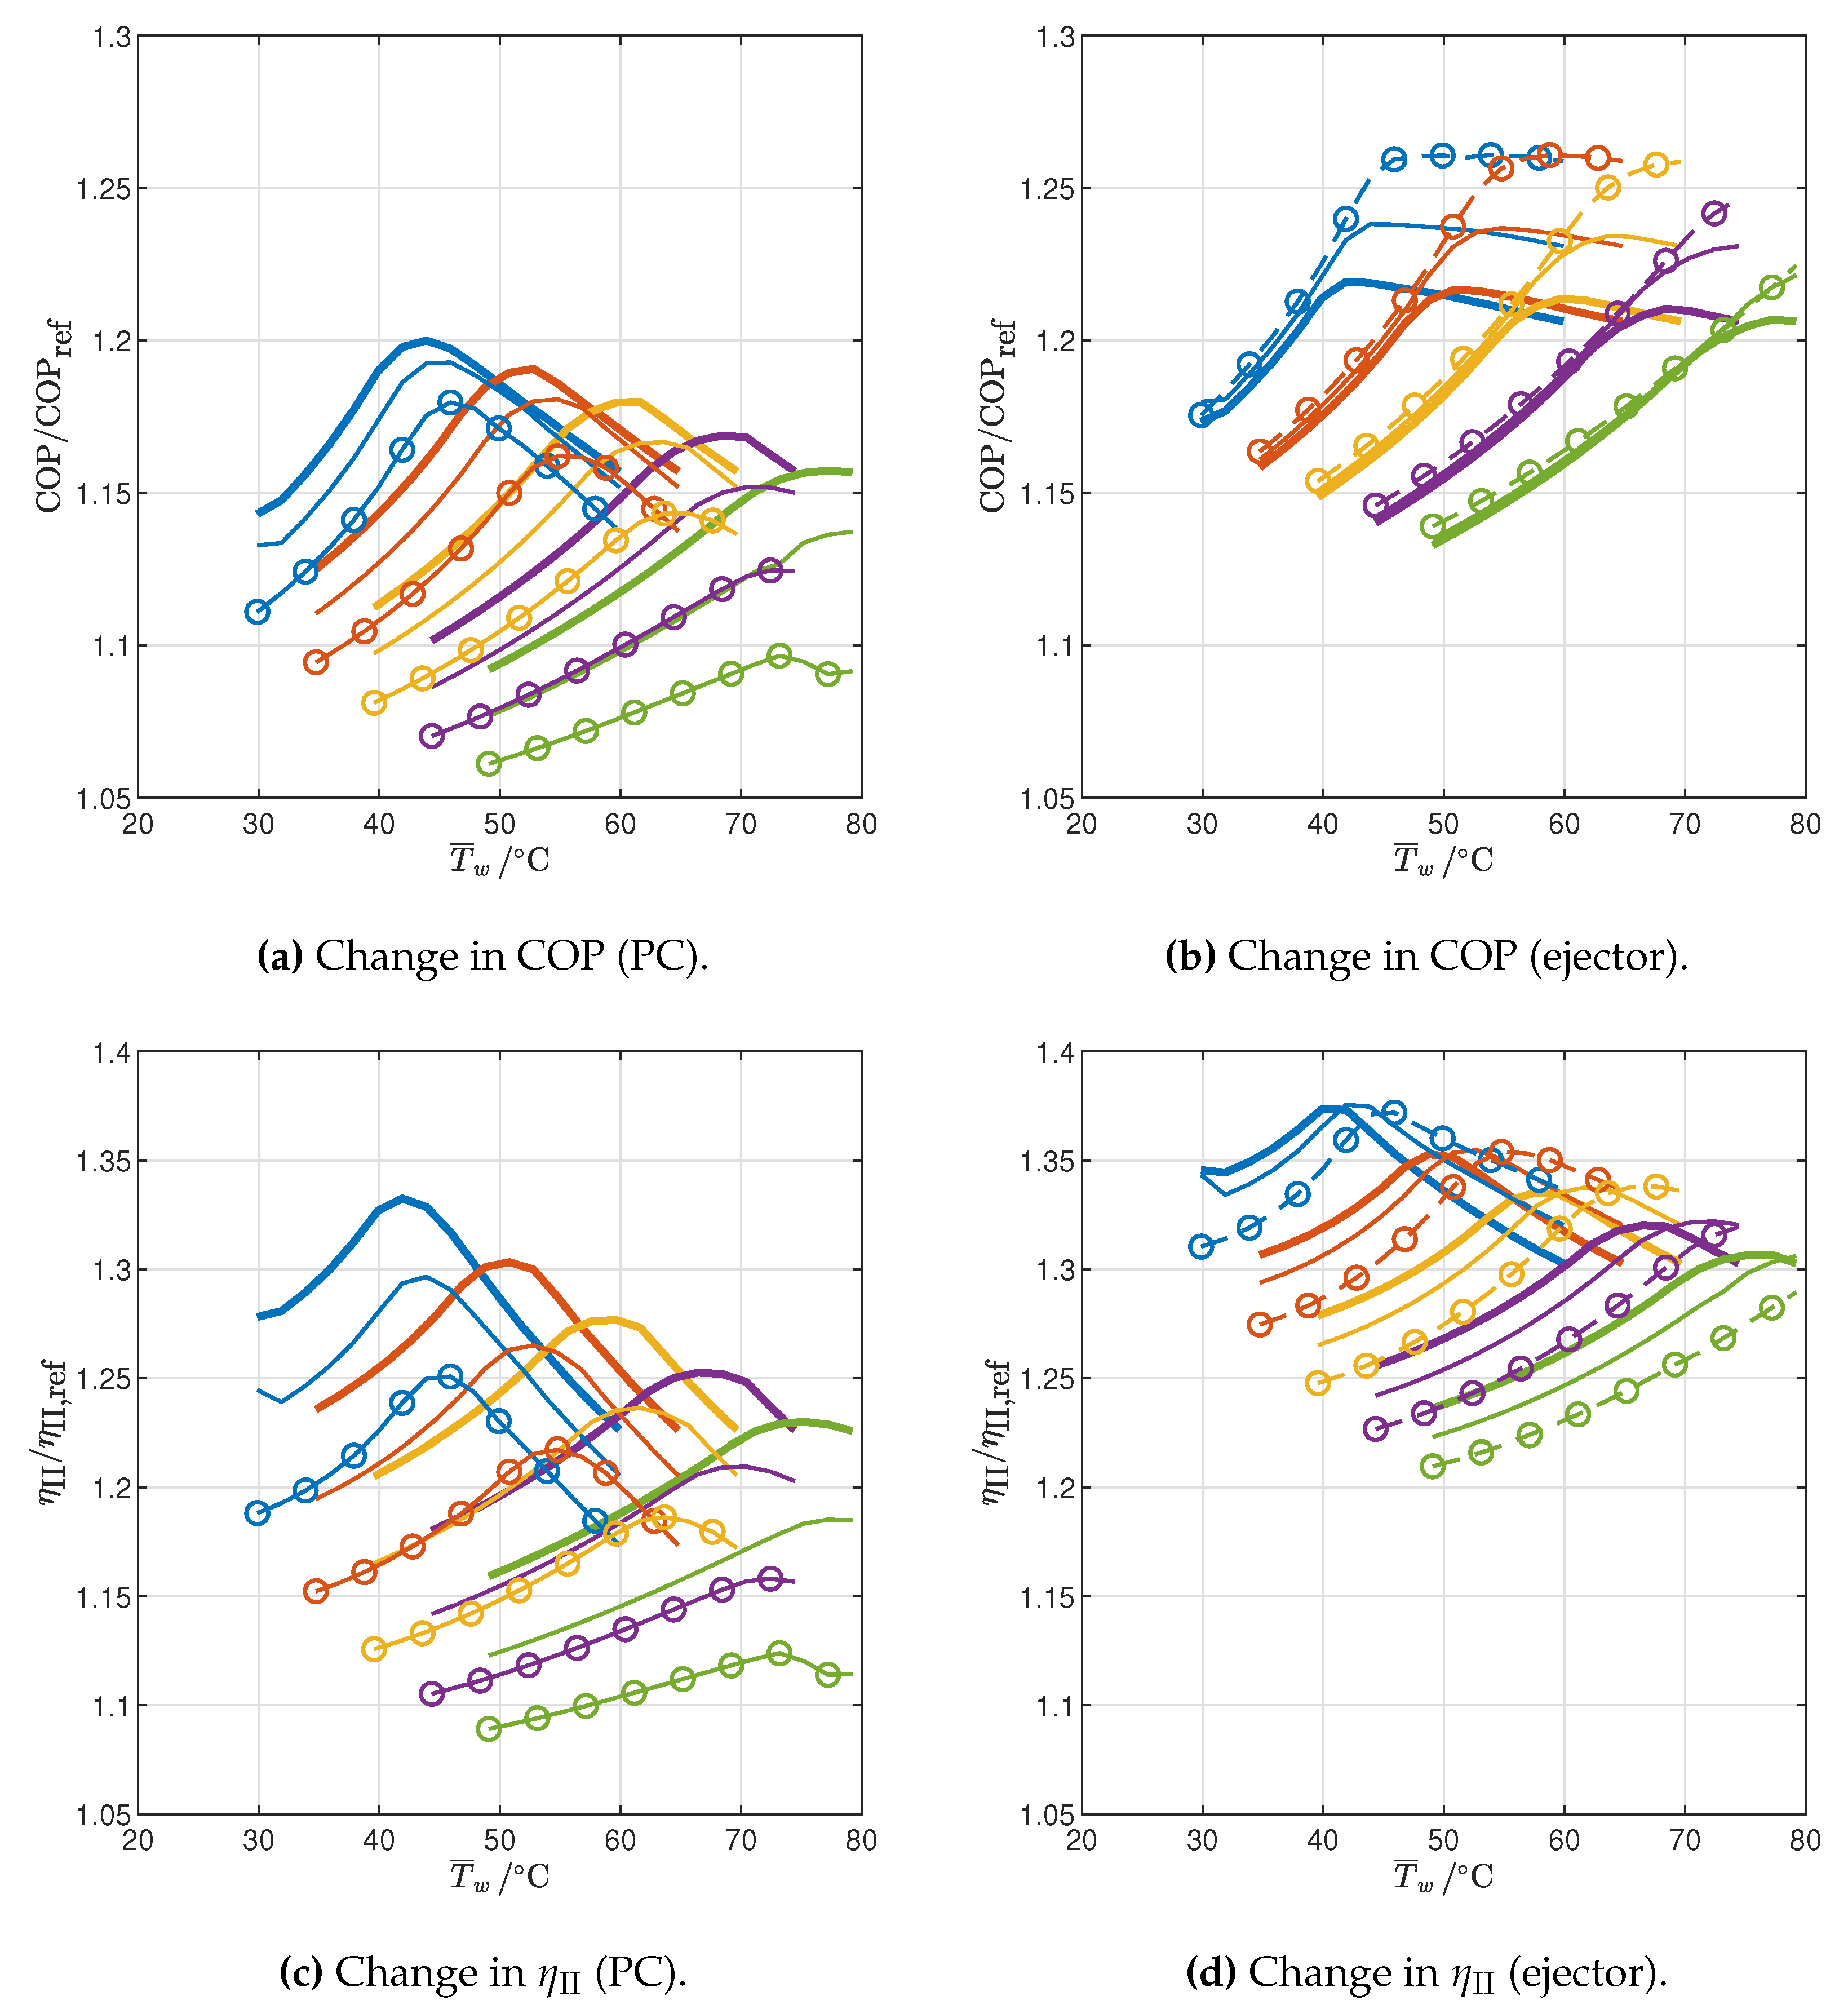
- The cycle with IHX and ejector is the most efficient among those analyzed: with respect to the reference cycle the COP increases by 13.3–26.1% and the second-law efficiency by 21.0–37.6%, depending on the operating conditions.
Author Contributions
Funding
Data Availability Statement
Conflicts of Interest
Abbreviations
| 1PP | Configurations with optimal pressure resulting in one gas cooler pinch point |
| 2PP | Configurations with optimal pressure resulting in two gas cooler pinch point |
| ASHP | Air Source Heat Pump |
| COP | Coefficient Of Performance |
| HTF | Heat Transfer Fluid |
| HP | Heat Pump |
| IHX | Internal Heat Exchanger |
| PC | Parallel Compression |
Appendix A. Optimized Thermodynamic Cycles
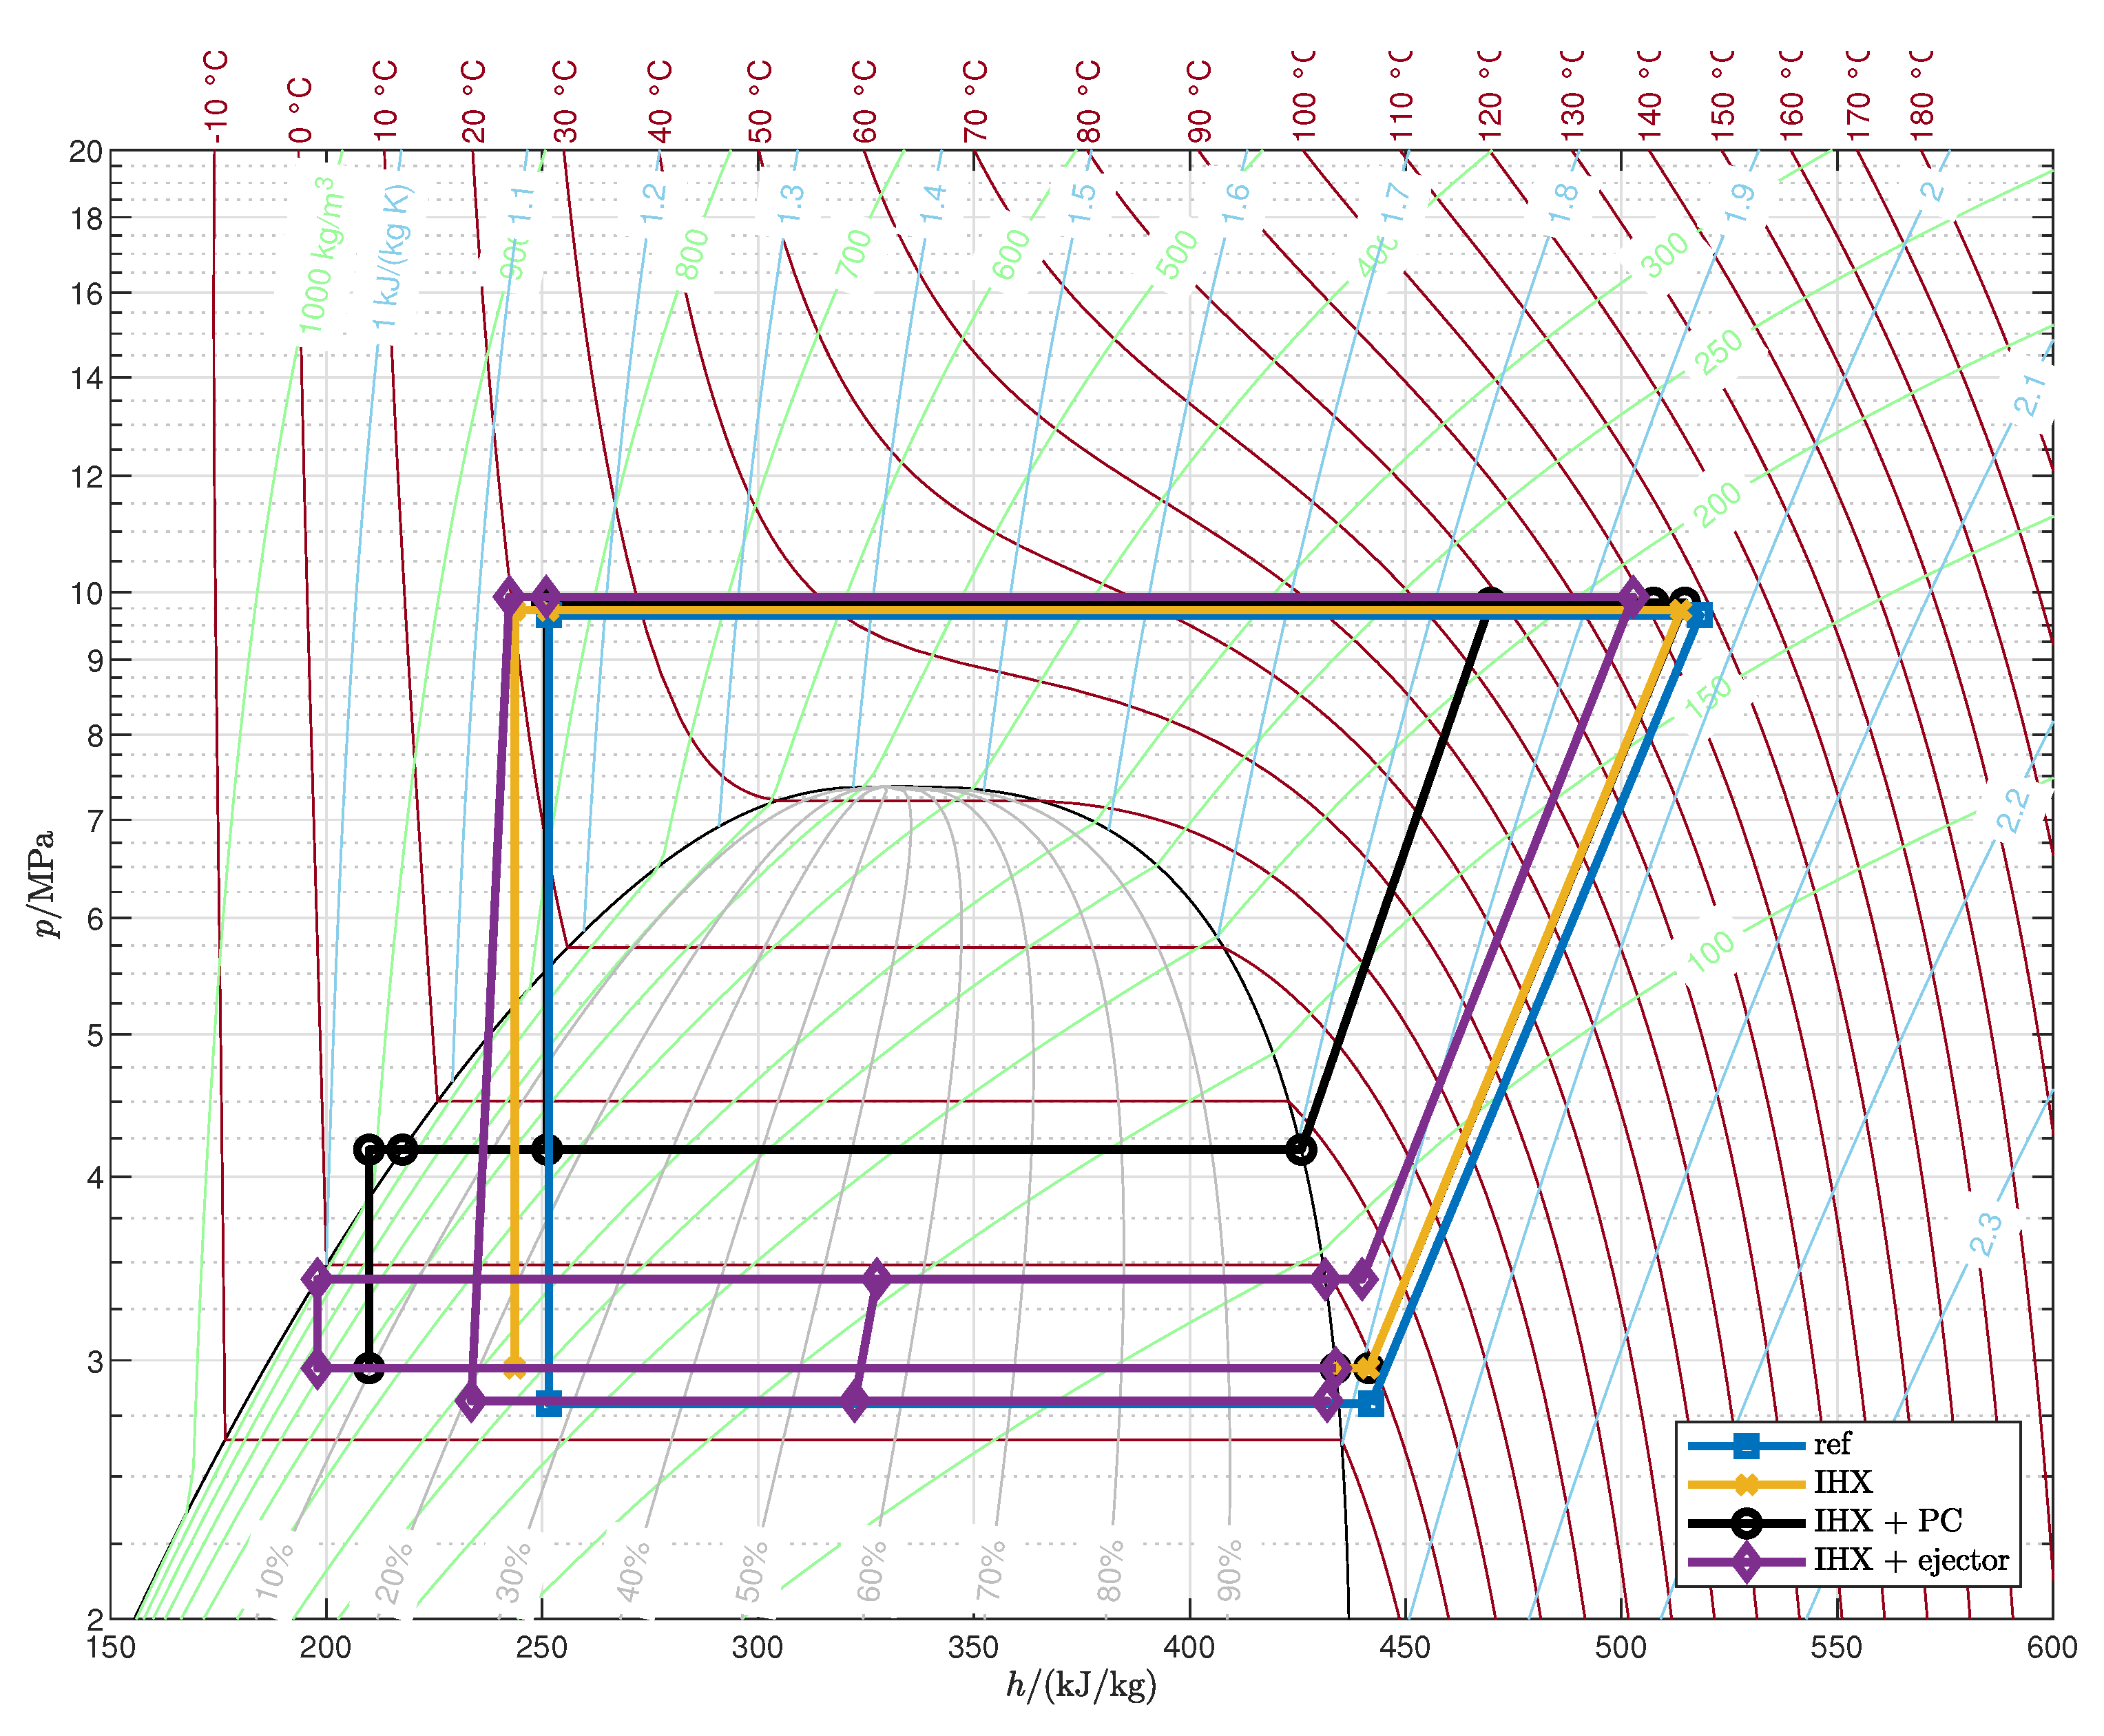
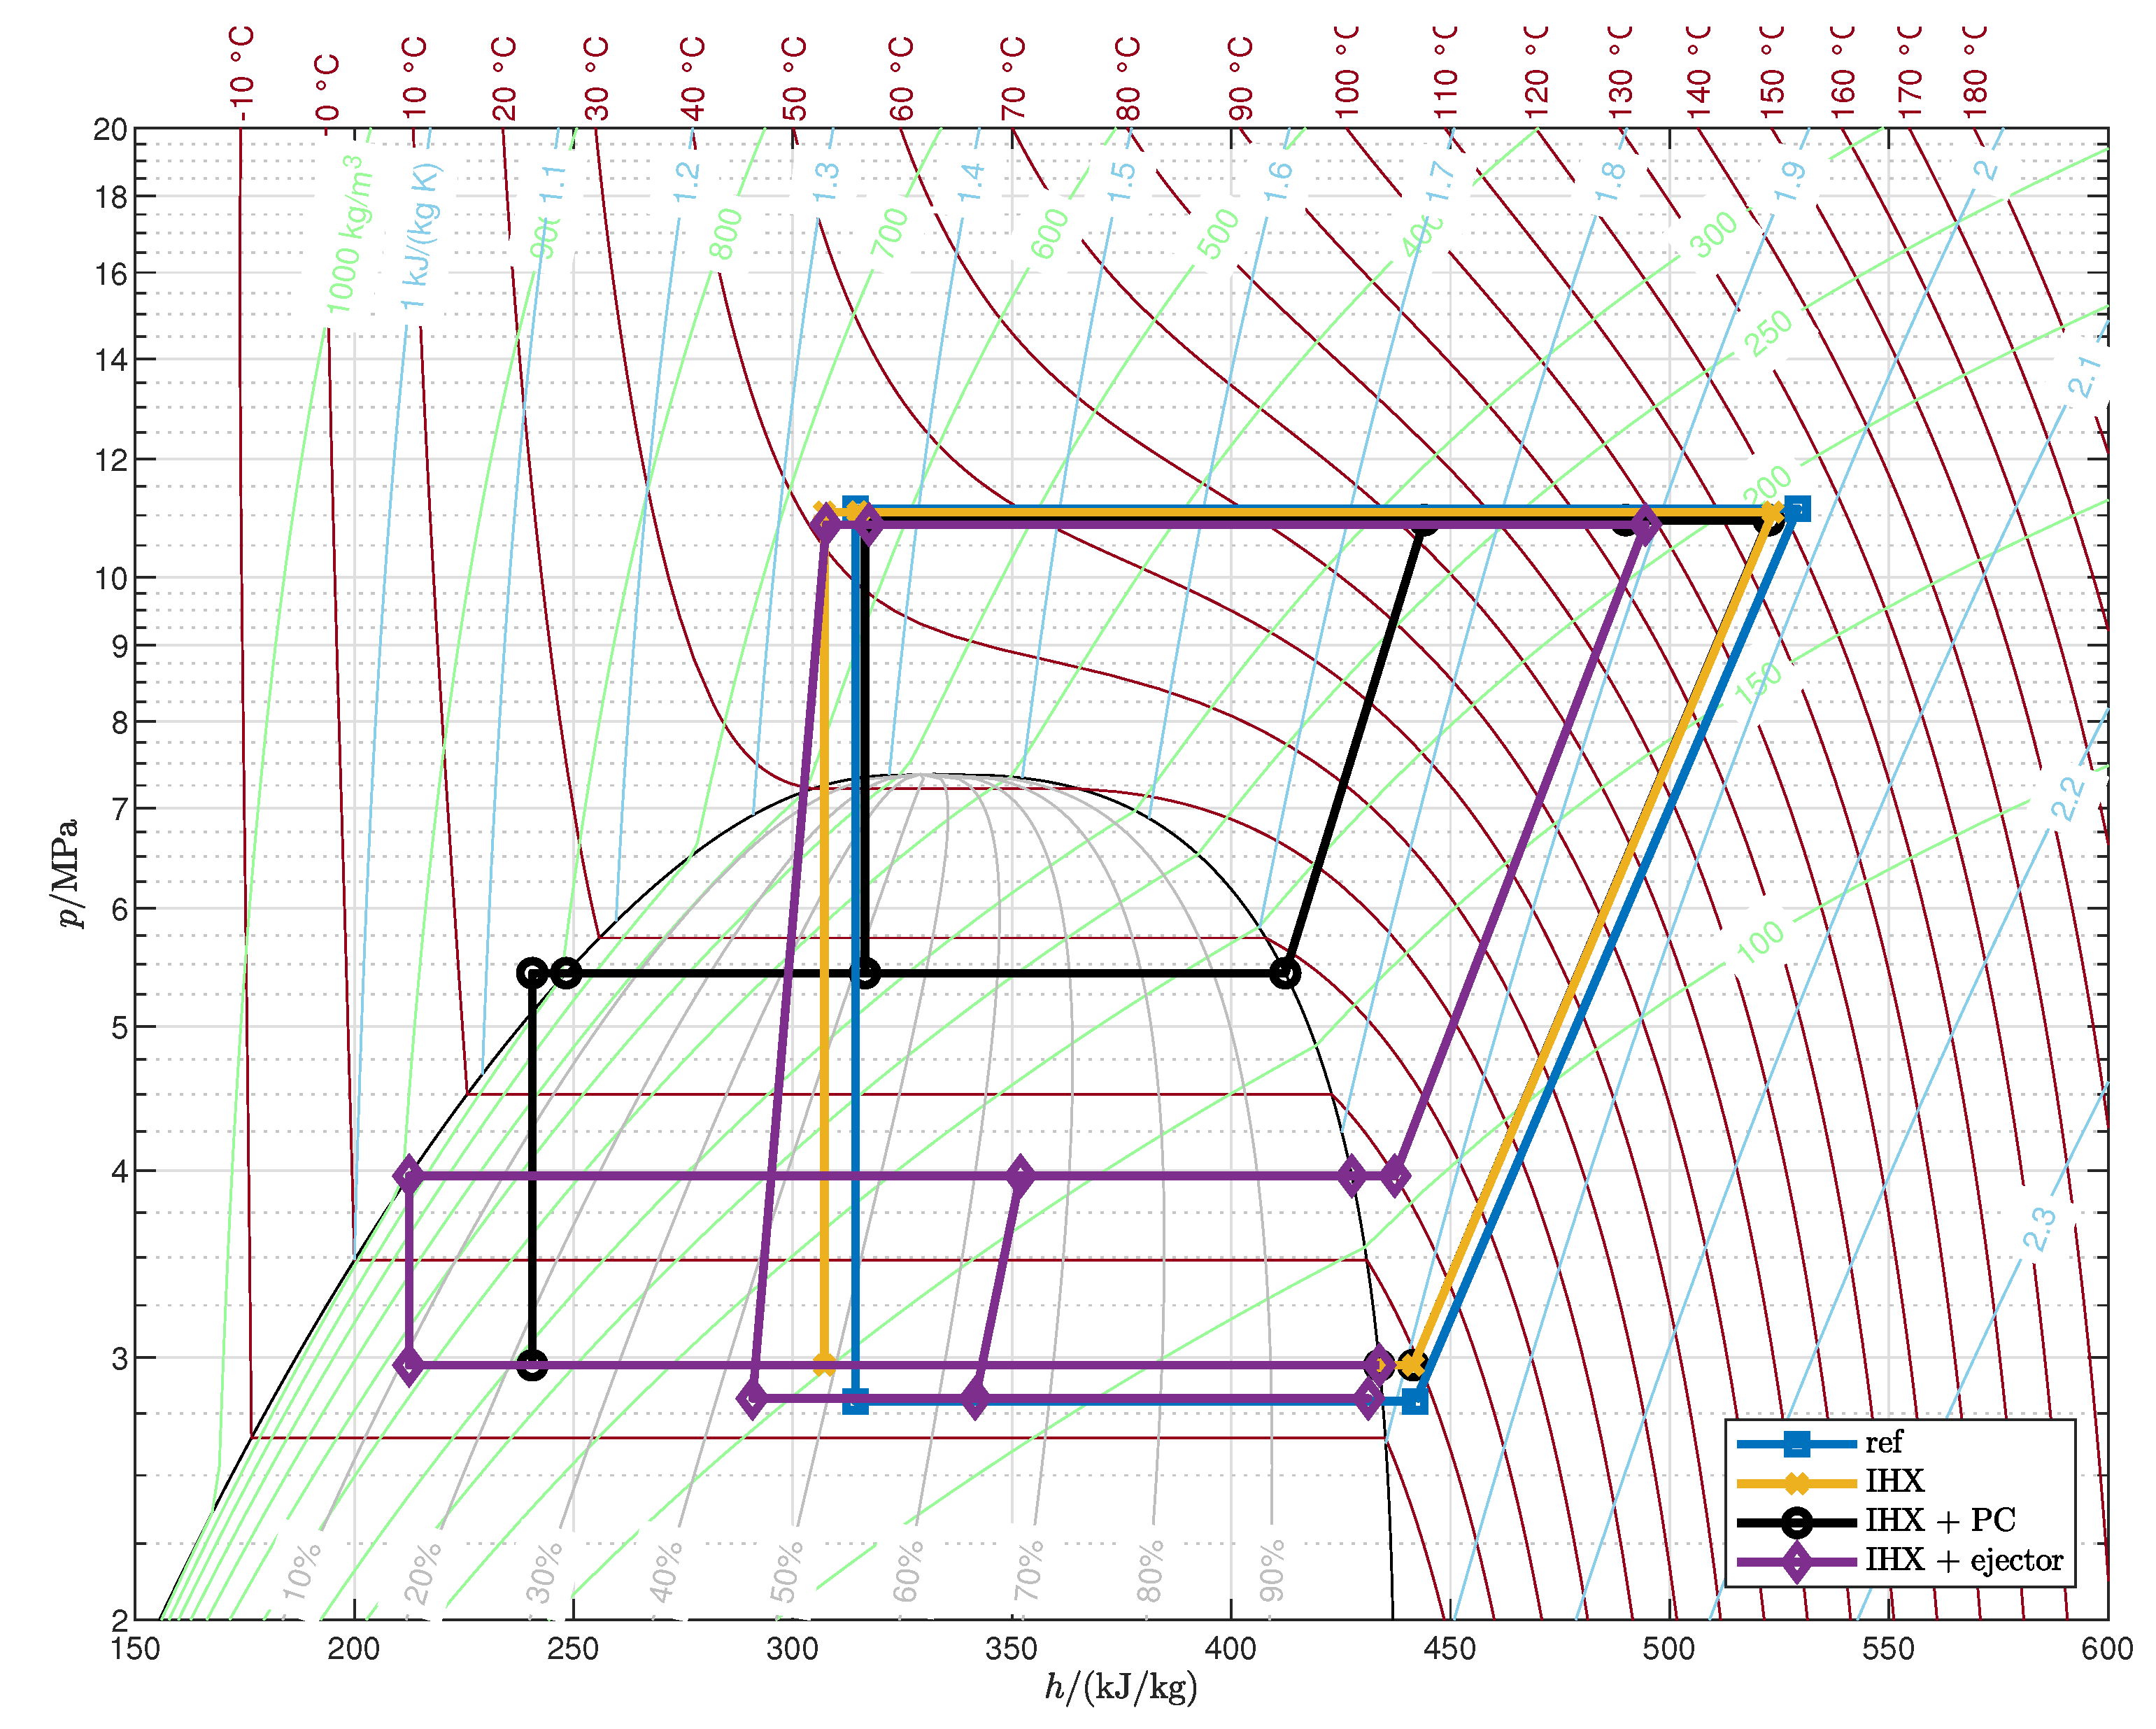
| 1 |
References
- International Energy Agency. The Future of Heat Pumps, 2022. [CrossRef]
- Bellocchi, S.; Manno, M.; Noussan, M.; Prina, M.G.; Vellini, M. Electrification of Transport and Residential Heating Sectors in Support of Renewable Penetration: Scenarios for the Italian Energy System. Energy 2020, 196, 117062. [Google Scholar] [CrossRef]
- Simon, S.; Xiao, M.; Harpprecht, C.; Sasanpour, S.; Gardian, H.; Pregger, T. A Pathway for the German Energy Sector Compatible with a 1.5 ∘C Carbon Budget. Sustainability 2022, 14, 1025. [Google Scholar] [CrossRef]
- Gaur, A.S.; Fitiwi, D.Z.; Curtis, J. Heat Pumps and Our Low-Carbon Future: A Comprehensive Review. Energy Research & Social Science 2021, 71, 101764. [Google Scholar] [CrossRef]
- Faraldo, F.; Byrne, P. A Review of Energy-Efficient Technologies and Decarbonating Solutions for Process Heat in the Food Industry. Energies 2024, 17, 3051. [Google Scholar] [CrossRef]
- Ong, B.H.Y.; Bhadbhade, N.; Olsen, D.G.; Wellig, B. Characterizing Sector-Wide Thermal Energy Profiles for Industrial Sectors. Energy 2023, 282, 129028. [Google Scholar] [CrossRef]
- Zuberi, M.J.S.; Hasanbeigi, A.; Morrow, W. Techno-Economic Evaluation of Industrial Heat Pump Applications in US Pulp and Paper, Textile, and Automotive Industries. Energy Efficiency 2023, 16, 19. [Google Scholar] [CrossRef]
- Schoeneberger, C.; Dunn, J.B.; Masanet, E. Technical, Environmental, and Economic Analysis Comparing Low-Carbon Industrial Process Heat Options in U.S. Poly(Vinyl Chloride) and Ethylene Manufacturing Facilities. Environmental Science & Technology 2024, 58, 4957–4967. [Google Scholar] [CrossRef]
- United Nations. Montreal Protocol on Substances That Deplete the Ozone Layer, 1987. https://treaties.un.org/doc/Treaties/1989/01/19890101%2003-25%20AM/Ch_XXVII_02_ap.pdf.
- United Nations. Amendment to the Montreal Protocol on Substances That Deplete the Ozone Layer, 2016. https://treaties.un.org/doc/Treaties/2016/10/20161015%2003-23%20PM/Ch_XXVII-2.f-English%20and%20French.pdf.
- Wu, D.; Hu, B.; Wang, R.Z. Vapor Compression Heat Pumps with Pure Low-GWP Refrigerants. Renewable and Sustainable Energy Reviews 2021, 138, 110571. [Google Scholar] [CrossRef]
- Zühlsdorf, B.; Jensen, J.K.; Elmegaard, B. Heat Pump Working Fluid Selection—Economic and Thermodynamic Comparison of Criteria and Boundary Conditions. International Journal of Refrigeration 2019, 98, 500–513. [Google Scholar] [CrossRef]
- Lorentzen, G. Revival of Carbon Dioxide as a Refrigerant. International Journal of Refrigeration 1994, 17, 292–301. [Google Scholar] [CrossRef]
- Stene, J. Residential CO2 Heat Pump System for Combined Space Heating and Hot Water Heating. International Journal of Refrigeration 2005, 28, 1259–1265. [Google Scholar] [CrossRef]
- Diniz, H.A.G.; Paulino, T.F.; Pabon, J.J.G.; Maia, A.A.T.; Oliveira, R.N. Dynamic Model of a Transcritical CO2 Heat Pump for Residential Water Heating. Sustainability 2021, 13, 3464. [Google Scholar] [CrossRef]
- Banks, A.; Grist, C.; Heller, J.; Lim, H. Field Measurement of Central CO2 Heat Pump Water Heater for Multifamily Retrofit. Sustainability 2022, 14, 8048. [Google Scholar] [CrossRef]
- Wang, D.; Yu, B.; Hu, J.; Chen, L.; Shi, J.; Chen, J. Heating Performance Characteristics of CO2 Heat Pump System for Electrical Vehicle in a Cold Climate. International Journal of Refrigeration 2018, 85, 27–41. [Google Scholar] [CrossRef]
- Groll, E.A.; Kim, J.H. Review of Recent Advances toward Transcritical CO2 Cycle Technology. HVAC&R Research 2007, 13, 499–520. [Google Scholar] [CrossRef]
- Liao, S.M.; Zhao, T.S.; Jakobsen, A. A Correlation of Optimal Heat Rejection Pressures in Transcritical Carbon Dioxide Cycles. Applied Thermal Engineering 2000, 20, 831–841. [Google Scholar] [CrossRef]
- Dai, B.; Dang, C.; Li, M.; Tian, H.; Ma, Y. Thermodynamic Performance Assessment of Carbon Dioxide Blends with Low-Global Warming Potential (GWP) Working Fluids for a Heat Pump Water Heater. International Journal of Refrigeration 2015, 56, 1–14. [Google Scholar] [CrossRef]
- Wang, S.; Tuo, H.; Cao, F.; Xing, Z. Experimental Investigation on Air-Source Transcritical CO2 Heat Pump Water Heater System at a Fixed Water Inlet Temperature. International Journal of Refrigeration 2013, 36, 701–716. [Google Scholar] [CrossRef]
- Adamson, K.M.; Walmsley, T.G.; Carson, J.K.; Chen, Q.; Schlosser, F.; Kong, L.; Cleland, D.J. High-Temperature and Transcritical Heat Pump Cycles and Advancements: A Review. Renewable and Sustainable Energy Reviews 2022, 167, 112798. [Google Scholar] [CrossRef]
- Ji, H.; Pei, J.; Cai, J.; Ding, C.; Guo, F.; Wang, Y. Review of Recent Advances in Transcritical CO2 Heat Pump and Refrigeration Cycles and Their Development in the Vehicle Field. Energies 2023, 16, 4011. [Google Scholar] [CrossRef]
- Rony, R.U.; Yang, H.; Krishnan, S.; Song, J. Recent Advances in Transcritical CO2 (R744) Heat Pump System: A Review. Energies 2019, 12, 457. [Google Scholar] [CrossRef]
- Cao, F.; Ye, Z.; Wang, Y. Experimental Investigation on the Influence of Internal Heat Exchanger in a Transcritical CO2 Heat Pump Water Heater. Applied Thermal Engineering 2020, 168, 114855. [Google Scholar] [CrossRef]
- Taslimi Taleghani, S.; Sorin, M.; Poncet, S. Analysis and Optimization of Exergy Flows inside a Transcritical CO2 Ejector for Refrigeration, Air Conditioning and Heat Pump Cycles. Energies 2019, 12, 1686. [Google Scholar] [CrossRef]
- Haida, M.; Banasiak, K.; Smolka, J.; Hafner, A.; Eikevik, T.M. Experimental Analysis of the R744 Vapour Compression Rack Equipped with the Multi-Ejector Expansion Work Recovery Module. International Journal of Refrigeration 2016, 64, 93–107. [Google Scholar] [CrossRef]
- Zhu, Y.; Huang, Y.; Li, C.; Zhang, F.; Jiang, P.X. Experimental Investigation on the Performance of Transcritical CO2 Ejector–Expansion Heat Pump Water Heater System. Energy Conversion and Management 2018, 167, 147–155. [Google Scholar] [CrossRef]
- Liu, Y.; Sun, Y.; Tang, D. Analysis of a CO2 Transcritical Refrigeration Cycle with a Vortex Tube Expansion. Sustainability 2019, 11, 2021. [Google Scholar] [CrossRef]
- Sarkar, J.; Agrawal, N. Performance Optimization of Transcritical CO2 Cycle with Parallel Compression Economization. International Journal of Thermal Sciences 2010, 49, 838–843. [Google Scholar] [CrossRef]
- López Paniagua, I.; Jiménez Álvaro, Á.; Rodríguez Martín, J.; González Fernández, C.; Nieto Carlier, R. Comparison of Transcritical CO2 and Conventional Refrigerant Heat Pump Water Heaters for Domestic Applications. Energies 2019, 12, 479. [Google Scholar] [CrossRef]
- Mancinelli, C.; Manno, M.; Salvatori, M.; Zaccagnini, A. Thermal Energy Storage as a Way to Improve Transcritical CO2 Heat Pump Performance by Means of Heat Recovery Cycles. Energy Storage and Saving 2023, 2, 532–539. [Google Scholar] [CrossRef]
- Wang, Z.; Zhang, Y.; Wang, F.; Li, G.; Xu, K. Performance Optimization and Economic Evaluation of CO2 Heat Pump Heating System Coupled with Thermal Energy Storage. Sustainability 2021, 13, 13683. [Google Scholar] [CrossRef]
- Liu, X.; Fu, R.; Wang, Z.; Lin, L.; Sun, Z.; Li, X. Thermodynamic Analysis of Transcritical CO2 Refrigeration Cycle Integrated with Thermoelectric Subcooler and Ejector. Energy Conversion and Management 2019, 188, 354–365. [Google Scholar] [CrossRef]
- Yang, J.; Zhang, X.; Wang, L.; Du, Y.; Han, Y. Performance Analysis of Transcritical CO2 Quasi-Secondary Compression Cycle with Ejector Based on Pinch Point. Designs 2023, 7, 89. [Google Scholar] [CrossRef]
- Chen, Y.G. Pinch Point Analysis and Design Considerations of CO2 Gas Cooler for Heat Pump Water Heaters. International Journal of Refrigeration 2016, 69, 136–146. [Google Scholar] [CrossRef]
- Chen, Y.G. Optimal Heat Rejection Pressure of CO2 Heat Pump Water Heaters Based on Pinch Point Analysis. International Journal of Refrigeration 2019, 106, 592–603. [Google Scholar] [CrossRef]
- Cui, Q.; Wang, C.; Gao, E.; Zhang, X. Pinch Point Characteristics and Performance Evaluation of CO2 Heat Pump Water Heater under Variable Working Conditions. Applied Thermal Engineering 2022, 207, 118208. [Google Scholar] [CrossRef]
- Bell, I.H.; Wronski, J.; Quoilin, S.; Lemort, V. Pure and Pseudo-pure Fluid Thermophysical Property Evaluation and the Open-Source Thermophysical Property Library CoolProp. Industrial & Engineering Chemistry Research 2014, 53, 2498–2508. [Google Scholar] [CrossRef]
- Minetto, S. Theoretical and Experimental Analysis of a CO2 Heat Pump for Domestic Hot Water. International Journal of Refrigeration 2011, 34, 742–751. [Google Scholar] [CrossRef]
- Kornhauser, A.A. The Use of an Ejector as a Refrigerant Expander, 1990. International Refrigeration and Air Conditioning Conference. Paper 82. https://docs.lib.purdue.edu/iracc/82/.
- Liu, R.; Gao, F.; Liang, K.; Wang, L.; Wang, M.; Mi, G.; Li, Y. Thermodynamic Evaluation of Transcritical CO2 Heat Pump Considering Temperature Matching under the Constraint of Heat Transfer Pinch Point. Journal of Thermal Science 2021, 30, 869–879. [Google Scholar] [CrossRef]
- Cecchinato, L.; Corradi, M.; Fornasieri, E.; Zamboni, L. Carbon Dioxide as Refrigerant for Tap Water Heat Pumps: A Comparison with the Traditional Solution. International Journal of Refrigeration 2005, 28, 1250–1258. [Google Scholar] [CrossRef]
| Parameter | Range | Parameter | Value | Parameter | Value |
|---|---|---|---|---|---|
| 20–50 | 100 | 0.85 | |||
| 20–60 | 3 | 0.85 | |||
| −20–0 | 3 | 0.80 | |||
| 5 | 0.95 | ||||
| 0.90 | |||||
| Equation (4) |
| Case | |||
|---|---|---|---|
| A | 20 | 50 | 0 |
| B | 40 | 30 | 0 |
Disclaimer/Publisher’s Note: The statements, opinions and data contained in all publications are solely those of the individual author(s) and contributor(s) and not of MDPI and/or the editor(s). MDPI and/or the editor(s) disclaim responsibility for any injury to people or property resulting from any ideas, methods, instructions or products referred to in the content. |
© 2024 by the authors. Licensee MDPI, Basel, Switzerland. This article is an open access article distributed under the terms and conditions of the Creative Commons Attribution (CC BY) license (http://creativecommons.org/licenses/by/4.0/).


