Preprint
Article

Carbon Storage Dynamics in Rubber Plantations along an Elevational Gradient in Tropical China

Altmetrics

Downloads

132

Views

65

Comments

0

A peer-reviewed article of this preprint also exists.

Submitted:

22 July 2024

Posted:

24 July 2024

You are already at the latest version

Alerts
Abstract
Carbon (C) losses due to the conversion of natural forests adversely affect the abiotic components of terrestrial ecosystems. In tropical China, rubber cultivation often extends from its traditional range to elevations of up to 1400 m. However, C storage in rubber plantations across elevation gradients is poorly understood. In this study, we investigated biomass and C storage along elevation gradients in two age groups (8- and 12-year-old) of rubber monoculture plantations in Xishuangbanna, Southwest China. We investigated the C distribution across various tree sections, ranging from aboveground biomass (AGB) to belowground biomass (BGB), including litter, big dead branches, and different soil depths. A significant negative correlation was observed between total ecosystem C stocks and elevation in both age groups of rubber plantations. The highest ecosystem C stock of 197.90 Mg C ha–1 was recorded at 900 m in 8-year-old plantations, whereas in 12-year-old rubber plantations, the highest value of 183.12 Mg C ha–1 was found at 700 m. The total ecosystem C stocks decreased to its lowest level at 1000 m in both the 8-year-old and 12-year-old plantations, ranging between 113.05 Mg C ha–1 and 125.75 Mg C ha–1, respectively. We concluded that the total ecosystem C stocks were negatively correlated with elevation and significantly decreased from 8.05% to 51.55% and 11.46% to 42.96% between 700 m and 1100 m in both 8-year-old and 12-year-old plantations, respectively. However, no correlation was observed between the total soil C stocks and elevation in either age group of rubber plantations. Regardless of elevation gradient, the total ecosystem C stock of 12-year-old rubber plantations was 1.98% greater than that of 8-year-old rubber plantations. Biomass was the second largest contributor, while soil accounted for 82% to 90%, and the other factors contributed less than 2% of the total ecosystem C stock in both age groups. These fluctuations in C stocks along elevation gradients in both 8- and 12-year-old plantations suggested that rubber growth, biomass and C storage capacity decreased above 900 m and that age and elevation are key factors for biomass and C storage in monoculture rubber plantations.
Keywords: 
Subject: Environmental and Earth Sciences  -   Ecology

1. Introduction

Global warming is a major research issue globally, potentially causing significant adverse effects on forest composition, structure, and biological processes [1,2]. Carbon (C) losses due to land use changes in the tropics are estimated at 1.1 Gt C per year [3,4], adversely affecting the abiotic and biotic components of the Earth's ecosystems [5,6]. However, estimations of C stocks in deforested tropical forest areas are uncertain because of inaccurate biomass measurements and C concentrations [7]. Therefore, it is necessary to quantify the exact amount of C storage that is lost due to deforestation to mitigate global warming effects [8].
In tropical Southeast Asia, rubber (Hevea brasiliensis) cultivation is not a traditional agricultural practice [9]. After it originated from the Amazon basin, rubber cultivation began commercially in the 1950s [10]. Rubber has since become one of the rapidly cultivated commercial crops in Southeast Asia [11,12], with 90% of the region’s natural forests converted into monoculture rubber plantations due to income generated by latex commercialization [13]. The total area of rubber cultivation has increased from 5.5 Mha to 9.9 Mha globally over the last three decades [14] and is predicted to continue increasing over the next twenty years [15,16]. Initially, rubber cultivation in tropical Asia was confined to elevations less than 800 m above sea level (asl.), the natural upper range for rubber species distribution [17]. However, in Southwest China, rubber cultivation has extended to elevations of up to 1400 m due to land availability [18], despite studies showing that such a shift is not profitable [19,20]. This expansion into relatively high elevation has led to the conversion of species-rich tropical forests into rubber plantations, resulting in biodiversity loss, reduced biomass C storage, and increased C emissions [13]. While previous studies have reported biomass and C stocks along elevation gradients in forest ecosystems globally [21,22,23], there is limited information on the fluctuations in biomass and C stocks in rubber plantations along the elevation gradients in tropical China. Accurate estimation of rubber tree biomass and C stocks along different elevation gradients is needed to predict the global C budget and its effects on the future regional climate cycle.
Carbon storage in forests occurs through photosynthesis, primarily in aboveground vegetation, and is transferred to belowground vegetation, including roots, soil, litter, and dead wood [24]. For example, Liu et al. [25] estimated that 68% of biomass C is stored in the aboveground part and more than 45% total ecosystem C is stored in the soil of rubber plantations in tropical China. Ziegler et al. [26] reported that in Southeast Asia, the total ecosystem C stocks of rubber plantations ranged from 93 to 376 Mg C ha–1, whereas the total ecosystem C stocks of swidden systems ranged from 62 to 329 Mg C ha–1. However, these studies lack information on climatic conditions, aspects and elevation [26]. Understanding the effects of environmental factors on C exchanges and their role in the global C cycle is necessary to inform policymakers [27]. Elevation gradients are natural scientific predictors for investigating climatic factors and their effects on ecological processes, whereas stand age provides information for assessing C storage dynamics [28,29,30].
Therefore, this study aimed to evaluate biomass C storage and allocation along an elevation gradient in two different aged (8- and 12-year-old) rubber monoculture plantations in Xishuangbanna, Southwest China. We also aimed to understand how the total C storage in these rubber plantations is distributed among aboveground and belowground sections, including litter, big dead branches and different soil depths. Finally, we investigated the effects of stand age on the biomass and C stocks of rubber plantations.

2. Materials and Methods

2.1. Study Site and Stand Description

The study was conducted in Naban River basin in Xishuangbanna, Southwest China. It covers an area of 26,660 ha (22°04′ - 22°17′N, 100°32′ - 100°44′E), with an elevation range from 539 to 2304 m. The weather conditions feature a distinct combination of dry (November–April) and wet (May–October) seasons. The annual precipitation fluctuates from 1200 to 1700 mm, and the mean temperature varies from 18 to 22 °C. The soil is classified into two main categories: Ferralsols, which are the major type of soil, and Regolsols, which are the minor type of soil [31]. Yang et al. [32] reported that the area of rubber plantations in this region increased from 338 ha to 2858 ha from 1989-2012.
Five stands of rubber monoculture plantations were established along five elevation gradients (Figure 1). Each stand comprised two different age classes of 8- and 12-year-old plantations. Six sampling plots (20 m × 25 m) were established in each age class with planting specifications of 6 m × 2.5 m (inter and intra row spacing, respectively). The topographic features, such as slope, aspect, and elevation, in both the 8- and 12-year-old rubber plantations were recorded (Table 1).

2.2. Field Sampling and Measurements

The diameter at breast height (1.3 m, DBH) and height were measured for all rubber trees in each plot within 8- and 12-year-old plantations with DBH tape and a clinometer, respectively. We estimated the various components of aboveground biomass (AGB) and belowground biomass (BGB) according to allometric biomass models, which were recently established by Yang et al. [33] for the Xishuangbanna.
For litter collection, 10 (0.5 m2) litter collection traps were set up 5 m apart in each plot and collected once every month. Litterfall samples of rubber trees were sorted into leaves, branches, flowers/fruits, and miscellaneous, and the litter amount per unit area and the annual litter amount were measured. Litter samples were divided into two subsamples. One subsample of litter was oven-dried to a constant weight at 70 °C to calculate the fresh-to-dry biomass ratio; the other subsample was used for chemical element analysis. To collect big dead branches, we randomly set up six collection traps (5 m × 4 m) and collected them once every month. The number of big dead branches per unit area and their annual amount were measured. After measurement, we divided the big dead branches into two subsamples: one was oven-dried to a constant weight at 70 °C to calculate the fresh-to-dry biomass ratio, and the other was used for chemical element analysis.
Three soil profiles were dug at depths of 110 cm at the upper, middle, and lower 3 positions in each plot, and soil samples were collected from six soil depths (0–10, 10–30, 30–50, 50–70, 70–90 and 90–110 cm). Equal amounts of soil samples taken from the same depth in the same plot were thoroughly mixed to obtain composite soil samples. The composite soil samples were air dried at room temperature and sieved with a 2 mm mesh to remove gravel and vegetation. For the measurement of soil bulk density, soil samples were collected from each soil depth, and the soil bulk density was calculated by dividing the weight of the soil after oven-drying the soil samples to a constant weight of 105° over the core volume.
Elemental analysis was conducted to measure the C concentration in litter and bid dead branches as well as in soil samples via a Vario Max CNS elemental analyzer. We multiplied the dried biomass and C conversion coefficient (0.45) to calculate the above- and belowground C stocks of rubber tree [25]. We calculated the C stock in the litter and big dead branches by multiplying their oven-dried biomass by their respective C concentrations. The soil C stock was estimated from the C concentration at each soil depth and multiplied by the bulk density and depth interval.

2.3. Statistical Analysis

The effects of elevation gradient on tree biomass, biomass C stocks, litter C concentrations, soil C concentrations and soil bulk density were tested via one-way ANOVA, followed by Tukey’s Honest significant difference test when one-way ANOVA was significant. The relationships among elevation, age, tree component C stock, soil C stock and total C stock were assessed via linear modeling with the function lm. We conducted all the analyses in R version 4.0.3 (R-Foundation for Statistical Computing, USA).

3. Results

3.1. Tree Biomass Partitioning

A negative correlation was observed between the total biomass of above- and below-ground sections of rubber trees and elevation in both age groups of rubber plantations (Table 2). However, no significant difference in total biomass and various components was noted across elevations ranging from 700–900 m in the 8-year-old plantations. Notably, a significant decline in biomass was observed at 1000 m and 1100 m compared with below 900 m in the 8-year-old plantations. In contrast, 12-year-old plantations presented a similar elevational trend and an obvious decrease in total biomass and various components from 900 m. Across all the elevation gradients, the total biomass of the above- and belowground tree sections were greater in the 12-year-old plantations than that of 8-year-old plantations. Additionally, stems contributed the most biomass, followed by roots, branches and foliage, in both age groups.

3.2. Litter Biomass and C Concentration

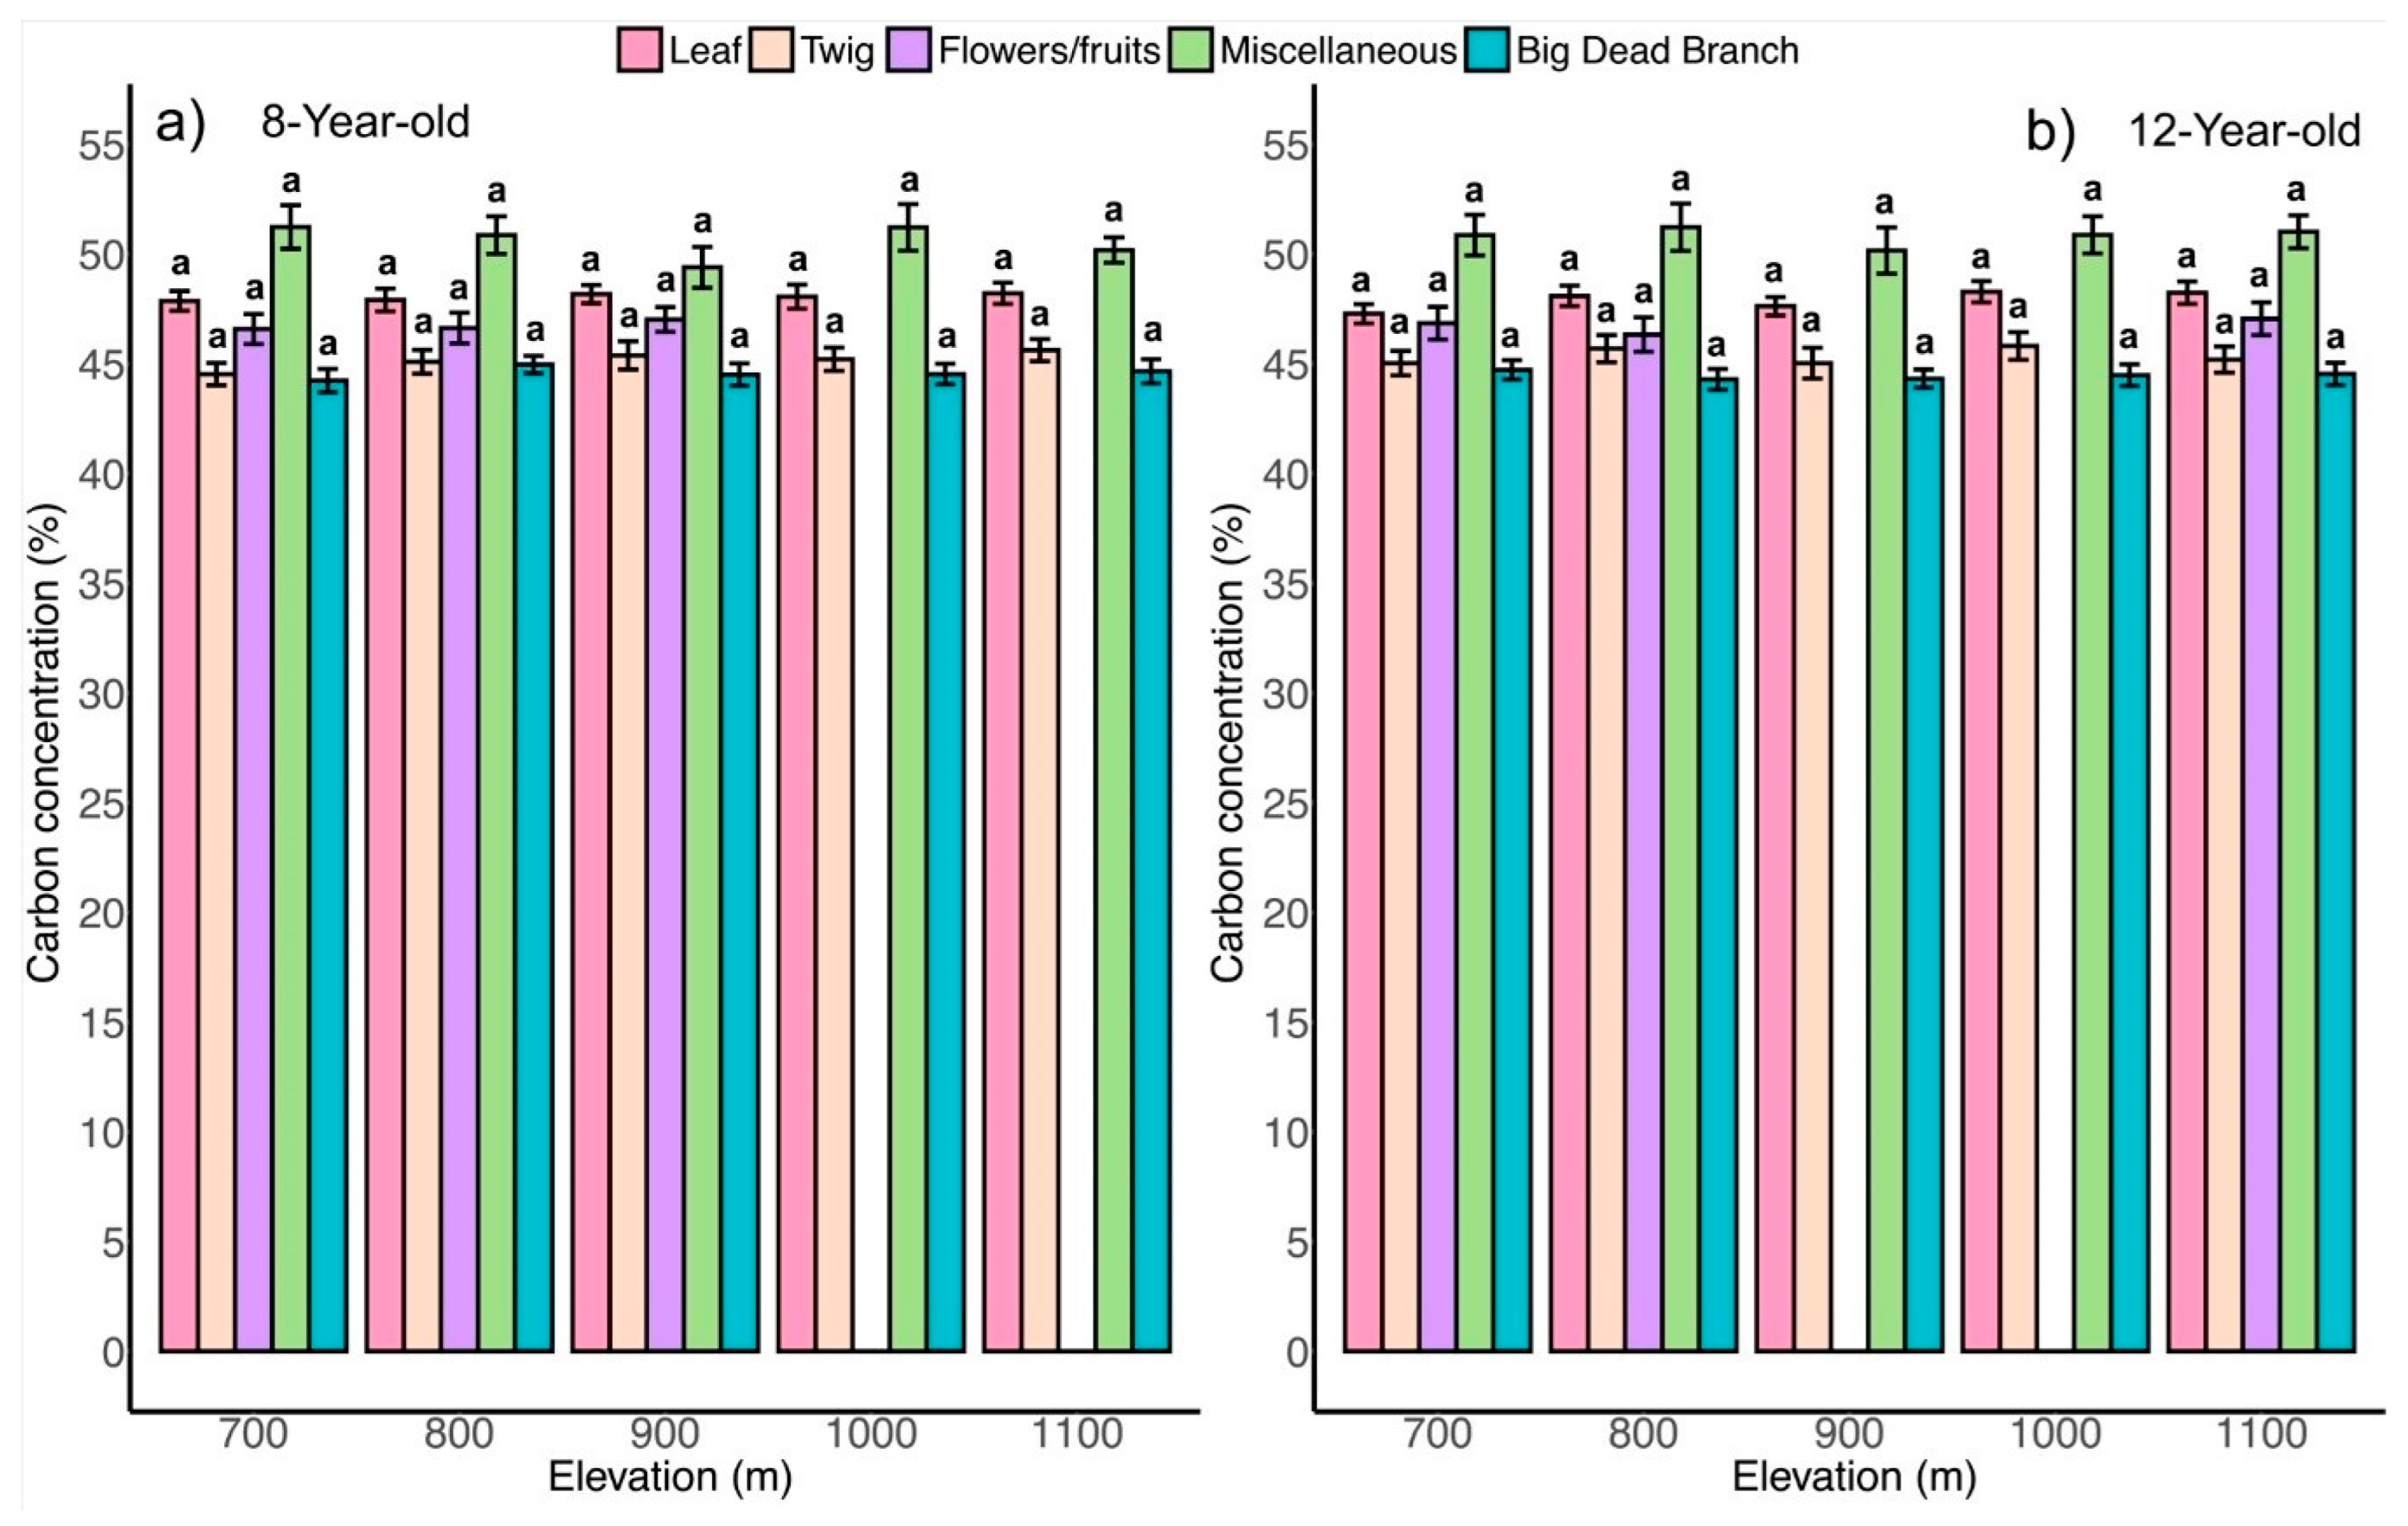
Litter biomass was negatively correlated with elevation and significantly decreased across elevation gradients in both age groups of rubber plantations (Table 3). The highest litter biomass was observed at 700 m and the lowest at 1100 m. The overall litter biomass of the 12-year-old plantations exceeded that of the 8-year-old plantations, ranging from 5.62 Mg ha–1 to 2.78 Mg ha–1 and from 4.95 Mg ha–1 to 2.23 Mg ha–1, respectively. Across all elevation gradients, leaves contributed the most biomass, followed by twigs and big dead branches, whereas miscellaneous and flowers/fruits contributed the least biomass in both age groups. In terms of the litter C concentration, the miscellaneous presented the highest values in both the 8-year-old (51.23 ± 0.99% at 700 m) and 12-year-old (51.22 ± 1.08% at 800 m) plantations, respectively (Figure 2). On the other hand, big dead branches had the lowest values in 8-year-old (44.23 ± 0.53% at 700 m) and 12-year-old (44.29 ± 0.47% at 800 m) plantations, respectively. The leaf litter C concentration ranged from 47.86 ± 0.45% at 700 m to 48.21 ± 0.48% at 1100 m in the 8-year-old plantations and varied from 47.28 ± 0.44% at 700 m to 48.28 ± 0.49% at 1000 m in the 12-year-old plantations.

3.3. Tree Components C Stock

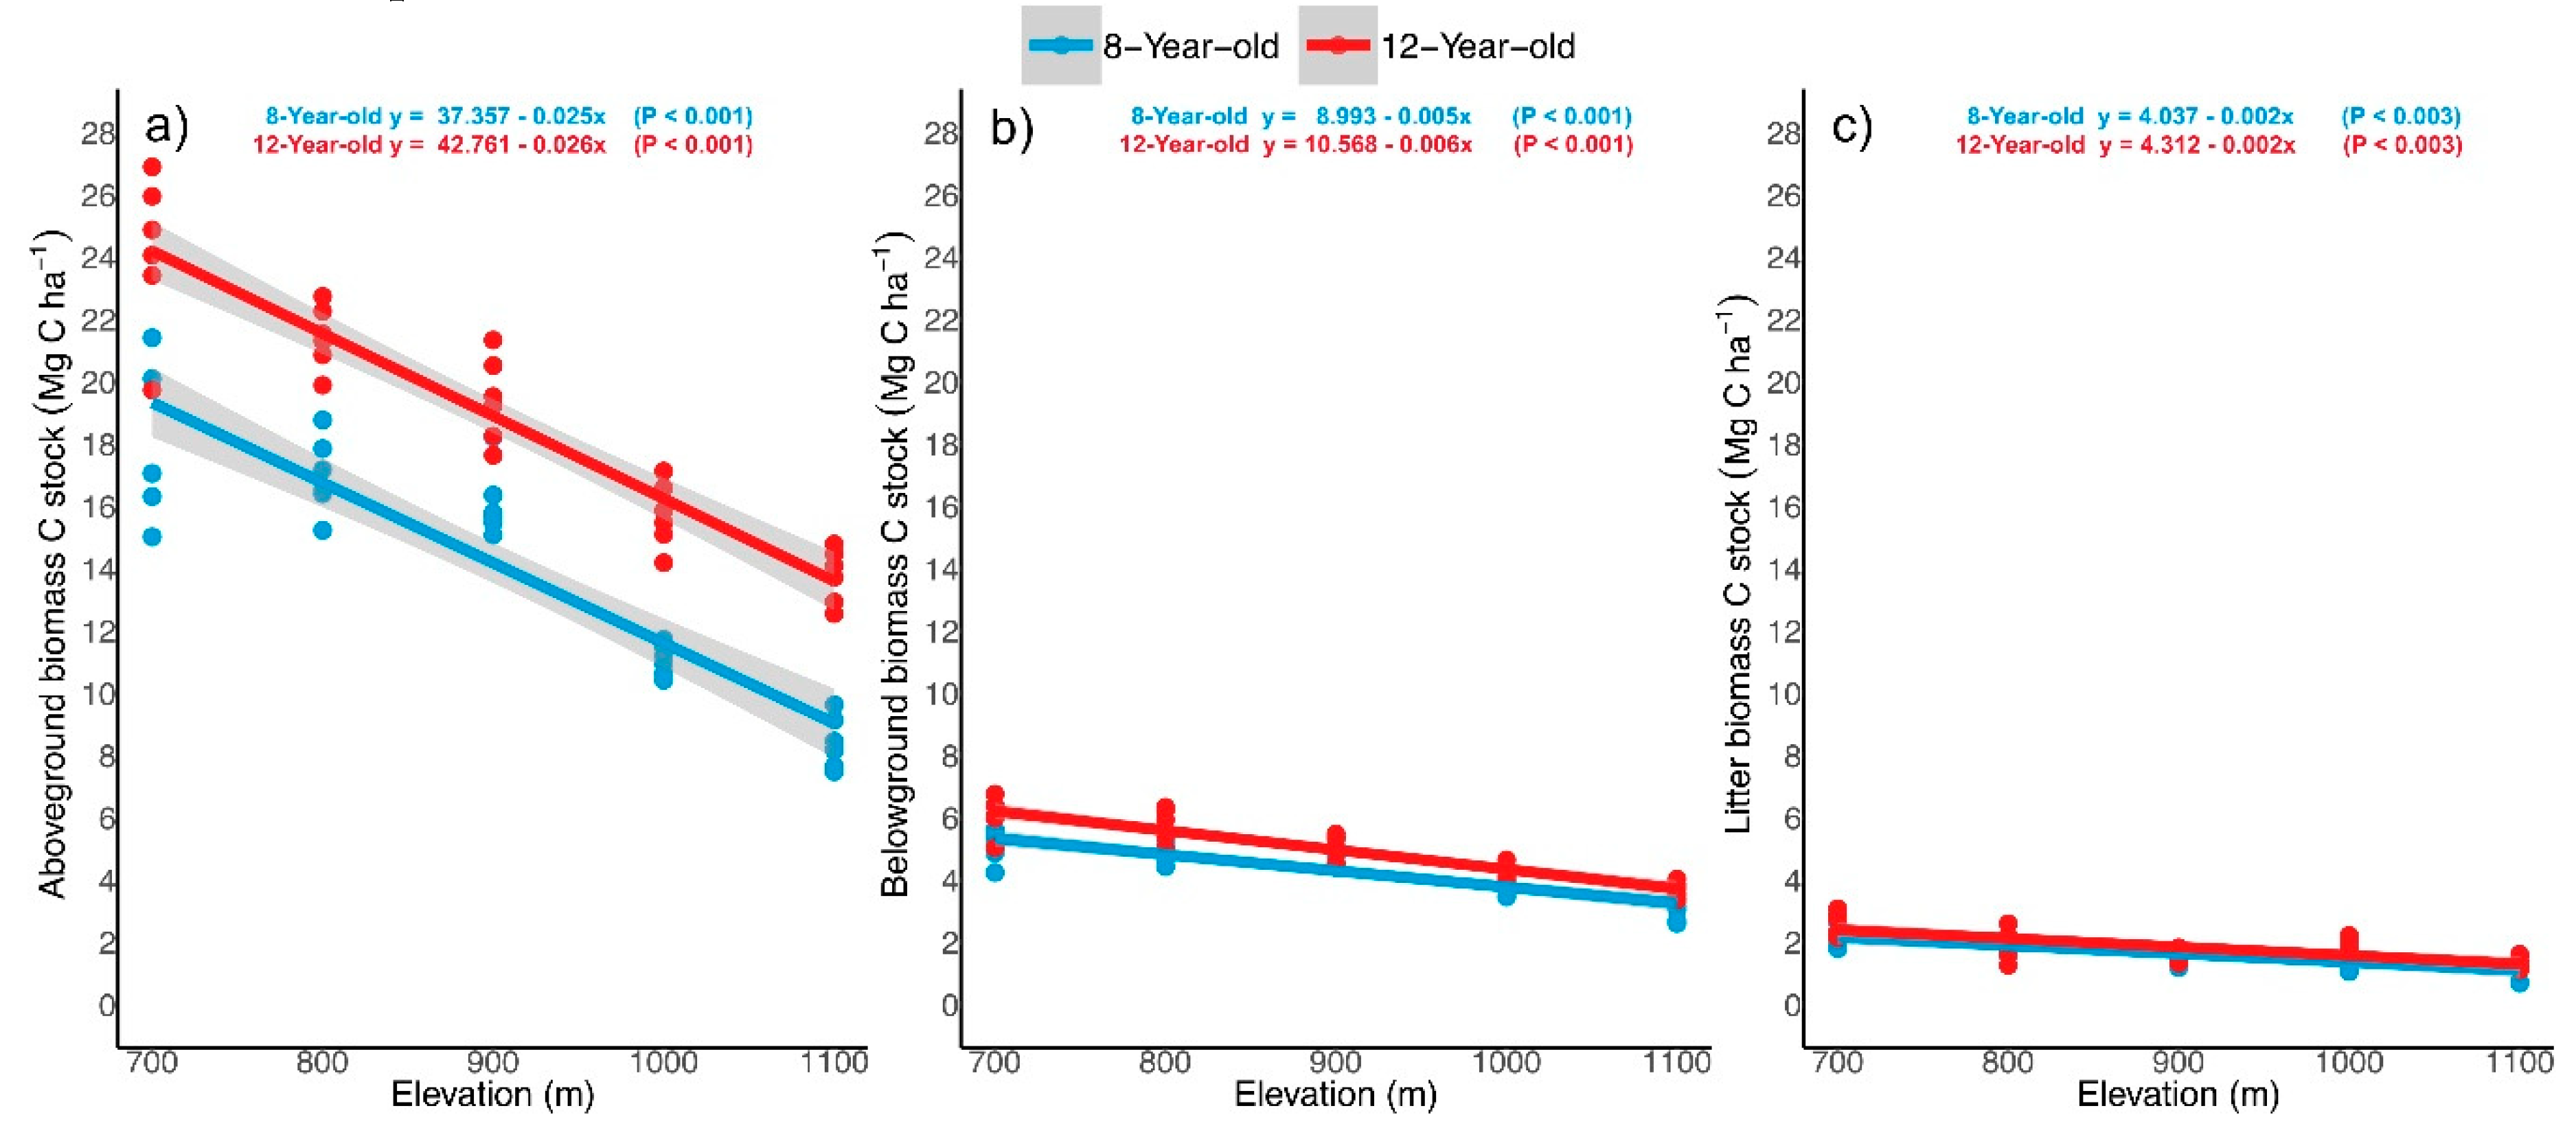
We observed a significant negative correlation between the total biomass C stock (AGB and BGB) and elevation in both age groups of rubber plantations (Figure 3a and b). The C stock of AGB showed a decreasing trend with elevation, declining from 7.33% to 54.06% in 8-year-old plantations and 11.26% to 43.05% in 12-year-old plantations between 700 m and 1100 m. This decline in AGB C stock between 700 m and 1100 m was more pronounced than that in the BGB C stock, which varied from 2.24% to 40.88% and from 5.23% to 39.56% in the 8- and 12-year-old plantations, respectively. Comparatively, the highest biomass C stocks in above- and belowground biomass components were stored at 700 m, whereas the lowest were observed at 1100 m in both age groups. However, the total biomass C stocks increased with plantation age and ranged from 23.39 Mg C ha–1 to 11.41 Mg C ha–1 in the 8-year-old plantations and from 30.21 Mg C ha–1 to 17.41 Mg C ha–2 in the 12-year-old plantations.
Litter C stocks in both 8- and 12-year-old plantations were also negatively correlated with elevation (Figure 3c) and varied from 2.35 Mg C ha–1 to 1.06 Mg C ha–1 in the 8-year-old plantations and from 2.65 Mg C ha–1 to 1.33 Mg C ha–1 in the 12-year-old plantations. Litter C stocks between 700 m and 1100 m decreased from 26.26% to 55.88% in the 8-year-old plantations and from 27.54% to 49.89% in the 12-year-old plantations. Both age groups presented around 30% decline in litter C stocks at 1100 m compared with 700 m.
Figure 3. Relationship between elevation (m) and (a) aboveground biomass C stock (Mg C ha–1), (b) belowground biomass C stock (Mg C ha–1) and (c) litter C stock (Mg C ha–1) in 8-year-old and 12-year-old monoculture rubber plantation.
Preprints 112882 g003

3.4. Soil C Concentration and Stock

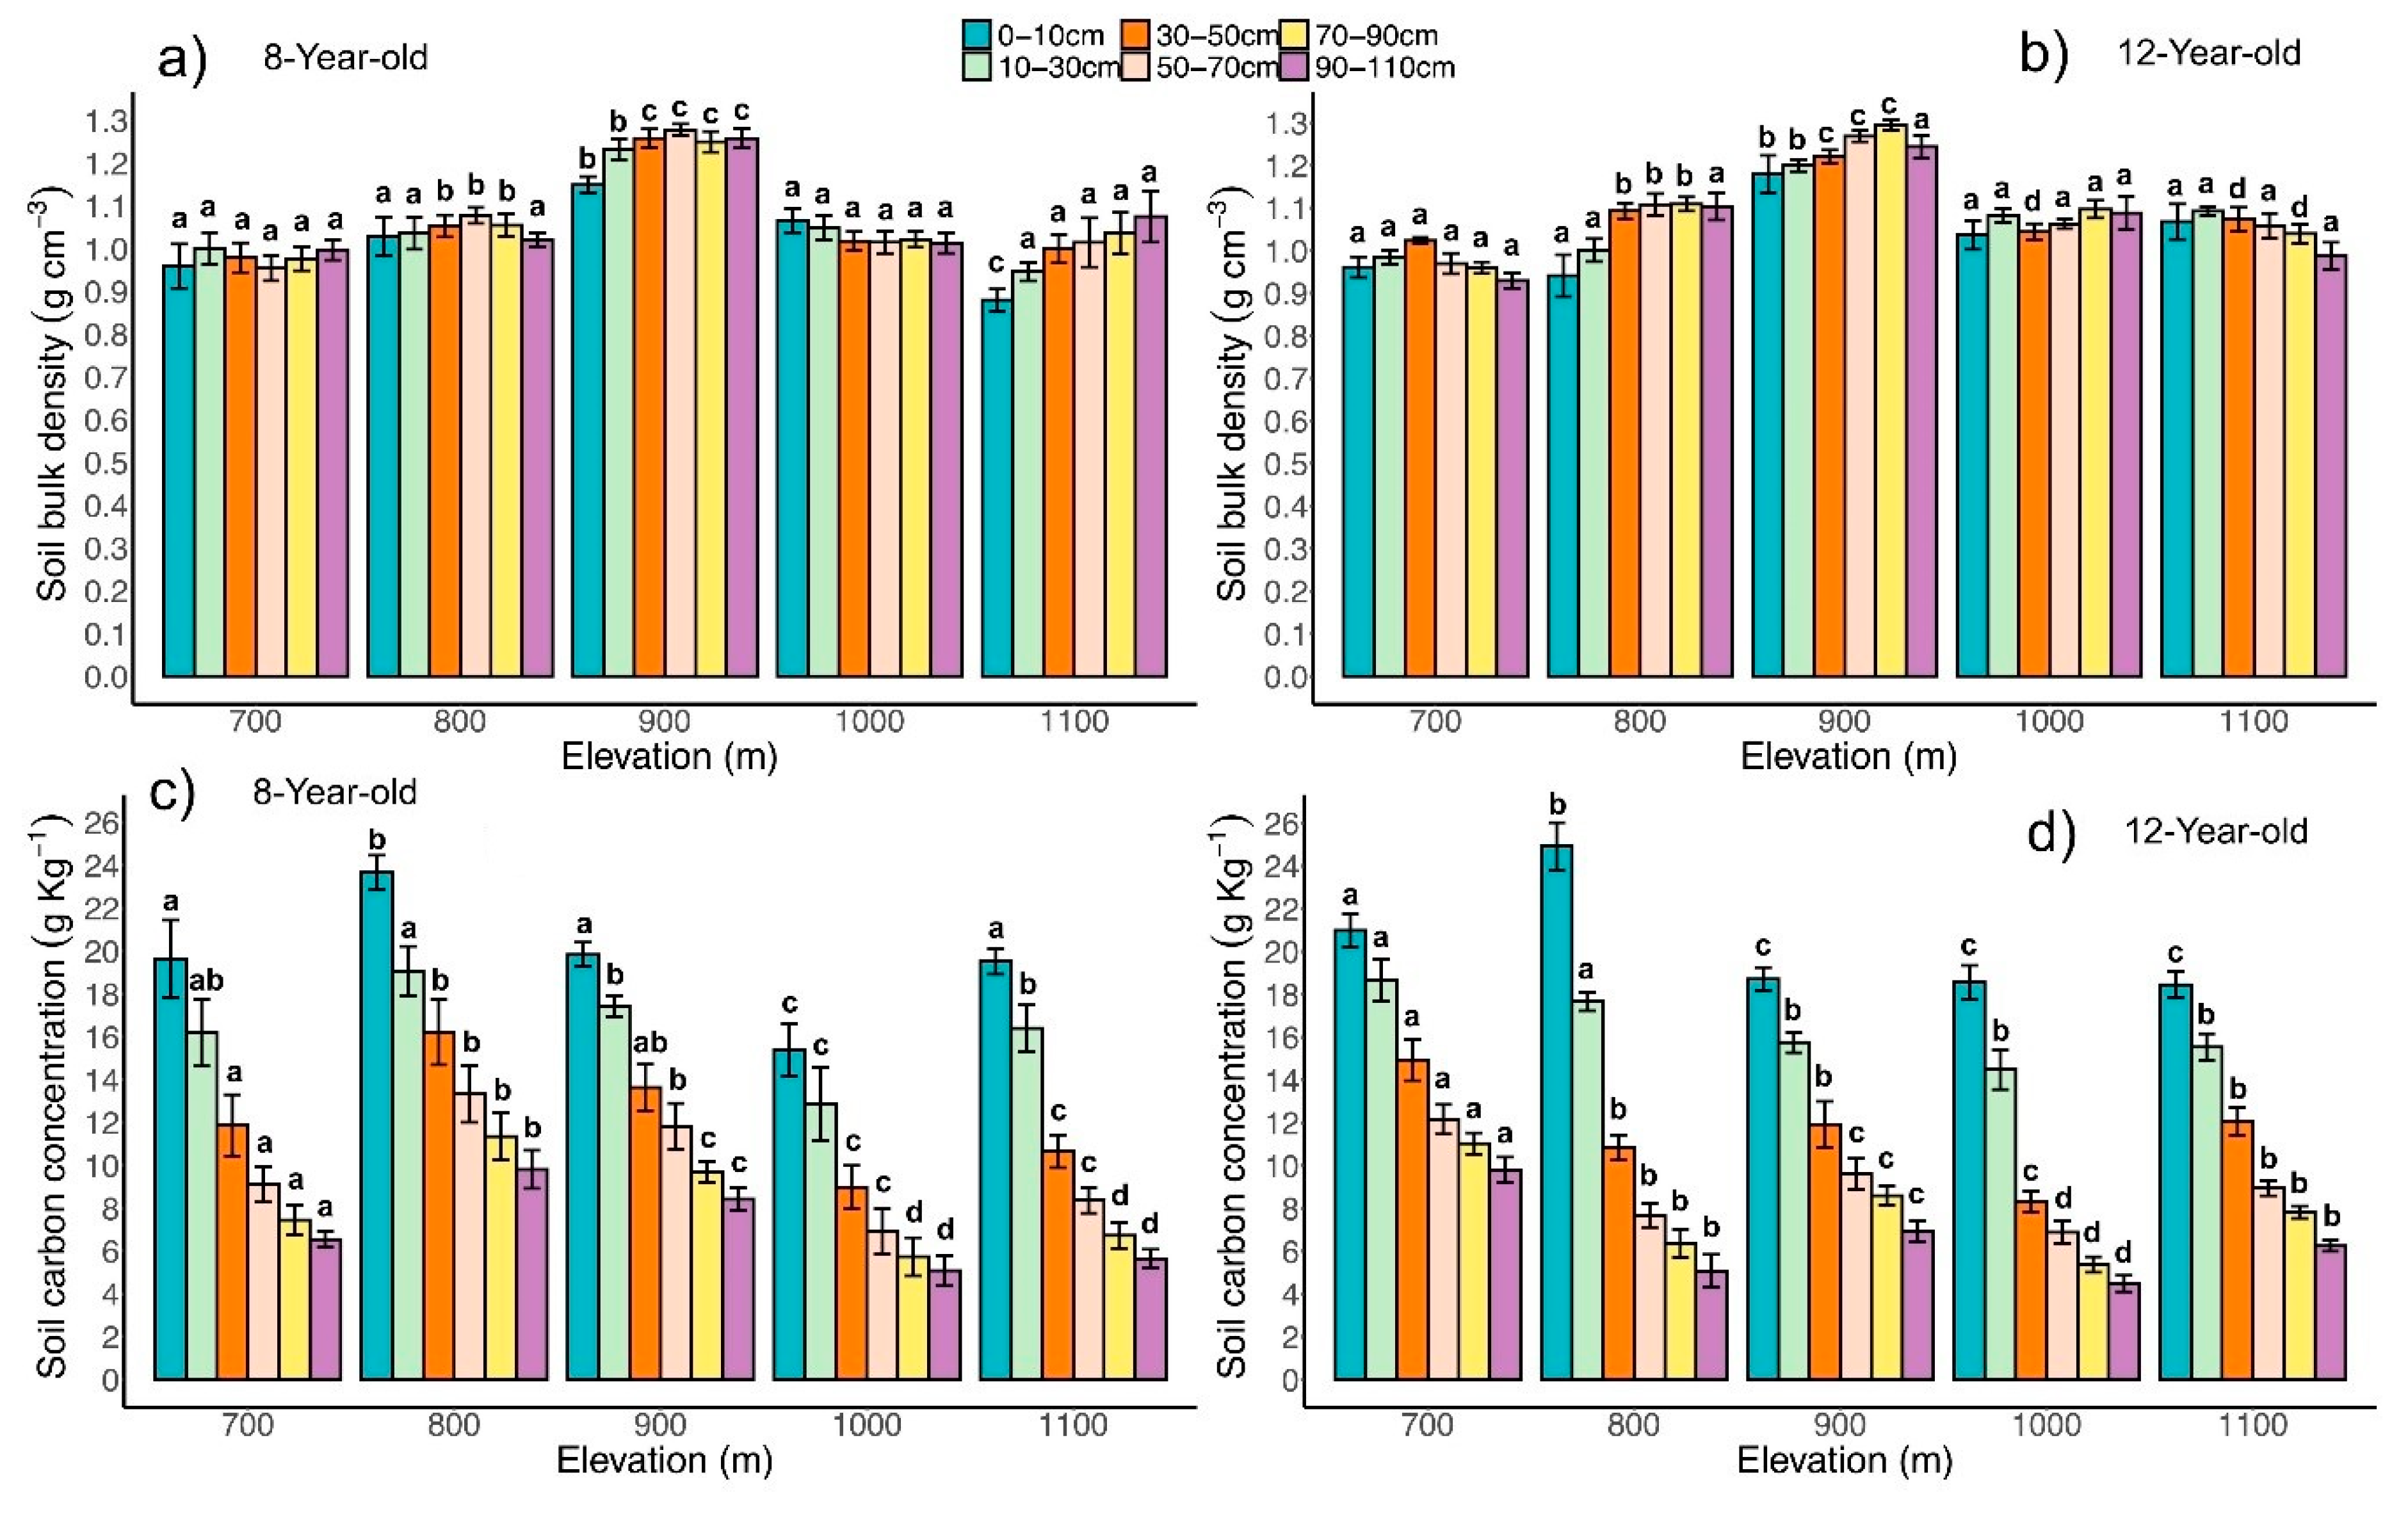
The elevation gradient and soil depth significantly influenced the soil C concentration without an interaction effect in both age groups of rubber plantations (Figure 4c and d). The average soil C concentration decreased significantly with increasing soil depth in both age groups. However, it fluctuated with increasing elevation at the 110 cm depth, with the highest values observed at 800 m and 700 m in the 8- and 12-year-old plantations, respectively, while the lowest values were found at 1000 m in both age groups. In contrast, the average soil bulk density increased with soil depth, ranging from 1.02 g cm−3 to 1.07 g cm−3 and from 1.02 g cm−3 to 1.09 g cm−3 in the 8- and 12-year-old plantations, respectively (Figure 4a and b). Across all elevation gradients, the highest soil bulk density was found at 900 m, and the lowest was found at 700 m in both age groups.
No correlation between the total soil C stock and elevation was detected in either age group of rubber plantations (Figure 5a). The total soil C stock at 110 cm depth decreased along the elevation gradient and fluctuated, with the highest values of 175.77 Mg C ha–1 and 153.51 Mg C ha–1 at 900 m and the lowest values of 96.49 Mg C ha–1 and 103.90 Mg C ha–1 at 1000 m in both 8- and 12-year-old plantations, respectively (Table 4). Compared with 12-year-old plantations, soil C stock in the 8-year-old plantations decreased at 700 m (32.36 Mg C ha–1), 1000 m (7.42 Mg C ha–1) and 1100 m (14.72 Mg C ha–1), whereas it increased at 800 m (44.92 Mg C ha–1) and 900 m (22.27 Mg C ha–1). In both age groups, 59.73% to 60.12% of soil C was stored within the 0-50 cm depth along each elevation gradient. However, soil C stock declined with soil depth, ranging from 54.14 Mg C ha–1 to 52.60 Mg C ha–1 at 0−30 cm and from 15.10 Mg C ha–1 to 14.42 Mg C ha–1 at 90−110 cm across all elevation gradients in both 8- and 12-year-old plantations. Regardless of elevation gradient, total soil C stocks at the 110 cm soil depth were slightly high in the 8-year-old plantations.

3.5. Total Ecosystem C Stock

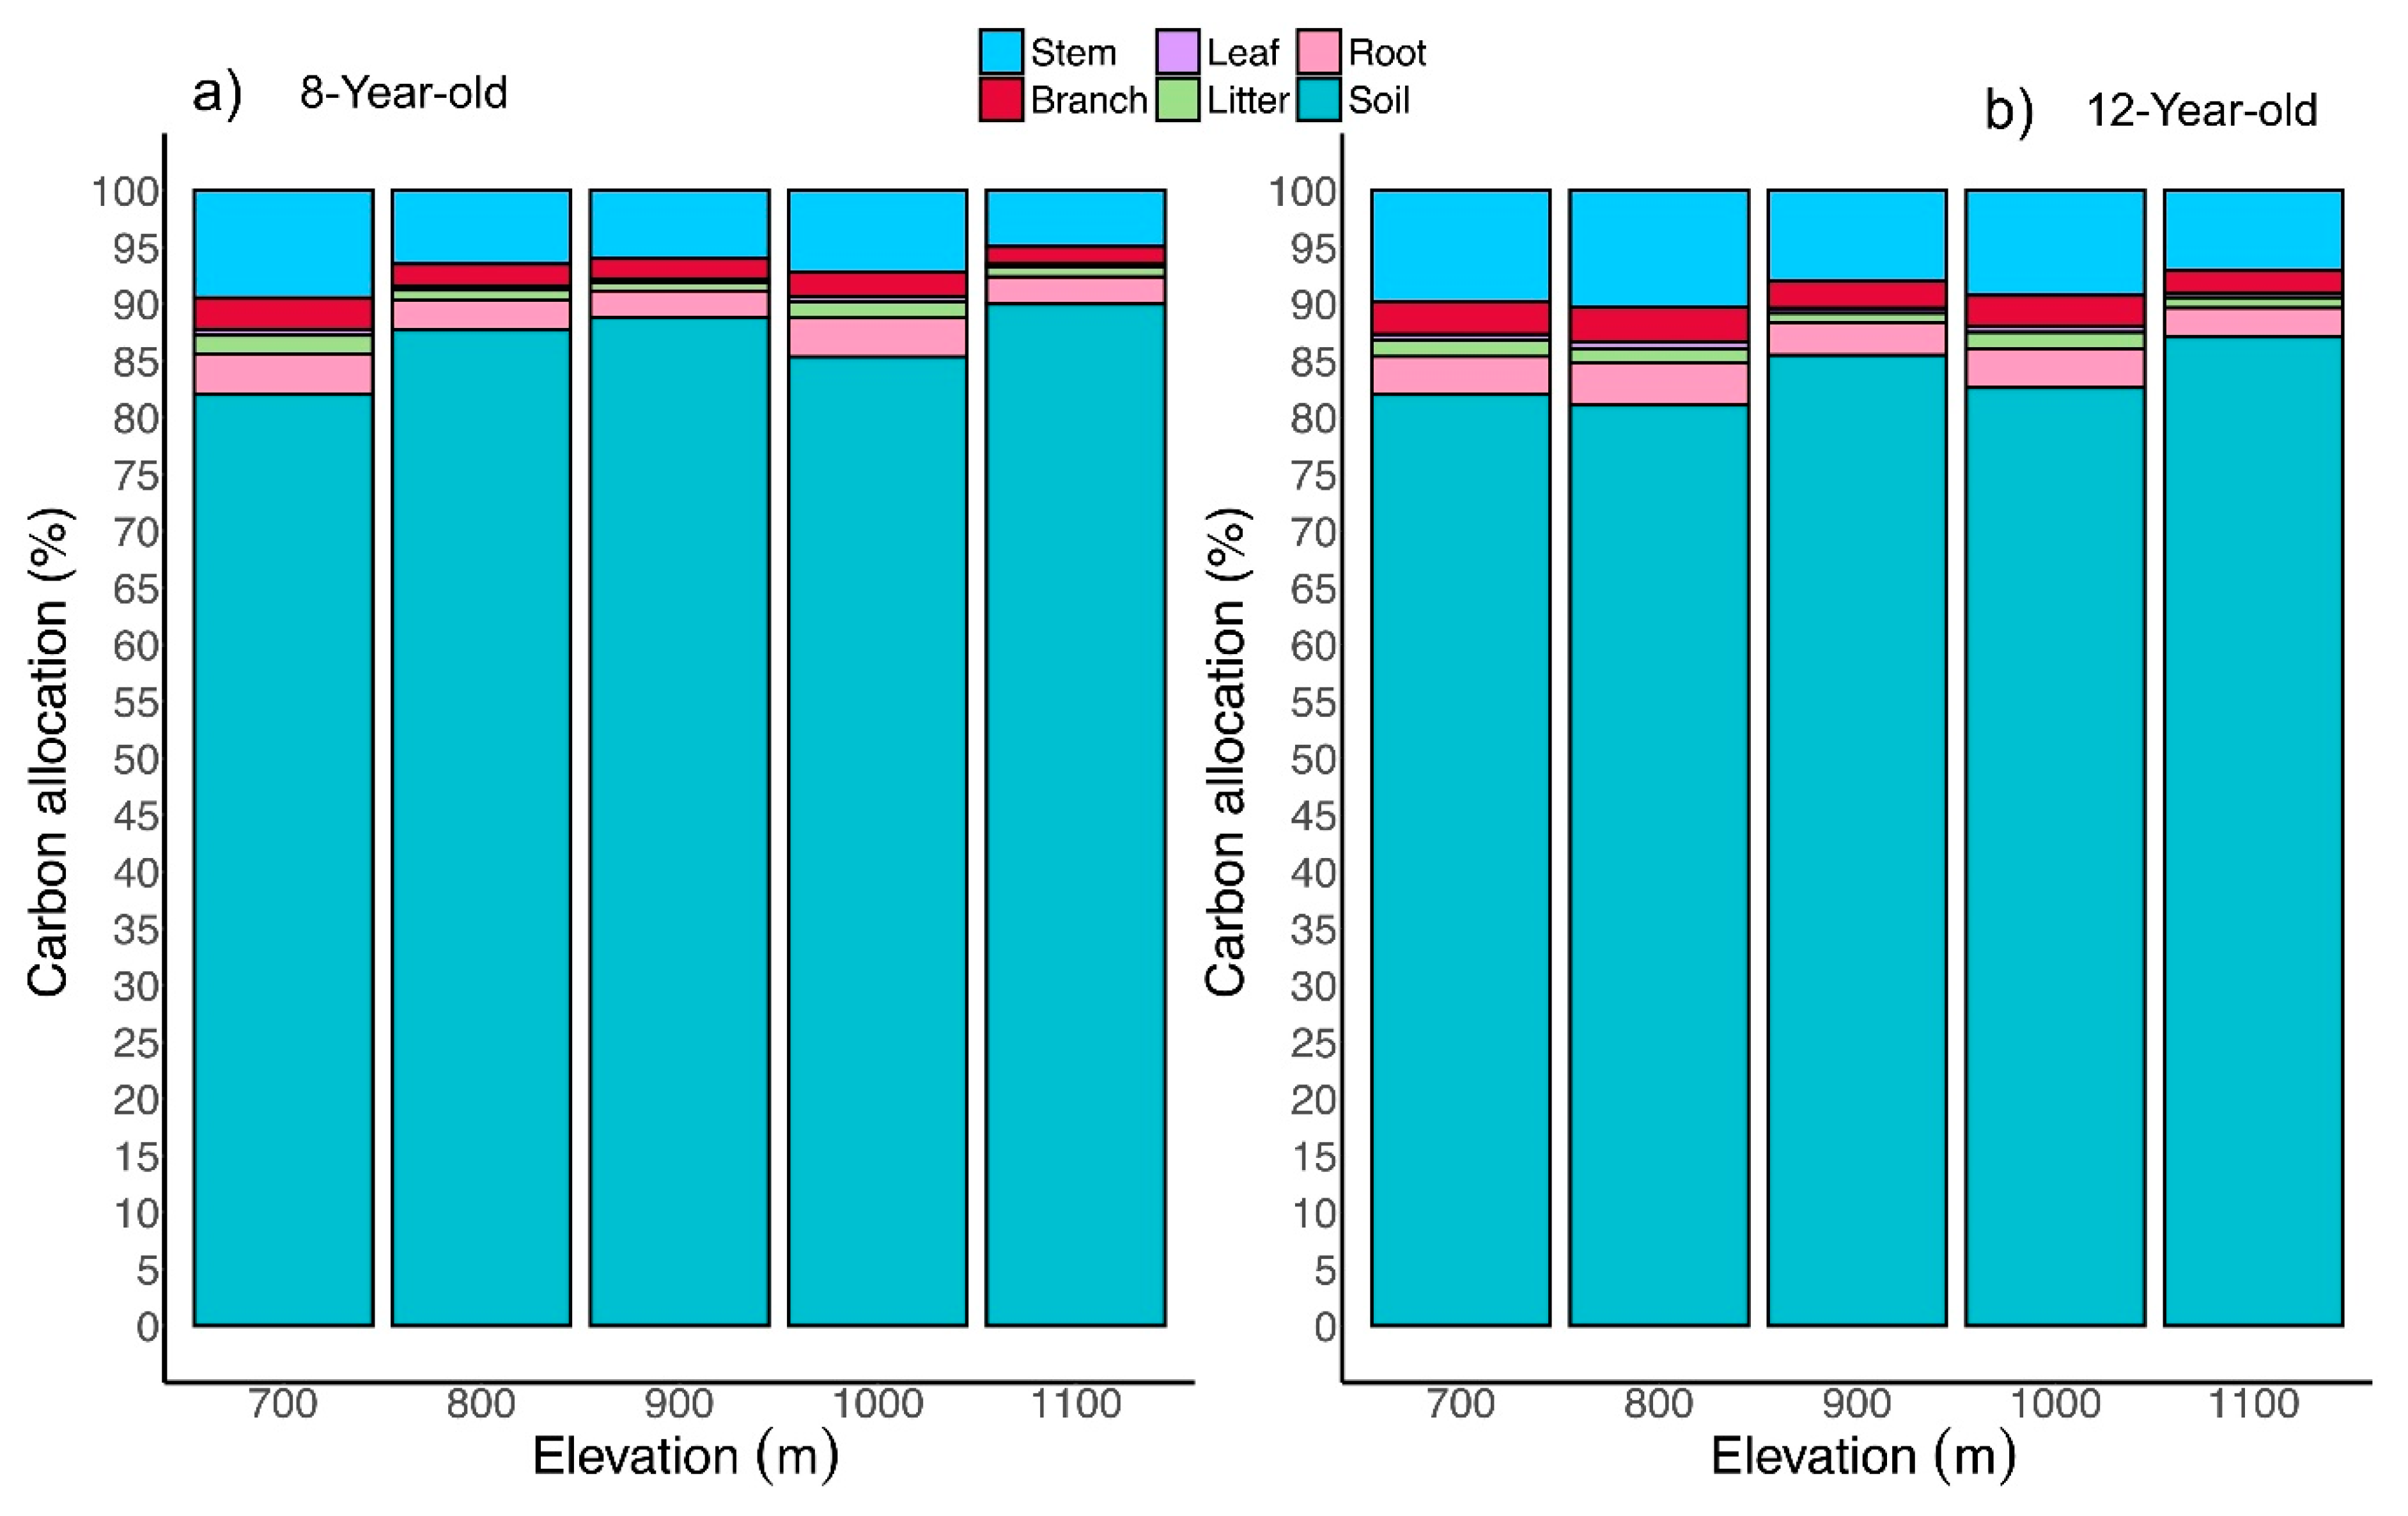
We observed a significant negative correlation between total ecosystem C stocks and elevation in both age groups of rubber plantations (Figure 5 b). The total ecosystem C stocks were relatively high in the 12-year-old rubber plantations and fluctuated with elevation in both age groups, ranging from 197.90 Mg C ha–1 at 900 m to 113.05 Mg C ha–1 at 1000 m in the 8-year-old plantations and from 183.12 Mg C ha–1 at 700 m to 125.75 Mg C ha–1 at 1000 m in the 12-year-old plantations. Across all elevation gradients, the soil was the largest C pool, accounting for 82.08% to 90% and 82.6% to 87.14% of the total ecosystem C stocks in both 8- and 12-year-old plantations, respectively (Figure 6). Biomass was the second-largest contributor and litter contributed less than 2% of the total ecosystem C stock across all elevation gradients in both 8- and 12-year-old plantations. However, the total biomass C stock significantly decreased from 8.05% to 51.55% and 11.46% to 42.96% between 700 m and 1100 m in both 8- and 12-year-old plantations. Regardless of elevation gradient, the total ecosystem C stock of 12-year-old plantations were 1.98% greater than that of 8-year-old plantations.

4. Discussion

4.1. Biomass C Stock

Previous studies in tropical regions have shown that the growth rates of rubber trees are profoundly affected by climate conditions, soil types, age and elevation gradients [32,34,35,36]. However, to date, no study has explained the effects of age and elevation gradient on the C stock of rubber trees. In the present study, the highest tree C stock in 8- and 12-year-old rubber plantations was observed at 700 m (Figure 3), which was lower than those reported in a 7-year-old rubber plantation (45 m asl) in Rio de Janeiro, Brazil [37], and a 12-year-old rubber plantation (500 m asl) in Minas Gerais, Brazil [38]. These variations in the tree C stock illustrate the negative effect of the elevation gradient on the tree C stock of rubber plantations. The C stock of trees at lower elevations, specifically at 700 m, varied between 30.21 Mg C ha–1 in 12-year-old rubber plantations and 23.39 Mg C ha–1 in 8-year-old rubber plantations. These values were higher than the tree C stock of 13- and 7-year-old plantations in tropical China planted at elevations between 620 m and 587 m, respectively [25], and lower than the average tree C storage of 55.3 Mg C ha−1 in 9-year-old plantations in Southwest China planted at an elevation of 590 m [39]. Additionally, the reported value of the tree C stock of 61.4 Mg C ha−1 by Li et al. [40] at elevation under 800 m in rubber plantations surpassed our findings. Above 700 m, there was a significant reduction in the tree C stock in both 8- and 12-year-old rubber plantations. At 1100 m, the lowest tree C stock ranged from 17.41 Mg C ha–1 in 12-year-old rubber plantations to 11.41 Mg C ha–1 in 8-year-old rubber plantations. Therefore, this significant reduction in the tree C stock at relatively high elevations explains the elevation-related impact on the tree C stock in rubber plantations. Notably, in Xishuangbanna, China, the biomass C stock in tropical seasonal rainforests was reported to be 165.9 Mg C ha–1 by Lü et al. [41] Consequently, at 700 m, the biomass C stock of rubber trees experienced a loss of 135.69 Mg C ha–1 in 12-year-old rubber plantations and 142.51 Mg C ha–1 in 8-year-old rubber plantations. At higher elevations at 1100 m, the biomass C stock of rubber trees experienced further C losses of 148.49 Mg C ha–1 in 12-year-old rubber plantations and 154.49 Mg C ha–1 in 8-year-old rubber plantations.
The leaf litter C concentrations along all the elevation gradients in the 8- and 12-year-old plantations (Figure 3) were lower than those in the 7- and 12-year-old rubber plantations in southern Coˆte d’Ivoire [42] and higher than those in the rubber plantation at an elevation between 700 m and 830 m in Xishuangbanna, China [43]. The average litter C concentrations along all elevation gradients in the 8- and 12-year-old plantations (Figure 2a and b) were lower than those in the 7- and 13-year-old plantations in tropical China, which are planted at elevations ranging from 587 m and 620 m, respectively [25], and in the 7- and 9-year-old plantations in Southwest China, which are planted at an elevation of 590 m [39]. The highest litter C stock in 8-year-old rubber plantations (2.35 Mg C ha–1) was observed at 700 m (Table 3), which exceeded the litter C stock reported in 7-year-old rubber plantations of tropical China (1.42 Mg C ha–1) planted at an elevation range of 580–595 m [25], Southwest China (1.8 Mg C ha–1) planted at an elevation of 587 m [39] and rubber plantations in Xishuangbanna, China planted at an elevation range of 700–830 m [43]. However, the litter C stock in 8-year-old rubber plantations decreased at 700 m compared with that in 9-year-old plantations in Southwest China (3.6 Mg C ha–1) planted at an elevation of 590 m [39]. Above 900 m, the litter C stock in 8-year-old rubber plantations was lower than that in regional rubber plantations. In 12-year-old rubber plantations at 700 m, the highest litter C stock of 2.65 Mg C ha–1 was greater than that in 13-year-old rubber plantations in tropical China (2.35 Mg C hm–1) planted at an elevation range of 600–620 m [25] but lower than the litter C stock in 14-year-old rubber plantations (4.1 Mg C ha–1) in western Ghana and Mato Grosso in Brazil [44]. However, the litter C stock along all elevation gradients in both the 8- and 12-year-old plantations decreased relative to that in the secondary forest in Xishuangbanna, China (2.7 Mg C ha–1) [43], and the greatest reduction was observed above 900 m. The observed variations in the litter C stock explain the effects of age and elevation on the litter C stock in rubber plantations.

4.2. Soil C Stock

The soil C stock in the topsoil at 0-50 cm depth in 8-year-old rubber plantations at an elevation of 700 m (Table 4) was lower than that in 7-year-old rubber plantations in tropical China (580 m asl) [25], Southwest China ( 587 m asl) [39] and Xishuangbanna, China (700–800 m asl) [43] but increased at 900 m while experiencing a decline above 900 m. In 12-year-old rubber plantations, the soil C stock in the topsoil at 0–50 cm depth at elevations of 700 m and 900 m was greater than that in 13-year-old rubber plantations in tropical China (580 m asl) [25] and 9-year-old rubber plantations in Southwest China (587 m asl) [39] but decreased across other elevation gradients. At an elevation of 900 m, the highest values of soil C stock were observed in both 8- and 12-year-old rubber plantations across a depth of 110 cm, ranging from 175.77 Mg C ha–1 to 153.51 Mg C ha–1, which exceeded those reported by de Blécourt et al. [43] in Xishuangbanna, China, planted at elevations between 700 m and 830 m, and rubber plantations in western Ghana and Mato Grosso Brazil [44]. Moreover, the soil C stock observed in our study surpassed that of a 20-year-old rubber plantation in Hainan, China [45], which stores 75.5 Mg C ha–1 across a 100 cm soil depth.
The lowest total soil C stock in 8- and 12-year-old rubber plantations was observed at 1000 m (Table 4), which was lower than the soil C stock in 7- and 13-year-old plantations in tropical China planted at an elevation between 587 m and 620 m, respectively [25], and the soil C stock in 7- and 9-year-old plantations in Southwest China planted at an elevation of 590 m [39]. However, the total soil C stock at 1000 m in 8-year-old rubber plantations was greater than that in 7-year-old rubber plantations in Rio de Janeiro, Brazil [37]. These variations in the soil C stock illustrate the effects of age and elevation on the regional soil C stock in rubber plantations. Notably, at 1000 m, the total soil C stock in 8- and 12-year-old rubber plantations was lower than that in tropical soils in China [46]. However, the soil C stock in the secondary forest in Xishuangbanna, China [43], was reported to be 178.7 Mg C ha–1 across 100 cm depth. Consequently, our findings revealed losses of 2.93 Mg C ha–1 and 25.19 Mg C ha–1 in the soil C stock for both the 8- and 12-year-old rubber plantations at 900 m and further reductions in the soil C stock above 900 m. This comparison revealed the influences of elevation, age, and land-use history on soil C dynamics in rubber plantations.

4.3. Total Ecosystem C Stock

The total ecosystem C stock at 700 m in the 8- year-old rubber plantation (143.65 Mg C ha–1) (Figure 5a) was lower than that in the 7- year-old rubber plantations in tropical China [25], Southwest China [39], and Rio de Janeiro Brazil [37], but it increased at 800 m and 900 m, while it decreased above 900 m and presented the lowest total ecosystem C stock (113.05 Mg C ha–1) at 1000 m. The total ecosystem C stock at 700 m and 900 m in the 12- year-old rubber plantations (183.12 Mg C ha–1) and (179.56 Mg C ha–1), respectively (Figure 5b), was greater than that in the 13-year-old rubber plantations in tropical China [25] and the 14-year-old rubber plantations in Mato Grosso Brazil [38] but decreased above 900 m and reached the lowest total ecosystem C stock (125.75 Mg C ha–1) at 1000 m. The total ecosystem C stock in the secondary forest in Xishuangbanna, China, was 181.4 Mg C ha−1 [43]. Therefore, in the present study, the total ecosystem C stock decreased, with a loss of 68.35 Mg C ha–1 at 1000 m in an 8-year-old rubber plantation and 55.65 Mg C ha–1 at 1000 m in a 12-year-old rubber plantation (Figure 5a and b). In contrast, the total ecosystem C stock in the tropical seasonal rainforest in Xishuangbanna, China, was 260.5 Mg C ha−1 [41]. Thus, the total ecosystem C stock in both age groups of rubber plantations decreased, with a loss of 62.67 Mg C ha–1 at 900 m in 8-year-old rubber plantations and 77.38 Mg C ha–1 at 900 m in 12-year-old rubber plantations (Figure 5a and b). Notably, above 900 m, the contribution of the soil C stock to the total ecosystem C stock decreased at 1000 m, and the contribution of the biomass C stock to the total ecosystem C stock decreased at 1100 m in both 8-year-old and 12-year-old rubber plantations (Figure 6a and b).

4.4. Implications of C Storage on the Elevation Gradient

The rapid expansion of rubber monoculture plantations in Xishuangbanna, Southwest China, has increased local economies through latex production [13]; however, this expansion comes at the cost of natural ecosystem degradation [17]. Planting rubber monocultures at relatively high elevations (> 900 m) in Xishuangbanna, China (Figure 5), notably reduces the C storage capacity, highlighting the unsuitability for converting natural tropical forests [41,43]. Although C storage increases with plantation age in our study, peaking at approximately 22 years [25], converting degraded forests with low carbon storage [47] into rubber monoculture plantations at relatively high elevations could increase C retention [8]. However, challenges such as declining latex prices [48] and biodiversity loss [49] threaten the long-term sustainability of rubber plantations in Xishuangbanna, China [50]. In this context, rubber-based agroforestry systems offer potential alternatives. Min et al. [51] reported that rubber intercropping with annuals was positively correlated with elevation, and Ziggler et al. [26] reported that rubber agroforestry with leguminous species significantly increased the C stock and soil fertility. Understanding how the integration of diverse plant species in rubber monoculture plantations at higher elevations is related to each other and rubber trees are fundamental to our ability to explain the effects of rubber-based agroforestry systems. Therefore, further research is crucial to fully understand the ecological and economic impacts of such systems at higher elevations in Xishuangbanna, China.

5. Conclusions

The study revealed a significant negative correlation between total ecosystem C stocks and elevation in monoculture rubber plantations. The lowest total ecosystem C stocks were at 1000 m, with 113.05 Mg C ha–1 in 8-year-old plantations and 125.75 Mg C ha–1 in 12-year-old plantations. The soil contributed 82–90% of the total ecosystem C stock, the biomass was the second-largest, and the litter contributed less than 2% of the total ecosystem C stock. The biomass C stock decreased with elevation, dropping from 8.05% to 51.55% in 8-year-old plantations and 11.46% to 42.96% in 12-year-old plantations between 700 m and 1100 m. The soil C stock had no significant elevation correlation, peaking at 900 m in both age groups. The litter C stock was highest at 700 m in both age groups. The total ecosystem C stock in 12-year-old plantations was 1.98% greater than that in 8-year-old plantations. Rubber growth, biomass, and C storage are significantly reduced above 900 m, with age and elevation being key factors, regardless of understory vegetation. These findings enhance the understanding of C stock changes with elevation in rubber plantations.

Acknowledgments

We would like to thank the Institutional Center for Shared Technologies and Facilities of Xishuangbanna Tropical Botanical Garden, Chinese Academy of Sciences, for their support with carbon analysis. This study was funded by the Office Project of Chinese Academy of Agricultural Sciences (KSCX2-EW-B-12), the Project of Yunnan Provincial Environmental Protection Department, the ‘Yunnan Revitalization Talent Support Program’ in Yunnan Province, and the ‘Light of West China Program’ of Chinese Academy of Sciences.

Author Contributions

Conceptualization, J.T.; methodology, J.T. and C.L.; formal analysis, M.R.; investigation, CA.L., Q.H. and F.W.; writing—review and editing, M.R., P.G., C.L. and J.T.; funding acquisition, J.T. and C.L.

Conflicts of Interest

The authors declare no conflict of interest.

References

  1. Alam, A., A. Kilpeläinen, and S. Kellomäki, Impacts of initial stand density and thinning regimes on energy wood production and management-related CO2 emissions in boreal ecosystems. European Journal of Forest Research, 2012. 131(3): p. 655-667. [CrossRef]
  2. Zhang, Y. and S. Liang, Changes in forest biomass and linkage to climate and forest disturbances over Northeastern China. Global Change Biology, 2014. 20(8): p. 2596-2606. [CrossRef]
  3. Houghton, R.A., et al., Carbon emissions from land use and land-cover change. Biogeosciences, 2012. 9(12): p. 5125-5142. [CrossRef]
  4. Grace, J., E. Mitchard, and E. Gloor, Perturbations in the carbon budget of the tropics. Global Change Biology, 2014. 20(10): p. 3238-3255. [CrossRef]
  5. Green, R.E., et al., Farming and the fate of wild nature. science, 2005. 307(5709): p. 550-555. [CrossRef]
  6. Fitzherbert, E.B., et al., How will oil palm expansion affect biodiversity? Trends in ecology & evolution, 2008. 23(10): p. 538-545. [CrossRef]
  7. Goetz, S.J., et al., Measurement and monitoring needs, capabilities and potential for addressing reduced emissions from deforestation and forest degradation under REDD+. Environmental Research Letters, 2015. 10(12): p. 123001. [CrossRef]
  8. Fox, J., et al., Rubber plantations expand in mountainous Southeast Asia: what are the consequences for the environment? 2014.
  9. Li, Z. and J.M. Fox, Mapping rubber tree growth in mainland Southeast Asia using time-series MODIS 250 m NDVI and statistical data. Applied Geography, 2012. 32(2): p. 420-432. [CrossRef]
  10. Yi, Z.F., et al., Developing indicators of economic value and biodiversity loss for rubber plantations in Xishuangbanna, southwest China: A case study from Menglun township. 2013.
  11. Fox, J., J.C. Castella, and A.D. Ziegler, Swidden, rubber and carbon: Can REDD+ work for people and the environment in Montane Mainland Southeast Asia? Global Environmental Change, 2014. 29: p. 318-326. [CrossRef]
  12. Sahner, J., et al., Degradation of root community traits as indicator for transformation of tropical lowland rain forests into oil palm and rubber plantations. PloS one, 2015. 10(9): p. e0138077. [CrossRef]
  13. Ziegler, A.D., J.M. Fox, and J. Xu, The rubber juggernaut. Science, 2009. 324(5930): p. 1024-1025. [CrossRef]
  14. Warren-Thomas, E., P.M. Dolman, and D.P. Edwards, Increasing demand for natural rubber necessitates a robust sustainability initiative to mitigate impacts on tropical biodiversity. Conservation Letters, 2015. 8(4): p. 230-241. [CrossRef]
  15. Fox, J. and J.C. Castella, Expansion of rubber (Hevea brasiliensis) in Mainland Southeast Asia: what are the prospects for smallholders? The Journal of Peasant Studies, 2013. 40(1): p. 155-170. [CrossRef]
  16. Zomer, R.J., et al., Environmental stratification to model climate change impacts on biodiversity and rubber production in Xishuangbanna, Yunnan, China. Biological Conservation, 2014. 170: p. 264-273. [CrossRef]
  17. Li, H., et al., Demand for rubber is causing the loss of high diversity rain forest in SW China. Biodivers Conserv, 2007. 16: p. 1731-1745. [CrossRef]
  18. Li, M. and F. Yuan, Rubber plantations–green desert. Chinese National Geography, 2008. 4: p. 60-78.
  19. Xiao, G. and S. Zhong, Mountain climate with high elevation and rubber suitable region in Xishuangbanna. Trop Agric Sci Technol, 2007. 30(2): p. 1-6.
  20. Yi, Z.F., et al., Developing indicators of economic value and biodiversity loss for rubber plantations in Xishuangbanna, southwest China: A case study from Menglun township. Ecological Indicators, 2014. 36: p. 788-797. [CrossRef]
  21. Dar, J.A. and S. Sundarapandian, Variation of biomass and carbon pools with forest type in temperate forests of Kashmir Himalaya, India. Environmental monitoring and assessment, 2015. 187(2): p. 55. [CrossRef]
  22. Ensslin, A., et al., Effects of elevation and land use on the biomass of trees, shrubs and herbs at Mount Kilimanjaro. Ecosphere, 2015. 6(3): p. 1-15. [CrossRef]
  23. Van Do, T., et al., Aboveground biomass and tree species diversity along altitudinal gradient in Central Highland, Vietnam. Tropical Ecology, 2017. 58(1).
  24. Thompson, I., et al., V., Kurz, WA, Spalding, M. and van Vliet, N., 2012. Forest biodiversity, carbon and other ecosystem services: Relationships and impacts of deforestation and forest degradation. Understanding Relationships Between Biodiversity, Carbon, Forests and People: The Key to Achieving REDD+ Objectives, 2012.
  25. Liu, C., et al., Carbon stocks across a fifty year chronosequence of rubber plantations in tropical China. Forests, 2017. 8(6): p. 209. [CrossRef]
  26. Ziegler, A.D., et al., Carbon outcomes of major land-cover transitions in SE Asia: great uncertainties and REDD+ policy implications. Global change biology, 2012. 18(10): p. 3087-3099. [CrossRef]
  27. Le Quéré, C., et al., Global carbon budget 2016. Earth System Science Data (Online), 2016. 8(2). [CrossRef]
  28. Körner, C., The use of ‘altitude’in ecological research. Trends in ecology & evolution, 2007. 22(11): p. 569-574. [CrossRef]
  29. Malhi, Y., et al., Introduction: elevation gradients in the tropics: laboratories for ecosystem ecology and global change research. Global Change Biology, 2010. 16(12): p. 3171-3175. [CrossRef]
  30. Gavazov, K., et al., Biotic and abiotic constraints on the decomposition of Fagus sylvatica leaf litter along an altitudinal gradient in contrasting land-use types. Ecosystems, 2014. 17(8): p. 1326-1337. [CrossRef]
  31. Nations, A.O.f.t.U., World reference base for soil resources. Vol. 3. 1998: Food & Agriculture Org.
  32. Yang, X., et al., Land-use change impact on time-averaged carbon balances: Rubber expansion and reforestation in a biosphere reserve, South-West China. Forest Ecology and Management, 2016. 372: p. 149-163. [CrossRef]
  33. Yang, X., et al., Rubber tree allometry, biomass partitioning and carbon stocks in mountainous landscapes of sub-tropical China. Forest ecology and management, 2017. 404: p. 84-99. [CrossRef]
  34. Grieco, E., Land use change and carbon stock dynamics in Sub-Saharan Africa-Case study of Western Africa–Ghana. 2011.
  35. Choudhary, B.K., K. Majumdar, and B.K. Datta, Carbon sequestration potential and edaphic properties along the plantation age of rubber in Tripura, Northeastern India. Current World Environment, 2016. 11(3): p. 756. [CrossRef]
  36. Selma Regina, M., et al., Potential carbon sequestration in rubber tree plantations in the northwestern region of the Paraná State, Brazil. Acta Scientiarum. Agronomy, 2014. 36(2). [CrossRef]
  37. Diniz, A.R., et al., Contrasts in areas of rubber tree clones in regard to soil and biomass carbon stocks. Revista Brasileira de Ciência do Solo, 2015. 39(5): p. 1378-1385. [CrossRef]
  38. Fernandes, T.J.G., et al., Quantificação do carbono estocado na parte aérea e raízes de Hevea sp., aos 12 anos de idade, na Zona da Mata Mineira. Revista Arvore, 2007. 31: p. 657-665. [CrossRef]
  39. Yanci, S., et al., Temporal changes of ecosystem carbon stocks in rubber plantations in Xishuangbanna, Southwest China. Pedosphere, 2017. 27(4): p. 737-746.
  40. Li, H., et al., Past, present and future land-use in Xishuangbanna, China and the implications for carbon dynamics. Forest Ecology and Management, 2008. 255(1): p. 16-24. [CrossRef]
  41. Lü, X.T., et al., Ecosystem carbon storage and partitioning in a tropical seasonal forest in Southwestern China. Forest Ecology and Management, 2010. 260(10): p. 1798-1803. [CrossRef]
  42. N’Dri, J.K., et al., Can litter production and litter decomposition improve soil properties in the rubber plantations of different ages in Côte d’Ivoire? Nutrient cycling in agroecosystems, 2018. 111: p. 203-215.
  43. de Blécourt, M., et al., Soil carbon stocks decrease following conversion of secondary forests to rubber (Hevea brasiliensis) plantations. PloS one, 2013. 8(7): p. e69357. [CrossRef]
  44. Wauters, J.B., et al., Carbon stock in rubber tree plantations in Western Ghana and Mato Grosso (Brazil). Forest Ecology and Management, 2008. 255(7): p. 2347-2361. [CrossRef]
  45. Zheng, Z., et al., Carbon storage and distribution law of the rubber forest ecological system in Danzhou of Hainan. Trop. Agric. Eng, 2010. 34: p. 45-50.
  46. Zhou, Y.R., Z.L. Yu, and S.D. Zhao, Carbon storage and budget of major Chinese forest types. Chinese Journal of Plant Ecology, 2000. 24(5): p. 518.
  47. Jianwei, T., et al., A Preliminary Study on the Biomass of Secondary Tropical Forest in Xishuangbana. Chinese Journal of Plant Ecology, 1998. 22(6): p. 489.
  48. FAO, Food and Agriculture Organization of the United Nations. 2021.
  49. Fu, Y., et al., Smallholder rubber plantation expansion and its impact on local livelihoods, land use and agrobiodiversity, a case study from Daka, Xishuangbanna, southwestern China. International Journal of Sustainable Development & World Ecology, 2009. 16(1): p. 22-29. [CrossRef]
  50. Jianchu, X., et al., Land-use and land-cover change and farmer vulnerability in Xishuangbanna prefecture in southwestern China. Environmental Management, 2005. 36: p. 404-413. [CrossRef]
  51. Min, S., et al., Adoption of intercropping among smallholder rubber farmers in Xishuangbanna, China. International Journal of Agricultural Sustainability, 2017. 15(3): p. 223-237. [CrossRef]
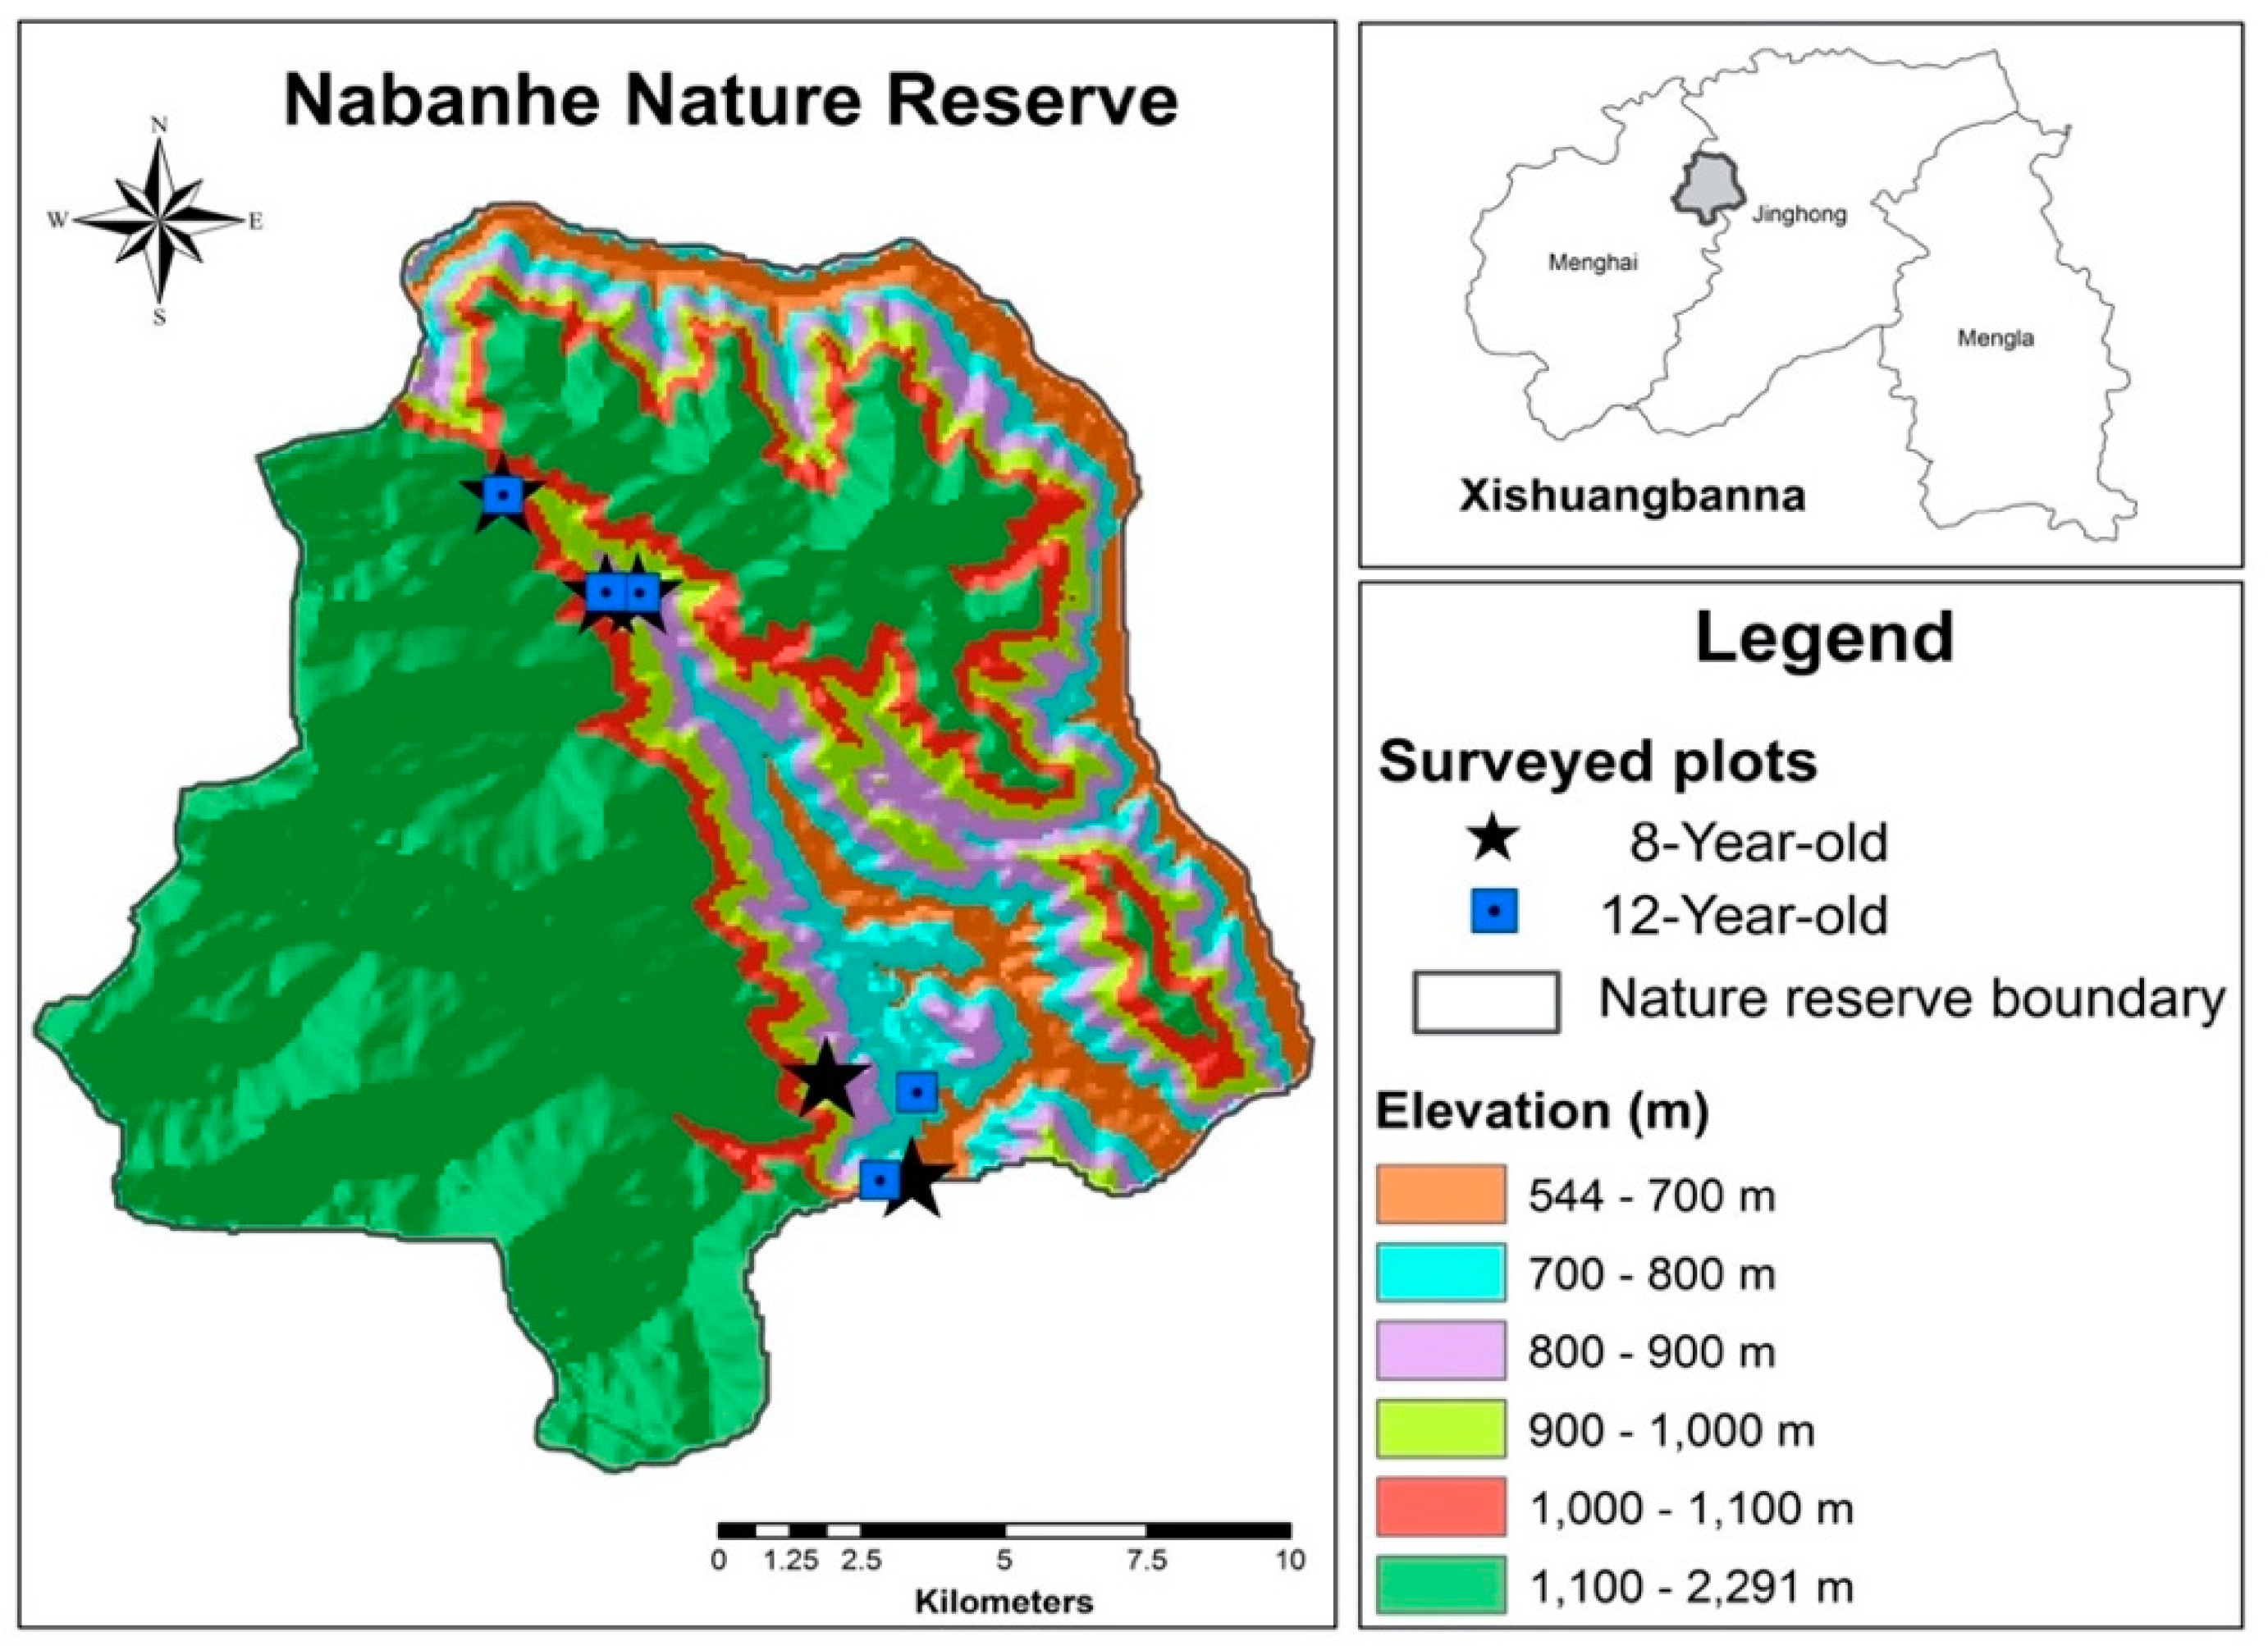
Figure 1. Surveyed plots of two aged (8- and 12-year-old) group monoculture rubber plantations are located at low elevation (700 m) to high elevation (1100 m) of Naban River basin.
Preprints 112882 g001
Figure 2. Carbon concentration (%) in different sections of litter (leaf, twig, flowers/fruits, miscellaneous and big dead branches) in (a) 8-year-old and (b) 12-year-old monoculture rubber plantation along five elevation gradients. Bars with different lowercase letters indicate significant differences according to Tukey’s HSD test (P ˂ 0.05). The missing column was not detected because no samples.
Preprints 112882 g002
Figure 4. Soil bulk density in (a) 8-year-old and (b) 12-year-old and soil C concentration in (c) 8-year-old and (d) 12-year-old monoculture rubber plantation at each soil depth along five elevation gradients. Vertical bars with different lowercase letters indicate significant differences according to Tukey’s HSD test (P ˂ 0.05).
Preprints 112882 g004
Figure 5. Relationship between elevation (m) and (a) soil C stock (Mg C ha–1) and (b) total ecosystem C stock (Mg C ha–1) in 8-year-old and 12-year-old monoculture rubber plantation.
Preprints 112882 g005
Figure 6. Allocation of total ecosystem C stocks (%) in different compartments (stem, branch, leaf, litter, root and soil) of (a) 8-year-old and (b) 12-year-old monoculture rubber plantation along five elevation gradients.
Preprints 112882 g006
Table 1. Stand characteristics of 8- and 12-year-old monoculture rubber plantations along five elevation gradients.
Age Elevation (m) Longitude Latitude Aspect (°) Slope (°) Planting spacing (m)
8-Year-old 700 100°40′33.58″ 22°07′53.10″ Southeast (20) 25 6 × 2.5
800 100°39′53.21″ 22°08′51.55″ Southeast (10) 30 6 × 2.5
900 100°37′47.52″ 22°13′26.74″ Southwest (20) 30 6 × 2.5
1000 100°37′44.91″ 22°13′26.89″ Southeast (20) 25 6 × 2.5
1100 100°36′46.93″ 22°14′25.33″ Southeast (30) 25 6 × 2.5
12-Year-old 700 100°40′03.48″ 22°07′49.81″ Southeast (15) 30 6 × 2.5
800 100°40′38.58″ 22°08′36.33″ Southeast (20) 25 6 × 2.5
900 100°37′47.62″ 22°13′26.79″ Southwest (24) 30 6 × 2.5
1000 100°37′44.69″ 22°13′28.65″ Southeast (20) 25 6 × 2.5
1100 100°36′47.46″ 22°14′24.47″ Southeast (60) 30 6 × 2.5
Table 2. Rubber tree biomass (Mg ha–1) of 8- and 12-year-old monoculture rubber plantation along five elevation gradients.
Age Elevation (m) Stem Branch Foliage Root Total
8-Year-old 700 31.64 ± 1.81a 8.82 ± 0.50a 1.58 ± 0.07a 11.62 ± 0.46a 53.66 ± 2.85a
800 29.27 ± 0.87a 8.18 ± 0.24a 1.51 ± 0.05a 11.36 ± 0.36a 50.32 ± 1.52a
900 27.75 ± 0.79a 7.75 ± 0.22a 1.42 ± 0.04a 10.65 ± 0.25a 47.57 ± 1.29a
1000 18.93 ± 0.35b 5.34 ± 0.10b 1.09 ± 0.02b 8.86 ± 0.19b 34.21 ± 0.66b
1100 14.39 ± 0.59c 4.07 ± 0.16c 0.84 ± 0.03c 6.87 ± 0.26c 26.17 ± 1.05c
12-Year-old 700 41.84 ± 1.78a 11.60 ± 0.49a 1.97 ± 0.08a 13.90 ± 0.54a 69.31 ± 2.89a
800 37.04 ± 0.71b 10.30 ± 0.20b 1.81 ± 0.05ab 13.18 ± 0.49ab 62.33 ± 1.45ab
900 33.58 ± 0.98b 9.33 ± 0.27b 1.63 ± 0.04b 11.75 ± 0.33b 56.29 ± 1.62b
1000 27.14 ± 0.75c 7.56 ± 0.21c 1.35 ± 0.03c 9.88 ± 0.22c 45.93 ± 1.21c
1100 23.95 ± 0.72c 6.67 ± 0.20c 1.19 ± 0.03c 8.66 ± 0.24c 40.46 ± 1.19c
Note: Values are means ± SE. Means followed by different lowercase letters in the same column indicate significant differences in 8- and 12-year-old monoculture rubber plantations along five elevation gradients according to Tukey’s HSD test (P ˂ 0.05).
Table 3. Litter biomass (Mg ha–1) of 8- and 12-year-old monoculture rubber plantation along five elevation gradients.
Age Elevation (m) Leaf Twig Flowers/fruits Miscellaneous BDB Total
8-Year-old 700 4.17 ± 0.25a 0.50 ± 0.10a 0.04 ± 0.02a 0.08 ± 0.00a 0.17 ± 0.05ab 4.95 ± 0.43a
800 2.48 ± 0.25b 0.66 ± 0.09a 0.09 ± 0.08a 0.12 ± 0.02ab 0.33 ± 0.10a 3.67 ± 0.55b
900 2.39 ± 0.08b 0.37 ± 0.06a 0.01 ± 0.00a 0.06 ± 0.00b 0.09 ± 0.05ab 2.90 ± 0.19bc
1000 2.55 ± 0.33b 0.75 ± 0.08a ND 0.06 ± 0.01b 0.12 ± 0.04ab 3.47 ± 0.46b
1100 1.63 ± 0.21b 0.49 ± 0.22a ND 0.05 ± 0.01b 0.06 ± 0.03b 2.23 ± 0.47c
12-Year-old 700 4.80 ± 0.24a 0.23 ± 0.03a 0.30 ± 0.07a 0.09 ± 0.01a 0.21 ± 0.06a 5.62 ± 0.40a
800 3.23 ± 0.19b 0.30 ± 0.07a 0.02 ± 0.01b 0.06 ± 0.01b 0.43 ± 0.20a 4.04 ± 0.48b
900 2.63 ± 0.13bc 0.36 ± 0.08a ND 0.05 ± 0.01b 0.20 ± 0.07a 3.23 ± 0.28bc
1000 3.20 ± 0.18b 0.43 ± 0.08a ND 0.04 ± 0.00b 0.15 ± 0.07a 3.82 ± 0.34bc
1100 2.31 ± 0.16dc 0.32 ± 0.06a 0.02 ± 0.02b 0.03 ± 0.00b 0.10 ± 0.04a 2.78 ± 0.29c
Note: Values are means ± SE. Means followed by different lowercase letters in the same column indicate significant differences in 8- and 12-year-old monoculture rubber plantations along five elevation gradients according to Tukey’s HSD test (P ˂ 0.05). BDB (Big dead branches). ND (Not detected).
Table 4. Soil C Stock (Mg C ha–1) in 8- and 12-year-old monoculture rubber plantation along five elevation gradients.
Age Depth (cm) 0–10 10–30 30–50 50–70 70–90 90–110 Total
8-Year-old 700m 18.39 ± 0.80ba 31.87 ± 2.12bc 22.91 ± 2.37b 17.31 ± 1.56b 14.44 ± 1.18b 13.00 ± 0.67b 117.91 ± 1.45b
800m 24.17 ± 0.48a 39.13 ± 1.38ab 33.83 ± 2.66a 28.61 ± 2.68a 23.79 ± 2.07a 20.11 ± 2.05a 169.64 ± 1.89a
900m 22.80 ± 0.83b 42.92 ± 1.50a 34.36 ± 2.96a 30.19 ± 2.82a 24.25 ± 1.41a 21.25 ± 1.54a 175.77 ± 11.06a
1000m 16.47 ± 1.55b 26.86 ± 3.58c 18.40 ± 2.27b 14.11 ± 2.29b 11.61 ± 1.72b 9.03 ± 1.30b 96.49 ± 12.72b
1100m 17.19 ± 0.81b 30.92 ± 1.87bc 21.25 ± 1.5b 16.93 ± 1.42b 13.89 ± 1.28b 12.11 ± 1.16b 112.29 ± 8.08b
12-Year-old 700m 19.12 ± 0.5a 26.25 ± 3.69ab 34.83 ± 2.10a 27.05 ± 2.31b 22.88 ± 1.97b 20.14 ± 1.66c 150.27 ± 2.04a
800m 23.26 ± 0.95a 35.31 ± 0.92ab 23.79 ± 1.58ab 17.03 ± 1.35a 14.17 ± 1.59a 11.16 ± 1.71a 124.71 ± 1.35ab
900m 21.67 ± 1.20a 33.26 ± 3.58a 31.71 ± 3.14a 25.24 ± 2.26b 22.85 ± 1.47b 18.78 ± 2.07bc 153.51 ± 13.71a
1000m 19.24 ± 0.99a 31.26 ± 1.74b 17.33 ± 0.94b 14.61 ± 1.09a 11.81 ± 0.89a 9.65 ± 0.63a 103.90 ± 6.28b
1100m 19.66 ± 0.85a 33.99 ± 1.55ab 25.78 ± 1.00a 18.94 ± 1.00ab 16.26 ± 0.62a 12.39 ± 0.80ab 127.01 ± 5.82ab
Note: Values are means ± SE. Means followed by different lowercase letters in the same column indicate significant differences among soil depths of 8-year-old and 12-year-old monoculture rubber plantations along five elevation gradients according to Tukey’s HSD test (P ˂ 0.05).
Disclaimer/Publisher’s Note: The statements, opinions and data contained in all publications are solely those of the individual author(s) and contributor(s) and not of MDPI and/or the editor(s). MDPI and/or the editor(s) disclaim responsibility for any injury to people or property resulting from any ideas, methods, instructions or products referred to in the content.
Copyright: This open access article is published under a Creative Commons CC BY 4.0 license, which permit the free download, distribution, and reuse, provided that the author and preprint are cited in any reuse.
Prerpints.org logo

Preprints.org is a free preprint server supported by MDPI in Basel, Switzerland.

Subscribe

© 2024 MDPI (Basel, Switzerland) unless otherwise stated