1. Introduction
Developing ML applications is becoming more popular and important, and with so many different types of ML algorithms available [
11], building tools that can help choose appropriate machine learning techniques, help apply models to different datasets, and integrate it with operational systems is extremely significant. Many users or analysts working for the same organisation often have similar goals [
8]. Hence, allowing them to contribute collaboratively at different stages of ML model lifecycle (i.e discovery, development, deployment, maintenance) becomes essential.
For example, analysts find it difficult to apply machine learning techniques to financial market data [
8]. Most literature is only focused on building models and not implementation and integration with operational systems [
10]. Hence, the provision of software tools for practitioners and researchers to implement, operate, and maintain models in a collaborative way is required.
To implement and maintain models, the users require methods and tools that can be customised to tailor to their needs specifically, for example, in financial markets as they are quite diverse when accurate analysis is required [
9]. However, they lack expert computing skills [
3]. Hence, software tools that provide easy customisation with minimal coding are required.
This paper identifies that existing tools and approaches have limitations, then contributes by proposing an architecture to overcome these limitations and shows a working example in the form of financial market data analysis.
2. Background
2.1. Related Work
The ML development cycle by an analyst within an organisation involves various steps. Firstly, they gather raw data and clean or prepare it. Then, they analyse the data by exploring it and choosing or creating relevant features, followed by training and testing the model. The final step is to deploy this ML application within the enterprise system. ML development is typically done by multiple people in an organisation, such as data analysts and data engineers.
There is a lot of interest in industrial ML applications, and to implement ML models. Obtaining data and preprocessing it appropriately for different ML models is a big task in itself. Many data scientists rely on features provided by vendors however in many cases they wish to create their own features [
6]. Even then, there is a plethora of options to choose from, and each option requires a comprehensive understanding of how that ML algorithm works [
8]. Operationalising models can also be challenging as fitting generic models to a specific business problem requires high proficiency [
8]. Along with this, collaboration presents an additional challenge as it requires streamlining and synchronization across the team.
There are plenty of tools or libraries available for performing analytics using machine learning. Broadly, they can be classified into tools supporting programming languages, or part of a platform that offers Artificial Intelligence as a Service (AIaaS) [
1]. There is also an increasing use of API/services to capture different stages of the analytics pipeline such as data acquisition, preprocessing, analysis and interpretation which necessitates a tool to integrate them properly.
On one hand, tools with programming languages require a high degree of understanding of those languages. AIaaS platforms, on the other hand, are focused more on how AI can be leveraged to accomplish your task. It is a type of AI outsourcing which seeks to enable users to experiment with AI without investing too much money or effort. There are quite a few AIaaS providers currently active in the market [
1]. These tools are comprehensive as AI needs a detailed iterative approach to deal with quality data such as that of financial markets [
2].
Due to a wide range of development tools and the increasing availability of services that can be used off-the shelf, this paper focuses on some innovative methods that allow teams to collaboratively assemble the entire solution from reading the data to presenting it.
2.2. ML Application Development Methods
Developing ML applications has become a collaborative effort as it is an appealing paradigm to build high-quality ML models [
12]. Four types of methods that enable collaborative ML application development have been identified:
Community model sharing (e.g., OpenML): online platforms about sharing machine learning algorithms, models, experiments, and so on. It is meant to encourage open source development where people can freely collaborate and quickly build upon new advances in the field of machine learning [
5].
Using a low code programming platform: an approach that requires some basic programming knowledge, in order to accomplish the required software development task. Instead of using complex coding tools, visual interfaces, combined with basic logic, can be used to perform any task, even those requiring multiple people to collaborate [
3].
Composition and workflow platforms: enable the enactment of multiple services (typically developed by multiple people) to achieve a complex analytics goal, such as in MLFlow [
15].
MLOps: a practice that unifies ML application development with ML system operations. It is about streamlining the process of deploying, maintaining and monitoring machine learning models efficiently with high reliability [
4].
To make a useful comparison, ML analytics software development methods can be evaluated against the following features:
Maintaining domain knowledge- When analysts perform any task, they rely on shared understanding of domain knowledge, such as, in financial market data analysis within an organisation, they need to define and operate complex workflows that involve the entire analytics cycle where it is possible for multiple ML techniques to operate over a large number of measures to be included in one workflow [
6].
ML pipeline composition- Analysts typically require customisable and collaborative solutions without the need for expert coding skills to define and maintain workflows. Many complex analysis problems require group effort but the majority of tools assume one analyst [
7].
Quality control and testing- Quality control and software testing are essential components of any project to ensure successful deployment, and with many separate components such as in this case, it becomes critical to maintain quality and testing requirements collaboratively.
Table 1 below summarises how existing techniques address all required features.
While OpenML allows to maintain domain knowledge collaboratively, it lacks collaborative composition and quality control. Low code platforms and workflows allow collaborative composition but lack collaborative domain knowledge and quality control. MLOps performs the best out of the four methods by allowing collaborative domain knowledge maintenance and quality control but still lacks collaborative composition.
Hence, the purpose of this paper is to investigate a method that allows high customization, good user experience, and that can be used collaboratively. Basically, a solution fulfilling all three requirements mentioned in
Table 1 is required.
3. Proposed Solution
3.1. Knowledge Graph
The proposed solution is based on using a knowledge graph, which makes collaboratively maintaining domain knowledge possible [
13]. In practice, different roles such as data engineers, data scientists, software engineers, DevOps engineers, business analysts and researchers have different parts of knowledge who have to collaborate, and there are many services that perform different functions.
For example, consider a service that generates trading signals based on the stock price data. But, this price could be the daily open price, or it could also be the daily closing price. A knowledge graph would keep track of this information, making the whole service more convenient and not requiring to keep changing it based on which price we want to use. Also, a knowledge graph would be able to automatically suggest the most appropriate generating trading signal service if we present it with the price data, thus increasing usability and convenience. Hence, a knowledge graph shows how different data concepts relate to each other thus helping to perform composition, and it also identifies relevant services.
Competency questions are a set of queries that the artifact must be able to answer once it is built and implemented according to Design Science Research methodology [
16,
17]. They define the key requirements, problems, or use cases that the artifact should address. They help ensure the artifact meets the needs of its intended users and serves its purpose effectively. They act as a benchmark against which the quality and utility of the final artifact can be evaluated [
16,
17]. An example of this is shown below in
Table 2 with the context being financial market data analysis.
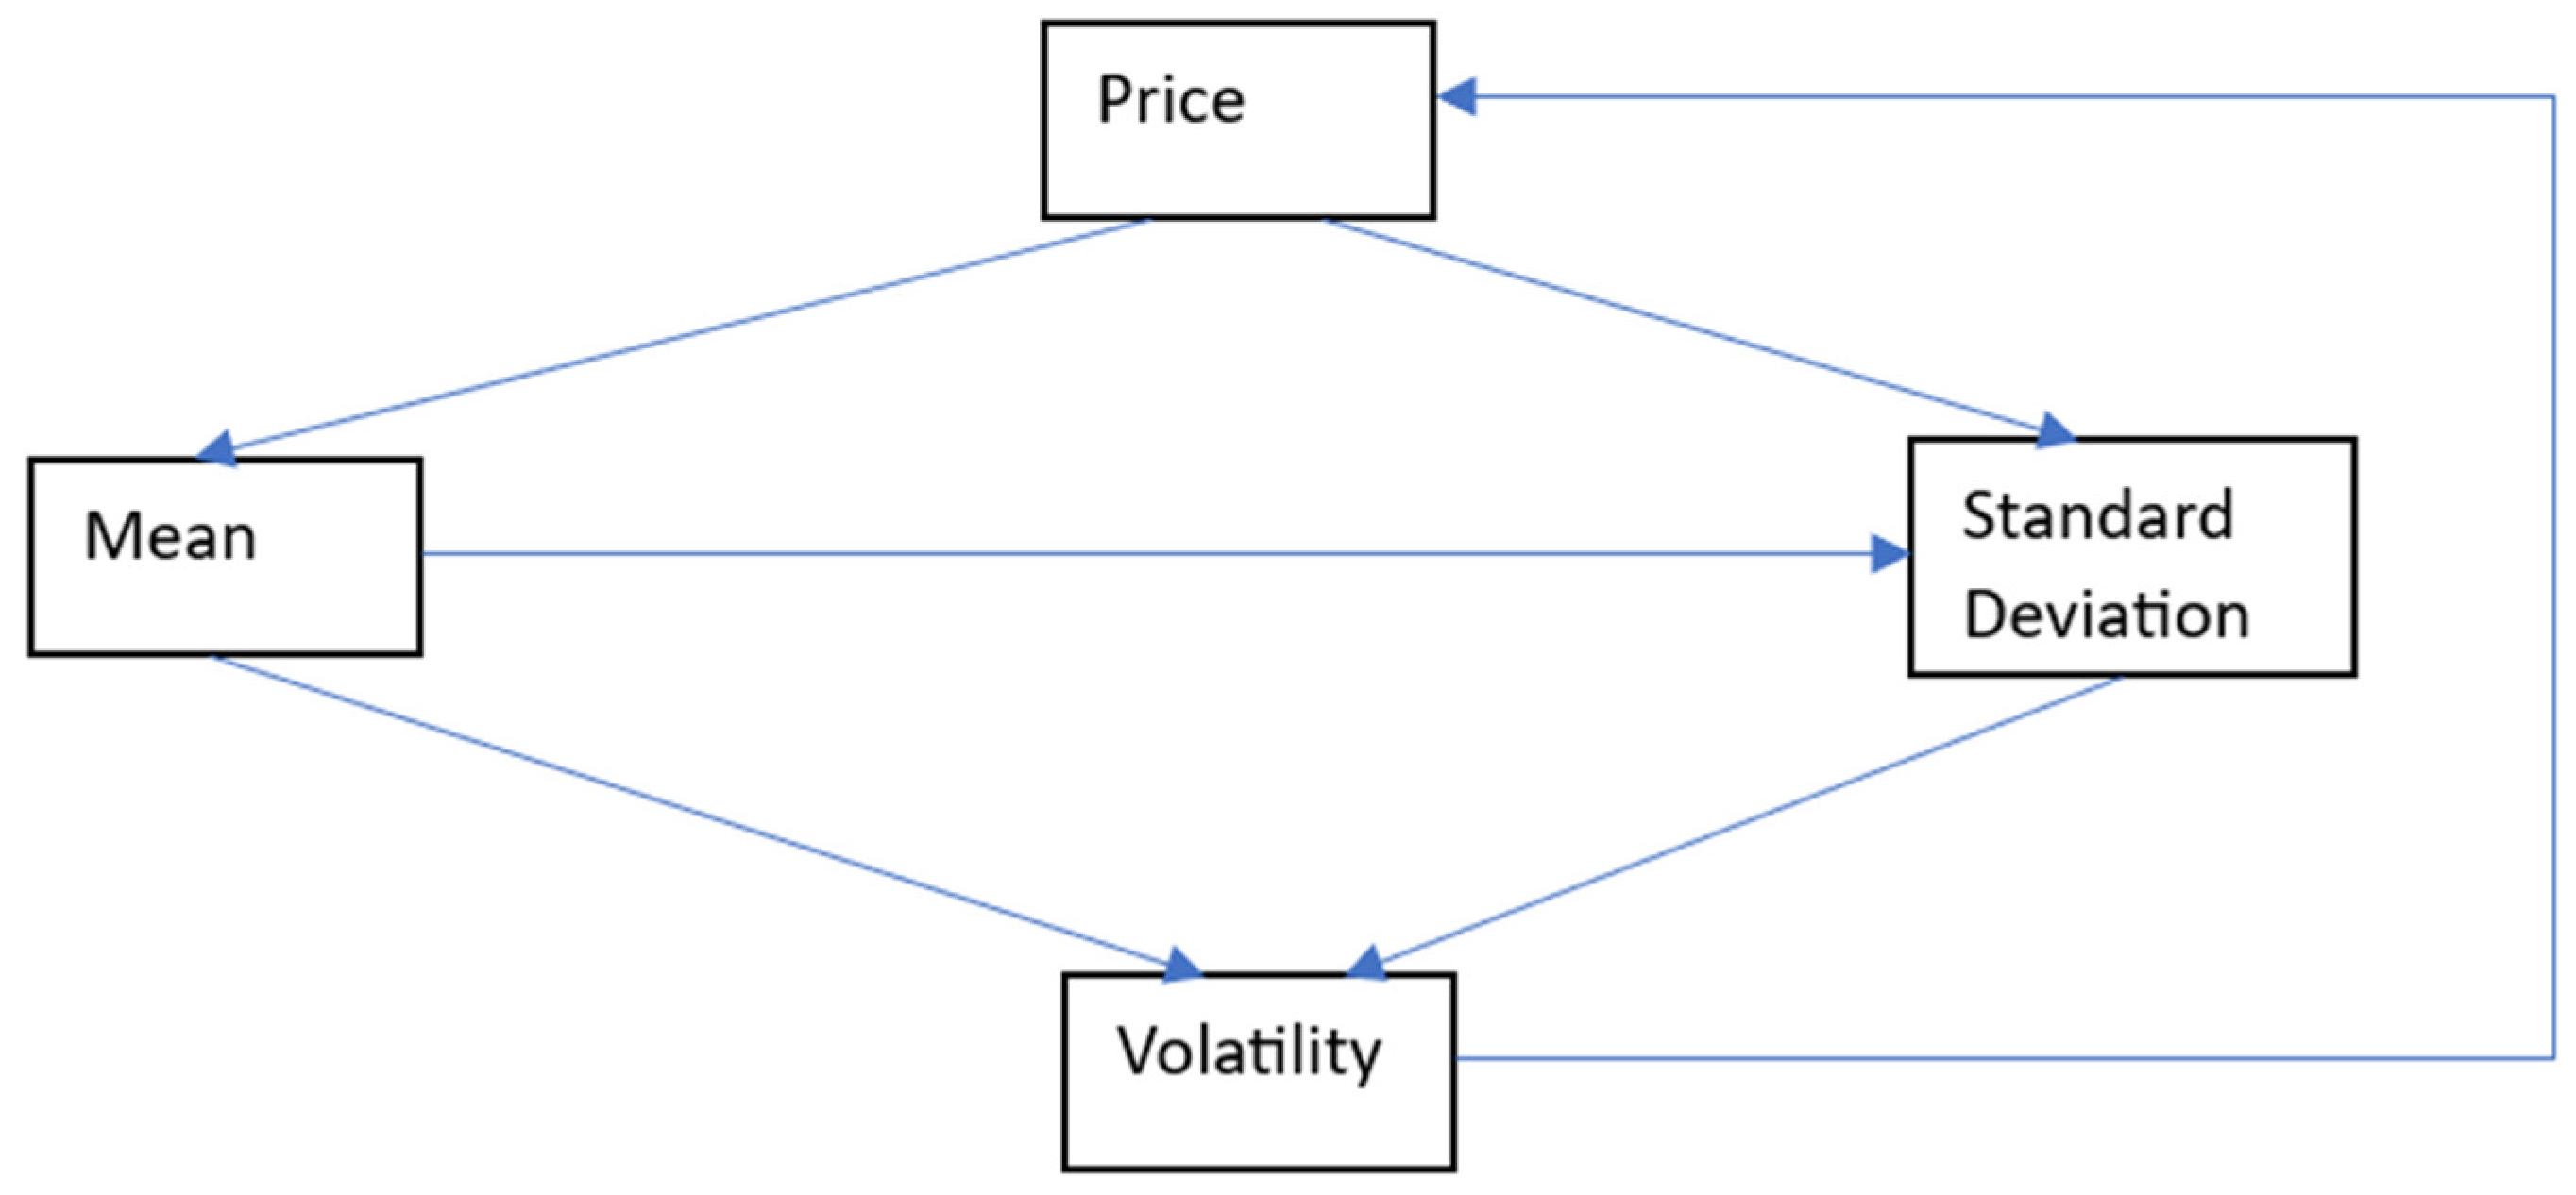
In normal programming, every analytic module is closely linked with data, or variables, whose information can be extracted from the knowledge graph. This is critical as almost all the measures are interdependent. For example, in financial market data analytics, trade count will have an effect on trading volume. It is important to figure out these dependencies, which can make the task more complicated. The amount of data is large, and there are plenty of ways or tools to interpret it. Choosing the correct combination and cleaning the data, such as removing outliers, is of paramount importance for accurate, reliable and precise prediction [
14]. An illustration of such interdependencies is shown below in
Figure 1.
Here, the mean and the standard deviation are calculated from the price, which are then used to determine the volatility. Volatility can affect the behaviour of market participants, thus influencing the price. In summary, a knowledge graph would answer various questions related to these measures.
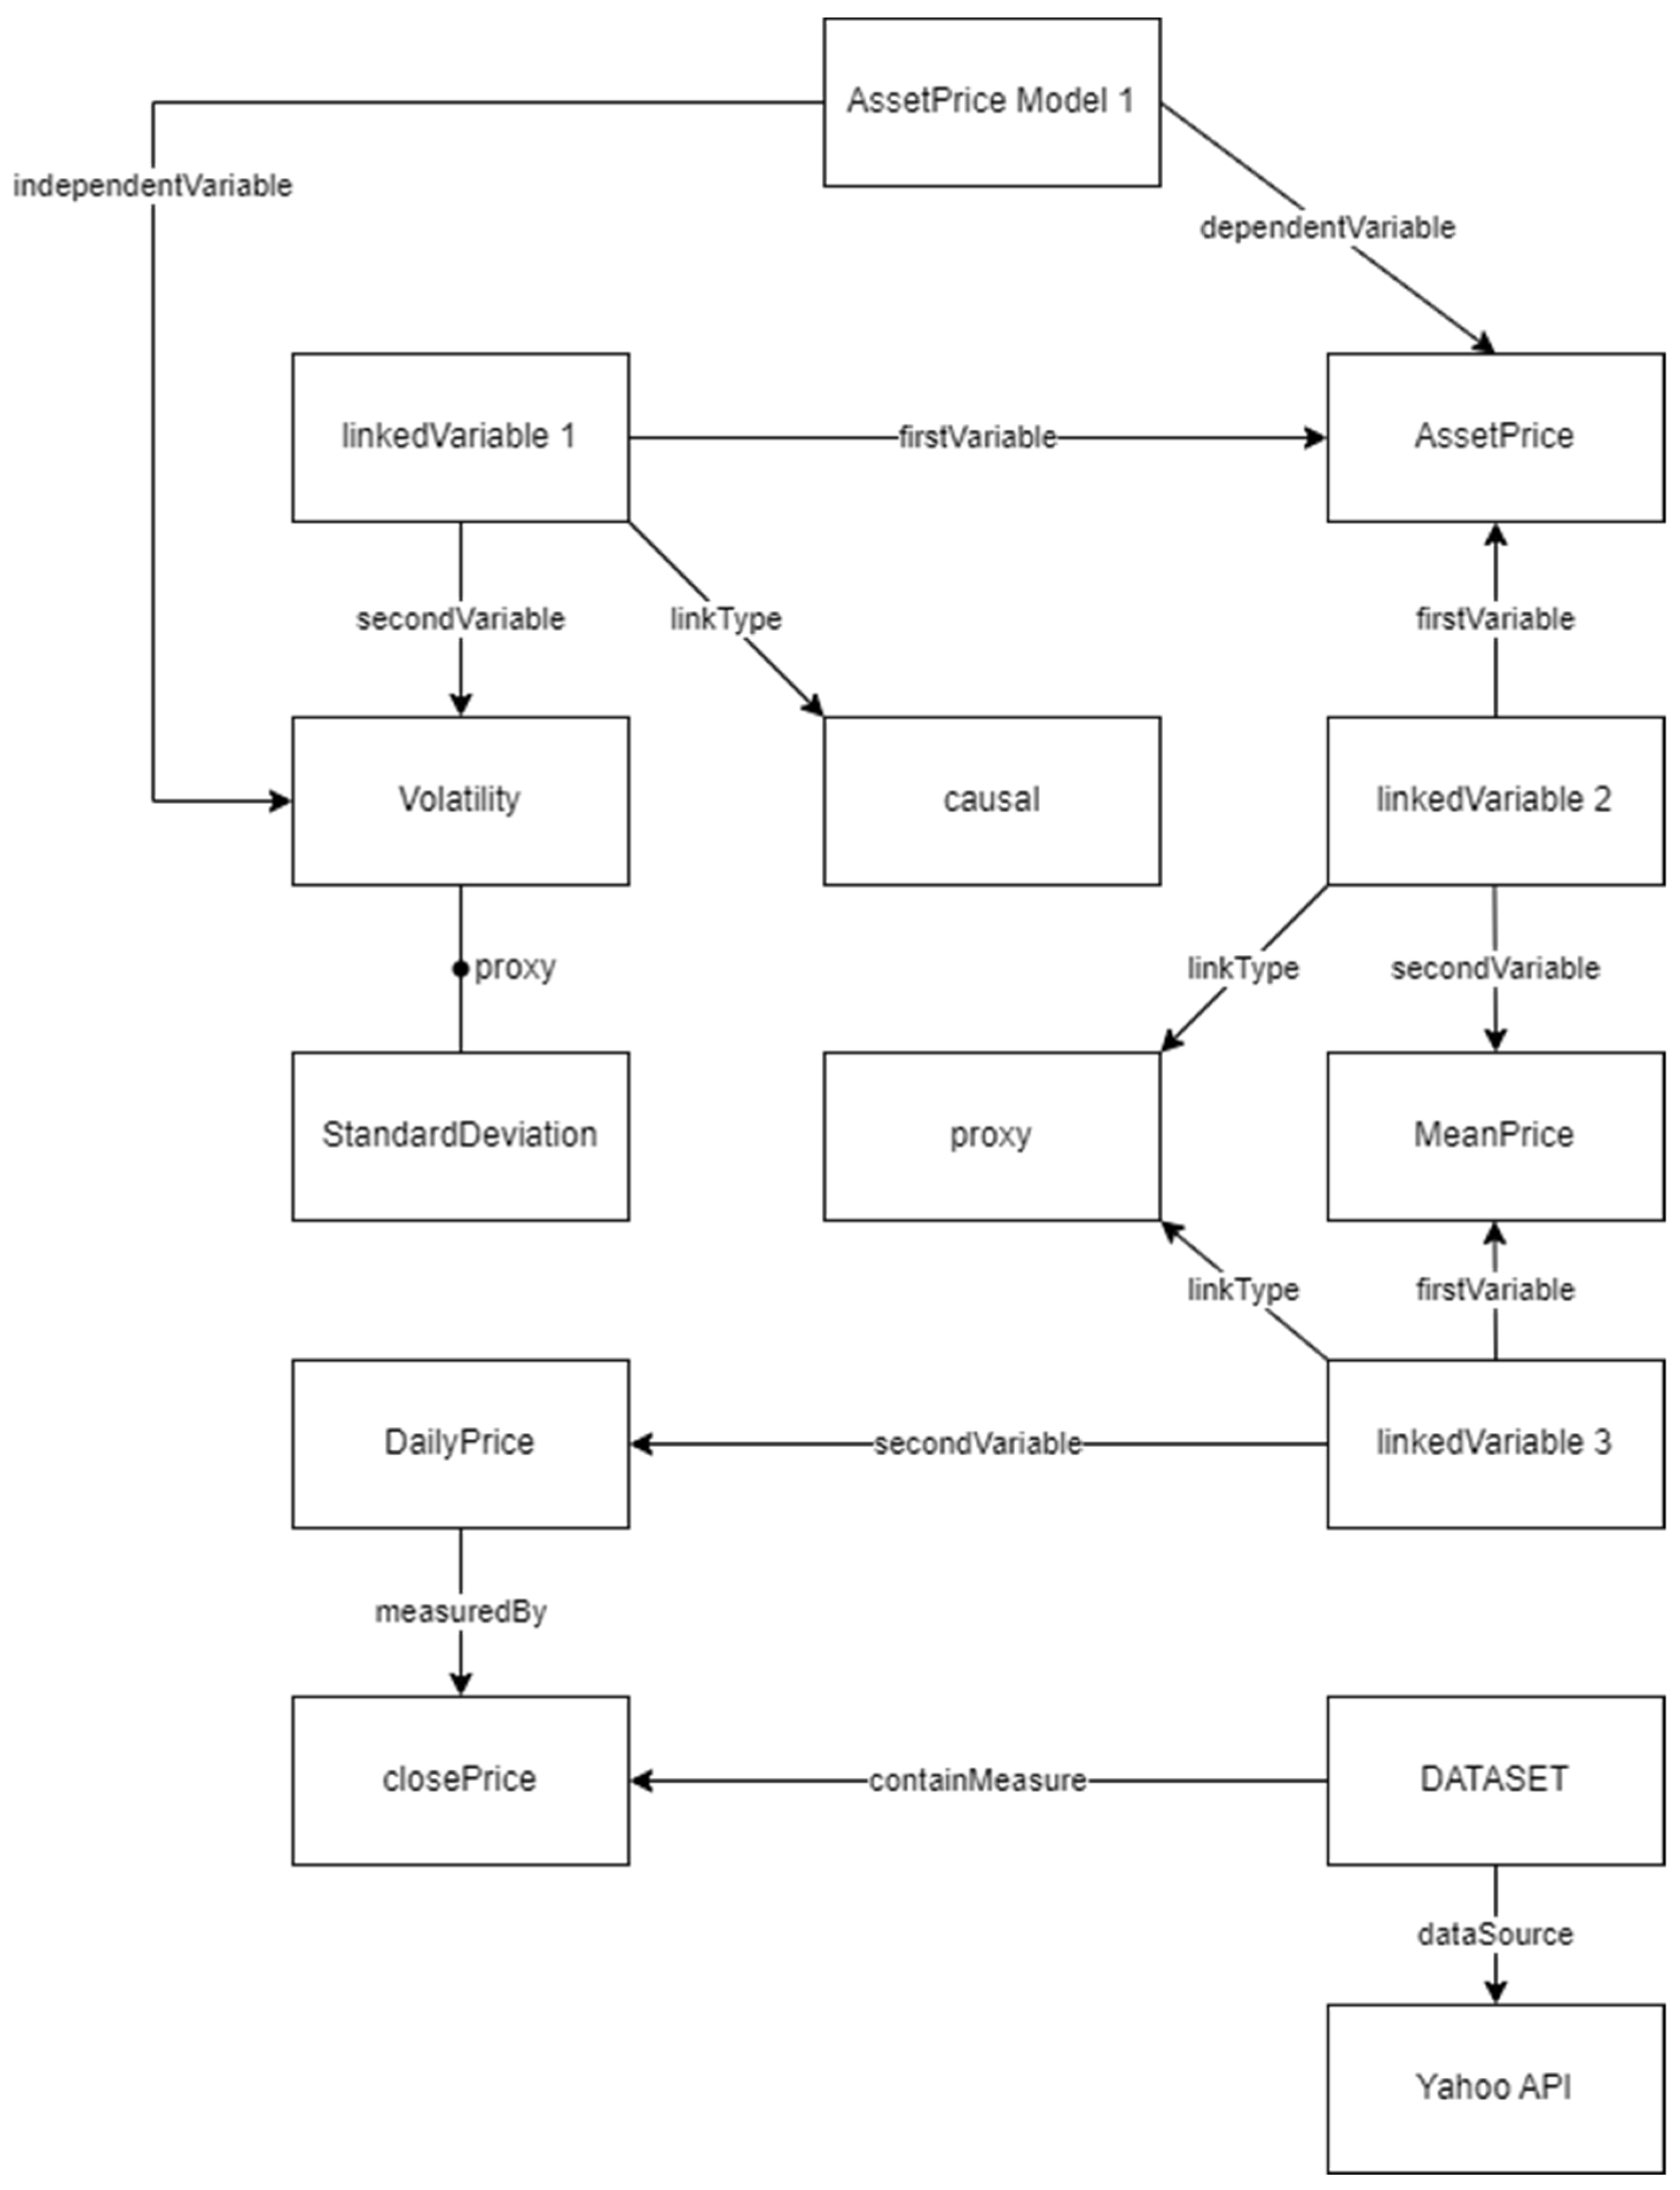
Figure 2 below shows an example of how would such a knowledge graph look like within the context of financial market data analysis. This knowledge graph is based on the Research Variable Ontology (RVO) [
18].
3.2. Architecture
As per the identified gap, a method to fully allow collaboration of ML analytics is required.
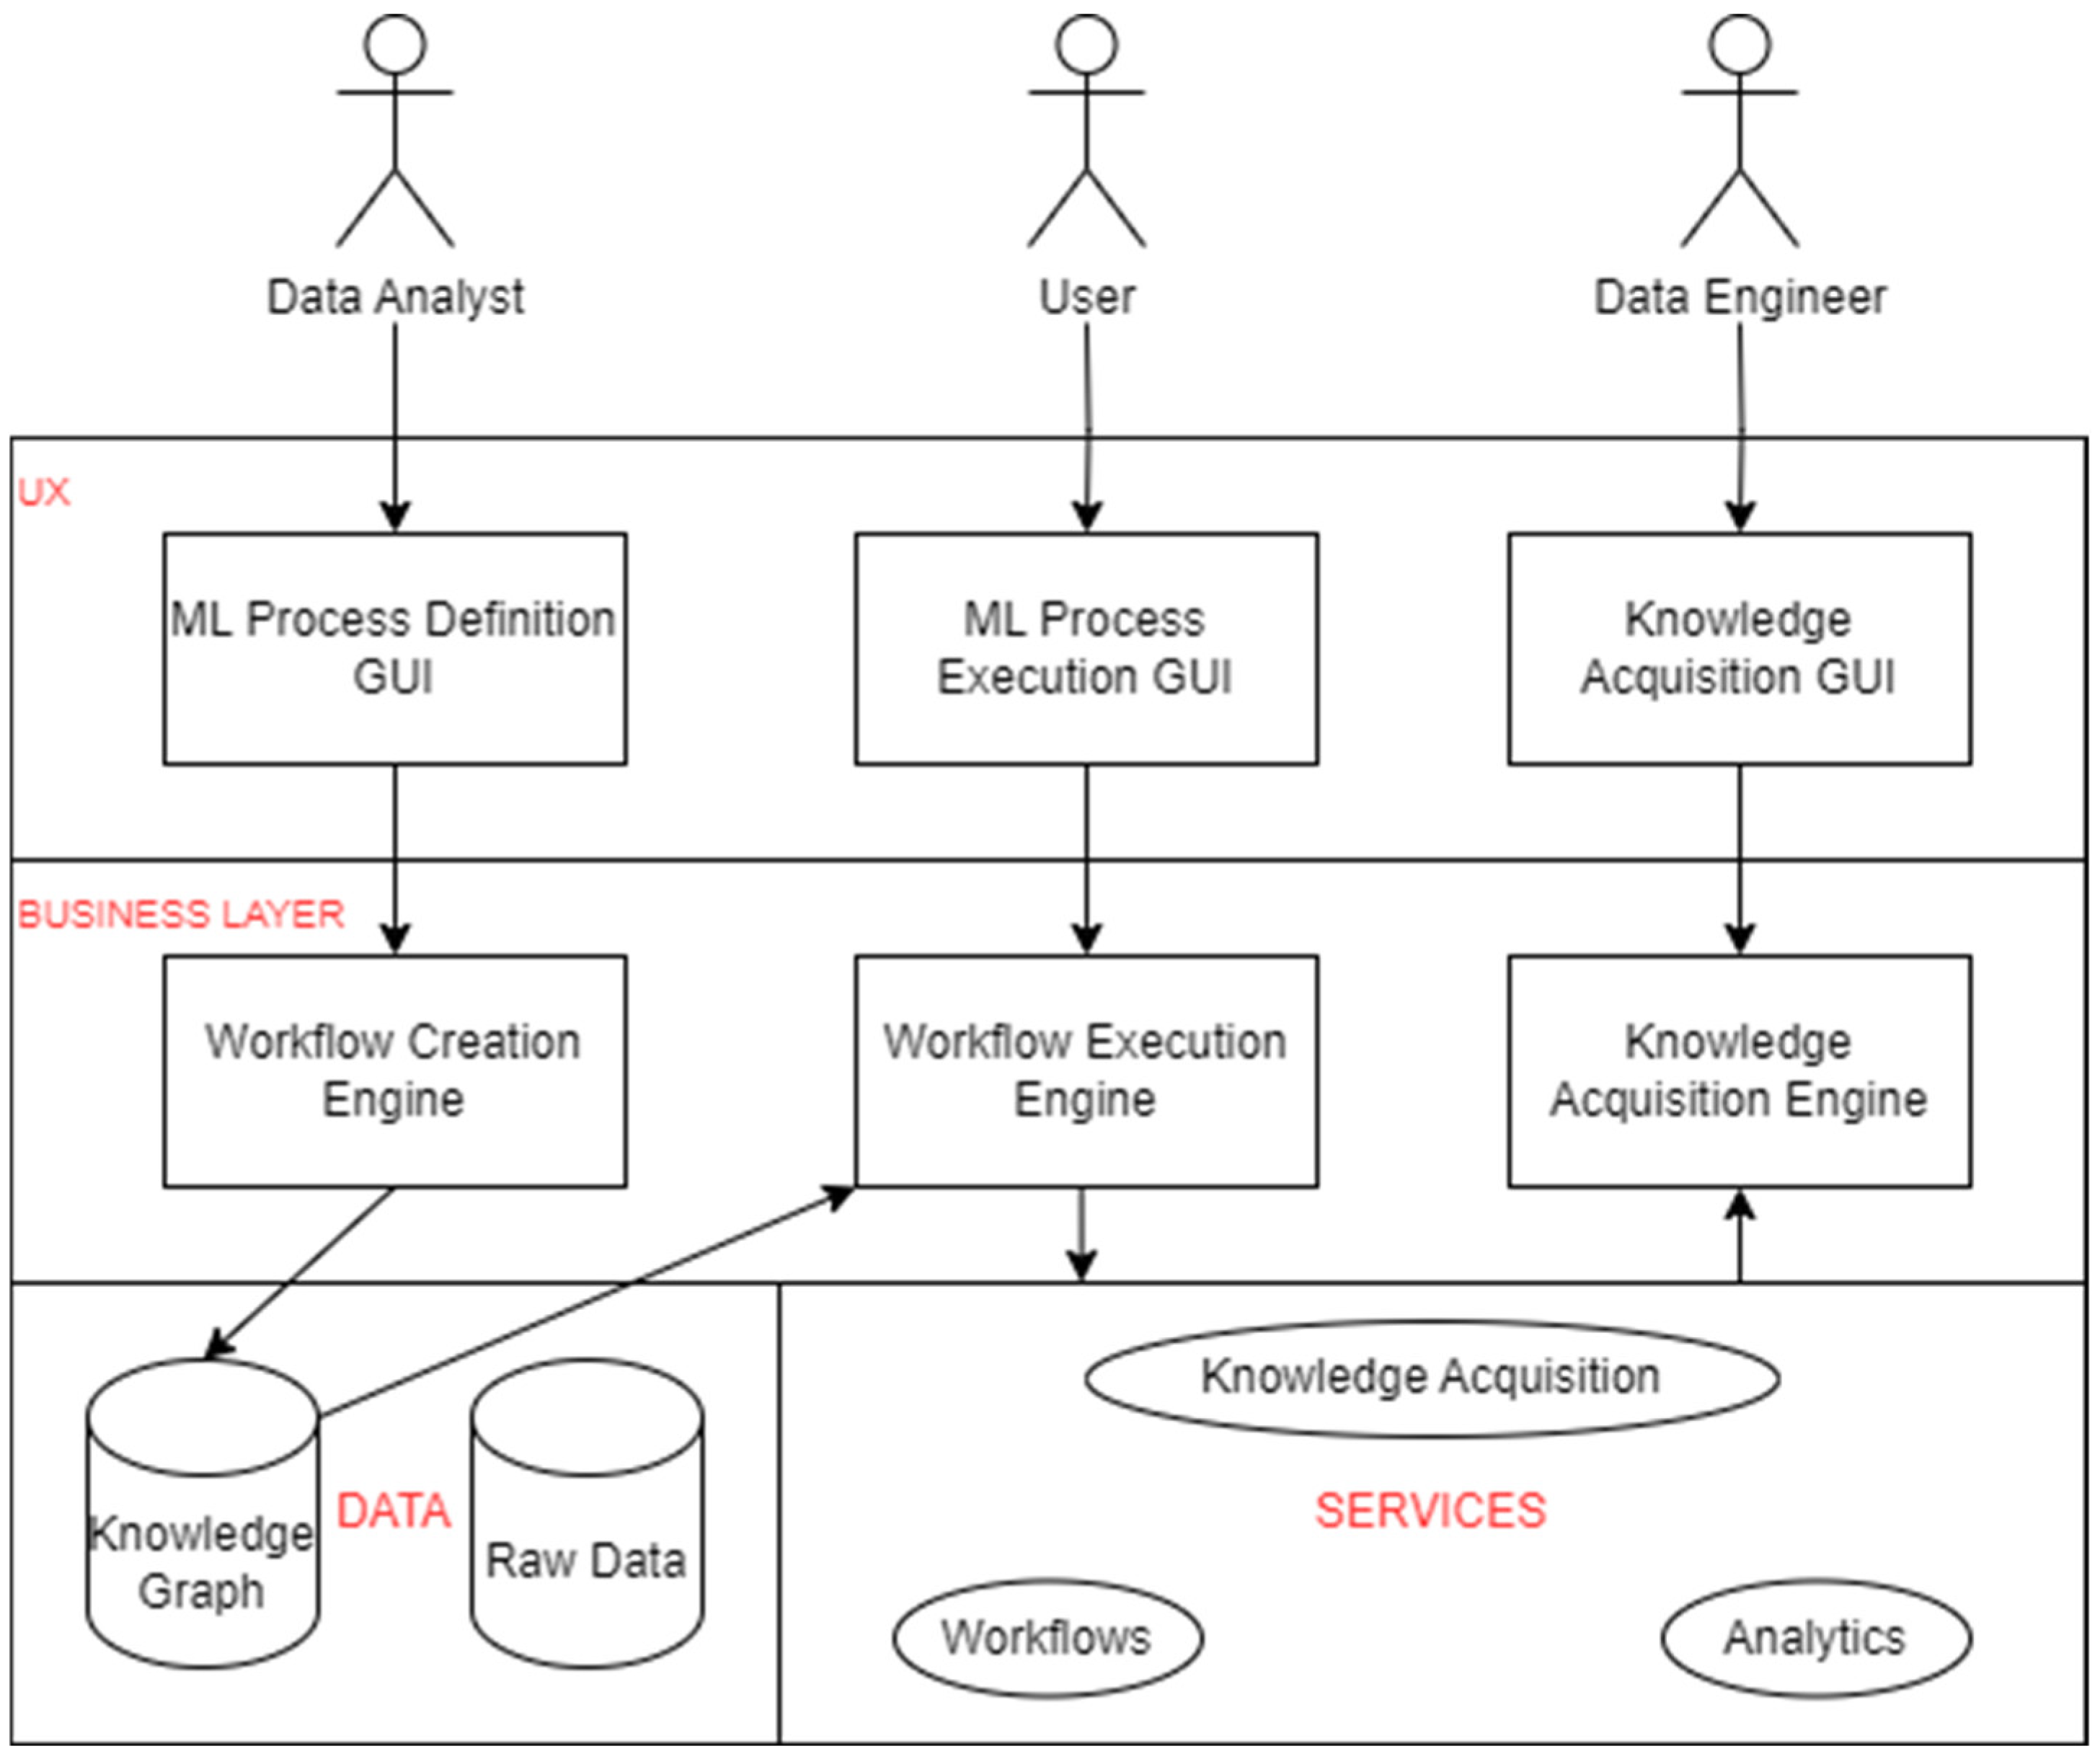
Figure 3 shows the software architecture of the proposed solution.
The architecture is organised in 4 layers. Under the Data Layer, we have raw data and the corresponding knowledge graph to ensure the ability to collaboratively maintain domain knowledge. Under the Services Layer, we have analytics along with knowledge acquisition and workflows to ensure collaborative quality control. On top of this, the business layer has engines which are connected to their respective GUIs at UX layer, to cater for collaborative composition. The knowledge graph takes input from the workflow creation engine and figures out what sort of data is required and then sends it to the workflow execution engine. This engine then feeds into the services layer which processes and feeds the information in the knowledge acquisition engine.
The three actors- data analyst, user, and data engineer are responsible for the defining, executing, and acquiring processes respectively. Data analysts are responsible for developing and fine-tuning ML models which includes collecting, preprocessing, analysing, training and testing models. Data engineers focus on building and maintaining data infrastructure that supports ML development and deployment which includes designing data pipelines, managing data storage and processing, and ensuring data quality and accessibility. Users are customers for which the solution is designed. Their feedback and usage enables evaluation of model performance and identification of improvements areas.
3.3. Development Processes
Performing development work collaboratively involves a few steps. Firstly, a workflow is agreed upon which includes the different component services and files that form the whole service. It also includes the order in which they will be executed. Then, these component services are allocated to different members of the development team. Once all of them are finished, they are executed as per the workflow, and the whole service is now functioning.
4. Demonstration and Evaluation
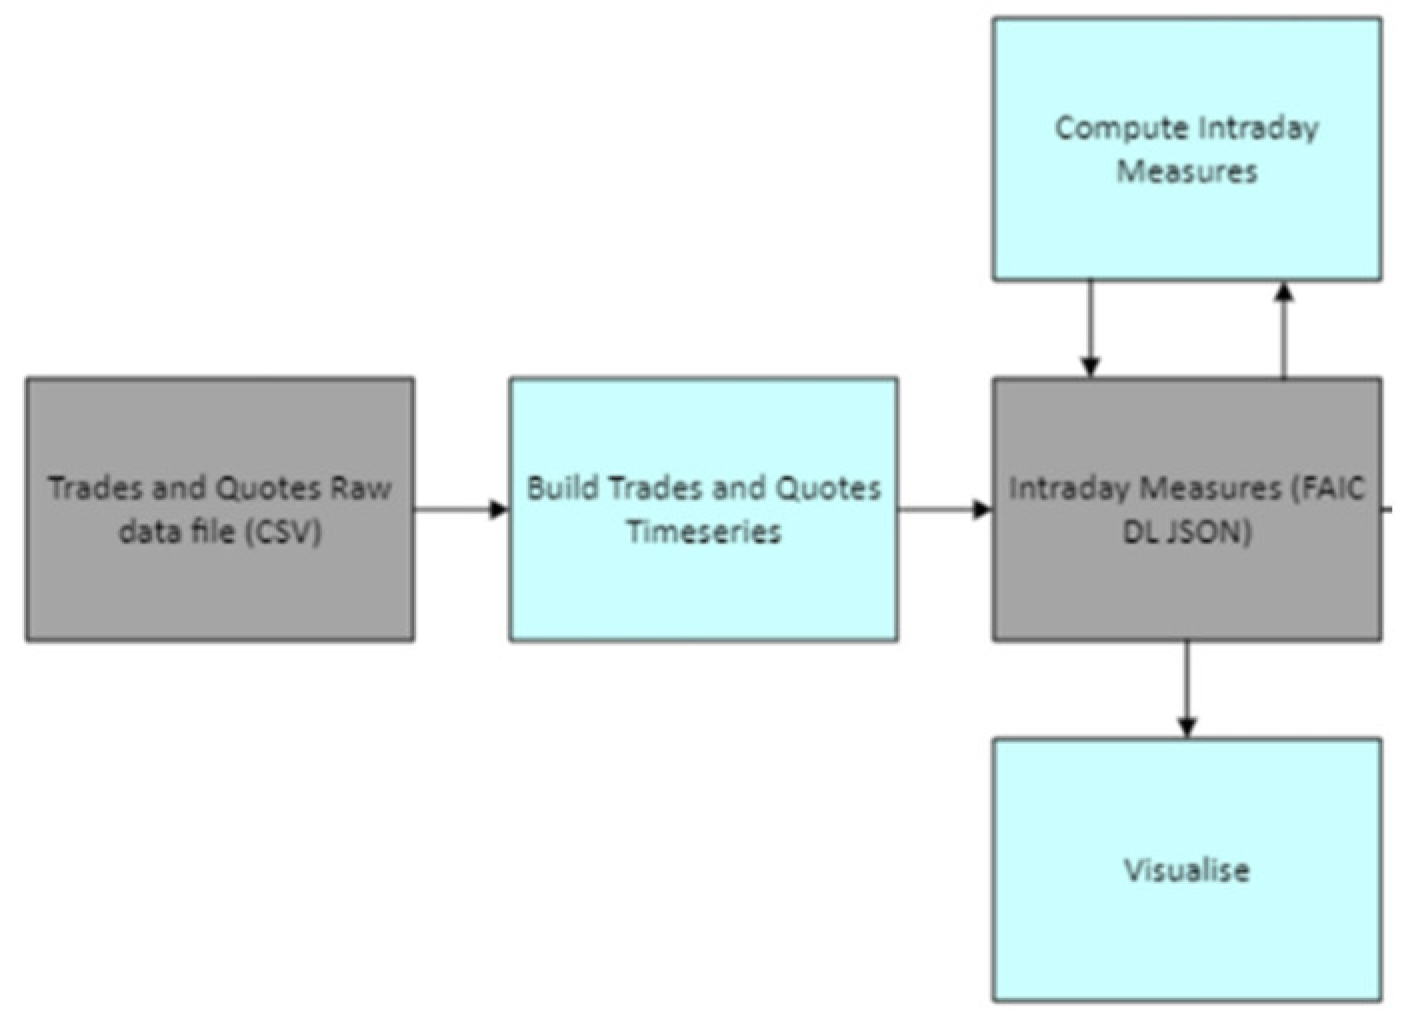
The example used here is a case study for conducting financial market data analysis. Basically, it is a workflow for intraday data analysis, shown below in
Figure 4. It includes the required information, such as the component services, order, and files. Let’s assume that multiple people are collaborating to build this service. They can then collaborate by building smaller component services shown in blue in
Figure 4, which are then integrated and executed into the overall service as shown.
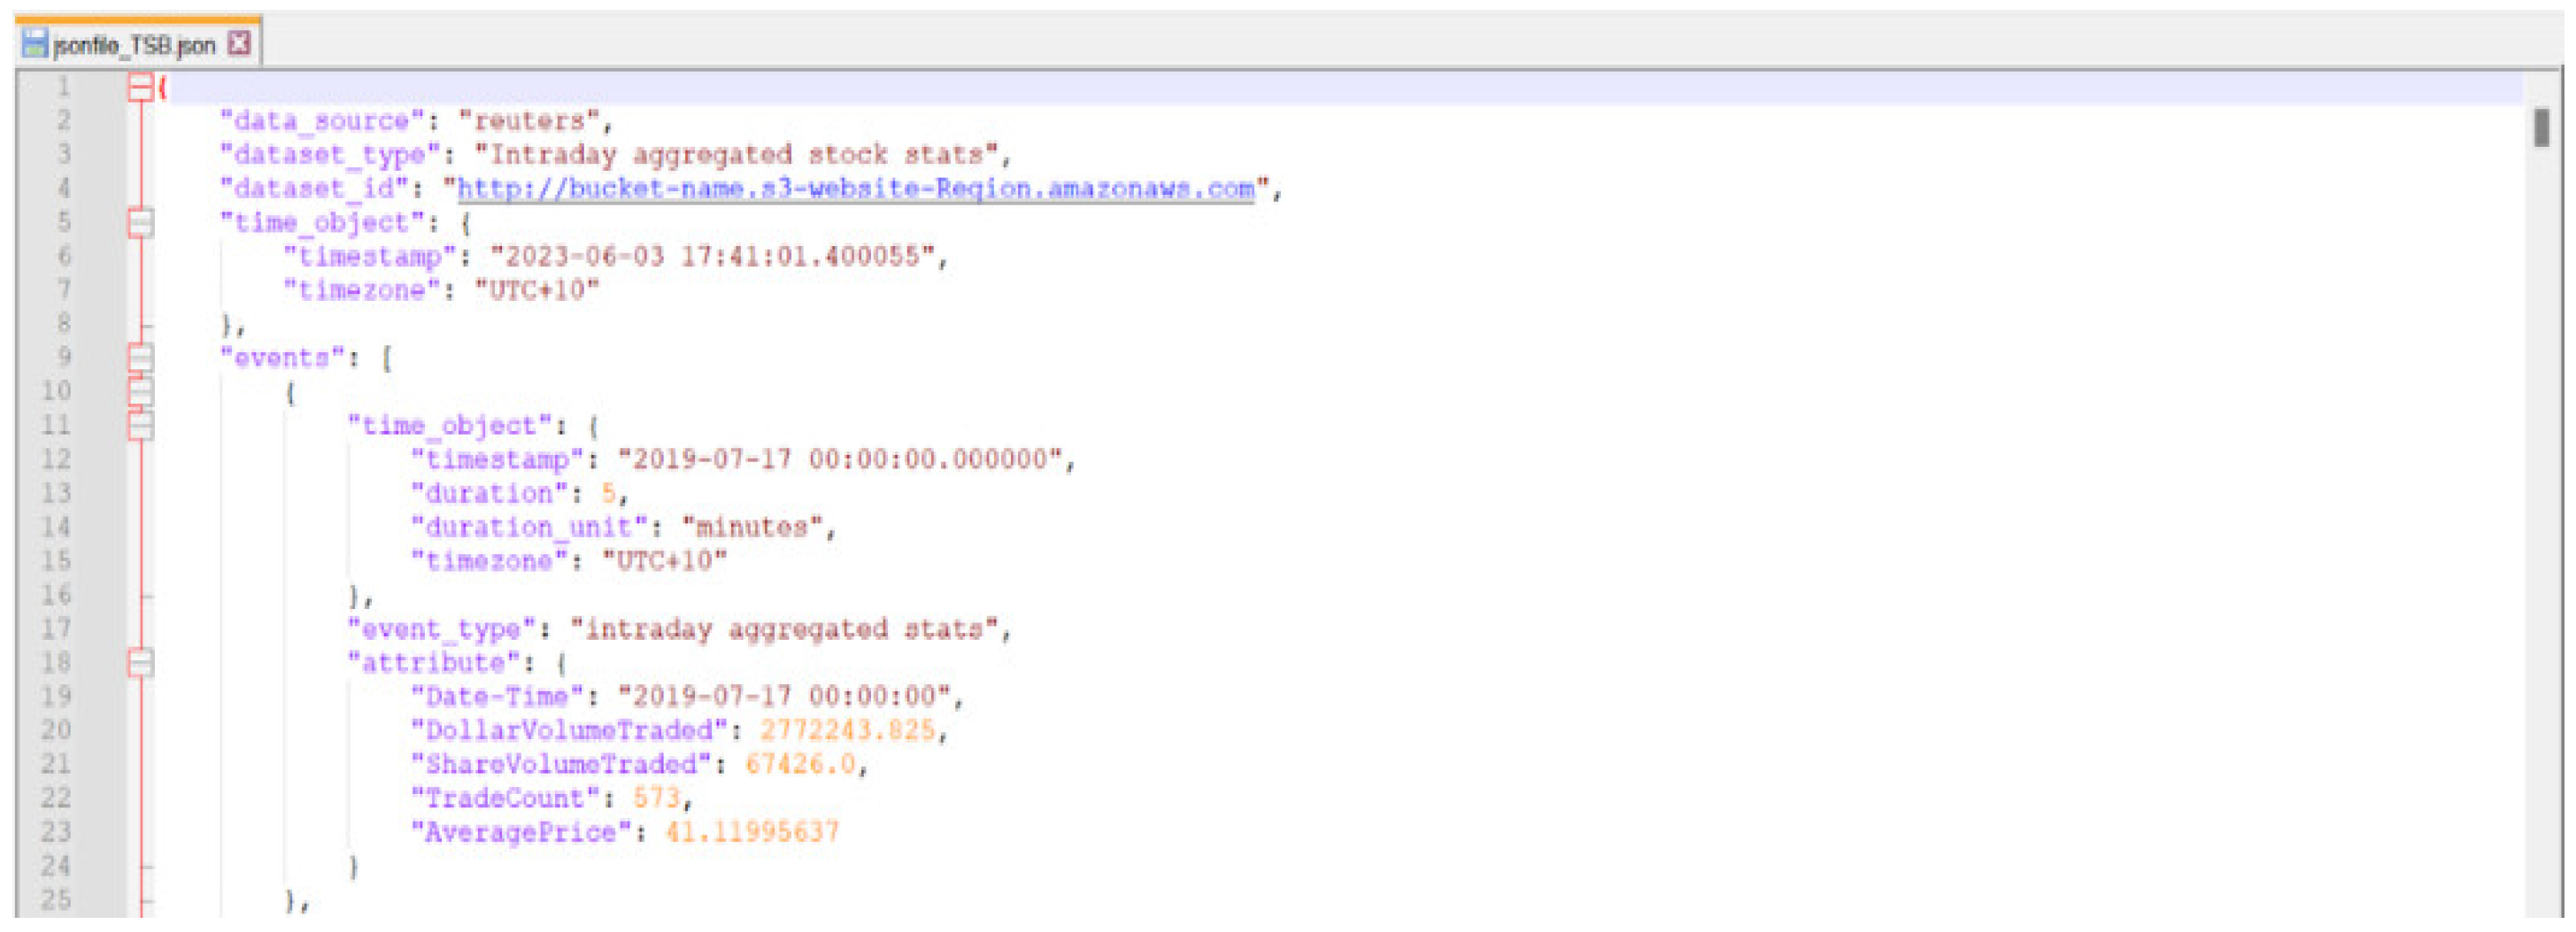
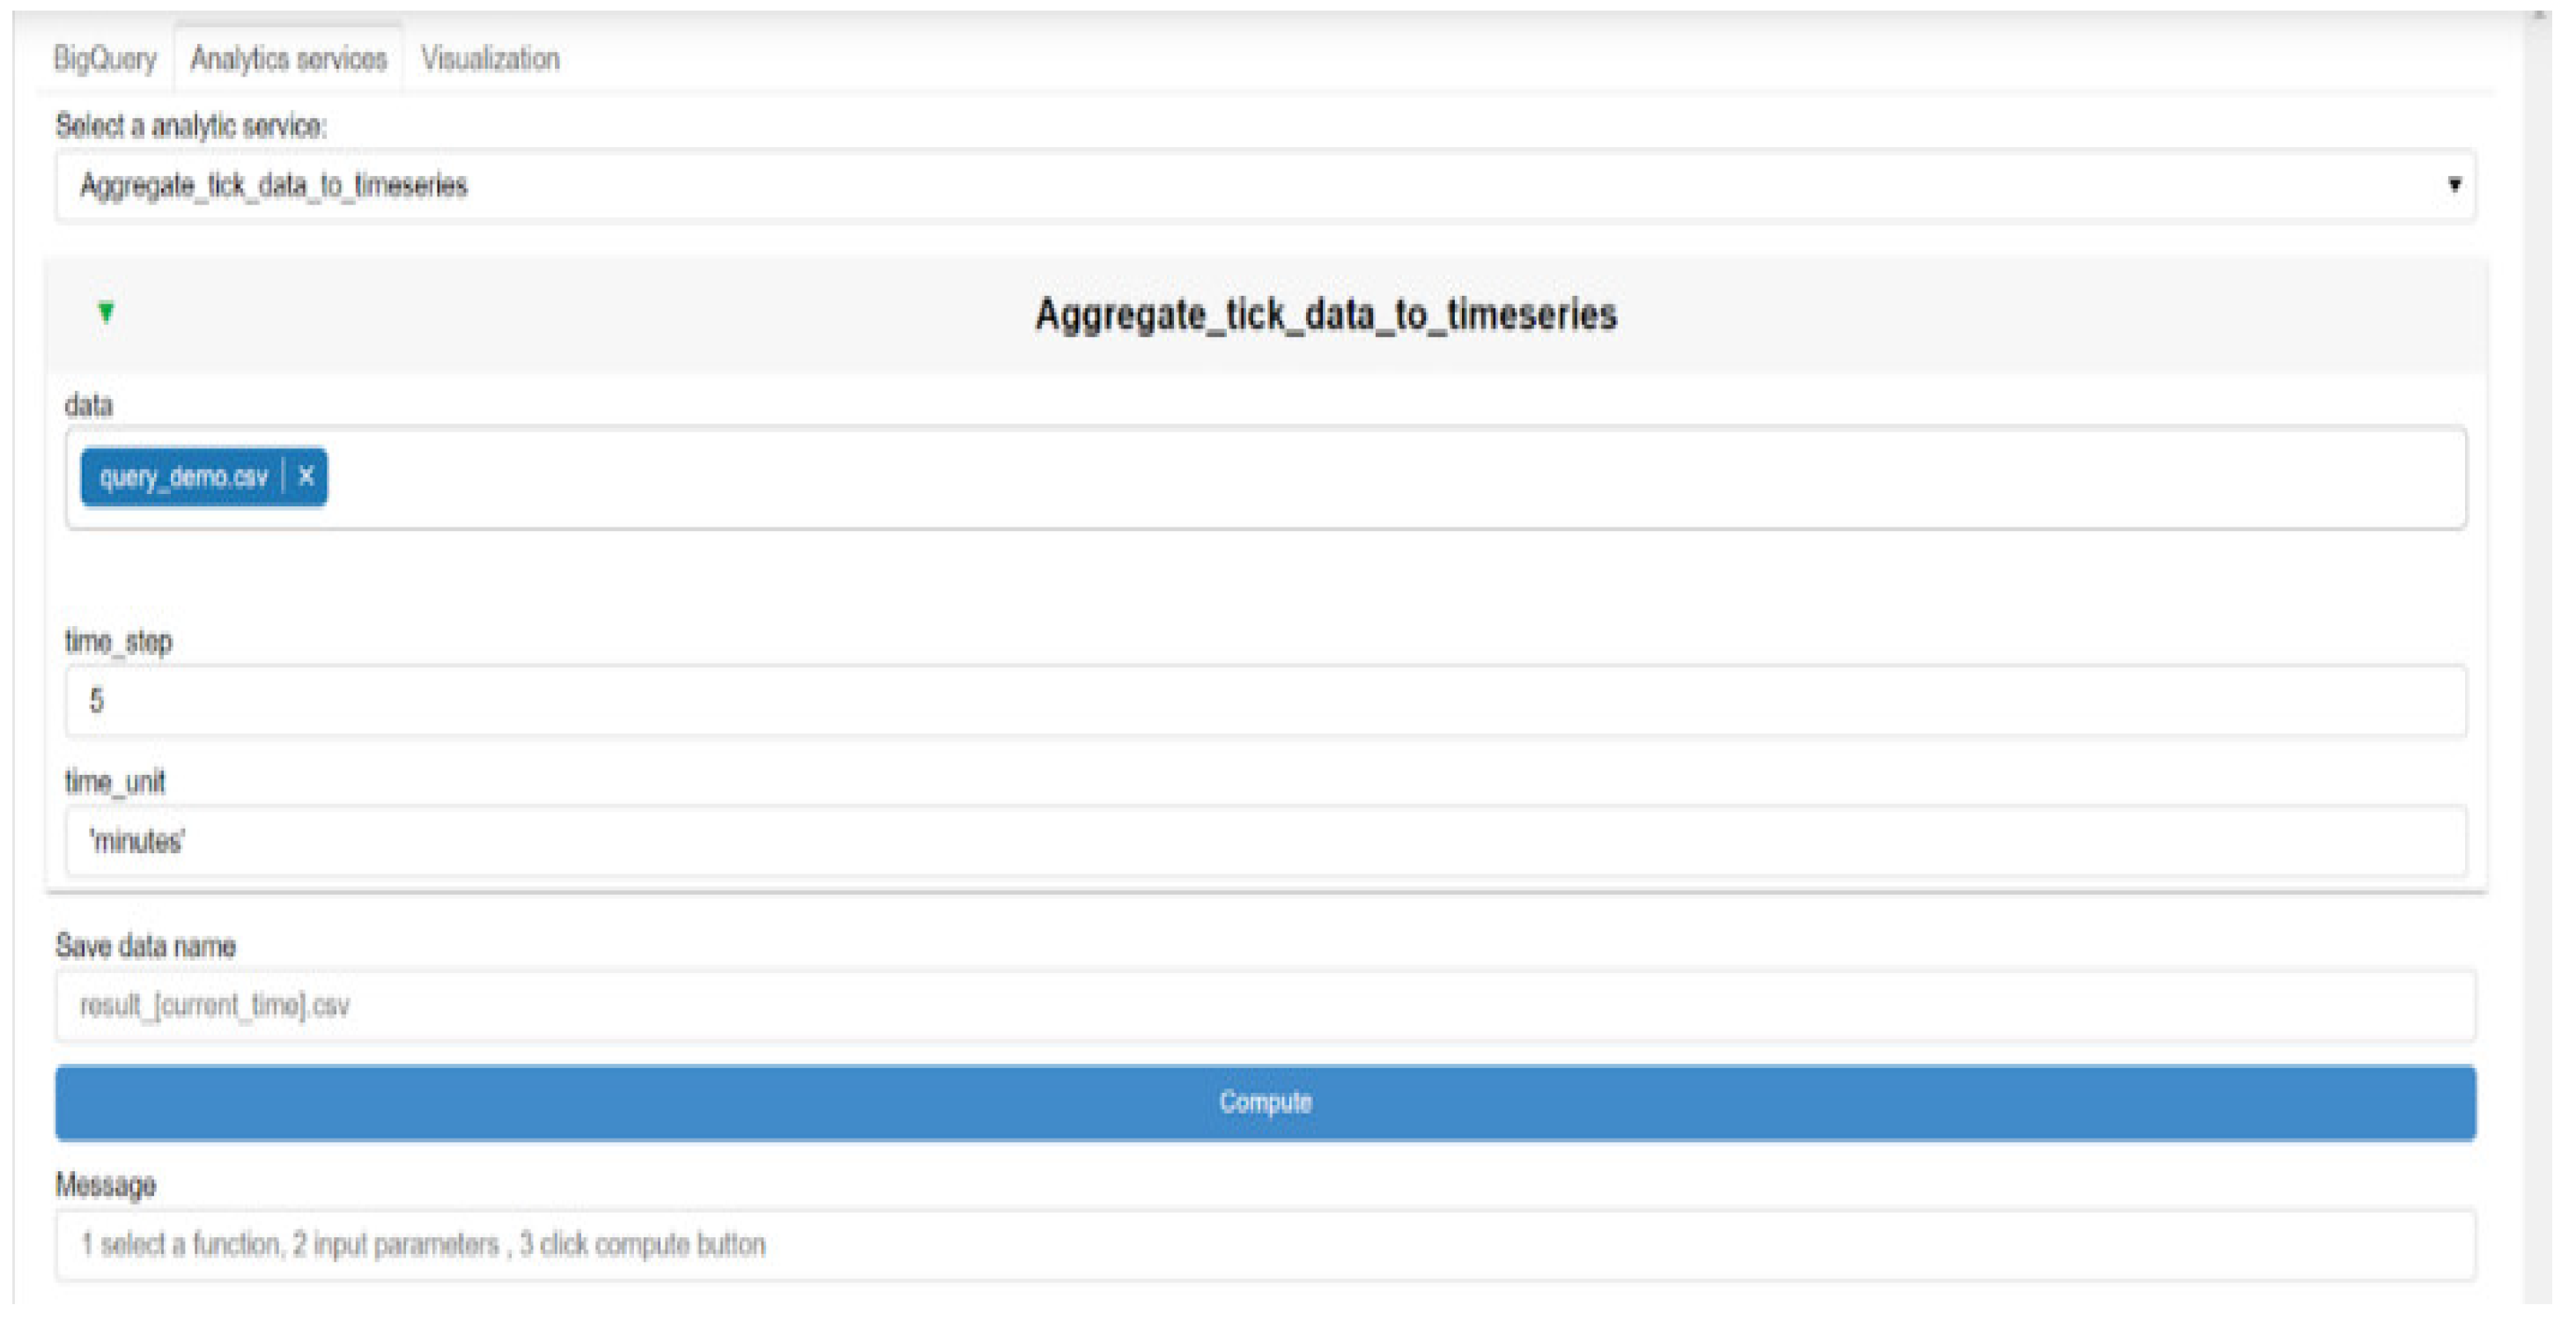
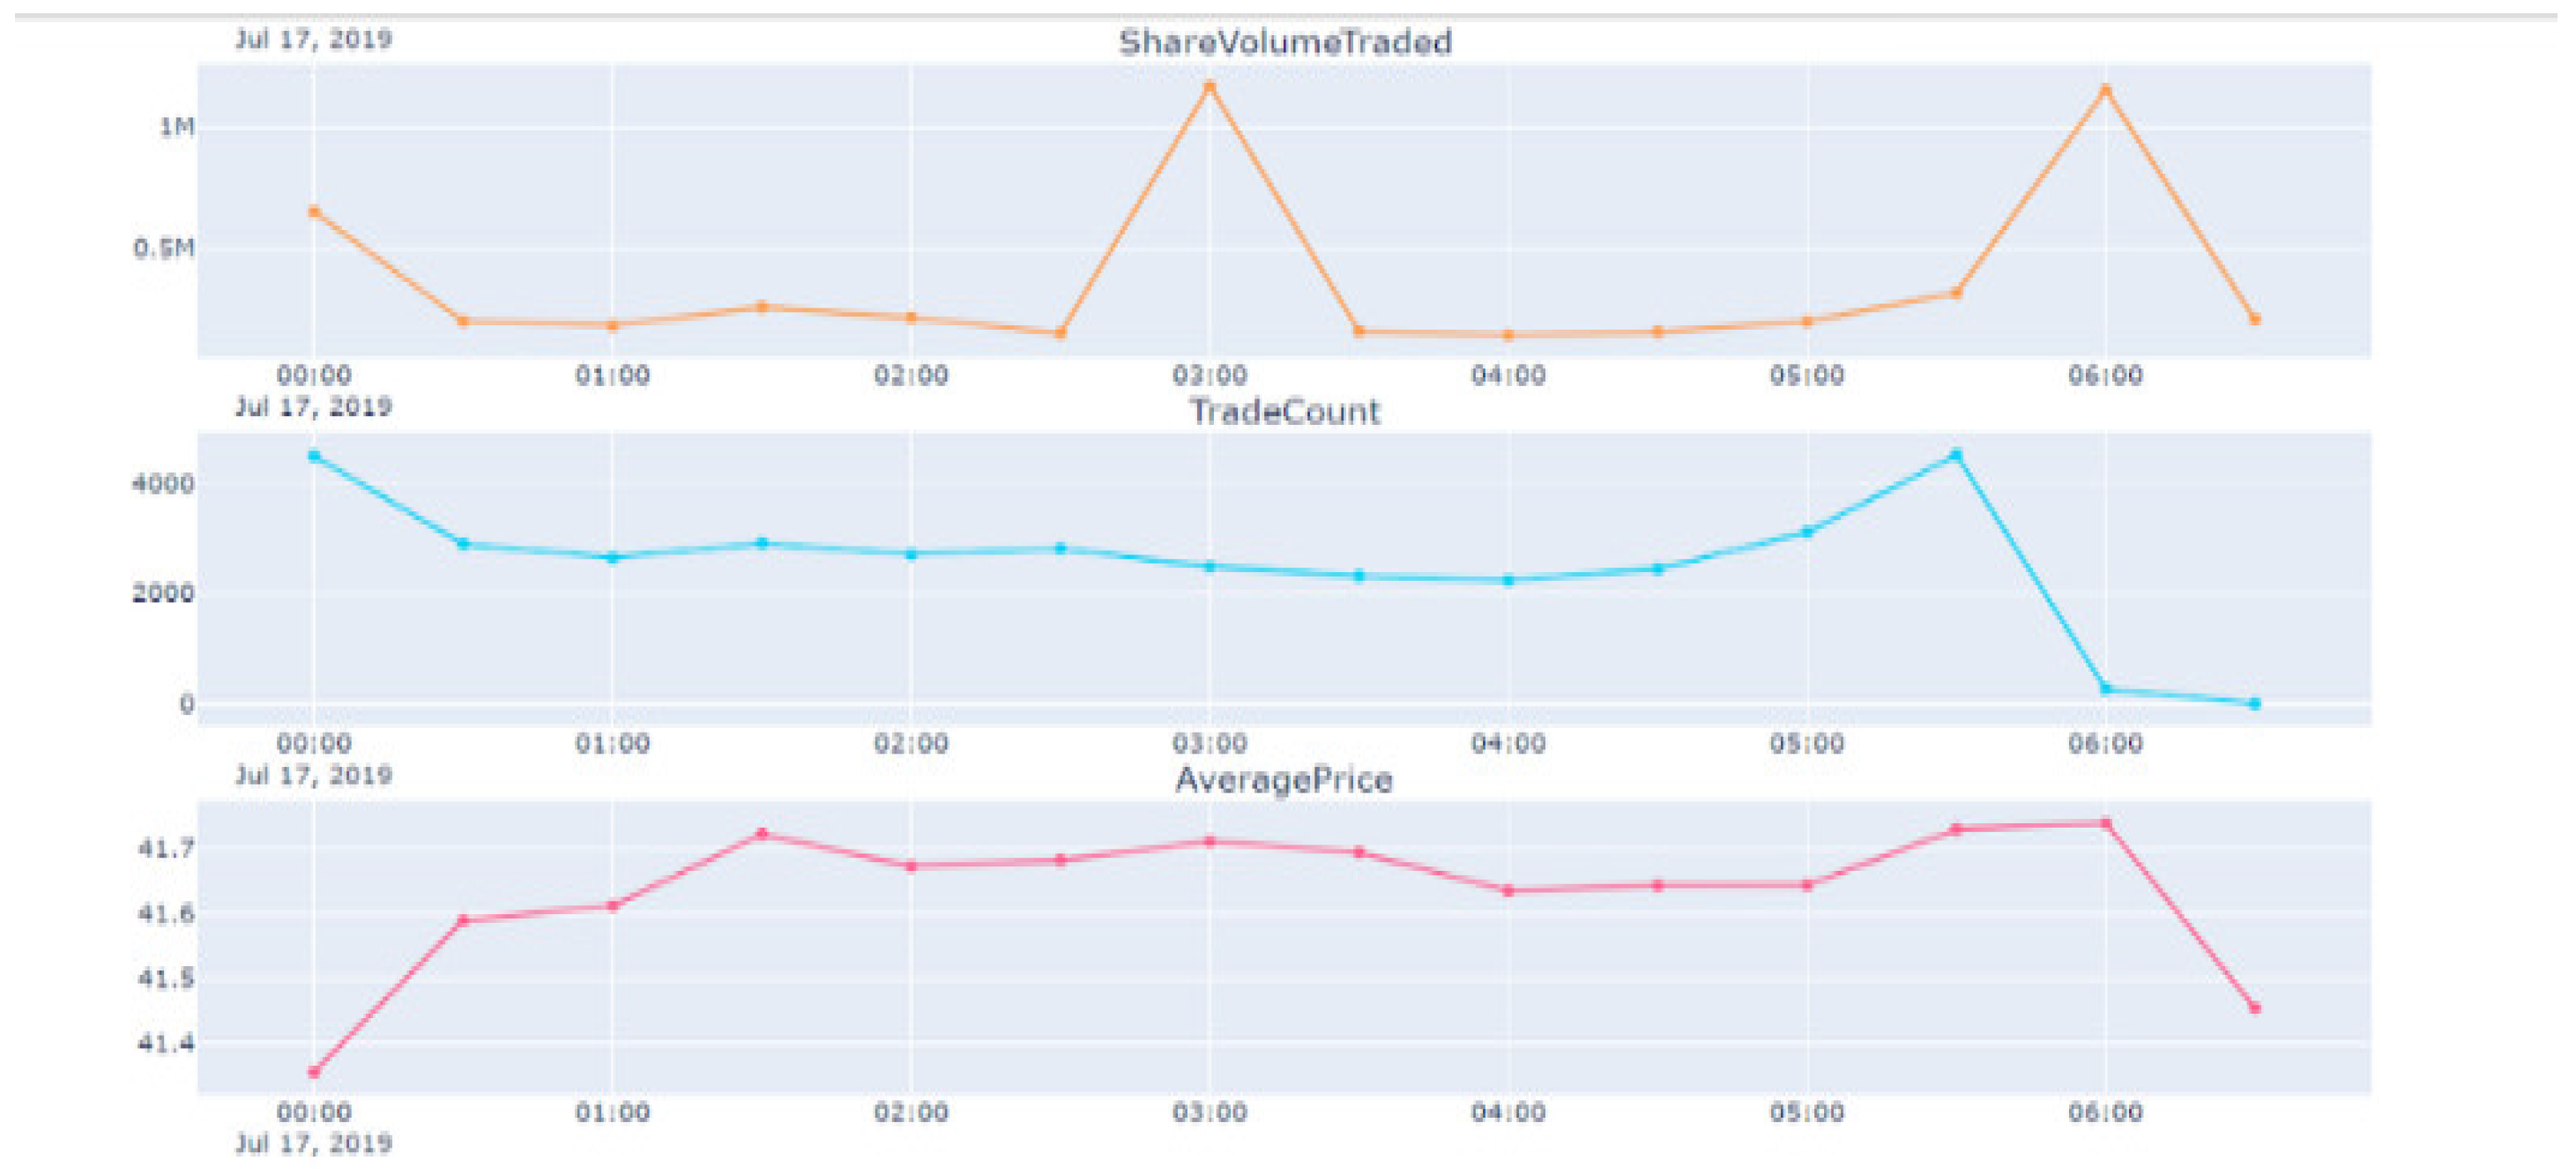
Here, we have the raw data in the form of a CSV file, from which a time series is built. This can be used to generate measures. Then, the results can be visualised or fed into models for generating trading signals. Once the signals are generated, orders can be placed for backtesting. A self-explanatory example concerning “timeseries” and “visualise” components is shown below in . The “build trades and quotes timeseries” component is a python file that takes input from the CSV and creates the JSON file containing basic measures. The “visualise” component is a Jupyter Notebook file that takes in the JSON file and produces a HTML file containing the required visualisations.
5. Conclusion
This paper has discussed how knowledge graphs can enable collaboration in the field of financial market data analysis. This is done by creating a software architecture that integrates workflows and knowledge graphs. This software architecture is described comprehensively and a case study demonstrating the usage within the context of equity markets has been shown at the end. This leads to an enhanced experience of collaborative financial market data analysis.
Author Contributions
Conceptualization, Bhushan Oza; methodology, Bhushan Oza and Ali Behnaz; software, Bhushan Oza; validation, Bhushan Oza and Ali Behnaz; formal analysis, Bhushan Oza; investigation, Bhushan Oza; resources, Bhushan Oza; data curation, Bhushan Oza; writing—original draft preparation, Bhushan Oza; writing—review and editing, Bhushan Oza and Ali Behnaz; visualization, Bhushan Oza; supervision, Ali Behnaz; project administration, Bhushan Oza. All authors have read and agreed to the published version of the manuscript.
Funding
This research received no external funding.
Data Availability Statement
The data presented in this study are available on request from the corresponding author due to privacy reasons.
Conflicts of Interest
The authors declare no conflicts of interest.
References
- Tsaih, R.H. , Chang, H.L., Hsu, C.C. and Yen, D.C., 2023. The AI Tech-Stack Model. Communications of the ACM, 66(3), pp.69-77. [CrossRef]
- Jarrahi, M.H. , Memariani, A. and Guha, S., 2022. The principles of Data-Centric AI (DCAI). arXiv:2211.14611.
- Hirzel, M. Low-Code Programming Models. Commun. ACM 2023, 66, 76–85. [Google Scholar] [CrossRef]
- John, M.M. , Olsson, H.H. and Bosch, J., 2021, September. Towards mlops: A framework and maturity model. In 2021 47th Euromicro Conference on Software Engineering and Advanced Applications (SEAA) (pp. 1-8). IEEE.
- Vanschoren, J. , Van Rijn, J.N., Bischl, B. and Torgo, L., 2014. OpenML: networked science in machine learning. ACM SIGKDD Explorations Newsletter, 15(2), pp.49-60. [CrossRef]
- Dixon, M.F. , Halperin, I. and Bilokon, P., 2020. Machine learning in finance (Vol. 1170). Berlin/Heidelberg, Germany: Springer International Publishing.
- Wang, J. , Sun, T., Liu, B., Cao, Y. and Wang, D., 2018. Financial Markets Prediction with Deep Learning. 17th IEEE International Conference on Machine Learning and Applications (ICMLA), pp.97-104.
- De Prado, M.L. , 2018. Advances in financial machine learning. John Wiley & Sons.
- Kearns, M. and Nevmyvaka, Y., 2013. Machine Learning for Market Microstructure and High Frequency Trading. High Frequency Trading – New Realities for Traders, Markets and Regulators, pp.1-21.
- Kersting, K. , Kim, M., Van den Broeck, G. and Zimmermann, T., 2020. Se4ml-software engineering for ai-ml-based systems (dagstuhl seminar 20091). In Dagstuhl Reports (Vol. 10, No. 2). Schloss Dagstuhl-Leibniz-Zentrum für Informatik.
- C. S. Robertson, F.A. C. S. Robertson, F.A. Rabhi and M. Peat, A Service-Oriented Approach towards Real Time Financial News Analysis, Consumer Information Systems: Design, Implementation and Use, A. Lin, J. Foster and P. Scifleet (eds), IGI Global, 2012.
- Sim, R.H.L. , Zhang, Y., Chan, M.C. and Low, B.K.H., 2020, November. Collaborative machine learning with incentive-aware model rewards. In International conference on machine learning (pp. 8927-8936). PMLR.
- Chen, Z.; Wang, Y.; Zhao, B.; Cheng, J.; Zhao, X.; Duan, Z. Knowledge Graph Completion: A Review. IEEE Access 2020, 8, 192435–192456. [Google Scholar] [CrossRef]
- Nabipour, M.; Nayyeri, P.; Jabani, H.; S. , S.; Mosavi, A. Predicting Stock Market Trends Using Machine Learning and Deep Learning Algorithms Via Continuous and Binary Data; a Comparative Analysis. IEEE Access 2020, 8, 150199–150212. [Google Scholar] [CrossRef]
- Chen, A. , Chow, A. , Davidson, A., DCunha, A., Ghodsi, A., Hong, S.A., Konwinski, A., Mewald, C., Murching, S., Nykodym, T. and Ogilvie, P., June. Developments in mlflow: A system to accelerate the machine learning lifecycle. In Proceedings of the fourth international workshop on data management for end-to-end machine learning (pp. 1-4). 2020. [Google Scholar]
- Thuan, N.H. , Drechsler, A. and Antunes, P., 2019. Construction of design science research questions. Communications of the Association for Information Systems, 44(1), p.20.
- Tebes, Guido & Rivera, María Belén & Becker, Pablo & Papa, Fernanda & Peppino, Denis & Olsina, Luis. (2020). Specifying the Design Science Research Process: An Applied Case of Building a Software Testing Ontology.
- Bandara, M. , Behnaz, A. and Rabhi, F.A., 2019. RVO-the research variable ontology. In The Semantic Web: 16th International Conference, ESWC 2019, Portorož, Slovenia, –6, 2019, Proceedings 16 (pp. 412-426). Springer International Publishing. 2 June.
|
Disclaimer/Publisher’s Note: The statements, opinions and data contained in all publications are solely those of the individual author(s) and contributor(s) and not of MDPI and/or the editor(s). MDPI and/or the editor(s) disclaim responsibility for any injury to people or property resulting from any ideas, methods, instructions or products referred to in the content. |
© 2024 by the authors. Licensee MDPI, Basel, Switzerland. This article is an open access article distributed under the terms and conditions of the Creative Commons Attribution (CC BY) license (https://creativecommons.org/licenses/by/4.0/).
