1. Introduction
The circulating fluidized bed (CFB) is widely used in a variety of processes, such as power plants, chemical and pharmaceutical industries due to its excellent gas-solid interactions and the ability to reduce the pollutant emission [
1,
2]. With the development of computer technology and computing algorithm, the numerical simulation has become a popular and effective method to study the complex gas-solid two-phase flow in the fluidized bed, which is instructive for the improvement of the actual industrial process and substantially reduces the experimental cost. The two-fluid model (TFM) [
3,
4,
5] under the Eulerian-Eulerian framework and the computational fluid dynamics-discrete element method (CFD-DEM) [
6,
7,
8] under the Eulerian-Lagrangian framework are two of the most used modeling methods in the simulation of gas-solid fluidized beds. Especially, the CFD-DEM takes the interaction between particles into account, which can provide a relatively accurate and detailed particle moment [
9,
10,
11,
12]. However, the high computational load and long computing time restrict the practical application of this model as it solves the most basic fluid and particle dynamic formulas.
The Markov chain based stochastic model (MCM) has proved to be an efficient and effective method to simulate the particle process in the granular systems, which calculates the particle movement based on the particle transition probability matrix and Monte Carlo method without solving the complicated dynamic formulas [
13,
14,
15]. Berthiauxa et al. [
16,
17] introduced some applications of the Markov chain theory to simulate different processes of particles technology, such as grinding, classification, mixing and agglomeration. The examples confirmed that the Markov chain theory was a universal mathematical tool, and it only contained few mathematical operations, which could be easily performed by using contemporary software. As a typical granular system, the rotating drum was simulated by Doucet et al. [
18] by using the Markov chain theory. They defined the Markov states of the rotating drum by the divisional physical cells. In this way, the specific particle movement could be obtained by the MCM. The calculation of the transition probability matrix was based on directly taking the preliminary DEM simulated results as statistic samples, since the DEM was able to give detailed particle movement. The simulated results showed that the MCM gave a good estimate of the particle mixing in the rotating drum system. Ponomarev et al. [
19,
20] established a 2D model of the flow and mixing of particulate solids for an alternately revolving static mixer based on the Markov chain theory. The particle transition probability between each two mixing elements was calculated according to the physical geometry. Effects of the initial material loading and the transition probability values on the mixing kinetics were investigated. In addition, comparison of the simulated results with the published experimental data gave a good validation of the viability of the MCM.
However, when it comes to fluidized beds, the interaction between the solid phase and the gas phase is much stronger and more complicated than that in both the rotating drum and the static mixer. Anyway, there have been some researches about the application of the MCM in the fluidized beds. Gottschalk et al. [
21] introduced a multiphase stochastic model for the vertical particle transport in the bubbling fluidized beds based on the Markov chain theory. The finite velocity of fluidization bubbles and the extra particle transport due to gulf streaming were considered in the description of Markov chain states. Results from the multiphase stochastic model agreed well with the experimental data. But neither the horizontal particle transport nor the detailed particle moment could be obtained from the simulation of this stochastic model. Catak et al. [
22,
23] introduced a Markov chain simulation for the fluidized bed granulation. However, the Markov chain method was only used to model and analyze the particle size enlargement process, but not involved with the particle fluidization. Mizonov et al. [
24,
25,
26] proposed a one-dimensional mathematical model of particulate solids fluidization based on the theory of Markov chains. Particle convection between two different cells of the chain and the particle diffusion over the bed height were taken into consideration to calculate the transition probabilities. The model successfully described and predicted the macroscopic particulate phase distribution over the bed height in the batch process, and the particle residence time distribution (RTD) was verified experimentally. Harris et al. [
27] presented two stochastic mathematical models to simulate the RTD of solids in the riser of a CFB using a Markov chain. One of them was a core-annulus solids interchange model, and the other was a four-zone model that derived from the fast fluidized bed hydrodynamic profile. The transfer probabilities were calculated according to the local particle mass flow rates between each two states, and with both the discrete time and the continuous time versions presented. The particle RTDs simulated by the stochastic models were in a good agreement with the experimental data from a few authors. Nevertheless, the MCMs mentioned above can only simulate the macro movement of many particles, but cannot provide the detailed particle movement in the fluidized beds as that predicted by the CFD-DEM simulation. Thus, there is still a long way to combine the MCM with the chemical reaction, mass transfer and heat transfer between particles and fluidized gas.
In this paper, a CFD-DEM based MCM is introduced to simulate the detailed particle movement in a 2D CFB riser, which is carried out through discretizing the CFB riser into physical cells as Markov states. As the CFD-DEM can provide a relatively accurate and detailed particle moment in fluidized beds, the previous CFD-DEM results can act as appropriate statistical samples for the MCM, and the subsequent CFD-DEM simulation is used to verify the calculated results of MCM. In addition, as MCM belongs to the statistical category, the informative sample data provided by CFD-DEM is beneficial for the improvement and further expansion. Furthermore, statistical models have strong sample adaptability. The MCM established based on CFD-DEM simulation results can easily replace the samples with experimental data in the future.
2. Model Description
2.1. Discrete Element Method
The simulation object in this paper is a 2D CFB riser. It is an infinite circulating system in which the gas and particles at the outlet of riser are immediately fed into the inlet with the same velocity and lateral positions. The no-slip wall condition for gas phase is assumed at the walls. The riser height and width are 0.95 m and 0.09 m, respectively. Other parameters are listed in
Table 1.
Taking the CFD-DEM results as samples of the MCM is an optimized choice, as the CFD-DEM can provide the detailed and abundant particle information that meets the needs of the statistical calculation [
18,
28,
29]. The credibility of the CFD-DEM is guaranteed by its fundamental physics and hydromechanics-based algorithm. In CFD-DEM model, the local averaged Navier-Stokes equations and the Newton’s second law are applied to calculate the flow of the gas phase and the movement of the particles. The basic drag model [
30] and liner spring-dashpot model [
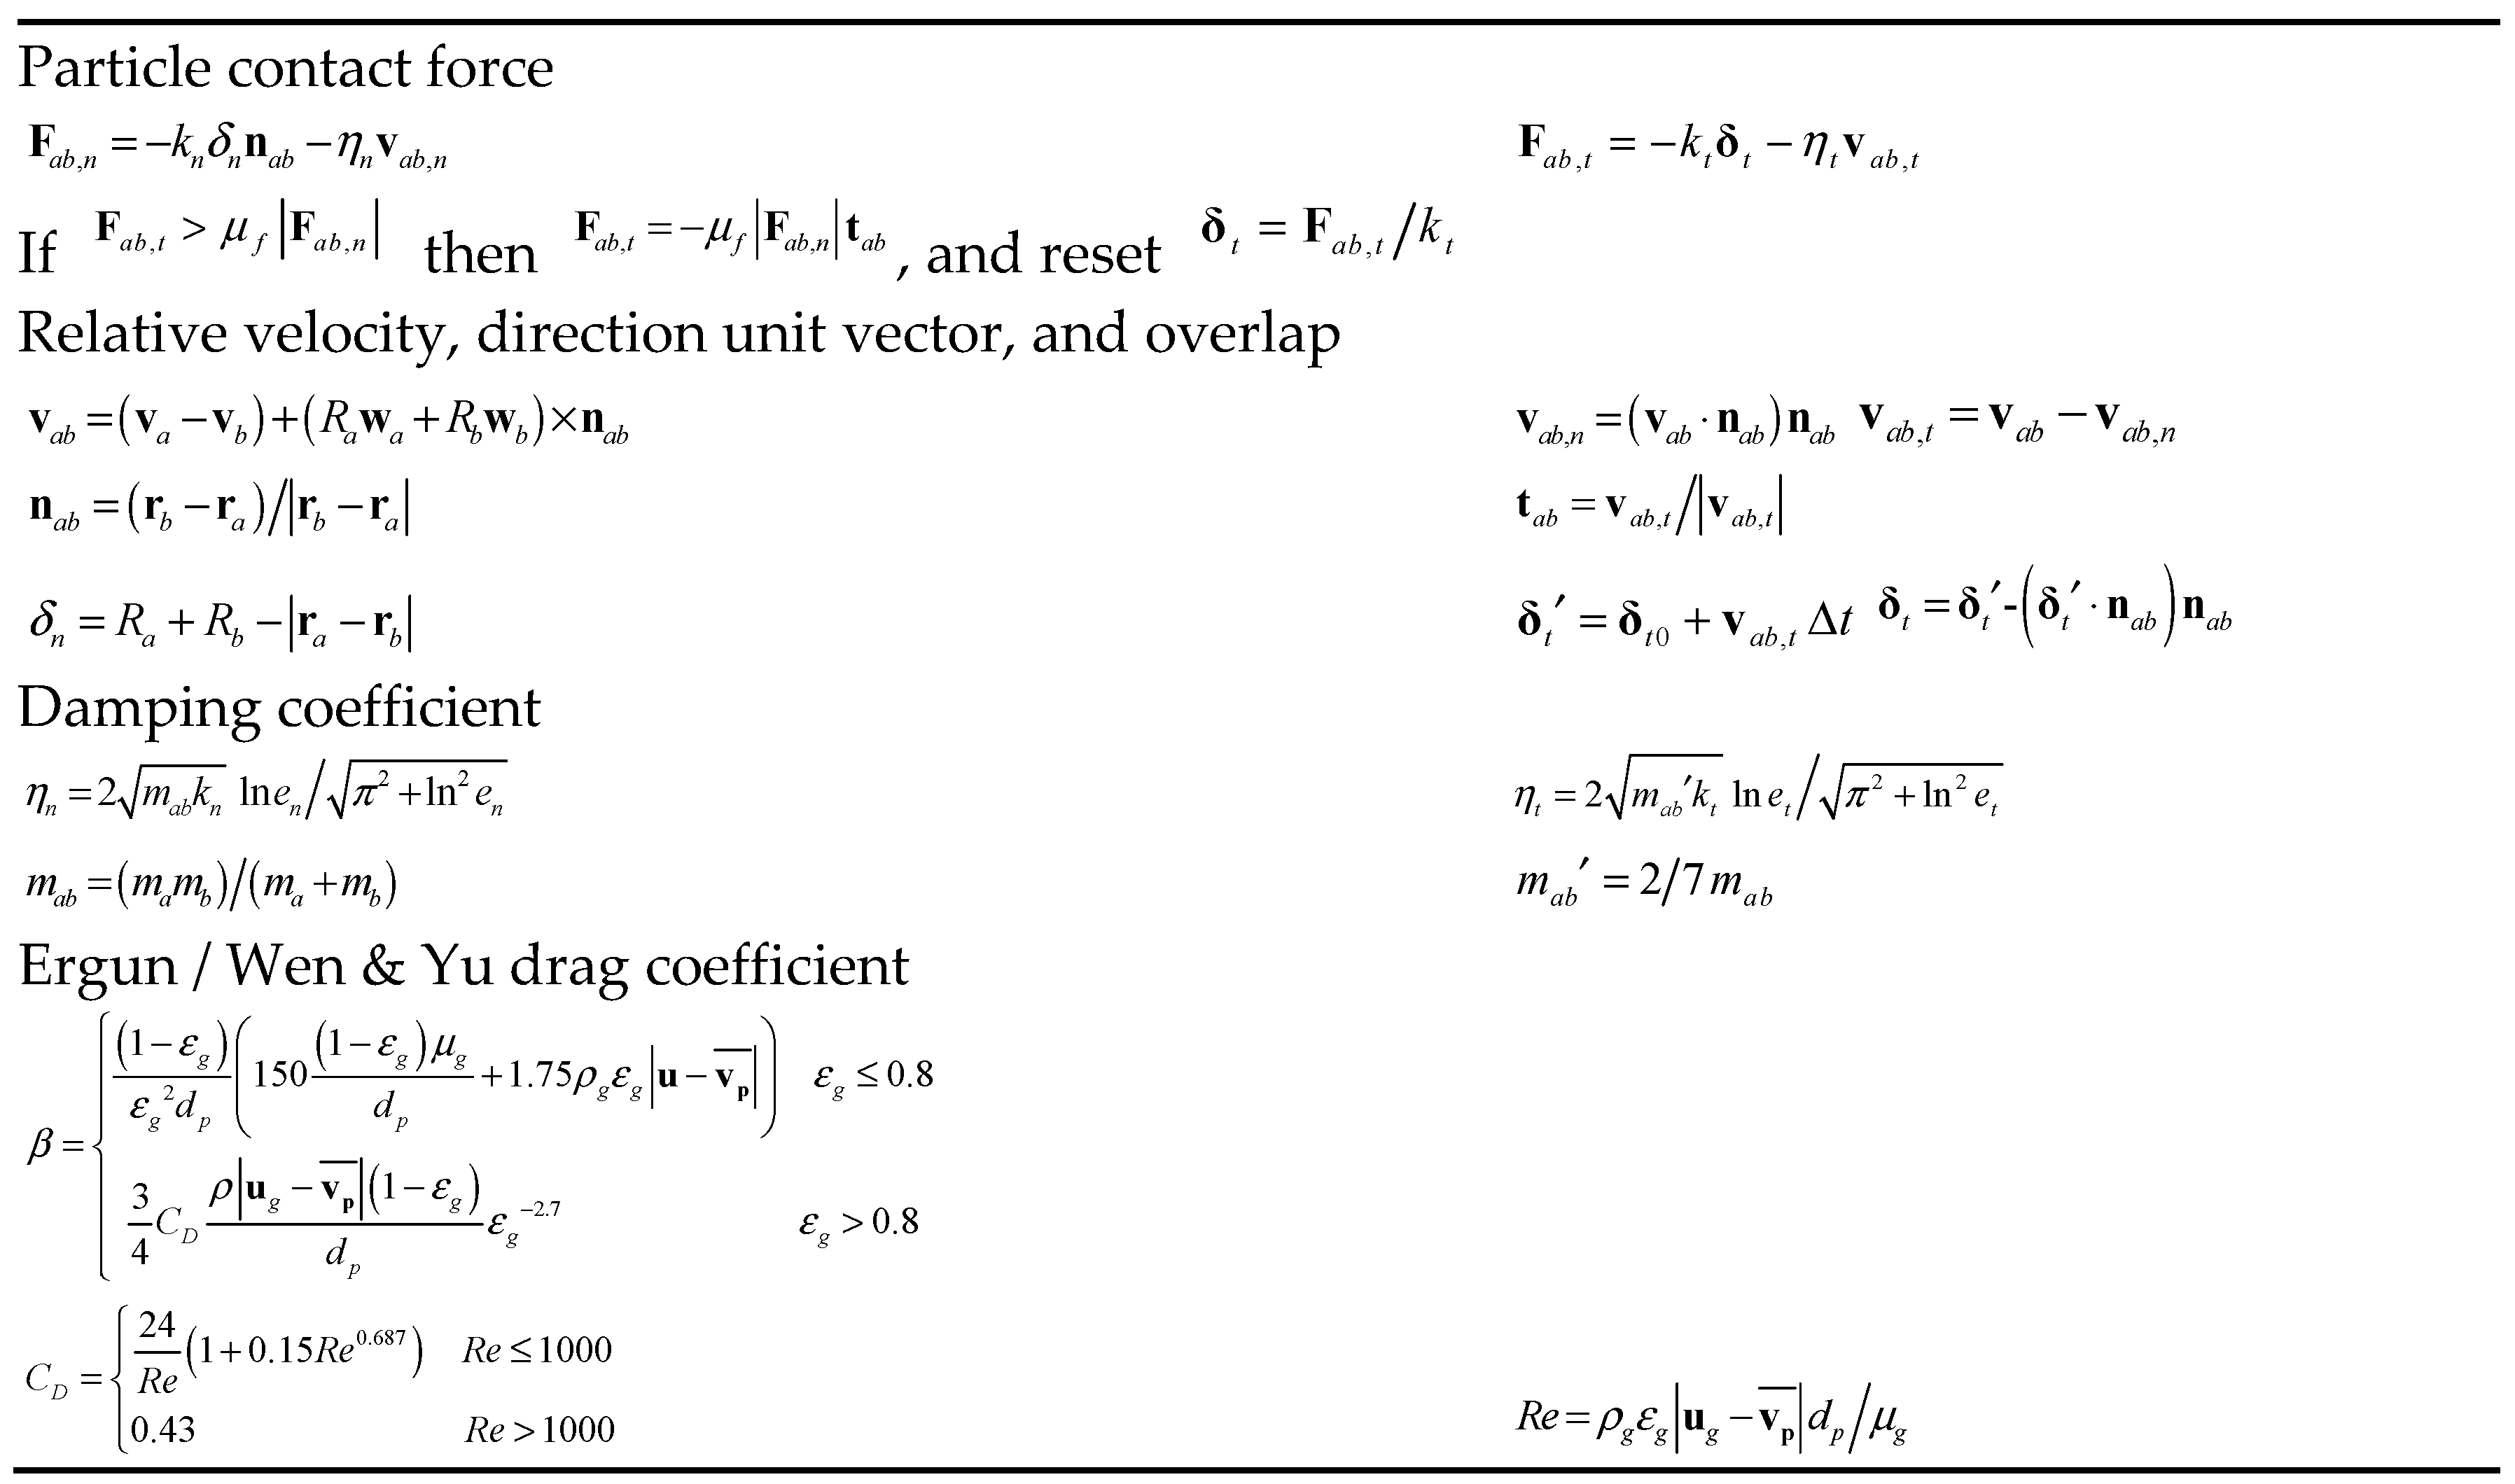
31] are also contained. The CFD-DEM approach used in the present work is based on previous work, which has been used and validated in various studies of fluidized beds. Necessary information of the CFD-DEM model is given in
Table 1 and
Table 2. All particle collisions are considered in the CFD-DEM simulation. The DEM cell list and the neighbor search technique are employed to accelerate the search for particle collisions.
The CFD-DEM simulation lasts 20 s. The MCM takes samples based on the data calculated by the CFD-DEM from 10 s to 15 s, when the fluidization is fully developed. The MCM calculates the particle motion in the subsequent 5 s, and results are compared with the CFD-DEM results in the same period (15 s - 20 s).
2.2. Markov Process of Particles
A Markov chain is a stochastic process that satisfies the Markov property, which can be used to simulate a random system predicting the future of the process based solely on its present state [
16]. A discrete-time Markov chain is used in this paper, which means the process makes transitions from one state to another on a state space, according to the probability distribution of the next state. The probability distribution depends only on the current state without influence of the sequence of events that preceded it. Although it is almost impossible to strictly testify the Markov property of fluidized beds, a few of applications and discussions have convincingly indicated the applicability of the MCM for fluidized beds [
21].
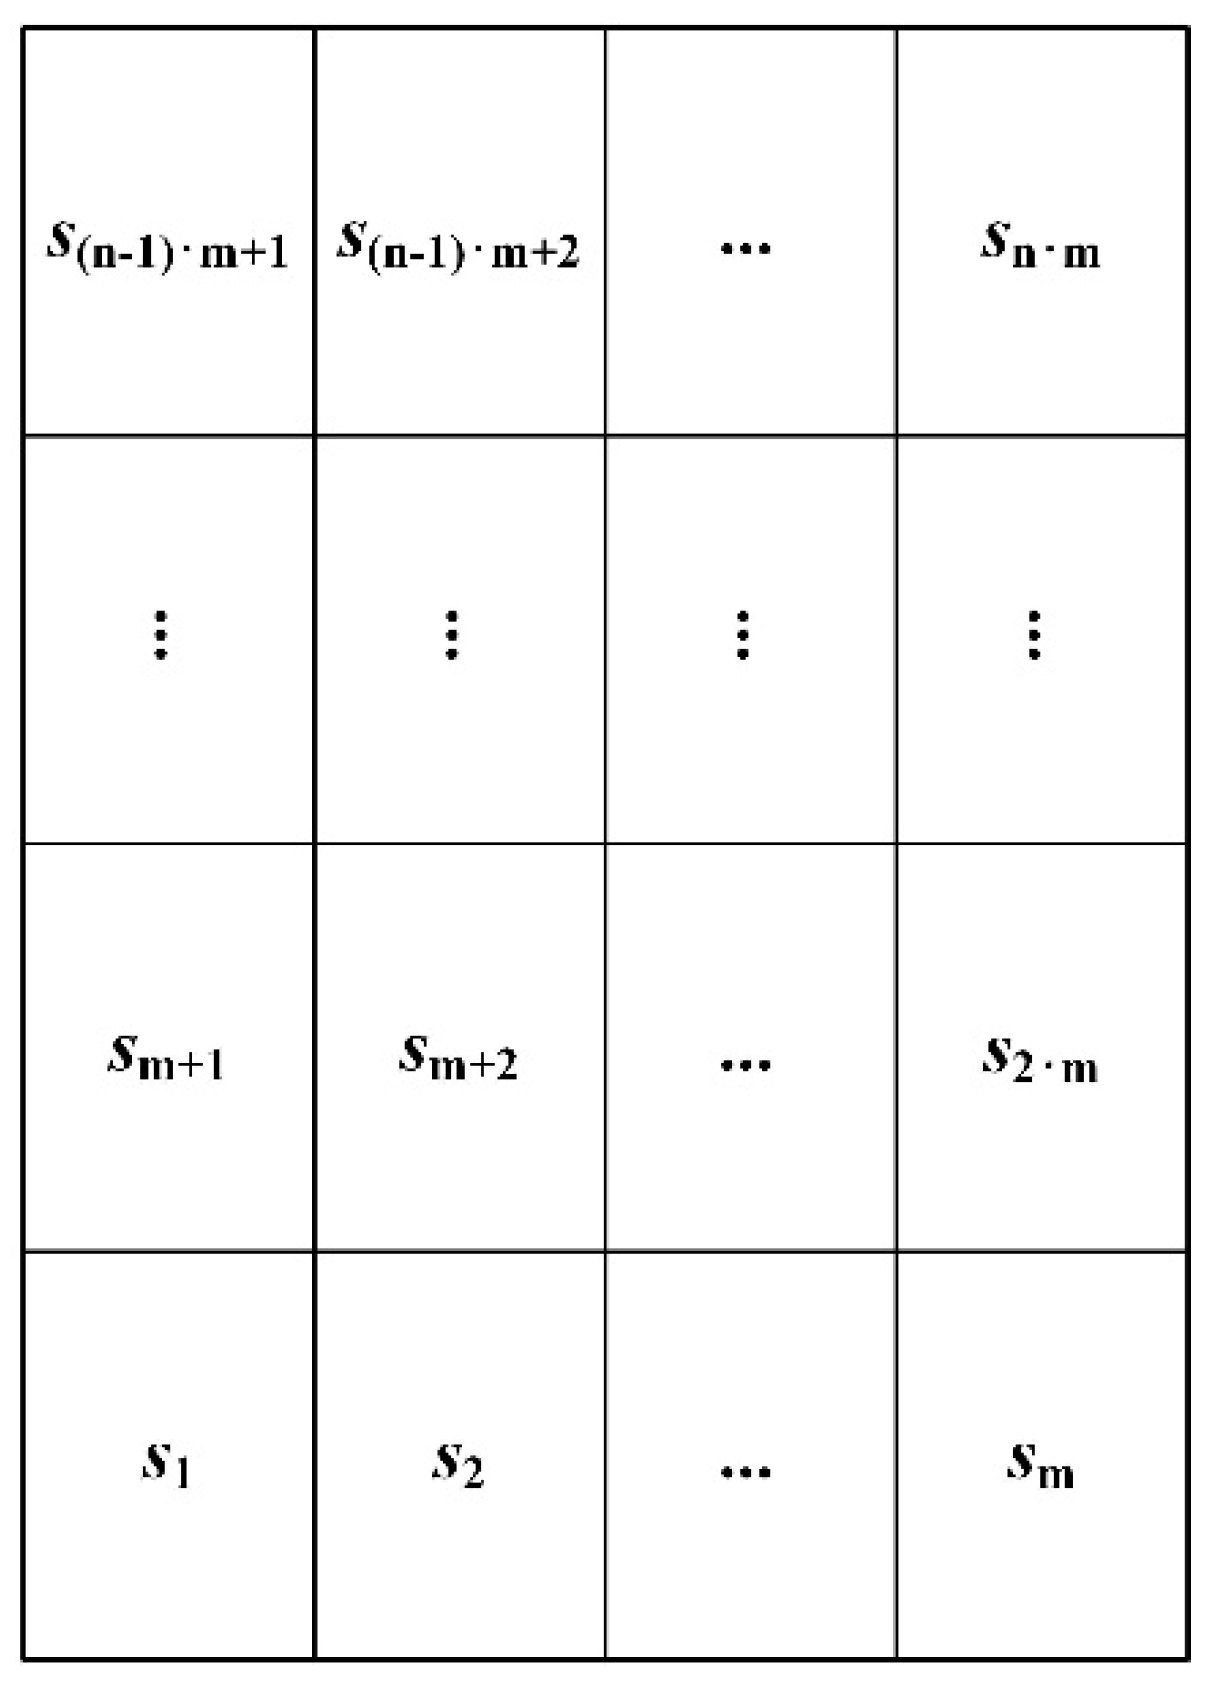
The 2D CFB riser is discretized into
and
equal divisions separately in width and height. The
physical cells are the space states of the MCM for the 2D CFB riser system, which is shown in
Figure 1. The space state information of a particle at a certain time
can be described by a state vector
as follows:
At the beginning, the cell where the particle locates represents its MCM state, and the corresponding component of is assigned the value 1, while other elements are assigned as 0.
cells (space states).
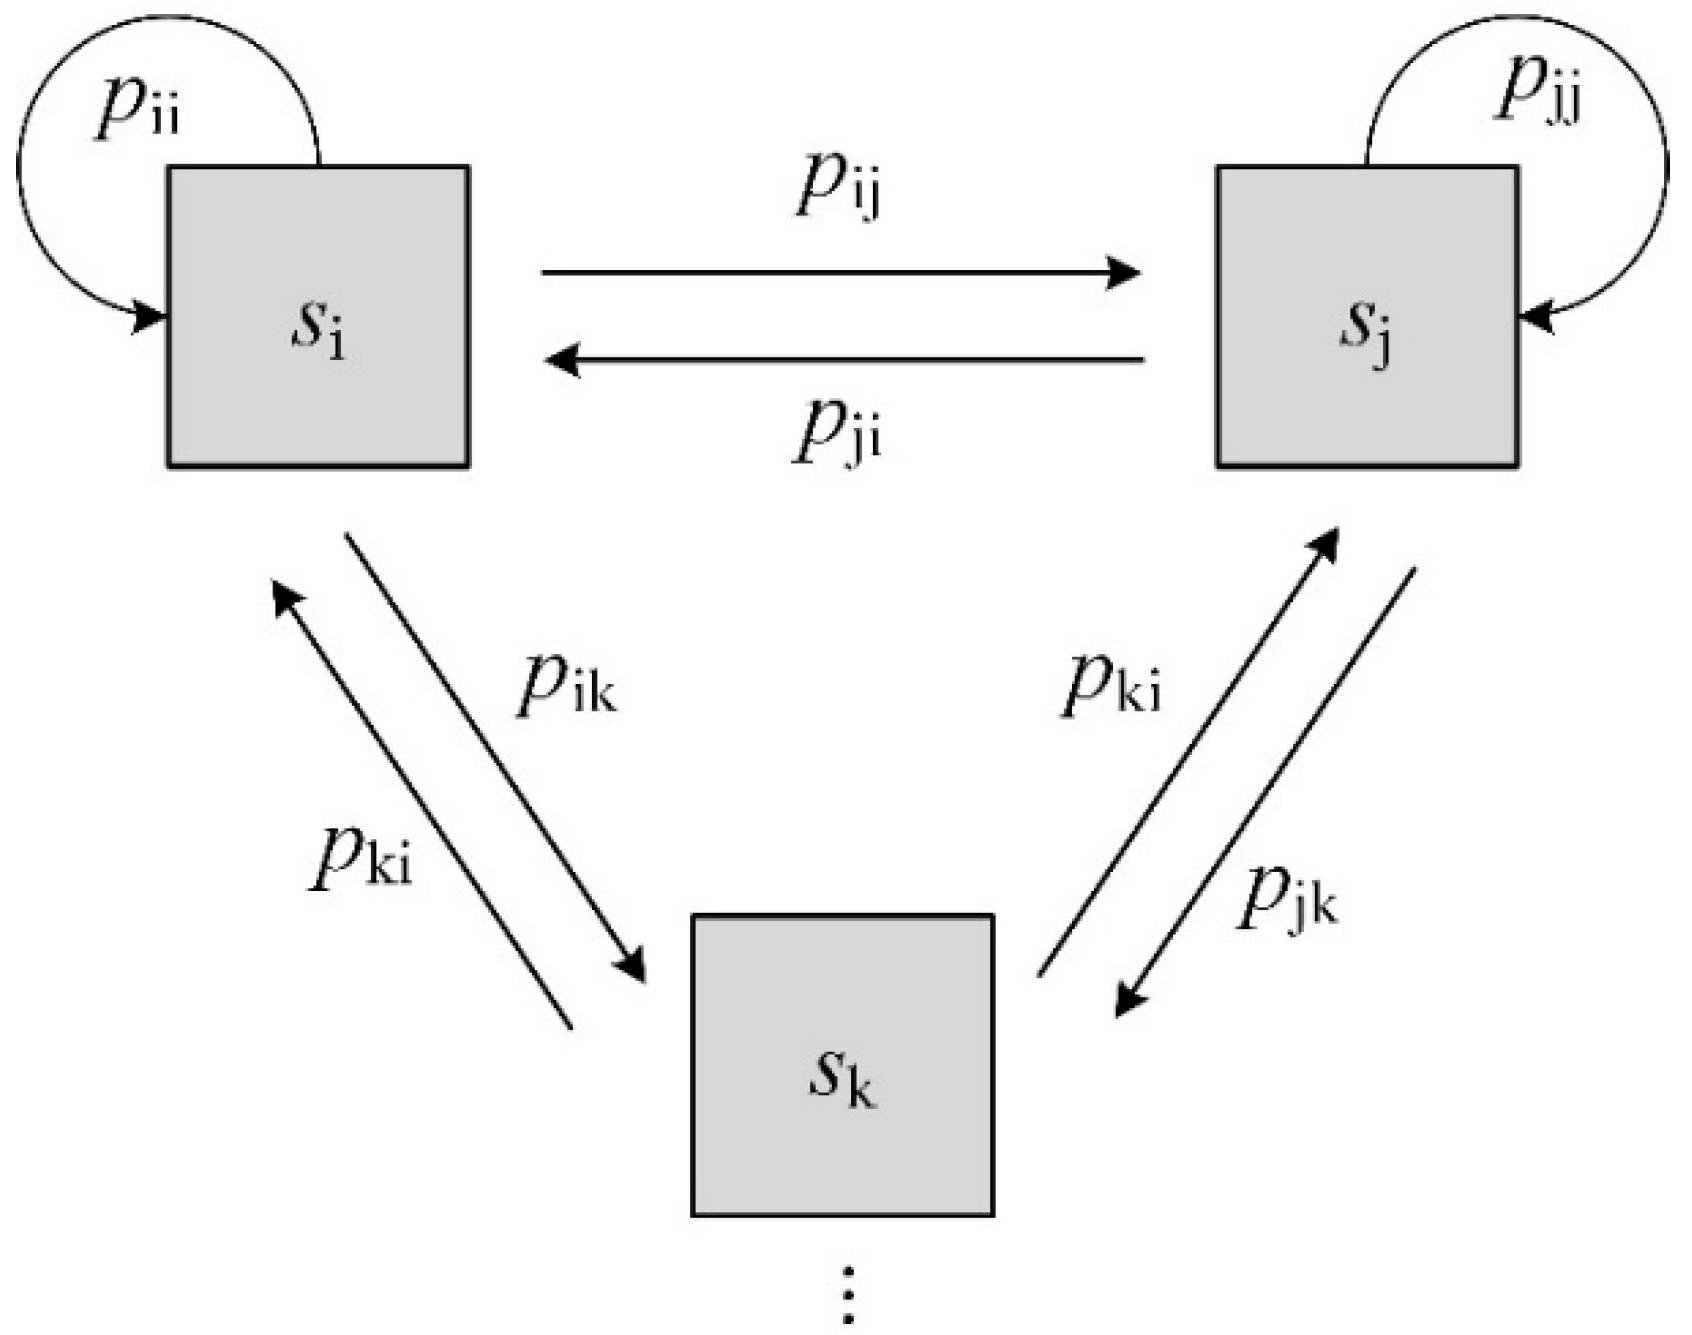
Figure 2 gives a diagram of the transitions of the Markov chain states. Assuming that there are
particles in the state
at the time
, and there are
particles moving from
to
at the next moment
. The transition probability
which describes the probability that particles moving from
to
between the moment
and
can be calculated as Eq. (2).
The transition probabilities between any other two states at any time moment can be calculated by the same method, which form a matrix
of the transition probabilities at this time. The average value of all the transition probability matrixes at all moments is the final transition probability matrix
for the MCM. All information of the particles used in the calculation of the transition probabilities is obtained from the CFD-DEM results. Matrixes
and
are shown as Eq. (3) and Eq. (4).
The sampling time of the MCM is from 10 s to 15 s (mentioned in the last paragraph of section 2.2), so the start time for sampling is set as 10 s. According to our previous studies on the parameters of the MCM for the 2D CFB riser, the model output is not very sensitive to the cell size and time step, if the value is not outrageous. In this paper, the variables , and are separately set as 6, 38 and 0.025 s. There are totally 200 instantaneous transition probability matrixes which can be obtained during the five-second sampling. On such condition, the time step should be appropriate to the state divisions. A long-time step might make the transition probability matrix more complicated and lead to distorted statistical results, whereas a short time step is not long enough for a particle leaving the current state and moving to the neighboring one.
The state vector transition of a particle between two adjacent time steps or at any time can be described as Eq. (5) and Eq. (6). During the matrix operations, each component of vector
is between 0 and 1, which represents the probability of the particle located at the corresponding state. The probability distribution of the particle state can be easily predicted by these simple matrix operations.
The Monte Carlo cumulative sampling method is used to confirm the certain state of a particle by a random number once the probability distribution of its state is obtained. The random number generated by the computer is limited between 0 and 1. Eq. (7) gives the specific algorithm to calculate the state number
that the particle is marked with at the time
according to its state vector
.
The state number obtained is equivalent to the cell number in the 2D CFB riser. The approach taken here is to randomly arrange the particles in the cell which they are marked with. The whole Markov process of particles uses the CFD-DEM calculated particle information at the time 15 s as the initialization, and then calculates the particle movement according to the MCM described above.
3. Results and Discussion
3.1. Computing Time
The MCM is initialized by using the CFD-DEM results at 15 s, and then continues to simulate by using the stochastic model. It takes about 50 h for the CFD-DEM of the subsequent 5 s simulation, whereas it costs only about 30 min for the MCM. That is, the MCM is about 100 times faster than the CFD-DEM, which is a quantum leap compared to the traditional CFD models.
3.2. Transition Probability Matrix
The transition probability matrix is one of the most important factors for the stochastic model, and it has the convenience to express some macroscopic properties of the CFB riser.
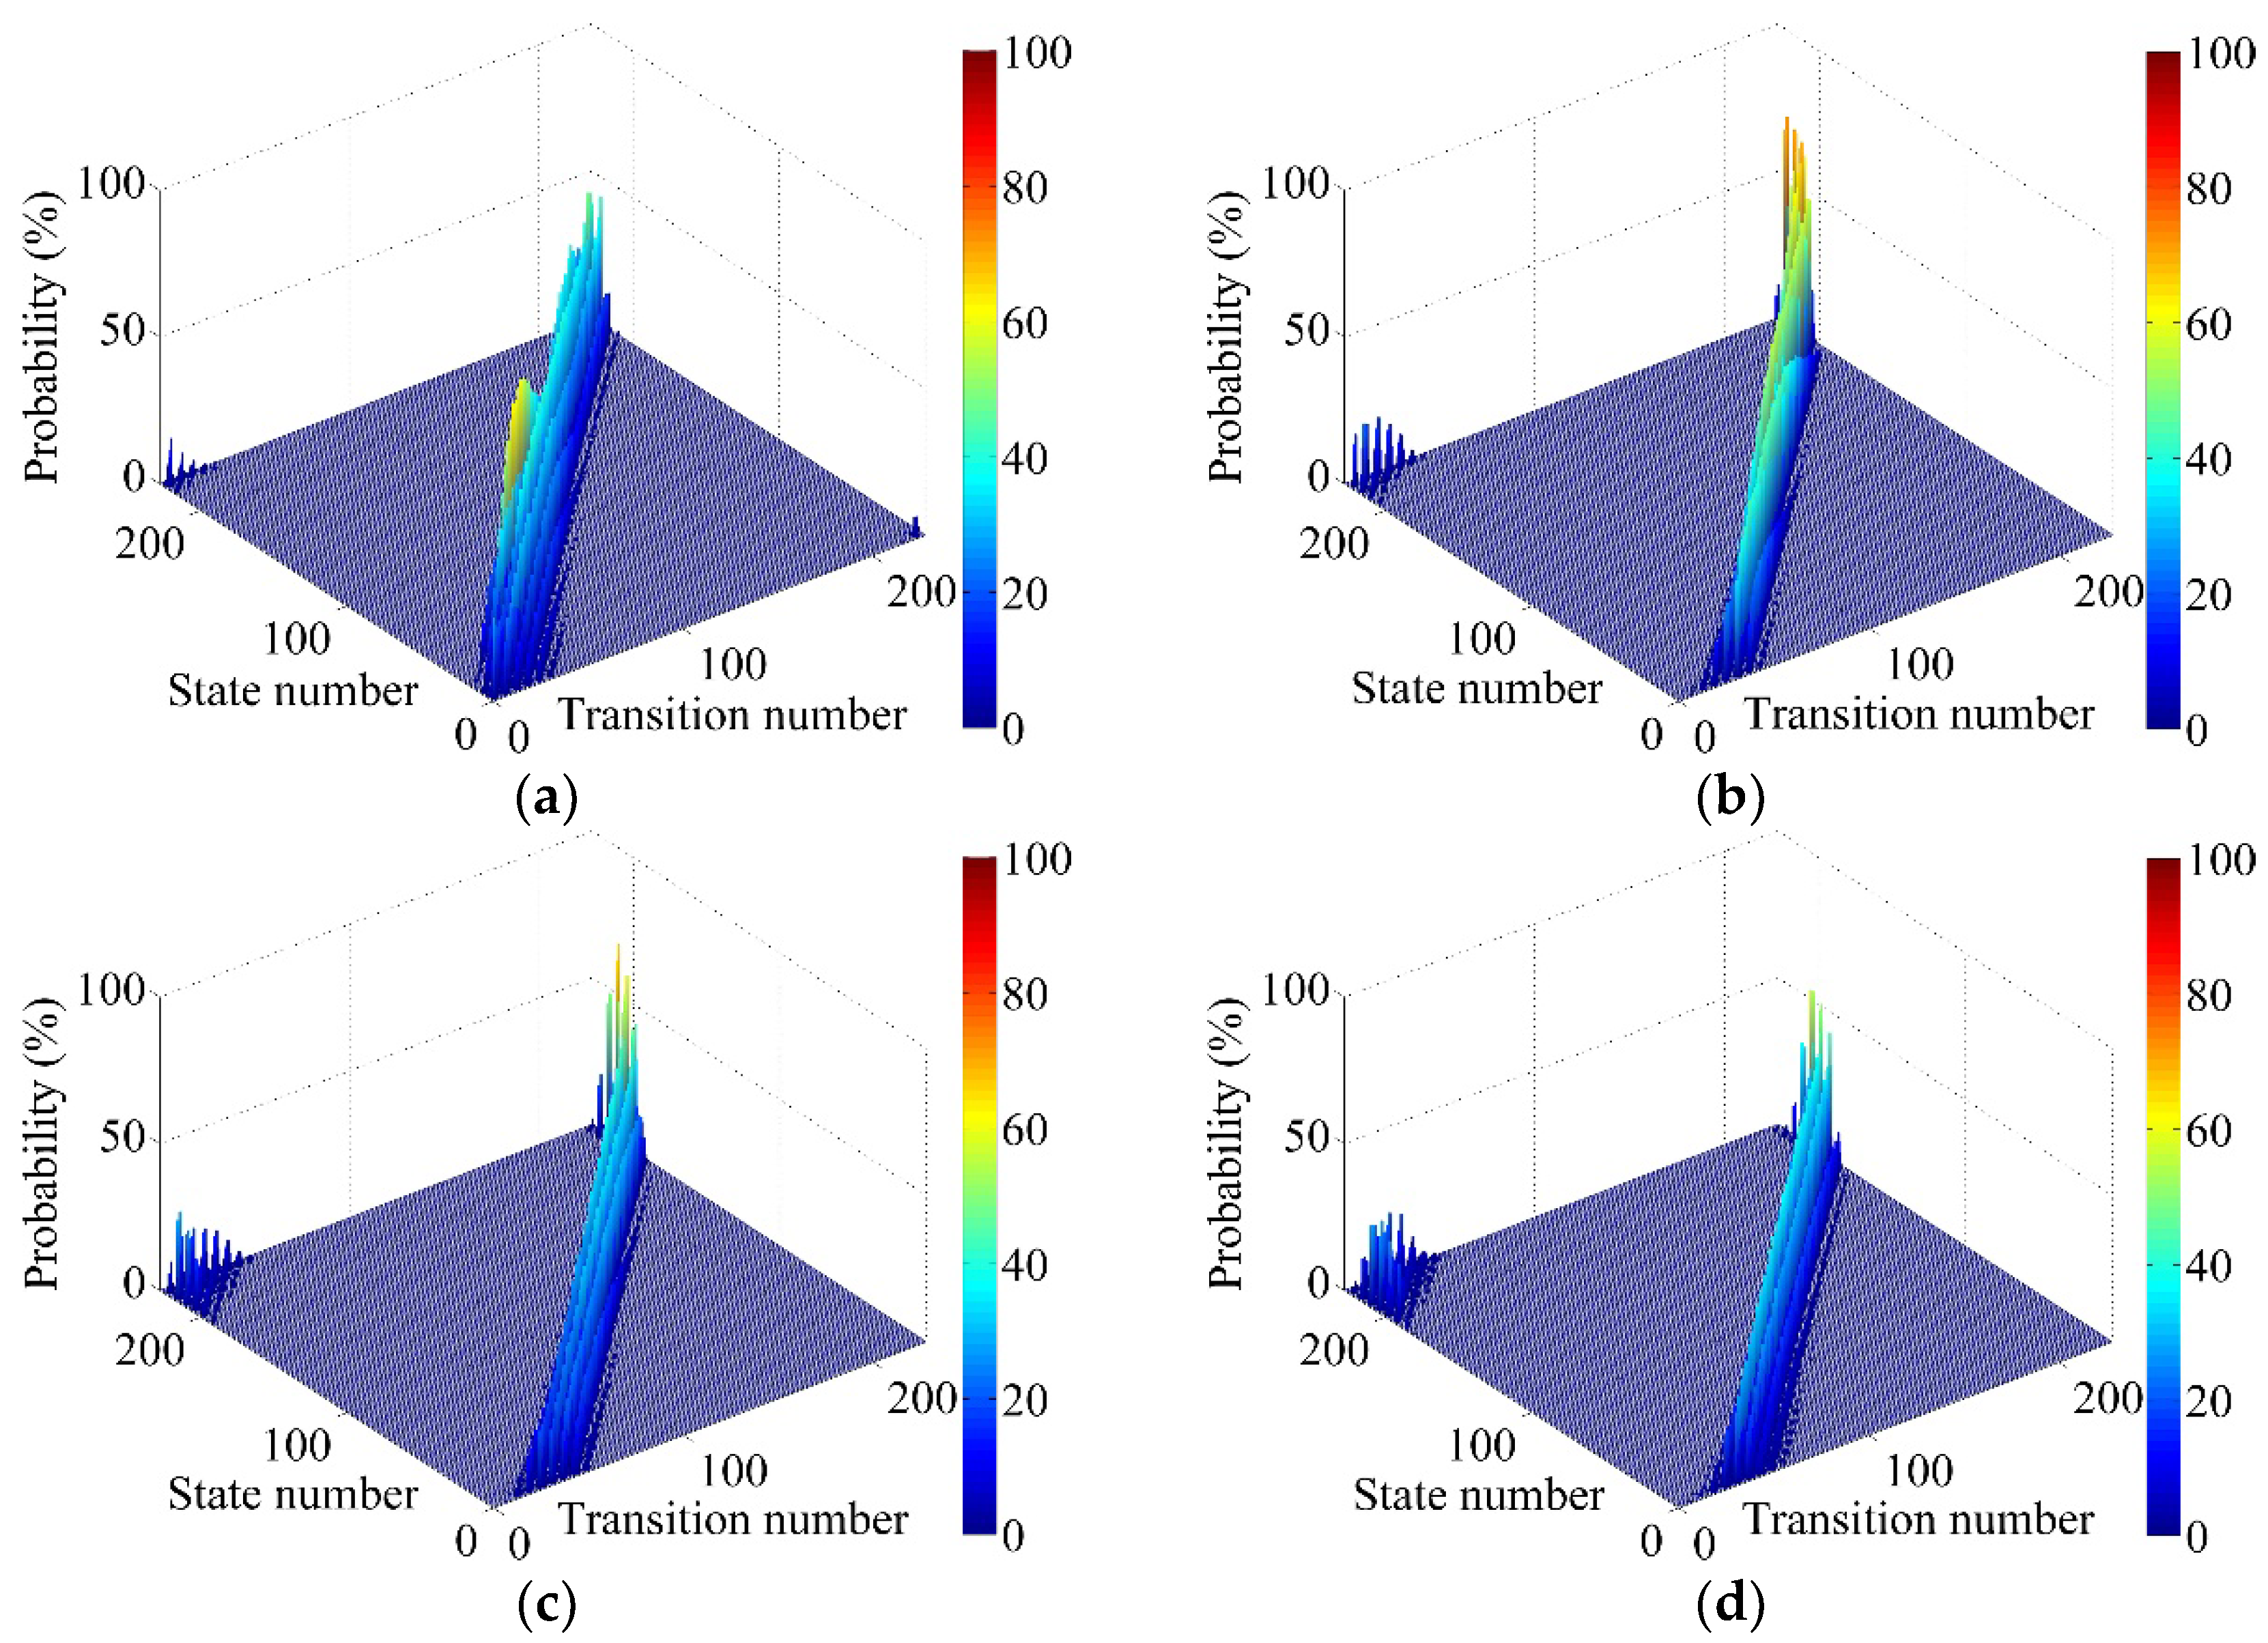
Figure 3 gives the transition probability matrixes expressed by bar graphs under four fluidized velocities. The transition probability
corresponds to the probability under the state number
i and the transition number
j in the histograms.
Figure 3a shows three obvious regions from the left to the right of the graph, where there exist nonzero values in
under the fluidized velocity of 3 m/s. In the first region, the state number
i is from 210 to 228, which represents the top area of the CFB riser according to
Figure 1, and the transition number
j is from 1 to 37, which represents the bottom area of the CFB riser. So, the first nonzero region of
indicates that particles have the certain probability to move from the top to the bottom of the bed. The reason of this kind of the particle motion is that the simulated CFB riser is an infinite circulating system, in which particles are immediately fed into the inlet of bed when they get out of the top of the bed. In the second nonzero region of
, the transition number
j is around the state number
i, and the numerical difference (
i -
j) varies from -20 to 30 (there are 6 divisions in the width and 38 divisions in the height of the CFB riser for the space state division), which means that the particles have the probability for both vertical and lateral movement at the next time step from their original positions. The third nonzero region of
is a small area, where the state number
i is from 1 to 12, and the transition number is from 214 to 228, which means that the particles have the probability to fall out of the bottom of the bed and then be fed into the outlet of the bed, as the simulated CFB riser is assumed as an infinite circulating system.
When the fluidized velocity increases to 4 m/s or even larger, the first nonzero region of
becomes larger, the second nonzero region gradually moves to the area where the state number
i is smaller than the transition number
j, and the third nonzero region gradually disappears with the increase of the fluidized velocity, as shown in
Figure 3b, 3c and 3d. The change of
indicates that the particles prefer to move upward rather than fall.
It is easy to calculate the probability distribution of the particle positions by using Eq. (5) and (6) once
and
are obtained.
Figure 4 shows the probability distribution for the particle positions at 0.25 s, 0.5 s and 0.75 s under the fluidized velocity of 3 m/s after a batch of particles being fed into the inlet of the CFB riser. The initial state vector
is shown as Eq. (8), which expresses that a batch of particles are uniformly fed into the inlet of bed.
The probability that particles appear in the upper-left corner of the bed in
Figure 4a indicates that some particles fall out of the bottom of the bed and are put into the top of the bed at the time 0.25 s, which agrees with the analysis of the transition probability
in
Figure 3a.
Figure 4a also shows that most particles prefer to move upward on one side of the bed, whereas particles on the other side of the bed move upward at a much slower rate and seem to have a downward trend combined with
Figure 4b and 4c. The result is consistent with the motion characteristics of particle clusters under low fluidized air velocity.
Figure 4c indicates that most particles do not get out of the bed within 0.75 s.
Figure 5 gives the probability distribution of the particle positions at 0.05s, 0.1 s and 0.15 s under the fluidized velocity of 4 m/s. The nonzero probability area is clearly much more concentrated than that shown in
Figure 4, indicating that almost all particles flow upward and gather in a small area. None of the particles get out of the bed within 0.15 s.
Figure 6 gives the probability distribution of the particle positions at 0.05s, 0.1 s and 0.15 s under the fluidized velocity of 6 m/s. With the increase of the fluidized velocity, the particle rising velocity increases, and particles gradually spread in the vertical direction. There are few particles getting out of the bed within 0.15 s.
Figure 7 gives the probability distribution of the particle positions at 0.05s, 0.1 s and 0.15 s under the fluidized velocity of 8 m/s. Particles in the middle of the bed clearly flow upward at a faster rate than those on both sides of the bed, which is consistent with the motion characteristics of particle clusters under high fluidized air velocity. Part of particles get out of the bed at the time 0.15 s, which indicates the averaged particle residence time of CFB reduces with the increase of the fluidized velocity.
3.3. Residence Time Distribution
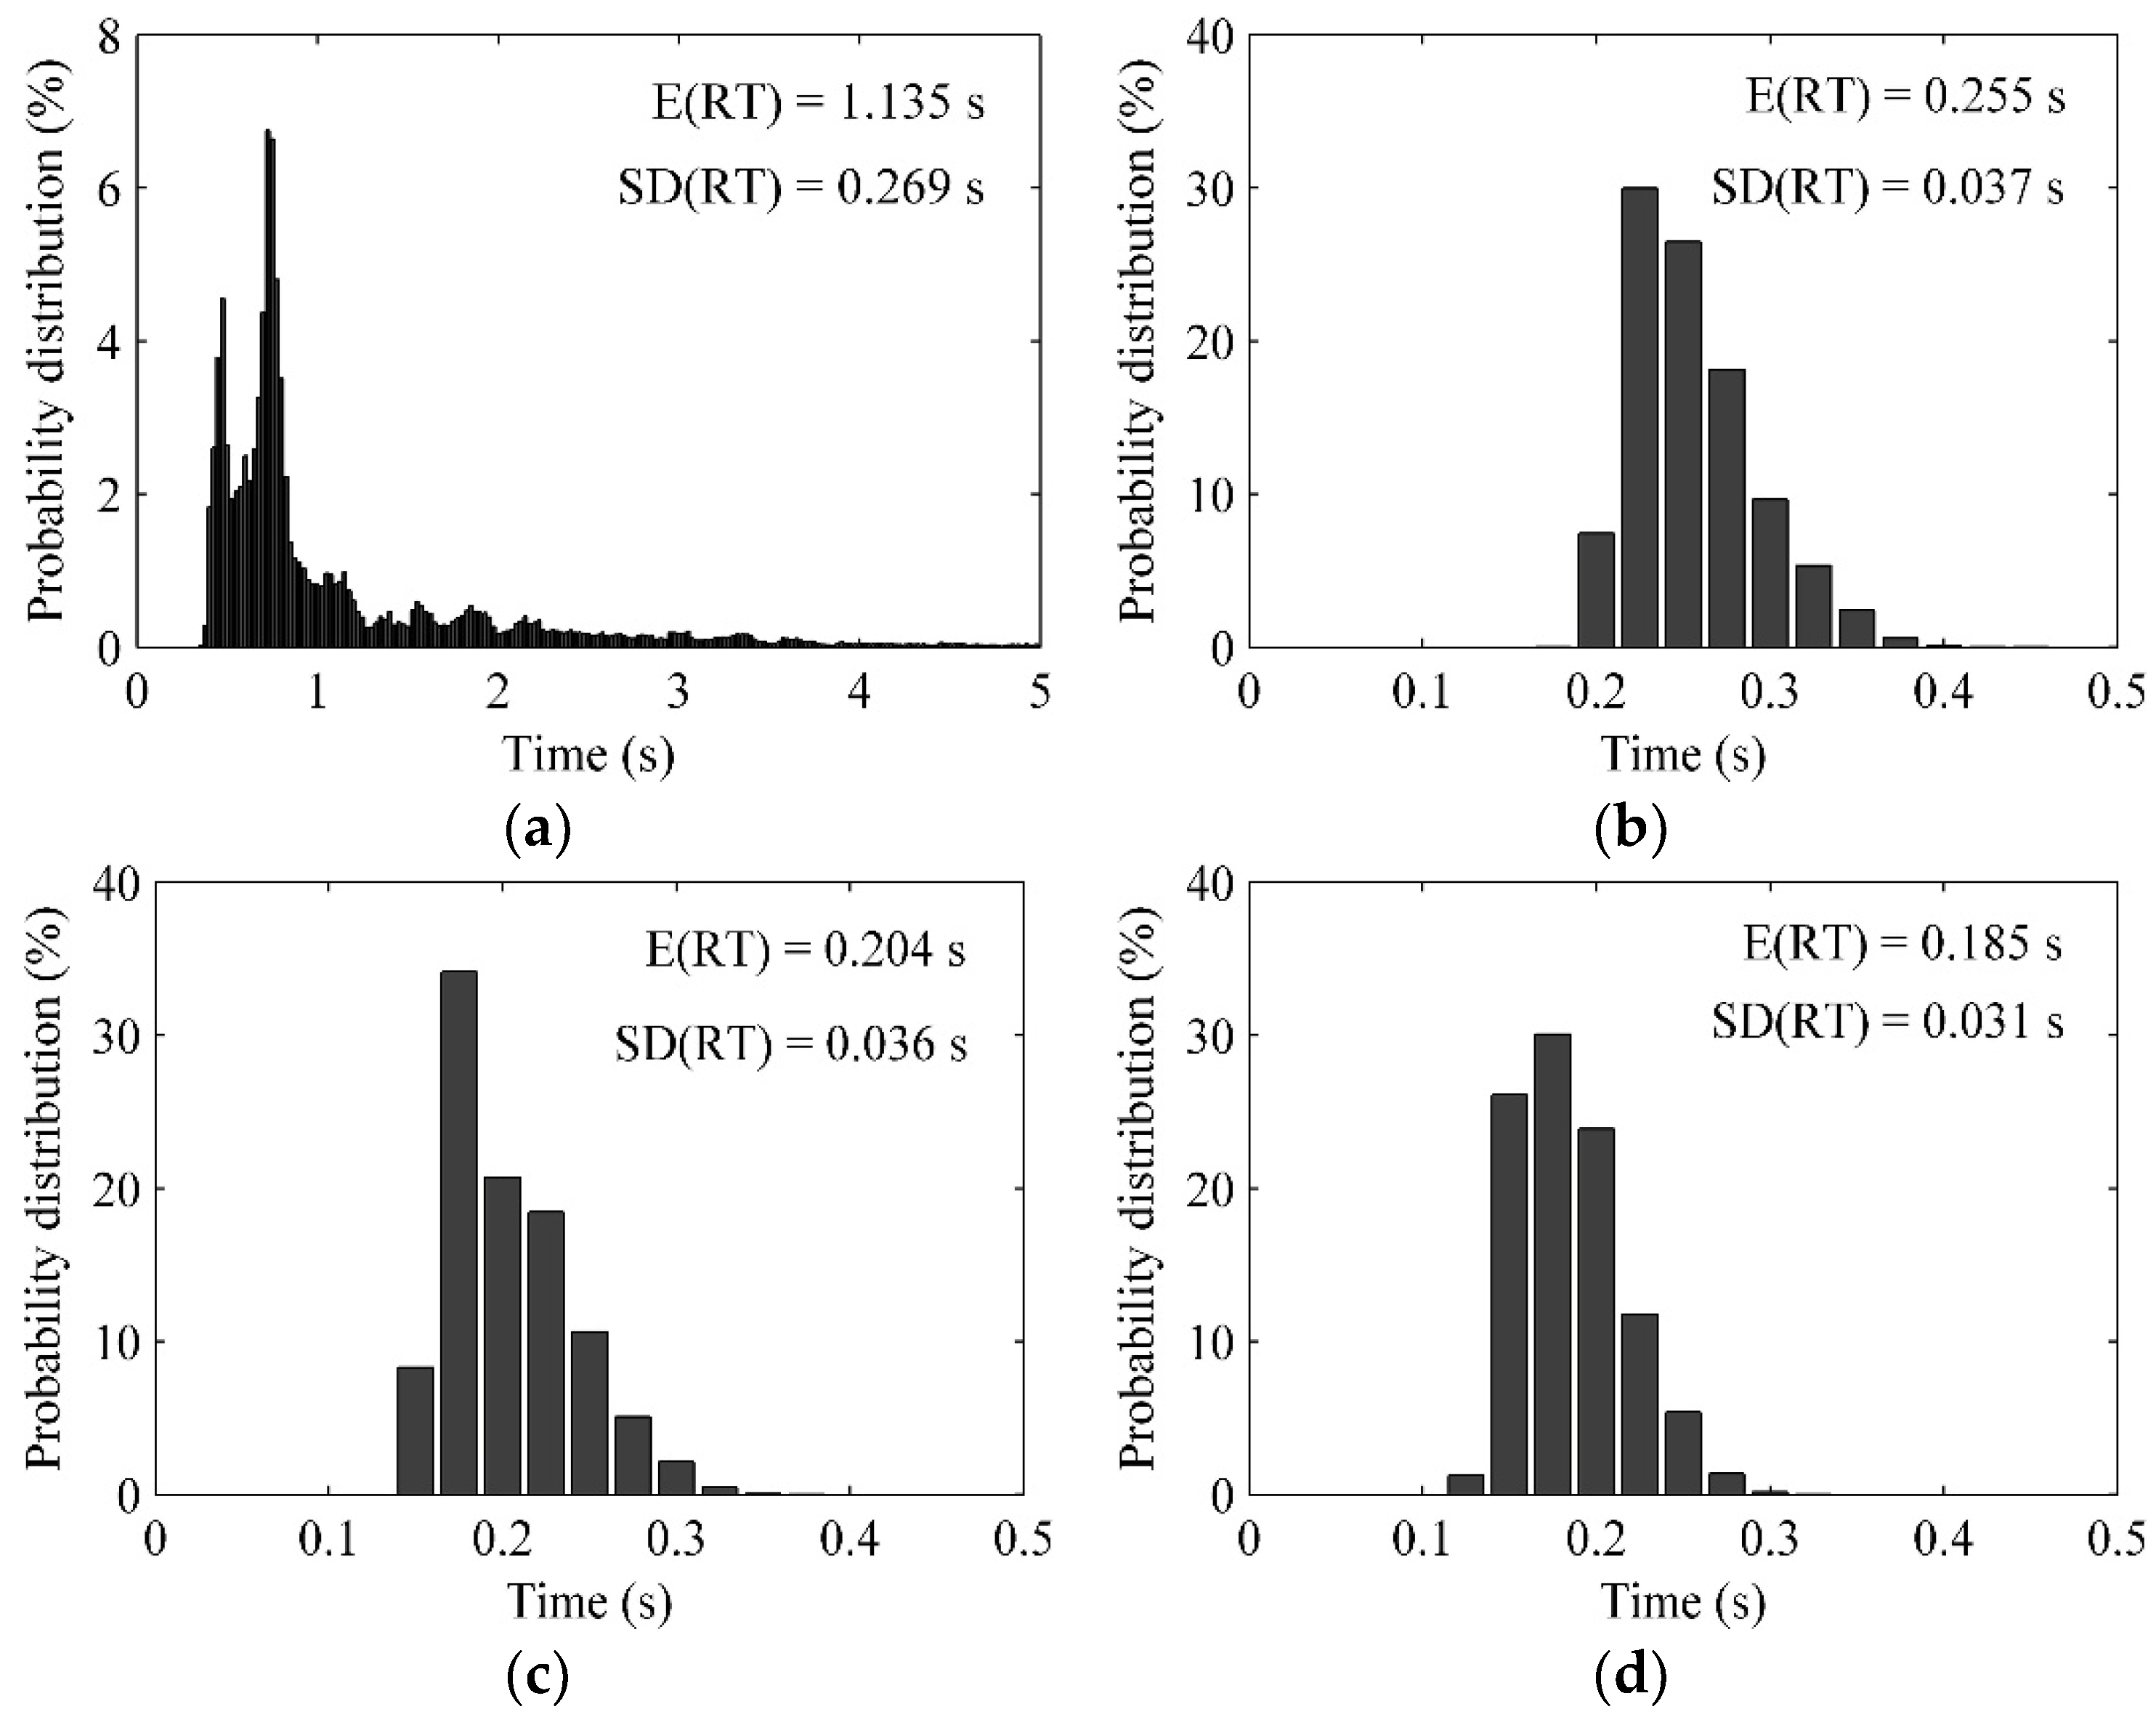
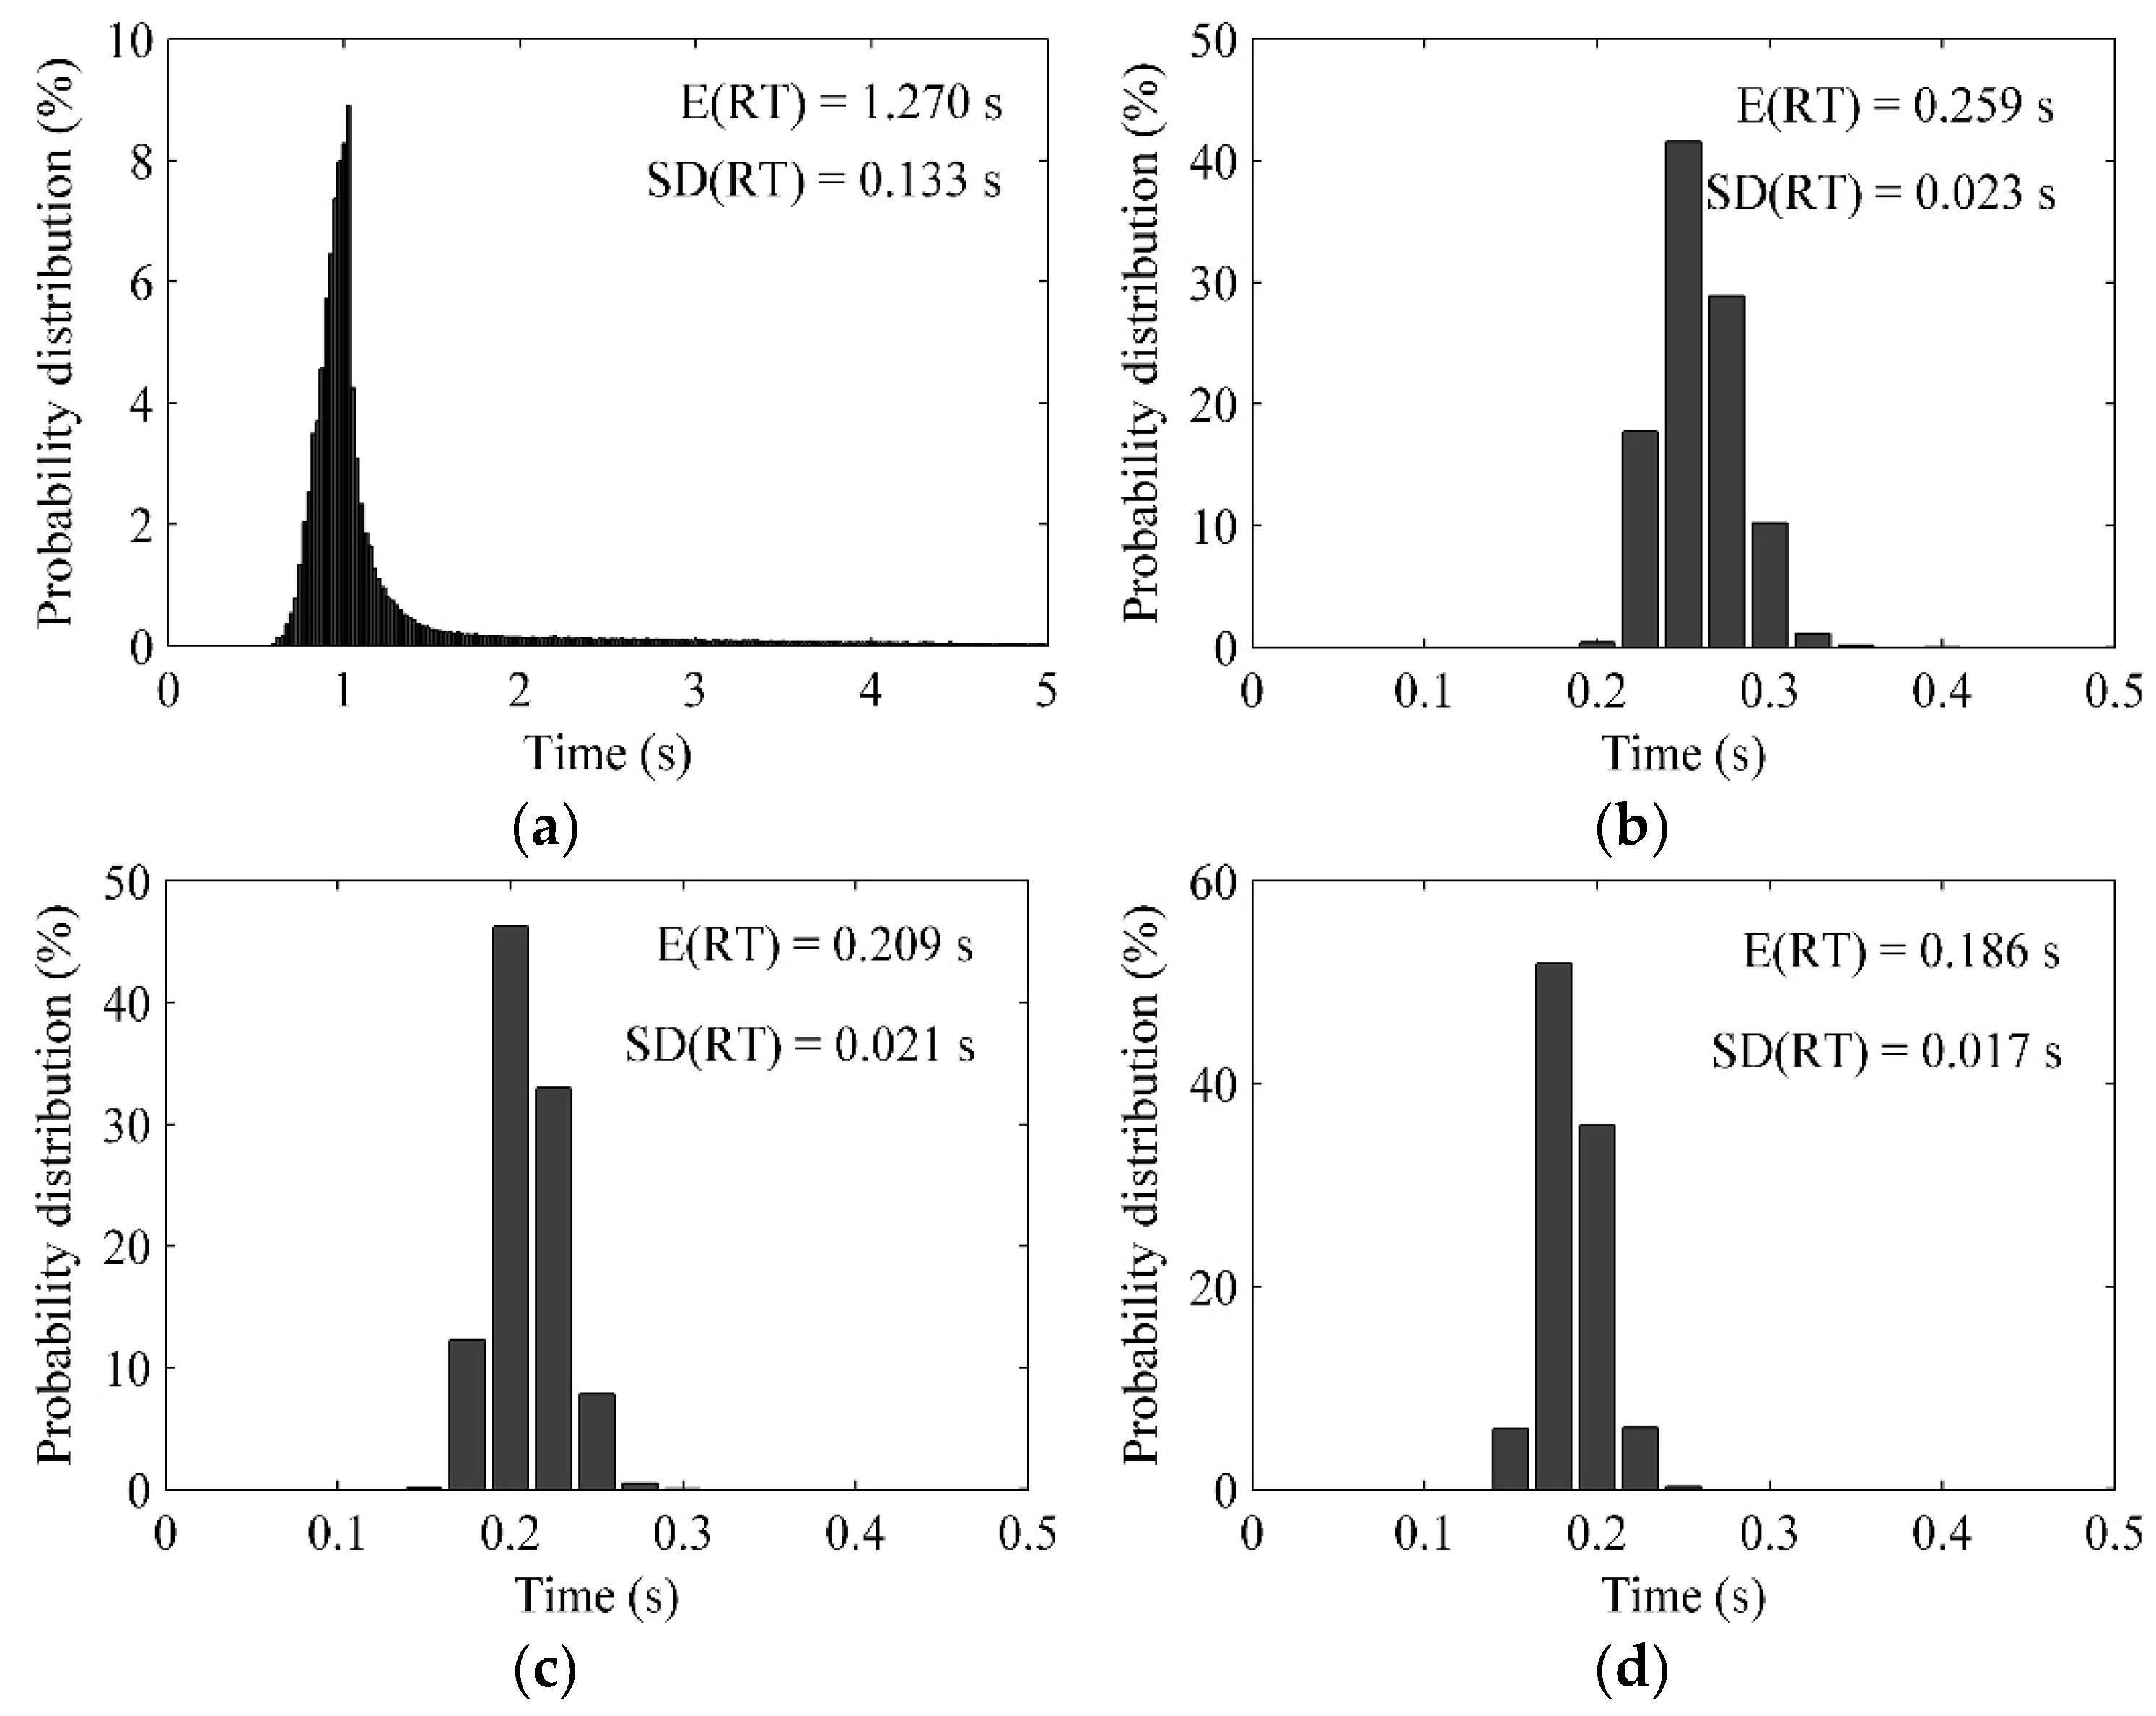
Figure 8 gives the simulated particle residence time distribution (RTD) of the CFD-DEM in the CFB riser under four fluidized velocities. The E(RT) is the mathematical expectation of the particle residence time, which represents the averaged particle residence time. The SD(RT) is the standard deviation of the particle residence time, which reflects the dispersion of the particle residence time. The E(RT) decreases with the increase of the fluidized velocity. The RTD in
Figure 8a exhibits a clear multi-peak profile, in which the range of the particle residence time is much wider than the other three RTDs in
Figure 8b,
Figure 8c and
Figure 8d, and the SD(RT) decreases along with the increase of the fluidized bed velocity. Besides, the SD(RT) in
Figure 8a is much larger than that in the other three figures. The comparison indicates that there might be a considerable quantity of particles falling back in the CFB riser when the fluidized velocity is 3 m/s, which is the typical annular-core flow structure in the CFB. When the fluidized bed air velocity increases to 4 m/s or larger, the phenomenon of the particle back flow is weakened, with a more concentrated RTD, and a smaller SD(RT).
Figure 9 gives the simulated particle RTD of the MCM in the CFB riser under four fluidized velocities. Compared to the CFD-DEM result, the simulated particle RTDs of the MCM are much more concentrated near the E(RT)s under all four fluidized velocities. The detailed E(RT) and SD(RT) comparisons between the stochastic model and CFD-DEM are listed in
Table 3. The PD means the percentage difference of the parameter between the CFD-DEM and the stochastic model. The comparison of the SD(RT) quantitatively indicates that the simulated RTD of the MCM prefers to intensively highlight the main particle residence time, while it weakens or even ignores the secondary particle residence time range, as the simulated RTD of the MCM shows a much smaller SD(RT) compared with that of the CFD-DEM. Difference of the simulated particle E(RT) between the MCM and the CFD-DEM is less than 3% under the fluidized velocities of 4 m/s, 6 m/s and 8 m/s. But the E(RT) difference reaches about 12% when the fluidized velocity is 3 m/s, as it is hard for the time-averaged
of the MCM to reflect such a large range of the particle residence time caused by the cluster backflow simulated by the CFD-DEM.
To illustrate how close the simulated particle RTDs of the stochastic model are to that of the CFD-DEM, the Minkowski distances (MD) of the simulated RTDs between the MCM and the CFD-DEM are calculated according to Eq. (9), which can describe the proximity of two arrays (E and F) in numerical values and distributions.
Table 3 shows that when the fluidized velocity is 3 m/s, the MD value is small, though the distribution of the MCM simulated RTD has a clear difference at the particle residence time about 0.05 s. The MD value increases with the increase of the fluidized velocity, which indicates that the simulated RTDs of the MCM have a clear difference with the CFD-DEM on the whole distribution patterns.
3.4. Particle Distribution
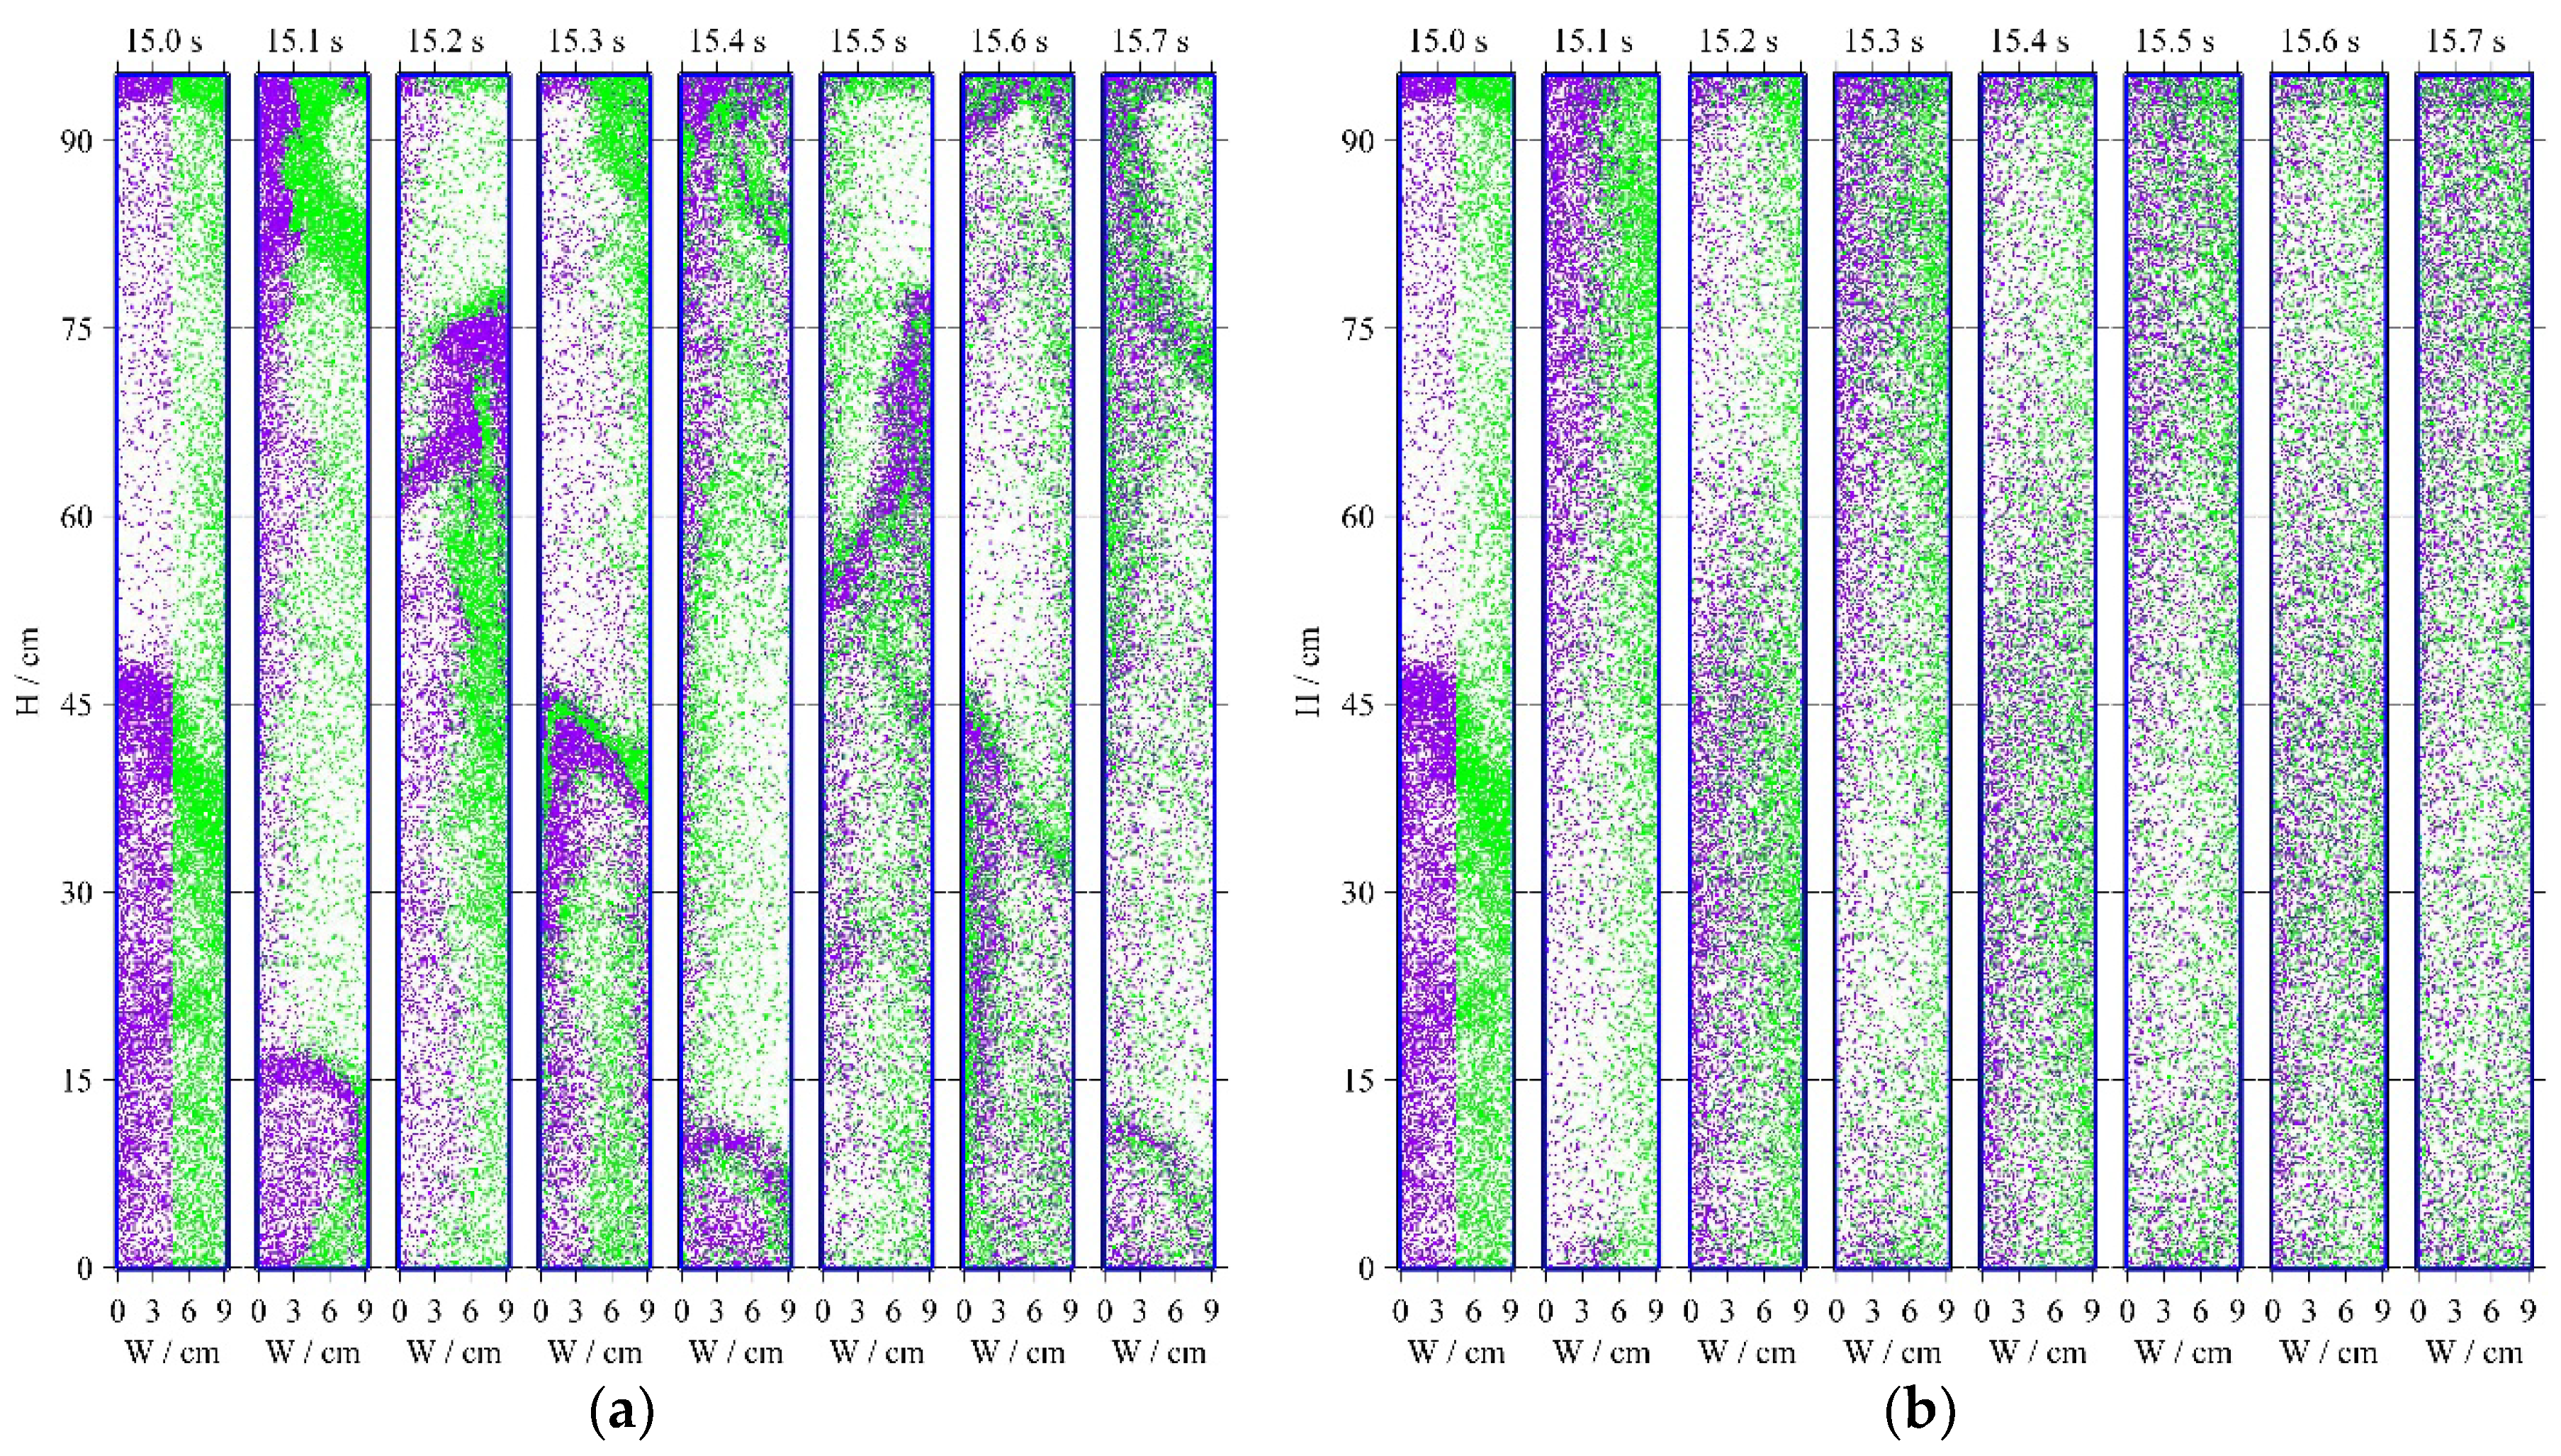
Figure 10a gives the simulated particle distribution snapshots of the CFD-DEM from 15 s to 15.7 s under the fluidized velocity of 6 m/s. To intuitively observe the particle mixing, particles are initialized with two different colors (purple and green) according to which half bed there are in at the time of 15 s. Particle clusters are clearly shown, and particles in the left and right half bed are gradually mixed over time shown by the color distribution. At the time of 15.7 s, purple and green particles seem to be thoroughly mixed.
Figure 10b shows the simulated particle distributions of the MCM from 15 s to 15.7 s under the same fluidized velocity. Particles are well mixed at the time of 15.7 s. However, particle clusters are almost invisible.
3.5. Particle Mixing
To further investigate the particle mixing of the stochastic model,
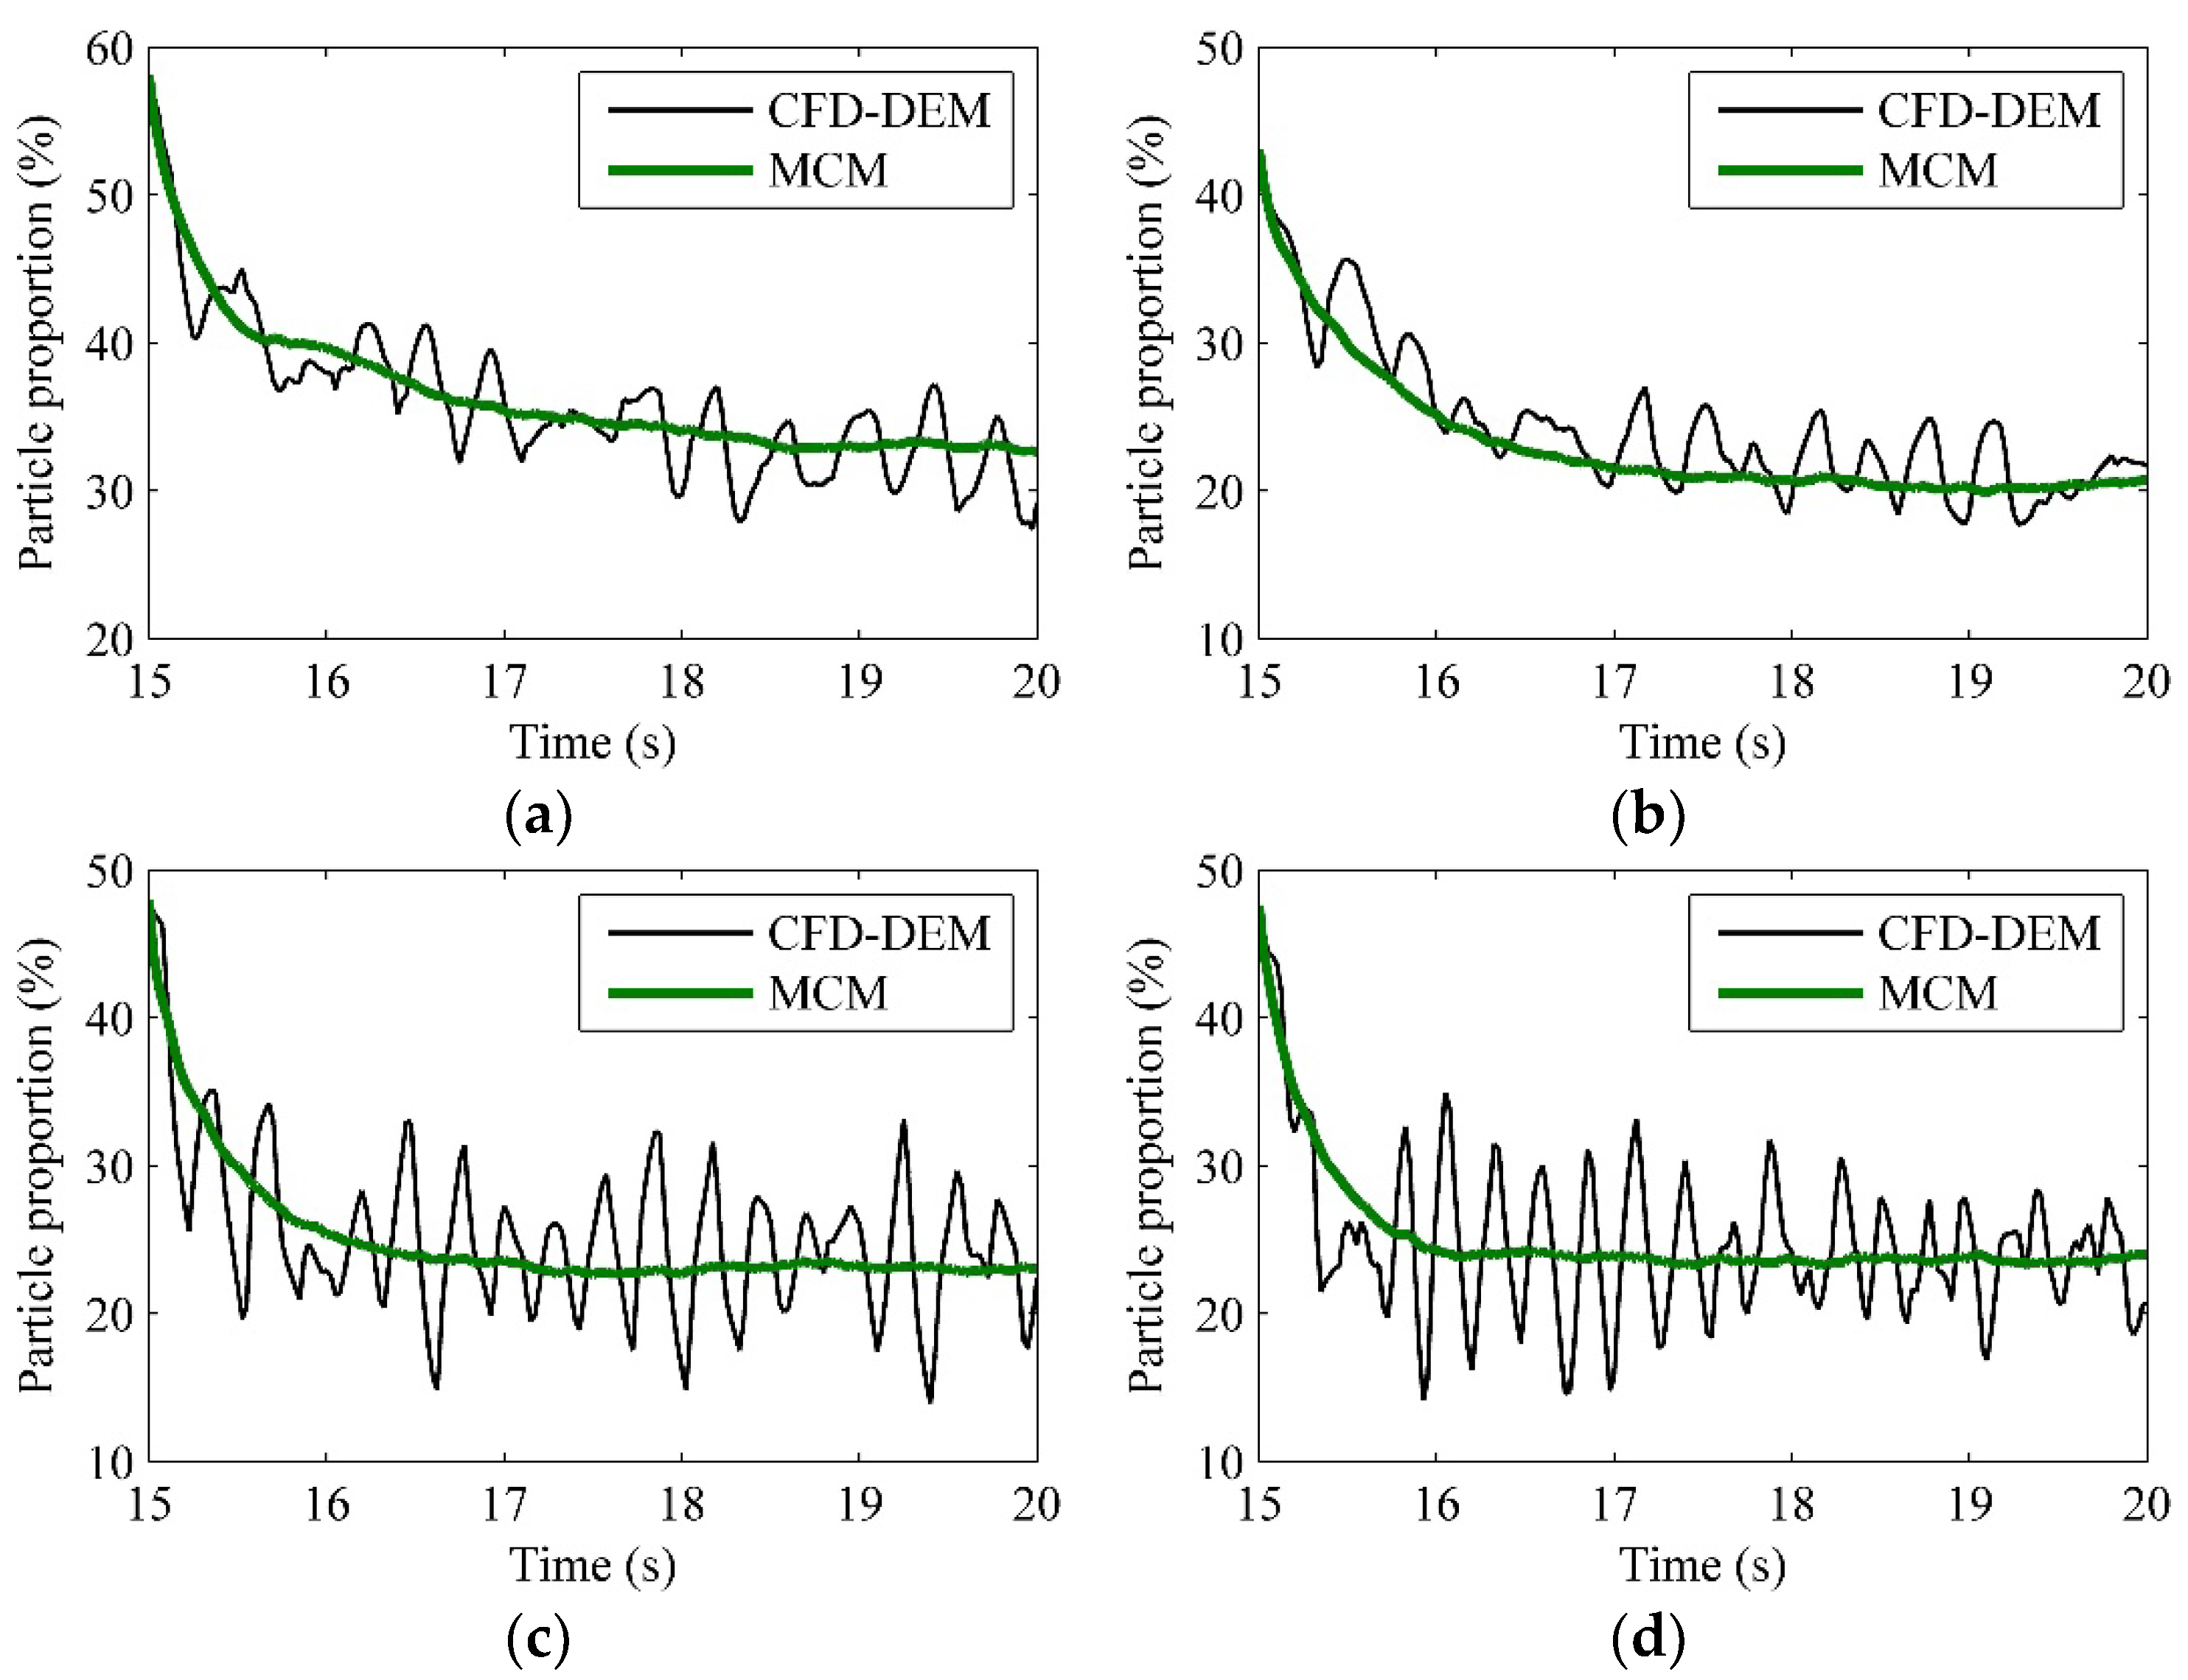
Figure 11 gives the detailed radial particle mixing comparison of three models under four fluidized velocities. The proportion of the purple particles in the left half bed over time (marked in section 3.4) is tracked.
Figure 11a shows that there are about 58% of the total particles in the left half bed at the time of 15 s when the fluidized velocity is 3 m/s. The CFD-DEM and the SCDM-MCM show almost the same mixing trend with about half of purple particles moving to the right half bed after the 5 s simulation. The MCM shows a little slower particle mixing speed compared to the CFD-DEM. Besides, the mixing curve of the MCM is very smooth, whereas the mixing curves of the CFD-DEM show frequent and instantaneous fluctuations, which may be since the MCM cannot give a recurrence of particle clusters.
When the fluidized velocity increases to 4 m/s, there are about 43% of the total particles in the left half bed at the time of 15 s, as shown in
Figure 11b. Particles get well mixed in the radial direction of both two models during the 5 s simulation. The mixing curve of the MCM is still very smooth, and nearly located in the time-averaged curve of the CFD-DEM.
Figure 11c and
Figure 11d give the similar particle mixing characteristics of two models under the fluidized velocities of 6 and 8 m/s. And the particle radial mixing speed obviously increases with the increases of the fluidized velocity.
4. Conclusions
The MCM is introduced to simulate the detailed particle movement in a 2D CFB riser based on the CFD-DEM results. The stochastic model has an extremely quick calculation speed and greatly reduces the computational load compared with the CFD-DEM. Besides, the MCM has the convenience to describe the macroscopic particle movement characteristics by the transition probability matrix, which agrees well with the statistical samples. However, the MCM can only express the time-averaged movement, RTD and particle mixing, instead of the instantaneous characteristics of the particle movement. The MCM cannot give a recurrence of particle clusters. Thus, an extra cluster model may be established to introduce the instantaneous effect on the particle moment by clusters for the MCM. In addition, more statistical samples from elaborate experiments are needed to support the MCM. Based on the above analysis, the establishment of the MCM, with combination of the chemical reaction, mass transfer and heat transfer sub-models will be a promising method for efficient simulation of the industrial dense gas-solid flows in the future.
Author Contributions
Conceptualization, Y.Z.; methodology, Y.Z.; software, Y.Z. and F.L.; validation, Y.Z. and F.L.; formal analysis, Y.Z. and F.L.; investigation, Y.Z. and F.L.; resources, Y.Z. and F.L.; data curation, Y.Z. and F.L.; writing—original draft preparation, Y.Z.; writing—review and editing, Y.Z. and F.L.; visualization, Y.Z.; supervision, Y.Z. and F.L.; project administration, Y.Z.; funding acquisition, Y.Z. All authors have read and agreed to the published version of the manuscript.
Funding
This research was supported by Suqian Sci & Tech Program (Grant No. K202236) and Suqian University Research Launch Project (Grant No. 2022XRC099). The APC was funded by Suqian Key Laboratory of Intelligent Manufacturing (Grant No. M202108) and Jiangsu Engineering Research Center of Key Technology for Intelligent Manufacturing Equipment.
Institutional Review Board Statement
Not applicable.
Informed Consent Statement
Not applicable.
Data Availability Statement
The data presented in this study are available in the article.
Conflicts of Interest
The authors declare no conflicts of interest.
Nomenclature
|
height of the CFB riser (cm) |
|
transition probability from state to state
|
|
instantaneous transition probability matrix |
|
average transition probability matrix |
|
space state of MCM |
|
state vector of MCM |
|
transition time step of MCM (s) |
|
fluidized air velocity (m/s) |
|
width of the CFB riser (cm) |
References
- Chao, C.; Deng, Y.; Dewil, R.; Baeyens, J.; Fan, X. Post-combustion carbon capture. Renewable Sustainable Energy Rev. 2021, 138, 110490. [Google Scholar] [CrossRef]
- Wang, J. W. Continuum theory for dense gas-solid flow: A state-of-the-art review. Chem. Eng. Sci. 2020, 215, 115428. [Google Scholar] [CrossRef]
- Li, Y. K.; Guo, T.; Guo, X. T.; Hu, X. D.; Guo, Q. J.; He, S. Z.; Zhou, Z. M. Computational particle fluid dynamics simulation of gas-solid flow in a 3 MW th dual-circulation fluidized bed for chemical looping process. Carbon Resour. Convers. 2024, 7, 100232. [Google Scholar] [CrossRef]
- Haghgoo, M. R.; Bergstrom, D. J.; Spiteri, R. J. Identifying particle flow structures in a dense gas-particle fluidized bed. Int. J. Heat Fluid Flow 2024, 108, 109495. [Google Scholar] [CrossRef]
- Zarepour, M.; Bergstrom, D. J.; Zhang, L. F.; Spiteri, R. J. The effect of collision parameters on the 3D Eulerian simulation of a thin rectangular bubbling fluidized bed. Int. J. Heat Fluid Flow 2024, 107, 109354. [Google Scholar] [CrossRef]
- Wang, S.; Luo, K.; Hu, C. S.; Lin, J. J.; Fan, J. R. CFD-DEM simulation of heat transfer in fluidized beds: Model verification, validation, and application. Chem. Eng. Sci. 2019, 197, 280–295. [Google Scholar] [CrossRef]
- Lian, G. Q.; Zhong, W. Q. CFD-DEM modeling of oxy-char combustion in a fluidized bed. Powder Technol. 2022, 407, 117698. [Google Scholar] [CrossRef]
- Lin, J. J.; Luo, K.; Wang, S.; Hu, C. S.; Fan, J. R. An augmented coarse-grained CFD-DEM approach for simulation of fluidized beds. Adv. Powder Technol. 2020, 31, 4420–4427. [Google Scholar] [CrossRef]
- Li, H.; Liu, D. Y.; Ma, J. L.; Chen, X. P. Simulation of a Wurster fluidized bed by CFD-DEM with a cohesive contact model. Chem. Eng. Res. Des. 2022, 177, 157–166. [Google Scholar] [CrossRef]
- Xu, D.; Wang, S.; Shen, Y. S. An improved CFD-DEM modelling of raceway dynamics and coke combustion in an industrial-scale blast furnace. Chem. Eng. J. 2023, 455, 140677. [Google Scholar] [CrossRef]
- Ma, H. Q.; Zhou, L. Y.; Liu, Z. H.; Chen, M. Y.; Xia, X. H.; Zhao, Y. Z. A review of recent development for the CFD-DEM investigations of non-spherical particles. Powder Technol. 2022, 412, 117972. [Google Scholar] [CrossRef]
- Wang, S.; Shen, Y. S. Coarse-grained CFD-DEM modelling of dense gas-solid reacting flow. Int. J. Heat Mass Transfer 2022, 184, 122302. [Google Scholar] [CrossRef]
- Hoffmann A; Dehling H. A Stochastic modelling approach to particle residence time distribution in continuous fluidized beds. Proceedings of the Third World Congress on Particle Technology, Brighton, UK, 1998, 258-270.
- Dehling, H. G.; Hoffmann, A. C.; Stuut, H. W. Stochastic models for transport in a fluidized bed. SIAM J. Appl. Math. 1999, 60, 337–358. [Google Scholar] [CrossRef]
- Dehling, H. G.; Dechsiri, C.; Gottschalk, T.; Wright, P. C.; Hoffmann, A. C. A stochastic model for mixing and segregation in slugging fluidized beds. Powder Technol. 2007, 171, 118–125. [Google Scholar] [CrossRef]
- Berthiaux, H.; Mizonov, V. Applications of Markov chains in particulate process engineering: A review. Can. J. Chem. Eng. 2004, 82, 1143–1168. [Google Scholar] [CrossRef]
- Ammarcha, C.; Gatumel, C.; Dirion, J. L.; Cabassud, M.; Mizonov, V.; Berthiaux, H. Powder flow and mixing in a continuous mixer operating in either transitory or steady-state regimes: Mesoscopic Markov chain models. Powder Technol. 2019, 346, 116–136. [Google Scholar] [CrossRef]
- Doucet, J.; Hudon, N.; Bertrand, F.; Chaouki, J. Modeling of the mixing of monodisperse particles using a stationary DEM-based Markov process. Comput. Chem. Eng. 2008, 32, 1334–1341. [Google Scholar] [CrossRef]
- Ponomarev, D.; Mizonov, V.; Gatumel, C.; Berthiaux, H.; Barantseva, E. Markov-chain modelling and experimental investigation of powder-mixing kinetics in static revolving mixers. Chem. Eng. Process. 2009, 48, 828–836. [Google Scholar] [CrossRef]
- Ponomarev, D.; Mizonov, V.; Berthiaux, H.; Gatumel, C.; Gyenis, J.; Barantseva, E. A 2D Markov chain for modelling powder mixing in alternately revolving static mixers of Sysmix® type. Chem. Eng. Process. 2009, 48, 1495–1505. [Google Scholar] [CrossRef]
- Gottschalk, T.; Dehling, H. G.; Hoffmann, A. C. Multiphase stochastic model for fluidized beds. Phys. Rev. E 2008, 77, 031306. [Google Scholar] [CrossRef]
- Catak, M.; Cronin, K.; Medina-Tellez, D. Markov Chain Modeling of Fluidized Bed Granulation Incorporating Simultaneous Aggregation and Breakage. Ind. Eng. Chem. Res. 2011, 50, 10811–10823. [Google Scholar] [CrossRef]
- Catak, M.; Bas, N.; Cronin, K.; Tellez-Medina, D.; Byrne, E. P.; Fitzpatrick, J. J. Markov chain modelling of fluidised bed granulation. Chem. Eng. J. 2010, 164, 403–409. [Google Scholar] [CrossRef]
- Mizonov, V.; Mitrofanov, A.; Ogurtzov, A.; Tannous, K. Modeling of Particle Concentration Distribution in a Fluidized Bed by Means of the Theory of Markov Chains. Part. Sci. Technol. 2014, 32, 171–178. [Google Scholar] [CrossRef]
- Mitrofanov, A.; Mizonov, V.; Tannous, K.; Ovchinnikov, L. A Markov chain model to describe fluidization of particles with time-varying properties. Part. Sci. Technol. 2018, 36, 244–253. [Google Scholar] [CrossRef]
- Mitrofanov, A.; Mizonov, V.; Camelo, A.; Tannous, K. Application of the theory of Markov chains to theoretical study of processes in a circulating fluidized bed. Part. Sci. Technol. 2019, 37, 1028–1033. [Google Scholar] [CrossRef]
- Harris, A. T.; Thorpe, R. B.; Davidson, J. F. Stochastic modelling of the particle residence time distribution in circulating fluidised bed risers. Chem. Eng. Sci. 2002, 57, 4779–4796. [Google Scholar] [CrossRef]
- Tjakra, J. D.; Bao, J.; Hudon, N.; Yang, R. Y. Modeling collective dynamics of particulate systems under time-varying operating conditions based on Markov chains. Adv. Powder Technol. 2013, 24, 451–458. [Google Scholar] [CrossRef]
- Bouffard, J.; Bertrand, F.; Chaouki, J. A multiscale model for the simulation of granulation in rotor-based equipment. Chem. Eng. Sci. 2012, 81, 106–117. [Google Scholar] [CrossRef]
- Alobaid, F.; Almohammed, N.; Farid, M. M.; May, J.; Rossger, P.; Richter, A.; Epple, B. Progress in CFD Simulations of Fluidized Beds for Chemical and Energy Process Engineering. Prog. Energy Combust. Sci. 2022, 91, 100930. [Google Scholar] [CrossRef]
- Ma, H. Q.; Zhou, L. Y.; Liu, Z. H.; Chen, M. Y.; Xia, X. H.; Zhao, Y. Z. A review of recent development for the CFD-DEM investigations of non-spherical particles. Powder Technol. 2022, 412, 117972. [Google Scholar] [CrossRef]
|
Disclaimer/Publisher’s Note: The statements, opinions and data contained in all publications are solely those of the individual author(s) and contributor(s) and not of MDPI and/or the editor(s). MDPI and/or the editor(s) disclaim responsibility for any injury to people or property resulting from any ideas, methods, instructions or products referred to in the content. |
© 2024 by the authors. Licensee MDPI, Basel, Switzerland. This article is an open access article distributed under the terms and conditions of the Creative Commons Attribution (CC BY) license (http://creativecommons.org/licenses/by/4.0/).
