1. Introduction
To expand new fields of application as service robots or assistance systems, new trends in human-robot collaboration (HRC) are erasing the boundaries between the human and the robots. Safety and protection of humans become the focus, especially when humans and robots share the same workspace, sometimes even have physical contacts with each other. A key technology for a safe physical human-robot interaction is the monitoring of contact forces. In 2016, the International Organization of Standardization (ISO) published the Technical Specification (TS) 15066, which emphasizes the safety requirements for collaborative industrial robot systems [
1], which aims to limit the force transfer from the robot to the human body. To monitor the contact force, many measuring methods were proposed. In the early stage, the robot systems did not attach any extra force sensor and only relied on the joint current monitoring paired with gravity models to calculate the contact forces indirectly [
2]. The misjudgments often occur. Tin et al. designed five contactless capacitive sensors which are installed inside the robot arms to form the sensitive skin [
3]. A. Cirillo et al. reported a proximity/contact-force sensor based on the optoelectronic sensing elements. The robotic speed is reduced as soon as an obstacle is detected by the proximity sensing element, while, the robot is stopped when contact occurs, that is detected by a contact-force sensing element [
4]. It is a typical active protection strategy. However, when the human is concentrated on his/her own work, he/she often collides the robots. The active strategy [
3,
4] will be invalided. In this situation, a soft contact force sensor as a passive strategy could reduce the hurt further. H. Yang et al. reported a pneumatic soft sensor for a soft gripper [
5]. It can detect the variation of air pressure in a rubber chamber to evaluate the contact force. However, the reliability of the sealants in the sensor restricts their application in the large area of the robot skin. Alberto et al. reported a silicone-rubber-based tactile sensor which uses an array of light-emitting diode (LED) phototransistor couples [
6]. Although it has a high spatial resolution, it is a multi-point sensor. The amount of the LED-phototransistor couples increases rapidly as the area of the robot skin enlarges. Thousands of sensing points will be a great challenge for the design and manufacture of the sensor.
As an emerging technology, optical fiber sensors have attracted increasing attention, because of their non-conductivity of electricity, immunity to electromagnetic interference, and the capability for large area monitoring [
7,
8]. The polymer optical fiber (POF) has high flexibility and high sensitivity. It is good for high- flexibility contact force sensors. To further enhance the sensitivity and improve the flexibility of POF, in this paper, an 8-shaped wound polymer optical fiber sensor packaged by Polydimethylsiloxane (PDMS) is proposed. The sensor has a simple optoelectronic scheme (LED–fiber–photodetector). No complicated spectrum measurement is required. Therefore, it is a low-cost, high-speed, high-flexibility, and high-sensitivity contact force monitoring system. The proposed scheme is a promising technique for ensuring the safety in human-robot collaboration.
2. Principle and Fabrication of Sensors
A. Structure and Principle of Sensors
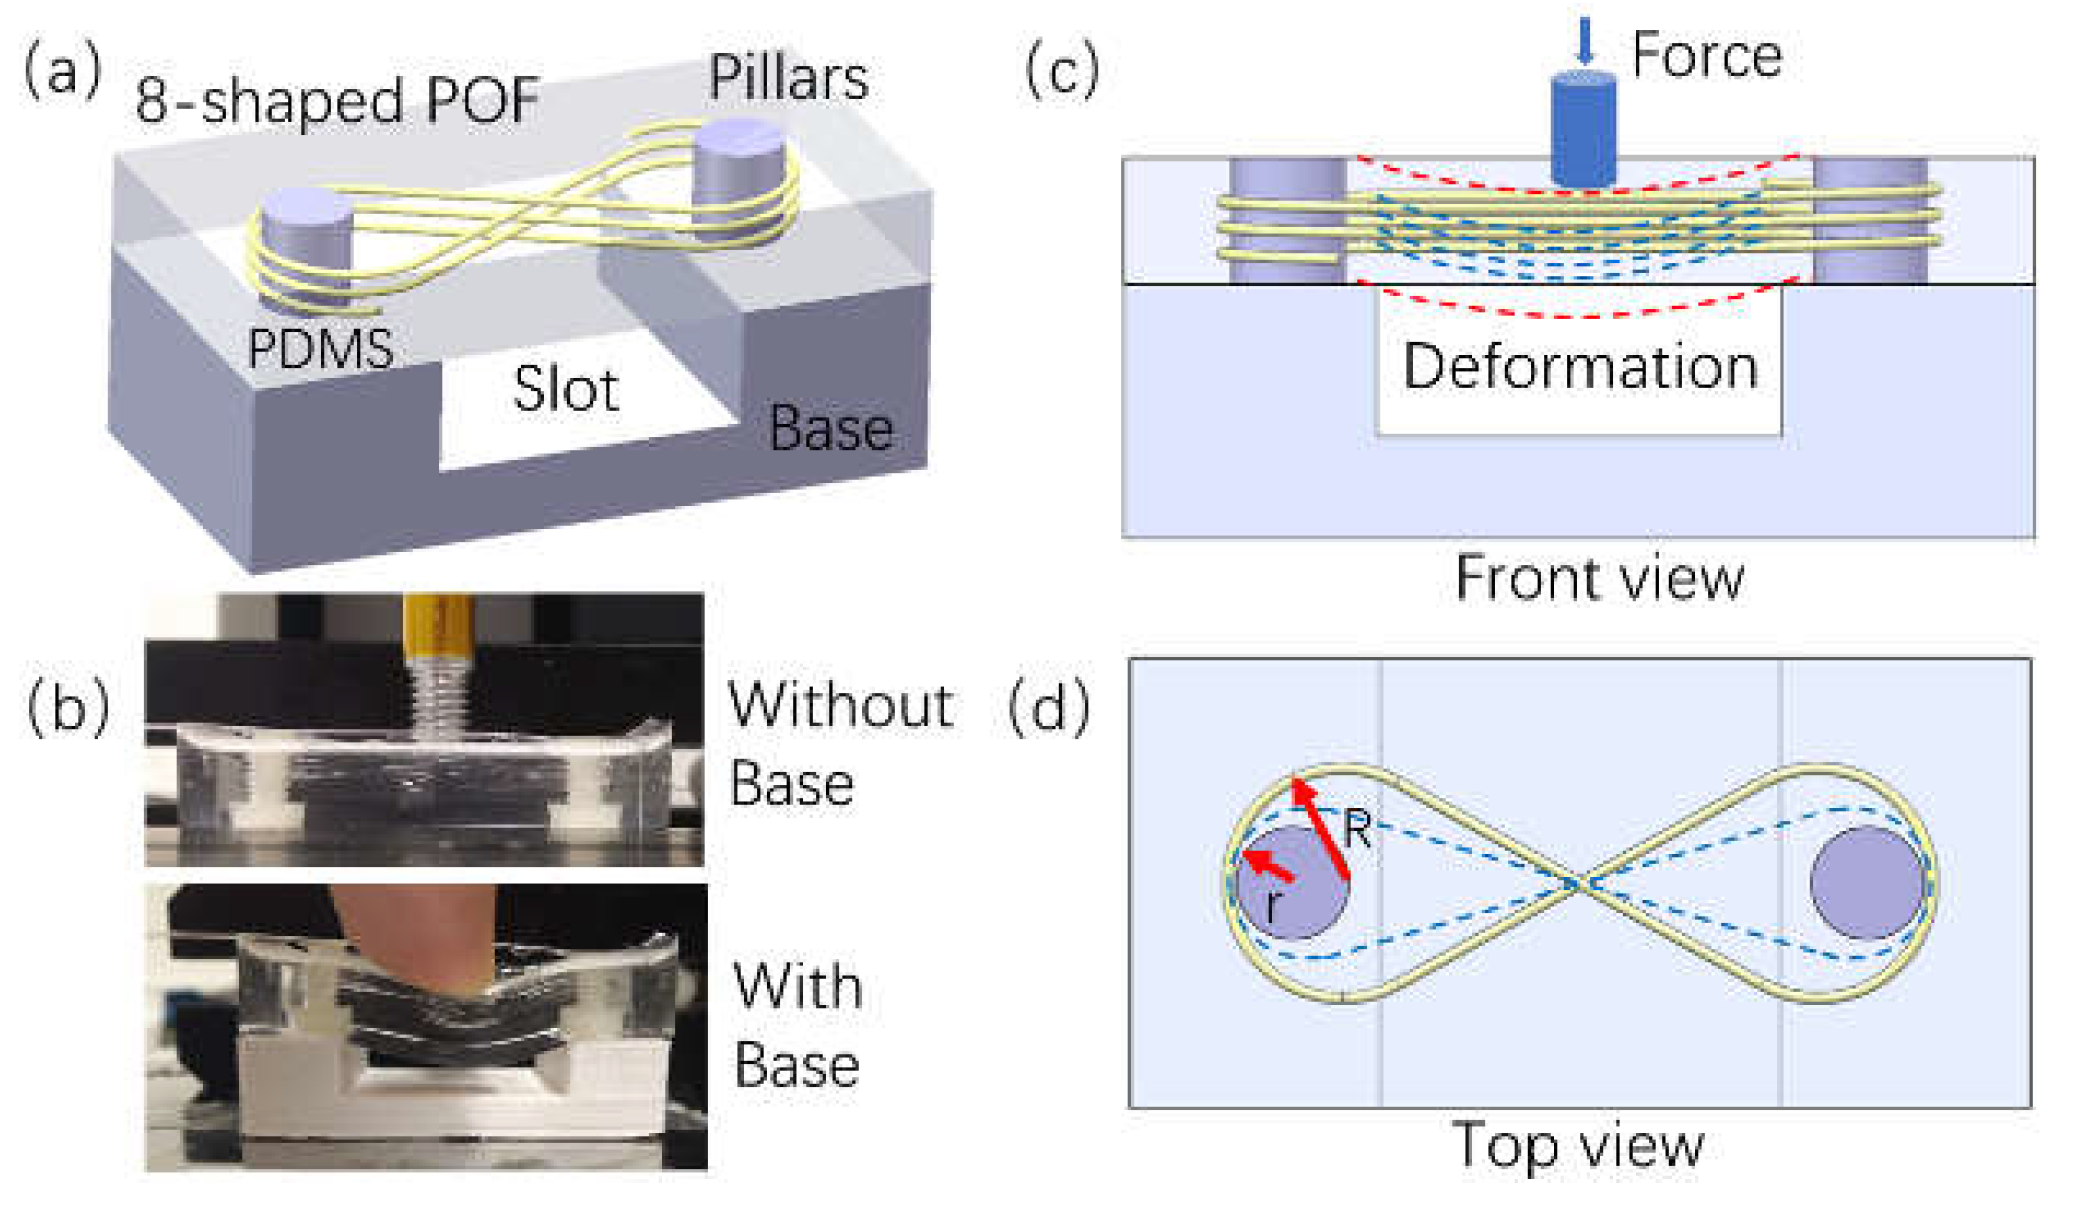
The sensor consists of two pillars, a piece of optical fiber, a PDMS package and a base with a rectangle slot which is shown in
Figure 1 (a). The sensor can be regarded as a polymer-based intelligent composite material. Two pillars with screw thread are fixed on the base. The optical fiber is wound in 8-shaped rings between the two pillars. All of them are packaged by a PDMS matrix. Because of the rectangle slot between the sensor and the base, the soft PDMS sensor could deform under the pressure as shown in
Figure 1 (c). The pillar is made of Polytetrafluoroethylene (PTFE) whose elastic modulus is higher than that of PDMS by two orders of magnitude. When the PDMS layer is pressed by a force, the pillars can be regarded as rigid cylinders and keep straight. The composite material between two pillars can be regarded as a beam fixed at the two ends. When the PDMS moves down, the optical fiber embedded in the PDMS moves synchronously. From the front view of the sensor in
Figure 1(c), the optical fiber bends from a straight line to a curve (blue line), and thus its length increases a lot. From the top view as shown in
Figure 1 (d), two ends of the 8-shaped ring are fixed by two pillars and cannot move. The increasing length of the optical fiber in the front view must result in the shrinkage of the 8-shaped ring in the top view. As shown in
Figure 1 (d), the radius of the 8-shaped ring decreases from R (yellow curve) to r (blue curve) as the force pressed on the top surface increases. When light propagates in the optical fiber, the output intensity of light is influenced by the bending loss of the fiber. Thus, the sensor could detect the contact force according to the bending loss of the POF. The 8-shaped structure converts the deformation from the vertical plane to the horizontal plane. Comparing to the traditional micro-bending sensor, the proposed sensor detects the macro-bending loss, and could sustain a larger deformation. The excellent flexibility of the proposed sensors can be seen from
Figure 1(b).
B. Fabrication and Calibration of Sensors
A simple source–fiber–photodetector system is assembled to calibrate the contact force. The light source is a white LED source (Thorlabs MWWHF2). The fiber is a piece of polymer optical fiber (PMMA) with a diameter of 480 μm and an attenuation of 0.3 dB/m (Dasheng D500). The matrix of the composite is made of PDMS (Dow Corning SYLGARD 184) within a mold. The mix ratio of base elastomer and the curing agent is 10:1. The curing temperature and time are 60 °C and 120 minutes, respectively. The photodetector is a power meter with a probe (Thorlabs S142C) which can receive light with a wavelength range from 350nm to 1100nm. The experimental setup is as shown in
Figure 2. To compare the influence of the base on the sensor, samples with/without base were manufactured as shown in
Figure 1(b). The two schemes represent two different installation conditions in practical applications. The force meter is used to load the contact force which is controlled precisely by the computer. In addition, the displacement of the force meter and the power received by the detector are recorded by the computer synchronously.
3. Experiments and Results
A. Sensitivity and Hysteresis
A loading/unloading experiment is implemented to test the sensitivity and hysteresis.
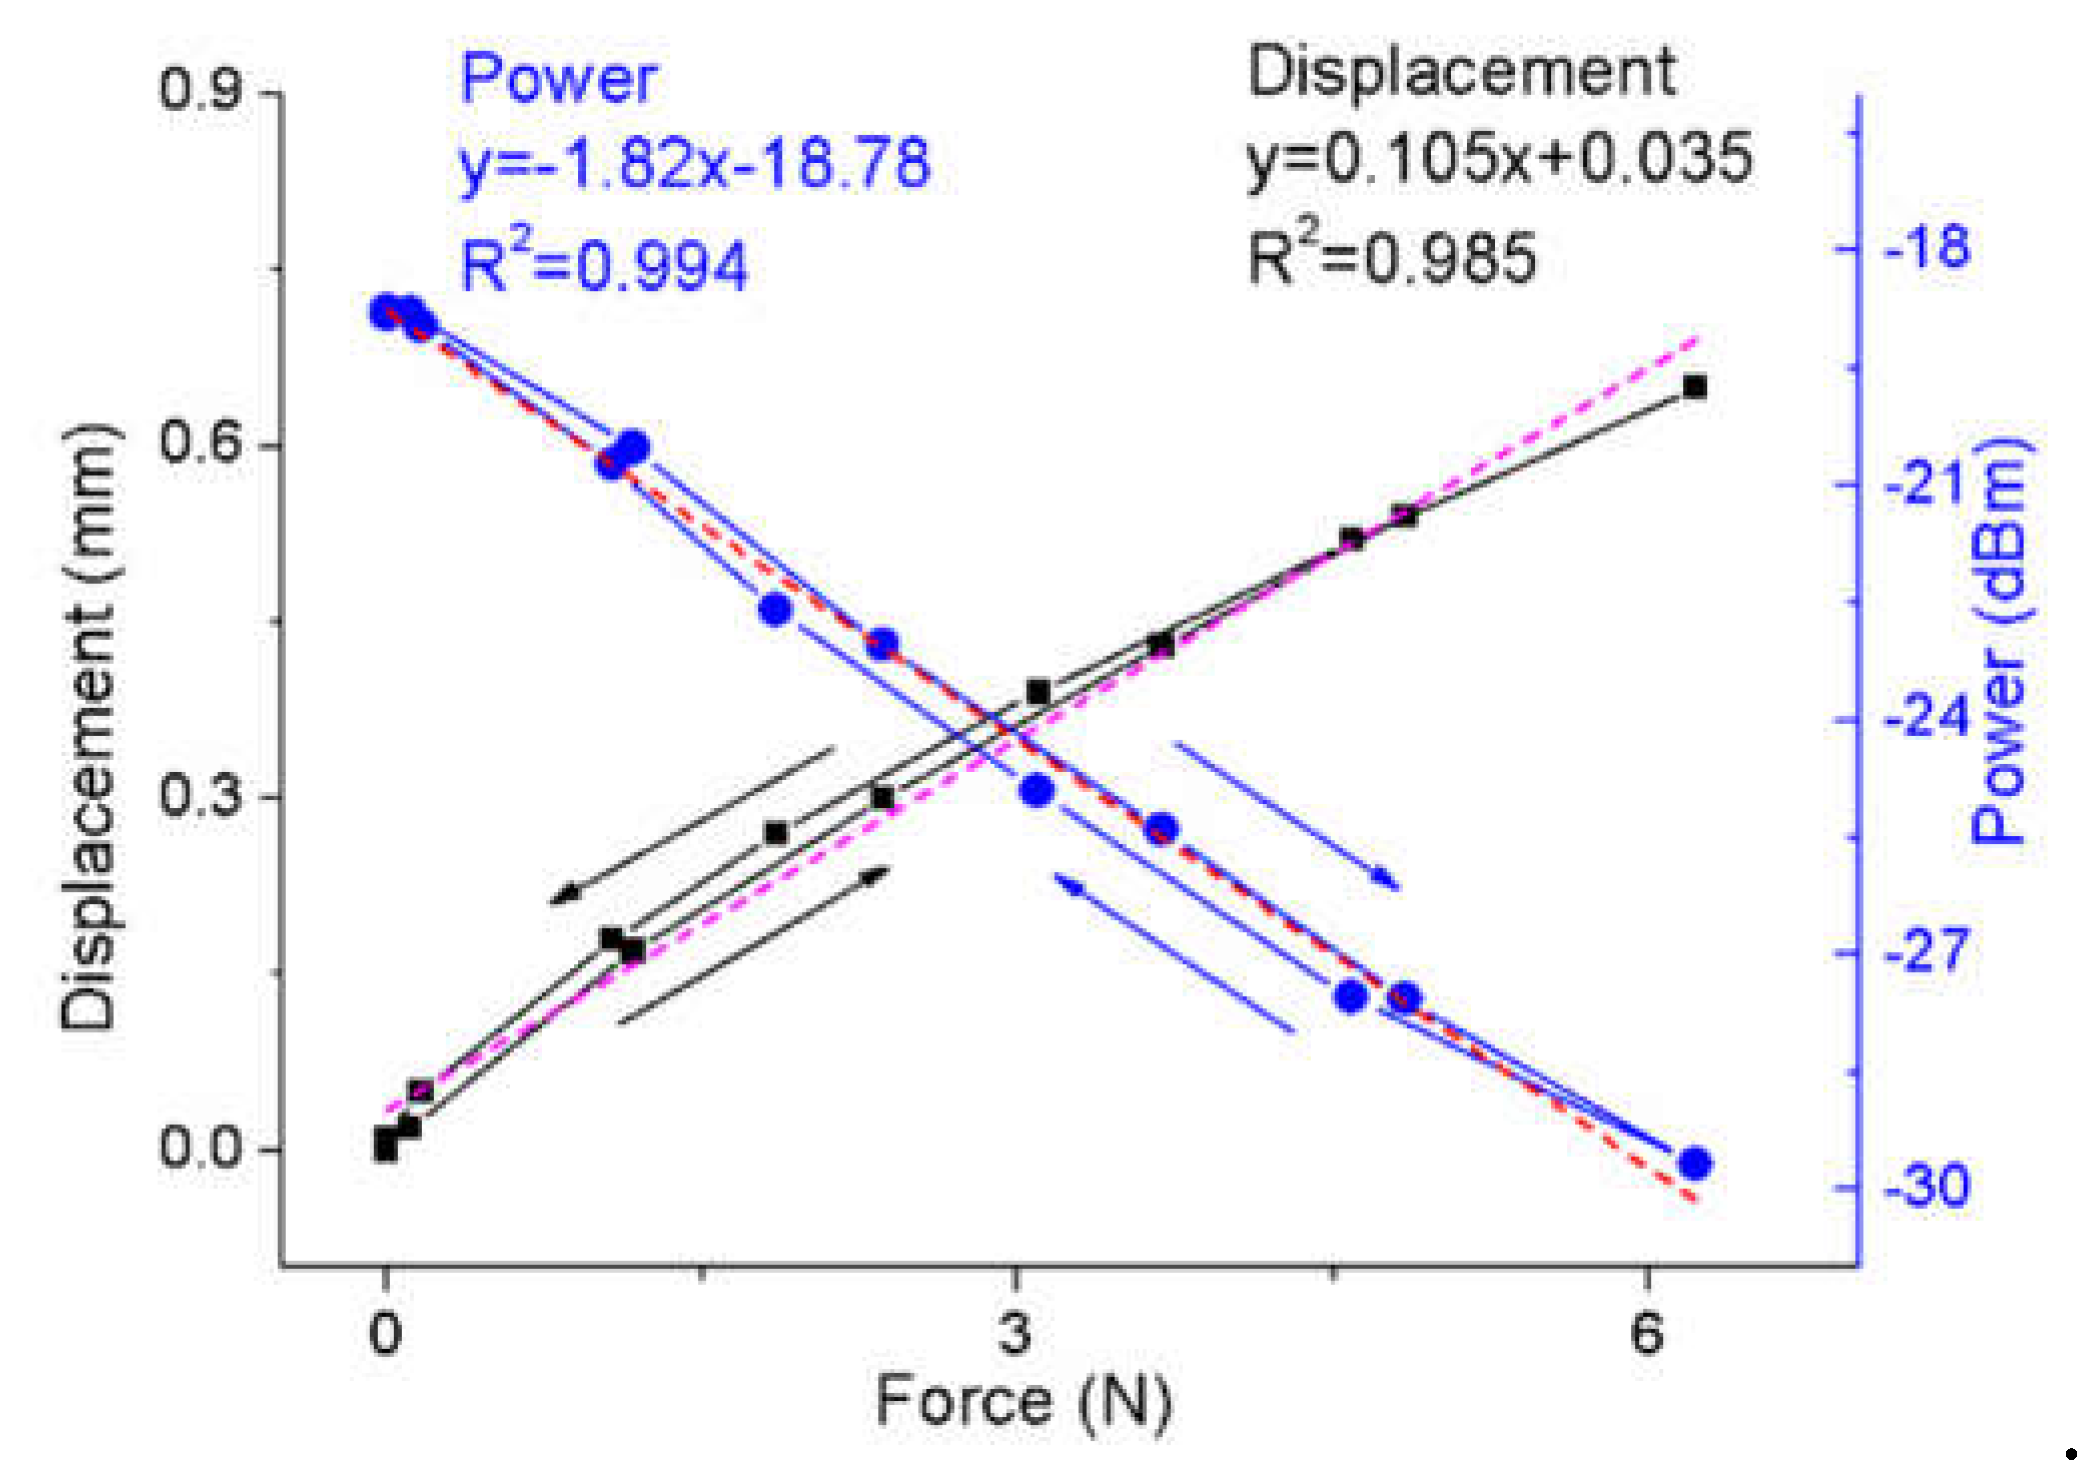
Figure 3 shows the results of the sensor without the base. The black and blue curves represent the displacement and the power change as the contact force changes respectively. When the probe of the force meter moves down, both the displacement and the force increase, however, the power decreases. The displacement and the power change almost linearly as the force increases. The sensitivity of power to the force is -1.82 dBm/N. For a power meter with a resolution of 0.001 dBm, the sensor can distinguish a minimal force change of 0.55mN theoretically. The sensitivity of displacement to the force is 0.105 mm/N which is determined by the elastic modulus of PDMS. In the experiment, both the power curve and the displacement curve show a slight hysteresis. It is caused by the stress relaxation of polymer material. In the loading and unloading process, the material undergoes the different relaxing process.
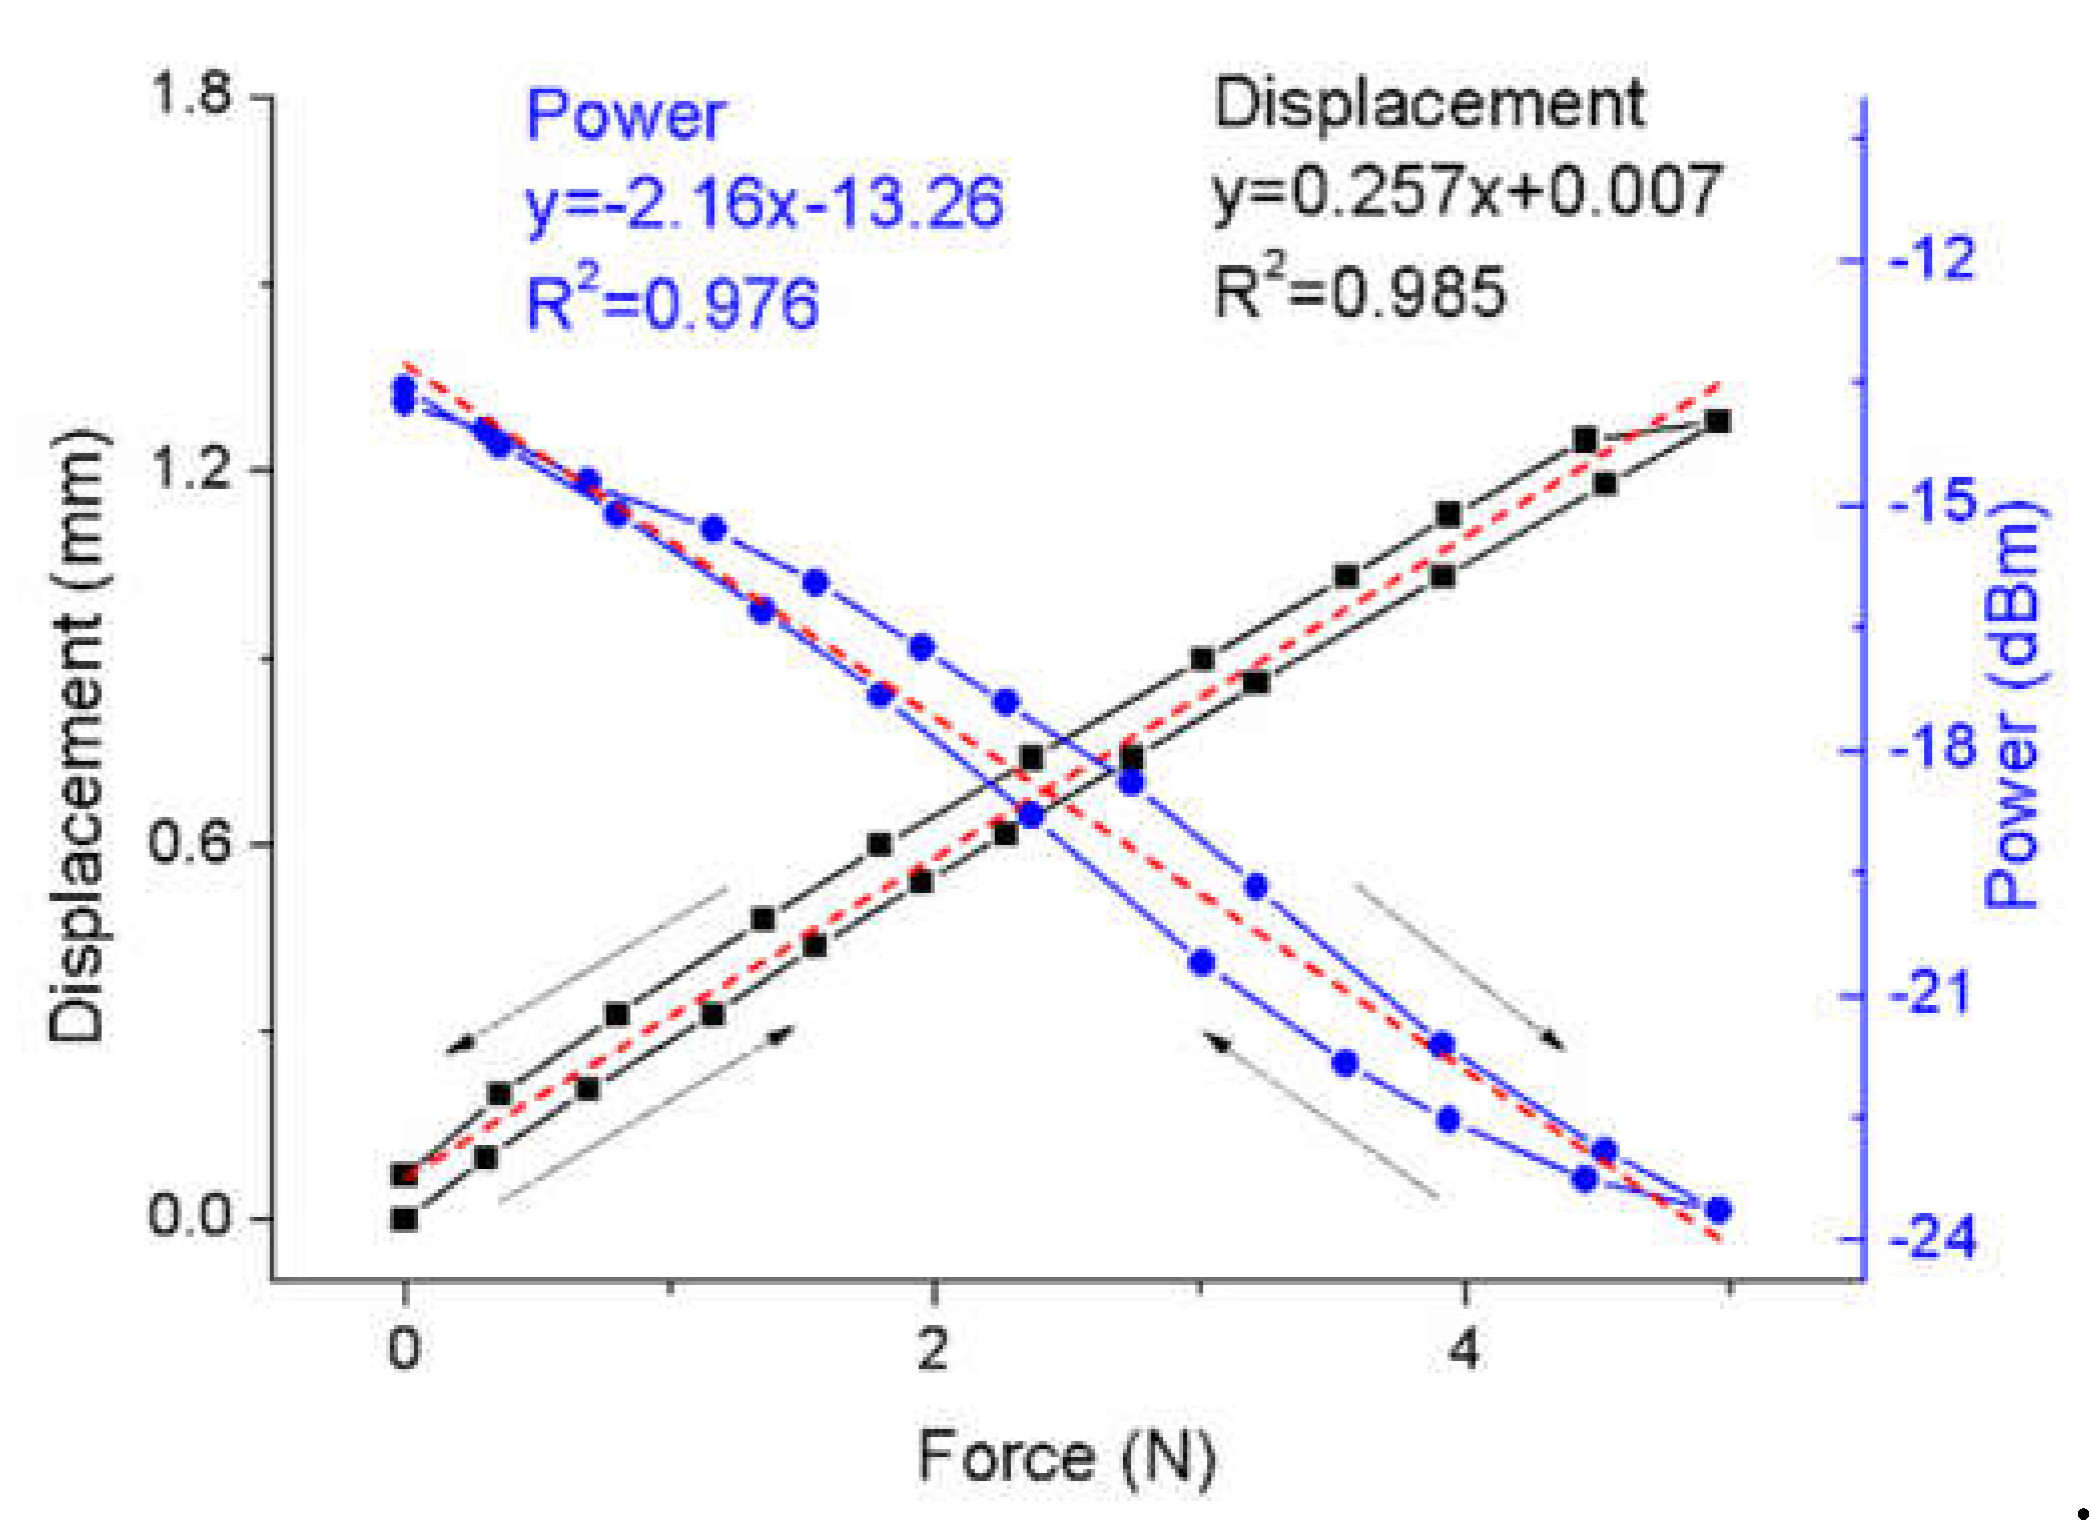
Figure 4 is the responses of the sensor with the base. The power response and displacement response also change approximately linearly as the force increases. However, the hysteresis phenomenon becomes strong. It may be caused by the large deformation of the PDMS. In the second experiment, the displacement of the sensor is two times as large as that of the first experiment. The sensitivity of power to the force is -2.16 dBm/N which is higher than that of the sensor without the base. The sensitivity of displacement to the force is 0.257 mm/N which shows a lower rigidity than that of the sensor without the base. The low-rigidity sensor is good for reducing the impact force and protecting the human from injury in the human-robot collaboration. In addition, the sensor with the base has higher sensitivity than that without the base.
B. Response Rate
The response rate of the sensor is another important characteristic for the human-robot collaboration.
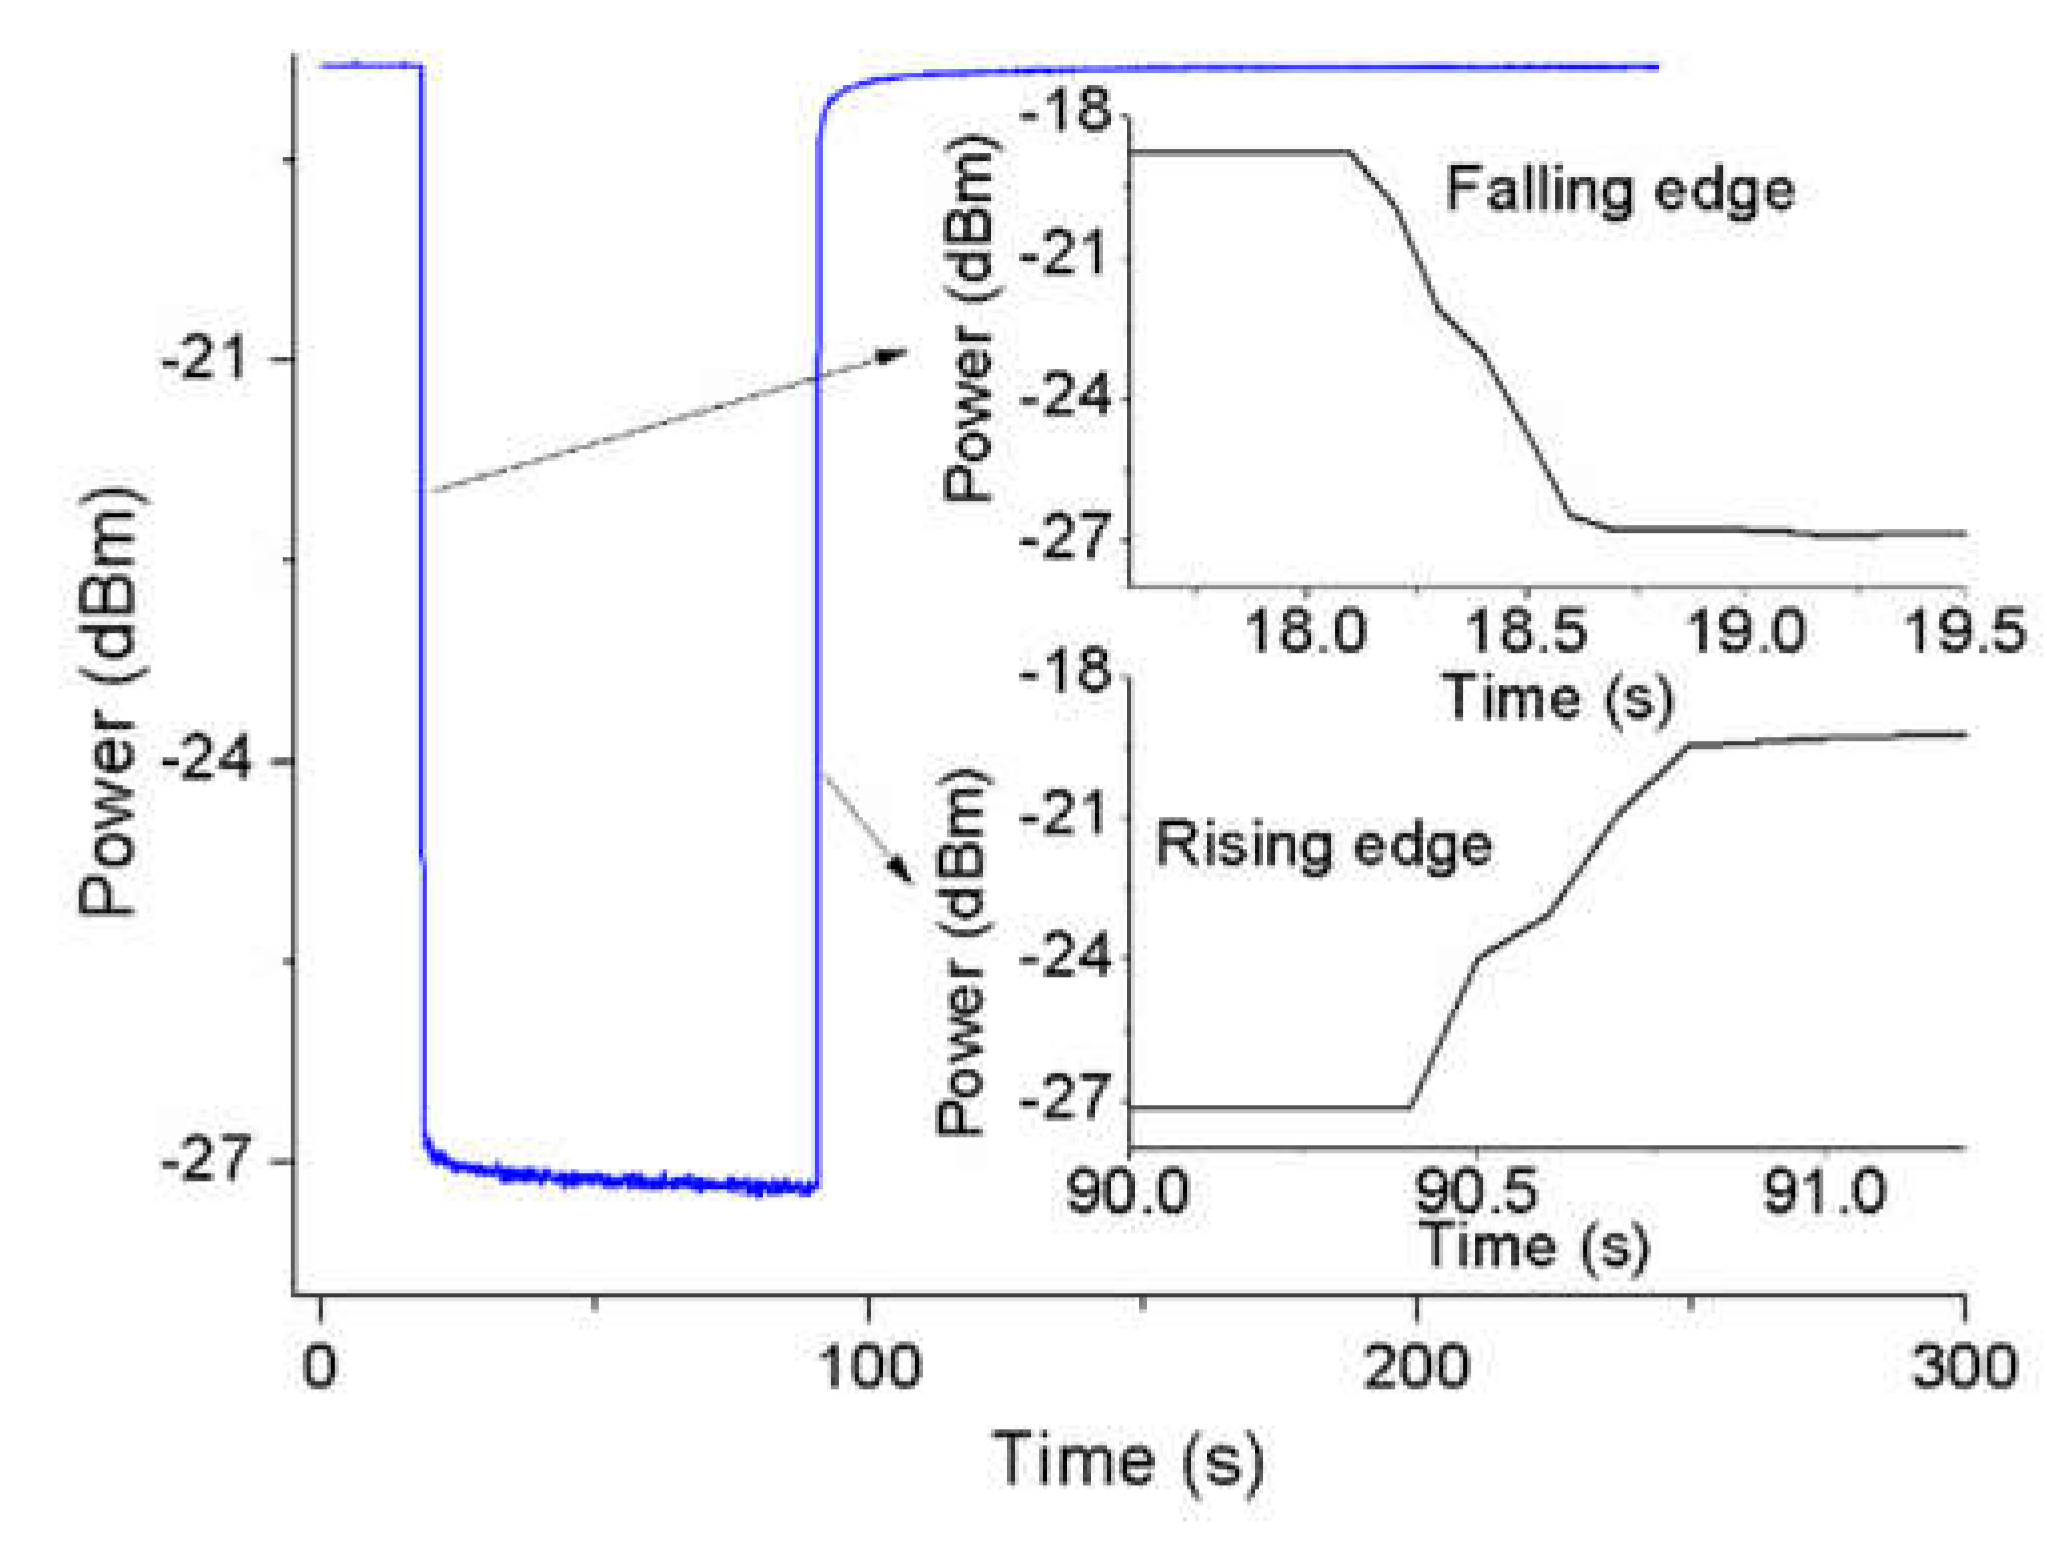
Figure 5 shows a response cycle of the sensor in the time domain. The falling edge and rising edge show that the response time and recovery time of the sensor are 0.4 s and 0.3 s, respectively. Considering the slow mechanical motion of the force loading probe, the real response time and recovery time should be shorter than those of the experimental results.
C. Repeatability
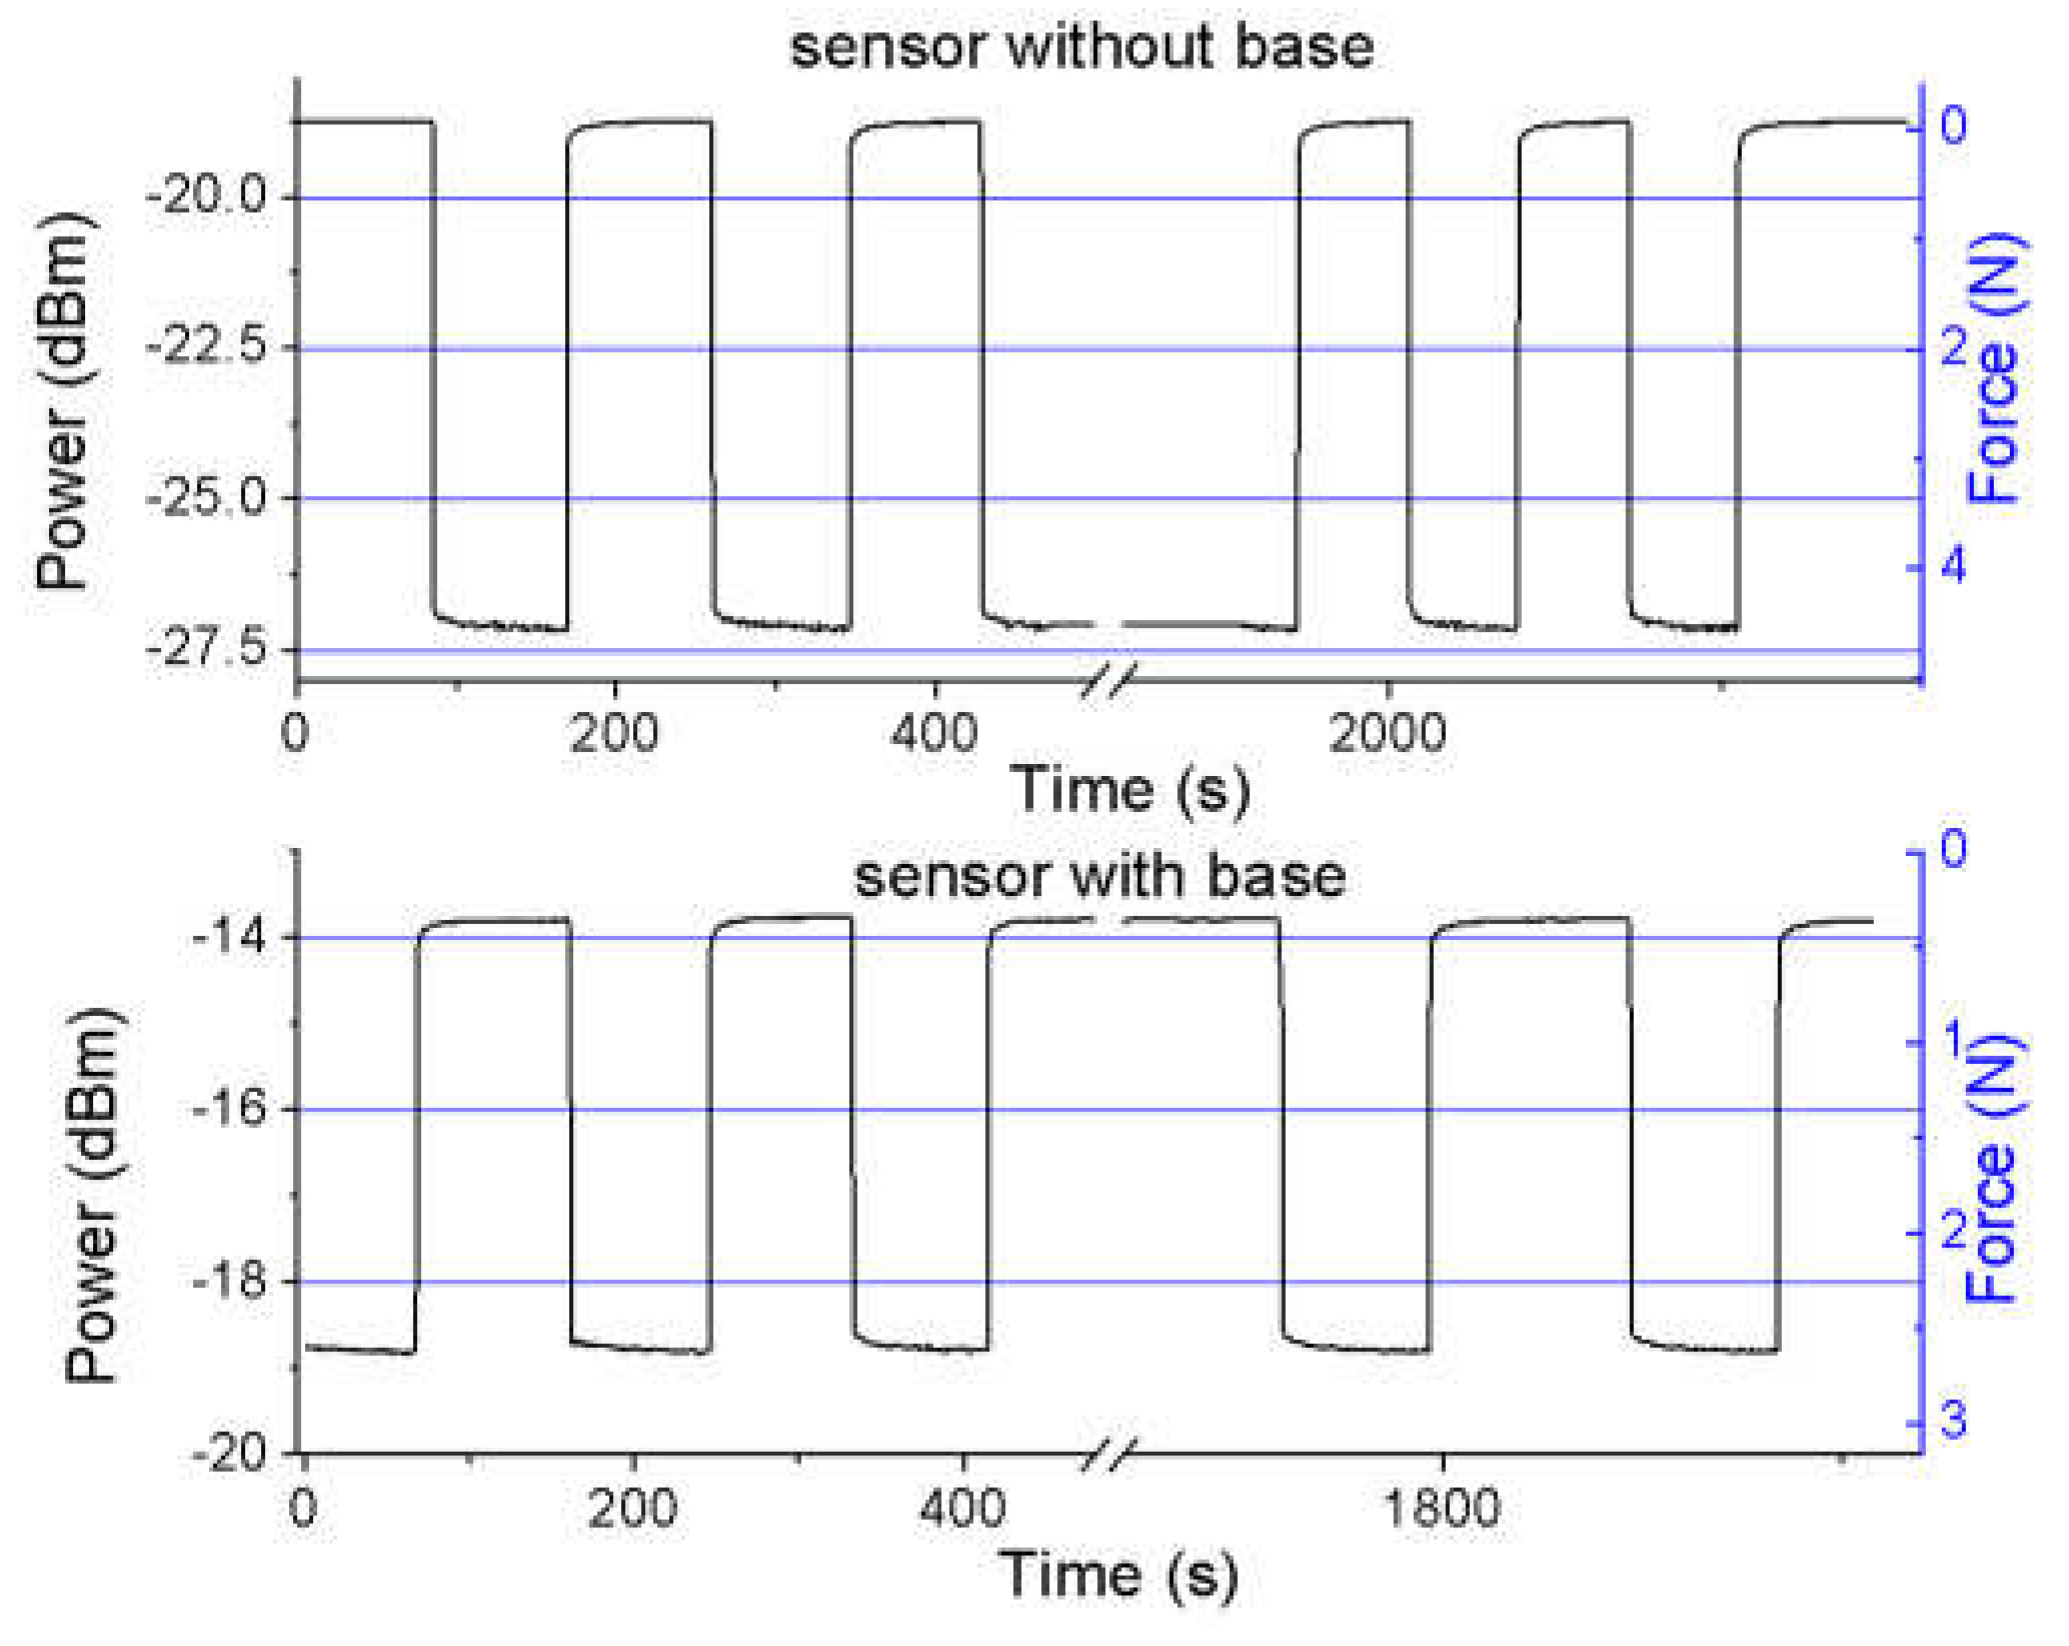
In industrial applications, repeatability is the most important characteristic. Force cycling tests are implemented. The results of the two samples are shown in
Figure 6. Both sensors with base and without base show high repeatability. In tens of cycles, the baseline and response line keep straight. The high repeatability is benefited from the simple LED–fiber–photodetector structure and composite material package.
4. Discussion
A. Model of the Sensor
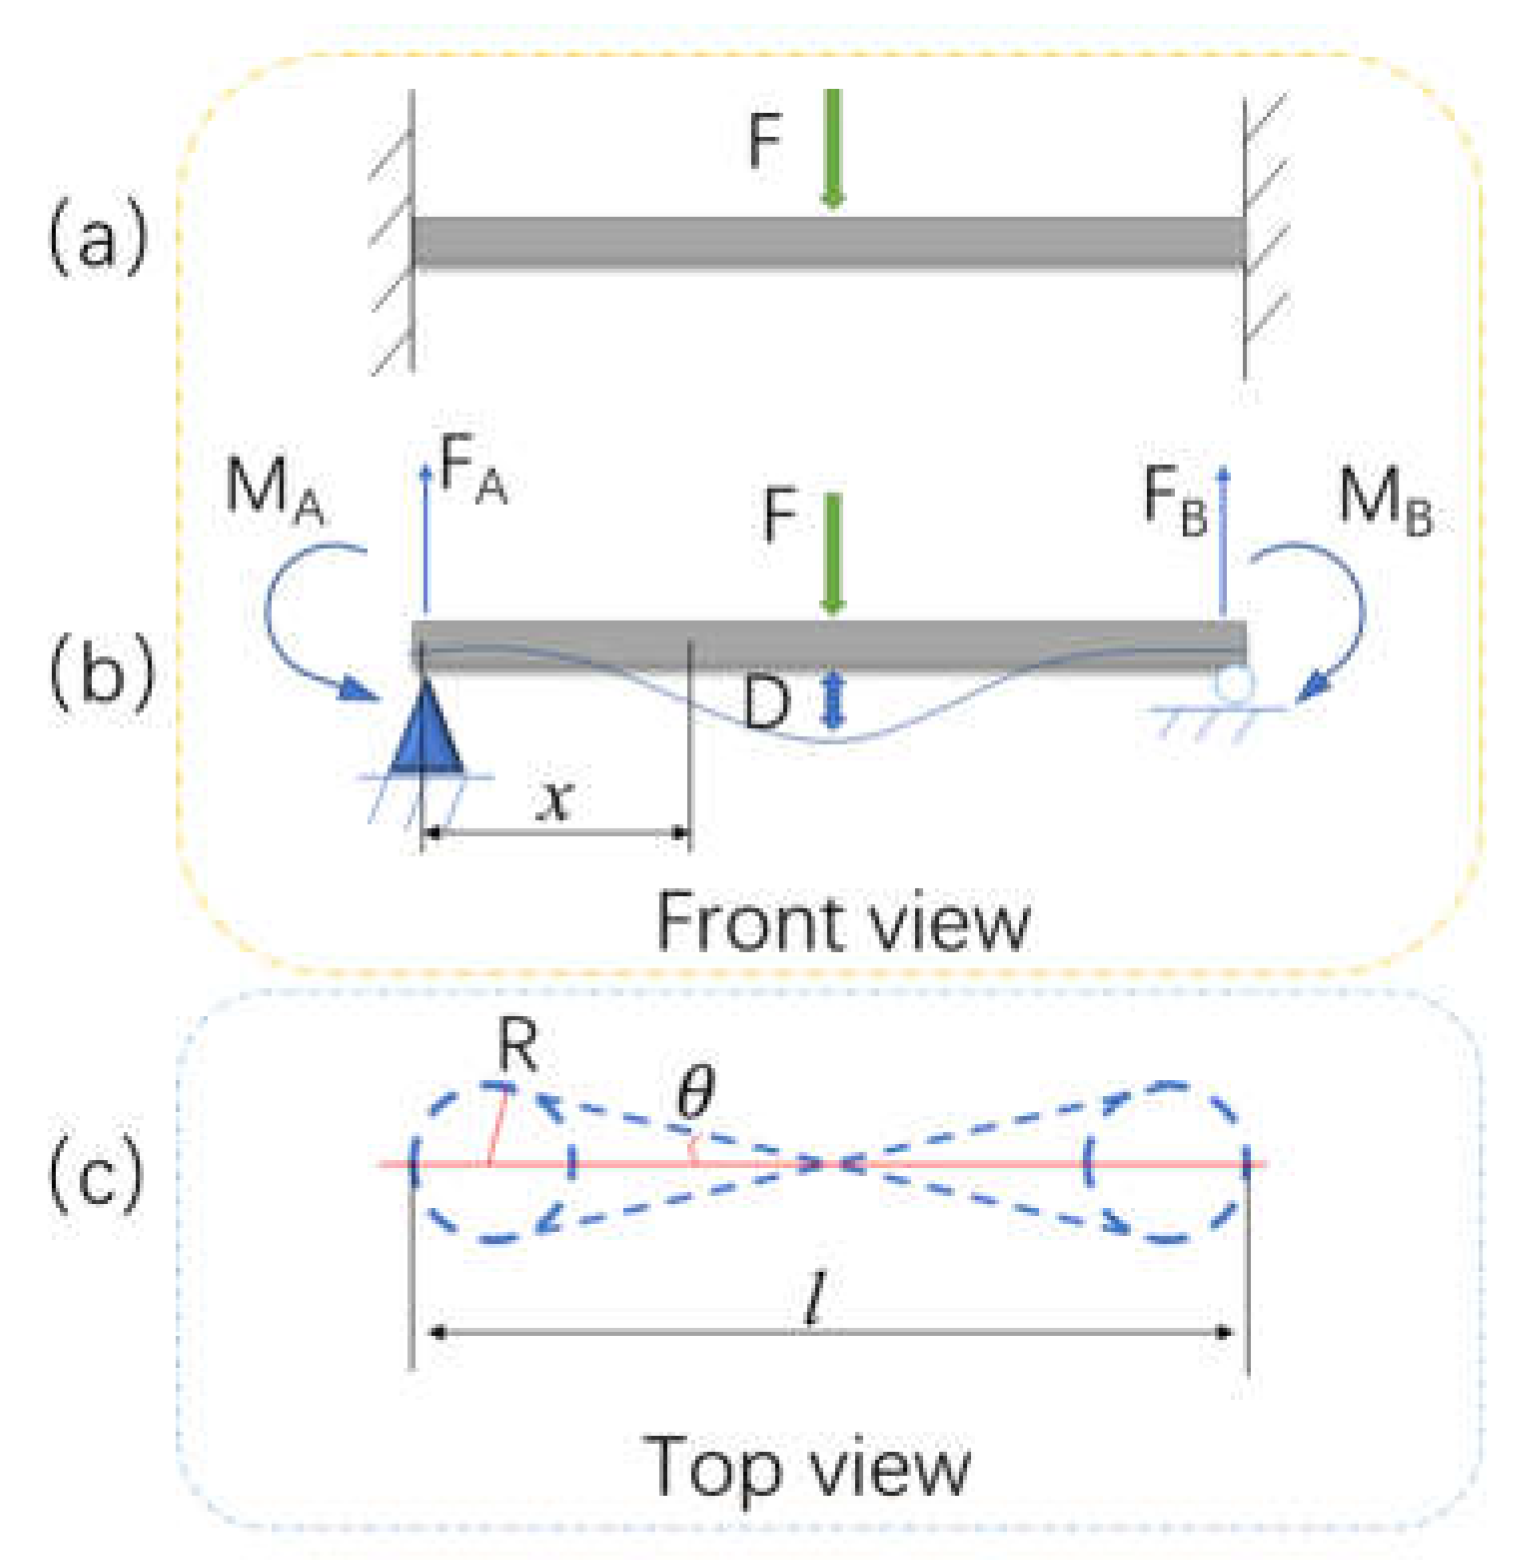
The sensor structure is made of composite material. The fiber in the sensor is fixed by the pillars as shown in
Figure 1(c). Its mechanical model can be regarded as a beam which is fixed at its two ends as shown in
Figure 7(a). When a force is put on the beam, the beam bends down. If we ignore the horizontal reaction force, the loading conditions of the beam are shown in
Figure 7(b).
The F
A, M
A, F
B, and M
B represent the reaction forces and moments at support A and support B respectively. According to the symmetry of the structure, the forces and moments satisfy
According to the static equilibrium condition, the reaction forces at supports can be expressed as
In addition, the compatibility condition points out
where
E, I, and l represent elastic modulus, moment inertia, and Length of beam, respectively.
Substituting Eq. (2) into (4), one can obtain:
According to the superposition principle, the deflection curve is
where x represents the position of a point on the beam as shown in Figure (c).
Considering the radius R of the 8-shaped ring is much smaller than its length
l, the influence of the arcs at both ends of the ring on the length of the bent fiber are ignored. The length of the bent fiber
can be calculated by
Substituting Eq. (6) into (7), the length of the bent fiber
Lv can be rewritten as
The term
is a non-integrable function. However, because of the large elastic module value of the material
E, the term
is much smaller than 1. According to Taylor’s theory, the Eq. (8) can be approximated as
For a small force change
dF, the length increment
dLv can be written as
In
Figure 7(c), the fiber length of the 8-shaped ring consists of the length of two arcs and two tangent lines which can be expressed as
where
.
The length decrement of the 8-shaped ring induced by the change of the radius is determined by
where
.
Because of the fiber bending in the vertical plane shown in
Figure 7 (c), the increasing length of fiber results from the shrinkage of the 8-shaped ring in the horizontal plane, which means that
Combining Eq. (13), (12) and (10), one can obtain the decrease of the radius as
Transition losses of bend fiber can be evaluated from overlap integral between optical fields in straight and curved waveguides [
9]. Bending loss can be expressed as
where α(R) is the bending losses per unit length and R is the curvature radius of the fiber.
Marcuse and Marcatili [
10,
11] analyzed the relationship between the loss and the radius. The macro-bending loss coefficient α(R) satisfy
where k1 and k2 are constants depending only on the optical properties of the fiber and the wavelength of light. Due to the independence between the curvature radius R and integration variable s in Eq. (14), the bending loss can be simplified as
where S represents the length of bending fiber.
For a small change of radius
dR, the change of loss can be expressed as
Substituting Eq. (14) into (18), the sensitivity of the sensor is obtained as shown in Eq. (19).
Resolving the differential equation, the loss can be obtained as
where the constant
C0 represents the initial loss.
The parameters k
1, k
2 are obtained from Eq. (16), according to the losses of PMMA POF which are reported in Ref. [
12]. The losses for the step index-POF with a diameter of 500 μm are 0.7 and 0.2 dB/turn for 2.5- and 4-mm bend radii, respectively.
The model described by Eq. (20) shows that the loss of the sensor is proportional to the term F2. Only in a small interval of the force, the loss can be regarded as a linear function of the force.
B. Simulation Analysis
The parameters of the 8-shaped ring in our experiments are shown in
Table 1.
With these parameters, a simulation was implemented.
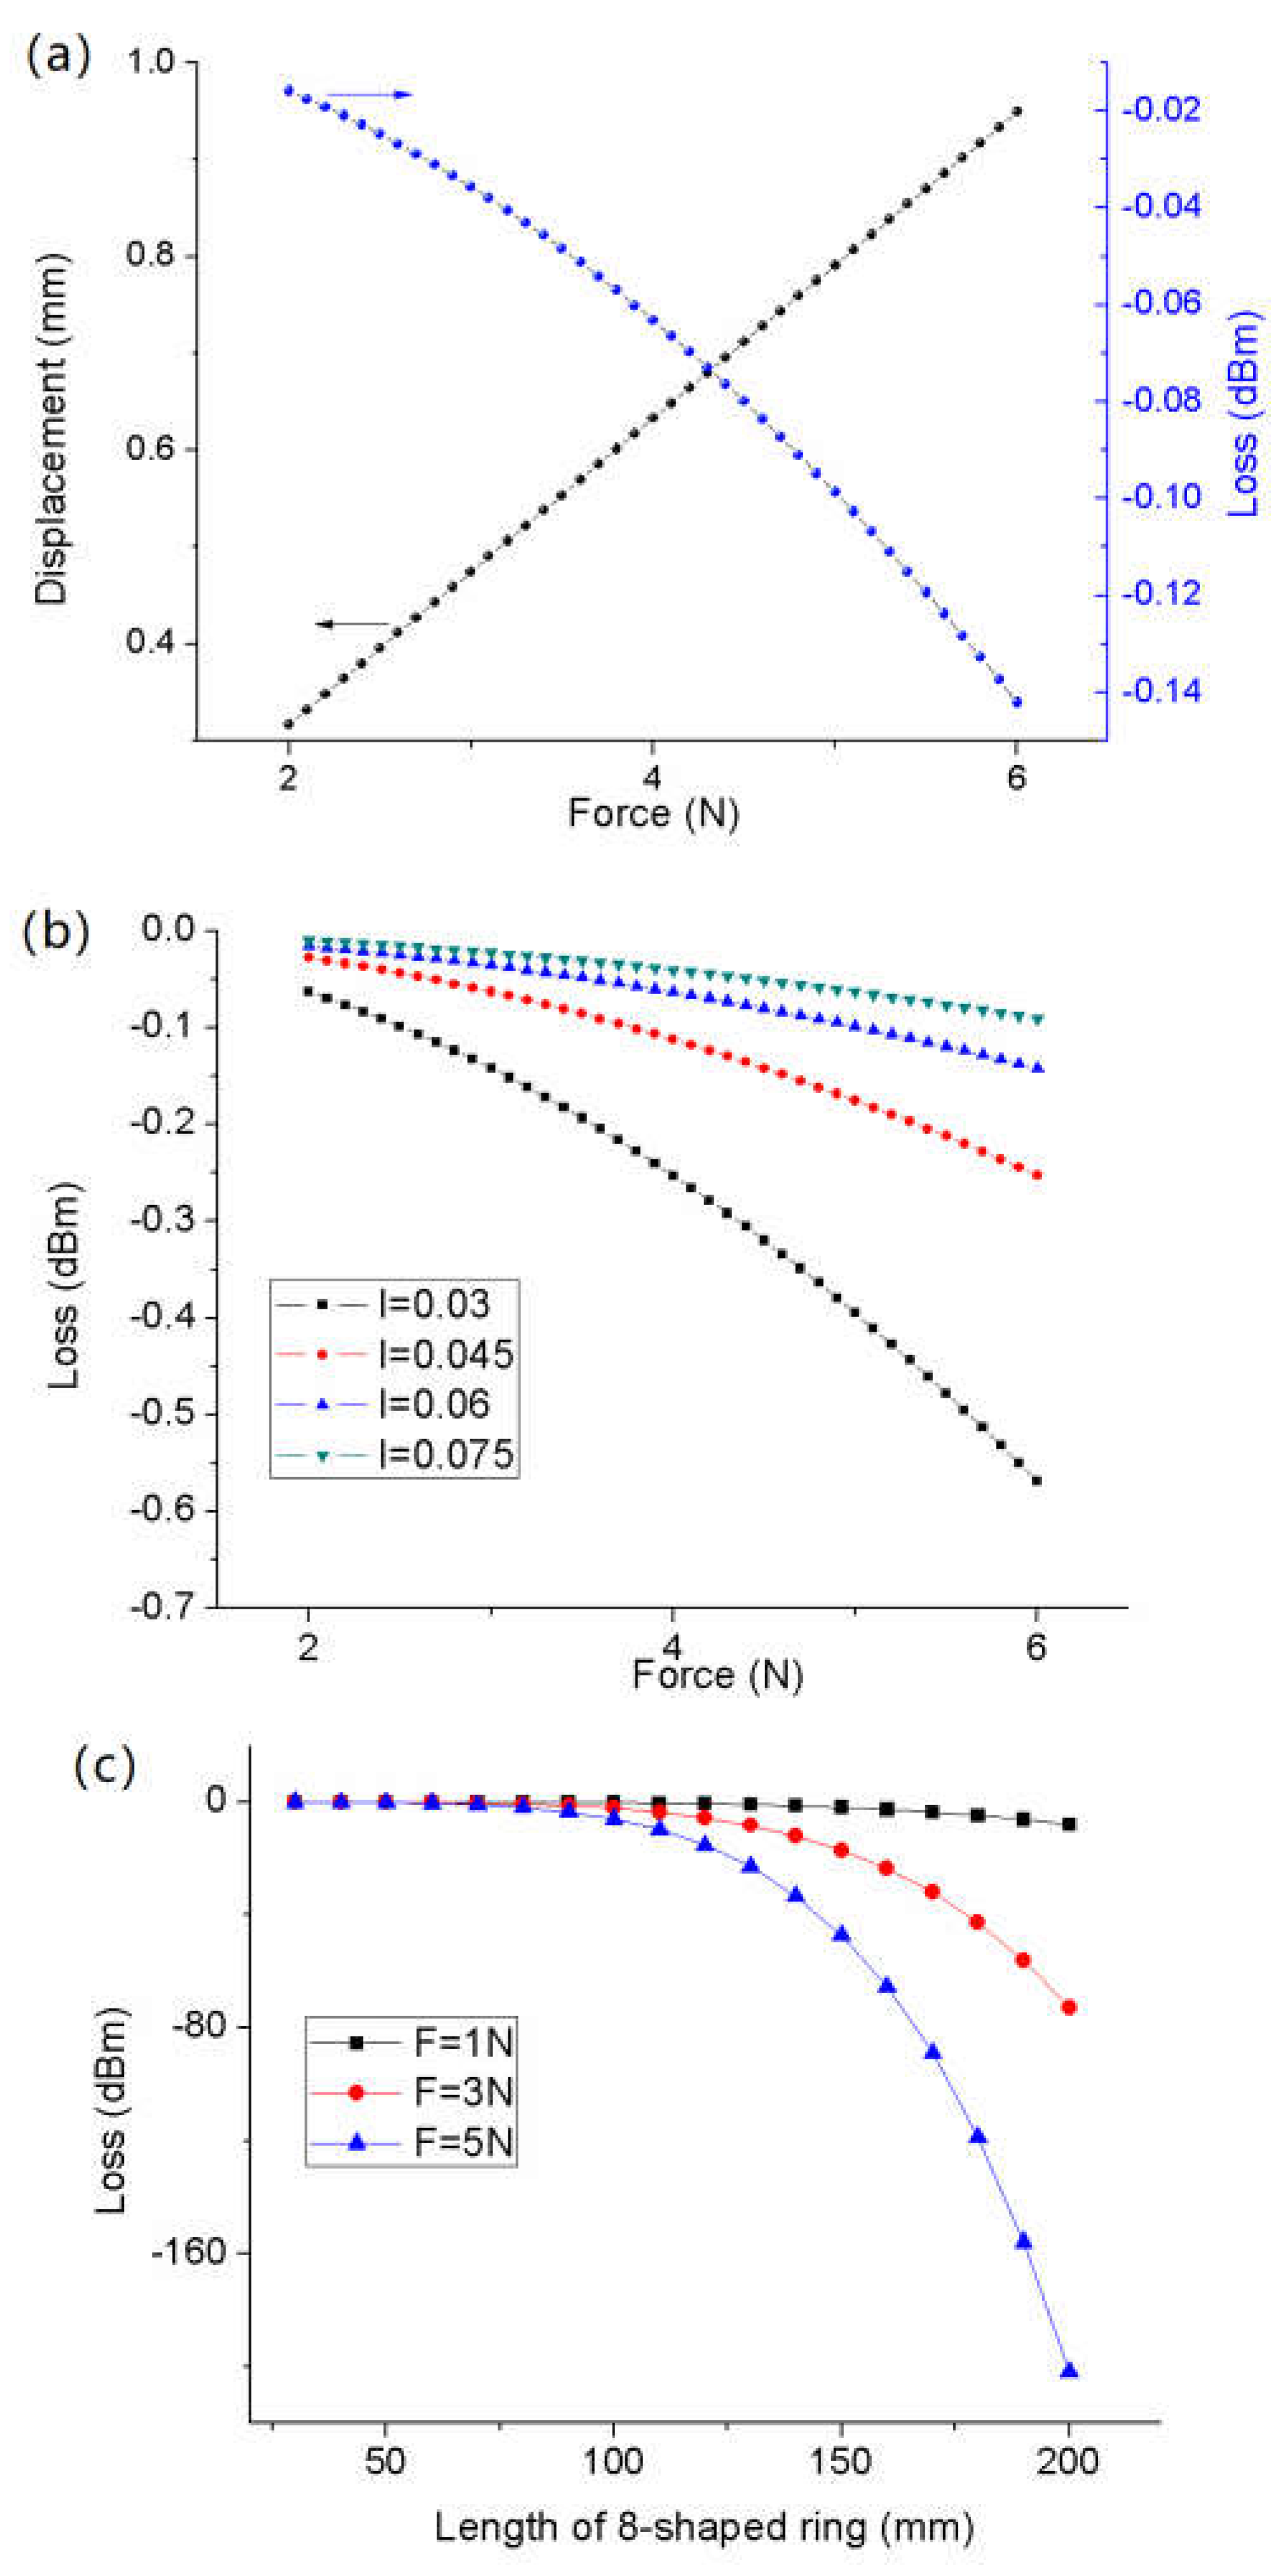
Figure 8(a) shows the displacement and the loss change inversely as the force increases, as what has been measured by the experiments shown in
Figure 3. The displacement curve (black curve) is linear to the force. However, the loss (blue curve) is a quadratic function of the force. The loss curve can be approximated to a straight line within a small variation range of the force. This explains why the sensor for large deformation measurement will show a nonlinear sensitivity as shown in
Figure 4.
Figure 8(b) shows the loss changes as the force changes for different section moment inertia
I. The loss increases as the section moment inertia decreases. It is caused by rigidness reducing. The weak rigidness section results in large deformation and loss. Therefore, the reducing the section moment inertia could be used to increase the sensitivity of the sensor and reduce the hurt during the human-robot collision.
Figure 8(c) shows the influence of the length of the 8-shaped ring on the loss. For a constant force, the loss increases as the length increases. When
l<80mm, the loss changes a little. However, the loss increases rapidly when the length is longer than 80mm. For the different forces, the longer the length of the ring is, the larger the difference of the loss between two different forces is also. In other words, the sensitivity will increase as the length of the 8-shape ring increases.
5. Conclusion
Human-Robot collaboration is a new trend in modern manufacture. To increase safety and protect the human, a soft force sensor as a passive strategy was proposed to reduce the hurt further. For traditional force sensors, there is a trade-off between the flexibility and the sensitivity. The soft package could weaken external action to the sensitive point and reduce the sensitivity of sensors. In this paper, an 8-shaped wound polymer optical fiber sensor packaged by Polydimethylsiloxane (PDMS) was proposed to obtain high flexibility and sensitivity simultaneously. The sensor consists of a simple LED–fiber–photodetector system. Since no complicated spectrum measurement is required, the proposed scheme is a low-cost, high-speed, high-flexibility, high-sensitivity contact force monitoring system. In the experiments, the prototype of sensor shows it can monitor the force and the displacement on its surface simultaneously. The response time and recovery time of the sensor are 0.4s and 0.3s respectively. To clarify the principle of the sensor, a model was established. Simulation results show that an optimization to the parameters of sensor, such as the section moment inertia, the length of the 8-shaped ring could improve the properties of sensor further. Because of their high flexibility, low cost, fast response, high repeatability, the contact force sensor based on the 8-shaped wound polymer optical fiber shows great promise on actively alarming collision and passively reducing the hurt further in industrial robot field.
Funding
This work is supported by the Grant 2023B41011 from Shaoxing Science and Technology Plan Project.
References
- Robots and robotic devices — Collaborative robots, ISO/TS 15066. 2016.
- J. A. Marvel, “Sensors for safe, collaborative robots in smart manufacturing,” in Proceedings of IEEE Sensors, 2017, vol. 2017–December, pp. 1–3.
- T. L. Lam, H. W. Yip, H. Qian, and Y. Xu, “Collision avoidance of industrial robot arms using an invisible sensitive skin,” in IEEE International Conference on Intelligent Robots and Systems, 2012, pp. 4542–4543.
- Cirillo, P. Cirillo, G. De Maria, C. Natale, and S. Pirozzi, “A proximity/contact-force sensor for Human Safety in industrial robot environment,” in 2013 IEEE/ASME International Conference on Advanced Intelligent Mechatronics: Mechatronics for Human Wellbeing, AIM 2013, 2013, pp. 1272–1277.
- H. Yang, Y. Chen, Y. Sun, and L. Hao, “A novel pneumatic soft sensor for measuring contact force and curvature of a soft gripper,” Sensors Actuators, A Phys., vol. 266, pp. 318–327, Sep. 2017. [CrossRef]
- A. D’Amore, G. De Maria, C. Natale, and S. Pirozzi, “Silicone-Rubber-Based Tactile Sensors for the Measurement of Normal and Tangential Components of the Contact Force,” J. Appl. Polym. Sci., vol. 122, no. 6, pp. 3758–3770, Aug. 2011. [CrossRef]
- Y. Liu and J. Zhang, “Model study of the influence of ambient temperature and installation types on surface temperature measurement by using a fiber bragg grating sensor,” Sensors (Switzerland), vol. 16, no. 7, Jul. 2016. [CrossRef]
- M. Liu, E. Zhang, Z. Zhou, Y. Tan, and Y. Liu, “Measurement of temperature field for the spindle of machine tool based on optical fiber bragg grating sensors,” Adv. Mech. Eng., vol. 2013, 2013. [CrossRef]
- F. J. Mustieles, E. Ballesteros, and P. Baquero, “Theoretical S-Bend Profile for Optimization of Optical Wwaveguide Radiation Losses,” IEEE Photonics Technol. Lett., vol. 5, no. 5, pp. 551–553, Feb. 1993.
- D.Marcuse, “Bending losses of the asymmetric slab waveguide,” Bell Syst. Tech. J., vol. 50, no. 8, pp. 2551–2563, Oct. 1971.
- E. A. J. Martacilli, “Bends in optical dielectric guides,” Bell Syst. Tech. J., vol. 48, no. 9, pp. 2103–2132, Sep. 1969.
- A. Argyros, R. Lwin, and M. C. J. Large, “Bend loss in highly multimode fibres,” Opt. Express, vol. 16, no. 23, pp. 18590–18598, Nov. 2008.
|
Disclaimer/Publisher’s Note: The statements, opinions and data contained in all publications are solely those of the individual author(s) and contributor(s) and not of MDPI and/or the editor(s). MDPI and/or the editor(s) disclaim responsibility for any injury to people or property resulting from any ideas, methods, instructions or products referred to in the content. |
© 2024 by the authors. Licensee MDPI, Basel, Switzerland. This article is an open access article distributed under the terms and conditions of the Creative Commons Attribution (CC BY) license (http://creativecommons.org/licenses/by/4.0/).
