Submitted:
25 July 2024
Posted:
25 July 2024
You are already at the latest version
Abstract

Keywords:
1. Introduction
2. Instruments, Methods and Data
2.1. The Koldewey Aerosol Raman Lidar and Measurement Site
2.2. Data Set and the Cloud Mask
2.3. Hygroscopic Growth and the Growth Curve Model
3. Aerosol Properties in Spring and Summer 2021
4. Hygroscopic Properties
4.1. Hygroscopic Growth Analysis, dependent on Aerosol Diameter
4.2. Hygroscopic Growth Analysis, dependent on the Season
4.3. Hygroscopic Growth Analysis, dependent on Altitude
4.4. Case study: 23rd of May 2021
4.5. Case study: 29th of April 2021
5. Discussion
5.1. Estimation of the Effective Aerosol Radius - according to Mie Theory
5.2. The Seasonal Cycle of Arctic Aerosol in 2021
5.3. Dependene of Hygroscopicity on Particle Size, Season and Altitude
6. Conclusions
- Subdivision of the data set according to the aerosols’ color ratio, season and altitude. The application of the growth curve model then estimates the hygroscopicity of the sub dataset.
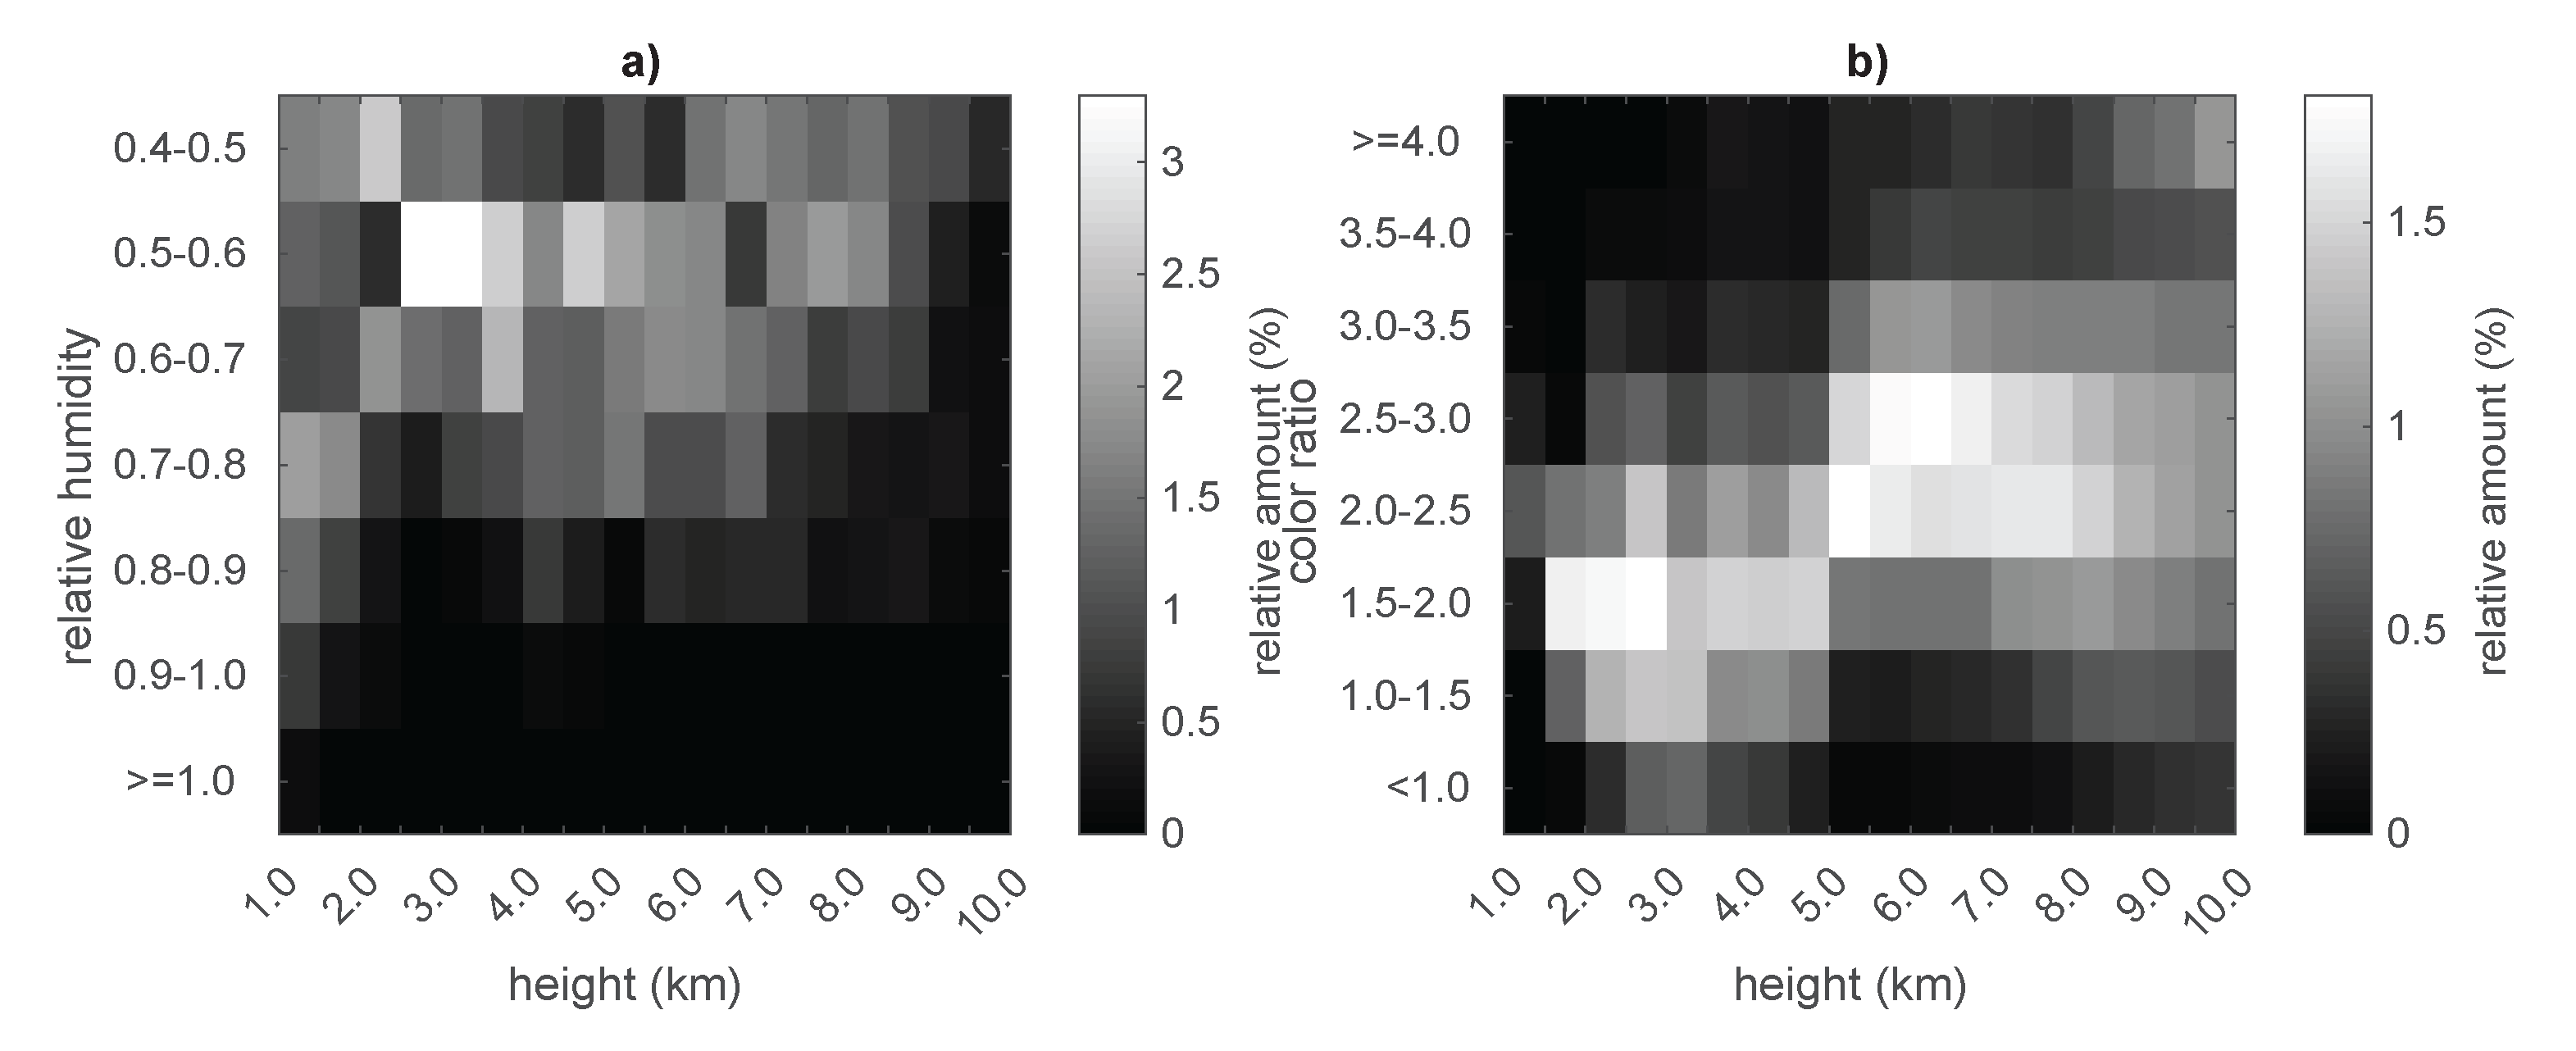
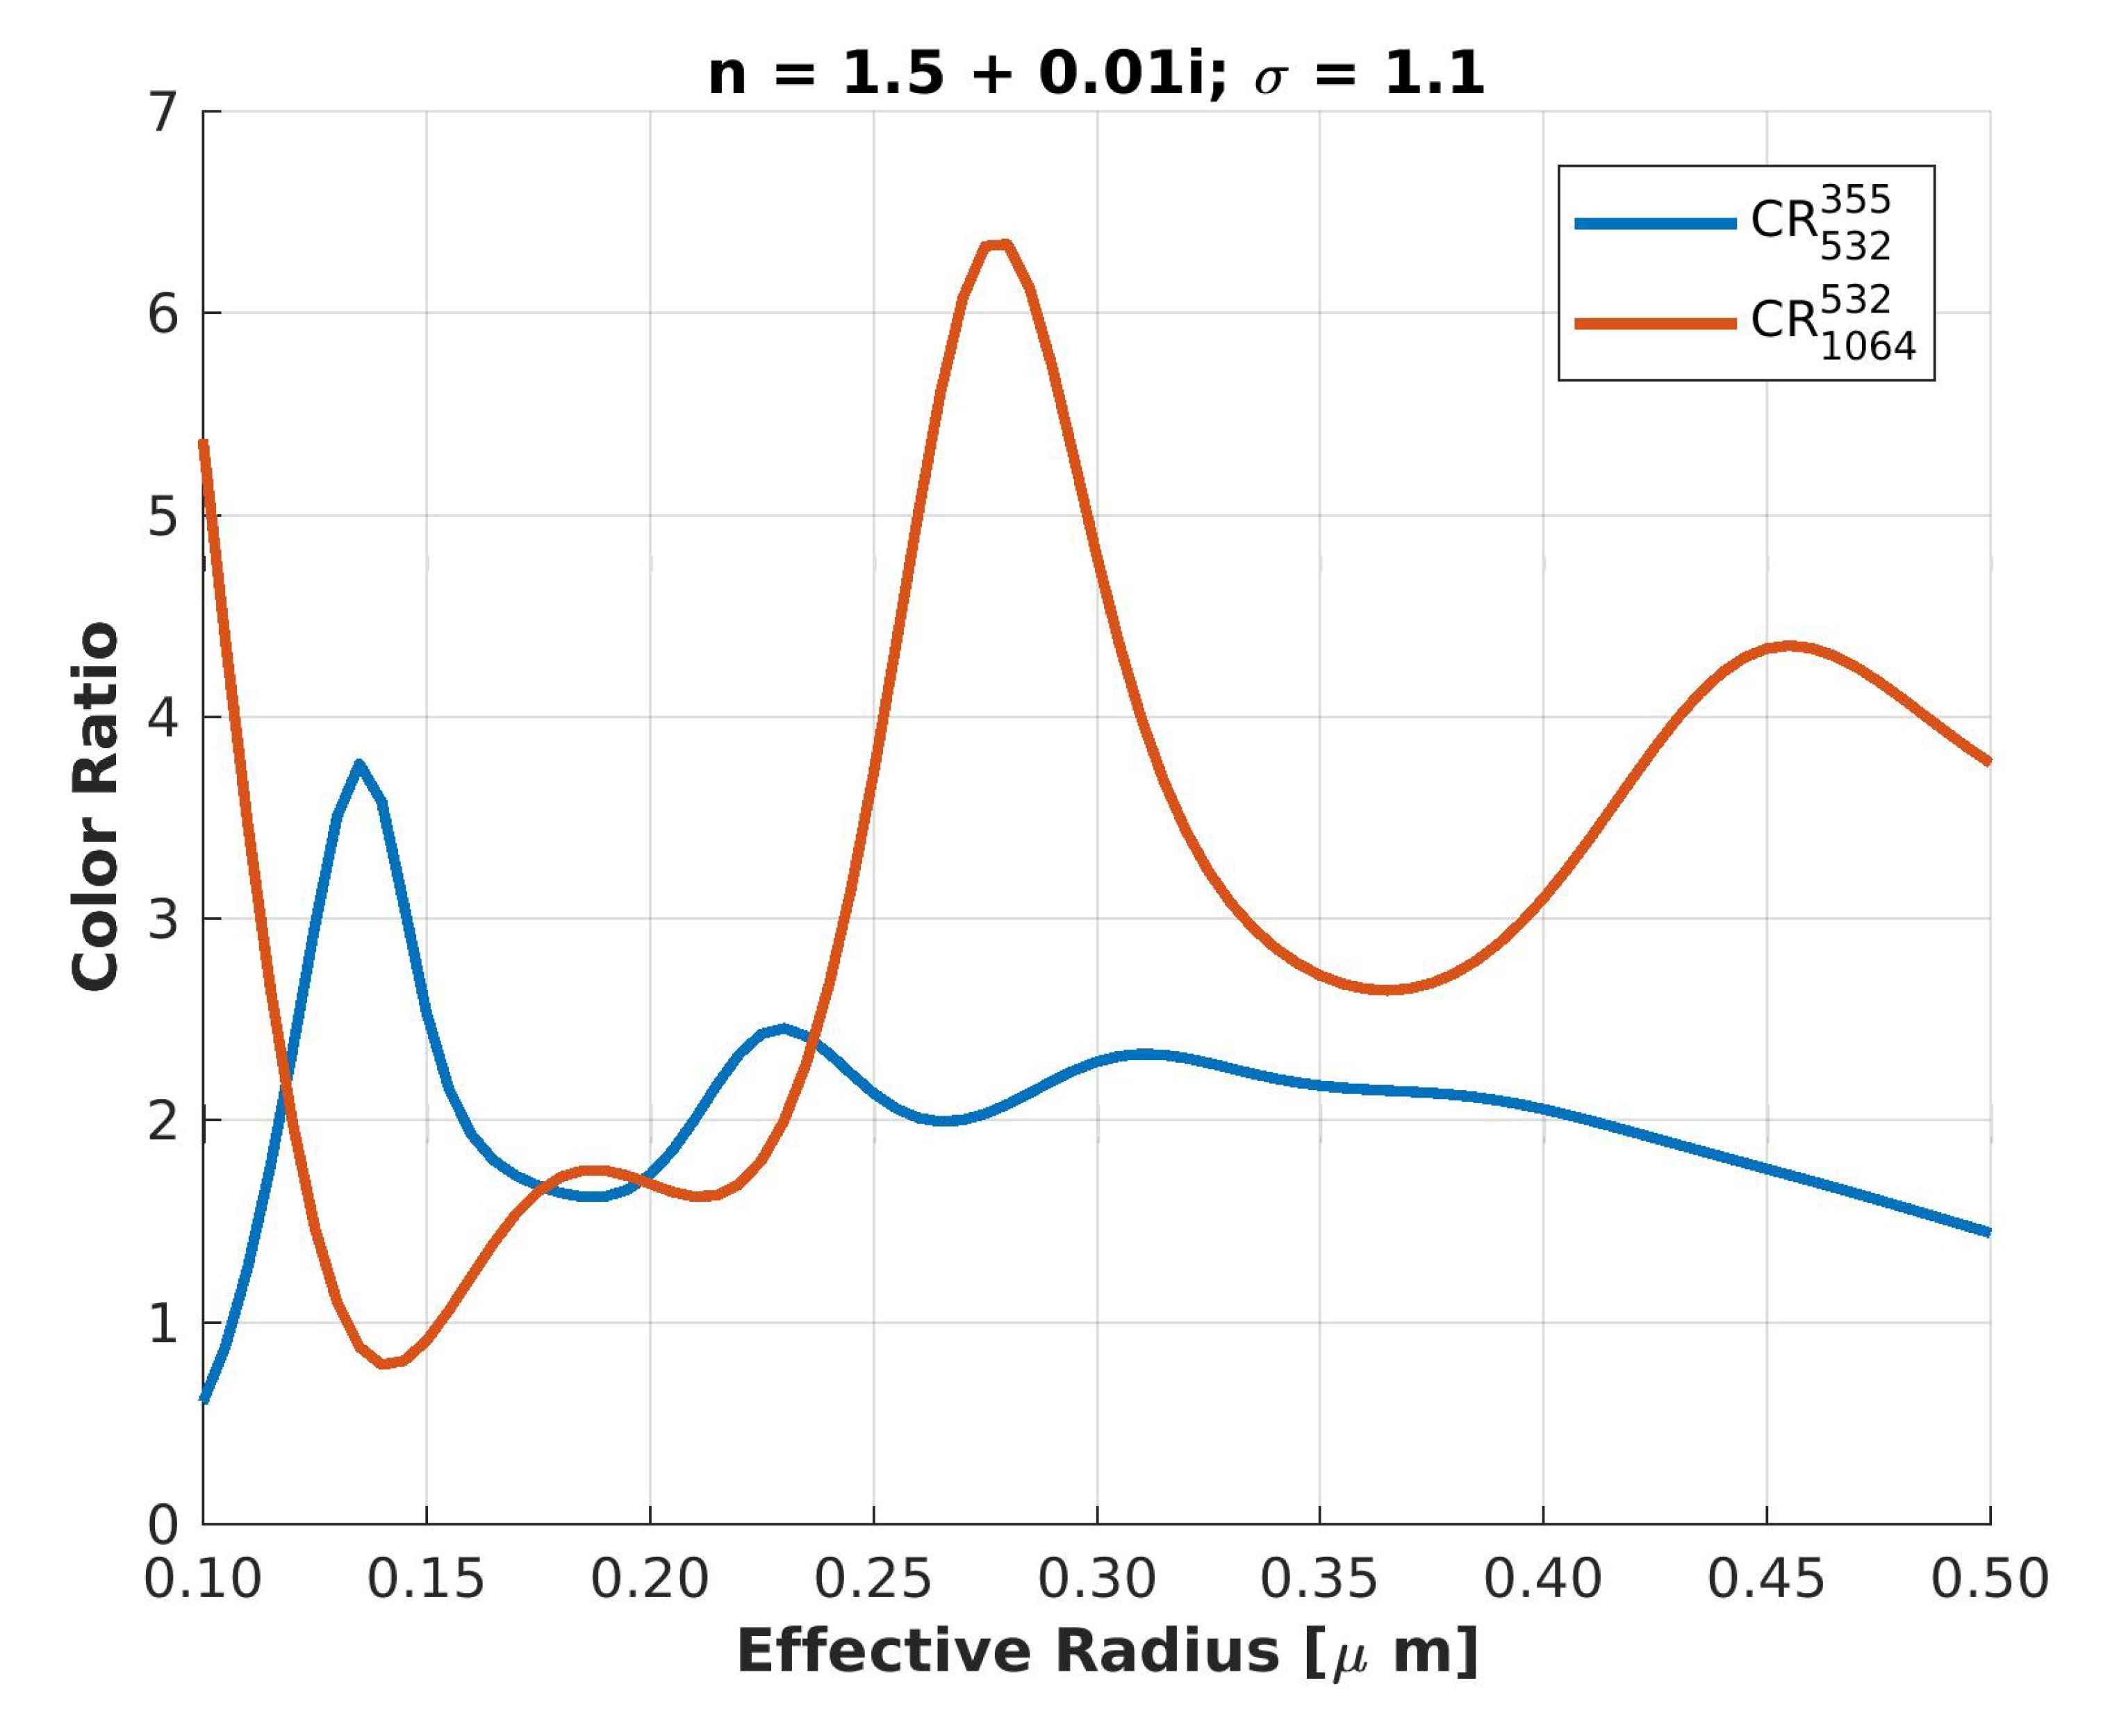
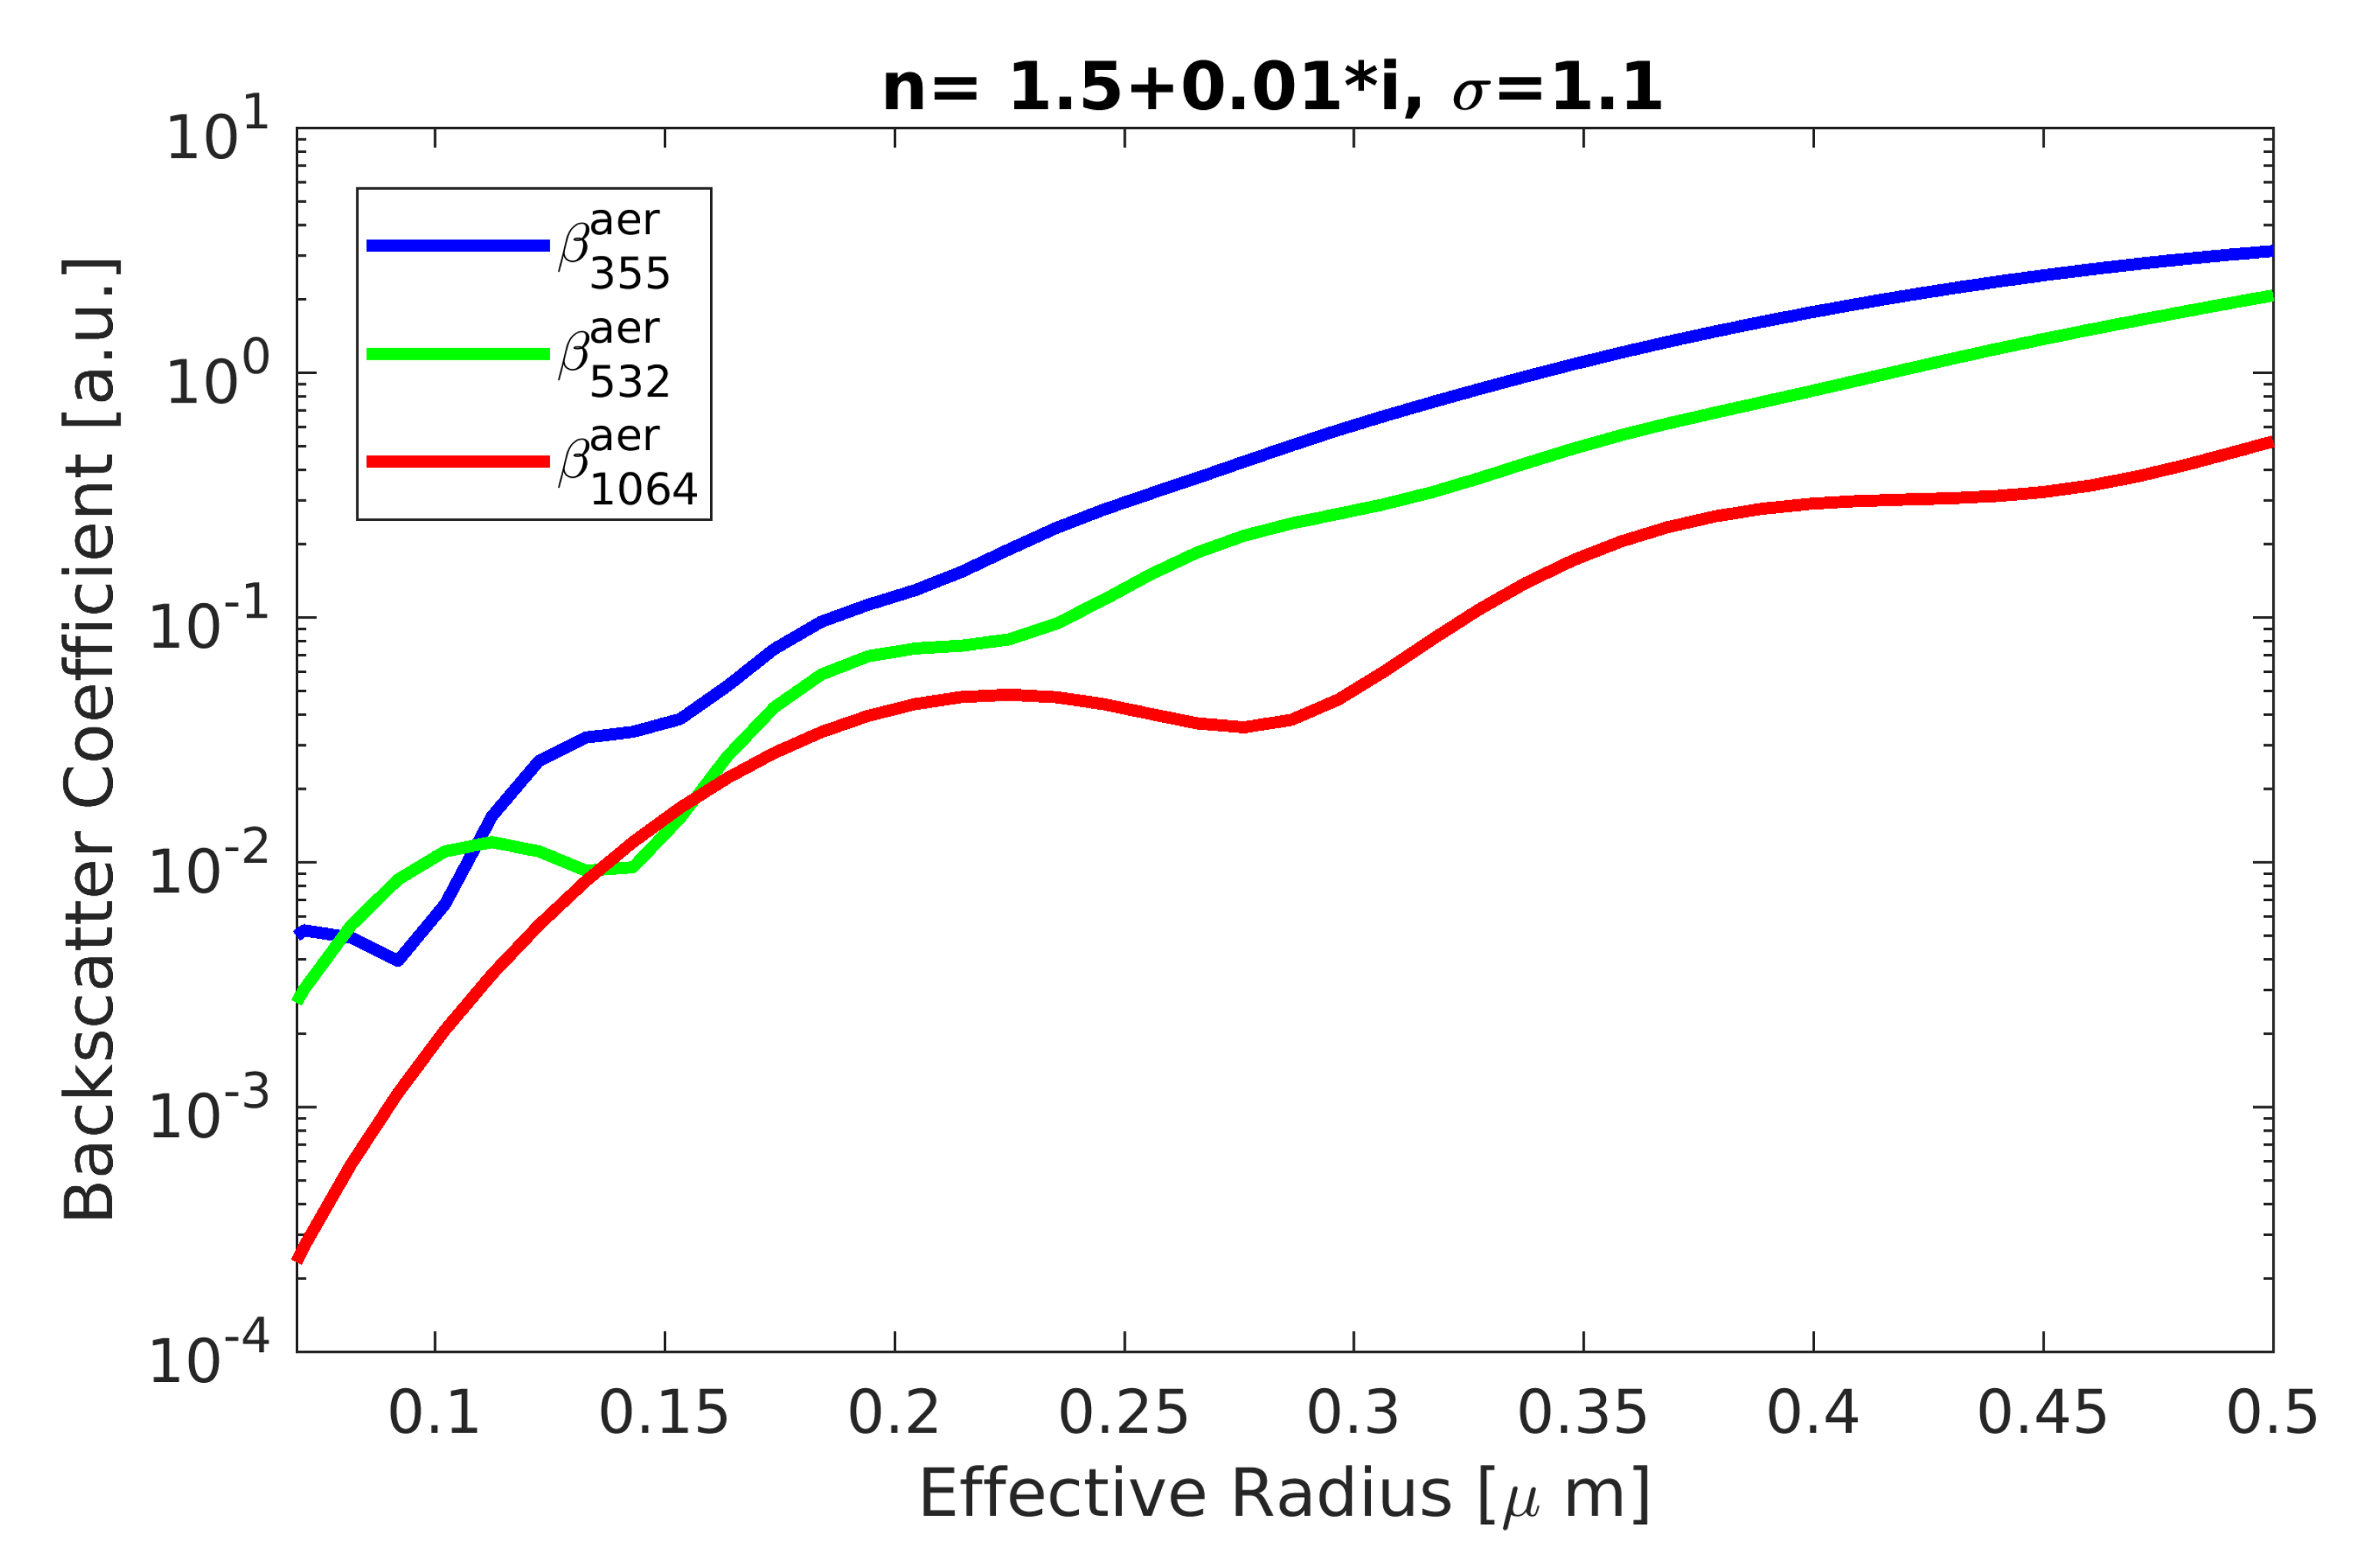
- Illustration of the often complex interpretation of the lidar data, and in particular the color ratio. Mie-calculation is performed to obtain a relation of the color ratio to the effective aerosol radius. We showed that by three backscatter coefficients (two color ratios, no extinction coefficient) the hygroscopic growth for a large, relevant size interval can be captured with only mild assumptions of the refractive index.
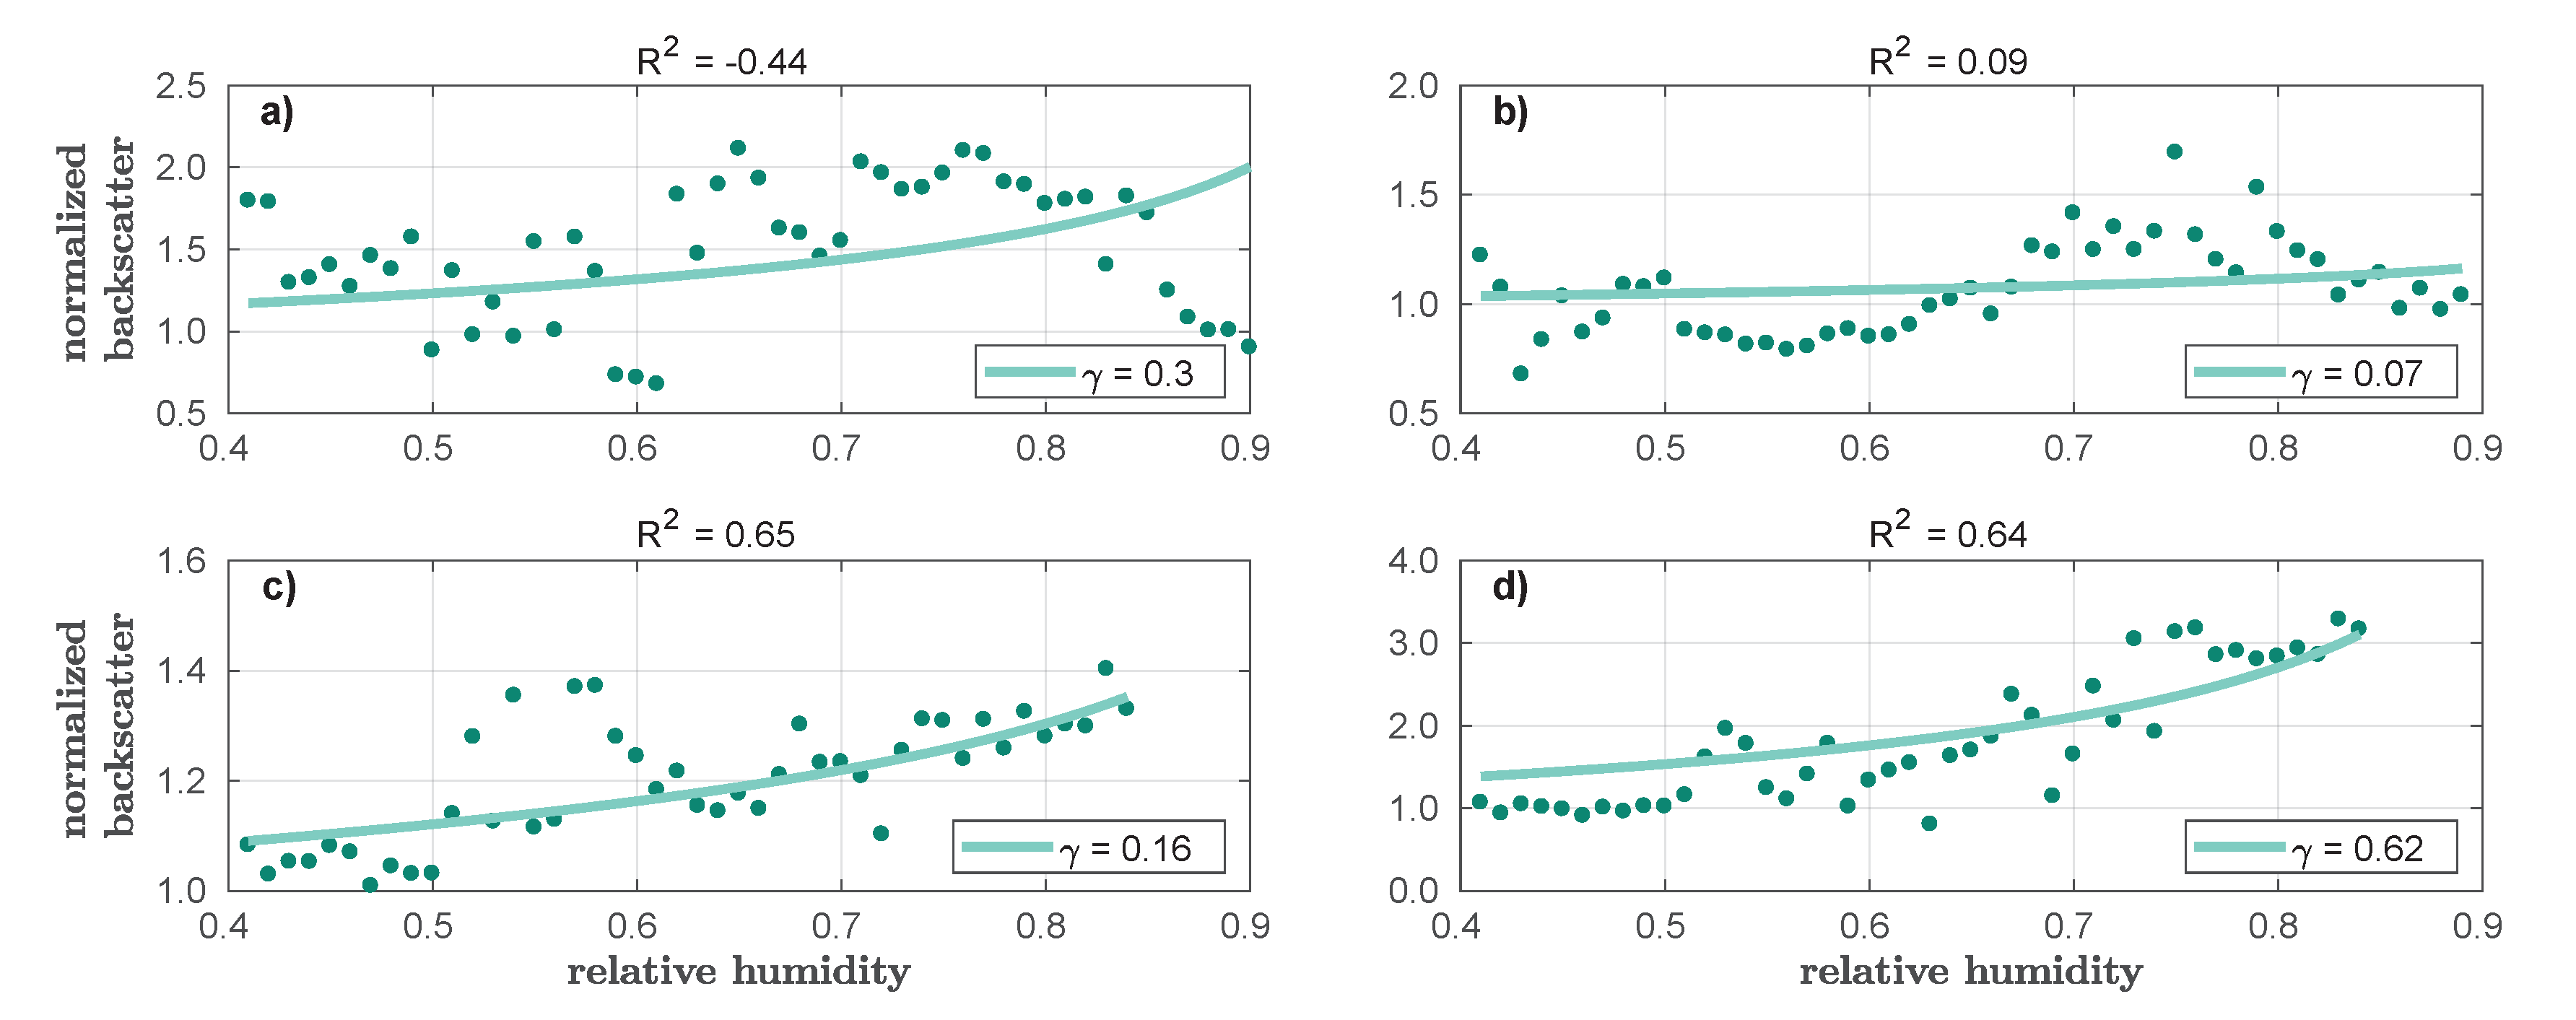
- Hygroscopic growth depends on the particle diameter. A bias to stronger growth by larger particles is observed. Therein, aerosols with a color ratio of 1.75-2.0 provide on average the highest apparent hygroscopicity. Using Mie theory (and the color ratio between and ), their radius is determined to be . The hygroscopic growth of larger particles will surely happen in the atmosphere, but is hard to see from inspection of the color ratio alone. Here a full inversion of the lidar data seems necessary.
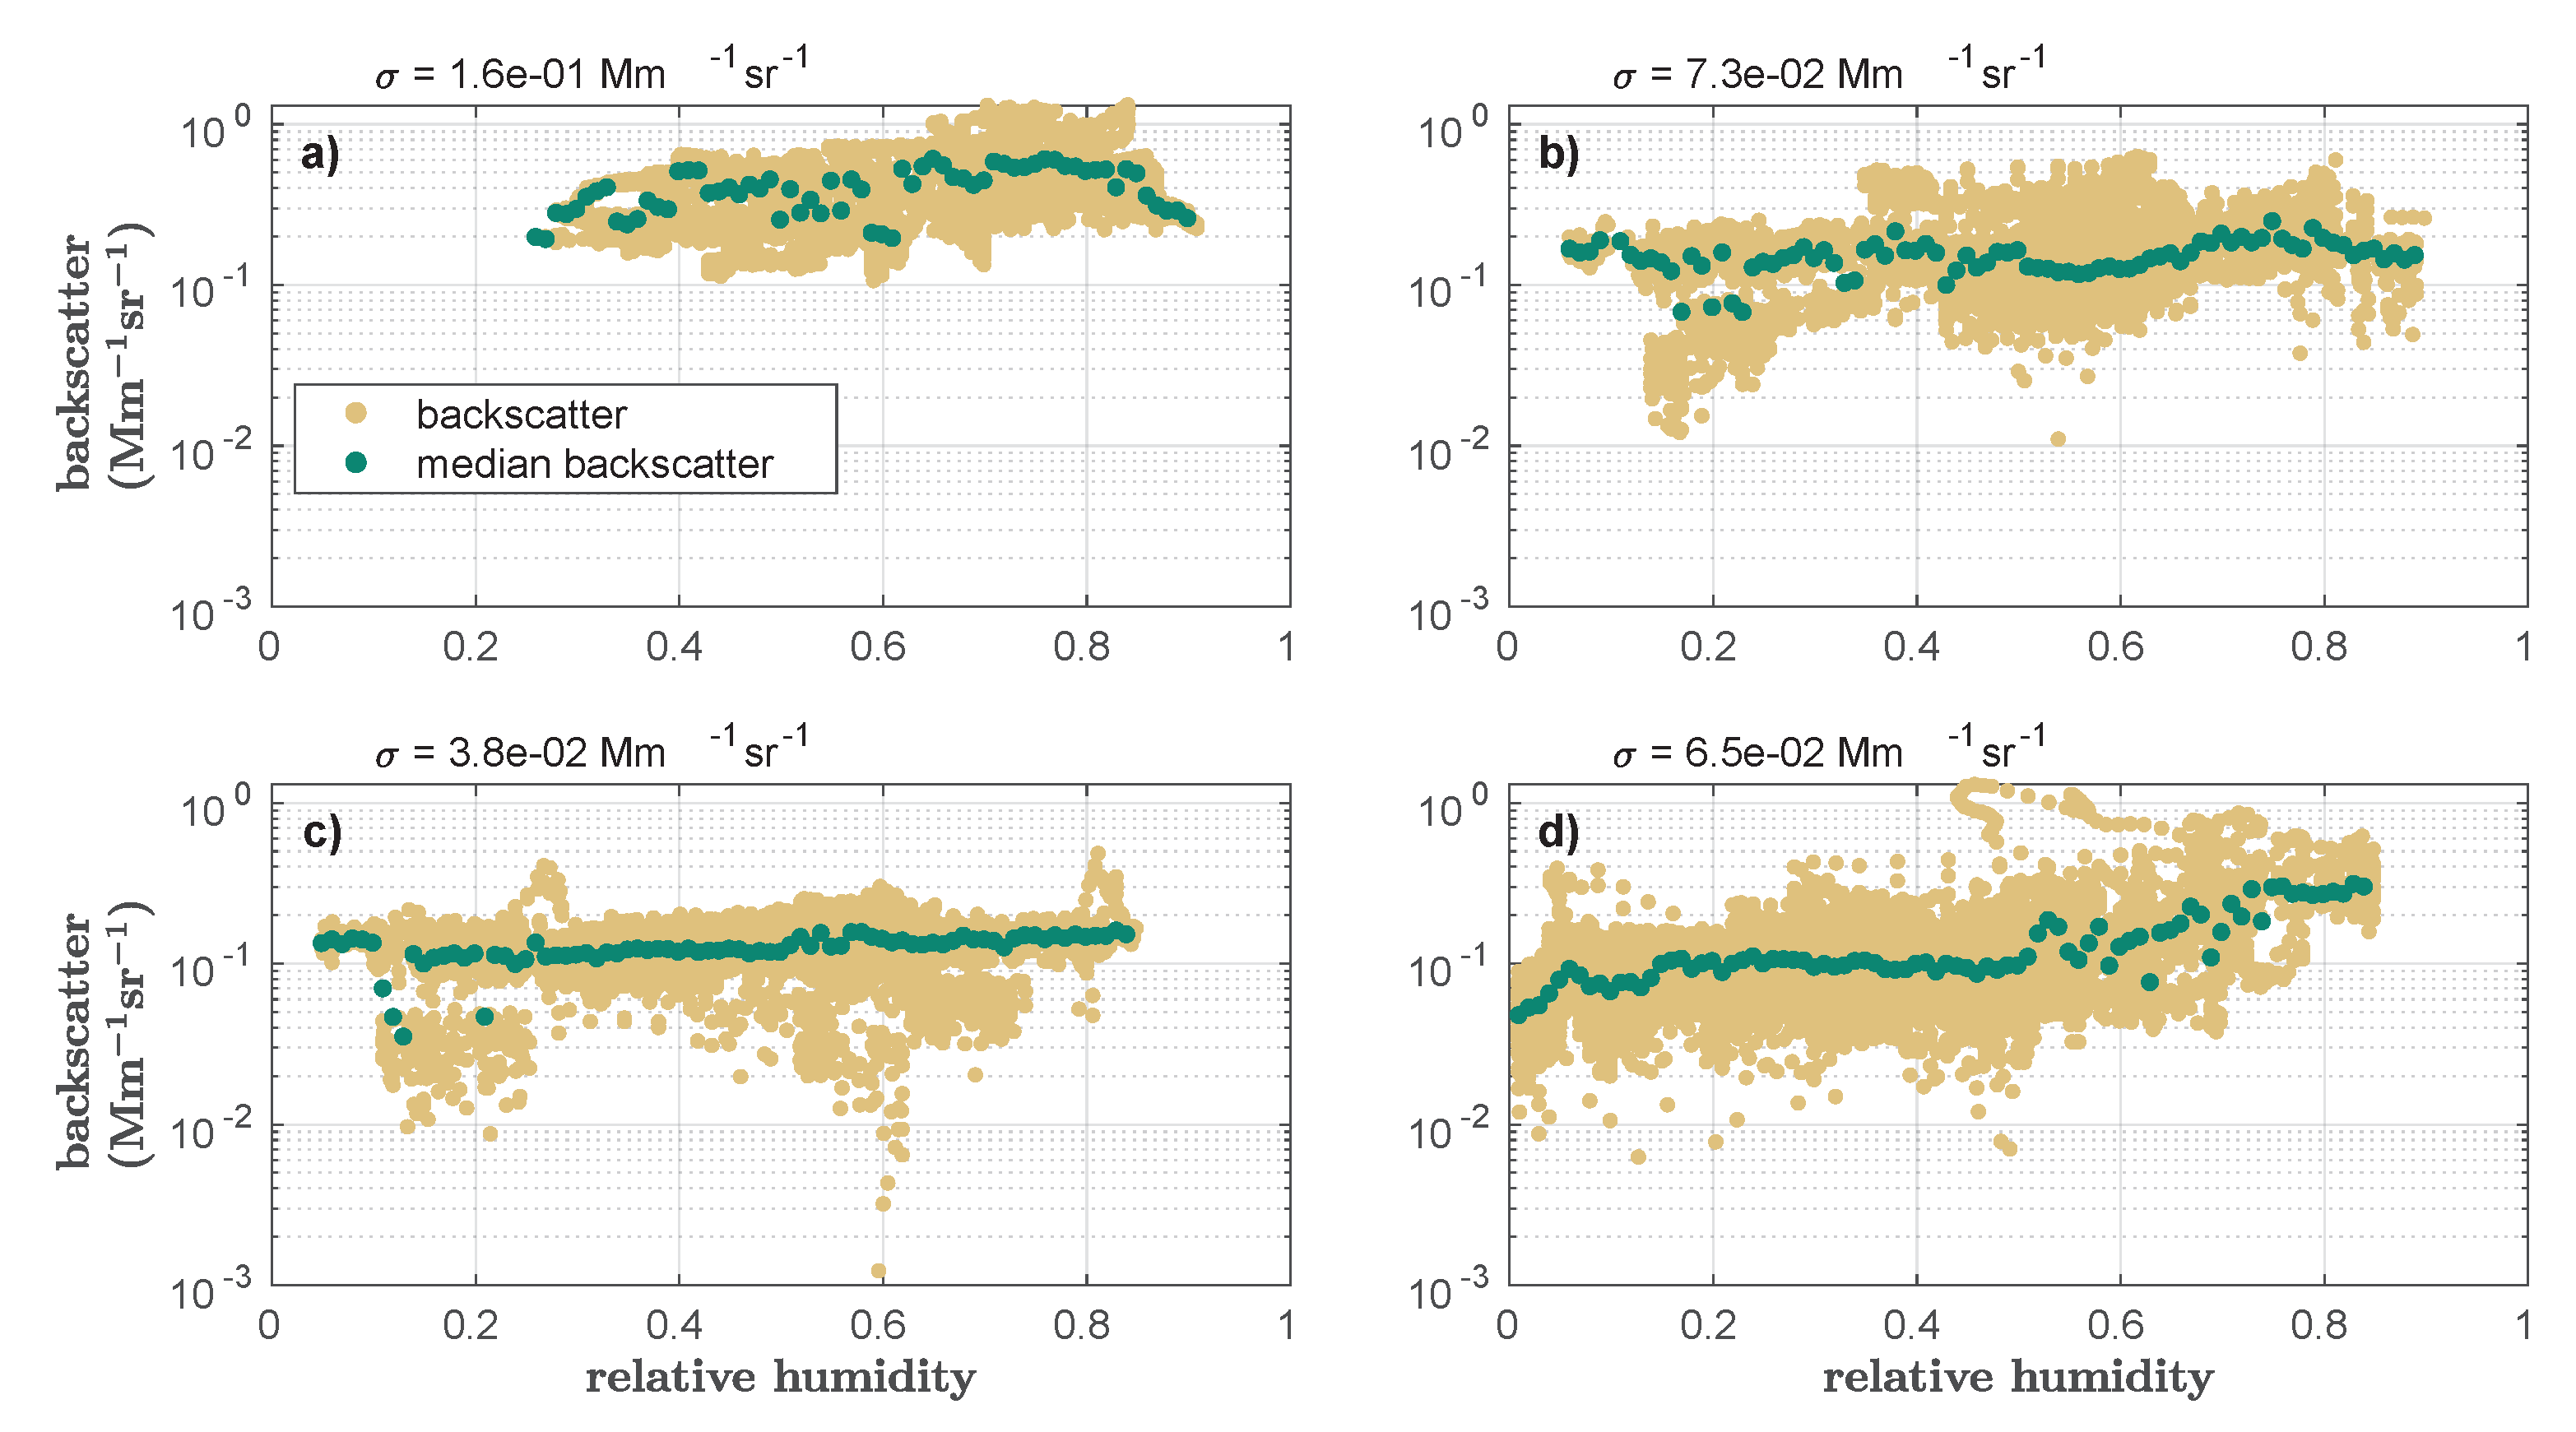
- Generally we found in different seasons two modes of stronger (, only missing during forest fire season) and weaker () hygroscopicity. Only during summer, this weakly hygroscopic mode has a higher value. While this hygroscopicity parameter in the present work is based on the aerosol backscatter coefficient, this number may not be directly comparable to the existing literature. However, in the atmospheric column the aerosol may, on average, be less hygroscopic than previously derived by ground-based measurements.
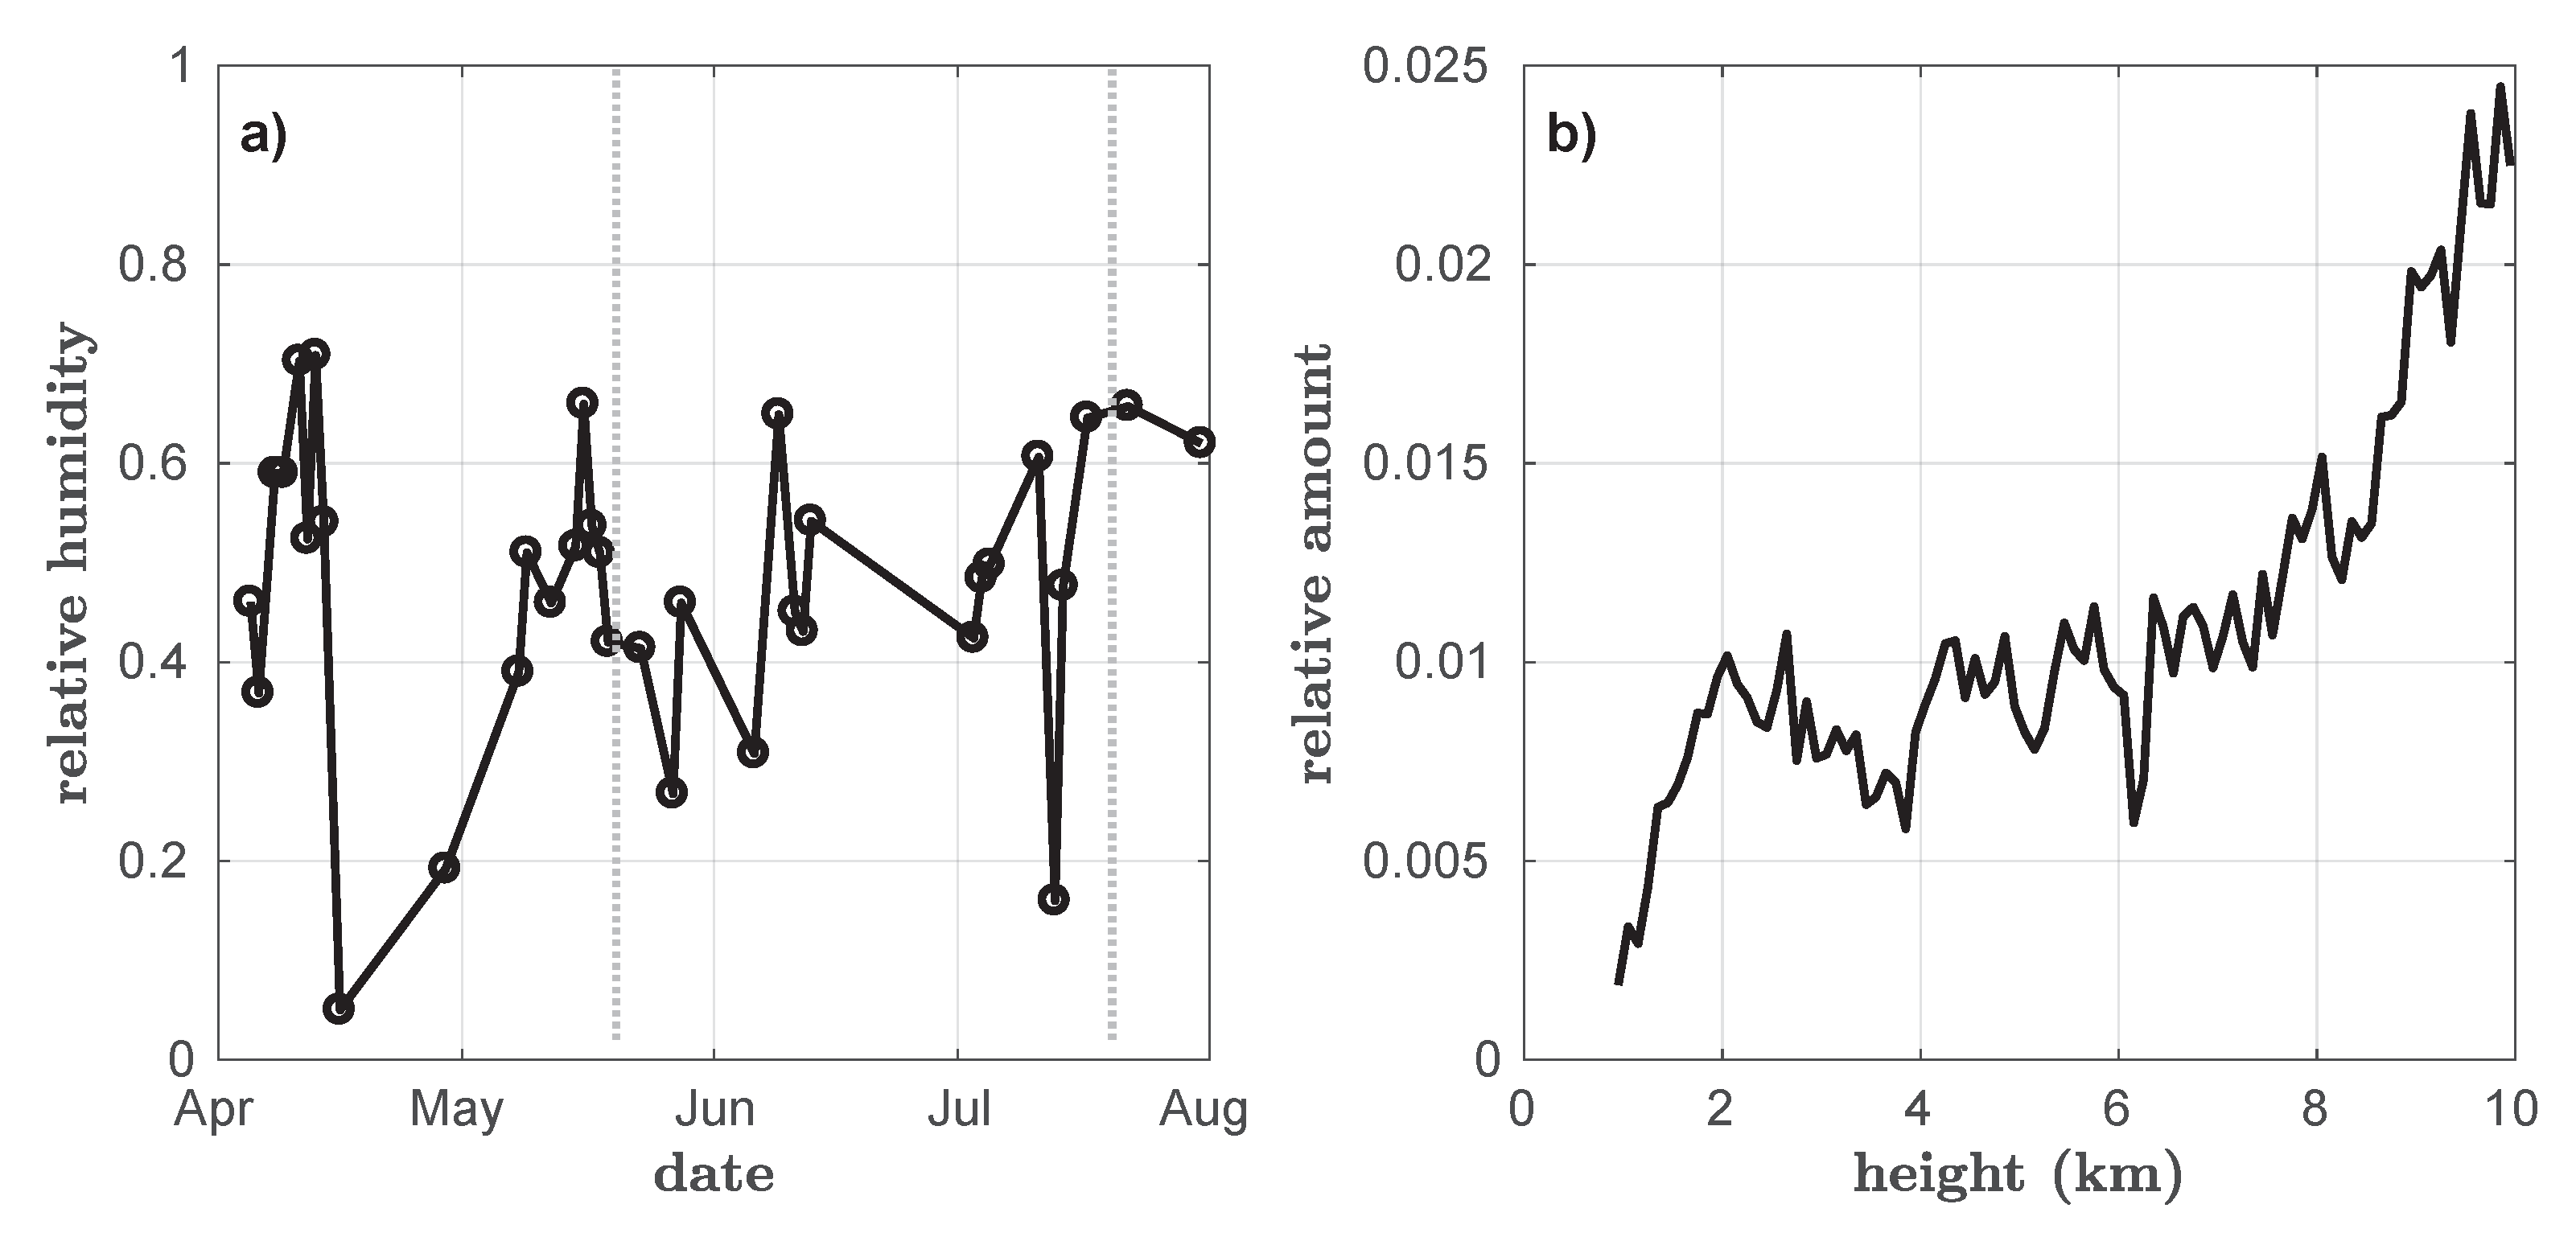
- An interplay of processes causes the vertical trend in hygroscopicity to be complex. We found higher hygroscopicity and high relative humidity in the lowest altitude, but cannot say whether this is due to different chemical composition or due to orographic effects. In the middle troposphere, the hygroscopicity is reduced, maybe because the probability of having aerosol that never encountered moist conditions is the highest. Finally, in the upper free troposphere highly hygroscopic aerosol was found. These particles must have been lifted up and hence the surrounding air had apparently cooled to saturation level prior to its advection towards the Arctic.
Author Contributions
Funding
Acknowledgments
Conflicts of Interest
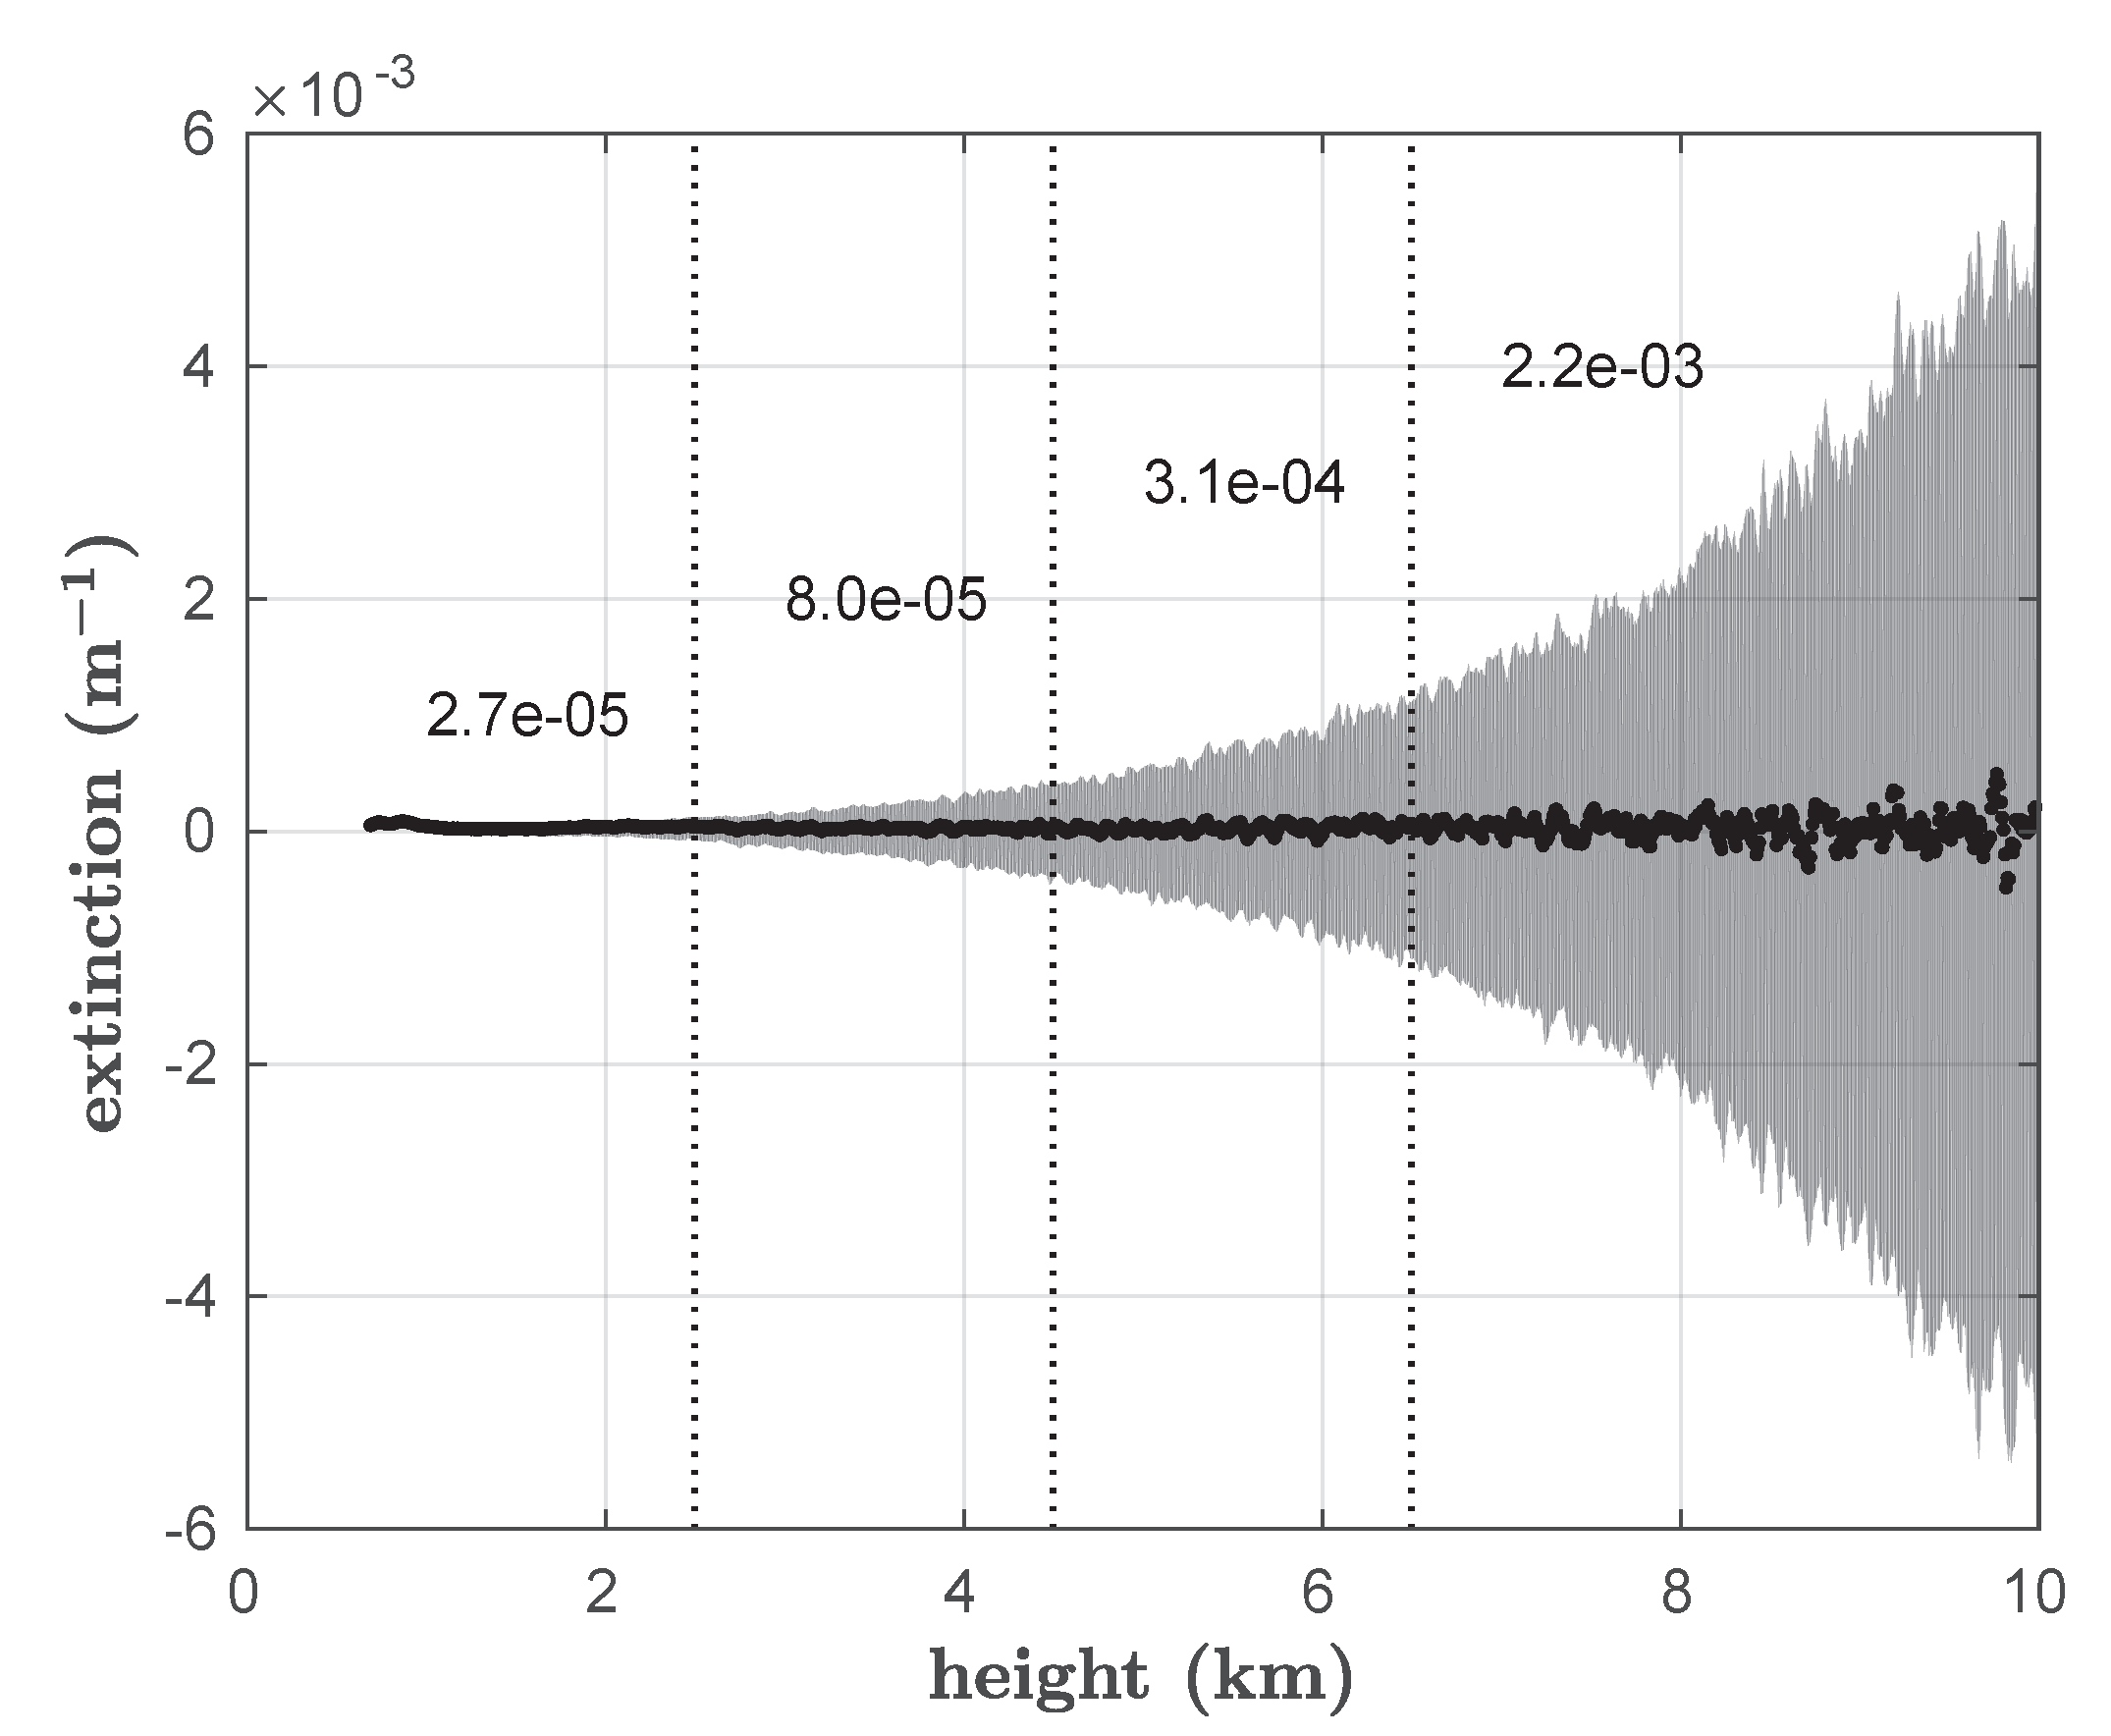
Appendix A. Sensitivity study: Amplifying Noise in the Extinction Coefficient with Altitude
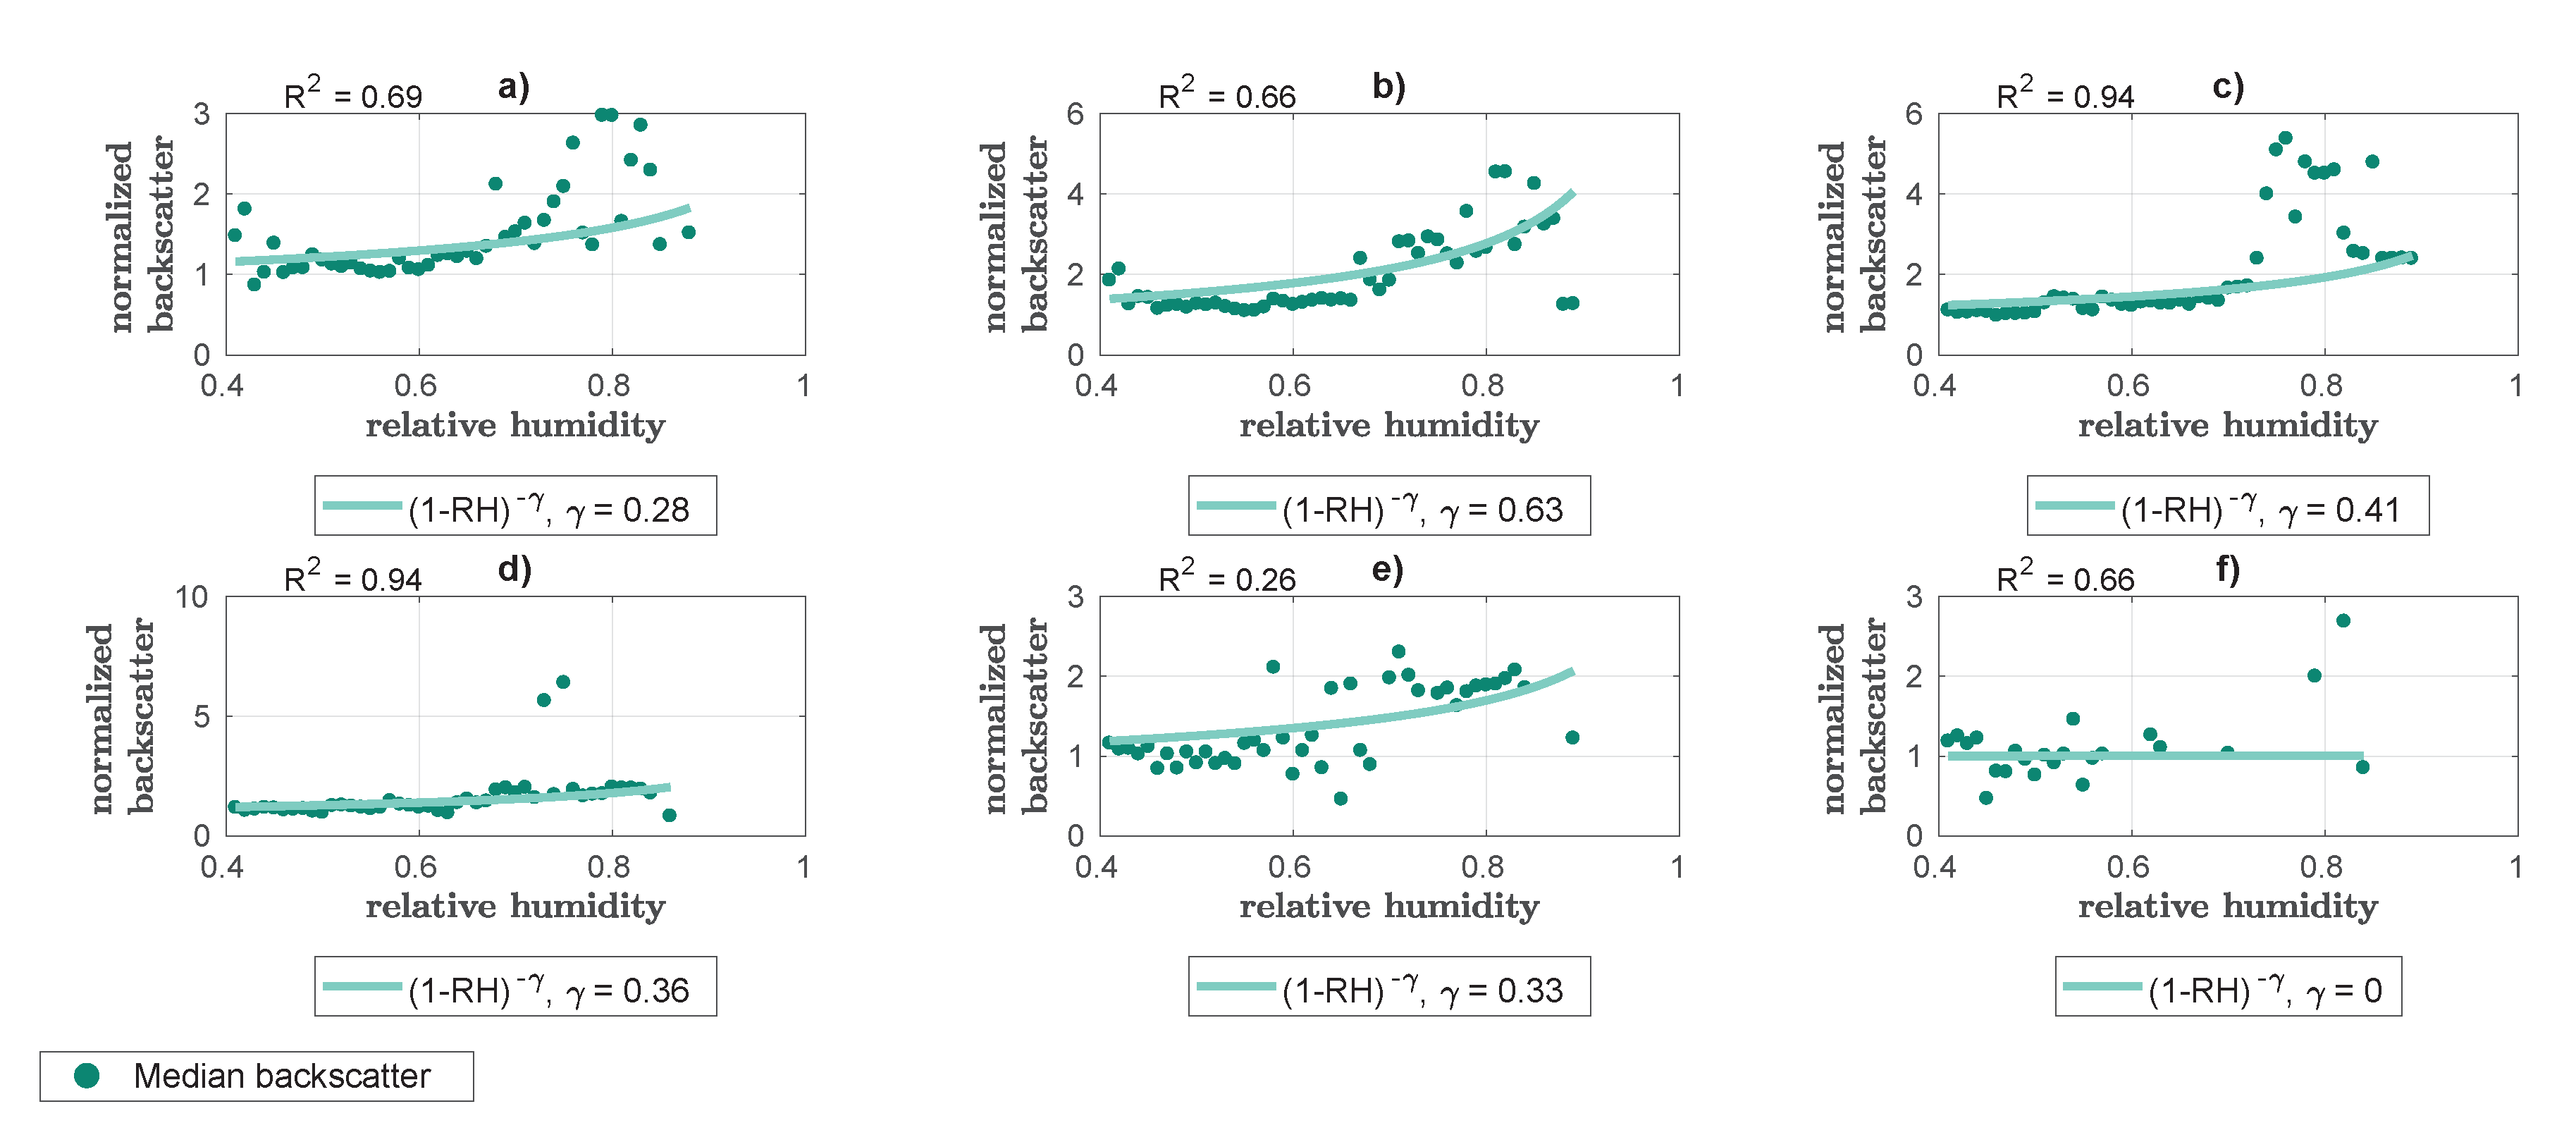
Appendix B. Fitted Growth curve for the Color Ratio classified sub dataset using larger intervals of spacing 1.0
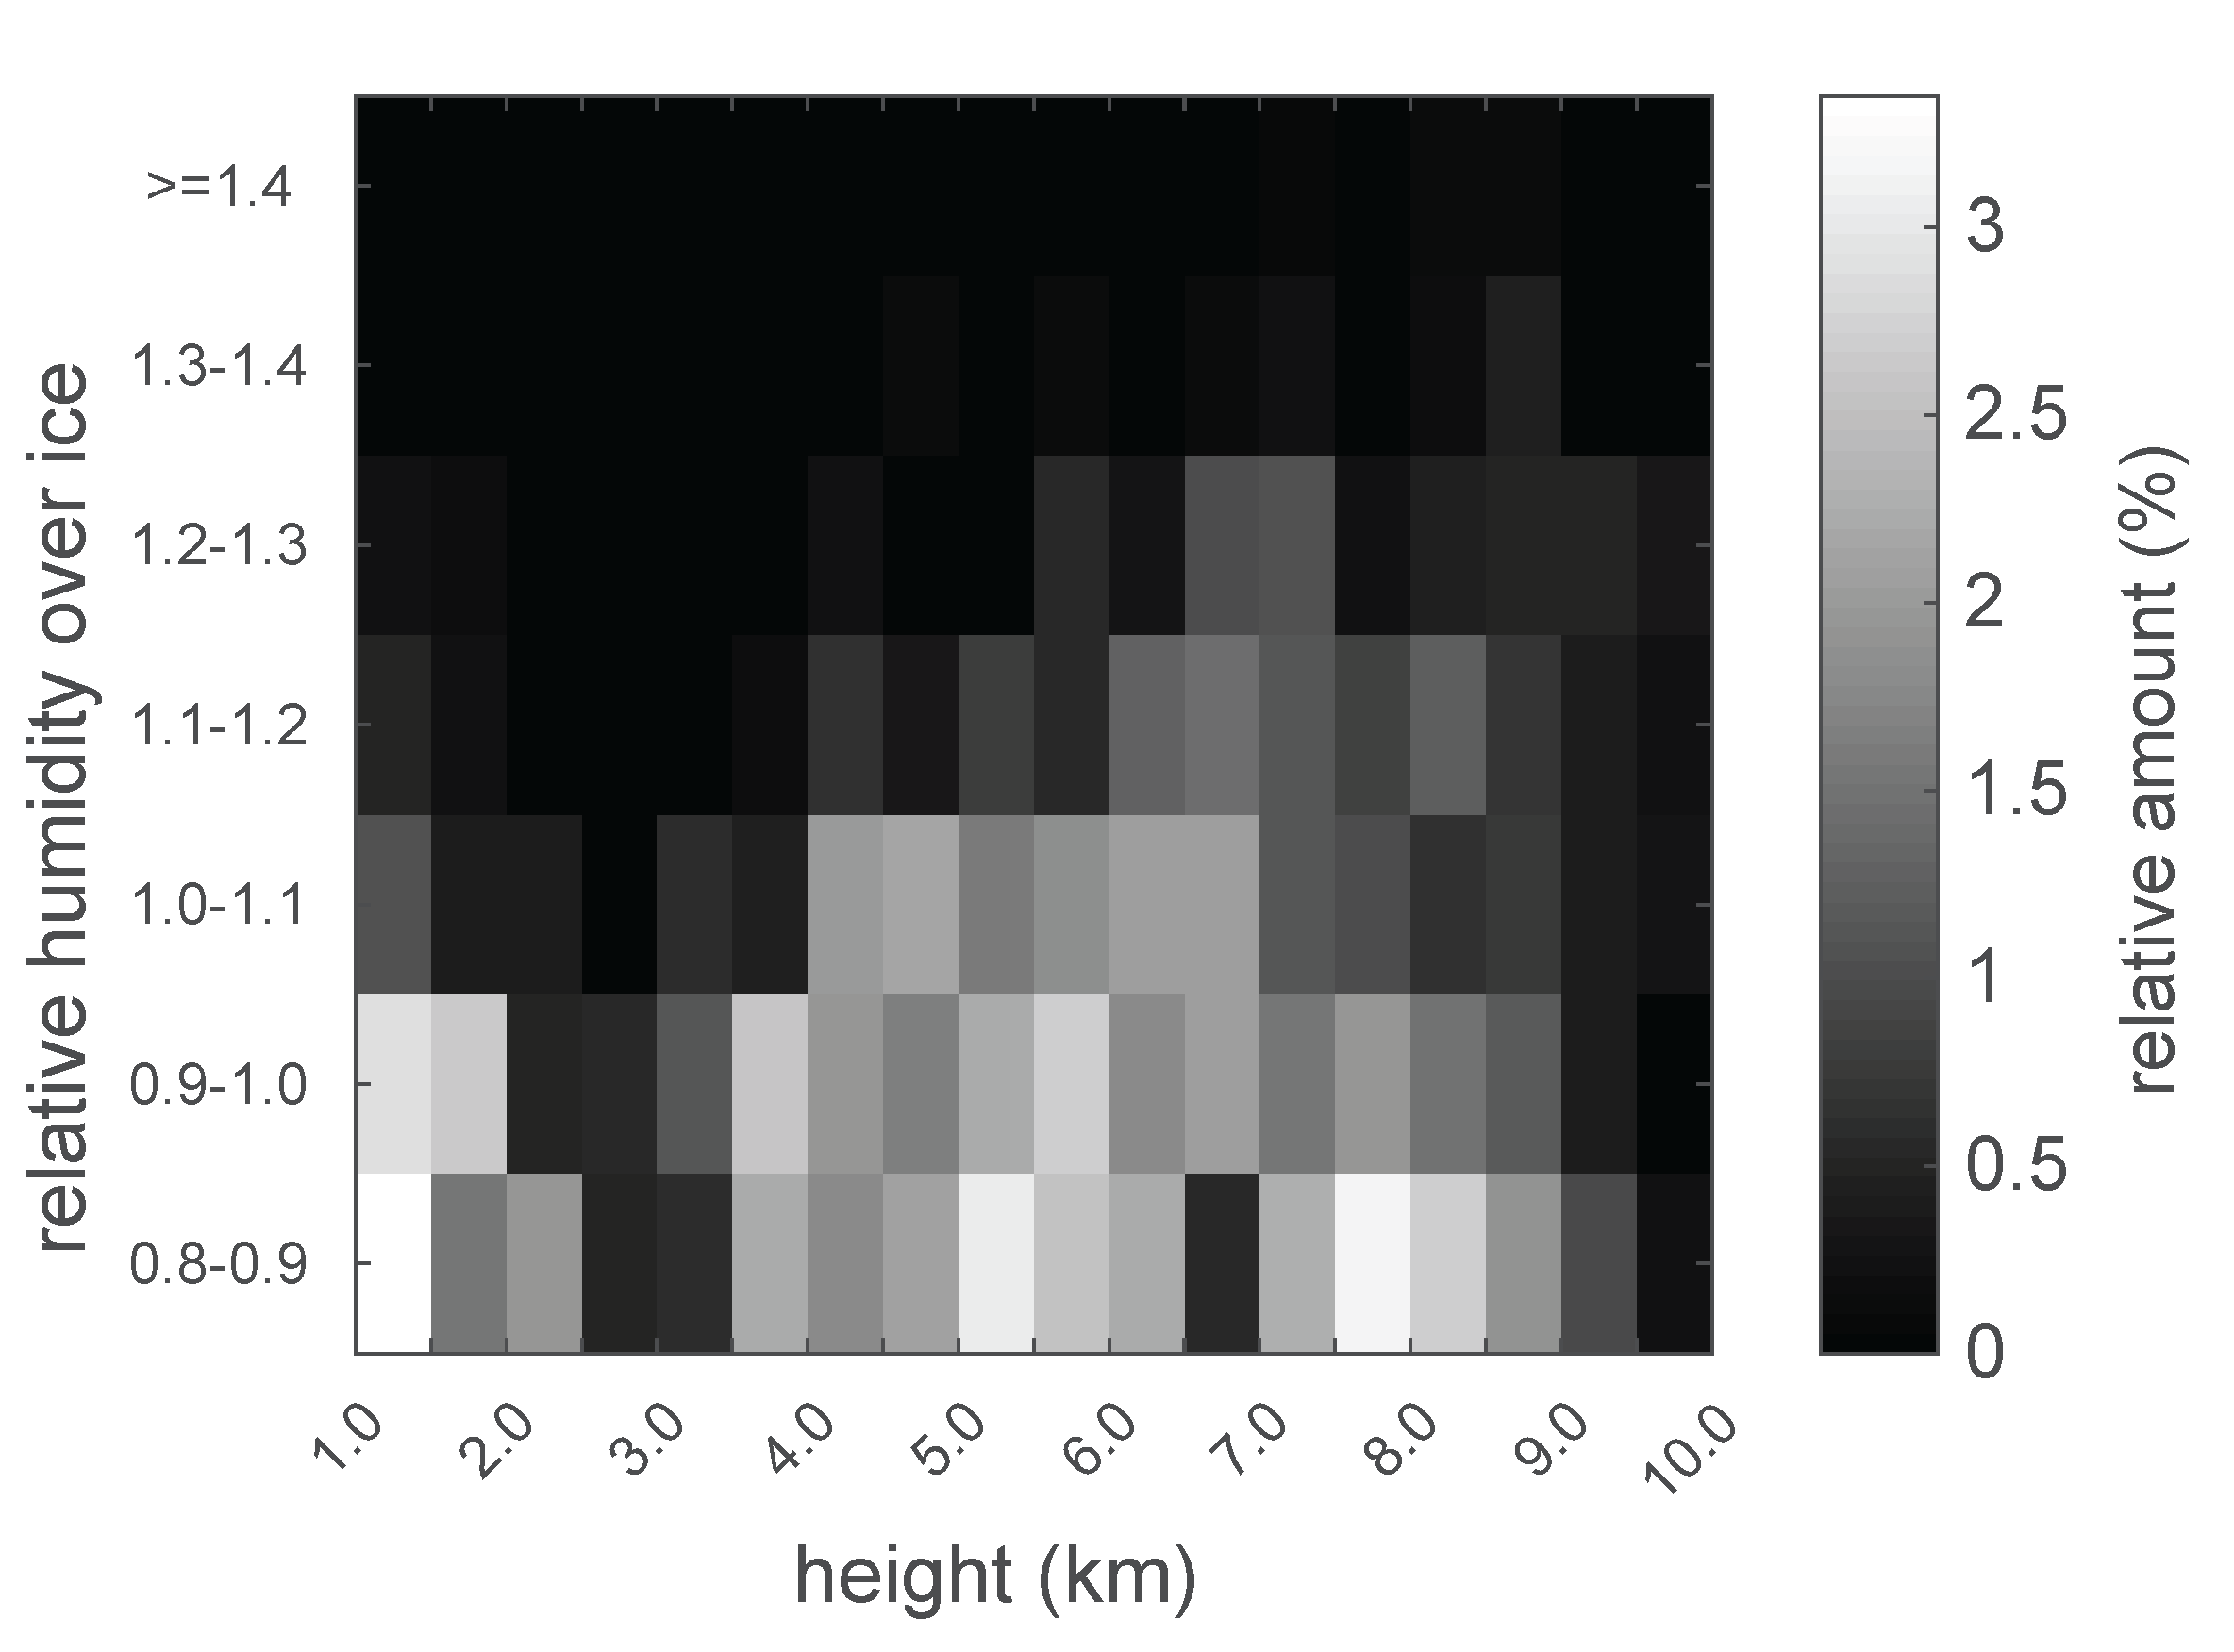
Appendix C. Discussion on the importance of relative humidity over ice in this work
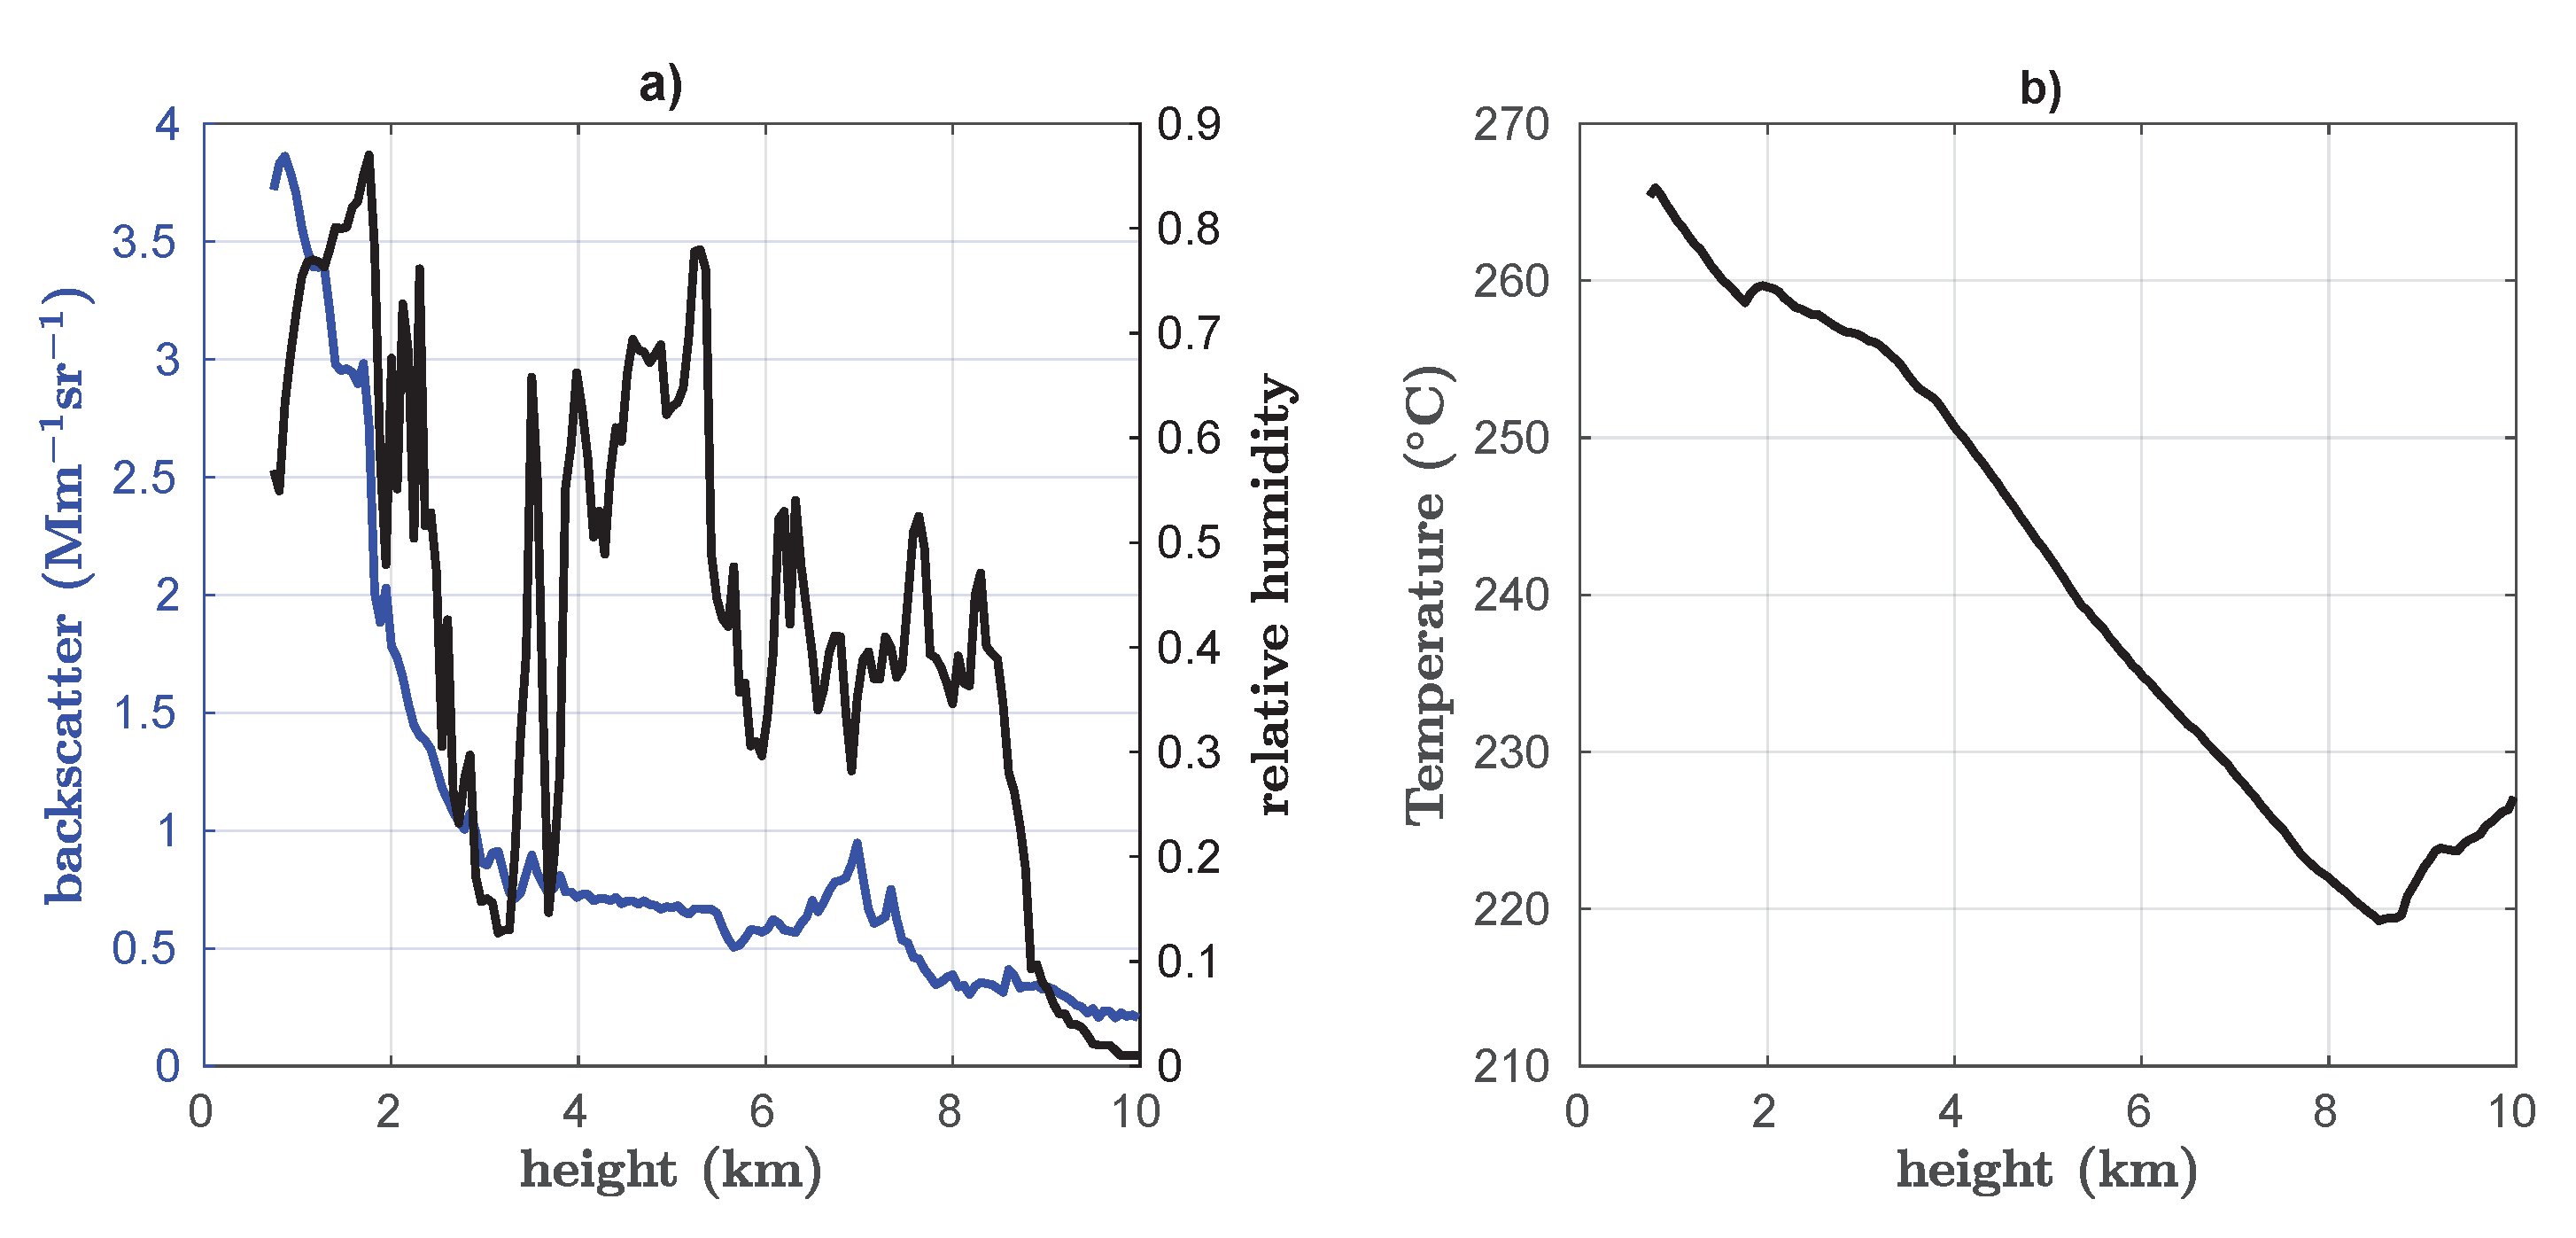
Appendix D. Backscatter, Relative Humidity and Temperature Profiles on the 23rd of May 2021
References
- Maturilli, M.; Herber, A.; König-Langlo, G. Surface radiation climatology for Ny-Ålesund, Svalbard (78.9 N), basic observations for trend detection. Theoretical and Applied Climatology 2015, 120, 331–339. [Google Scholar] [CrossRef]
- Wendisch, M.; Brückner, M.; Crewell, S.; Ehrlich, A.; Notholt, J.; Lüpkes, C.; Macke, A.; Burrows, J.; Rinke, A.; Quaas, J.; others. Atmospheric and surface processes, and feedback mechanisms determining Arctic amplification: A review of first results and prospects of the (AC) 3 project. Bulletin of the American Meteorological Society 2023, 104, E208–E242. [Google Scholar] [CrossRef]
- Serreze, M.C.; Barry, R.G. Processes and impacts of Arctic amplification: A research synthesis. Global and Planetary Change 2011, 77, 85–96. [Google Scholar] [CrossRef]
- Previdi, M.; Smith, K.L.; Polvani, L.M. Arctic amplification of climate change: a review of underlying mechanisms. Environmental Research Letters 2021, 16, 093003. [Google Scholar] [CrossRef]
- Stjern, C.W.; Lund, M.T.; Samset, B.H.; Myhre, G.; Forster, P.M.; Andrews, T.; Boucher, O.; Faluvegi, G.; Fläschner, D.; Iversen, T.; Kasoar, M.; Kharin, V.; Kirkevåg, A.; Lamarque, J.F.; Olivié, D.; Richardson, T.; Sand, M.; Shawki, D.; Shindell, D.; Smith, C.J.; Takemura, T.; Voulgarakis, A. Arctic Amplification Response to Individual Climate Drivers. Journal of Geophysical Research: Atmospheres 2019, 124, 6698–6717. [Google Scholar] [CrossRef]
- J. Schmale, P. Zieger, A. Aerosols in current and future Arctic climate. Nat. Clim. Change 2021, 11, 95–105. [Google Scholar] [CrossRef]
- Creamean, J.M.; Barry, K.; Hill, T.C.J.; Hume, C.; DeMott, P.J.; Shupe, M.D.; Dahlke, S.; Willmes, S.; Schmale, J.; Beck, I.; Hoppe, C.J.M.; Fong, A.; Chamberlain, E.; Bowman, J.; Scharien, R.; Persson, O. Annual cycle observations of aerosols capable of ice formation in central Arctic clouds. Nature Communications 2022, 13, 3537. [Google Scholar] [CrossRef] [PubMed]
- Li, J.; Carlson, B.E.; Yung, Y.L.; Lv, D.; Hansen, J.; Penner, J.E.; Liao, H.; Ramaswamy, V.; Kahn, R.A.; Zhang, P.; Dubovik, O.; Ding, A.; Lacis, A.A.; Zhang, L.; Dong, Y. Scattering and absorbing aerosols in the climate system. Nature Reviews Earth & Environment 2022, 3, 363–379. [Google Scholar] [CrossRef]
- Quinn, P.K.; Shaw, G.; Andrews, E.; Dutton, E.; Ruoho-Airola, T.; Gong, S. Arctic haze: current trends and knowledge gaps. Tellus B: Chemical and Physical Meteorology 2007, 59, 99–114. [Google Scholar] [CrossRef]
- Stohl, A. Characteristics of atmospheric transport into the Arctic troposphere. Journal of Geophysical Research: Atmospheres 2006, 111. [https://agupubs.onlinelibrary.wiley.com/doi/pdf/10.1029/2005JD006888]. [Google Scholar] [CrossRef]
- Zielinski, T.; Bolzacchini, E.; Cataldi, M.; Ferrero, L.; Graßl, S.; Hansen, G.; Mateos, D.; Mazzola, M.; Neuber, R.; Pakszys, P.; others. Study of chemical and optical properties of biomass burning aerosols during long-range transport events toward the arctic in summer 2017. Atmosphere 2020, 11, 84. [Google Scholar] [CrossRef]
- Udisti, R.; Bazzano, A.; Becagli, S.; Bolzacchini, E.; Caiazzo, L.; Cappelletti, D.; Ferrero, L.; Frosini, D.; Giardi, F.; Grotti, M.; others. Sulfate source apportionment in the Ny-Ålesund (Svalbard Islands) Arctic aerosol. Rendiconti Lincei 2016, 27, 85–94. [Google Scholar] [CrossRef]
- Tunved, P.; Ström, J.; Krejci, R. Arctic aerosol life cycle: linking aerosol size distributions observed between 2000 and 2010 with air mass transport and precipitation at Zeppelin station, Ny-Ålesund, Svalbard. Atmospheric Chemistry and Physics 2013, 13, 3643–3660. [Google Scholar] [CrossRef]
- Ritter, C.; Neuber, R.; Schulz, A.; Markowicz, K.; Stachlewska, I.; Lisok, J.; Makuch, P.; Pakszys, P.; Markuszewski, P.; Rozwadowska, A.; others. 2014 iAREA campaign on aerosol in Spitsbergen–Part 2: Optical properties from Raman-lidar and in-situ observations at Ny-Ålesund. Atmospheric environment 2016, 141, 1–19. [Google Scholar] [CrossRef]
- Platt, S.M.; Hov; Berg, T.; Breivik, K.; Eckhardt, S.; Eleftheriadis, K.; Evangeliou, N.; Fiebig, M.; Fisher, R.; Hansen, G.; others. Atmospheric composition in the European Arctic and 30 years of the Zeppelin Observatory, Ny-Ålesund. Atmospheric Chemistry and Physics Discussions 2021, 2021, 1–80. [Google Scholar]
- Graßl, S.; Ritter, C. Properties of arctic aerosol based on sun photometer long-term measurements in Ny-Ålesund, Svalbard. Remote Sensing 2019, 11, 1362. [Google Scholar] [CrossRef]
- Ferrero, L.; Ritter, C.; Cappelletti, D.; Moroni, B.; Močnik, G.; Mazzola, M.; Lupi, A.; Becagli, S.; Traversi, R.; Cataldi, M.; others. Aerosol optical properties in the Arctic: The role of aerosol chemistry and dust composition in a closure experiment between Lidar and tethered balloon vertical profiles. Science of the total environment 2019, 686, 452–467. [Google Scholar] [CrossRef] [PubMed]
- Schmale, J.; Baccarini, A. Progress in Unraveling Atmospheric New Particle Formation and Growth Across the Arctic. Geophysical Research Letters 2021, 48, e2021GL094198. [Google Scholar] [CrossRef]
- Nakoudi, K.; Ritter, C.; Böckmann, C.; Kunkel, D.; Eppers, O.; Rozanov, V.; Mei, L.; Pefanis, V.; Jäkel, E.; Herber, A.; Maturilli, M.; Neuber, R. Does the Intra-Arctic Modification of Long-Range Transported Aerosol Affect the Local Radiative Budget? (A Case Study). Remote Sensing 2020, 12. [Google Scholar] [CrossRef]
- Johnson, J.S.; Regayre, L.A.; Yoshioka, M.; Pringle, K.J.; Turnock, S.T.; Browse, J.; Sexton, D.M.H.; Rostron, J.W.; Schutgens, N.A.J.; Partridge, D.G.; Liu, D.; Allan, J.D.; Coe, H.; Ding, A.; Cohen, D.D.; Atanacio, A.; Vakkari, V.; Asmi, E.; Carslaw, K.S. Robust observational constraint of uncertain aerosol processes and emissions in a climate model and the effect on aerosol radiative forcing. Atmospheric Chemistry and Physics 2020, 20, 9491–9524. [Google Scholar] [CrossRef]
- Tang, I.N. Chemical and size effects of hygroscopic aerosols on light scattering coefficients. Journal of Geophysical Research: Atmospheres 1996, 101, 19245–19250. [Google Scholar] [CrossRef]
- Gassó, S.; Hegg, D.A.; Covert, D.S.; Collins, D.; Noone, K.J.; Öström, E.; Schmid, B.; Russell, P.B.; Livingston, J.M.; Durkee, P.A.; Jonsson, H. Influence of humidity on the aerosol scattering coefficient and its effect on the upwelling radiance during ACE-2. Tellus B: Chemical and Physical Meteorology 2000. [CrossRef]
- Vu, T.V.; Shi, Z.; Harrison, R.M. Estimation of hygroscopic growth properties of source-related sub-micrometre particle types in a mixed urban aerosol. npj Climate and Atmospheric Science 2021, 4, 21. [Google Scholar] [CrossRef]
- Zieger, P.; Fierz-Schmidhauser, R.; Weingartner, E.; Baltensperger, U. Effects of relative humidity on aerosol light scattering: results from different European sites. Atmospheric Chemistry and Physics 2013, 13, 10609–10631. [Google Scholar] [CrossRef]
- Zieger, P.; Fierz-Schmidhauser, R.; Gysel, M.; Ström, J.; Henne, S.; Yttri, K.E.; Baltensperger, U.; Weingartner, E. Effects of relative humidity on aerosol light scattering in the Arctic. Atmospheric Chemistry and Physics 2010, 10, 3875–3890. [Google Scholar] [CrossRef]
- Rastak, N.; Silvergren, S.; Zieger, P.; Wideqvist, U.; Ström, J.; Svenningsson, B.; Maturilli, M.; Tesche, M.; Ekman, A.M.L.; Tunved, P.; Riipinen, I. Seasonal variation of aerosol water uptake and its impact on the direct radiative effect at Ny-Ålesund, Svalbard. Atmospheric Chemistry and Physics 2014, 14, 7445–7460. [Google Scholar] [CrossRef]
- Hoffmann, A. Comparative aerosol studies based on multi-wavelength Raman LIDAR at Ny-Ålesund, Spitsbergen. doctoralthesis, Universität Potsdam, 2011.
- Maturilli, M.; Kayser, M. Arctic warming, moisture increase and circulation changes observed in the Ny-Ålesund homogenized radiosonde record. Theoretical and Applied Climatology 2017, 130, 1–17. [Google Scholar] [CrossRef]
- Ansmann, A.; Wandinger, U.; Riebesell, M.; Weitkamp, C.; Michaelis, W. Independent measurement of extinction and backscatter profiles in cirrus clouds by using a combined Raman elastic-backscatter lidar. Appl. Opt. 1992, 31, 7113–7131. [Google Scholar] [CrossRef] [PubMed]
- Klett, J.D. Lidar inversion with variable backscatter/extinction ratios. Appl. Opt. 1985, 24, 1638–1643. [Google Scholar] [CrossRef] [PubMed]
- Shibata, T.; Shiraishi, K.; Shiobara, M.; Iwasaki, S.; Takano, T. Seasonal Variations in High Arctic Free Tropospheric Aerosols Over Ny-Ålesund, Svalbard, Observed by Ground-Based Lidar. Journal of Geophysical Research: Atmospheres 2018, 123, 12–353. [Google Scholar] [CrossRef]
- Nakoudi, K.; Stachlewska, I.S.; Ritter, C. An extended lidar-based cirrus cloud retrieval scheme: first application over an Arctic site. Opt. Express 2021, 29, 8553–8580. [Google Scholar] [CrossRef] [PubMed]
- Vu, T.V.; Delgado-Saborit, J.M.; Harrison, R.M. A review of hygroscopic growth factors of submicron aerosols from different sources and its implication for calculation of lung deposition efficiency of ambient aerosols. Air Quality, Atmosphere & Health 2015, 8, 429–440. [Google Scholar] [CrossRef]
- Swietlicki, E.; Hansson, H.C.; Hämeri, K.; Svenningsson, B.; Massling, A.; Mcfiggans, G.; Mcmurry, P.H.; Petäjä, T.; Tunved, P.; Gysel, M.; Topping, D.; Weingartner, E.; Baltensperger, U.; Rissler, J.; Wiedensohler, A.; Kulmala, M. Hygroscopic properties of submicrometer atmospheric aerosol particles measured with H-TDMA instruments in various environments—a review. Tellus B: Chemical and Physical Meteorology 2008, 60, 432–469. [Google Scholar] [CrossRef]
- Dube, J.; Böckmann, C.; Ritter, C. Lidar-Derived Aerosol Properties from Ny-Ålesund, Svalbard during the MOSAiC Spring 2020. Remote Sensing 2022, 14. [Google Scholar] [CrossRef]
- Foken, T. Springer Handbook of Atmospheric Measurements, 1 ed.; Springer Cham, 2021. [CrossRef]
- Khattatov, V.; Tyabotov, A.; Alekseev, A. An aircraft lidar method of studying aerosol in the free troposphere over Siberia. Atmospheric research 1997, 44, 89–98. [Google Scholar] [CrossRef]
- Böckmann, C.; Ritter, C.; Graßl, S. Improvement of Aerosol Coarse-Mode Detection through Additional Use of Infrared Wavelengths in the Inversion of Arctic Lidar Data. Remote Sensing 2024, 16, 1576. [Google Scholar] [CrossRef]
- Böckmann, C. Hybrid regularization method for the ill-posed inversion of multiwavelength lidar data in the retrieval of aerosol size distributions. Applied Optics 2001, 40, 1329–1342. [Google Scholar] [CrossRef] [PubMed]
- Sassen, K., Polarization in Lidar. In Lidar: Range-Resolved Optical Remote Sensing of the Atmosphere; Weitkamp, C., Ed.; Springer New York: New York, NY, 2005; pp. 19–42. [CrossRef]
- Quinn, P.K.; Shaw, G.; Andrews, E.; Dutton, E.G.; Ruoho-Airola, T.; Gong, S.L. Arctic haze: current trends and knowledge gaps. Tellus B: Chemical and Physical Meteorology 2007, 59, 99–114. [Google Scholar] [CrossRef]
- Graßl, S.; Ritter, C. Properties of Arctic Aerosol Based on Sun Photometer Long-Term Measurements in Ny-Ålesund, Svalbard. Remote Sensing 2019, 11. [Google Scholar] [CrossRef]
- Herber, A.; Thomason, L.W.; Gernandt, H.; Leiterer, U.; Nagel, D.; Schulz, K.H.; Kaptur, J.; Albrecht, T.; Notholt, J. Continuous day and night aerosol optical depth observations in the Arctic between 1991 and 1999. Journal of Geophysical Research: Atmospheres 2002, 107, AAC–6. [Google Scholar] [CrossRef]
- Schmeisser, L.; Backman, J.; Ogren, J.A.; Andrews, E.; Asmi, E.; Starkweather, S.; Uttal, T.; Fiebig, M.; Sharma, S.; Eleftheriadis, K.; et al. Seasonality of aerosol optical properties in the Arctic. Atmospheric Chemistry and Physics 2018, 18, 11599–11622. [Google Scholar] [CrossRef]
- Koffi, B.; Schulz, M.; Bréon, F.M.; Dentener, F.; Steensen, B.M.; Griesfeller, J.; Winker, D.; Balkanski, Y.; Bauer, S.E.; Bellouin, N.; et al. Evaluation of the aerosol vertical distribution in global aerosol models through comparison against CALIOP measurements: AeroCom phase II results. Journal of Geophysical Research: Atmospheres 2016, 121, 7254–7283. [Google Scholar] [CrossRef] [PubMed]
- Tomasi, C.; Kokhanovsky, A.A.; Lupi, A.; Ritter, C.; Smirnov, A.; O’Neill, N.T.; Stone, R.S.; Holben, B.N.; Nyeki, S.; Wehrli, C.; et al. Aerosol remote sensing in polar regions. Earth-Science Reviews 2015, 140, 108–157. [Google Scholar] [CrossRef]
- Rader, F.; Traversi, R.; Severi, M.; Becagli, S.; Müller, K.J.; Nakoudi, K.; Ritter, C. Overview of Aerosol Properties in the European Arctic in Spring 2019 Based on In Situ Measurements and Lidar Data. Atmosphere 2021, 12. [Google Scholar] [CrossRef]
- Dall’Osto, M.; Beddows, D.C.; Tunved, P.; Harrison, R.M.; Lupi, A.; Vitale, V.; Becagli, S.; Traversi, R.; Park, K.T.; Yoon, Y.J.; others. Simultaneous measurements of aerosol size distributions at three sites in the European high Arctic. Atmospheric Chemistry and Physics 2019, 19, 7377–7395. [Google Scholar] [CrossRef]
- Rissler, J.; Vestin, A.; Swietlicki, E.; Fisch, G.; Zhou, J.; Artaxo, P.; Andreae, M.O. Size distribution and hygroscopic properties of aerosol particles from dry-season biomass burning in Amazonia. Atmospheric Chemistry and Physics 2006, 6, 471–491. [Google Scholar] [CrossRef]
- Lathem, T.L.; Beyersdorf, A.J.; Thornhill, K.L.; Winstead, E.L.; Cubison, M.J.; Hecobian, A.; Jimenez, J.L.; Weber, R.J.; Anderson, B.E.; Nenes, A. Analysis of CCN activity of Arctic aerosol and Canadian biomass burning during summer 2008. Atmospheric Chemistry and Physics 2013, 13, 2735–2756. [Google Scholar] [CrossRef]
- Hara, K.; Yamagata, S.; Yamanouchi, T.; Sato, K.; Herber, A.; Iwasaka, Y.; Nagatani, M.; Nakata, H. Mixing states of individual aerosol particles in spring Arctic troposphere during ASTAR 2000 campaign. Journal of Geophysical Research: Atmospheres 2003, 108. [Google Scholar] [CrossRef]
- Schacht, J.; Heinold, B.; Quaas, J.; Backman, J.; Cherian, R.; Ehrlich, A.; Herber, A.; Huang, W.T.K.; Kondo, Y.; Massling, A.; et al. The importance of the representation of air pollution emissions for the modeled distribution and radiative effects of black carbon in the Arctic. Atmospheric Chemistry and Physics 2019, 19, 11159–11183. [Google Scholar] [CrossRef]
- Schrod, J.; Thomson, E.S.; Weber, D.; Kossmann, J.; Pöhlker, C.; Saturno, J.; Ditas, F.; Artaxo, P.; Clouard, V.; Saurel, J.M.; others. Long-term INP measurements from four stations across the globe. Atmospheric Chemistry and Physics Discussions 2020, 2020, 1–37. [Google Scholar]

Disclaimer/Publisher’s Note: The statements, opinions and data contained in all publications are solely those of the individual author(s) and contributor(s) and not of MDPI and/or the editor(s). MDPI and/or the editor(s) disclaim responsibility for any injury to people or property resulting from any ideas, methods, instructions or products referred to in the content. |
© 2024 by the authors. Licensee MDPI, Basel, Switzerland. This article is an open access article distributed under the terms and conditions of the Creative Commons Attribution (CC BY) license (http://creativecommons.org/licenses/by/4.0/).


