Preprint
Article

Comparison between Traditional and Innovative NMR Methods for the Analysis of Sicilian Monovarietal Extra Virgin Olive Oils: Metabolic Profile is Influenced by Micro Pedoclimatic Zones

Altmetrics

Downloads

129

Views

32

Comments

0

A peer-reviewed article of this preprint also exists.

Submitted:

25 July 2024

Posted:

25 July 2024

You are already at the latest version

Alerts
Abstract
The nuclear magnetic resonance (NMR) metabolomic analysis was applied to investigate the differences within nineteen Sicilian Nocellara del Belice mono varietal Extra Virgin Olive Oils (EVOO), grown in two zones different for altitude and soil composition. Several classes of endogenous olive oil metabolites were quantified through a nuclear magnetic resonance (NMR) three-experiment protocol coupled with a yet developed data-processing called MARA-NMR. This method, taking around one-hour experimental time per sample, faces the possible quantification of different class of compounds at different concentration’s range which would require at least three alternative traditional methods. NMR results were compared with the data of traditional analytical methods to quantify free fatty acidity (FFA), fatty acid methyl esters (FAMEs), and total phenol content. The presented NMR methodology is compared with traditional analytical practices and its consistency is also tested through slightly different data treatment. Despite the rich literature about the NMR of EVOOs, the paper points out that there are still several advances potentially improving this general analysis and overcoming the other cumbersome and multi-devices analytical strategies. Monovarietal EVOO’s composition is mainly affected by pedoclimatic conditions in turn relaying upon the nutritional properties, quality, and authenticity. Data collection, analysis and statistical processing are discussed touching the important issues related to the climate changes in Sicily and to the specific influence of pedoclimatic conditions.
Keywords: 
Subject: Chemistry and Materials Science  -   Food Chemistry

1. Introduction

Extra virgin olive oil (EVOO) is the hydrophobic fraction separated by milling drupes of Olea europaea. This fat is widely spread worldwide because of the perfect balance among saturated, mono-unsaturated, and poly-unsaturated fatty acids (SFA, MUFA and PUFA, respectively) [1]. The main benefits of EVOO diets are just partially related to the high content of the MUFA, with respect to the other vegetable oils, because other minor species are certainly involved into key physiological pathways leading to biological effects. Among these, we remind aliphatic and triterpene alcohols, hydrocarbons, volatile compounds, squalene (SQ), sterols, and the list is still opened [2]. Among these, liposoluble phenols are very fashion because of their demonstrated protective action against oxidative stress in vivo and in vitro [3,4,5]. The same chemicals work as EVOOs self-protectors by stretching the famous shelf-life, finally phenolic species drive the organoleptic features (aroma and flavour, especially bitterness) of EVOOs despite their relatively tiny molecular ratio [6,7]. Several analytical techniques were employed to characterize EVOOs, mainly adopting separation devices coupled with very sensitive detectors. The EU commission still consider some of these protocols as the official characterization procedures [8]. Namely, the gas chromatographic separation and the detection though the flame ionization (GC-FID) is chosen for the quantification of the fatty acids which are tough present as glyceryl esters [9]; whereas many triacyl-glycerols (triglycerides) are detected and quantified through the cumbersome high-performance liquid chromatography (HPLC) often coupled with the diode array detector (DAD) and the coupled methylated fatty acid residues are adopted to detect the fatty acid residues [10]. For the minor components such as terpenes and sterols, other GC-FID conditions with different derivatization should be adopted, whereas the minor phenolic species would require another acetonitrile extraction and a different HPLC-DAD run [11]. Therefore, to detect the great variety of chemicals in EVOO many target analytical methodologies have been proposed for the identification and quantification of specific compounds [12]. This is explaining the rapid growth of nuclear magnetic resonance (NMR) studies embracing the holistic approach to characterize the chemical profile of complex mixtures [13]. Despite the claimed low sensitivity, the undeniable quick detection of all the organic species within matrices, without troublesome chemical treatments or separation procedures [14,15], explain the great success of this method for food analysis. We add that the pure quantitative spectral response and direct sampling minimize the many sources of errors, experimental time, and employment of reference standards [16].
Provided that the main challenge is represented by the relative sensitivity limits (respect to a specific compound) [17], unlike the traditional separation methods, NMR spectroscopy simultaneously detects all the organic molecules in the same sample which are distinguished by their physical-chemical properties. In the last decades, many studies successfully demonstrated the wide application of the NMR analysis of vegetable oils and in particular EVOOs [18] even though these were mainly employed to distinguish and cluster samples through multivariate statistical analyses [19], based on different features (cultivar, origin, climatic conditions, etc.) [20,21].
This study explores the ambitious idea to develop an NMR analytical protocol, based on the MARA-NMR algorithm [22], to reach an objective and absolute quantification by NMR of many different chemical species and verify that the NMR quantification is consistent with traditional methods. The NMR metabolomic analysis is applied to investigate the differences within Nocellara del Belice mono varietal EVOOs sampling in two zones different for altitude and soil composition.

2. Results

2.1. Sampling Areas

Figure 1 indicate the rough sampling areas. Part (a) shows differences in altitude between zone L1 (red) which is meanly 250-300 mt highest than L2 (blue). Part (b) shows differences in soil composition Zone L1 (red) is a mix of Brown Soils and Lithosols and Vertosols. Zone L2 (blue) is a mix of Red regosols, Regosoilson Clay Rocks and Alluvial soils. The peculiar territory in Figure 1 offers different elements which are challenging a neat selection of environmental influences on the composition of olive oil. Since the homogeneity of harvesting period and extraction conditions allowed us to analyse the variability of the fatty acid (FA), this is potentially affected by altitude, solar exposure and pedological conditions.

2.2. NMR Metabolic Profile

The whole NMR data processing led to the quantification of metabolites reported in Table 1. The extended table referred to all the analysed samples is then reported in Table A1 and stacked spectra are also reported (Appendix A and Figure A1, A2 and A3). To complete the experimental panel Table A2 displays all the outcomes retrieved by the traditional laboratory procedures. Specific measurements over three replicates for single samples revealed that the deviation on the output values was never over the 6% for the main metabolites and below the 12% for sterols and phenols. Several exchanges with experiments performed with a different number of scans led to similar values by the MARA-NMR algorithm [22] which is further warrantying the general consistency of the method. Beyond the absolute quantification of metabolites in EVOOs, this study is addressed to the detection of the whole metabolic profile which is demonstrated to change according to different environmental conditions. Eliminating some variables could help to reduce collinearity, leading to more stable and reliable model. Indeed, after some trial we have selected sixteen variables which gave a reliable and robust model [23].

2.3. GC vs NMR Comparison

The NMR results are proportional to the molecular relative ratio, whereas traditional techniques usually are set to provide quantification in weight ratio respect to the total matter. This is why we have used the most reasonable conversion parameters in the comparative analyses.
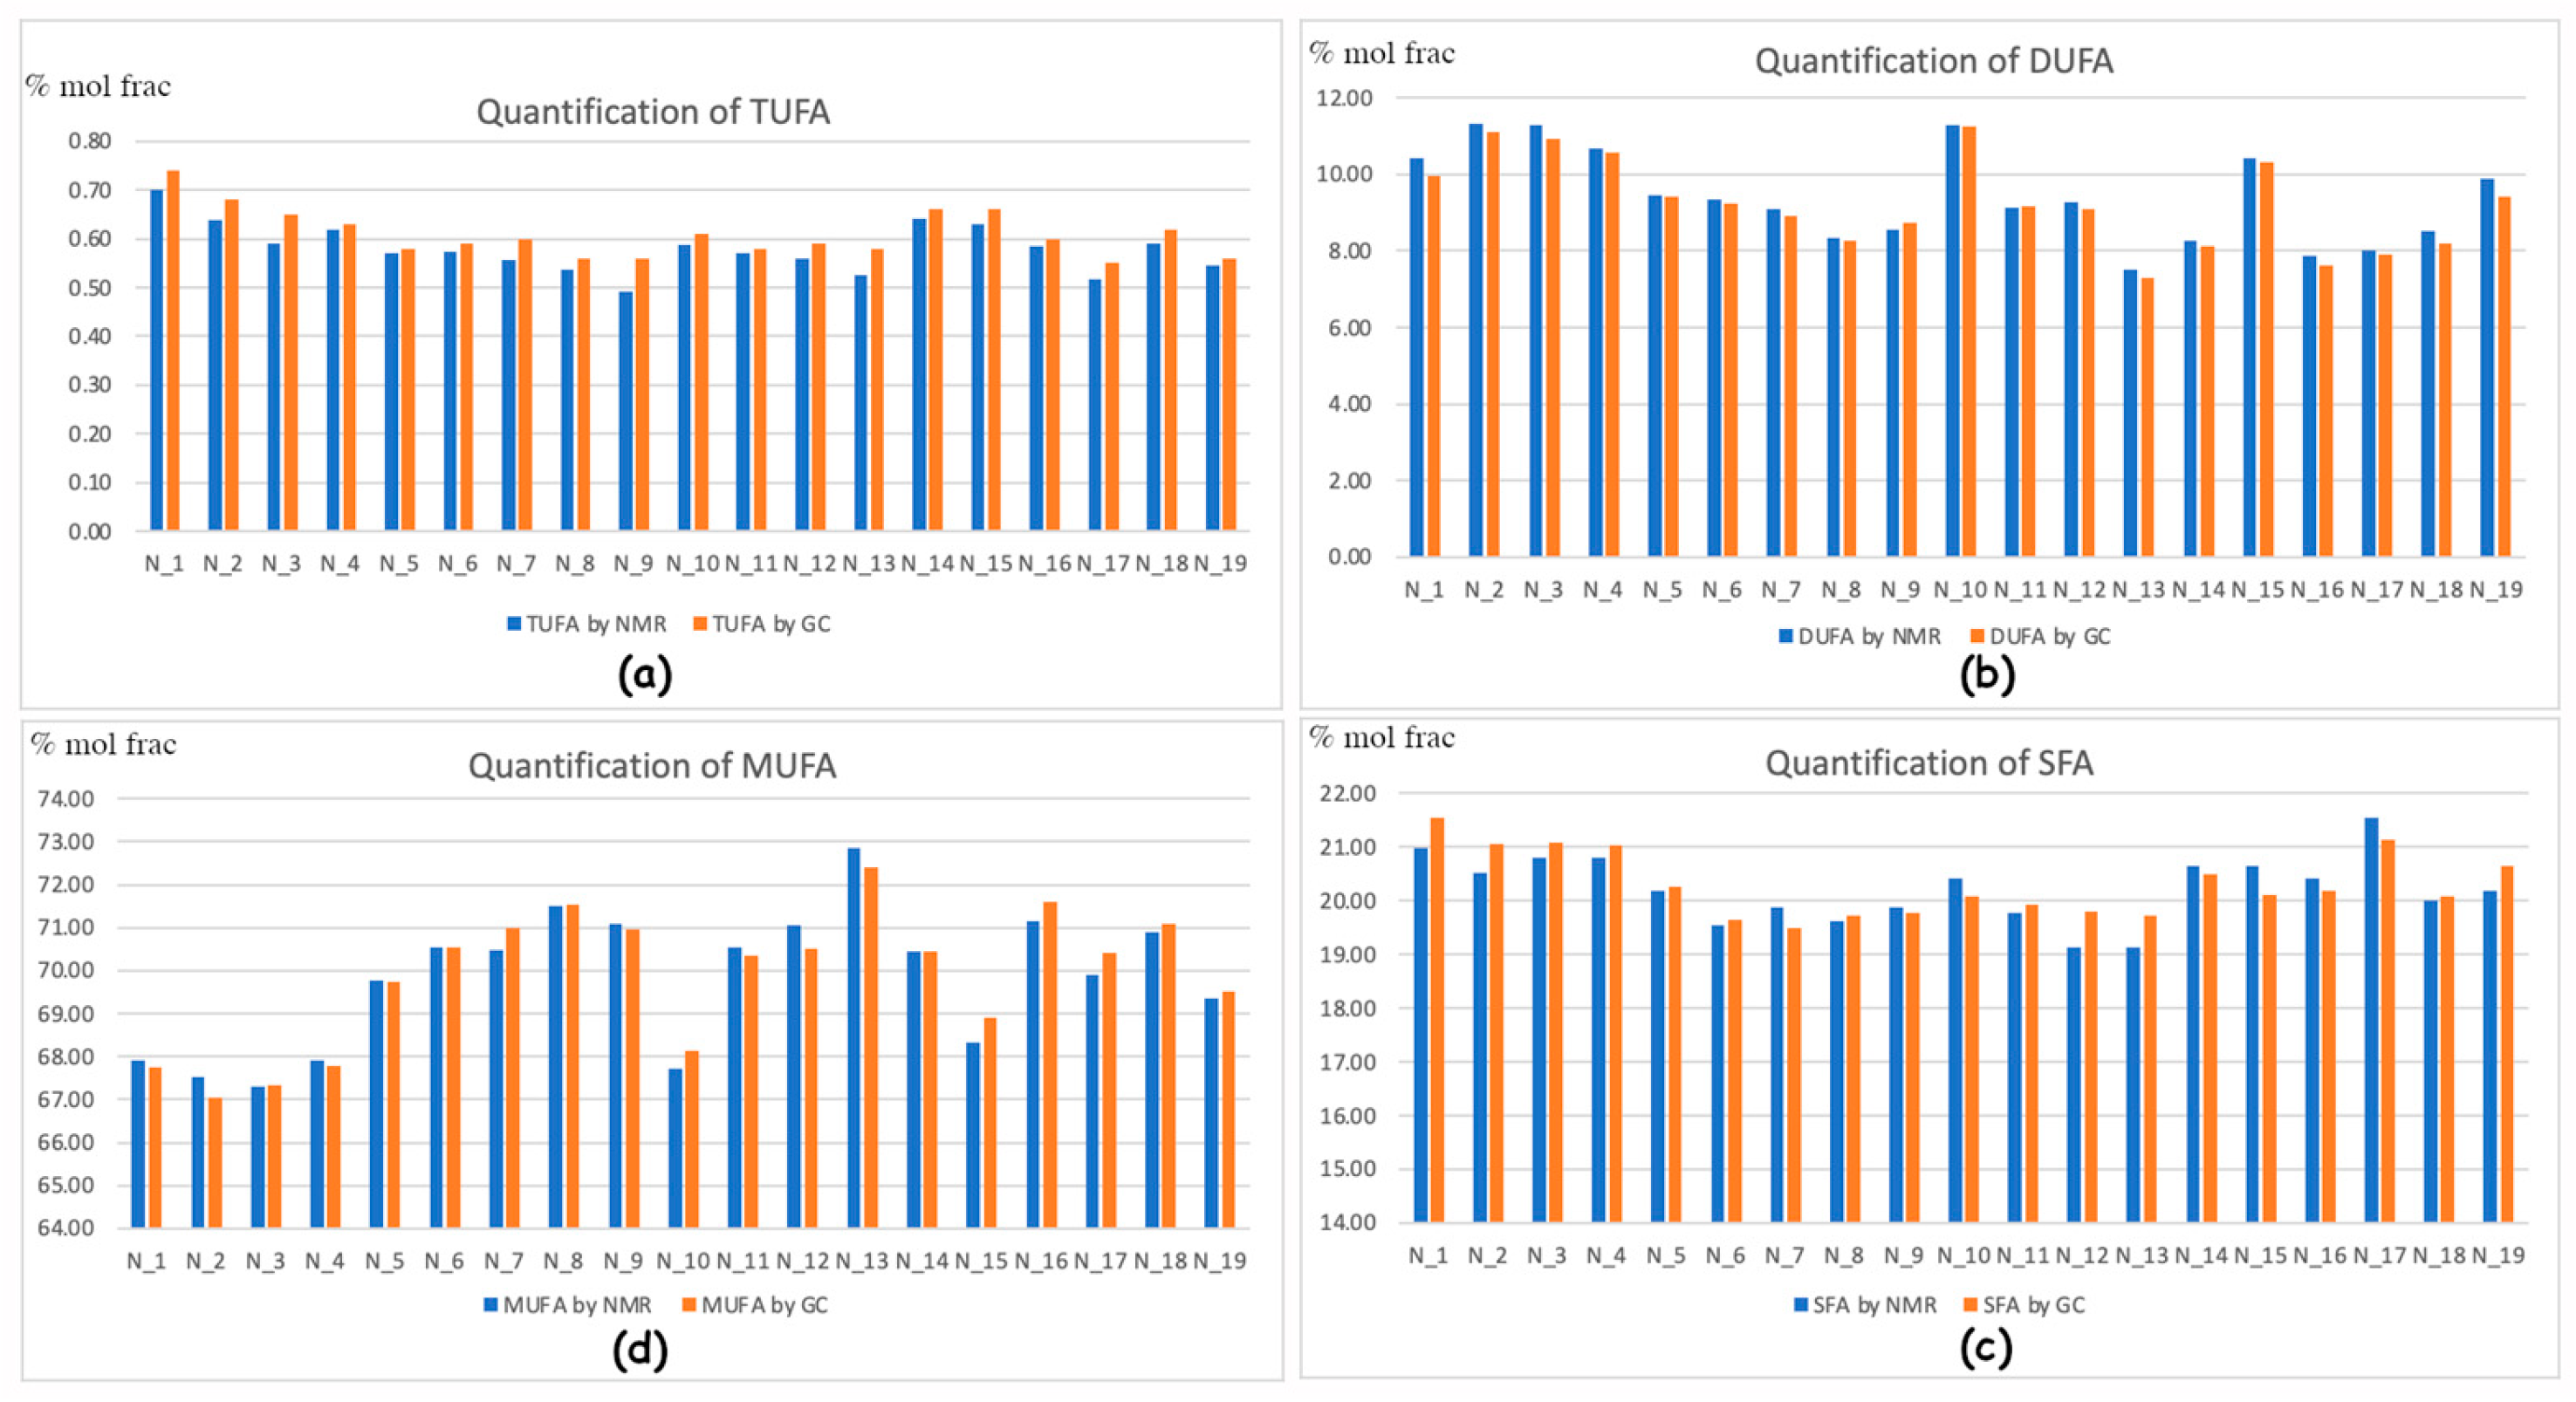
This is leading to the necessary data conversion which is, in principle related to the molecular weight ratio. In the case of the fatty acid quantification by GC-FID this subject is further complicated by the fact that the real main components in EVOOs are fatty esters [24] owning a totally different molecular weight. This is justifying our idea to keep the ratio among fatty esters in “molecular ratio”, and therefore also the other minor components are first scaled as molecular quantities, afterward it is possible to convert these back to weight ratios. Provided that the GC and NMR techniques provide basically different information[24], Figure 2 represents the compared quantification according to our absolute independent scaling factors.

2.4. Total Phenolic Compounds: NMR vs Folin-Ciocolteau

We point out again that the NMR direct quantification of the four most representative phenolic compounds (Oleocanthal, Olaceine, Oleuropein and Ligstroside aglycones) is in molecular ratios [25], just as the spectrophotometric response which though is usually reported in gallic acid equivalents and anyway is considering the whole class of compound. This is why our reasonable idea was to compare results keeping in mind the gallic acid molecular weight as basic “data converter” (Figure 3). According to our opinion the few discrepancies are reminiscent of possible interferences in the Folin-Ciocâlteu measurements [26]. We would like to mention that the NMR method quantifies a fifth elenolic derivative called Elenolide [27] which is not considered as an electron donating compound and it is not considered in this comparison.
In the last five years, Sicily is facing an unprecedent drought with an average rise of temperatures which could theoretically lead to dramatic drop of the phenolic composition. Provided that our NMR analysis is consistent with other experimental evidence in this paper as well as in others [25], the phenolic fraction records a general slight decrease by keeping its important feature in the Nocellara del Belice oils. We think that a moderate thermal stress of plants is even better promoting the production of phenolic species despite their thermal stability which indeed decreases the phenolic presence after drastic oil processing [28]. Differences in mean temperatures lead differences in Oleic, Linoleic and others lipid acids [29].

2.5. Statistical Analysis of the Metabolic Profile

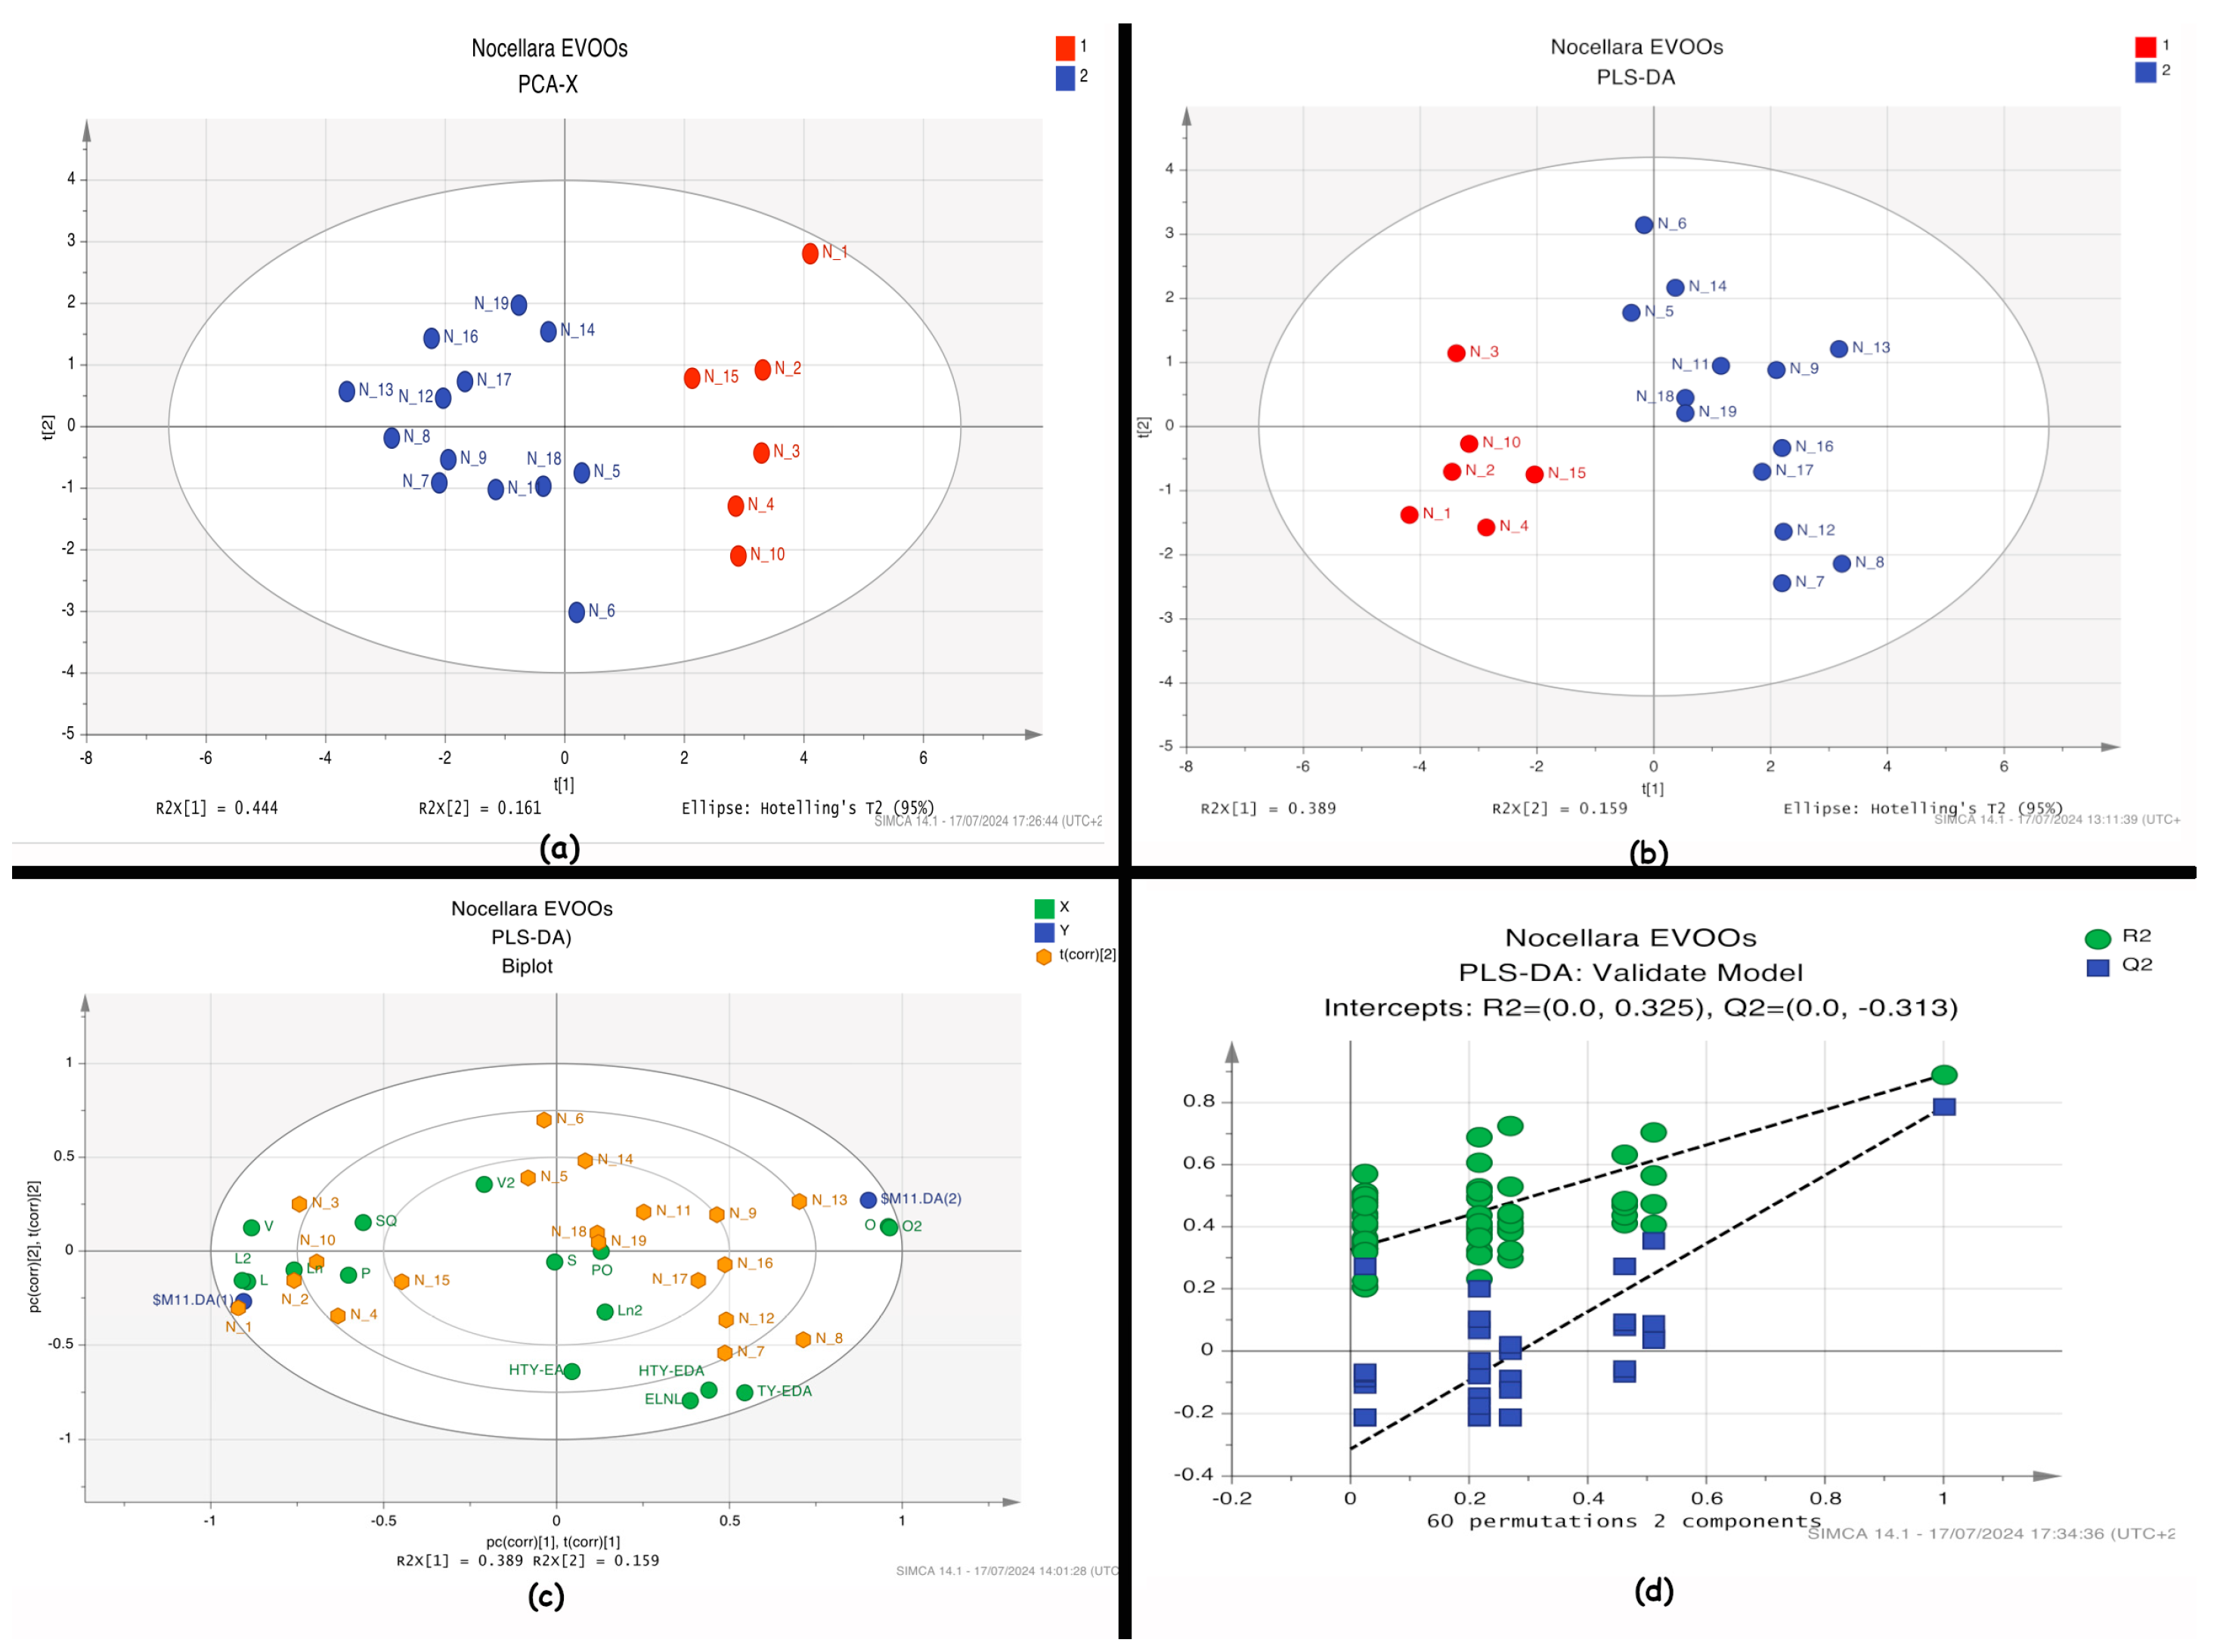
Statistical graphs are reported in Figure 4. For the statistical analysis we have used 19 observables and 16 variables. The PCA (Principal Component Analysis) analysis shows a promising clustering of samples according to specific variables (loadings not shown), revealing a fair distribution which may be linked to several factors (i.e., temperature, altitude, solar exposition and/or pedologic). Cumulative Sum of Squares R2 0.606 and the fraction of the total variation of X Q2 0.176 indicating an insufficient fit, it may depend on the low number of samples.
Despite the poor fit results, the PCA shows clustering into two groups (Figure 4a), prompting us to apply supervised analysis.
The PLS-DA (R2 0.889 and Q2 0.789.) shows a reliable separation between L1 and L2 samples (Figure 4b). The robustness of the model was tested by random permutation and leave-one-out tests, both yielding 100% robustness. These tests indicate that the model is robust and useful for future dataset extensions. The permutation test results show that all random models have lower R² and Q² values than our model, with intercepts at 0.325 for R2 and -0.3131 for Q2.
The misclassification test (Table 2) summarizes the number of observations with known class memberships that were correctly classified in class or PLS-DA models, all samples are correctly classified.
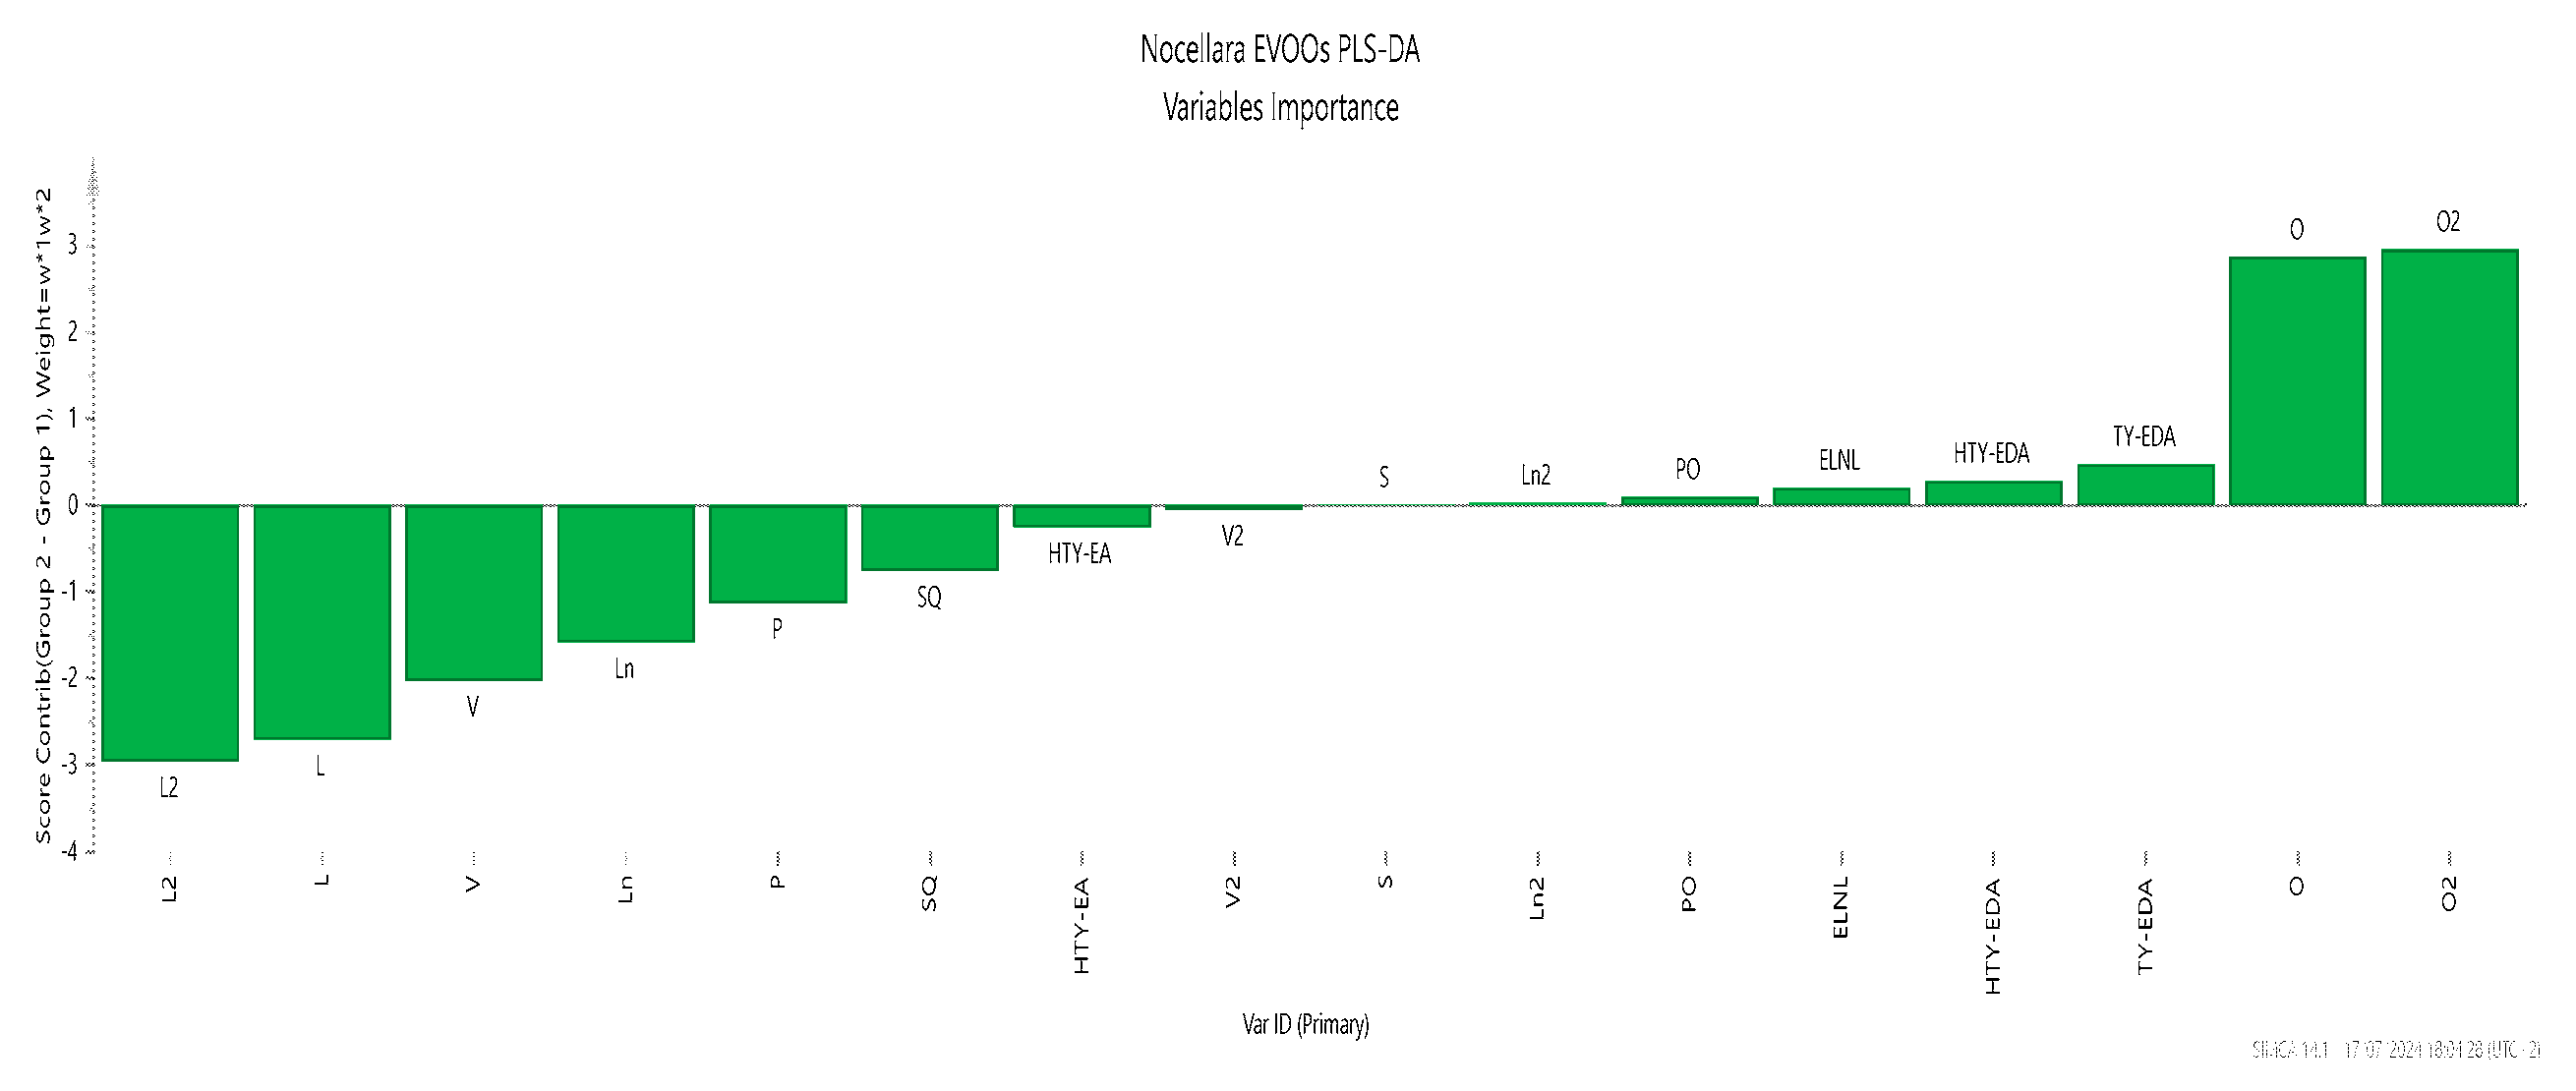
From Figure 5, we can identify the most important variables and their roles in the PLS-DA model, these are Linoleate, Linolenate, Palmitic and cis-Vaccenic esters for the L2 group (negative contribution); Oleate and polyphenols for L1 group (positive contribution). These results are consistent with those obtained by Piravi-Vanak et al. (2012) [30], who demonstrated that the fatty acid composition of olive oil is strongly influenced by the variety, ripening process, and geographical origin, particularly latitude and climatic conditions.

3. Discussion

The variables affecting olive oil quality before the production process include the variety (genetic factor), tree age, cultivation area/geographical origin (latitude, longitude, and elevation), climate (temperature, rainfall, humidity, and wind speed), and soil texture and composition [31]. Samples of monovarietal EVOO from a limited sampling area reduce the field of variability to altitude/temperatures and soil differences and references therein.
Our results demonstrate that 1 hour NMR-based analysis enables the detection of significant metabolic differences in monovarietal oils coming from the same “Belice valley” (western Sicily), being these results consistent with other traditional analytical measurements. The detected variabilities are obviously influenced by the terroir condition and despite the limited gamma of independent samples we demonstrate that the metabolomic profile is strictly related to the specific micro climatic territory.
The monovarietal plants are fixing the genetic features and therefore the detected differences are mostly referred to terroir and to some kind of specific agronomic practice. Variations in FA composition during ripening is closely associated with genetic factors and seasonal weather conditions [32], determining positive and negative trends in oleic, palmitic, and linoleic acids concentrations. Looking at the loadings, the oleic acid is positively linked to samples coming from the seaside plains and is dominating the main component being the linoleic acid related in an inverse mode. So, this dimension is strictly discriminating the altitude of the crops which is basically the main discriminant factor for a monovarietal species. The second dimension is mainly made by saturated fatty acids, and it is known that squalene, linoleic, palmitic and oleic acids are mainly influenced by the thermal regime of summer period, increasing linoleic, squalene and palmitic acid as temperature rises, while opposite effect is observed on oleic acid.
The area of Nocellara del Belice is featured by varying altitudes that influence local agriculture. Lower altitudes tend to have milder temperatures and different soil compositions, which affect crop types and yields. Higher elevations experience cooler temperatures and potentially more wind, impacting the growing conditions for certain plants. These altitude differences may contribute to the diversity of the FA profile in EVOO.

4. Materials and Methods

4.1. Samples

The nineteen chosen samples were selected according to a specific belonging of the crops whose production amounts could guarantee the independent olive milling. Mill plant declared from producers, from “Oleificio Asaro” (M1, six samples) and from Campobello di Mazzara “Keolive” (M2, thirteen samples). All the samples were guaranteed as monovarietal Sicilian cultivar Nocellara del Belice, one of the most diffused cultivars in the region. The samples were analysed in triplicate directly after production. Each sample was initially stored in capped glass tubes at room temperature inside a dark and dry cupboard, then preserved at -40°C until analysis to promote the long-term stability of phenols. Before analysis, each sample was defrosted at room temperature in a dark room.

4.2. Chemicals

Tetramethyl silane (TMS), high purity deuterated chloroform (CDCl3), methanol, n-hexane, cyclohexane and chemicals at reagent grade were supplied from Sigma-Aldrich (Milan, Italy).

4.2. NMR Sample Preparation

Sample preparation was developed after several test experiments. The experimental setup is our best optimization to keep a reasonable field homogeneity affecting line-with and resolution, sensitivity, and chemical stability. Just for instance we would like to point out that many studies suggested to add small amounts of d6-DMSO to decrease the sample viscosity and therefore the field homogeneity, however our experiments demonstrate that it is chemically affecting minor components as phenols preventing the suitable detection and quantification. Another possible strategy was to use small amounts of EVOOs (20 μL) gaining the great advantage of smooth homogeneity and really definite spectral lines [33], however this technique is advisable to detect just main components by protonic experiments, whereas it would increase the experimental time for the detection of less sensitive signals like 13C resonances or 1H resonances related to minor components.
All the oil samples were dissolved in CDCl3, in some test cases we have used traces of TMS as reference standard, and later we avoided this “contamination” since other EVOOs signals can be used instead as reference for the NMR analysis. As suggested elsewhere [16], we kept the oil-to-CDCl3 weight ratio equal to 13.5:86.5; it corresponds to a mixture of 122 μL of oil and 478 μL of deuterated chloroform into a 5-mm test tube for NMR. Tubes were immediately sealed to prevent the solvent evaporation which might affect the chemical shift of many signals, especially the olefinic and carbonylic 13C signals; the constant concentration is a crucial experimental task to be performed and it will become the main source of non-systematic errors as we run the phenol quantification in absolute measurement mode.

4.3. NMR Experimental Protocol

For any sample, three basic experiments were recorded:
  • Experiment A: a standard protonic spectrum with 16 scans and a suitable cycling delay for quantitative analysis.
  • Experiment B: 1H- DPFGSE (double-pulsed gradient spin echo) spectrum [25] with 32 scans for the detection and quantification of aldehydic phenolic species.
  • Experiment C: full-time 1H decoupled 13C spectrum with 32 scans with a suitable recycling delay for quantitative evaluations.[22]
The experimental choices owe to our personal optimization seeking for high precision and fast acquisition and certainly, these could be differently tuned and maybe improved. For instance, the 1H experiment could be drastically shortened according to Castejon et al. 2014 [34] (just 4 scans) if we should not consider the sterolic and phenolic fractions. Our three experiments setup lasted around 9 min, 9 min, and 35 min, respectively; therefore, by including the preparation procedure, the total experimental analysis for every sample was 60 min in the worst-case scenario.

4.4. NMR Acquisition and Processing

Samples in the 5mm NMR tubes were analysed by a 500-MHz Agilent spectrometer equipped with a new generation probe with gradients (ONE_nmr probe) at the constant temperature of 298 K. After the automatic tuning and gradient shimming, the line shape of the TMS signal was checked by shimming until line shape was lower than 1.5 Hz. The 1D 1H and {1H}-13C NMR spectra were run at 499.74 and 125.73 MHz, respectively. The hard pulse for the maximum sensitivity (90° pulse) was calibrated throughout the samples and always within 8.2 ± 0.1 μs at 58 dB. 1H-NMR experiments (experiment A) were run with a spectral width of 12 ppm, with 16 scans, 12 s of acquisition time, and 3 s of recycle delay to keep quantitative methods regardless the different protonic relaxation times (maximum value of T1 = 2.5 which is less than 5 times the total recycling time). For the same reason, some totally decoupled {1H}-13C spectra (experiment C) were first acquired with the 90° hard pulse (11.2 ± 0.3 us at 6 dB), 64 scans, 2 s of acquisition time, and 25 s for the time delay. Afterward, these experiments were compared to some others with lower recycling time and a smaller tilting angle with the purpose to optimize the experimental time keeping the quantitative ratio of 13C signals. The final optimized conditions were: 96 scans, 85° pulse and 18 seconds of total recycling delay for a total of 35 minutes experimental time. According to our past studies we also optimized the selection through selective pulses of the aldehydic region (8-10 ppm range) to perform a protonic DPFGSE spectrum (experiment B) [28,35] based on the standard 1H experiment (A); the shaped pulse between 8 and 10 ppm was a seduce with a duration of 100 ms. After 8 to 16 scans the spectrum displayed signals in the region of interest (barely foreseen through the experiment A) with a better signal to noise ratio provided that a slight line-broadening function (0.3 Hz) was applied for the Fourier-transform procedure.
Calibration of experiment A was basically performed on the methyl group of the β-sitosterol signal to (δH = 0.738 ppm) provided that, when TMS was in the sample, its signal was always δH=0.0± 0.005 ppm. Similarly, for 13C calibration (experiment C), the divinyl-methylene group of the linoleate glyceryl esters (L11; δ13C= 25.6614 ppm) was used always keeping the known TMS 13C signal to δ13C=0.0±0.05 ppm. Provided that it is here demonstrated that the TMS calibration would not really change results, the calibration over internal signals is preferred respect to the TMS calibration because (a) this could be further used and extended for samples without the internal reference and (b) TMS is a very small isotropic molecule with very long longitudinal relaxation times (T11H > 5s and T113C > 12 s as measured by inversion recovery experiments).

4.5. NMR Processing Strategies and Quantification

The basic principle of the NMR quantification (qNMR) is that any signal is strictly proportional to the relative representation of that chemical group embedded in its parent molecule [36]. Of course, the number of magnetically equivalent nuclei is to be considered as scaling factor [22] and possible overlaps should be accounted for the general outcome [37]. According to this scientific background the NMR power is related to the chance to assess the relative concentration of several molecules even just focusing to a specific spectral region of an NMR experiment. The idea to perform three different spectra is pursued to collect a great number of data all related by the same mentioned quantification roles. Briefly, MARA-NMR method [22] is a best-fitting regression of hundreds of qNMR relationships aimed to sort out the best fitting quantification model for nineteen independent metabolites. The low quadratic deviations (rho) found for any sample (observable) warrantees the self-consistency and robustness of the final outcomes. Practically speaking, the three mentioned experiments A, B and C were processed, baseline corrected and finely aligned. Finally, experiments were integrated in 102, 18 and 97 chosen bins, respectively. The final matrix was made by 19 observables and 220 spectroscopical variables. The used quantification equations were 13, 7 and 70, involving integrals of the three experiments respectively inferring the quantification of twenty-four independent compounds (among these just sixteen presented significative variance not affected by shelf-life and thus relevant for our studies). In this study we have harnessed different processing procedures: 1) reload spectra in MestreNova (MestreNova 6.6.2) running on a Windows 10 laptop, try the multiple spectra treatment with calibration, automatic phasing, alignment and group-integration to retrieve the general matrix; 2) spectra loading in Topspin 4.2.0, serial treatment for calibration, phasing, base-line correction and multiple integration through an au-program so that again we could retrieve the data-matrix for the three experiments; 3) we tried the innovative built-in icoshift [37] within the Matlab software package customized to match the three model-experiments. The last MATLAB procedure issued the lowest rho (deviation coefficient) and displayed the best consistency, probably because of the best local alignment allowed by this routine.

4.6. Traditional Analytical Essays

To assess that the analysed oils fall in the range of EVOO free fatty acidity (FFA), peroxide value (PV) and specific spectrophotometric indices were determined.
The FFA of each EVOO sample was estimated by titration, according to the [8], as follows: 5 g of oil were mixed with 90 mL of ethyl alcohol/diethyl ether (1:2, V/v), added with pH indicator (phenolphthalein) and the resulting solution was titrated with 0.1 M NaOH. The results were expressed as percentage of oleic acid.
The PV value was determined from a solution of 1 g of oil mixed with 25 mL of acetic acid/chloroform (3:2, V/v), added with 0.5 mL of a KI saturated solution. The resulting mixture was put in the dark for 5 min; subsequently, 75 mL of distilled water were added, and the mixture titrated with 0.01 N Na2S2O3, using starch paste as indicator. The results were expressed as meq of O2/kg oil.
The determinations of the spectrophotometric indices were carried out by dissolving 0.1 g of oil with pure cyclohexane in 10 ml volumetric flask. Each sample was analysed using an UV/Vis spectrophotometer (Shimadzu, Model UV-2401PC). Specific UV absorbance at 232 and 270 nm (K232 and K270, respectively) and ΔK were determined. The values were determined following the analytical methods described in the [8], to attribute the oil samples a commercial class.

4.7. Gas-Chromatographic (GC) Analysis of Fatty Acid Methyl Esters (FAMEs)

The fatty acid composition of the olive oil samples was carried out by GC-FID after derivatization to their methyl esters (FAMEs) [38]. A gas chromatograph (GC) (Master GC-DANI, Milan, Italy), equipped with a split/splitless injector, a flame ionization detector (FID), and a capillary column (Phenomenex ZB-Wax, 30 m x 0.25 mm, film thickness 0.25 µm), was used for the GC analysis. The following chromatographic conditions were used: the oven temperature was programmed from 50 °C (2 min) to 210 °C (at 3°C min−1) and then set to be isothermal for 15 min; injector and detector temperatures were 240 °C; a constant linear velocity of ultrapure helium (carrier gas) was used at 30 cm sec−1. The injection volume was 1 µL, with a split ratio of 1:50. The identification was carried out by comparing the retention times of the compounds identified in the oil to the retention times of a reference FAME mixture. The percentage of individual FAMEs was calculated relative to the total area of the chromatograms. All determinations were performed in triplicate. Data processing was carried out using Clarity Chromatography v.4.0.2 software.

4.8. Quantification of Total Phenol Content (TPC)

The TPC of each oil sample was determined by the Folin–Ciocâlteu spectrophotometric assay referring to the Dordevic method [39] with slight modifications. Briefly: 6 mL of oil were added with 6 mL of a H2O/MeOH (80:20, V/v) solution, mixed and centrifuged. Then 0.2 μL of supernatant were added with 1.8 mL of distilled water, 8 mL of Na2CO3 solution (75 g/L) and 10 mL of the Folin–Ciocâlteu reagent diluted 1:9. After about 2 h at 20 °C the TPCs were measured at 760 nm using an UV-spectrophotometer (UV-2401 PC, Shimadzu, Japan). The results were expressed as gallic acid equivalent (GAE, mg kg−1).

4.9. Statistical Analysis

Statistical analyses were performed using SIMCA-P software version 13.0, (Umetrics AB, Umea, Sweden) for statistical analysis. Data were scaled using UV function in SIMCA-P. PCA (Principal Component Analysis) data analysis was performed for exploratory purposes and outliers’ recognition, while Projection to Latent Structures (PLS)-based methods were used for discriminant analysis and data set comparison. We used Orthogonal extension of PLS-DA [23] in which the first latent variable accounted only for correlated data variations. PLS-DA models were evaluated using the goodness-of-fit parameter (R2Y) and the predictive ability parameter (Q2Y). First, 19 independent samples were chosen to run a multivariate statistical analysis without any defined classification. Because of the relatively limited available samples we preferred to use the sixteen variables issued by the NMR quantification to avoid overfitting, collinearity, and challenging recovery of the chemical rationale.
To check whether there were any differences in variables to classify samples and to create predictive models, we used PLS-DA (Discriminant Analysis) analysis (Simca-p v 12, Sartorius Gottingen - Germany). Consequently, we tried to correlate the compositions of EVOO, with discrete variables such as the place of origin, mean rainfall per year, or altitude of orchards. The results were analyzed, and the robustness of the results was verified using the methods proposed by Trygg [40]: permutation test was performed changing randomly class attribution of 3 samples for time.

5. Conclusions

In this paper we demonstrate that NMR enables the direct quantification of several components in EVOO. These determinations are validated by the recorded consistency with the traditional GC-MS and Folin-Ciocalteau methods. Eventually NMR quantitative data turned out very useful to develop a prediction model able to distinguish two areas with differences in altitude and soil composition. This study will pave the way to extended studies concerning EVOOs of different cultivar, belonging and agronomical practice with the aim to add more information about the different quality of EVOOs produced in the Sicilian region.

Author Contributions

“Conceptualization, G.L.L.T, N.C., A.R; methodology, G.B. and I.M.S.; software, N.C. and A.R; validation, A.R., N.C. and G.P.; formal analysis, G.B.; investigation, G.B. and G.L.L.T; resources, I.M.S.; data curation, N.C. and A.R; writing—original draft preparation, G.L.L.T.; writing—review and editing, G.P.; visualization, A.R. and N.C.; supervision, N.C. and M.G.M; project administration, A.R.; general coordination N.C. and M.G.M.; All authors have read and agreed to the published version of the manuscript.” Please turn to the CRediT taxonomy for the term explanation. Authorship must be limited to those who have contributed substantially to the work reported.

Funding

“No funding”

Institutional Review Board Statement

Not applicable.

Conflicts of Interest

The authors declare no conflicts of interest.

Appendix A

A.1. NMR Spectra and Assignments
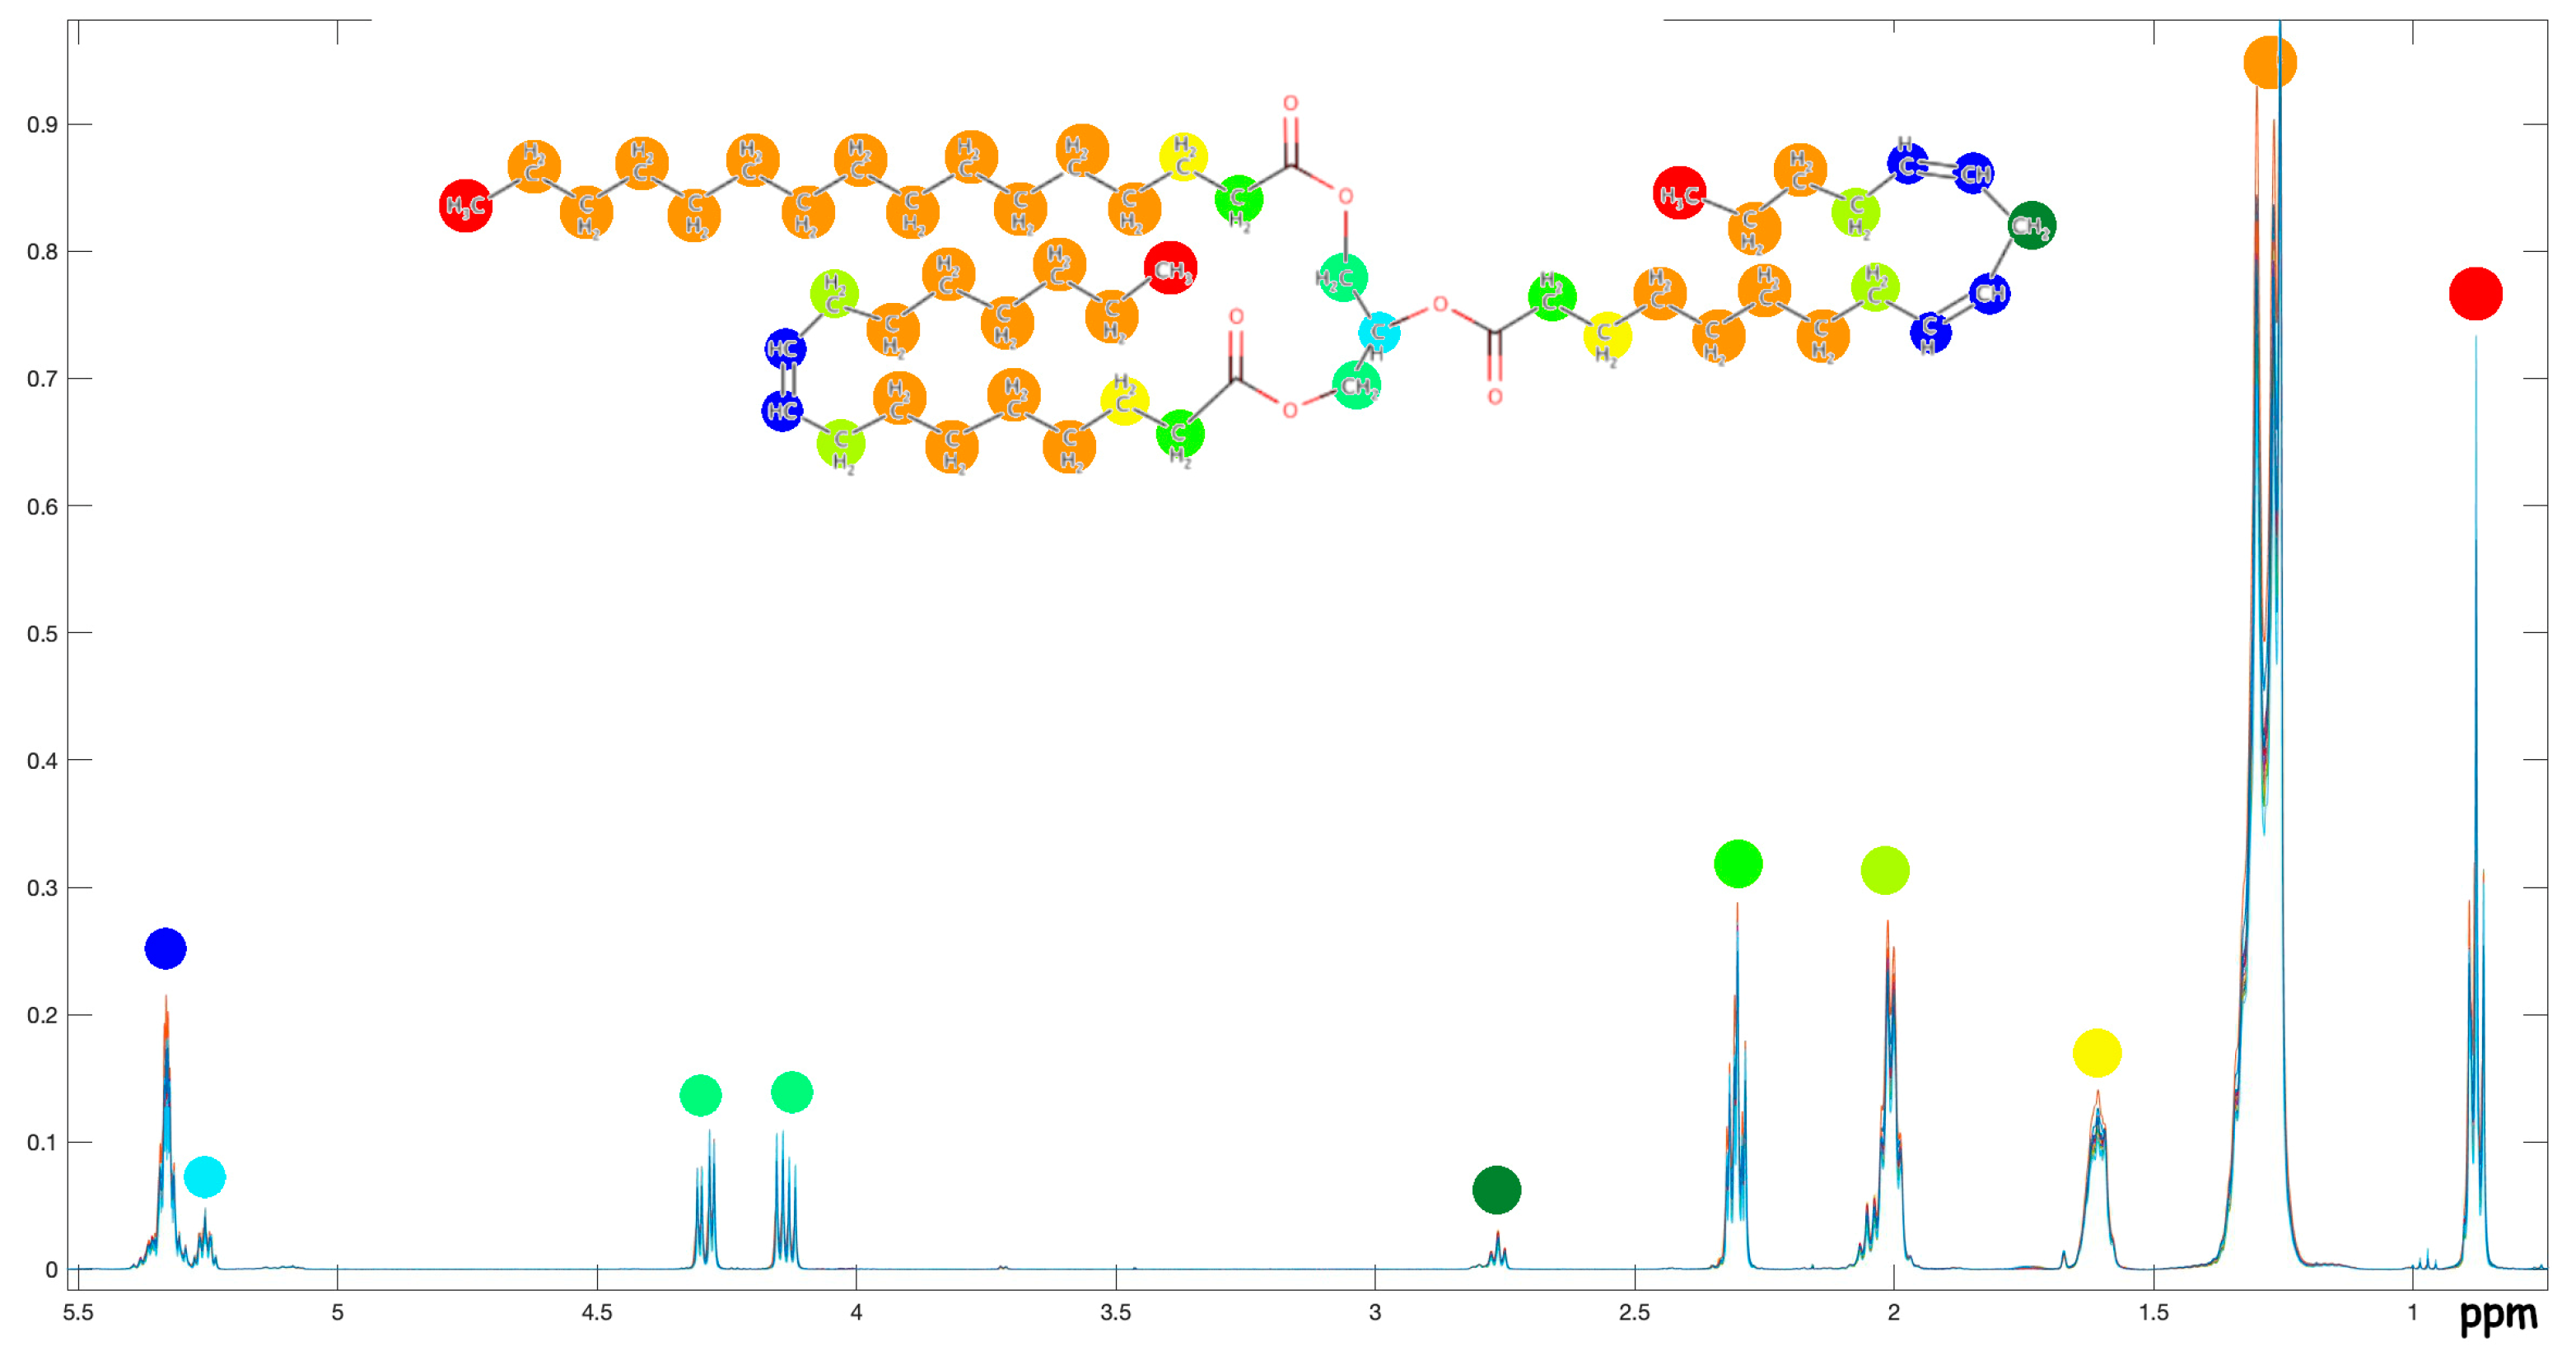
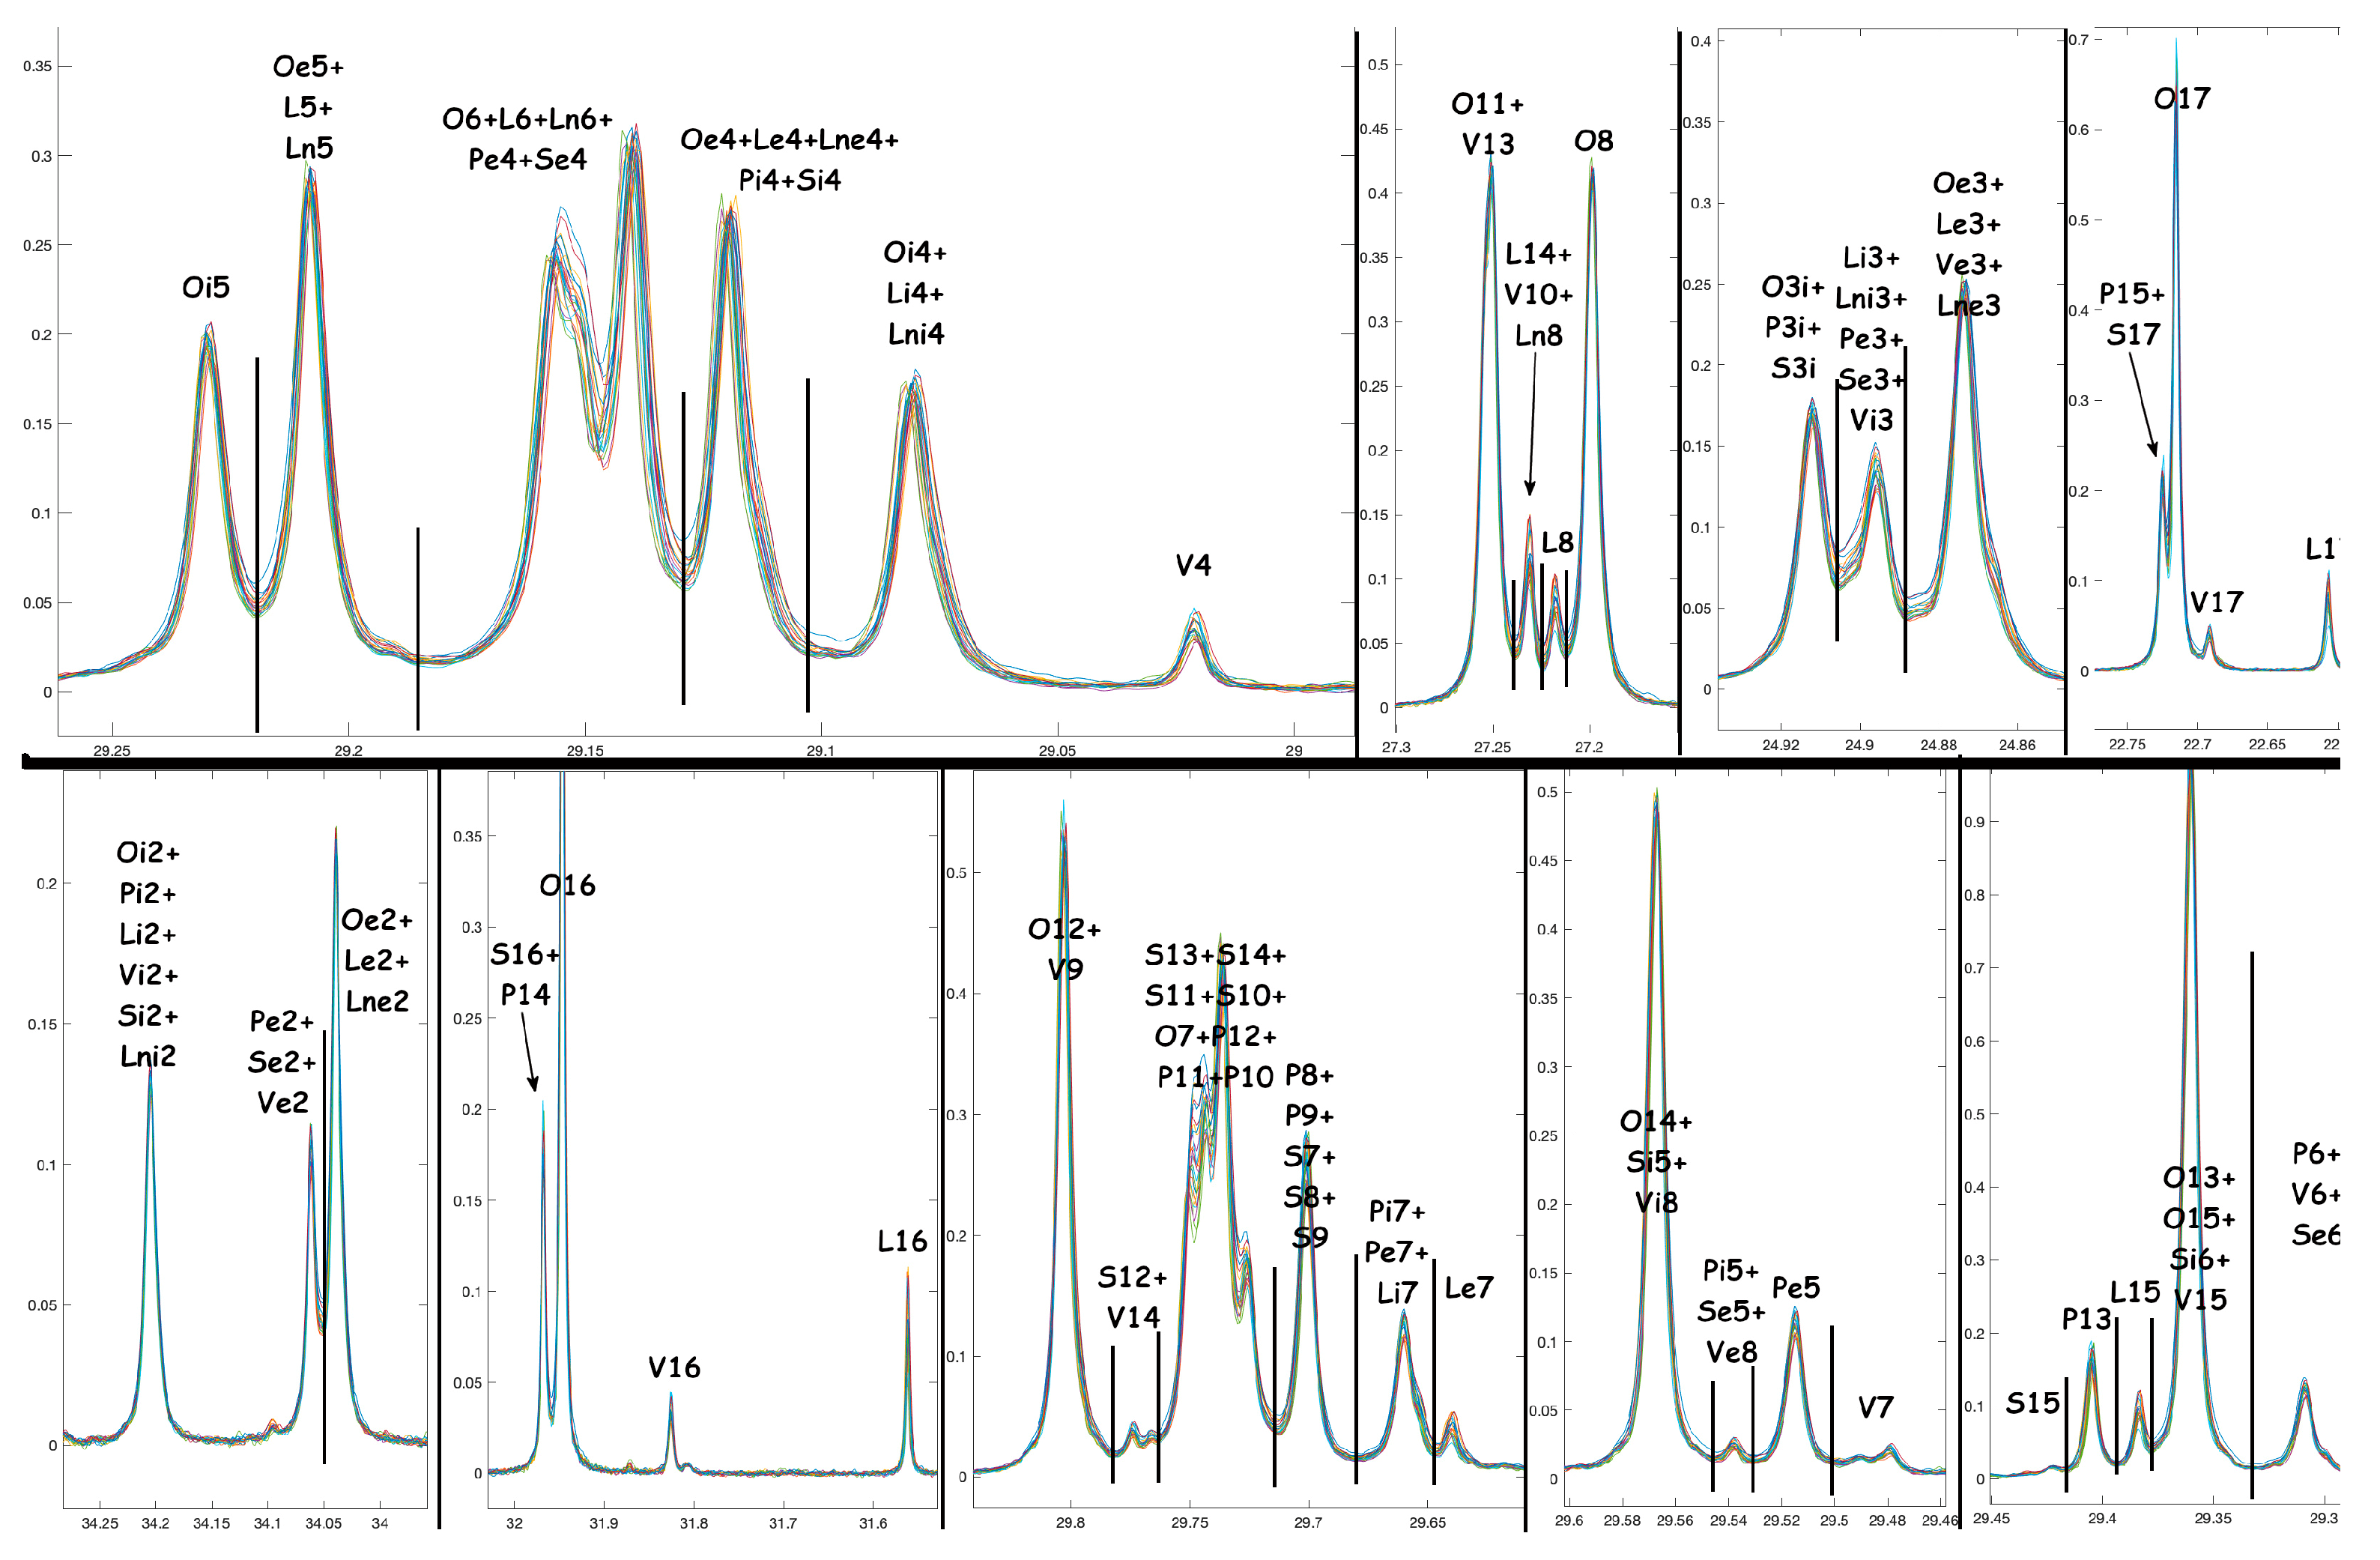
The NMR experiments described in paragraph 4.3 allowed specific assignments concerning the studied compounds. Here we report the global stack plots with the respective assignments used also to run the MARA-NMR calculations.
Figure A1. Stackplot of the 1H-NMR experiments. The main assignments of triglycerides and squalene are also evidenced.
Preprints 113267 g0a1
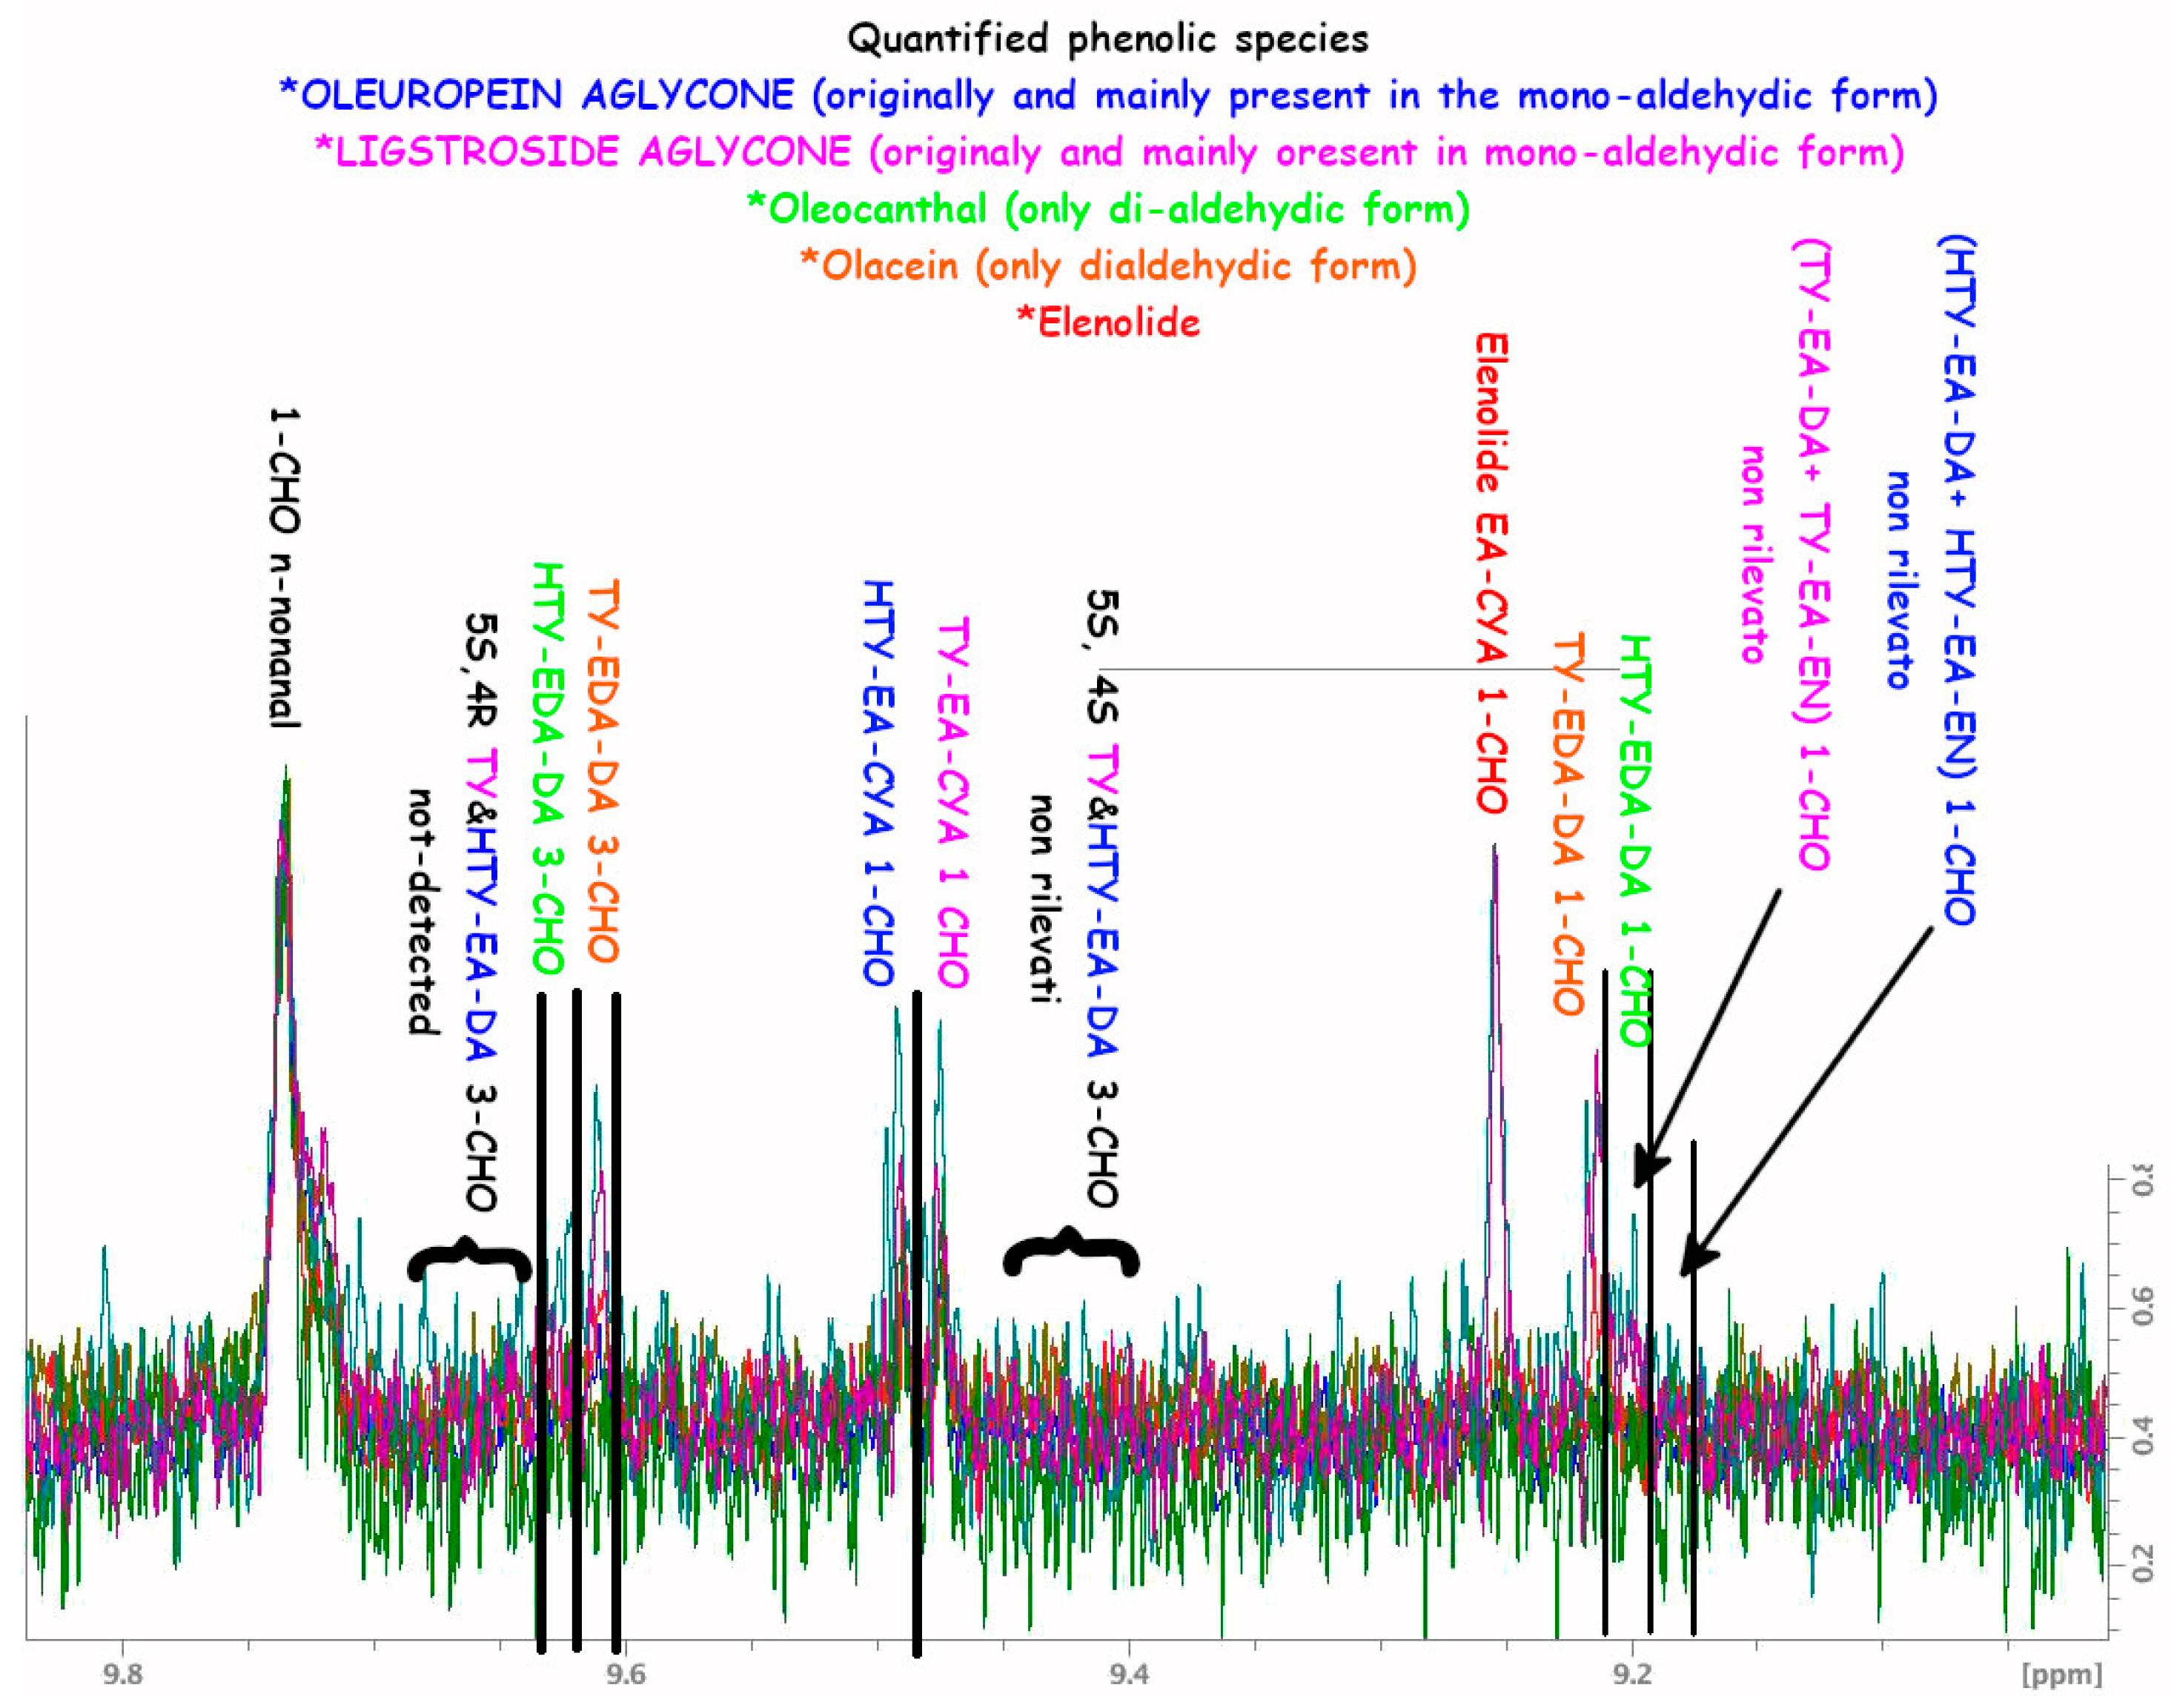
Figure A2. Stackplot of the 1H selected NMR experiments (selected pulse in the 8.5-10.5 region). The main assignments of the five phenolic species is reported.
Preprints 113267 g0a2
Figure A3. Stackplot of the 13C{1H} NMR experiments; some detailed regions are evidenced with the specific assignment employed to infer the relative quantifications.
Preprints 113267 g0a3

A.2. NMR Tables

The extended metabolite values obtained through the MARA-NMR procedure are herein reported for the sixteen relevant metabolites. We highlight that in this case some chemicals were below the limit of detection (n.d.), therefore these species were excluded from the table and from the statistical rationalization.
Table A1. NMR quantification of specific fatty esters and other metabolites (sixteen divided into two sections) for the nineteen Nocellara del Belice EVOO samples. These data are then treated for the statistical analysis.
Group 1 SQ** Ln L O PO V P S
SD%* 4.24 4.86 0.97 0.36 9.65 5.43 0.84 5.55
N_1 2.74 0.70 10.41 62.78 0.47 4.66 19.31 1.67
N_2 2.49 0.64 11.32 62.63 0.51 4.38 18.57 1.95
N_3 2.29 0.59 11.29 62.51 0.35 4.45 18.72 2.09
N_4 2.31 0.62 10.68 62.94 0.70 4.26 18.96 1.84
N_5 2.26 0.57 9.45 65.35 0.37 4.07 18.29 1.90
N_6 2.16 0.57 9.34 65.64 0.66 4.25 17.78 1.76
N_7 1.81 0.56 9.10 66.44 0.56 3.46 17.79 2.09
N_8 2.01 0.54 8.35 67.13 0.71 3.65 17.82 1.80
N_9 2.17 0.49 8.55 66.56 0.54 4.00 17.89 1.98
N_10 1.98 0.59 11.27 62.57 0.55 4.61 18.56 1.86
N_11 1.98 0.57 9.12 66.02 0.63 3.88 17.84 1.94
N_12 2.08 0.56 9.26 66.74 0.60 3.72 17.25 1.87
N_13 2.22 0.53 7.51 69.04 0.44 3.36 17.57 1.55
N_14 2.50 0.64 8.27 65.73 0.81 3.91 18.63 2.01
N_15 2.41 0.63 10.43 63.70 0.45 4.16 18.71 1.93
N_16 2.26 0.59 7.86 67.05 0.44 3.66 18.37 2.04
N_17 2.19 0.52 8.03 65.55 0.56 3.80 19.62 1.93
N_18 2.18 0.59 8.51 65.46 1.12 4.31 18.21 1.80
N_19 2.29 0.55 9.89 65.73 0.06 3.57 18.18 2.02
Group 2 Ln2 L2 O2 V2 TY-EDA HTY-EDA HTY-EA ELNL
SD%* 11.34 3.22 1.3 7.34 10.46 8.62 12.43 9.32
N_1 0.41 4.91 26.77 0.35 45.20 71.99 23.12 120.58
N_2 0.37 5.20 27.24 0.52 23.39 70.01 23.77 92.42
N_3 0.33 5.24 27.10 0.66 n.d. 25.48 n.d. 59.28
N_4 0.32 4.97 27.12 0.92 29.07 95.99 46.86 211.41
N_5 0.32 4.33 27.90 0.78 5.10 44.30 9.85 53.21
N_6 0.23 4.28 27.88 0.94 n.d. 24.39 n.d. 9.01
N_7 0.32 4.31 28.20 0.51 82.33 153.88 40.14 329.83
N_8 0.38 3.87 28.50 0.59 115.12 213.57 24.19 278.06
N_9 0.37 3.89 28.33 0.74 39.70 119.85 7.39 159.78
N_10 0.34 5.01 27.08 0.91 8.71 27.13 40.31 73.01
N_11 0.32 4.23 28.21 0.58 43.17 61.82 12.62 89.72
N_12 0.41 4.19 28.24 0.49 83.02 157.32 18.29 292.24
N_13 0.34 3.83 28.80 0.37 22.70 13.85 34.45 18.08
N_14 0.44 3.87 28.28 0.74 10.81 45.08 4.00 97.75
N_15 0.35 4.95 27.51 0.53 31.52 111.53 10.08 211.25
N_16 0.41 3.60 28.73 0.59 44.12 81.18 38.82 223.21
N_17 0.38 3.66 28.66 0.64 52.14 141.61 22.74 270.57
N_18 0.37 4.18 28.07 0.72 40.34 81.39 21.34 189.95
N_19 0.39 4.42 28.22 0.30 23.78 62.30 8.74 117.39
* SD% is the measured standard deviation percent respect to the absolute measure in the worst-case scenario (9 inter-day and intra-day of three different samples for N_1, N_2, N_3, N_4 and N_5). ** Squalene quantification is given in molecular percent presence.
Table A2. NMR table concerning the traditional standard routines to assess the EVOOs quality for the nineteen Nocellara del Belice EVOO samples.
Samples Free acidity (FFA)
(%)
Peroxydes (meqO2/Kg) K232 K270 ∆K
N_1 0,1 3 1,85 0,13 -0,001
N_2 0,1 4 1,37 0,15 0,000
N_3 0,3 6 1,62 0,12 0,000
N_4 0,1 5 1,49 0,10 0,000
N_5 0,2 5 1,38 0,12 0,000
N_6 0,1 5 1,41 0,08 -0,001
N_7 0,2 3 1,18 0,08 0,000
N_8 0,1 3 1,29 0,08 -0,001
N_9 0,2 4 1,31 0,10 -0,003
N_10 0,3 6 1,46 0,10 -0,003
N_11 0,2 7 1,51 0,13 -0,001
N_12 0,2 6 1,38 0,12 0,000
N_13 0,2 5 1,44 0,10 -0,001
N_14 0,2 5 1,36 0,09 -0,001
N_15 0,3 7 1,53 0,14 0,001
N_16 0,1 5 1,55 0,10 -0,006
N_17 0,2 8 1,51 0,10 -0,001
N_18 0,2 3 1,42 0,09 -0,002
N_19 0,2 4 1,49 0,10 -0,004

References

  1. Esposto, S.; Taticchi, A.; Urbani, S.; Selvaggini, R.; Veneziani, G.; Di Maio, I.; Sordini, B.; Servili, M. Effect of Light Exposure on the Quality of Extra Virgin Olive Oils According to Their Chemical Composition. Food Chem 2017, 229, 726–733. [Google Scholar] [CrossRef]
  2. Boskou, D.; Tsimidou, M.; Blekas, G. Olive Oil: Chemistry and Technology, Second ed.; 2006. [Google Scholar]
  3. Gorzynik-Debicka, M.; Przychodzen, P.; Cappello, F.; Kuban-Jankowska, A.; Gammazza, A.M.; Knap, N.; Wozniak, M.; Gorska-Ponikowska, M. Potential Health Benefits of Olive Oil and Plant Polyphenols. Int J Mol Sci 2018, 19. [Google Scholar] [CrossRef] [PubMed]
  4. Martín-Peláez, S.; Covas, M.I.; Fitó, M.; Kušar, A.; Pravst, I. Health Effects of Olive Oil Polyphenols: Recent Advances and Possibilities for the Use of Health Claims. Mol Nutr Food Res 2013, 57, 760–771. [Google Scholar] [CrossRef] [PubMed]
  5. Xiang, C.; Xu, Z.; Liu, J.; Li, T.; Yang, Z.; Ding, C. Quality, Composition, and Antioxidant Activity of Virgin Olive Oil from Introduced Varieties at Liangshan. LWT 2017, 78, 226–234. [Google Scholar] [CrossRef]
  6. Kouka, P.; Priftis, A.; Stagos, D.; Angelis, A.; Stathopoulos, P.; Xinos, N.; Skaltsounis, A.L.; Mamoulakis, C.; Tsatsakis, A.M.; Spandidos, D.A.; et al. Assessment of the Antioxidant Activity of an Olive Oil Total Polyphenolic Fraction and Hydroxytyrosol from a Greek Olea Europea Variety in Endothelial Cells and Myoblasts. Int J Mol Med 2017, 40, 703–712. [Google Scholar] [CrossRef] [PubMed]
  7. Andrewes, P.; Busch, J.L.H.C.; De Joode, T.; Groenewegen, A.; Alexandre, H. Sensory Properties of Virgin Olive Oil Polyphenols: Identification of Deacetoxy-Ligstroside Aglycon as a Key Contributor to Pungency. J Agric Food Chem 2003, 51, 1415–1420. [Google Scholar] [CrossRef]
  8. II of the European Parliament and of the Council as Regards Marketing Standards for Olive Oil, and Repealing Commission Regulation (EEC) No 2568/91 and Commission Implementing Regulation (EU) No 29/2012; 2022.
  9. Bella, G.; Rotondo, A. Theoretical Prediction of 13C NMR Spectrum of Mixed Triglycerides by Mean of GIAO Calculations to Improve Vegetable Oils Analysis. Chem Phys Lipids 2020, 232. [Google Scholar] [CrossRef] [PubMed]
  10. Carvalho, M.S.; Mendonça, M.A.; Pinho, D.M.M.; Resck, I.S.; Suarez, P.A.Z. Chromatographic Analyses of Fatty Acid Methyl Esters by HPLC-UV and GC-FID; 2012; Vol. 23. [Google Scholar]
  11. Ammar, S.; Kelebek, H.; Zribi, A.; Abichou, M.; Selli, S.; Bouaziz, M. LC-DAD/ESI-MS/MS Characterization of Phenolic Constituents in Tunisian Extra-Virgin Olive Oils: Effect of Olive Leaves Addition on Chemical Composition. Food Research International 2017, 100, 477–485. [Google Scholar] [CrossRef] [PubMed]
  12. Ruiz-Aracama, A.; Goicoechea, E.; Guillén, M.D. Direct Study of Minor Extra-Virgin Olive Oil Components without Any Sample Modification. 1H NMR Multisupression Experiment: A Powerful Tool. Food Chem 2017, 228, 301–314. [Google Scholar] [CrossRef]
  13. Ruiz-Aracama, A.; Goicoechea, E.; Guillén, M.D. Direct Study of Minor Extra-Virgin Olive Oil Components without Any Sample Modification. 1H NMR Multisupression Experiment: A Powerful Tool. Food Chem 2017, 228, 301–314. [Google Scholar] [CrossRef]
  14. Simmler, C.; Napolitano, J.G.; McAlpine, J.B.; Chen, S.N.; Pauli, G.F. Universal Quantitative NMR Analysis of Complex Natural Samples. Curr Opin Biotechnol 2014, 25, 51–59. [Google Scholar] [CrossRef]
  15. Cevallos-Cevallos, J.M.; Reyes-De-Corcuera, J.I.; Etxeberria, E.; Danyluk, M.D.; Rodrick, G.E. Metabolomic Analysis in Food Science: A Review. Trends Food Sci Technol 2009, 20, 557–566. [Google Scholar] [CrossRef]
  16. Salvo, A.; Rotondo, A.; La Torre, G.L.; Cicero, N.; Dugo, G. Determination of 1,2/1,3-Diglycerides in Sicilian Extra-Virgin Olive Oils By1H-NMR over a One-Year Storage Period. Nat Prod Res 2017, 31, 822–828. [Google Scholar] [CrossRef] [PubMed]
  17. Laghi, L.; Picone, G.; Capozzi, F. Nuclear Magnetic Resonance for Foodomics beyond Food Analysis. TrAC - Trends in Analytical Chemistry 2014, 59, 93–102. [Google Scholar] [CrossRef]
  18. Marcone, M.F.; Wang, S.; Albabish, W.; Nie, S.; Somnarain, D.; Hill, A. Diverse Food-Based Applications of Nuclear Magnetic Resonance (NMR) Technology. Food Research International 2013, 51, 729–747. [Google Scholar] [CrossRef]
  19. Liland, K.H. Multivariate Methods in Metabolomics - from Pre-Processing to Dimension Reduction and Statistical Analysis. TrAC - Trends in Analytical Chemistry 2011, 30, 827–841. [Google Scholar] [CrossRef]
  20. Mannina, L.; Marini, F.; Gobbino, M.; Sobolev, A.P.; Capitani, D. NMR and Chemometrics in Tracing European Olive Oils: The Case Study of Ligurian Samples. Talanta 2010, 80, 2141–2148. [Google Scholar] [CrossRef]
  21. Mannina, L.; Dugo, G.; Salvo, F.; Cicero, L.; Ansanelli, G.; Calcagni, C.; Segre, A. Study of the Cultivar-Composition Relationship in Sicilian Olive Oils by GC, NMR, and Statistical Methods. J Agric Food Chem 2003, 51, 120–127. [Google Scholar] [CrossRef]
  22. Rotondo, A.; Mannina, L.; Salvo, A. Multiple Assignment Recovered Analysis (MARA) NMR for a Direct Food Labeling: The Case Study of Olive Oils. Food Anal Methods 2019, 12, 1238–1245. [Google Scholar] [CrossRef]
  23. Trygg, J.; Wold, S. Orthogonal Projections to Latent Structures (O-PLS). J Chemom 2002, 16, 119–128. [Google Scholar] [CrossRef]
  24. Rotondo, A.; La Torre, G.L.; Dugo, G.; Cicero, N.; Santini, A.; Salvo, A. Oleic Acid Is Not the Only Relevant Mono-Unsaturated Fatty Ester in Olive Oil. Foods 2020, 9. [Google Scholar] [CrossRef] [PubMed]
  25. Klikarová, J.; Rotondo, A.; Cacciola, F.; Česlová, L.; Dugo, P.; Mondello, L.; Rigano, F. The Phenolic Fraction of Italian Extra Virgin Olive Oils: Elucidation Through Combined Liquid Chromatography and NMR Approaches. Food Anal Methods 2019, 12, 1759–1770. [Google Scholar] [CrossRef]
  26. Pérez, M.; Dominguez-López, I.; Lamuela-Raventós, R.M. The Chemistry Behind the Folin-Ciocalteu Method for the Estimation of (Poly)Phenol Content in Food: Total Phenolic Intake in a Mediterranean Dietary Pattern. J Agric Food Chem 2023, 71, 17543–17553. [Google Scholar] [CrossRef] [PubMed]
  27. Rigakou, A.; Diamantakos, P.; Melliou, E.; Magiatis, P. S-(E)-Elenolide: A New Constituent of Extra Virgin Olive Oil. J Sci Food Agric 2019, 99, 5319–5326. [Google Scholar] [CrossRef] [PubMed]
  28. Rotondo, A.; Salvo, A.; Giuffrida, D.; Dugo, G.; Rotondo, E. NMR Analysis of Aldehydes in Sicilian Extra-Virgin Olive Oils by DPFGSE Techniques. AAPP Atti della Accademia Peloritana dei Pericolanti, Classe di Scienze Fisiche, Matematiche e Naturali 2011, 89. [Google Scholar] [CrossRef]
  29. Deiana, P.; Santona, M.; Dettori, S.; Culeddu, N.; Dore, A.; Molinu, M.G. Multivariate Approach to Assess the Chemical Composition of Italian Virgin Olive Oils as a Function of Variety and Harvest Period. Food Chem 2019, 300. [Google Scholar] [CrossRef] [PubMed]
  30. Piravi-Vanak, Z.; Ghasemi, J.B.; Ghavami, M.; Ezzatpanah, H.; Zolfonoun, E. The Influence of Growing Region on Fatty Acids and Sterol Composition of Iranian Olive Oils by Unsupervised Clustering Methods. JAOCS, Journal of the American Oil Chemists’ Society 2012, 89, 371–378. [Google Scholar] [CrossRef]
  31. Lechhab, T.; Lechhab, W.; Cacciola, F.; Salmoun, F. Sets of Internal and External Factors Influencing Olive Oil (Olea Europaea L.) Composition: A Review. European Food Research and Technology 2022, 248, 1069–1088. [Google Scholar] [CrossRef]
  32. Dag, A.; Harlev, G.; Lavee, S.; Zipori, I.; Kerem, Z. Optimizing Olive Harvest Time under Hot Climatic Conditions of Jordan Valley, Israel. European Journal of Lipid Science and Technology 2014, 116, 169–176. [Google Scholar] [CrossRef]
  33. Culeddu, N.; Chessa, M.; Bandino, G.; Sedda, P.; Zurru, R.; Anedda, R.; Motroni, A.; Molinu, M.G.; Dettori, S.; Santona, M. Classification of Monovarietal Sardinian Extra Virgin Olive Oils by 1H NMR Metabolomic. European Journal of Lipid Science and Technology 2017, 119. [Google Scholar] [CrossRef]
  34. Castejón, D.; Mateos-Aparicio, I.; Molero, M.D.; Cambero, M.I.; Herrera, A. Evaluation and Optimization of the Analysis of Fatty Acid Types in Edible Oils by 1H-NMR. Food Anal Methods 2014, 7, 1285–1297. [Google Scholar] [CrossRef]
  35. Dugo, G.; Rotondo, A.; Mallamace, D.; Cicero, N.; Salvo, A.; Rotondo, E.; Corsaro, C. Enhanced Detection of Aldehydes in Extra-Virgin Olive Oil by Means of Band Selective NMR Spectroscopy. Physica A: Statistical Mechanics and its Applications 2015, 420, 258–264. [Google Scholar] [CrossRef]
  36. Barison, A.; Da Silva, C.W.P.; Campos, F.R.; Simonelli, F.; Lenz, C.A.; Ferreira, A.G. A Simplemethodology for the Determination of Fatty Acid Composition in Edible Oils through 1H NMR Spectroscopy. Magnetic Resonance in Chemistry 2010, 48, 642–650. [Google Scholar] [CrossRef]
  37. Rotondo, A.; Salvo, A.; Gallo, V.; Rastrelli, L.; Dugo, G. Quick Unreferenced NMR Quantification of Squalene in Vegetable Oils. European Journal of Lipid Science and Technology 2017, 119. [Google Scholar] [CrossRef]
  38. International Olive Council. Coi/t.20/Doc. No 33/Rev.1. Determination of Fatty Acid Methyl Esters by Gas Chromatography Available online: http://www.internationaloliveoil.org/.
  39. Dordevic, D.; Dordevic, S.; Ćavar-Zeljković, S.; Kulawik, P.; Kushkevych, I.; Tremlová, B.; Kalová, V. Monitoring the Quality of Fortified Cold-Pressed Rapeseed Oil in Different Storage Conditions. European Food Research and Technology 2022, 248, 2695–2705. [Google Scholar] [CrossRef]
  40. Eriksson, L.; Trygg, J.; Wold, S. CV-ANOVA for Significance Testing of PLS and OPLS® Models. In Proceedings of the Journal of Chemometrics; John Wiley and Sons Ltd, 2008; Vol. 22, pp. 594–600. [Google Scholar]
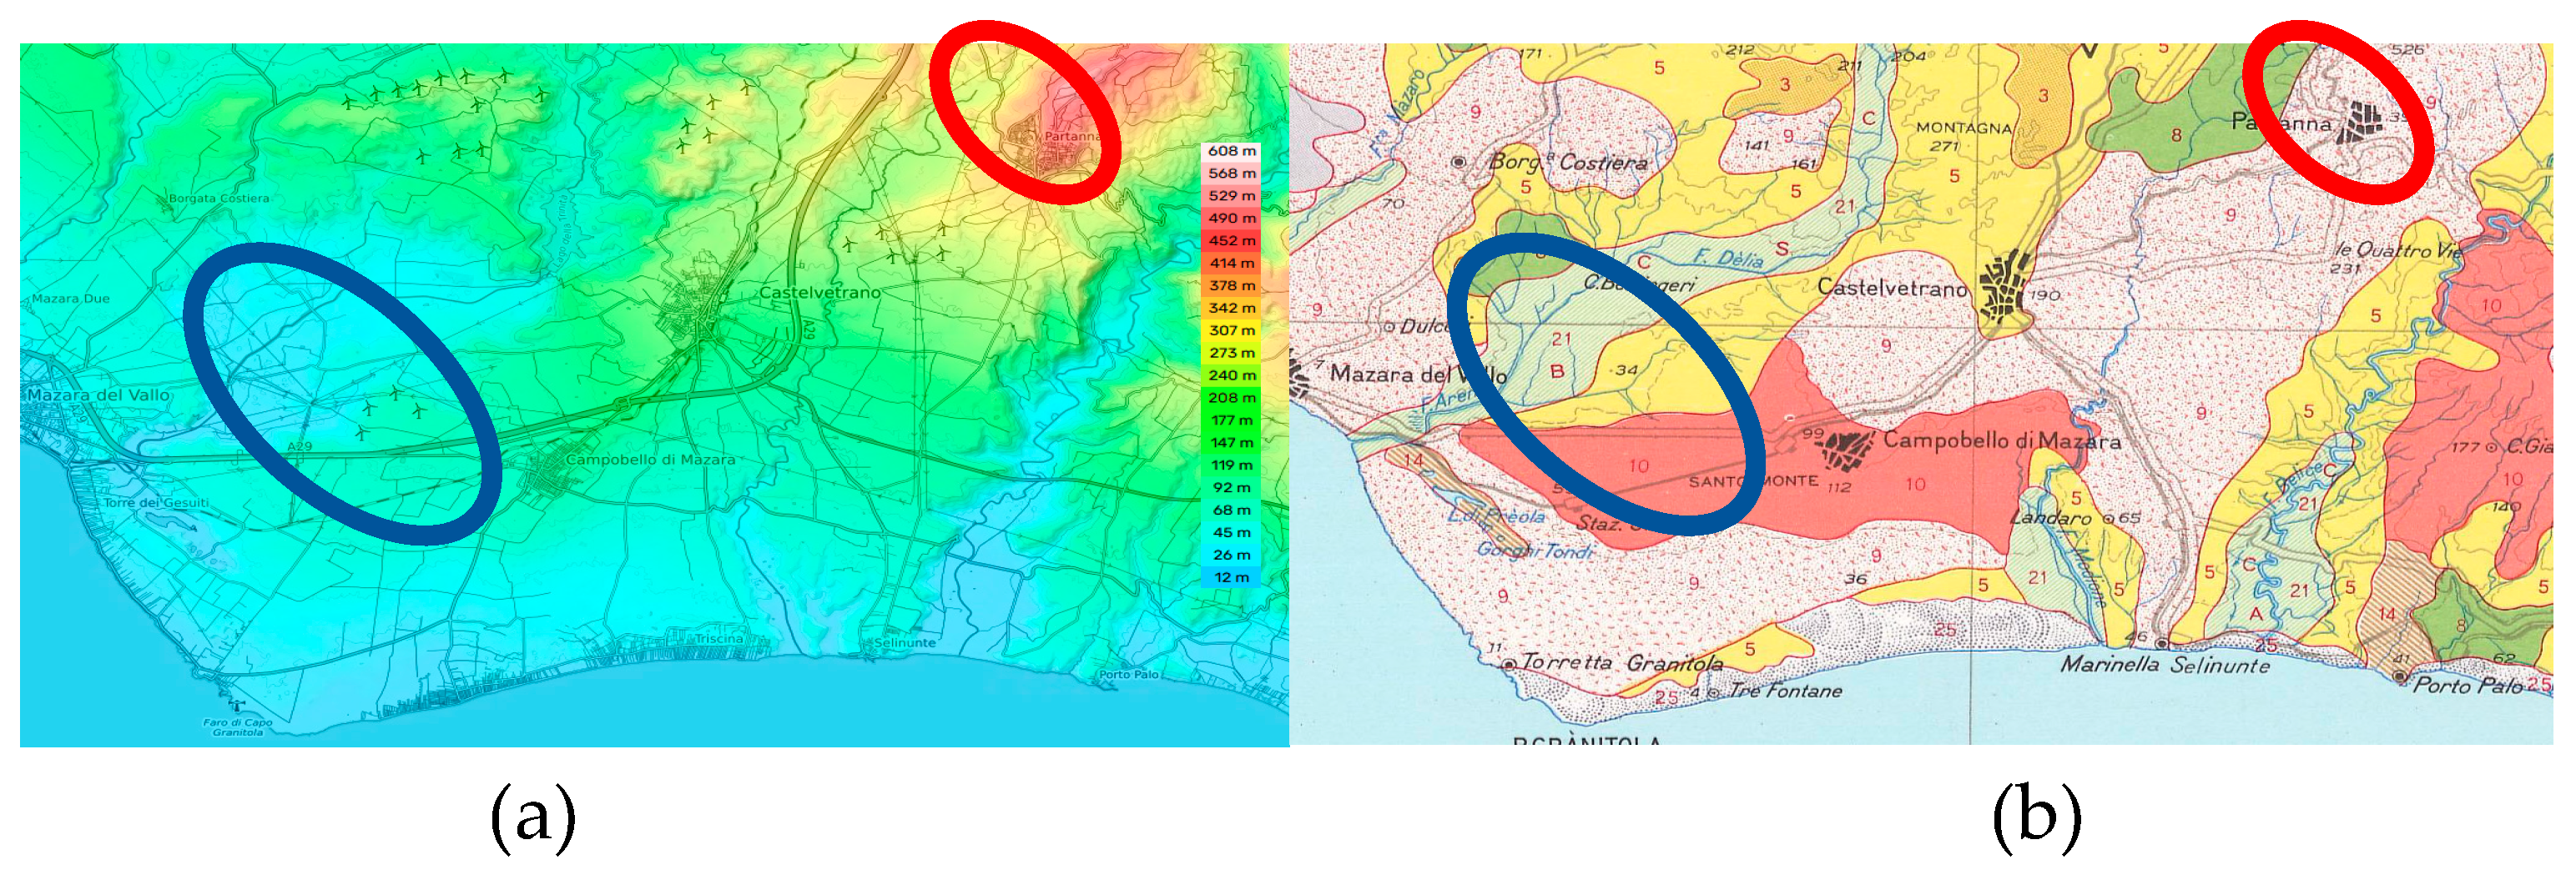
Figure 1. Maps reporting the main differences between sampling zones (a) Topography (b) Soil description and associations. Data were obtained from Sit-AGRO (Sicily Region- Sistema Informativo Territoriale - https://www.sitagro.it/jml/).
Preprints 113267 g001
Figure 2. Histograms representing the compared quantification of the fatty acids/esters by NMR and GC processing in % of the molecular fraction: a) TUFA which is Linolenic acid/esters (Ln); b) DUFA Linoleic acid/esters (L); c) Total mono-unsaturated fatty esters (MUFA which is O+V+PO); d) Saturated fatty acid esters (SFA which is mostly P+S and other minor fatty acids).
Preprints 113267 g002
Figure 3. Comparison by histograms of the total phenolic content measured by NMR and through the traditional spectrophotometric Folin-Ciocâlteu method.
Preprints 113267 g003
Figure 4. Statistical graphs concerning the multi-variate analyses. If there are multiple panels, they should be listed as: (a) PCA score plot showing two group R2 0.606 Q2 0.176; (b) PLS-DA score plot showing two groups with R2 0.889 and Q2 0.789. (c)PLS-DA biplot (d) 60-fold permutations permutation.
Preprints 113267 g004
Figure 5. score contribution that summarizes the importance of the X-variables for both the X- and Y-models.
Preprints 113267 g005
Table 1. NMR detected and quantified metabolites along with the relative label code also used in the statistical methods.
Metabolites code
Squalene molecular % SQ
Linolenate esters % Ln
Linoleates esters % L
Oleic esters % O
Palmitoleic esters % PO
cis-vaccenic esters % V
palmitate esters % P
sterarate esters S
Internal* Linolenate esters % Ln2
Internal* Linoleates esters % L2
Internal* Oleic esters % O2
Internal* cis-vaccenic esters % V2
Oleocanthal TY-EDA
Olaceine HTY-EDA
Ligstroside aglycone (all the derivates) TY-EA
Oleuropein aglycone (all the derivates) HTY-EA
Elenolide ELNL
total Phenolic species TPH
*Internal refers to the 2- esterification point over the glycerol moiety of tri- and di-glycerides, the saturated esters are excluded because of their irrelevant presence. The variables with gray background are those used for the final statistical model.
Table 2. The misclassification table (leave-one-out).
Members Correct 1 2 No class (YPred <= 0)
1 6 100% 6 0 0
2 13 100% 0 13 0
No class 0 0 0 0
Total 19 100% 6 13 0
Fisher's prob. 3.7e-005
Disclaimer/Publisher’s Note: The statements, opinions and data contained in all publications are solely those of the individual author(s) and contributor(s) and not of MDPI and/or the editor(s). MDPI and/or the editor(s) disclaim responsibility for any injury to people or property resulting from any ideas, methods, instructions or products referred to in the content.
Copyright: This open access article is published under a Creative Commons CC BY 4.0 license, which permit the free download, distribution, and reuse, provided that the author and preprint are cited in any reuse.
Prerpints.org logo

Preprints.org is a free preprint server supported by MDPI in Basel, Switzerland.

Subscribe

© 2024 MDPI (Basel, Switzerland) unless otherwise stated