Preprint
Article

Ecological Control of Aphids in Mandarins With Pyroligneous Acid Derived From Biomass

Altmetrics

Downloads

219

Views

37

Comments

0

Submitted:

24 July 2024

Posted:

26 July 2024

You are already at the latest version

Alerts
Abstract
This study investigates the implementation of equipment to obtain pyroligneous acid as an alternative to control aphids in mandarin cultivation on the El Arrayanal farm, Monte Olivo parish, Carchi province, Ecuador. Derived from mandarin pruning biomass using a dry distillation pilot oven, pyroligneous acid is an ecological option compared to synthetic phytosanitary products, with less impact on the environment and human health. Using a DBCA design, different concentrations of pyroligneous acid (250 ml, 500 ml, 750 ml, and 1000 ml) applied to immature shoots affected by aphids were analyzed. The 1000 ml concentration achieved 98% control of the pest. Analysis by Gas Chromatography and Mass Spectrometry (GC-MSD) and Total Polyphenols confirmed the effectiveness of pyroligneous acid. The results of the study, carried out in the research and linkage laboratories of the State University of Bolívar, Guaranda, Ecuador, demonstrated significant differences between the doses applied (p-value <0.005), with greater control in the treatment of 1000 ml of acid pyroleño compared to the 250 ml, 500 ml and 750 ml treatments. This pyroligneous acid has multiple uses in organic agriculture as a bioherbicide, biofungicide, biorepellent and foliar and root biostimulant, representing an alternative to obtain sustainable organic products. Despite operational limitations, local pyrolysis technology can be optimized to increase production, positioning pyroligneous acid as a viable and sustainable alternative in organic agriculture, promoting efficient waste management and reducing the use of chemicals.
Keywords: 
Subject: Environmental and Earth Sciences  -   Other

1. Introduction

The ecological problems derived from the application of synthetic pesticides in the cultivation of mandarins are considerably diverse and relevant (Pisa et al., 2021). These pesticides typically have wide-ranging effects, affecting not only the target pests, but also beneficial insects, birds, and aquatic organisms, among others (Bouket et al., 2022). This disturbance of ecological balance can result in decreased biodiversity and ecosystem health. Furthermore, prolonged and intensive use of these pesticides can generate resistance in target pest populations (Sparks et al., 2020), requiring the use of higher doses or more toxic chemicals, thus exacerbating ecological impacts and increasing production costs for farmers.
In Ecuador since the second half of the 20th century, the process of extension of agricultural production has been accompanied by the application of modern technologies, based on a high use of chemical inputs, among which insecticides stand out (Sánchez & Mendoza, 2019). According to the latest record of pesticide use, worldwide consumption of pesticides has been 4.17 MT, of which 17% corresponds to insecticides (Castillo & Dueñas, 2023). In Ecuador for the same year, consumption was 34 thousand tons, of which 19% corresponds to insecticides (Souza et al., 2012).
One of the crops that requires special attention for pest control and avoiding the indiscriminate use of pesticides are citrus fruits, since pests such as aphids or aphids predominate, which have the potential to become pests of economic importance due to their ability to rapidly increase in number (Alotaibi et al., 2022). Addressing these ecological challenges demands a holistic and integrated approach to pest management in citrus cultivation. This involves the implementation of agroecological practices such as integrated pest management (IPM), organic farming methods, crop diversification, habitat conservation and the use of alternative pest control measures such as biological control agents, pheromones and botanical extracts (Paiva et al., 2024). By decreasing dependence on synthetic pesticides and fostering ecological resilience in mandarin orchards, farmers can safeguard both the environment and human health, ensuring sustainable citrus production for the future (Panwar et al., 2023).
The new pest control alternatives are based on raw materials of plant origin, plant macerates and oil distillates. These are effective against populations resistant to synthetic chemical pesticides, they have a low probability of generating resistance, they have low impact on beneficial fauna and wildlife, they are biodegradable and not very persistent in the environment, they have no time restrictions for entering the treated surfaces. and, for the most part, they are exempt from the maximum residue limit (Gómez et al., 2022).
For years, special attention has been paid to the pyrolysis of biomass to contribute to the reduction of environmental pollution derived from the accumulation of waste and burning in open fields. One of the most important liquid products of wood (Lee et al., 2022)pyrolysis is pyroligneous acid or wood vinegar. Agricultural uses of pyroligneous acid (PA) date back to the 1930s in Japan, when the product began to be applied as an antifungal and antibacterial agent on crops (Pimenta et al., 2018). Several studies on the use of pyroligneous acid (PA) in agriculture report beneficial effects on plant growth, productivity, resistance induction, rooting, the development of beneficial soil microbiota, insect repellency, seed germination and composting(Cândido et al., 2023). It is useful for soil improvement, seed activity, germination and especially in the biological activity of fungal and termite attacks (Choi et al., 2009); (Gomez et al., 2021); (Ofoe et al., 2022); (María Ocampo González, 2015); (Catacora-Pinazo et al., 2019).
In the context of organic agriculture, growing interest has been observed in pyroligneous acid as an alternative with low environmental impact for the management of pests and diseases in crops. Pyroligneous acid, also known as acetic acid, is a natural product derived from the distillation of wood or plant biomass and has been the subject of studies for its potential benefits in sustainable agriculture. A recent study by Carril et al. (Carril et al., 2023) has highlighted the properties of pyroligneous acid and its inclusion in the list of products permitted for use in organic farming in Italy. This acid is made up of more than 200 water-soluble compounds, which have been correlated with its positive effects on plant growth and defenses. It has been observed that pyroligneous acid can act as a plant growth promoter, stimulating seed germination, root growth and the development of plant biomass. In addition, it has been shown to have antimicrobial and antifungal properties, making it an attractive option for the control of diseases of microbial origin in crops.
The inclusion of pyroligneous acid in organic farming represents an important step towards reducing the use of synthetic pesticides and promoting more sustainable and environmentally friendly agricultural practices. However, it is important to highlight the need to continue research on its long-term effects on agricultural ecosystems and its potential to promote biodiversity and soil health. In this sense, pyroligneous acid emerges as a promising tool in organic agriculture, offering a viable and environmentally friendly alternative for the management of pests and diseases in crops. Their inclusion in sustainable agricultural practices can significantly contribute to food security and the conservation of natural resources.
The objective of the present research is to analyze the potential of pyroligneous acid as a promising tool in organic citrus agriculture, exploring its long-term effects on agricultural ecosystems and its ability to promote biodiversity and soil health.

2. Materials and Methods

2.1. Study Area

The experiment was carried out on the El Arrayanal farm, located in the Monte Olivo parish, Bolívar canton, Carchi province, Ecuador (Figure 1). This property exhibits a mixed relief, with slopes that vary from 20% to 30% in the lowest areas, while, in the highest areas, known as "pie de monte", the slopes exceed 65%. Its altitude is 2432 meters above sea level. The predominant soils are clay loam, with the presence of cangahua and accumulation of stones of volcanic origin, with an organic matter content that oscillates around 2% in certain areas.
These characteristics have influenced crop selection, especially favoring citrus trees due to their resistance to soil conditions. The classification of the farm's soils varies between categories II (they require moderate conservation practices and can be used for tilled crops, pastures, natural grazing fields and forestry) and III (recent alluvial soils, flat, deep, with a sandy texture. to clay loam, with a moderately acidic to neutral reaction and moderate natural fertility), which makes them suitable for permanent crops. However, these lands require special conservation practices due to their light to moderate limitations.

2.2. Extraction of Pyroligneous Acid from Mandarin Pruning Biomass

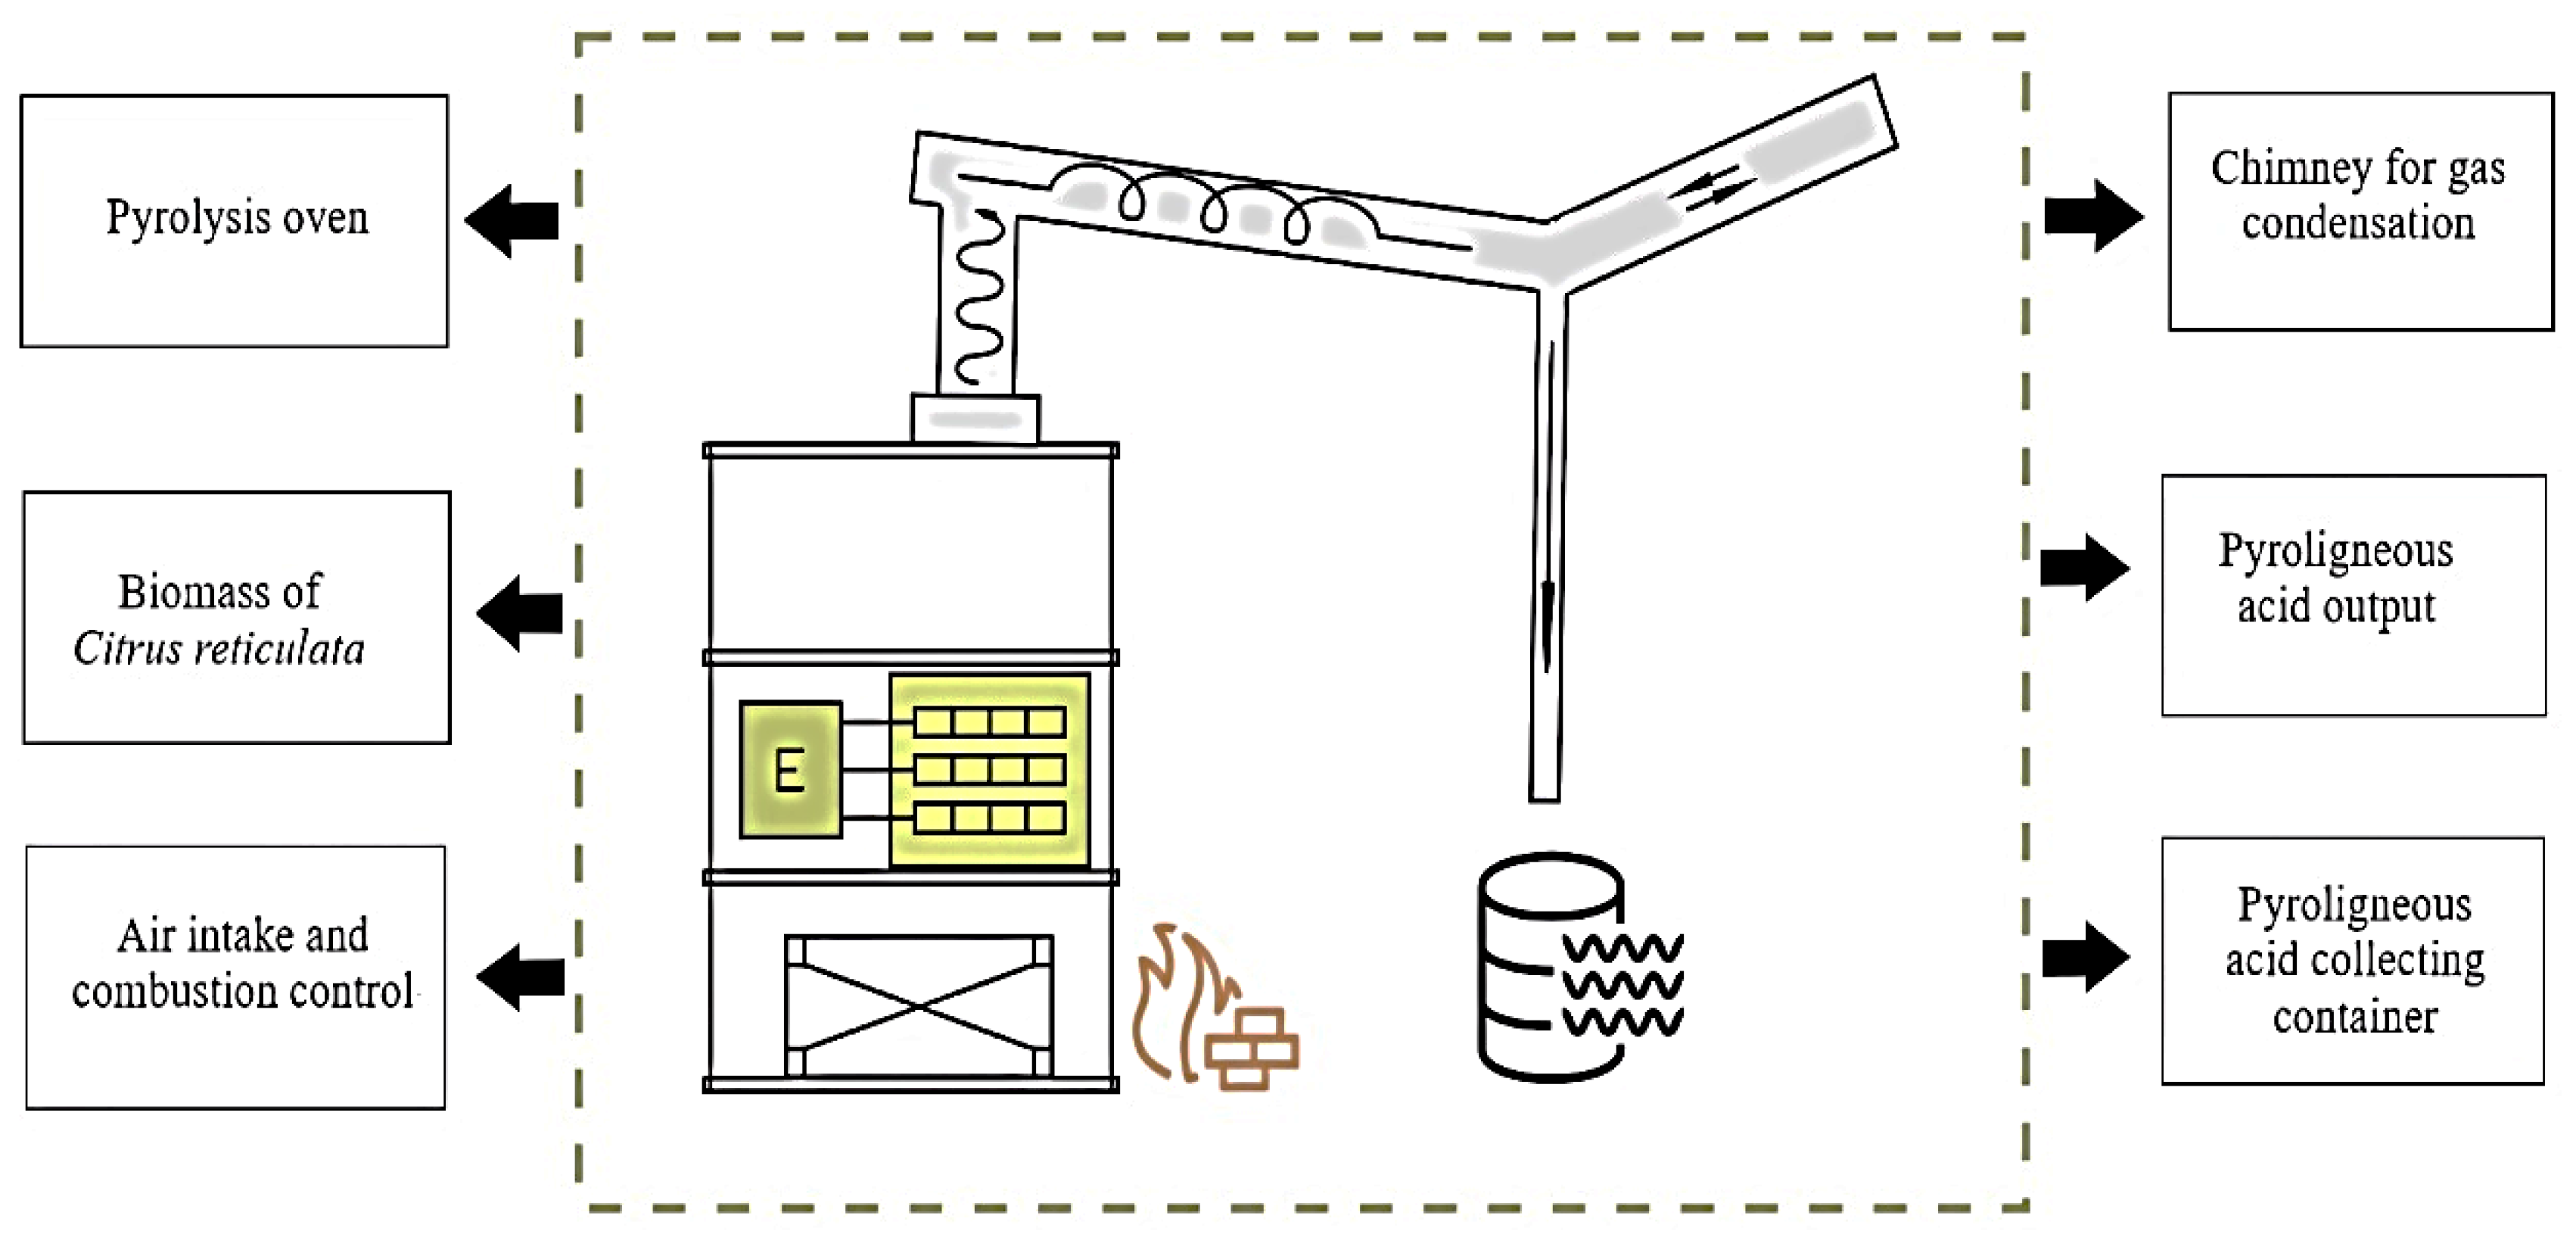
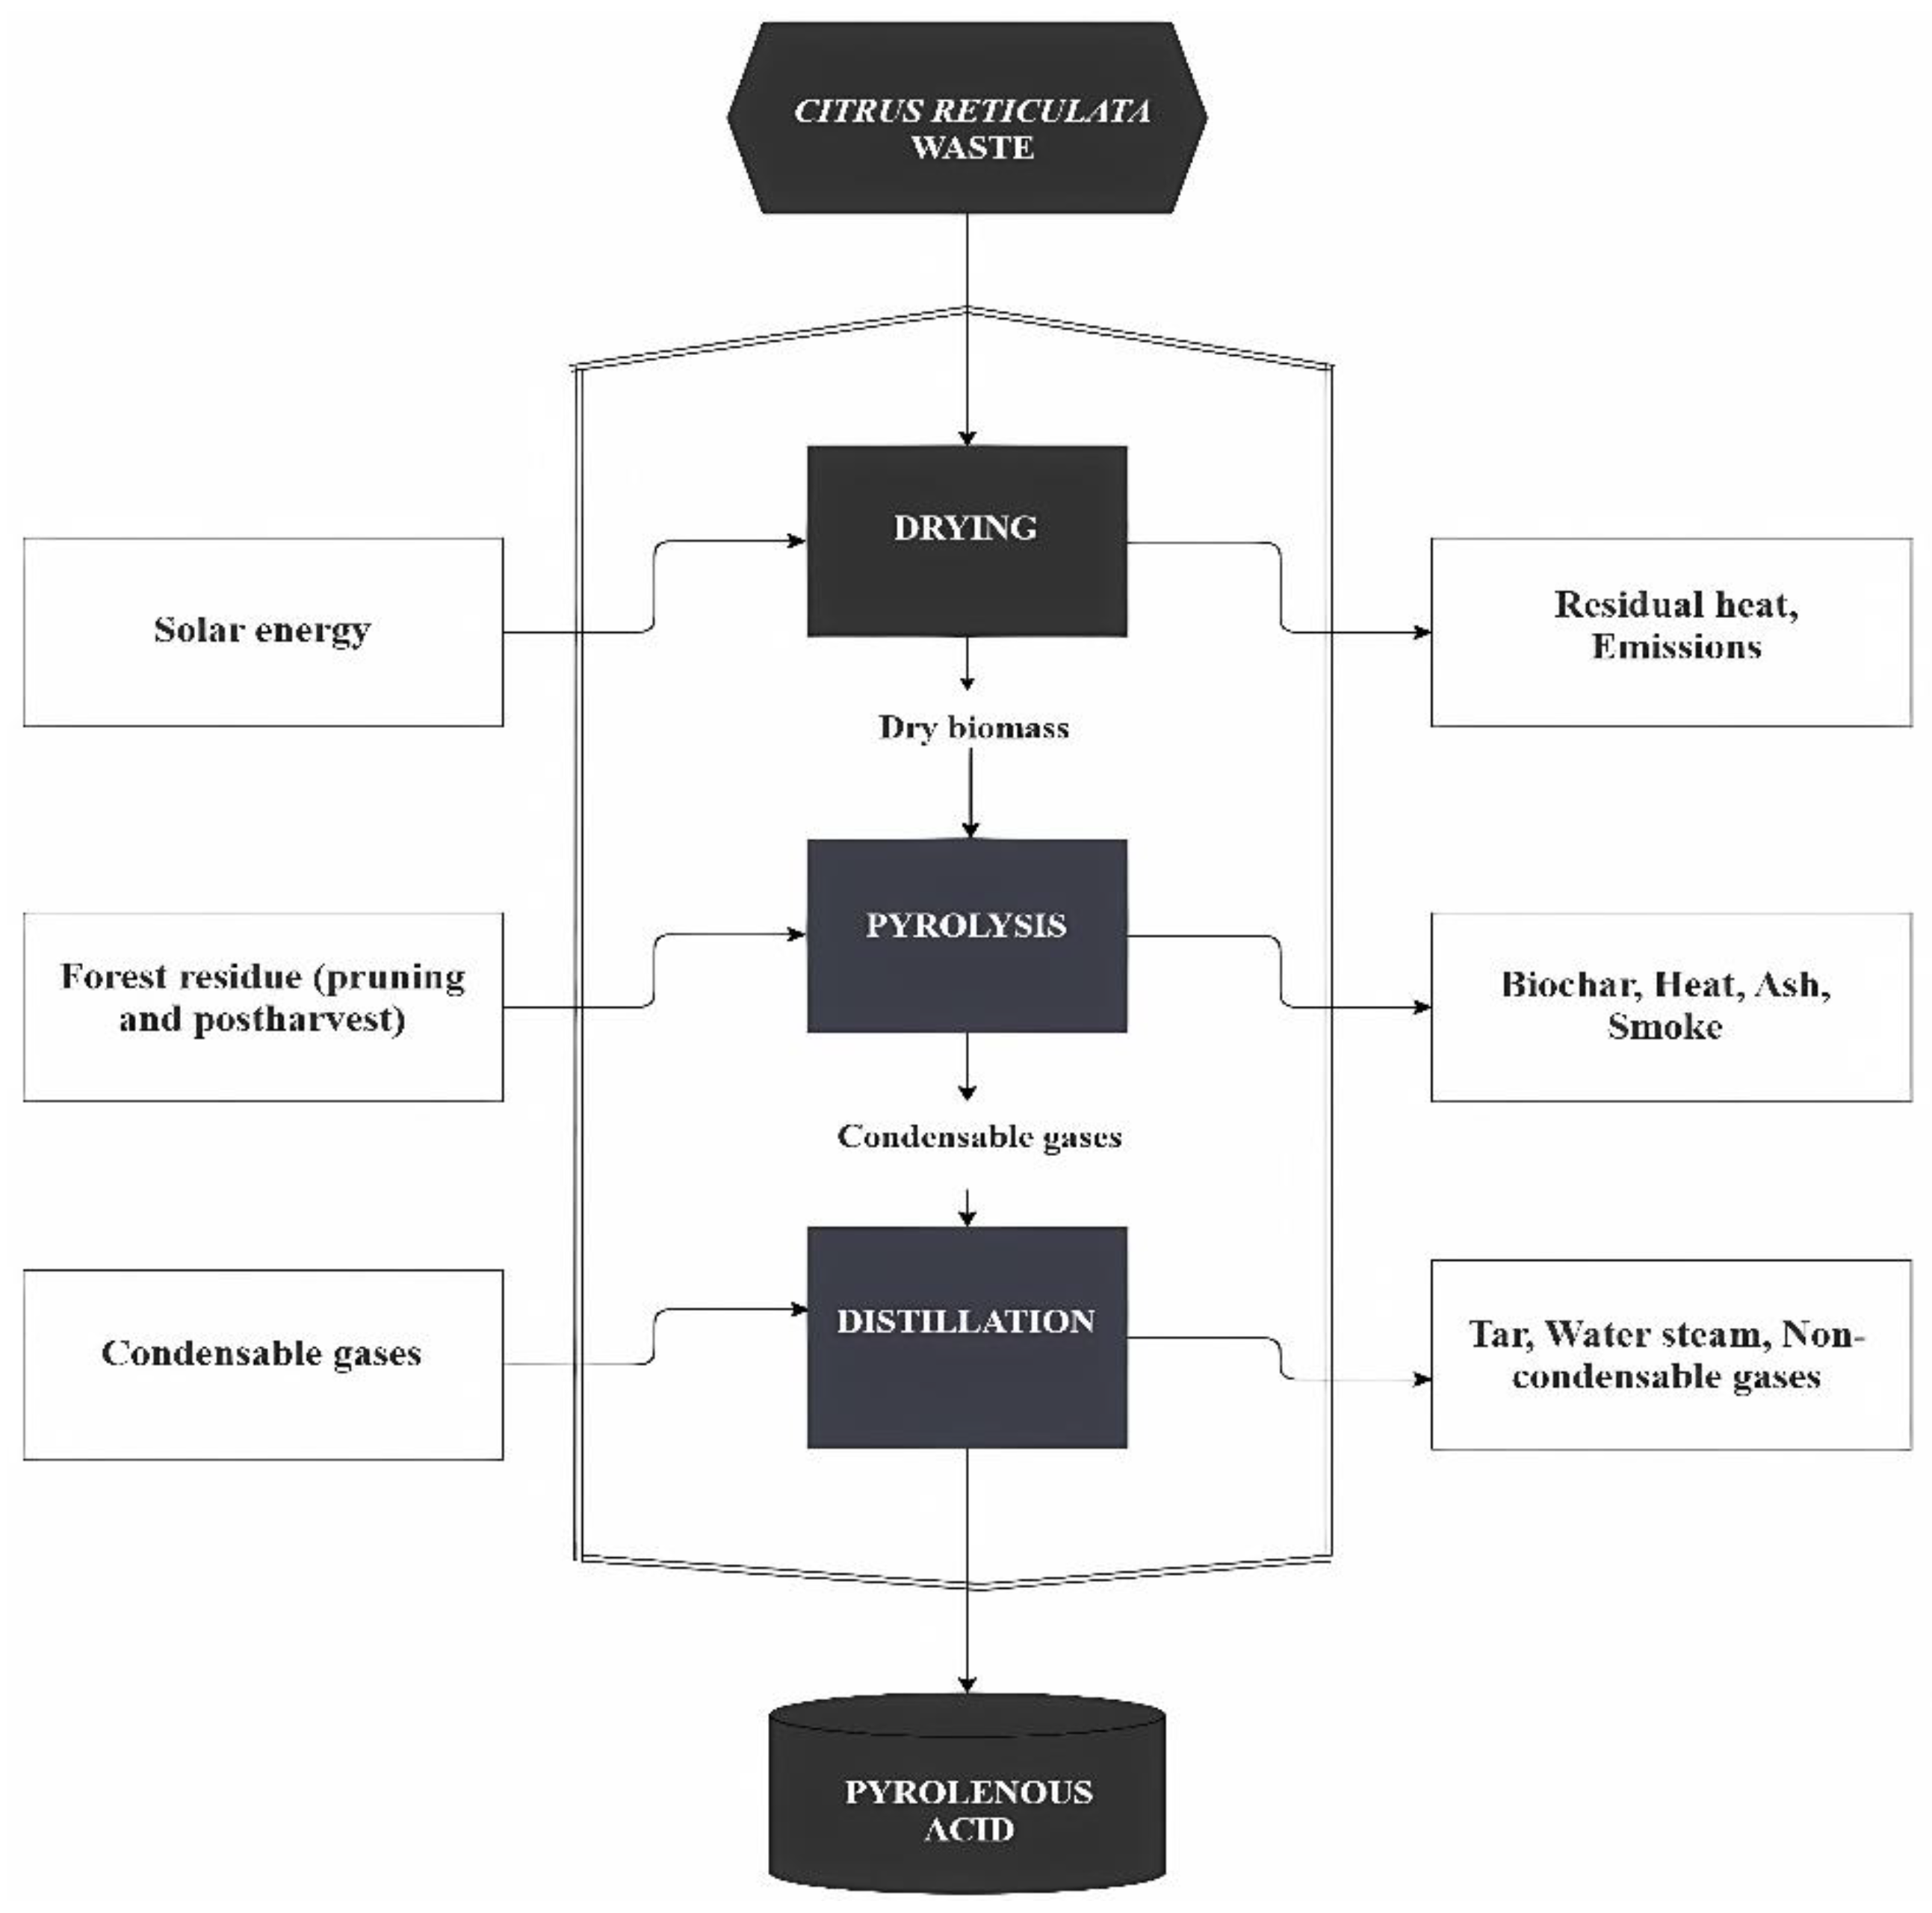
Pyroligneous acid, commonly known as "wood vinegar", was obtained through the dry distillation of the biomass of post-harvest waste of leaves, peels and fruits, as well as the prunings of mandarin (Citrus Reticulata). A pretreatment of the biomass was carried out, leaving it exposed to the sun for drying until reaching a humidity level of 10 to 15%. Subsequently, this raw material was cut into 25-centimeter pieces and arranged in layers inside the pyrolysis oven: a layer of thin wood, followed by a layer of post-harvest waste and finally a layer of thick wood (Figure 2).
For extraction, an oven designed with a metal tank with a capacity of 200 liters and a depth of 89 cm was used, functioning as a slow combustion pyrolysis oven. The oven was filled leaving a space of 20 cm between the biomass and the lid to have greater smoke storage. An aluminum tube four meters long and 2” in diameter with a thickness of 3 mm was used as a chimney to direct the smoke generated during carbonization. The chimney was designed with two slopes to optimize the use of smoke: tube 1 has an inclination of -5°, while tube 2 has an inclination of -10°. Finally, a polyethylene collecting container with a capacity of 10 liters was used at the end of the tube to collect the condensed pyroligneous acid.
The smoke produced during carbonization was directed through a tube with two slopes for condensation. During this process, the pyroligneous acid, which has evolved as a gas, was condensed and collected in the designated container. In this experiment, the chemical decomposition of wood products by destructive distillation included the formation of charcoal, pyroligneous acid, and wood tar.
Once the pyroligneous acid was obtained, it was passed through a homemade filter that contained the carbon resulting from pyrolysis, to retain the heavier components of the tar. Subsequently, it was filtered using qualitative filter paper of medium filtration, with a diameter of 125 mm, which has a particle retention capacity of 11 µm with an efficiency of 98% (Gómez et al., 2021), with the aim of eliminating most of the light tar present in mix. Once filtered, a pH of 3.8 was determined for our pyroligneous acid sample. Finally, this was stored in amber glass containers, well sealed and protected from sunlight (Figure 3).

2.3. Characterization of Pyroligneous Acid

The pyroligneous acid obtained was stored in an airtight container for later use in the field. A 250 ml sample was extracted for chemical analysis in the laboratory. To identify and quantify its components, an analysis was carried out using Gas Chromatography-Mass Spectrometry (GC-MSD) for the identification of volatile compounds, and analysis of Total Polyphenols. These procedures were carried out in the research and linkage laboratories of the State University of Bolívar, Guaranda-Ecuador.
The characterization of pyroligneous acid was carried out using specific equipment: an Agilent Technologies 7890 A Gas Chromatograph, equipped with an Agilent Technologies 5977A MSD detector and a DB- WAXetr column (60m x 0.250mm x 0.25μm). The analysis conditions were as follows: injector temperature of 250°C, Helium carrier gas at a flow of 0.9 mL /min in splitless injection mode. The oven thermal program began at 40°C for 5 minutes, with a temperature increase from 40°C to 180°C at a rate of 3°C/min, followed by an increase from 180°C to 240°C at 8 °C/min for 20 minutes. The detector temperature was maintained at 250 °C and the total run time was 79.167 minutes.

2.4. Experimental Design

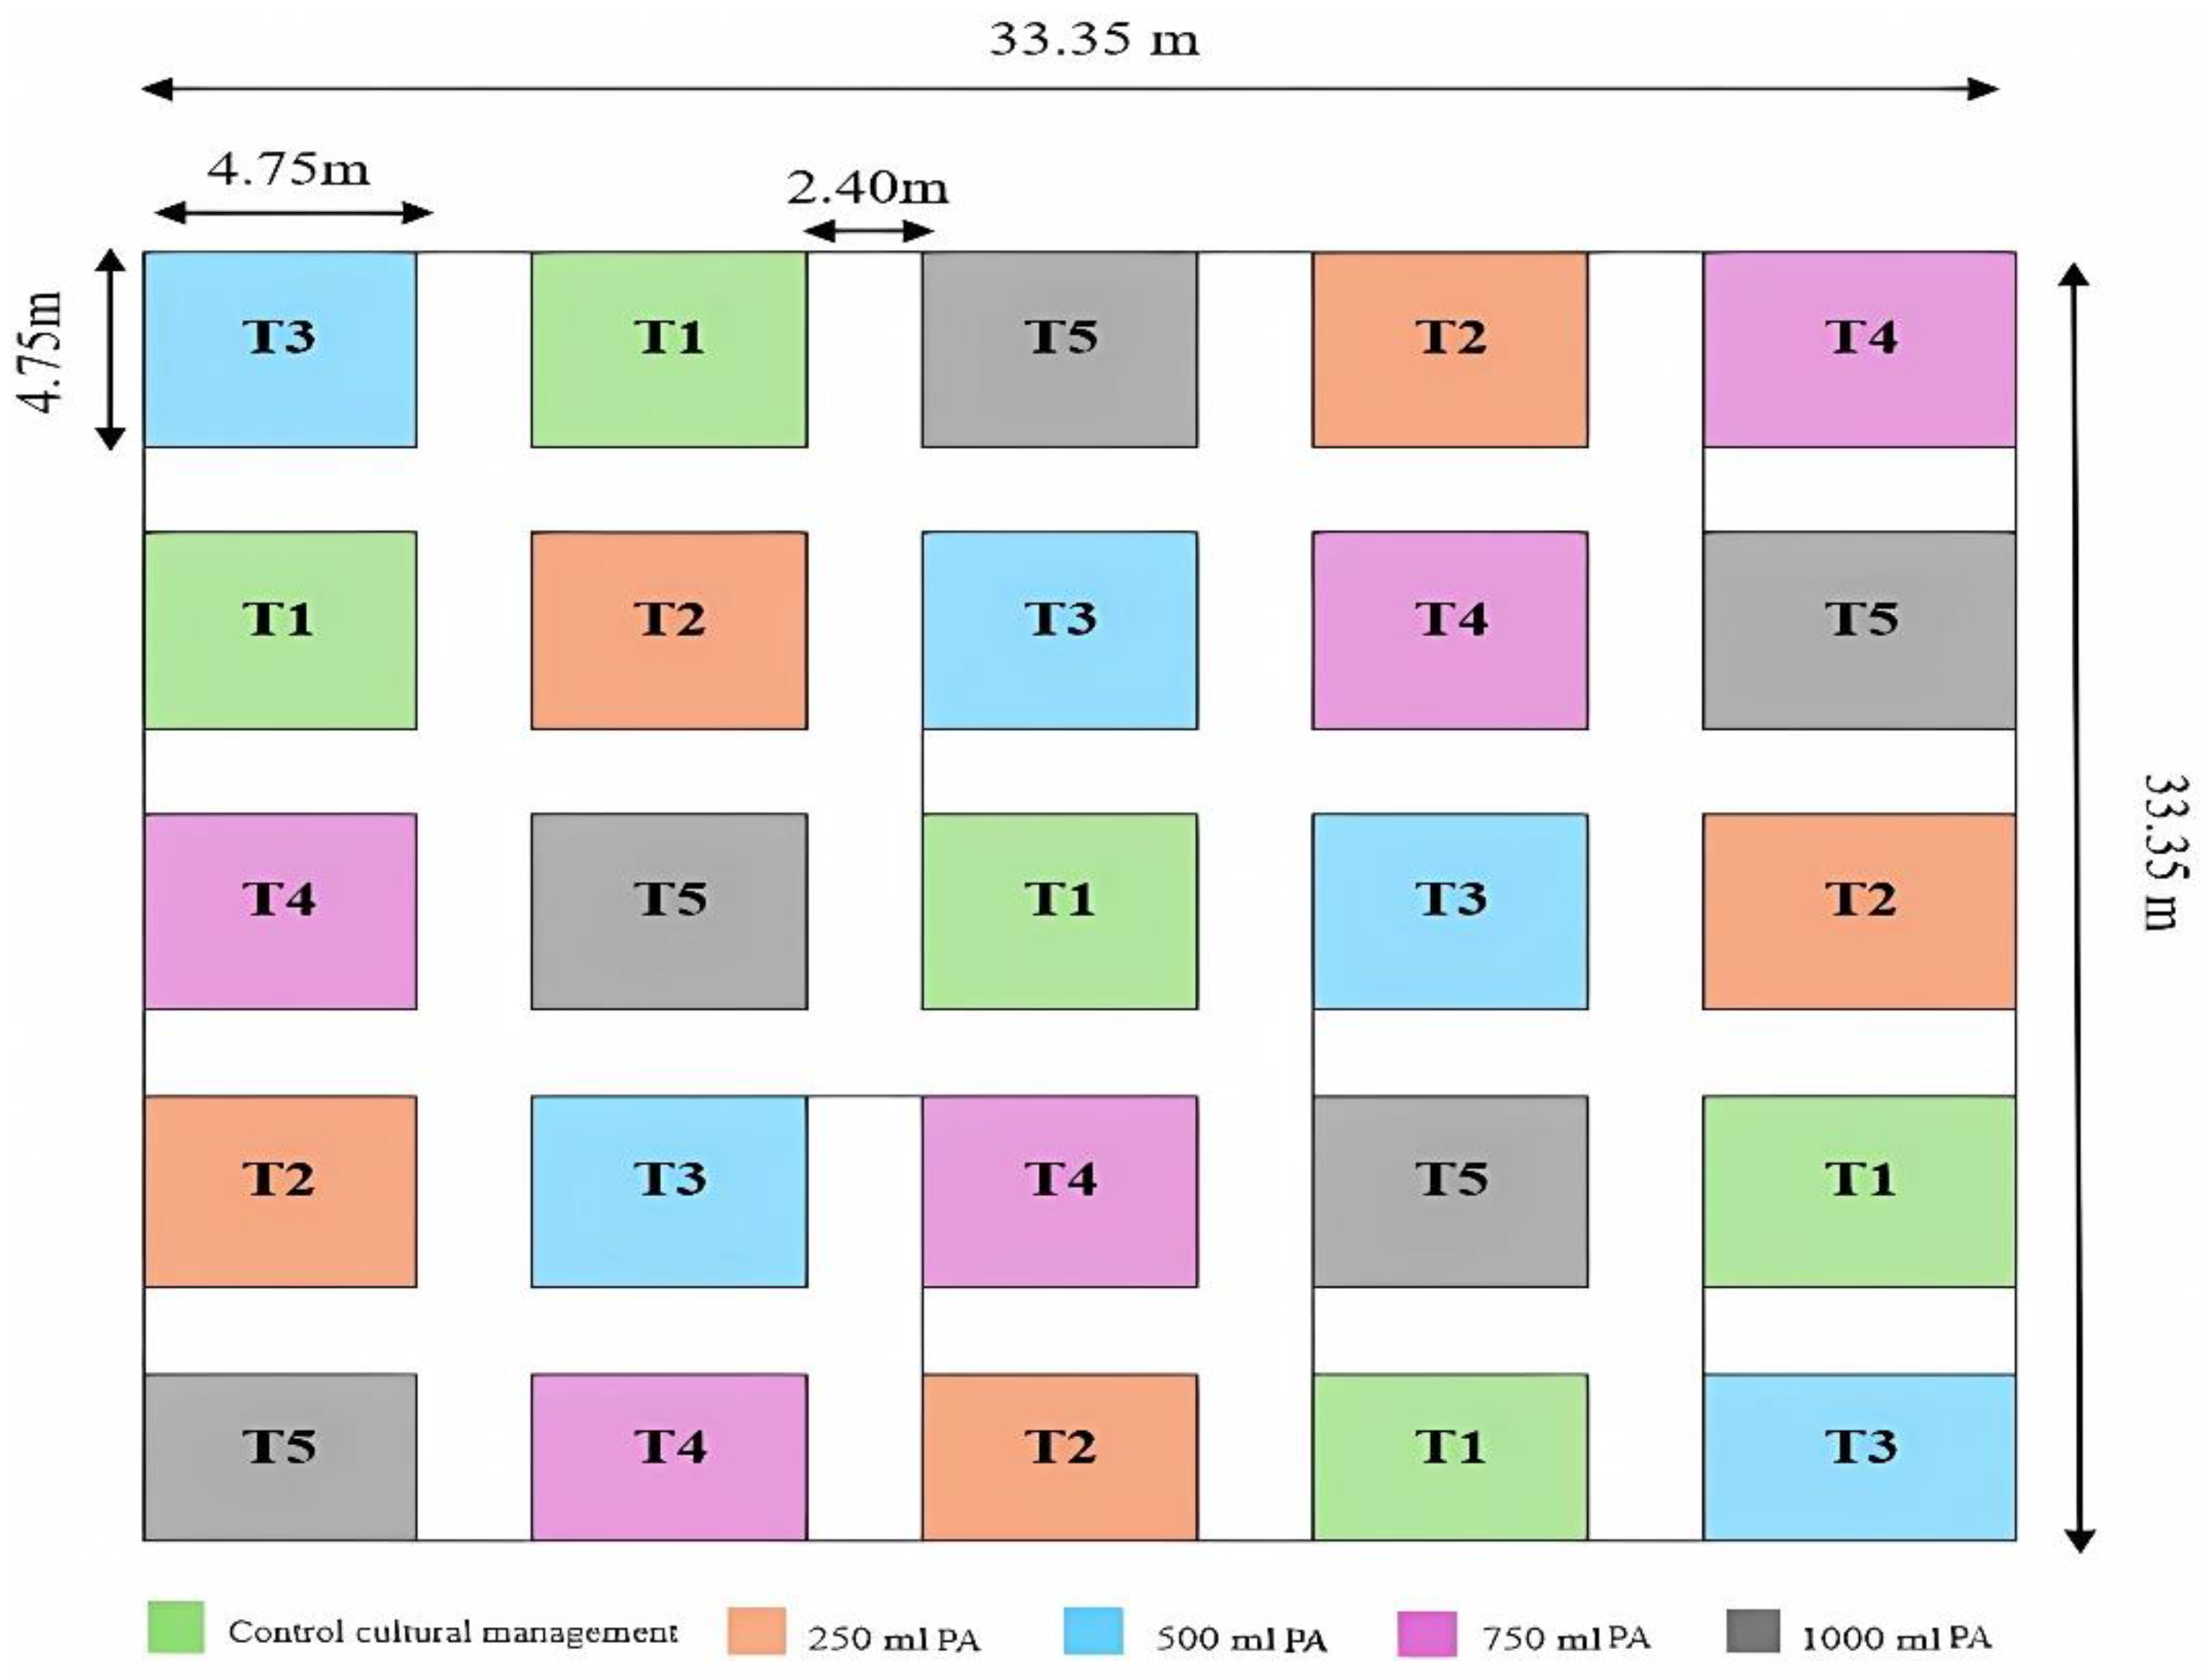
Pyroligneous acid was applied to mandarin crops of the Satsuma variety on trees in production, which were approximately 7 years old. The study plots had dimensions of 4.75 by 4.75 meters each, with a distance between them of 2.40 meters. Each plot was made up of four mandarin plants. For the experiment, a population of 100 Citrus reticulata plants distributed in 25 plots was selected, considering a population of 100 A. spiraecola for each net plot of the experiment. The application of the different doses was carried out every 4 days. 250 ml, 500 ml, 750 ml and 1000 ml of the respective solution were diluted in one liter of water with a pH of 7.5. The dosage for each plot was carried out using a one-liter capacity atomizer from the Klintek brand, which had an adjustable nozzle.
The design of the plots was carried out according to Figure 4, which were divided into 5 blocks in an area of 1112 m2. Three repetitions were applied for each dose in the 25 experimental units.

2.5. Statistical Analysis

For this study, a DCA randomized block design was used for the treatments. ANOVA analysis of variance was used to determine the significant differences between the treatment groups and a post-hoc test, the Tukey test was applied to determine the significant differences between each of the treatments. For statistical analysis (Othman et al., 2023)I use a one-way analysis of variance ANOVA to understand the interaction of the independent variables with the dependent variables and I apply a Tukey test to analyze the differences between treatments. The analyzes were performed at a 5% error probability. The statistical data were analyzed in the INFOSTAT statistical software version 2020I.

3. Results and Discussion

3.1. Characterization of Pyroligneous Acid

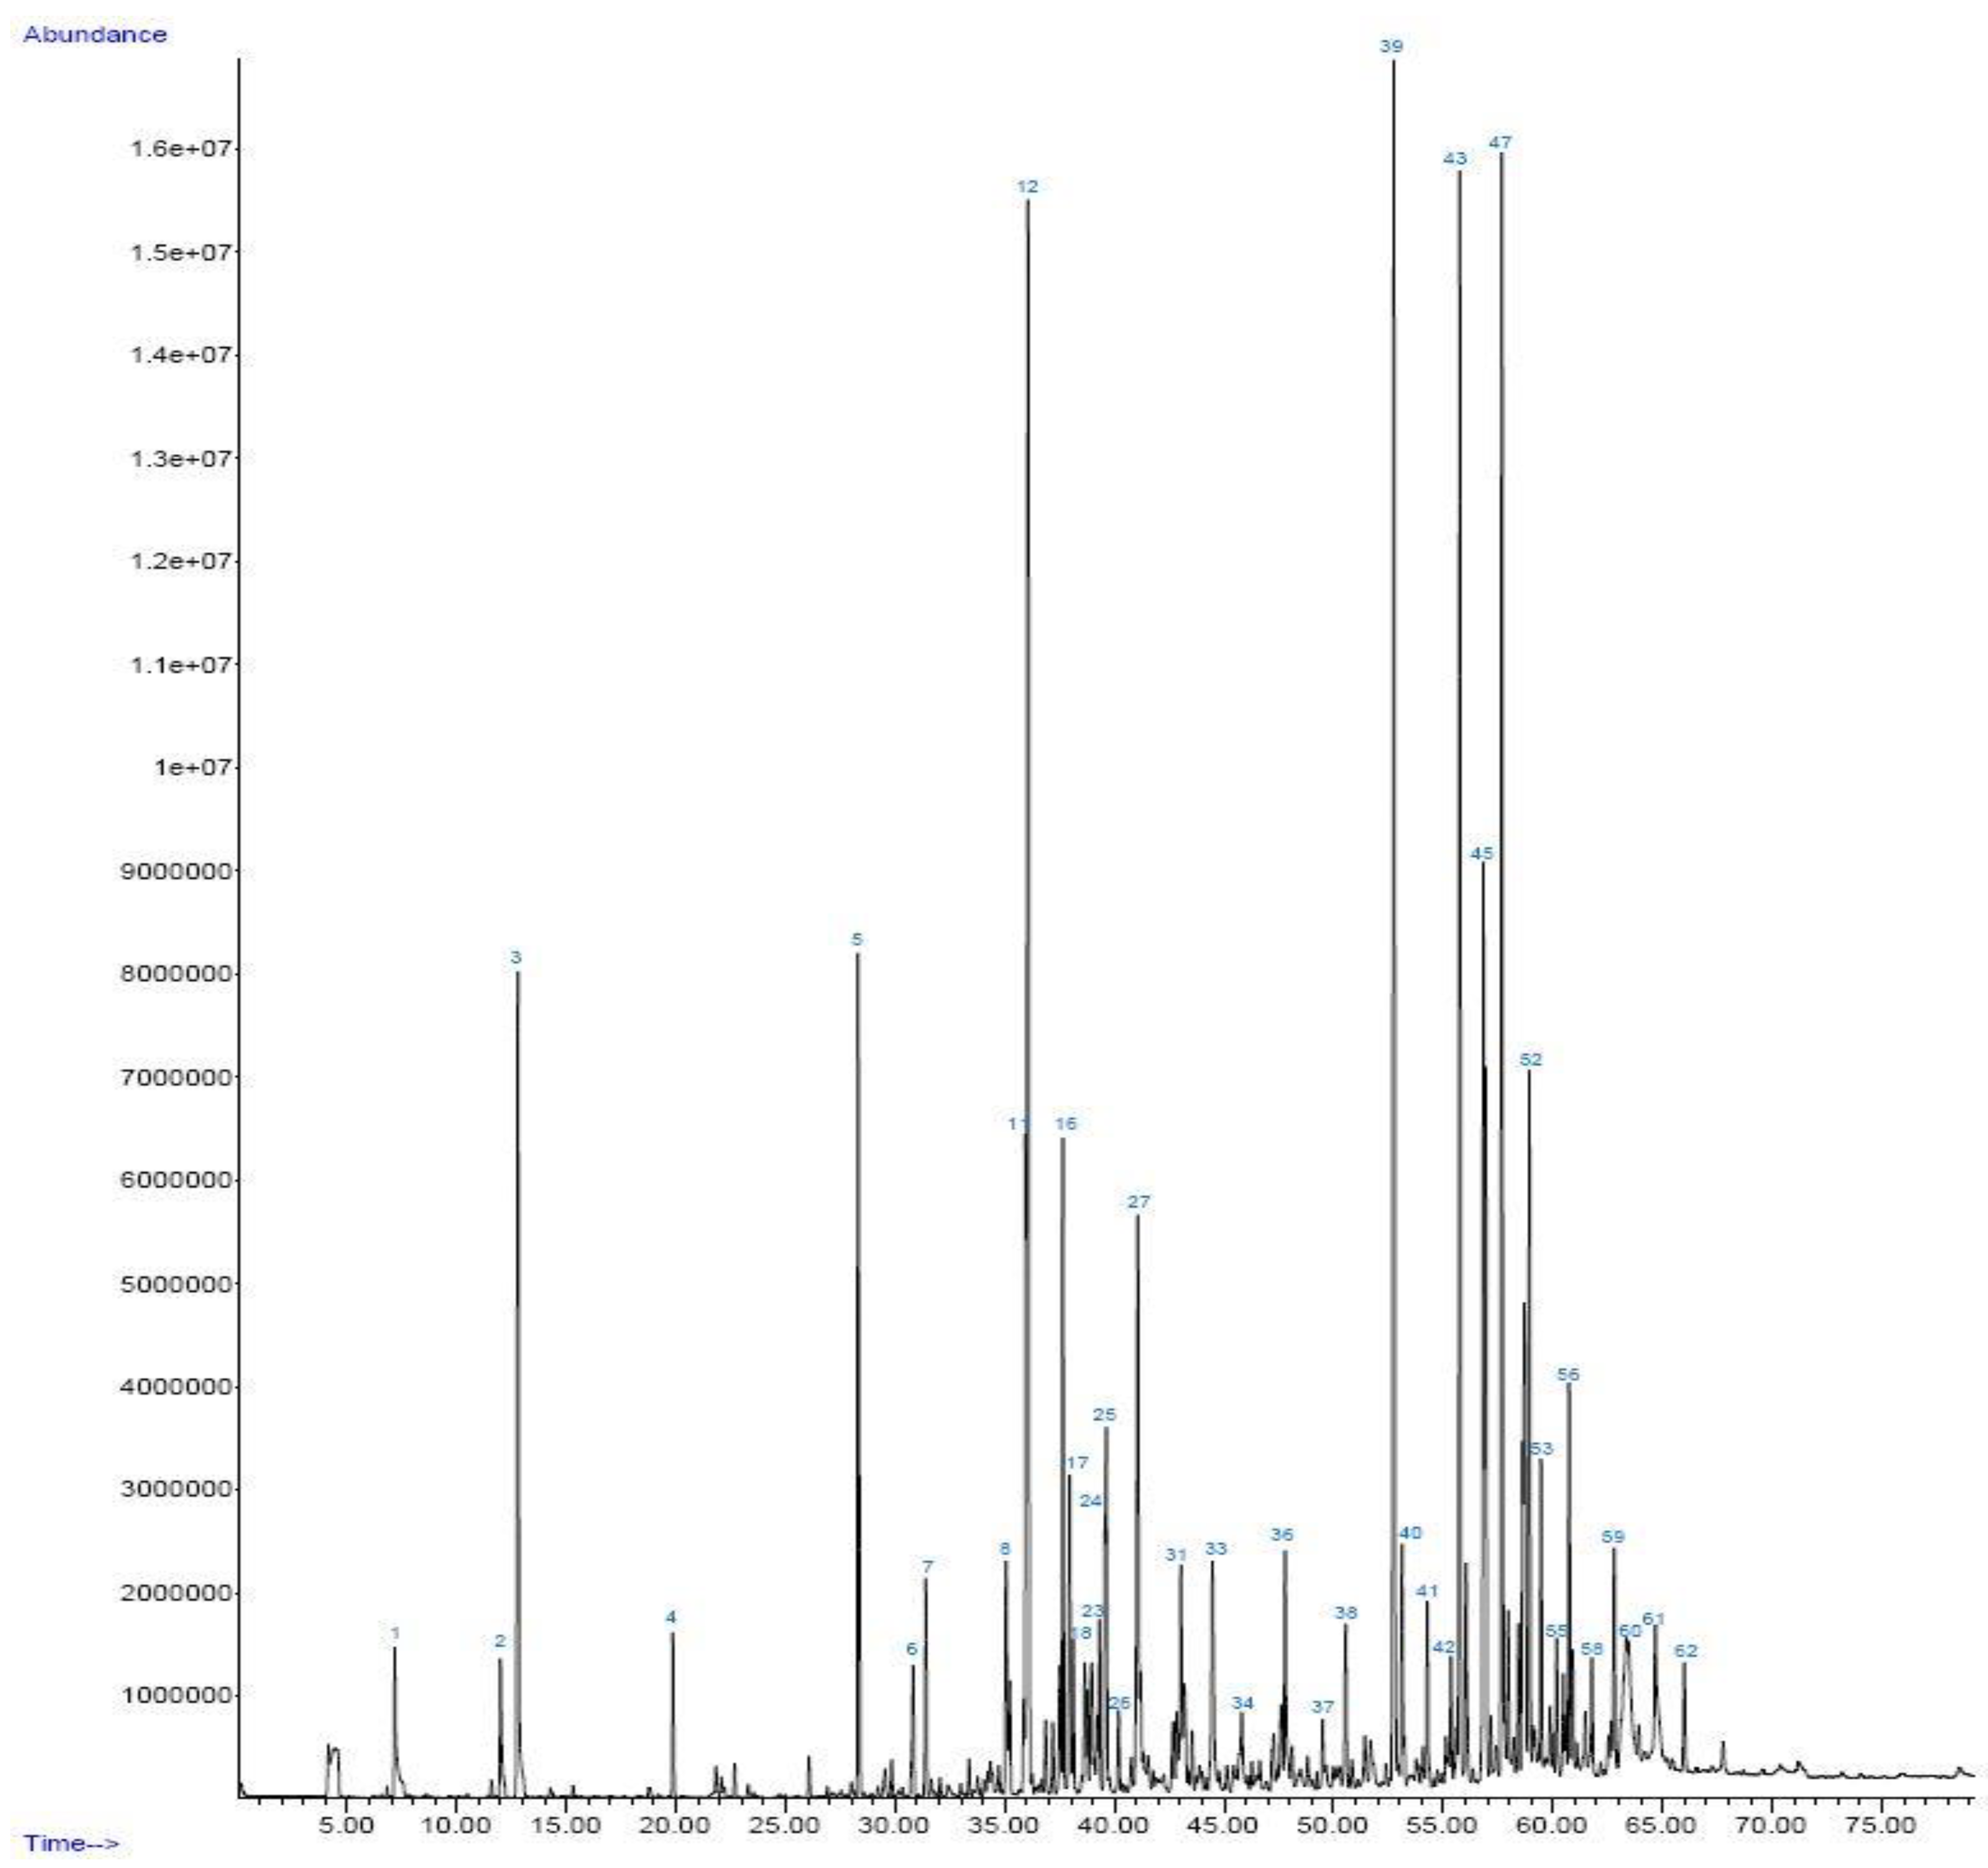
The pyroligneous acid was subjected to exhaustive analysis using gas chromatography coupled to mass spectrometry (GC-MS) to identify its volatile compounds. A total of 62 volatile compounds were detected, detailed in Table 1. Among these compounds, various cyclic siloxanes, phenols and heterocyclic derivatives were found. Compounds such as furfural stand out, with a high relative area of 9.48%, as well as several phenols, such as creosol, with areas that vary from 0.32% to 7.00%.
The results reveal the presence of a wide range of organic compounds in the sample, including phenols, furfurals and various derivatives of cyclopentenones and siloxanes. The identification of these compounds was carried out using the NIST14 Library, which allows a precise characterization of the chemical composition of the analyzed pyroligneous acid. This detailed analysis is essential to fully understand the nature of pyroligneous acid and explore its potential application in various industrial and research sectors.
In Figure 5, the chromatogram shows the presence and relative abundance of different compounds in the analyzed sample. Numbered compounds with specific retention times can be identified by comparison with standards or databases. The highest peaks indicate the most abundant compounds in the sample. Each number corresponds to a specific compound detected at a particular retention time. Higher peaks, such as those labeled 12 and 39, indicate that those compounds are present in greater quantities in the sample. Compounds with shorter retention times (peaks on the left) elute from the column more rapidly, generally indicating more volatile or less polar compounds. Compounds with longer retention times (peaks on the right) elute more slowly, which may indicate less volatile or more polar compounds.
Note: Y axis (Abundance): represents the abundance or intensity of the detected compounds. The higher the peak height, the higher the concentration of the corresponding compound. X axis (Time): represents the retention time, that is, the time it takes for each compound to elude the chromatography column and reach the detector. Peaks: Each peak in the chromatogram corresponds to a different compound. The height of the peak indicates the amount of the compound, and the position in the retention time suggests the identity of the compound.

3.2. Analysis of Total Polyphenols

The results presented in Table 2 show a direct relationship between the concentration of the substance and the absorbance measured at a wavelength of 750 nm. The observed trend is consistent with the Beer -Lambert Law, which states that the absorbance of a solution is directly proportional to its concentration, provided that the system is within the range of linearity and that the experimental conditions are constant.
At lower concentrations, such as 100 mg/L, the average absorbance is 0.22. The variability between individual measurements is minimal (0.21 to 0.24), indicating good precision in the measurements at this concentration. As the concentration increases to 200 mg/l, the average absorbance increases to 0.40, with individual measurements ranging between 0.38 and 0.41, showing slight variability. This increase in absorbance is proportional to concentration, as expected from theory.
At the 300 mg/L concentration, the average absorbance is 0.55, with individual measurements grouped evenly between 0.55 and 0.56, indicating stability in the readings. At 400 mg/l, the average absorbance reaches 0.77, with individual measurements of 0.77 to 0.78, maintaining a constant relationship between concentration and absorbance. Upon reaching 500 mg/l, the average absorbance is 0.96, with individual values between 0.96 and 0.97, showing that the relationship remains proportional and reliable at higher concentrations. Finally, at the concentration of 600 mg/L, the average absorbance is 1.16, with individual readings ranging from 1.14 to 1.17. This increase confirms the linear relationship between concentration and absorbance in the evaluated range. The consistency in absorbance measurements at different concentrations reinforces the validity of the analysis method used. The lower variability in readings at higher concentrations suggests that the device measures higher absorbances with greater precision.
The results obtained are in accordance with the analytical theory and the Beer -Lambert Law, which predicts a linear relationship between concentration and absorbance. This indicates that the method used is suitable for measuring concentrations within the range studied.
The results presented in Table 3 offer a detailed analysis of total polyphenols in a pyroligneous acid sample using the Folin-Ciocalteu method. The table summarizes the data for absorbance, concentration, dilution factor, and milligram equivalents of gallic acid per liter of sample, along with the average of these values.
The absorbance measured at 750 nm for the pyroligneous acid sample was consistent in all determinations, with a constant value of 0.52. This consistency in absorbance indicates that the measurement procedure was stable and that there were no significant variations in the analysis conditions. The concentration of the sample, calculated based on absorbance, is 267.96 mg/l. This value provides a clear indication of the number of polyphenols present in the sample.
The dilution factor used in the analysis was 61, which is crucial data to interpret the results. Dilution is used to adjust the sample concentration to the appropriate measurement range for the Folin-Ciocalteu method, ensuring that the readings are accurate and representative of the total amount of polyphenols.
The measurement of equivalent milligrams of gallic acid per liter of sample is 16345.56 mg Eq. AG/l. This value, obtained consistently in the three determinations, provides an accurate quantitative evaluation of the polyphenol content in the sample. Gallic acid equivalence is a standard measure to compare polyphenol content between different samples and studies, since gallic acid is used as a reference in this type of analysis.
The average milligram equivalents of gallic acid per liter of sample is also 16345.56 mg Eq. AG/l, which confirms the consistency and precision of the determinations made. The lack of variation in the absorbance and concentration results reinforces the robustness of the analysis method used.
The data obtained for pyroligneous acid show high precision and reproducibility in the analysis of total polyphenols using the Folin-Ciocalteu method. The consistency in measurements and calculated values suggest that the method is reliable for the quantification of polyphenols in this specific sample. The proper interpretation of these results will allow a better understanding of the content of phenolic compounds in pyroligneous acid and will facilitate comparisons with other studies and samples.
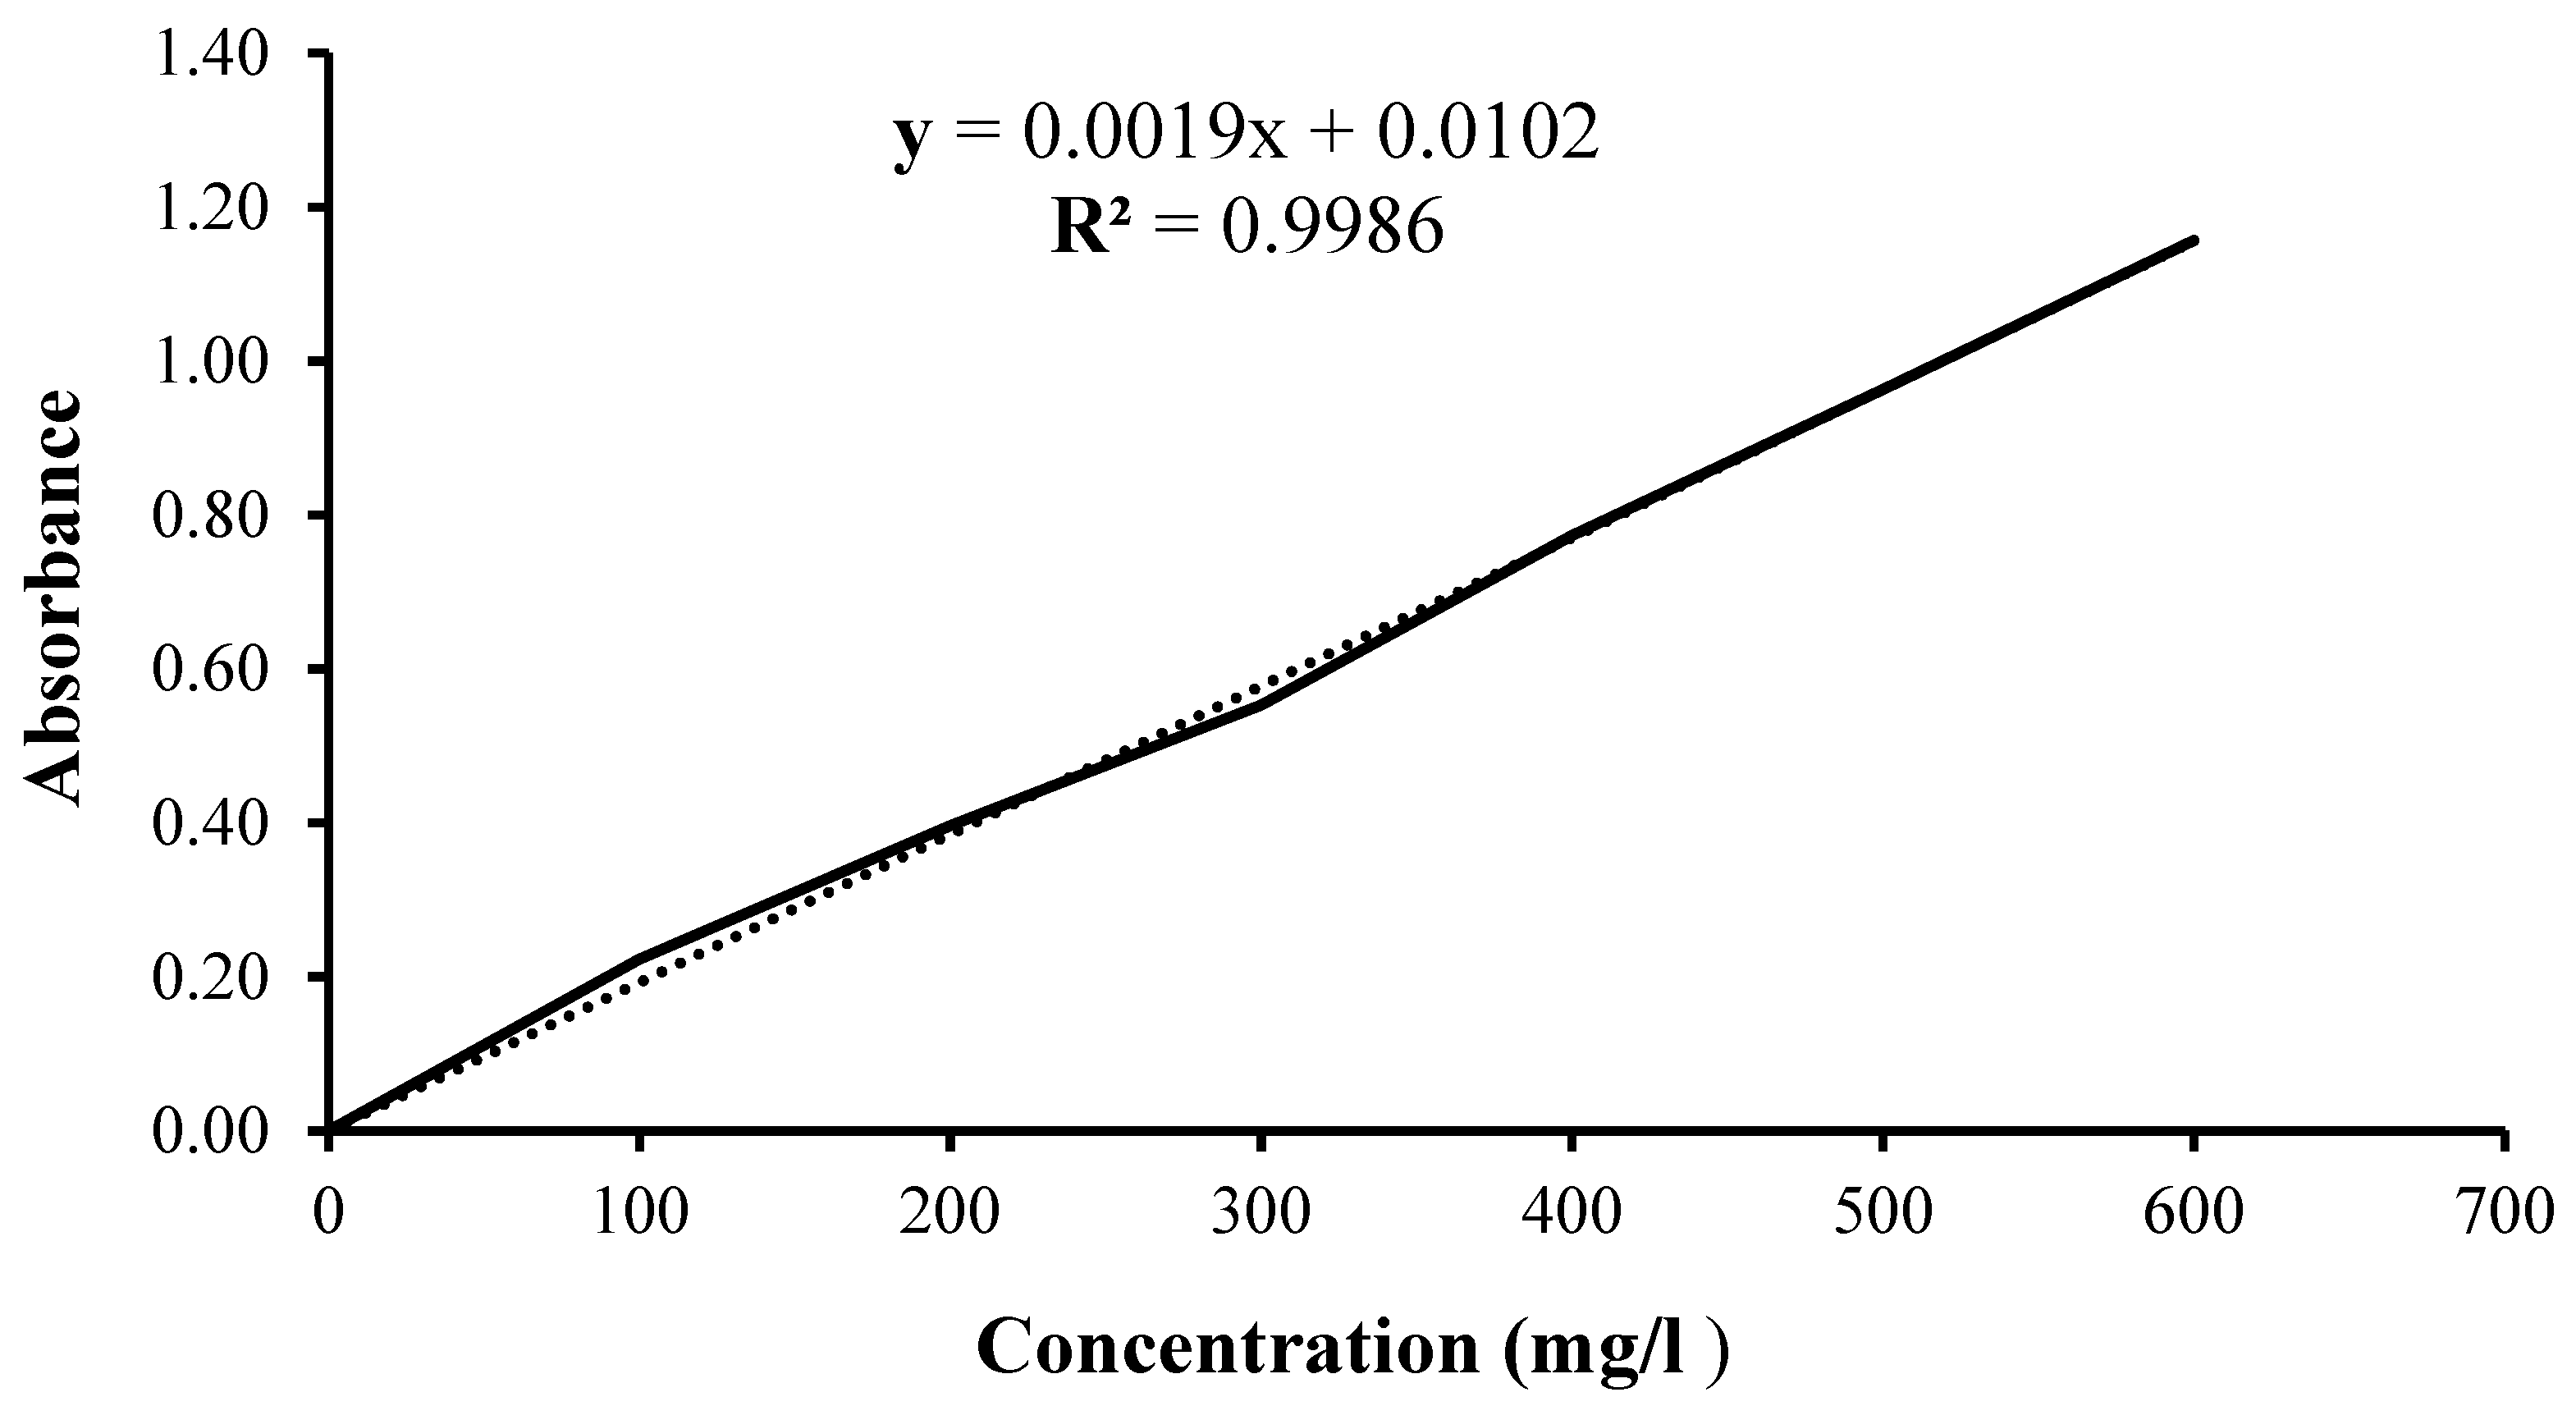
Figure 6 shows the standard curve of gallic acid, showing a clear positive linear relationship between the concentration of gallic acid and the measured absorbance. The figure plots absorbance on the Y axis versus gallic acid concentration on the concentration.
The solid blue trend line in the figure reflects the linear relationship between concentration and absorbance, with the trend line equation given by y=0.0019x+0.0102. This equation provides a key tool for the quantification of gallic acid in unknown samples, allowing the concentration to be determined from the measured absorbance. The slope of the line, 0.0019, indicates the change in absorbance for each unit increase in gallic acid concentration. A relatively low slope value suggests that the change in absorbance per unit concentration is modest, which is typical for most spectrophotometric methods. The constant term, 0.0102, represents the intercept on the Y axis, indicating the absorbance value when the gallic acid concentration is zero. This value may reflect background noise or the intrinsic absorbance of the experimental system, which must be considered when interpreting the results.
The coefficient of determination R2 of 0.9986 indicates an exceptional fit of the trend line to the data. An R2 value close to 1 suggests an extremely strong correlation between gallic acid concentration and absorbance, confirming that the linear relationship is appropriate, and that the equation provided is an accurate representation of the data. This high R2 value supports the robustness of the method used and its ability to accurately estimate the concentration of gallic acid in unknown samples.
Figure 6 provides strong evidence for a positive linear relationship between gallic acid concentration and measured absorbance. The trend line equation is useful for accurate quantification of gallic acid, and the high R2 value reinforces the validity of the model. These results are crucial for the application of the method in quantitative analyzes of gallic acid and other phenolic compounds in future research.
Figure 6. Standard curve of gallic acid: linear relationship between concentration and absorbance for accurate quantification.
Preprints 113202 g006
Note: X axis (concentration in mg/l), Y axis (absorbance). Each point on the graph represents a measurement of absorbance for a specific concentration of gallic acid.

3.3. Efficiency of Pyroligneous Acid in Mandarin Crops

Table 4 presents the results of the study on the effectiveness of pyroligneous acid in controlling aphids in mandarin crops, evaluating the number of aphids and the number of shoots evaluated for each treatment in five experimental blocks.
Analysis of the data reveals clear variability in the effectiveness of different treatments in reducing the aphid population. Treatment 5 stands out as the most effective, significantly reducing the number of aphids to almost zero in all blocks evaluated. The values of the number of aphids observed under this treatment ranged between 0.33 and 0.83, demonstrating a considerable reduction compared to the other treatments.
Treatment 4 also showed high effectiveness in controlling aphids, with numbers varying between 1.66 and 2.66. Although not as low as the results obtained with Treatment 5, it is still notably more effective than treatments 3.2 and 1. The difference in aphid reduction between Treatment 4 and the less effective treatments (3.2 and 1) reinforces the conclusion that pyroligneous acid is a very effective control agent, particularly in more concentrated treatments or applied in larger quantities.
In contrast, Treatments 3.2 and 1 show a progressive reduction in effectiveness. Treatment 3 reduced the number of aphids to a range of 3.91 to 7.5, while Treatment 2 achieved a reduction to a range of 6.66 to 10.5. Finally, Treatment 1, which appears to be the least effective, maintained a constant number of aphids around 100, indicating that it did not have a significant impact on aphid reduction.
These results corroborate the previous interpretation that Treatments 4 and 5 are the most effective to control the number of aphids on mandarin shoots. The effectiveness of these treatments may be attributed to the formulation or concentration of pyroligneous acid, which appears to be more potent in its ability to repel or eliminate aphids compared to the other treatments evaluated.
In terms of crop management, these findings are of great importance. The application of Treatments 4 and 5 could be considered a recommended practice for pest control in mandarin crops, significantly improving shoot health and potentially reducing the need for other chemical or biological control methods.
Research demonstrates that pyroligneous acid is a highly effective agent in controlling aphids, especially at higher concentrations or more intensive applications. The results obtained provide a solid basis for the implementation of integrated pest management strategies in mandarin crops, optimizing aphid control and promoting healthy crop growth.
Table 5 provides the results of the analysis of variance (ANOVA) to evaluate the effectiveness of the treatments in reducing the number of aphids in mandarin crops. The table details the key components of the analysis, including the total number of observations, the coefficient of determination R2, the coefficient of variation (CV), and the F test statistics, among others.
The analysis shows a coefficient of determination R2 of 0.96, indicating that the model explains 96% of the variability in the number of aphids. This high value of R2 suggests that the treatments applied have a significant impact on the reduction of aphids, and the model used is effective in capturing the variability observed in the data. The coincidence of R2 adjusted at 0.96 demonstrates that the model fit is solid even after considering the number of predictors, reaffirming the robustness of the evaluated treatments.
The coefficient of variation (CV) is 22.02%, indicating a moderate degree of relative variability in the data. Although this value suggests some variability in the response of aphids to the treatments, the fact that the model explains a large part of the variability (96%) contrasts with this variability, suggesting that the treatments have a consistent effect but that there may be additional factors not considered that contribute to variability.
In the Analysis of Variance Table (SC type III), it is observed that the sum of squares (SC) of the model is 91166.48, with 4 degrees of freedom (df) and a mean square (CM) of 22791.62. The F statistic for the model is 410.95, with a p-value less than 0.0001. This extremely low p-value indicates that there is a statistically significant difference between the treatments, rejecting the null hypothesis that all treatments have the same effect on aphid numbers.
The sum of squares of the error is 3882.27, with 70 degrees of freedom and a mean square of 55.46. The comparison between the model means square and the error mean square produces a high F statistic, which is consistent with the very low p-value. This supports the conclusion that the observed differences between treatments are significant and not attributable to chance.
In summary, the analysis of variance shows that the treatments applied in the study have a very significant effect on reducing the number of aphids. The high R2 suggests that the model explains a large part of the variability in aphid numbers, while the extremely low p-value confirms the statistical significance of the results. These findings reinforce the effectiveness of the evaluated treatments and provide a solid basis for their implementation in pest control in mandarin crops. The model's ability to explain most of the variability observed in the data also suggests that future research could benefit from further digging into the factors that contribute to residual variability.
Table 6 presents the results of the Tukey test, carried out to determine the significant differences between the treatments in terms of their effectiveness in reducing the number of aphids. The test was run with an alpha significance level of 0.05 and a minimum significant difference (MSD) of 7.61456, with a root mean square error of 55.4610 and 7 degrees of freedom.
The results of the Tukey Test reveal that the treatments are grouped into four different categories based on their means and the significant differences observed. Treatments 5 and 4 form Group a, since their means (2.60 and 9.00, respectively) do not differ significantly from each other (p > 0.05). This suggests that both treatments have a similar effect on aphid reduction and could therefore be considered interchangeable in terms of effectiveness.
Treatment 3 is assigned to Group b, with a mean of 23.47. This treatment is significantly different from the treatments in Group a, but does not present significant differences compared to the treatments in Group c. The significant difference indicates that Treatment 3 is less effective than Treatments 4 and 5, but more effective than Treatment 2 and Treatment 1.
Treatment 2 belongs to Group c, with a mean of 34.07. This treatment shows significant differences compared to the treatments of Groups a and b but does not present significant differences with Treatment 1. This implies that Treatment 2 is less effective than Treatments 4 and 5, and less effective than Treatment 3, but comparable to Treatment 1 in terms of aphid reduction.
Treatment 1 forms Group d, with a mean of 100.00. This treatment is clearly distinguished from all other treatments, as it has a significantly higher mean compared to the other treatments (Groups a, b and c). The high mean number of aphids in Treatment 1 indicates that it is the least effective in reducing aphids, showing significantly worse results compared to all other treatments evaluated.
The results of the Tukey Test highlight the variability in the effectiveness of treatments to control aphids. Treatments 4 and 5 are the most effective and do not present significant differences between them, while Treatments 1, 2 and 3 show lower effectiveness, with Treatment 1 being the least effective of all. These findings provide clear guidance for the selection of treatments based on their relative effectiveness, highlighting the importance of choosing treatments that maximize aphid reduction in mandarin crop management
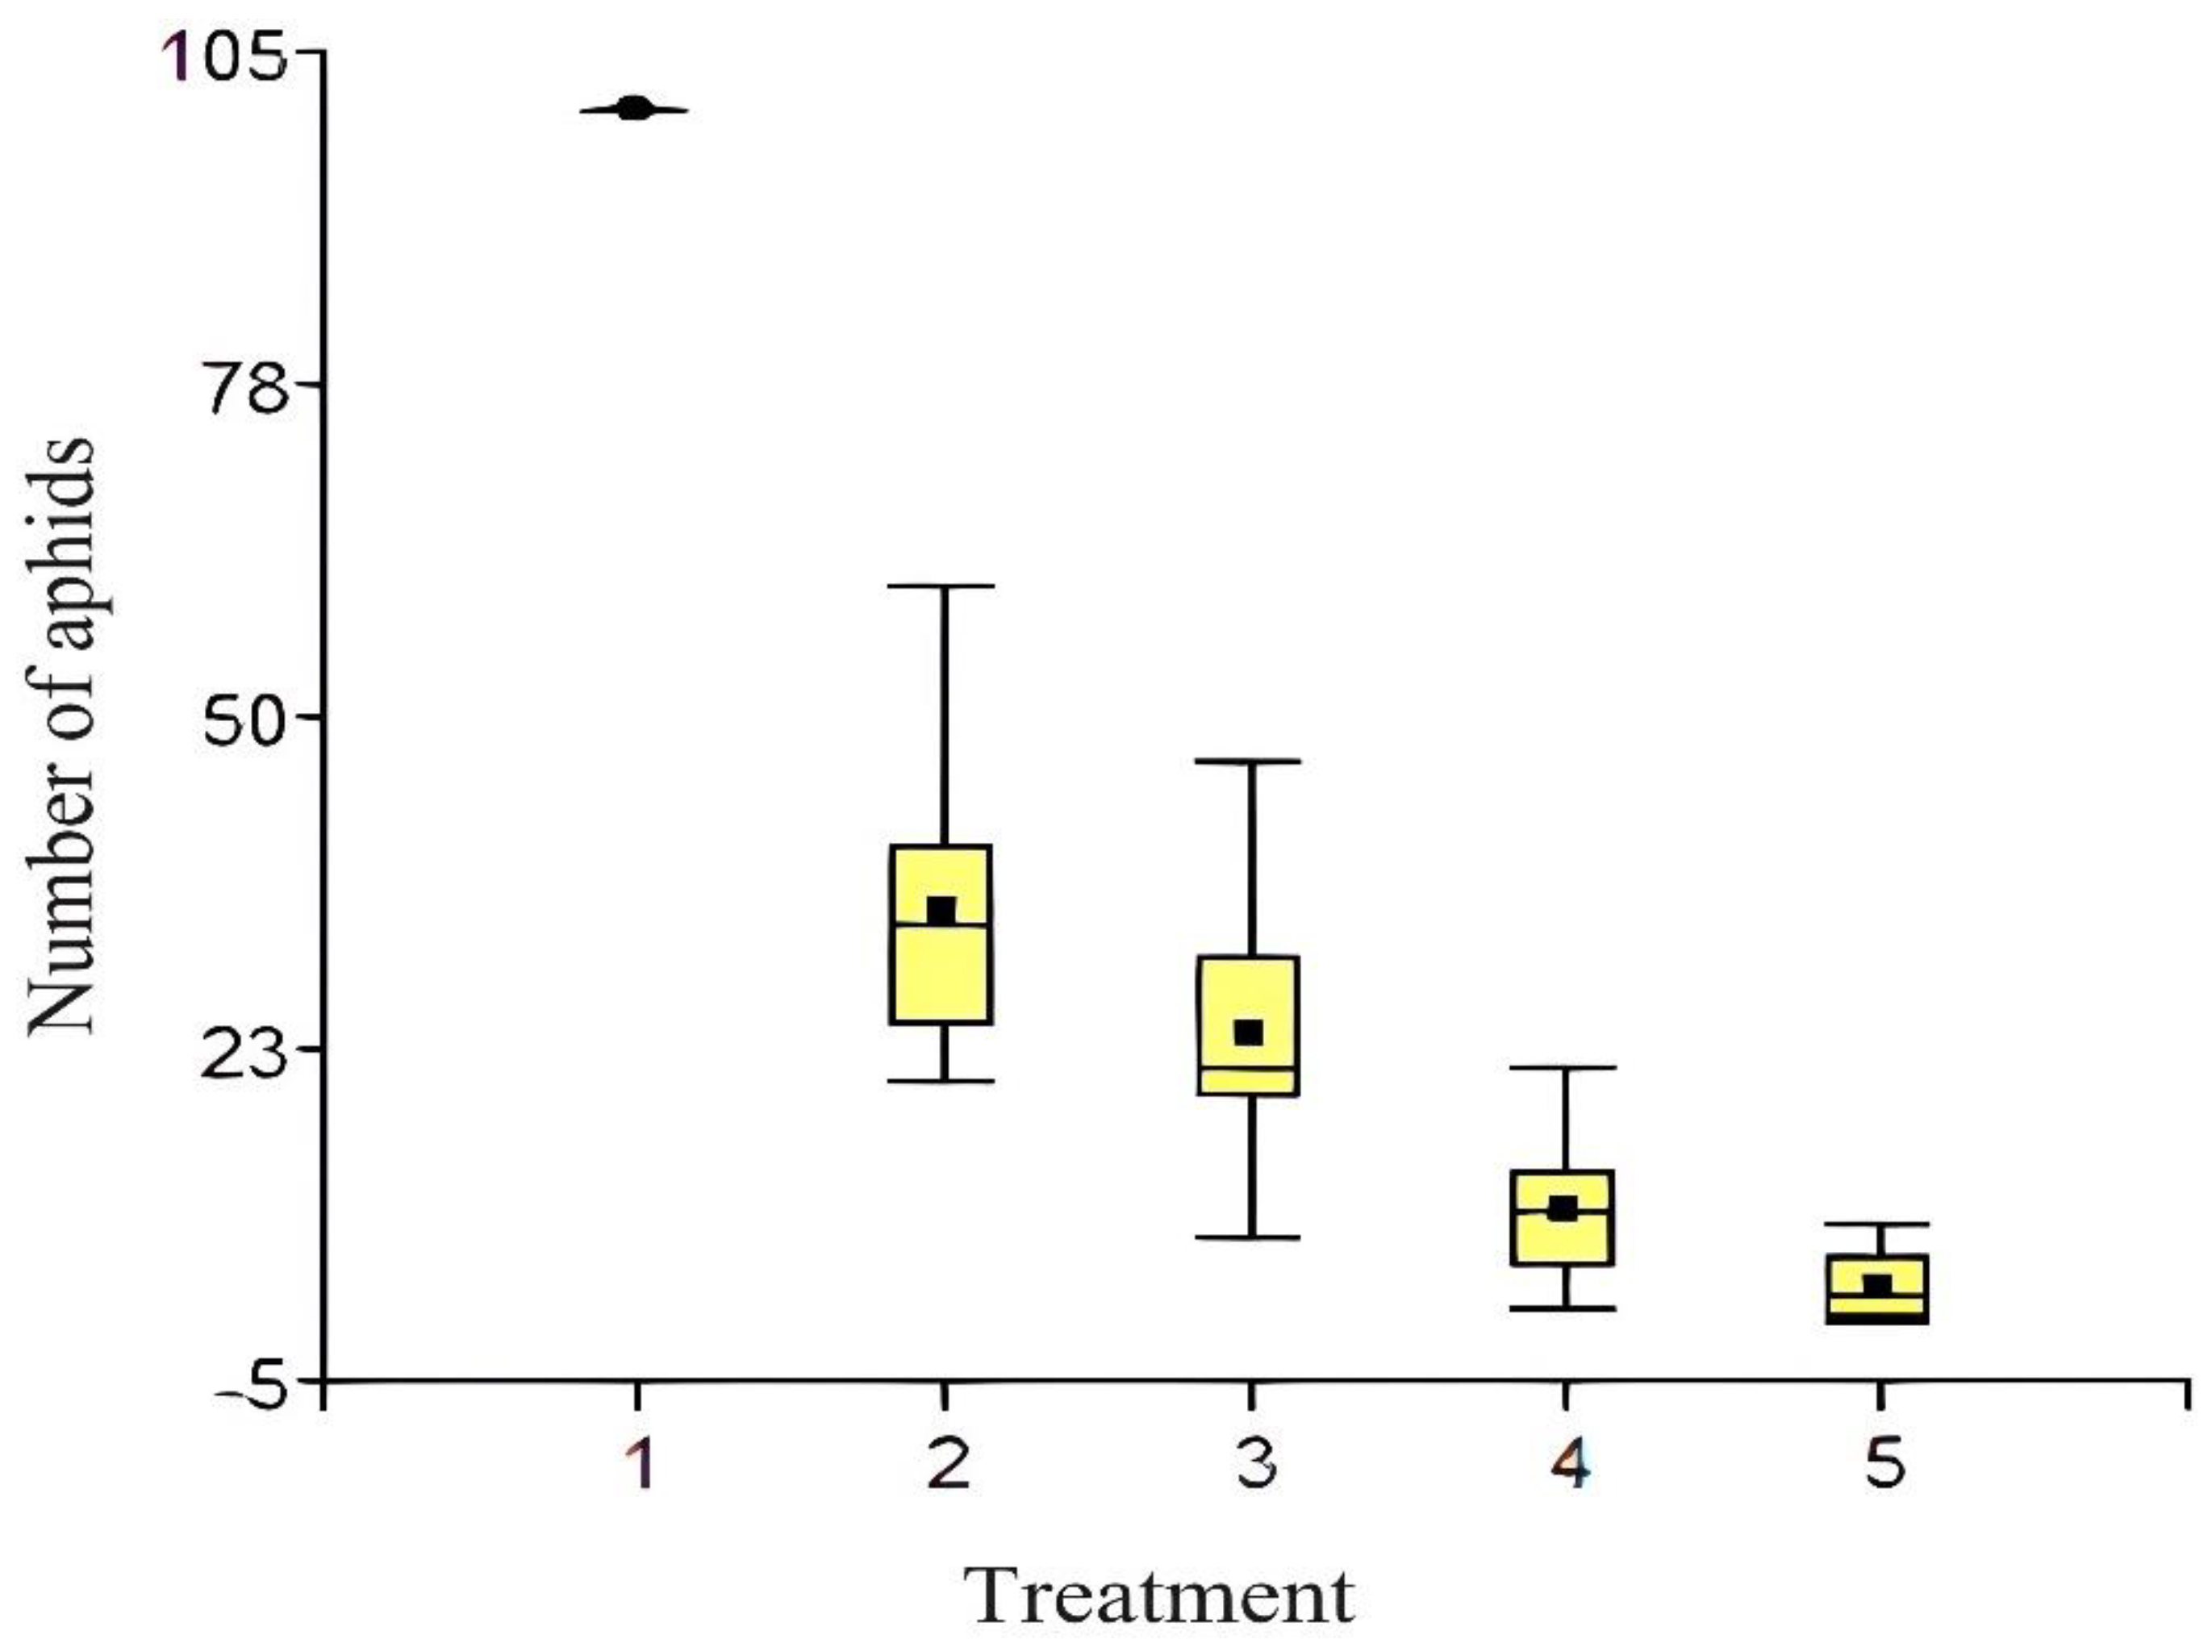
Figure 7 presents a box and whisker plot illustrating the variability and distribution of the number of aphids observed under different treatments, providing a clear and effective visualization of the effectiveness of each treatment in reducing this pest in mandarin crops.
In the box-and-whisker plot, Treatment 1 stands out as having the highest number of aphids, with all observed values around 105 aphids. This lack of variability indicates that Treatment 1 is not effective in reducing the aphid population, since all the outbreaks evaluated have a high infestation. Treatment 2 shows a median close to 23 aphids. The interquartile range (IQR) is wide, indicating significant dispersion in the data. The whiskers on the diagram suggest that the variability ranges from about 10 aphids to about 50 aphids, showing that some shoots have lower infestation, while others have higher infestation. In comparison, Treatment 3 has a median like that of Treatment 2, but with less dispersion. The whiskers in the diagram are shorter, indicating a smaller range of variability in the number of aphids observed. Treatment 4 shows a lower median, around 10 aphids. The box and whiskers are more compact compared to Treatments 2 and 3, indicating less variability in aphid infestation between shoots evaluated under this treatment. Treatment 5 has the lowest median, approximately 5 aphids. This treatment also shows the least variability, with a small range and whiskers indicating consistently low aphid numbers on all shoots tested. Regarding the effectiveness of the treatments, Treatments 4 and 5 are the most effective in reducing the number of aphids, since they show the lowest medians and less dispersion in the number of aphids observed. These results are consistent with the qualitative evaluation carried out previously, where it was concluded that Treatments 4 and 5 are the most effective for controlling aphids in the evaluated outbreaks.

4. Discussion

The present research confirms the effectiveness of pyroligneous acid as a repellent and pest control agent in crops, in line with previous studies that have explored its applications in pest management. Othman et al. (2023) found that pyroligneous acid, applied at a concentration of 200 ppm, showed a remarkable repellency of 98.3% against the rice weevil (Sitophylus oryzae), with a lethal concentration (LC50) estimated at 77.62 ppm. These results underline the potential of pyroligneous acid as an effective insecticide under controlled conditions.
In contrast, the research of Iacomino et al. (2024) reported the lack of repellent effect of pyroligneous acid applied in aerosol form against Bactrocera oleae in olive groves and observed phytotoxic effects at high concentrations. Additionally, a 1% solution of pyroligneous acid was documented to reduce infections caused by Meloidogyne incognita in strawberry plants by 15%. These findings suggest that, although pyroligneous acid shows promising insecticidal properties in some applications, its effectiveness can vary significantly depending on the type of pest and the application method.
Our experiments revealed that different concentrations of pyroligneous acid applied to immature shoots affected by Aphididae sp. (250 ml, 500 ml, 750 ml and 1000 ml) showed that the application of 1000 ml resulted in 98% control of the pest. This result highlights the effectiveness of pyroligneous acid as an insecticidal agent in aphid management, with a notable reduction capacity at higher concentrations.
Analysis of the components of the product, which is related to wood vinegar, suggests that pyroligneous acid is a biostimulant with potential applications in agriculture. Pyroligneous acid derived from Citrus reticulata could be effectively used for the control of aphids and other agricultural pests. The economic valorization of organic waste generated by pruning and post-harvest activities, which are currently considered waste, could transform these byproducts into valuable resources. Including these materials in economical processes and reusing them could offer a viable alternative to commercial chemicals, with the added benefit of reducing environmental risks due to their organic nature (Burbano et al 2018).
Finally, the study validates the implementation of a local pyrolysis technology, developed on the El Arrayanal farm in the Monte Olivo parish, Carchi province, to produce pyroligneous acid. This technology has been adapted to effectively take advantage of available organic waste, which contributes to environmental management by reducing the negative impacts associated with waste management. Furthermore, the adoption of pyroligneous acid instead of conventional chemicals could decrease interference with natural biological processes and promote more sustainable agricultural practices in the long term.

Conclusions

The implementation of equipment to obtain pyroligneous acid through pyrolysis of biomass from mandarin pruning on the El Arrayanal farm proved to be an effective and sustainable alternative for the control of aphids in mandarin crops. Through this process, 600 ml of pyroligneous acid were obtained, achieving a yield of 25%, and 15 kg of biochar, with a yield of 93.75%, starting from an initial biomass of 40 kg. Despite operational limitations in distillation due to furnace construction and handling errors, future optimization of the system could increase pyroligneous acid production. Treatments with different concentrations of pyroligneous acid (250 ml, 500 ml, 750 ml, and 1000 ml) showed a significant reduction in aphids, with the 1000 ml treatment standing out with a 98% control. This validates the potential of pyroligneous acid not only as a bioinsecticide but also as a biostimulant, offering an environmentally friendly alternative to synthetic pesticides. The results support the adoption of this pyrolysis technology at the local level to improve environmental management and promote more sustainable agricultural practices, transforming organic waste into valuable resources and reducing dependence on commercial chemicals.

Author Contributions

Conceptualization, O.M.Q., J.V. E. and J.Y.V.; methodology, O.M.Q., J.V. E. and J.Y.V.; validation, O.M.Q. and J.V. E.; formal analysis, O.M.Q., J.V. E. and J.A.C.; investigation, O.M.Q. and J.Y.V.; resources, O.M.Q., J.V. E. and J.Y.V.; data curation, O.M.Q., J.V. E. and J.Y.V.; writing—original draft preparation, O.M.Q., writing—review and editing, O.M.Q., J.V. E. and J.Y.V.; visualization, O.M.Q.; supervision, O.M.Q. and J.Y.V.; project administration, O.M.Q. and J.Y.V. All authors have read and agreed to the published version of the manuscript. |

Funding

This research received no external funding.

Data Availability Statement

The data presented in this study are available on request from the corresponding author. The data are not publicly available due to privacy.

Conflicts of Interest

The authors declare no conflicts of interest.

References

  1. Alotaibi, SS, Darwish, H., Alzahrani, AK, Alharthi, S., Alghamdi, AS, Al- Barty, AM, Helal, M., Maghrabi, A., Baazeem, A., Alamari, HA, & Noureldeen, A. (2022). Environment-Friendly Control Potential of Two Citrus Essential Oils against Aphis punicae and Aphis illinoisensis (Hemiptera: Aphididae ). Agronomy, 12 (9). [CrossRef]
  2. Autónomo, G., Parroquial, D., De, R., & Olivo, M. (2019). Monte Olivo Territorial Development and Planning Plan.
  3. Bouket, A.C., Narmani, A., Tavasolee, A., Elyasi, G., Abdi, A., Naeimi, S., Sharifi, K., Oszako, T., Alenezi, F.N., & Belbahri, L. (2022). In Vitro Evaluation of Wood Vinegar (Pyroligneous Acid) VOCs Inhibitory Effect against a Fungus-like Microorganism Ovatisporangium ( Phytopythium ) Isolate Recovered from Tomato Fields in Iran. Agronomy, 12 (7). [CrossRef]
  4. Burbano-Salas, D. (2018). Use of Kikuyu (Pennisetum Clandestinum L), residue from pruning areas greens for obtaining acid​ pyroligneous acid for agricultural purposes Use of Kikuyo (Pennisetum Clandestinum L), residue from the pruning of green areas for obtaining pyroligneous acid for agricultural purposes (Vol. 21).
  5. Cândido, NR, Modolo, LV, Pasa, VMD, & de Fátimaa, Â. (2023). Pyroligneous acids of coconut shell, black wattle and eucalyptus: physical-chemical characterization and in vitro evaluation as potential urease inhibitors. Quimica Nova , 46 (10), 961–971. [CrossRef]
  6. Carril, P., Bianchi, E., Cicchi, C., Coppi, A., Dainelli, M., Gonnelli, C., Loppi, S., Pazzagli, L., & Colzi, I. (2023). Effects of Wood Distillate (Pyroligneous Acid) on the Yield Parameters and Mineral Composition of Three Leguminous Crops. Environments - MDPI, 10 (7). [CrossRef]
  7. Castillo, B., & Dueñas, C. (2023). Exposure to pesticides in Latin America: Bibliographic Review. Journal of Forensic Sciences of Honduras ,9, 14–25. [CrossRef]
  8. Catacora-Pinazo, M., Quispe-Apaza, I., Julian -Laime, E., Zanabria-Mallqui, R., Roque-Cruz, M., & Zevallos-Pollito, P. (2019). Characterization of the chemical components of pyroligneous acid obtained from 3 forest species, for agricultural purposes in San Gaban, Puno (Perú) characterization of chemicals components of pyroleinous acid obtained from 3 forestry species, with agricultural purposes in San Gaban, Puno (Perú). 07 (2), 6–16. https://www.ceprosimad.com/.
  9. Choi, JY, Shinde, PL, Kwon, IK, Song, YH, & Chae, BJ (2009). Effect of Wood Vinegar on the Performance, Nutrient Digestibility and Intestinal Microflora in Weanling Pigs. Asian-Australas J Anim Sci,22 (2), 267–274. [CrossRef]
  10. Gomez, JP, Velez, JPA, Pinzon, MA, Arango, JAM, & Muriel, AP (2021). Chemical Characterization and Antiradical Properties of Pyroligneous Acid from a Preserved Bamboo, Guadua angustifolia Kunth. Brazilian Archives of Biology and Technology, 64, 1–13. [CrossRef]
  11. Gómez-arroyo, S., Martínez- valenzuela, C., Carbajal- lópez, Y., Martínez-arroyo, A., Elena CALDERÓN-SEGURA, M., Villalobos- pietrini, R., & Waliszewski, SM (nd). Genotoxic risk due to occupational exposure to pesticides in Latin America.
  12. Guo, G., Wang, Q., Huang, Q., Fu, Q., Liu, Y., Wang, J., Hu, S., Mašek, O., Wang, L., & Zhang, J. (2021). Effect of pyrolysis temperature on the characterization of dissolved organic matter from pyroligneous acid. Molecules, 26 (11). [CrossRef]
  13. Iacomino, G., Idbella, M., Staropoli, A., Nanni, B., Bertoli, T., Vinale, F., & Bonanomi, G. (2024). Exploring the Potential of Wood Vinegar: Chemical Composition and Biological Effects on Crops and Pests. Agronomy, 14 (1). [CrossRef]
  14. Ibrahim, D., Kassim, J., Lim, SH., & Rusli, W. (2014). Evaluation of antibacterial effects of Rhizophora apiculata pyroligneous acid on pathogenic bacteria. Malaysian Journal of Microbiology. [CrossRef]
  15. Jindo, K., Goron, T.L., Kurebito, S., Matsumoto, K., Masunaga, T., Mori, K., Miyakawa, K., Nagao, S., & Tokunari, T. (2022). Sustainable Plant Growth Promotion and Chemical Composition of Pyroligneous Acid When Applied with Biochar as a Soil Amendment. Molecules, 27 (11). [CrossRef]
  16. Lee, CL, Chin, KL, Khoo, PS, Hafizuddin, MS, & H'ng, PS (2022). Production and Potential Application of Pyroligneous Acids from Rubberwood and Oil Palm Trunk as Wood Preservatives through Vacuum-Pressure Impregnation Treatment. Polymers, 14 (18). [CrossRef]
  17. María Ocampo González, C. 17. María Ocampo González, C. (2015). Acid compounds​ pyrolean from residual coniferous biomass​ cypress (Cupressus lusitanica Mill) and patula (Pinus pátula) 1 Compounds of Pyroligneous acid produced from residual biomass of conifers Cypress (Cupressus lusitanica Mill) and Patula pine (Pinus patula) (Vol. 28).
  18. Morales, MM, Sartori, WW, Silva, BR, Spera, ST, Mendes, ABD, & Ambrosio-Albuquerque, EP (2022). Wood vinegar: chemical characteristics, phytotoxic effects, and impacts on greenhouse gas emissions. Native, 10 (3), 400–409. [CrossRef]
  19. Ofoe, R., Qin, D., Gunupuru, L.R., Thomas, R.H., & Abbey, Lord. (2022). Effect of Pyroligneous Acid on the Productivity and Nutritional Quality of Greenhouse Tomato. Plants, 11 (13). [CrossRef]
  20. Othman, N., Elias, N.H., & Zainalabidin, N. (2023). Wood Vinegar as an Alternative Insecticide in Controlling Rice Weevil, Sitophylus oryzae (Coleoptera: Curculionidae). Advances in Agricultural and Food Research Journal, 4 (1). [CrossRef]
  21. Paiva, PEB, Neto, LM, Marques, NT, Duarte, BZ, & Duarte, AM (2024). Citrus Aphids in Algarve Region (Portugal): Species, Hosts, and Biological Control. Ecologies, 5 (1), 101–115. [CrossRef]
  22. Panwar, N., Thirumurugan, S., & Kumar, S. (2023). Host Plant Resistance in Brassicaceae against Aphids. In S. Kumar (Ed.), Brassica (p. Ch. 5). IntechOpen. [CrossRef]
  23. Pimenta, AS, Fasciotti, M., Monteiro, TVC, & Lima, KMG (2018). Chemical composition of pyroligneous acid obtained from eucalyptus GG100 clone. Molecules, 23 (2). [CrossRef]
  24. Pisa, L., Goulson, D., Yang, E.-C., Gibbons, D., Sánchez-Bayo, F., Mitchell, E., Aebi, A., van Der Sluijs, J., MacQuarrie, C.J.K., & Giorio, C. (2021). An update of the Worldwide Integrated Assessment (WIA) on systemic insecticides. Part 2: impacts on organisms and ecosystems. Environmental Science and Pollution Research, 28 , 11749–11797.
  25. Sánchez, VH, & Mendoza, JLZ (2019). Adoption and impact of agricultural technologies developed in Ecuador. In Granja (Vol. 30, Issue 2, pp. 27–36). Polytechnic University Salesian. [CrossRef]
  26. Souza, JBG, Ré -Poppi, N., & Raposo Jr, JL (2012). Characterization of pyroligneous acid used in agriculture by gas chromatography-mass spectrometry. Journal of the Brazilian Chemical Society, 23, 610–617.
  27. Sparks, TC, Crossthwaite, AJ, Nauen, R., Banba, S., Cordova, D., Earley, F., Ebbinghaus- Kintscher, U., Fujioka, S., Hirao, A., & Karmon, D. (2020). Insecticides, biologics and nematicides: Updates to IRAC's mode of action classification-a tool for resistance management. Pesticide Biochemistry and Physiology, 167, 104587.
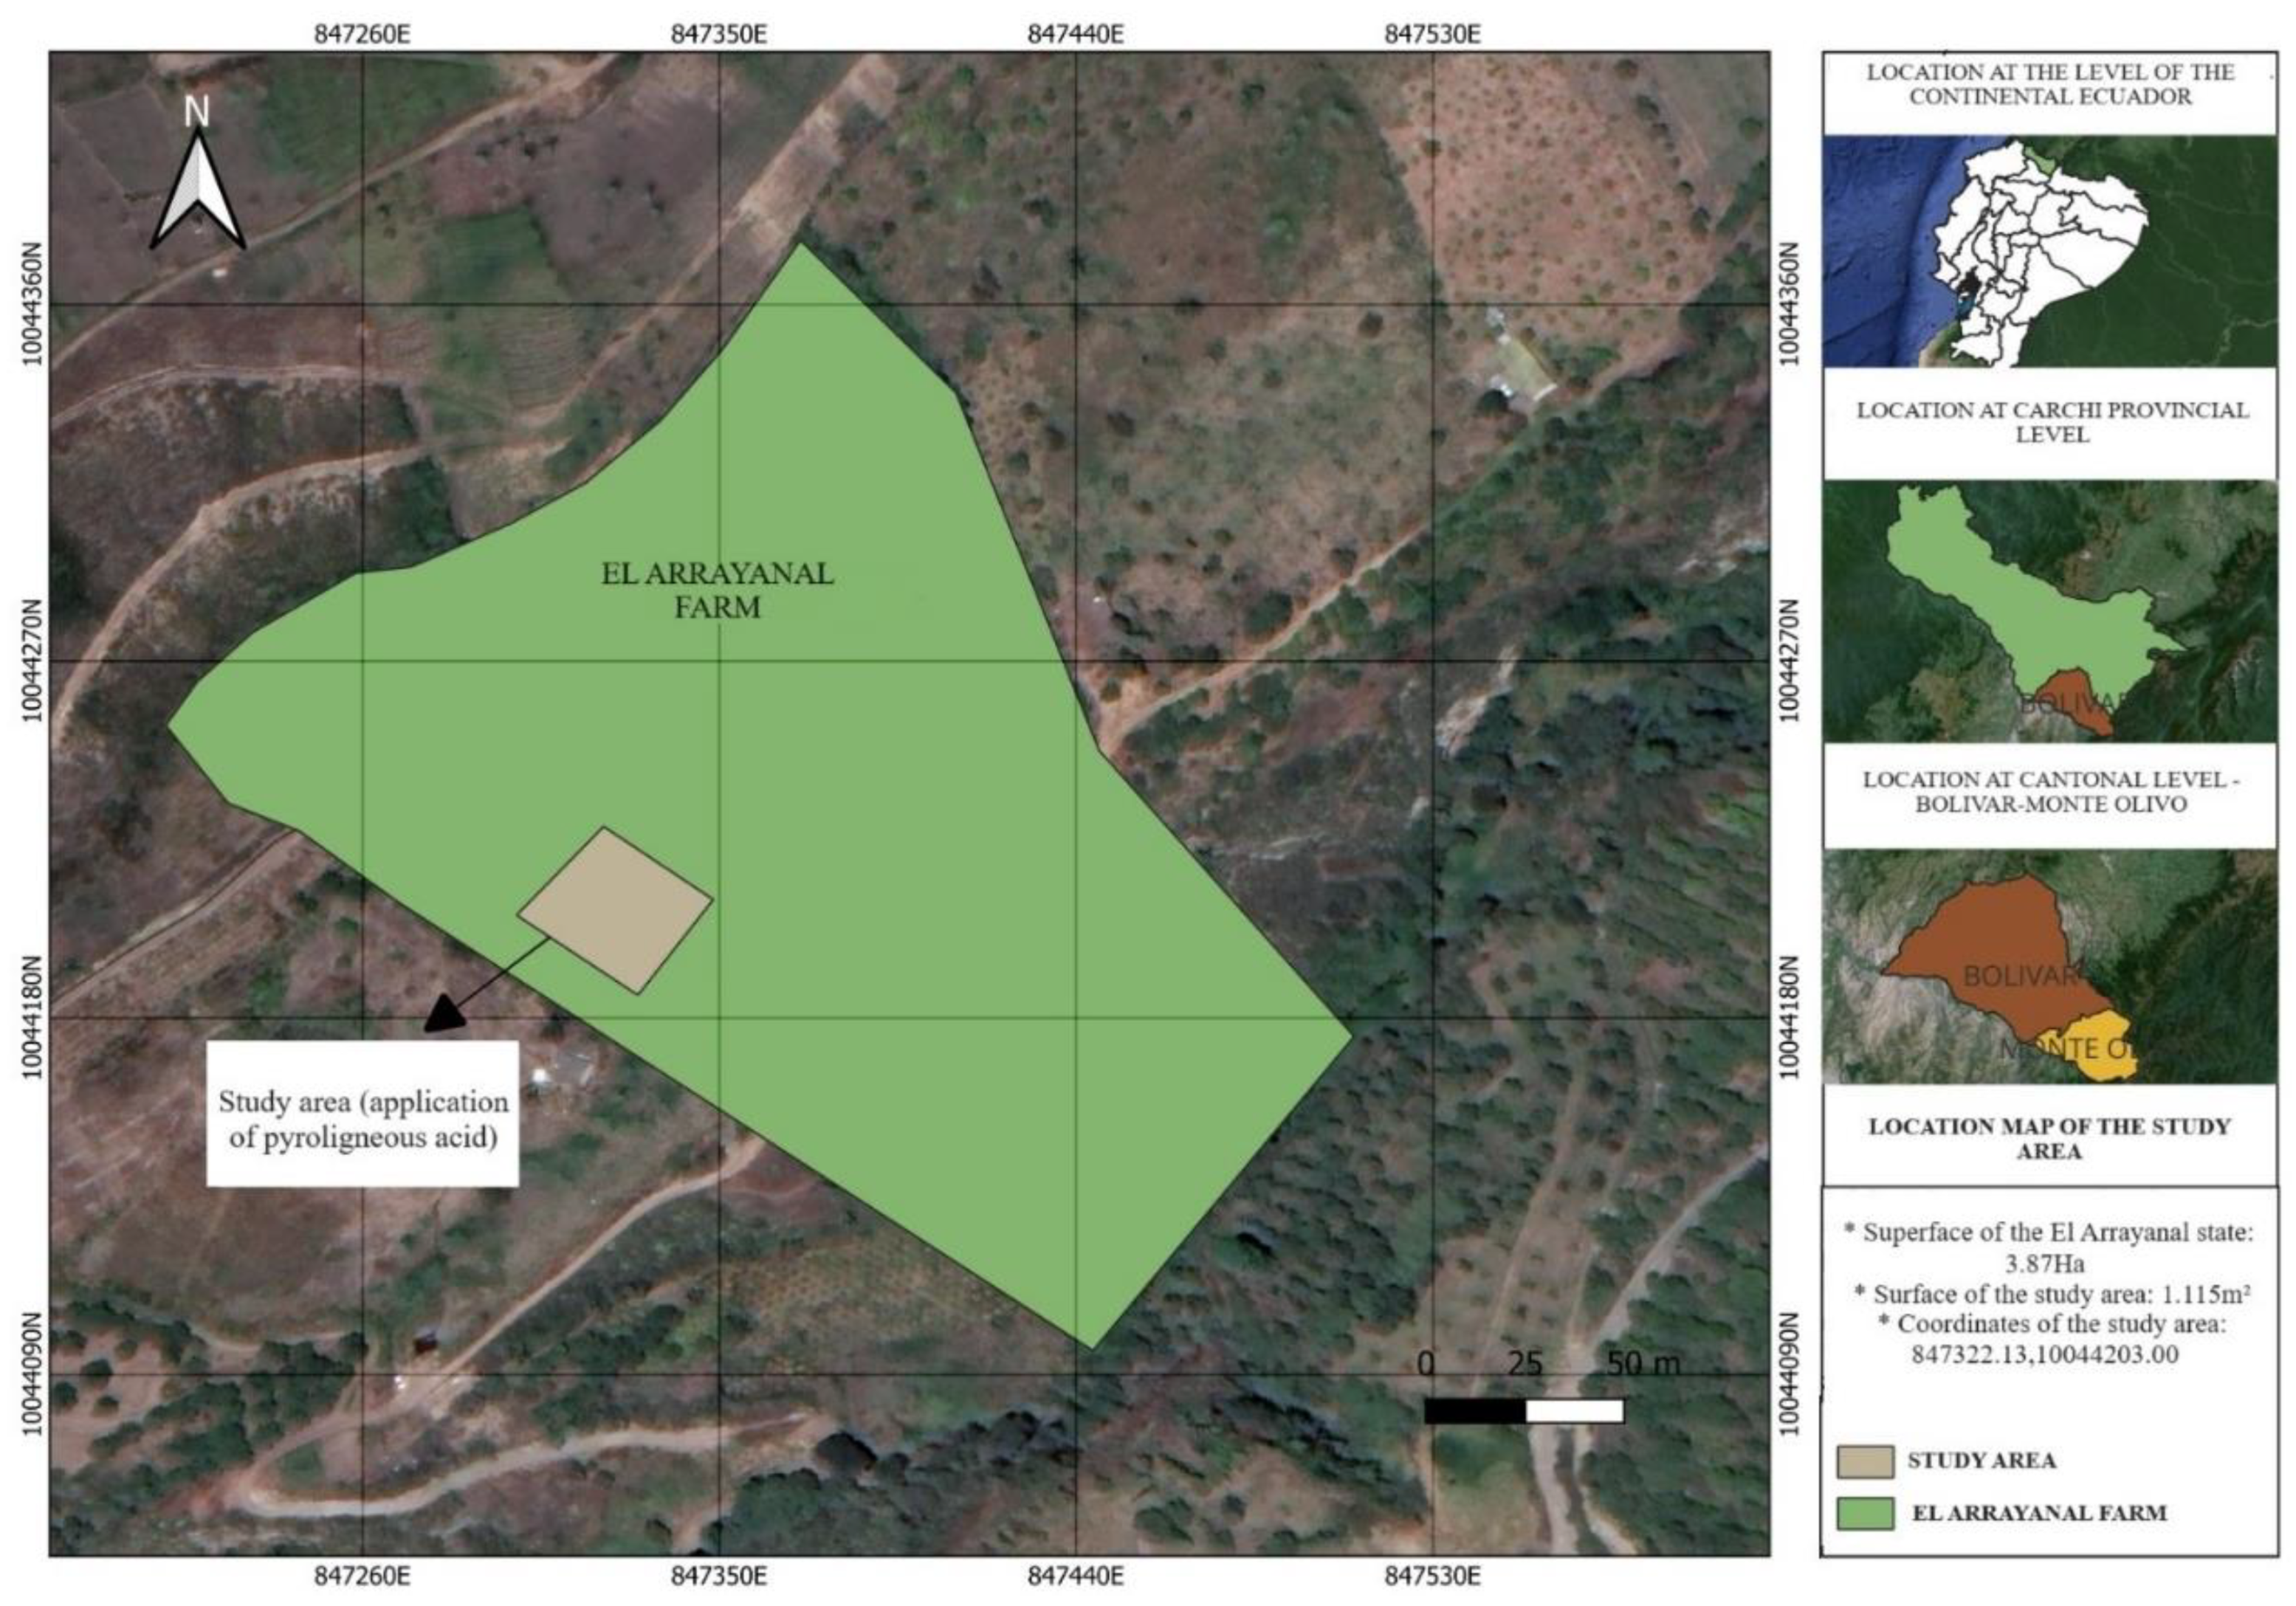
Figure 1. Location of the study area on the El Arrayanal farm, Monte Olivo parish, Bolívar canton, Carchi province.
Preprints 113202 g001
Figure 2. Design of the oven used for the extraction of pyroligneous acids through the pyrolysis of mandarin waste biomass.
Preprints 113202 g002
Figure 3. Pyroligneous acid extraction diagram.
Preprints 113202 g003
Figure 4. Experimental design information.
Preprints 113202 g004
Figure 5. Gas chromatography chromatogram: temporal distribution and abundance of detected compounds.
Preprints 113202 g005
Figure 7. Distribution of the number of aphids under different treatments: comparative analysis with box and whisker plot.
Preprints 113202 g007
Table 1. Compounds identified in pyroligneous acid and their retention times and corresponding areas.
No. Compound Retention time (min) Area (%)
1 Cyclotrisiloxane, hexamethyl-​ 7.172 0.74
2 Cyclotetrasiloxane, octamethyl-​ 11.993 0.74
3 Acetonitrile 12.791 4.39
4 Cyclopentasiloxane, decamethyl-​ 19.858 0.54
5 Cyclohexasiloxane, dodecamethyl-​ 28.295 4.03
6 2-Cyclopenten-1-one 30.815 0.77
7 2-Cyclopenten-1-one, 2-methyl- 31.397 0.98
8 Acetic acid 35.058 1.29
9 2-Cyclopenten-1-one, 2,3-dimethyl- 35.224 0.52
10 2-Propanone, 1- (acetyloxy)- 35.869 0.37
11 3-Isopropoxy-1,1,1,7,7,7-hexamethyl-3,5,5-tris (trimethylsiloxy) tetratris (trimethylsiloxy) tetra 35.945 1.68
12 Furfural 36.062 9.48
13 2-Cyclopenten-1-one, 3,4-dimethyl- 36.861 0.33
14 Acridine, 9-methyl- 37.191 0.32
15 Ethanone, 1-(2-methyl-1-cyclopenten-1-yl)- 37.511 0.58
16 1,2,4-Triazol-4-amine, 5-ethyl-3-(3-methyl-5- phenylpyrazol-1-yl)- 37.646 2.24
17 Ethanone, 1-(2-furanyl)- 37.955 1.50
18 4-Thiazoleacetic acid, 2- (p- chlorophenyl)-, hydrazide 38.118 0.65
19 2-Cyclopenten-1-one, 3-methyl- 38.645 0.62
20 3-Pentanone, 2-methyl- 38.766 0.44
21 2-Butanone, 1- (acetyloxy)- 38.971 1.00
22 2-Furanmethanol, acetate 39.214 0.36
23 Phosphonoacetic Acid, 3TMS derivative 39.311 0.56
24 2-Cyclopenten-1-one, 2,3-dimethyl- 39.570 1.00
25 Fluoren-9-ol, 3,6-dimethoxy-9-(2-phenylethynyl)- 39.626 1.30
26 Phenol, 2-methoxy- 40.193 0.38
27 2-Furancarboxaldehyde, 5-methyl- 41.062 3.20
28 Methyl 2-furoate 41.193 0.39
29 Benzonitrile 42.701 0.49
30 2-Acetyl-5-methylfuran 42.850 0.40
31 3,4-Dihydroxyphenylglycol, 4TMS derivative 43.034 0.85
32 2-Cyclopenten-1-one, 3,4,4-trimethyl- 43.192 0.68
33 2-Furanmethanol 44.471 1.63
34 2-Cyclopenten-1-one, 3-ethyl-2-hydroxy- 45.810 0.52
35 2-Hexene, 3,4,4-trimethyl- 47.599 0.54
36 Oxime -, methoxy-phenyl -_ 47.787 1.19
37 Cyclotrisiloxane, hexamethyl-​ 49.496 0.22
38 3,4-Dimethoxytoluene 50.546 0.89
39 Phenol, 2-methoxy- 52.743 8.87
40 Phenol, 2-methoxy-3-methyl- 53.120 0.90
41 Phenol, 2,6-dimethyl- 54.274 0.90
42 2-Methoxy-5-methylphenol 55.354 0.57
43 Creosol 55.753 7.00
44 1,4-Benzenediol, 2,3,5-trimethy 56.037 1.20
45 Phenol, 2-methyl- 56.832 3.99
46 Phenol 56.937 3.13
47 Phenol, 4-ethyl-2-methoxy- 57.670 6.94
48 Benzene, 1,2,3-trimethoxy-5-methyl 57.962 0.75
49 Phenol, 2-ethyl- 58.426 0.62
50 Phenol, 2,4-dimethyl- 58.615 1.15
51 Phenol, 2,4-dimethyl- 58.694 3.15
52 p- Cresol 58.923 2.87
53 Phenol, 2-methoxy-4-propyl- 59.459 1.12
54 Phenol, 2,3-dimethyl- 60.171 0.60
55 Phenol, 2-ethyl-6-methyl- 60.480 0.45
56 3-Ethylphenol, isopropyl ether 60.740 1.63
57 Phenol, 3-ethyl- 60.899 0.47
58 Phenol, 2-ethyl- 61.780 0.56
59 Phenol, 2,6-dimethoxy- 62.796 1.03
60 Caffeine 63.316 2.55
61 3,5-Dimethoxy-4-hydroxytoluene 64.674 1.18
62 5-tert-Butylpyrogallol 65.992 0.57
Table 2. Relationship between the concentration of the substance and the absorbance measured at 750nm.
C
mg/l
Abs
λ=750nm
A
100 0.21 0.22
0.24
0.22
200 0.41 0.40
0.40
0.38
300 0.55 0.55
0.55
0.56
400 0.77 0.77
0.77
0.78
500 0.96 0.96
0.97
0.96
600 1.17 1.16
1.14
1.16
Note: C (mg/l): concentration of the solution in milligrams per liter. Abs λ=750nm: absorbance measured at 750 nm for the indicated concentrations. A: average of absorbance measurements for each concentration.
Table 3. Quantification of total polyphenols in pyroligneous acid using the folin-ciocalteu method: results of absorbance, concentration and equivalence with gallic acid.
Sample Laboratory code Abs λ=750nm C
(mg/l)
F.D. mg Eq . AG/l sample A
pyroligneous acid INV 154 0.52 267.96 61.00 16345.56 16345.56
0.52 267.96 61.00 16345.56
0.52 267.96 61.00 16345.56
Note: Sample: Type of sample analyzed (Pyroligneous acid). Laboratory code: Sample identification code (INV 154). Abs λ=750nm: Absorbance measured at 750 nm (0.52). C (mg/l): Sample concentration (267.96 mg/l). DF: Dilution factor (61). mg Eq. AG/l sample: Milligram equivalents of gallic acid per liter of sample (16345.56). A: Average of the previous measurements (16345.56).
Table 4. Efficiency of pyroligneous acid in controlling aphids in mandarin crops: comparison of treatments in different blocks.
Treatment Number of aphids Number of outbreaks evaluated
Block 1 Block 2 Block 3 Block 4 Block 5
1 100 100 100 100 100 4
2 8.5 6.91 10 10.5 6.66 4
3 4.75 5.75 7.5 6.83 3.91 4
4 2.66 2.58 2.41 1.66 1.91 4
5 0.33 0.83 0.75 0.58 0.75 4
Nota: Tratamiento 1 (control), Tratamiento 2 (250 ml), Tratamiento 3 (500ml), Tratamiento 4 (750 ml), Tratamiento 5 (1000 ml). Los bloques muestran el promedio de las tres repeticiones dentro de cada tratamiento.
Table 5. Analysis of variance for the evaluation of the efficiency of treatments in reducing aphids in mandarin crops.
Variance analysis
Variable N R2 R2Acd CV
Number of aphids 75 0.96 0.96 22.02
Analysis of Variance Table (SC type III)
F.V. S.C. df CM F p-value
Model 91166.48 4 22791.62 410.95 <0.0001
Treatment 91166.48 4 22791.62 410.95 <0.0001
Mistake 3882.27 70 55.46
Total 95048.75 74
Note: coefficient of determination (R2), adjusted coefficient of determination (R2 Acd), coefficient of variation (CV), number of aphids (N), degrees of freedom (df).
Table 6. Post-Hoc comparison of treatment efficiency in reducing aphids: results of the Tukey test.
Treatment Measures n SE
5 2.60 15 1.92 a
4 9.00 15 1.92 a
3 23.47 15 1.92 b
2 34.07 15 1.92 c
1 100.00 15 1.92 d
Means with a common letter are not significantly different (p > 0.05)
Note: Letters indicate treatment groups that are not significantly different from each other (p > 0.05). The treatments with the same letter belong to the same group and do not show significant differences: Group a: Treatments 4 and 5. Group b: Treatment 3. Group c: Treatment 2. Group d: Treatment 1.
Disclaimer/Publisher’s Note: The statements, opinions and data contained in all publications are solely those of the individual author(s) and contributor(s) and not of MDPI and/or the editor(s). MDPI and/or the editor(s) disclaim responsibility for any injury to people or property resulting from any ideas, methods, instructions or products referred to in the content.
Copyright: This open access article is published under a Creative Commons CC BY 4.0 license, which permit the free download, distribution, and reuse, provided that the author and preprint are cited in any reuse.
Prerpints.org logo

Preprints.org is a free preprint server supported by MDPI in Basel, Switzerland.

Subscribe

© 2024 MDPI (Basel, Switzerland) unless otherwise stated