Preprint
Article

Enhancing Safety in Autonomous Vehicles: The Impact of Warning Signal Modalities on Driver Behavior and Situational Awareness

Altmetrics

Downloads

201

Views

88

Comments

0

A peer-reviewed article of this preprint also exists.

Submitted:

25 July 2024

Posted:

29 July 2024

You are already at the latest version

Alerts
Abstract
Semi-autonomous vehicles (AVs) enable drivers to engage in non-driving tasks but require them to be ready to take control during critical situations. This "out-of-the-loop" problem demands a quick transition to active information processing, raising safety concerns and anxiety. Multimodal signals in AVs aim to deliver take-over requests and facilitate driver-vehicle cooperation. However, the effectiveness of auditory, visual, or combined signals in improving situational awareness and reaction time for safe maneuvering remains unclear. This study investigates how signal modalities affect driver’s behavior using virtual reality (VR). We measured drivers’ reaction times from signal onset to take-over response and gaze dwell time for situational awareness across twelve critical events. Furthermore, we assessed self-reported anxiety and trust levels using the Autonomous Vehicle Acceptance Model questionnaire. Results showed visual signals significantly reduced reaction times, whereas auditory signals did not. Additionally, any warning signal, together with seeing driving hazards, increased successful maneuvering. Analysis of gaze dwell time on driving hazards revealed that audio and visual signals improved situational awareness. Lastly, warning signals reduced anxiety and increased trust. These results highlight the distinct effectiveness of signal modalities in improving driver reaction times, situational awareness, and perceived safety, mitigating the “out-of-the-loop” problem and fostering human-vehicle cooperation.
Keywords: 
Subject: Social Sciences  -   Cognitive Science

1. Introduction

Autonomous vehicles (AVs) are envisioned to become integral to future transportation systems, offering numerous benefits such as improved mobility, reduced emissions, and enhanced safety by minimizing human-related errors [1,2,3]. Additionally, AVs offer users the opportunity to engage in non-driving-related tasks (NDRTs) while being transported, thereby transforming the concept of private vehicle driving [4]. To better understand the benefits, it is essential to recognize that each automation level has distinct characteristics, allowing for specific advantages. The SAE International’s “Taxonomy and Definitions for Terms Related to Driving Automation Systems for On-Road Motor Vehicles” provides a well-known categorization of automation, dividing autonomous driving into six levels. While Levels 0 to 2 require human drivers to monitor and control the vehicle, Levels 4 and 5 presuppose high and full automation respectively. Among them, Level 3 refers to a type of conditional automation, also known as partial or semi-autonomous driving, requiring the driver to take vehicle control in situations unmanageable by the autonomous system [5]. In all five levels, AVs benefit from automation capabilities but also face challenges that could potentially undermine their benefits.
Semi-autonomous vehicles (Level 3) have attracted attention for their potential to allow interaction between drivers and autonomous systems [2,6,7]. This level of automation has advantages and disadvantages, making it a contentious design choice. On the positive side, interaction with semi-autonomous vehicles enhances their acceptance, addressing one of the key cognitive barriers to widespread adoption [8,9,10,11]. However, requiring drivers to be ready to take over control conflicts with one of the main benefits of AVs: allowing drivers to engage in non-driving-related tasks. Asking users to remain alert throughout the ride due to potential critical situations negatively impacts their experience, ultimately reducing AVs acceptance [8]. Thus, the primary issue with such vehicles is often categorized as the "out-of-the-loop" problem. The problem is defined as the absence of appropriate perceptual information and motor processes to manage the driving situation [12,13]. The out-of-the-loop problem occurs when sudden take-over requests (TORs) by the vehicle disrupts drivers’ motor calibration and gaze patterns, ultimately delaying reaction times, deteriorating driving performance, and increasing the likelihood of accidents [12,13,14,15]. Appropriate interface designs that facilitate driver-vehicle interaction and prepare drivers to take over control can mitigate the out-of-the-loop problem.
To ensure a safe and efficient transition from autonomous to manual control, it is crucial to provide drivers with appropriate Human-Machine Interfaces (HMIs) that bring them back into the loop. Inappropriate or delayed responses to TORs frequently lead to accidents that pose considerable harm to drivers, passengers, and those on the road. HMIs that provide appropriate warning signals can facilitate this transition, making it faster and more efficient by enhancing situational awareness and performance [1,3,16,17]. For instance, multimodal warning signals allow users to perform non-driving-related tasks while ensuring their attention can be quickly recaptured when necessary, thereby preventing dangerous driver behavior [18]. Warning signals such as auditory, visual, and tactile convey semantic and contextual information about the driving situation that is crucial when retrieving control [18,19,20]. The process of taking control of the vehicle involves several information processing stages, including the perception of stimuli (visual, auditory, or tactile), cognitive processing of the traffic situation, decision-making, resuming motor readiness, and executing the action [17,21,22]. Effective multimodal warning signals play an indispensable role in moderating information processing during take-over by enhancing situational awareness and performance.
Situational awareness and reaction time are two critical factors within the process of taking over control. Situational awareness is defined as "the perception of elements in the environment within a volume of time and space, the comprehension of their meaning, and the projection of their status in the near future" [23]. According to this definition, the perception of potential threats and their comprehension constitute the first stages in the information processing stages, where the driver’s attention is captured and the context of the critical situation is understood [18,23]. A unimodal or multimodal signal that is able to deliver urgency can already impact in these early stages [18,24]. For instance, auditory non verbal sounds are shown to enhance perceived urgency and draw back attention to the driving tasks [25,26,27]. Similarly, visual warnings alone or combined with auditory signals are successful in retrieving attention and increasing awareness of a critical situation [20,25,28]. Besides situational awareness, reaction times are commonly used metrics to evaluate drivers’ behavior during TOR. In general, reaction times encompasses the entire take-over process, from perceiving the stimuli (perception reaction time) to performing the motor action (movement reaction time) [22,29]. Differentiating between these stages is crucial for calculating the effect of a warning signal on reaction time. Discrete results in reaction time studies have revealed that the method of calculation should be considered precisely [22]. Perception reaction time is defined as the time required to perceive the stimuli, cognitively process the information, and make a decision. Movement reaction times is the time needed to perform the motor action [29]. While perception reaction times can be influenced by modality and characteristic of a signal, movement reaction time is more driven by the complexity of the situation and the expected maneuver [22,30]. As a result, the visual modality can affect movement reaction times by alerting the driver while simultaneously providing complex spatial information, such as distance and direction [31]. Understanding the roles of situational awareness and reaction times in the take-over process, and the effects of warning signals on each of them, allows us to determine when and where different types of signals are beneficial or detrimental to ensure a safer transition during TORs.
In addition to safe transitions that facilitate the integration of AVs into everyday life, acceptance factors play a crucial role in determining the feasibility of such integration. Increasing user acceptance can be effectively achieved through collaborative control and shared decision-making strategies, such as TORs [7,8,32]. However, providing TORs in semi-autonomous vehicles has a dual effect on their acceptance. While such requests can increase trust through enhanced interaction, they also induce anxiety during the take-over process [8,33]. Therefore, measuring perceived feelings of anxiety and trust is essential when studying conditional AVs. Subjective measures, like acceptance questionnaires, have been used to determine acceptance, with recent examples specifically designed for AVs. The Autonomous Vehicle Acceptance Model (AVAM) provides a multi-dimensional approach in quantifying acceptance aspects across different levels of automation [34].
The measuring methods used to understand drivers situational awareness and reaction times during TOR are as crucial as their definition. Differences in measuring methods lead to incommensurable results that make reproducibility difficult [35,36]. For instance, studies have used different metrics to understand drivers’ situational awareness and reaction time , including gaze related reaction time, gaze-on-road duration, hands-on-wheel reaction time, actual intervention reaction time, left-right car movement time [17,35,37,38]. Therefore, most research on driver behavior during critical events has produced mixed results. Additionally, most studies have been conducted in risk-free simulated environments due to the dangerous nature of the situations [39,40], usually carried out in laboratory-based setups, which are costly, space-consuming, and lack realism. As a result, research has questioned the extent to which findings under such conditions generalize to the real world [41]. One of the main reasons is the fact that participants in conventional driving simulations remain conscious of their surroundings, reducing the perceived realism of the driving scenario. For results to be generalizable to the real world, it is particularly important to simulate driving conditions that elicit similar natural driving behavior, including realistic ambience, increased workload, prolonged driving, meaningful signals, various behavioral measures, and diverse population sample [41,42]. To mitigate these limitations, virtual reality (VR) has been proposed as an inexpensive and compact solution, providing a higher immersion feeling [43,44,45,46]. Unlike conventional driving simulations, VR offers a more immersive driving experience, allowing researchers to isolate and fully engage drivers in critical situations. By enhancing perceived realism, VR makes simulated events feel more real [47,48], resulting in drivers’ behaviors closer to real life and findings that are more ecologically valid than those obtained through conventional driving simulations [49,50]. In addition, VR-based driving simulations offer other advantages which make them preferred over traditional systems, including integrated eye-tracking to collect visual metrics to understand situational awareness [38,51], controllability and repeatability [52], as well as usability for education and safety training [53,54,55]. Hence, VR holds the potential to investigate drivers’ behavior in a safe, efficient, and reproducible manner, which is of particular interest when designing multimodal interfaces for future autonomous transport systems.
In this study we used VR to investigate the impact of signal modalities—audio, visual, and audio-visual—on situational awareness and reaction time during TOR in semi-autonomous vehicles. We collected quantitative data on both objective behavioral metrics (visual and motor behavior) and subjective experience (AVAM questionnaire) from a large and diverse population sample, encompassing varying ages and driving experience. We hypothesized that the presence of any warning signal (audio, visual, or audio-visual) would lead to a higher success rate compared to a no-warning condition. Specifically, we posited that the audio warning signal would enhance awareness of the critical driving situation, while a visual signal would lead to a faster motor response. Furthermore, we predicted that the audio-visual modality, by combining the benefits of both signals, would result in the fastest reaction times and the highest level of situational awareness. Additionally, we expected that seeing the object of interest, regardless of the warning modality, would directly improve the success rate. Finally, we expected a positive correlation between self-reported preferred behavior and actual behavior during critical events and hypothesized that the presence of warning signals would be associated with increased perceived trust and decreased anxiety levels in drivers. By examining drivers’ behavior under these conditions, we can gain a better understanding of the effect of signal modalities on performance.

2. Materials and Methods

2.1. Research Design

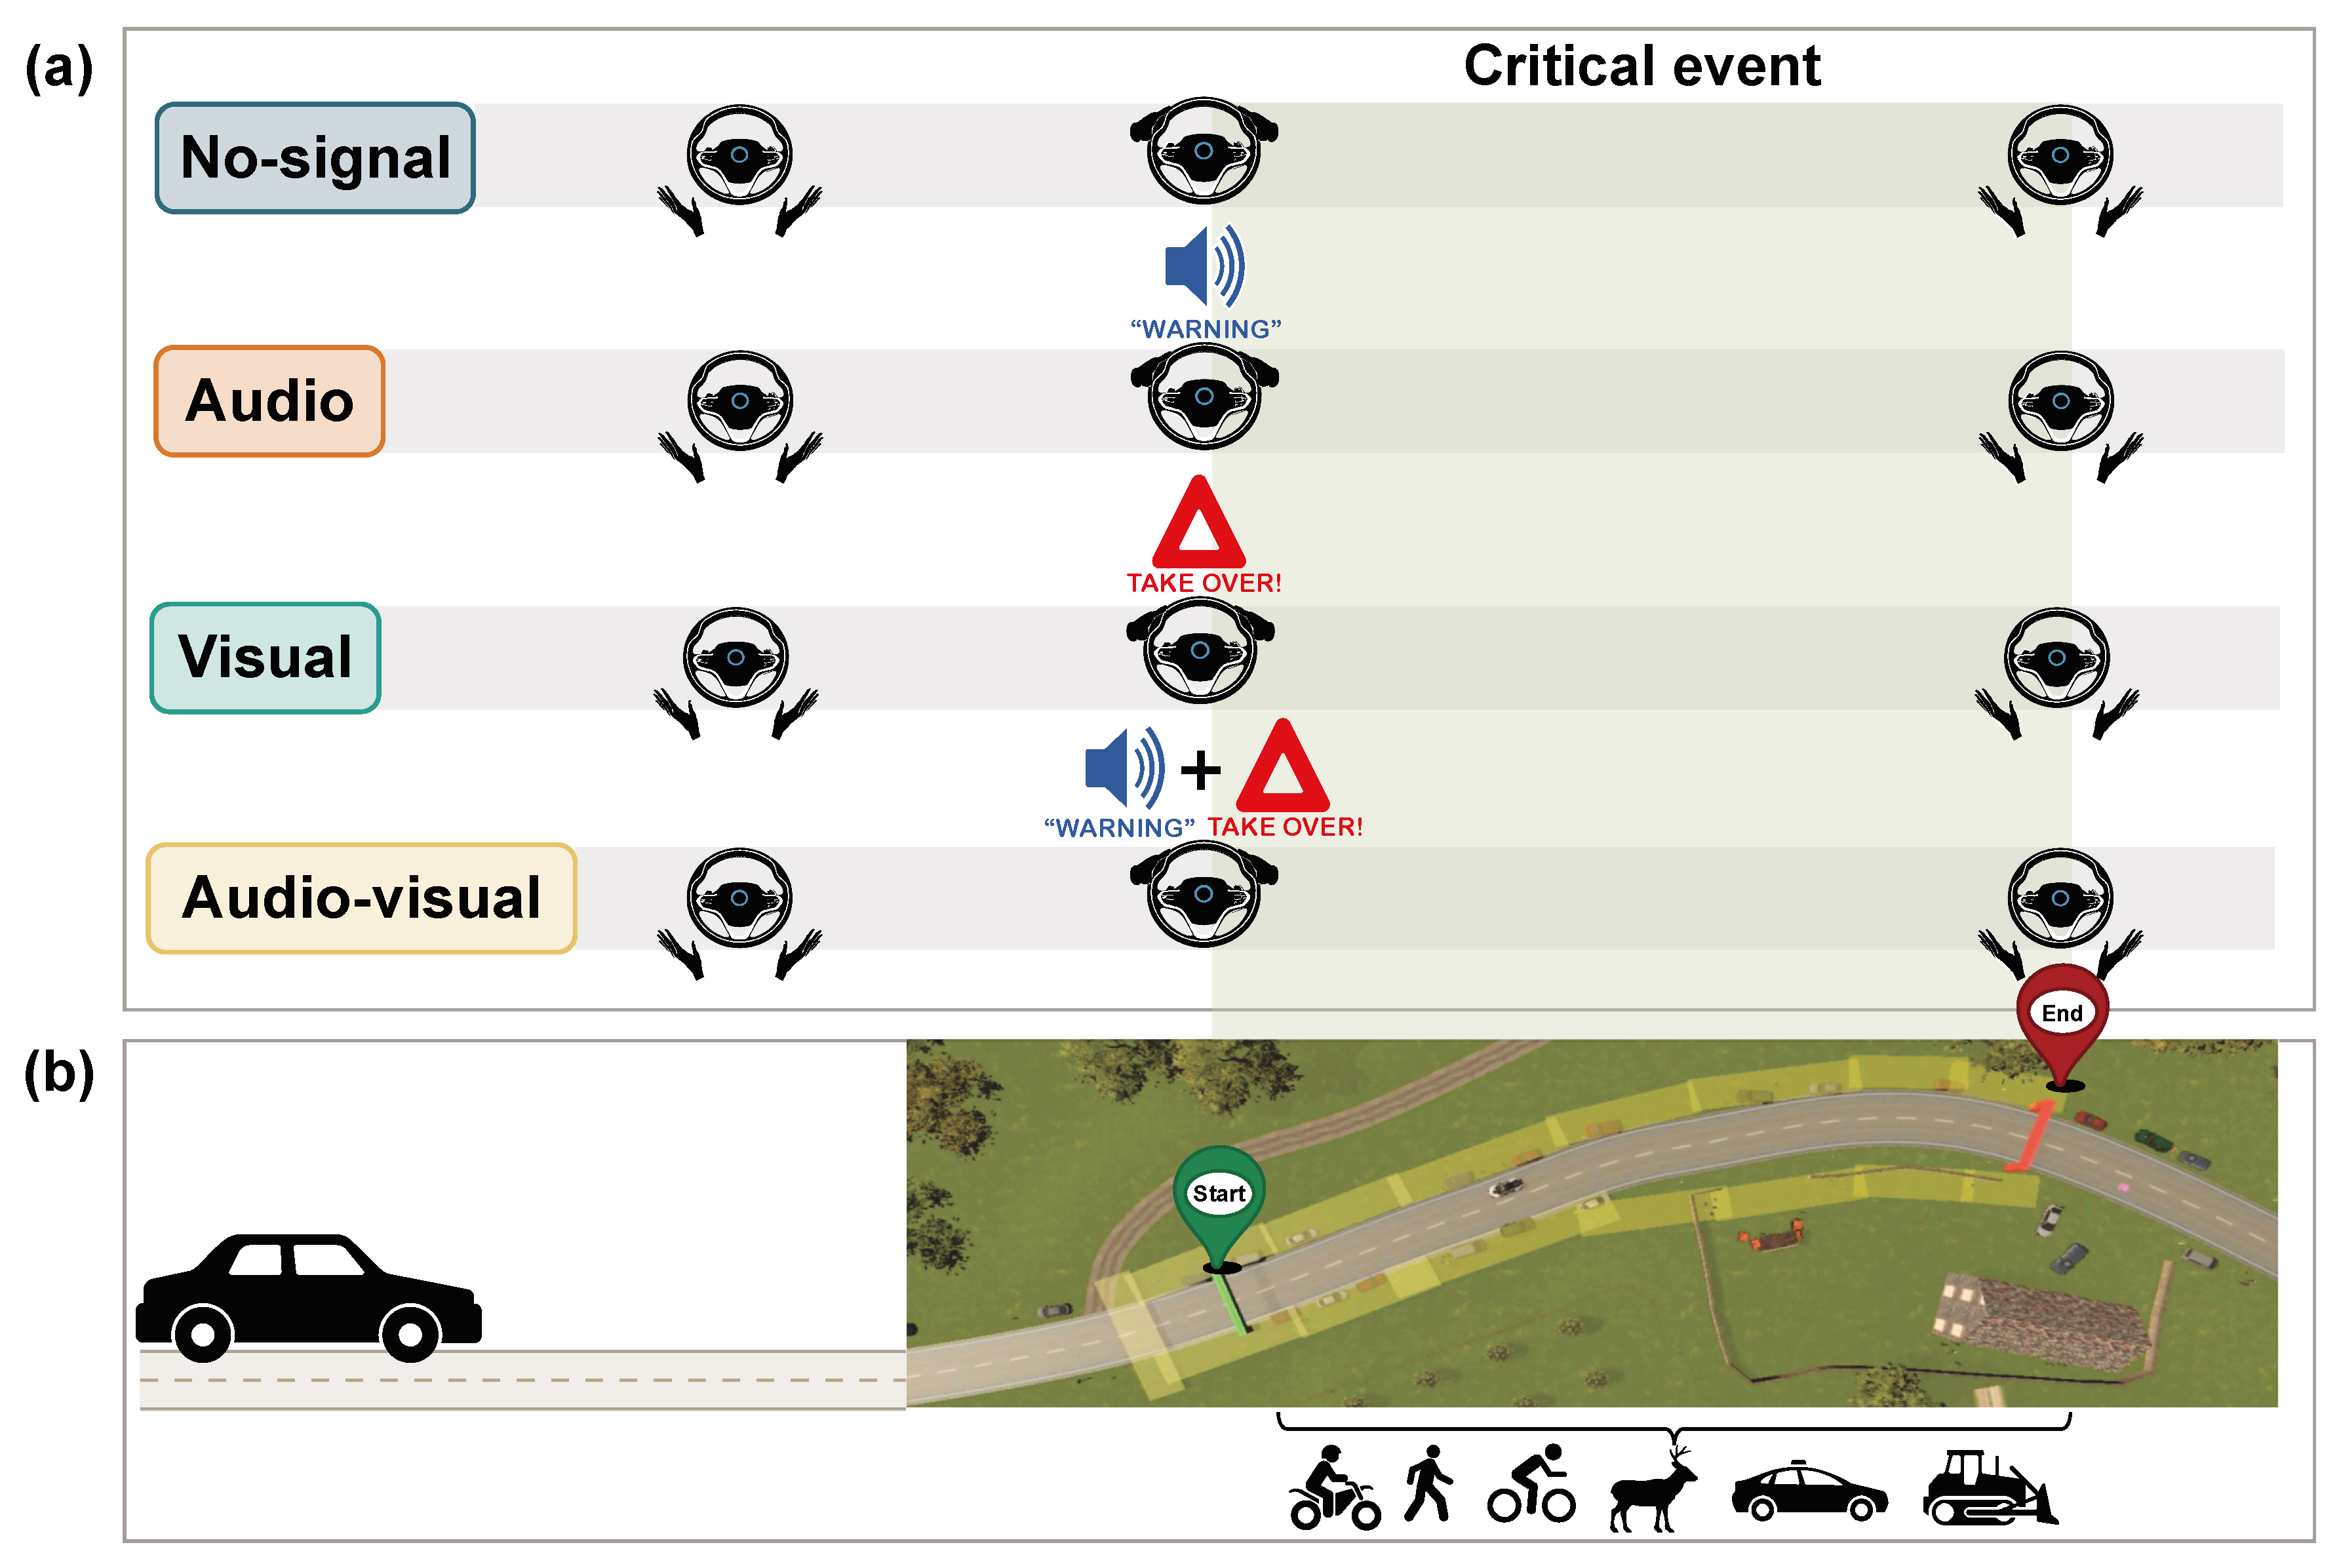
To investigate the impact of warning signal modality on driver behavior and situational awareness, four experimental conditions were designed to alert the driver about critical traffic events, requiring the driver to take-over control of the vehicle. Experimental conditions included a base condition with no signal, an audio signal, a visual signal, an audio-visual signal (Figure 1a). The base condition served as the control, providing no warning feedback to the driver. The audio signal modality featured a female voice, delivering a spoken “warning” sound at normal speech pace. The visual signal modality included a red triangle with the word “warning” and a red square highlighting potential driving hazards in the scene. The audio-visual signal modality combined both sound and visual warnings for dual feedback. Participants were randomly assigned to one of these conditions and drove an identical route, encountering the same 12 critical traffic events in sequential order. The critical events were designed to assess driver behavior during TOR and subsequent driving in hazardous situations (Figure 1b). Each critical event involved the sudden appearance of predefined driving hazards or “object(s) of interest”, such as animals, pedestrians, other vehicles, or landslides that posed challenges for driving. For instance, in the audio-visual condition both visual and auditory feedback alerted the driver about the driving hazard briefly at the start of the event (Figure 2a), after which the signals remained off for the duration of the subsequent manual drive (Figure 2b). The experimental design allowed us to collect behavioral and perceptual metrics and compare driver responses across different conditions.
We chose a mixed-methods approach to collect quantitative data on both objective behavioral metrics and subjective experience of autonomous driving. Objective measures included the driver’s reaction time from signal onset to take-over response, the successful completion in avoiding vehicle collision, as well as the dwell time of gaze on the object of interest. Additionally, we used the Autonomous Vehicle Acceptance Model questionnaire to assess self-reported levels of anxiety, trust, and preferred method of control after participants completed the VR experiment (for the respective items refer to Appendix A, Table A1) [34]. The current research design enables us to investigate how signal modality impacts driver behavior, situational awareness, and perceived levels of trust when handling TOR from semi-autonomous vehicles. By analyzing these performance metrics, the current research provides insights into the impact of multimodal warning signals on drivers behavior and situational awareness, ultimately contributing to enhanced driving safety.

2.2. Materials and Setup

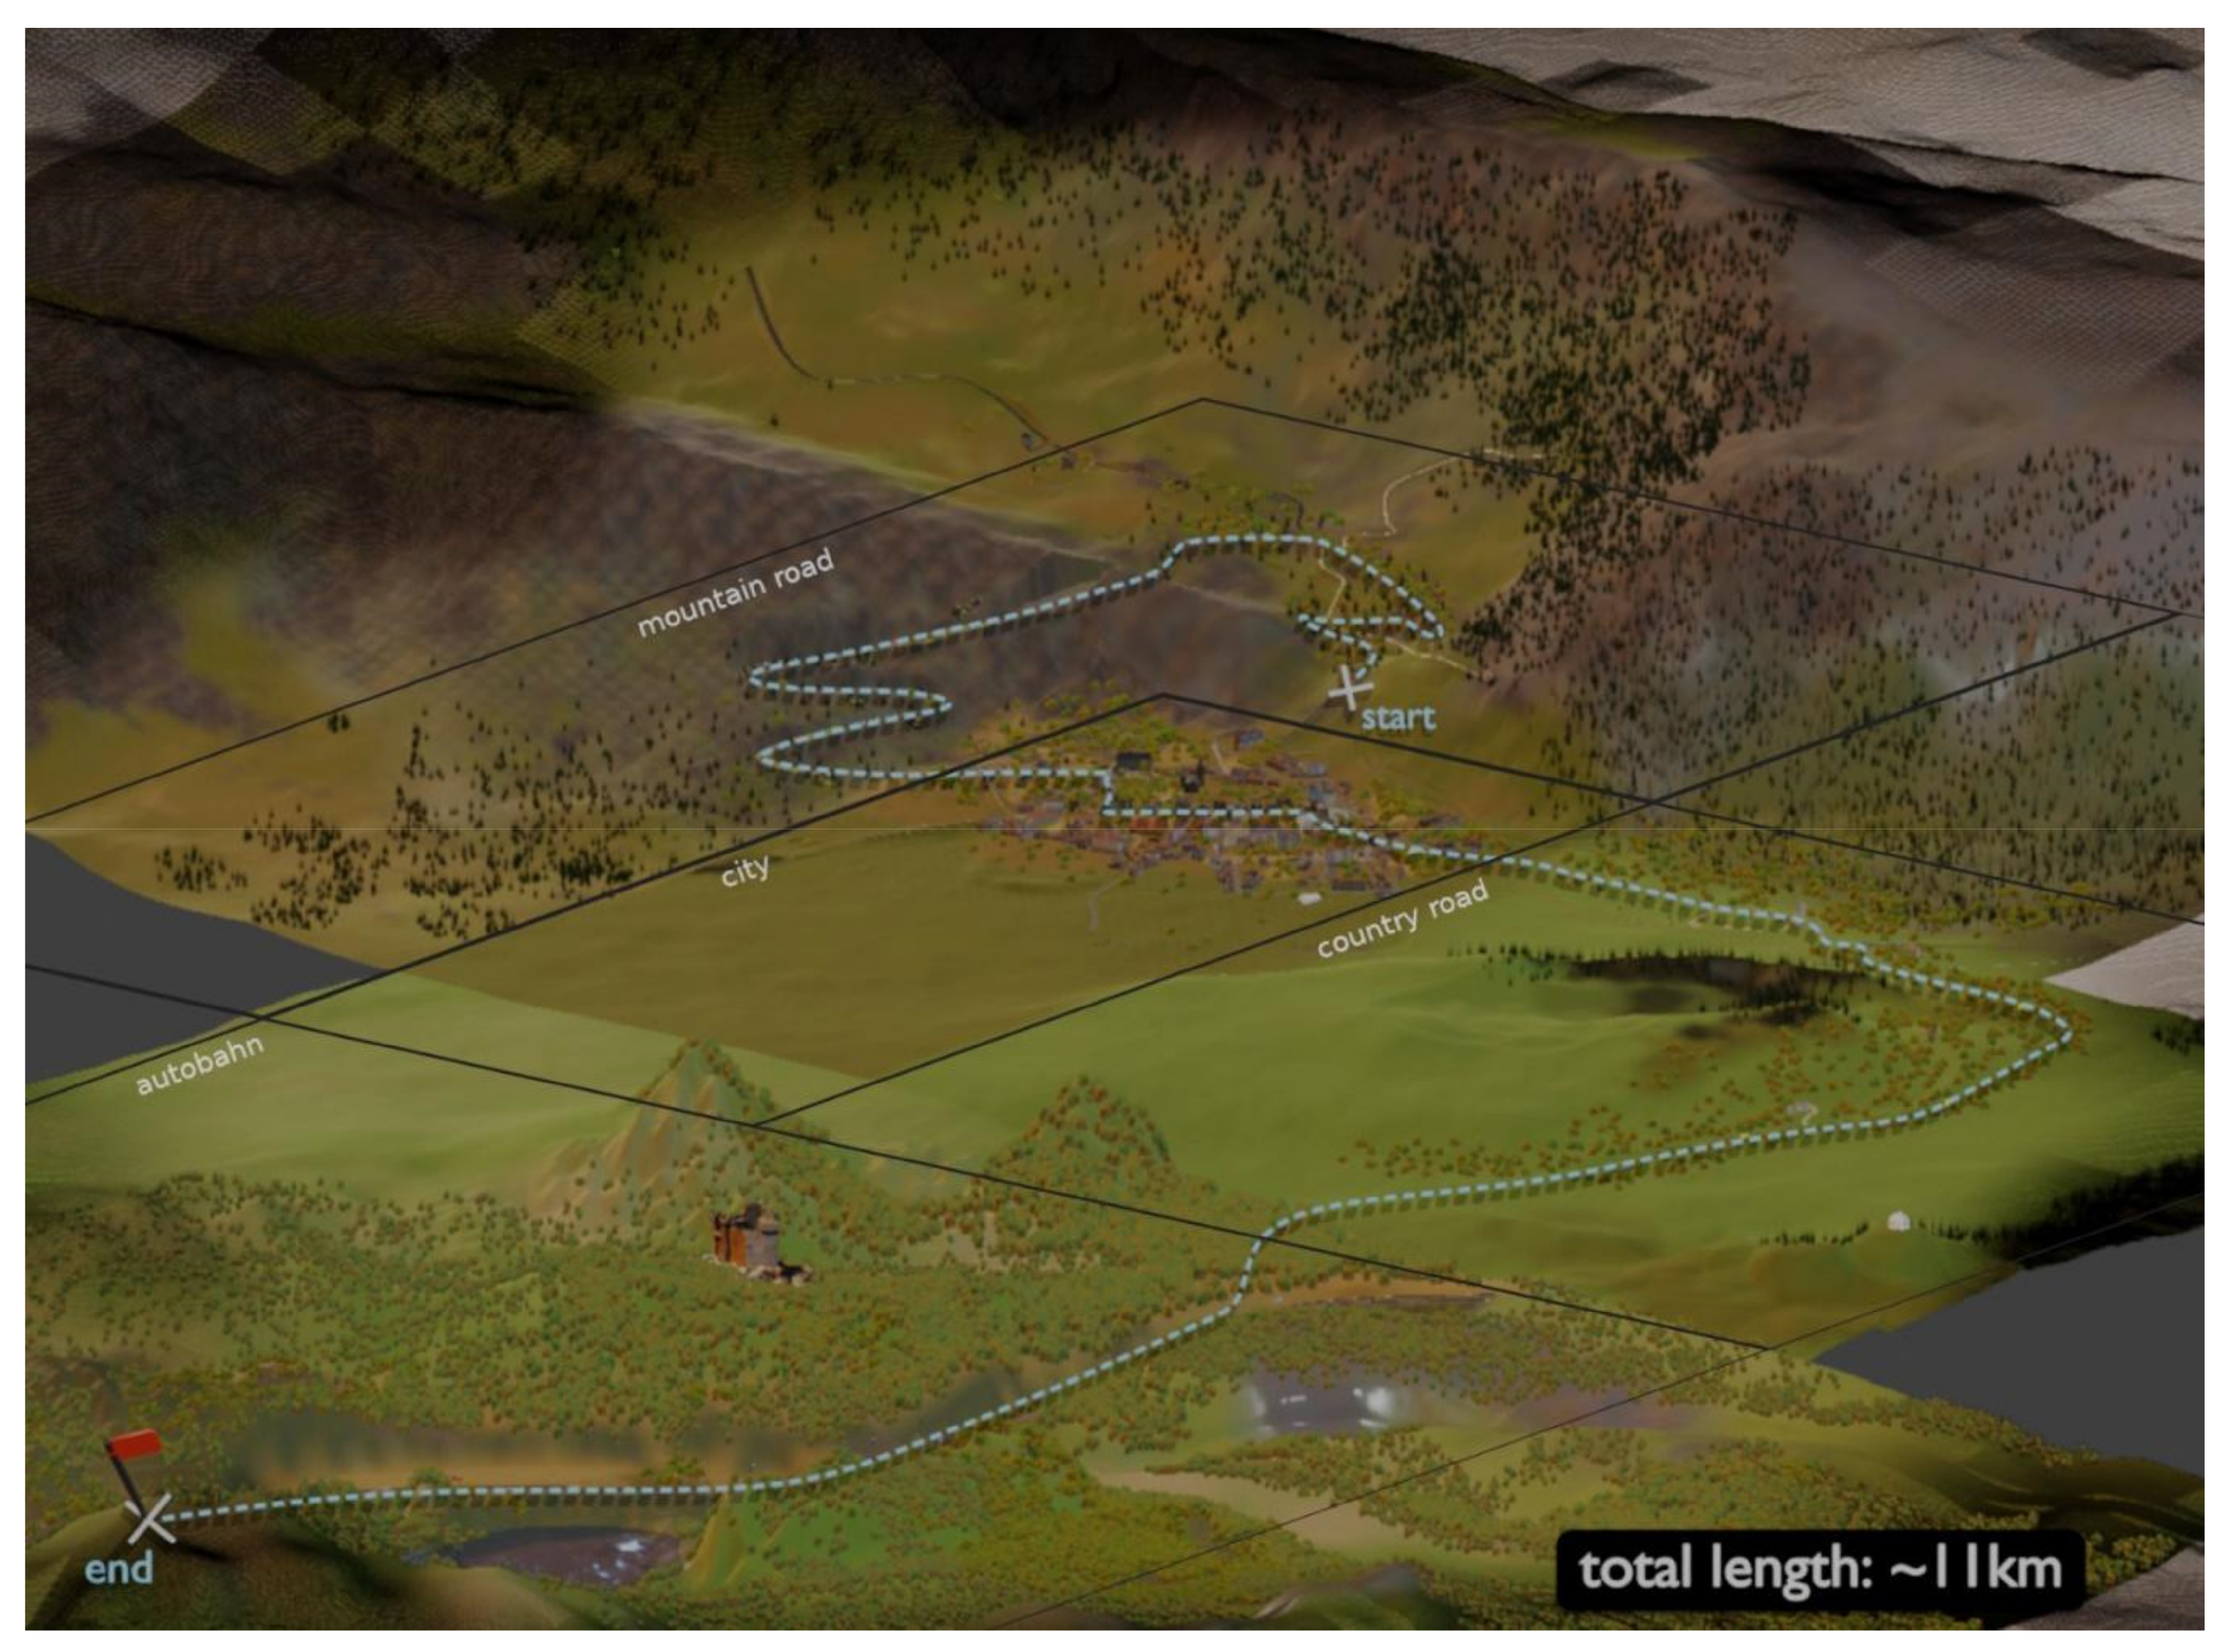
The current study used an open-access VR toolkit called “LoopAR” to test the driver’s interaction with a highly automated vehicle during various critical traffic events. The LoopAR environment was implemented using the Unity® 3D game engine 2019.3.0f3 (64 bit) [56], and designed for assessing driver-vehicle interaction during TORs [57]. LoopAR offers an immersive driving experience and seamlessly integrates with gaming steering wheels, pedals, and eye tracking. The VR environment includes a dynamic VR city prototype comprised of numerous vehicles (such as motorbikes, trucks, cars, etc.), 125 animated pedestrians, and several types of traffic signs. The design of the terrain was based on real geographical information of the city of Baulmes in the Swiss Alps. The entire terrain covers approximately 25 km² and offers about 11 km of continuous driving experience through four types of road scenes (Figure 3). The scenes include a mountain road (3.4 km), a city road “Westbrueck” (1.2 km), a country road (2.4 km), and a highway road (3.6km). In addition to static objects such as trees and traffic signs, the VR environment is populated with animated objects like pedestrians, animals, and cars to create realistic traffic scenarios. This diverse, expansive and highly realistic VR environment enables the current experiment to measure the driving behavior with high accuracy and efficiency.
For rendering the VR environment, we used the HTC Vive Pro Eye device with a built-in Tobii Eye Tracker connected to SRanipal and the Tobii XR SDK. The eye-tracking component includes an eye-tracking calibration, validation, and online ray-casting to record the driver’s gaze data during the experiment. To enable and collect steering and braking input data, we used game-ready Fanatec CSL Elite Steering Wheel and pedals devices. The experimental setup aimed at providing a stable and high frame rate visual experience and supported an average of 88 frames per second (fps), matching the 90 fps sampling rate of the HTC Vive eye-tracking device. More detailed information about the LoopAR environment, implementation, and software requirements can be found in the paper [57].

2.3. Participants

A total of 255 participants were recruited for the study during two job fairs in the city of Osnabrück. However, some participants were excluded from the final analysis due to various reasons. Only 182 participants including 74 females ( M = 23.32 years, S D = 8.27 years), and 110 male ( M = 27.68 years, S D = 19.75 years) who answered the Autonomous Vehicle Acceptance Model questionnaire were included in the questionnaire analysis. For the behavioral analysis, further exclusion criteria were applied. A total of 84 participants were excluded due to an eye-tracking calibration error exceeding 1.5 degrees or failure to complete the queried four scene rides. Additionally, 8 participants were excluded due to missing data for two or more of the critical events. Lastly, 6 participants were excluded due to eye-tracking issues such as missing data or large eye blinks. After these exclusions, 157 participants (base = 43; audio-visual = 50; visual = 36; audio = 28) were included in the main behavioral analyses. Demographic information such as gender and age was only available for 143 participants who have both behavioral and questionnaire data (53 females, M = 22.67 , S D = 6.79 , and 90 males, M = 27.38 years, S D = 10.49 years). No demographic-based analysis was conducted in this study. All participants provided written informed consent before the experiment, and data was anonymized to protect participant privacy. The study was conducted in accordance with the Declaration of Helsinki and approved by the Ethics Committee of the University of Osnabrück.

2.4. Experimental Procedure

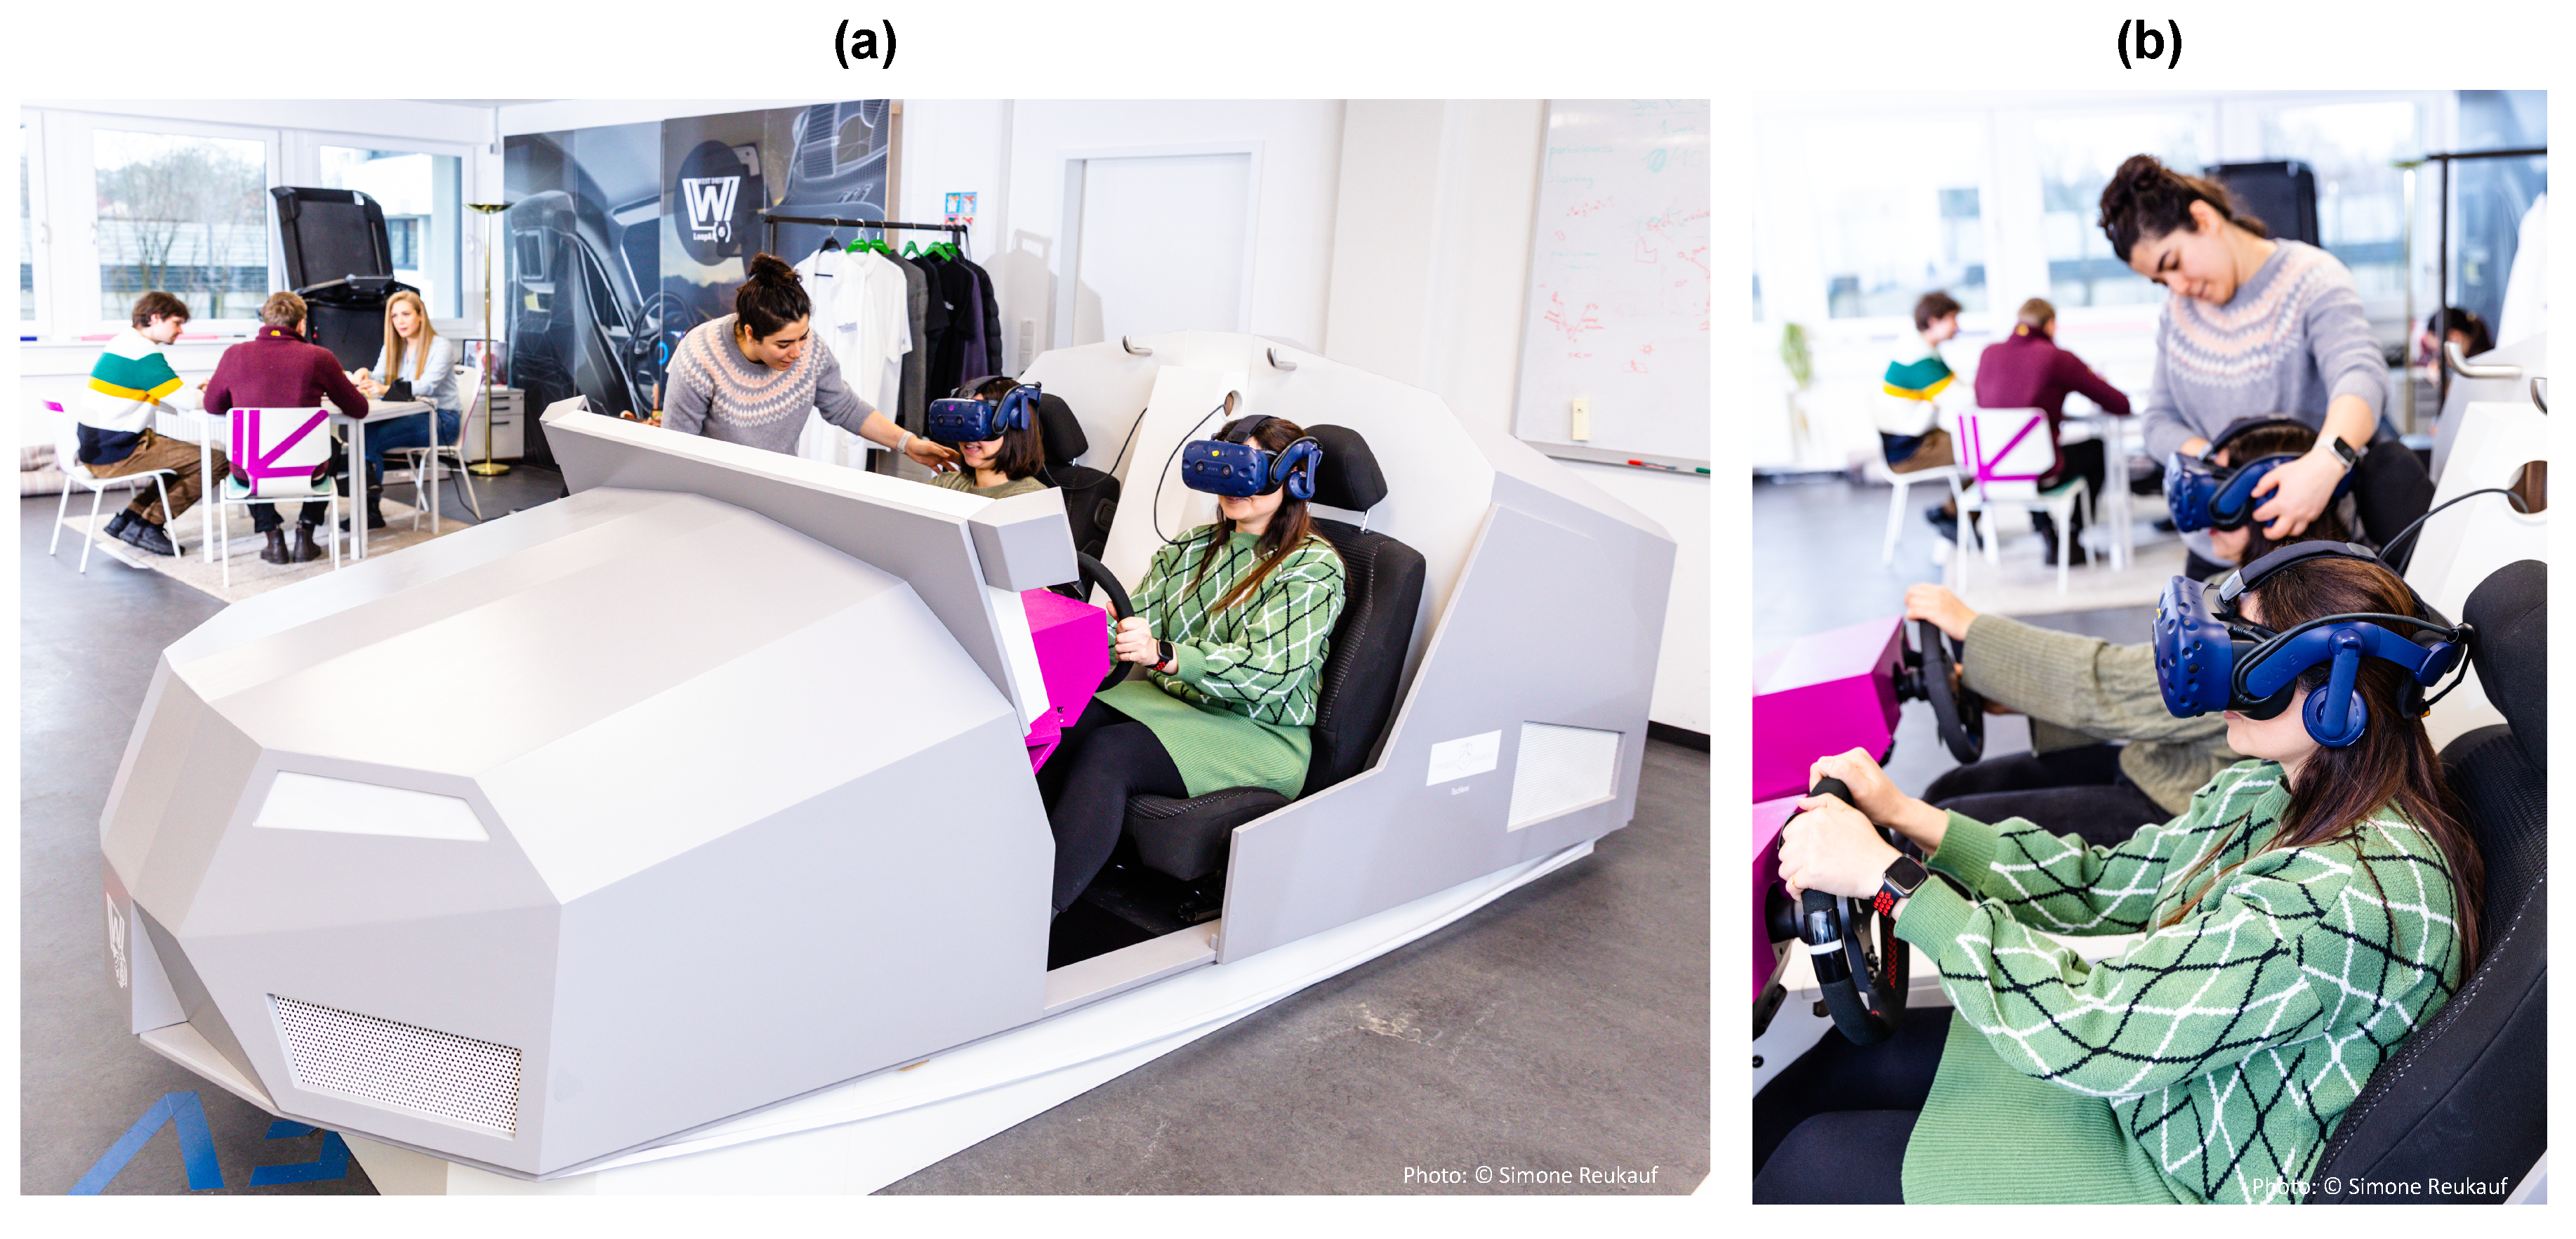
Upon arrival, participants were familiarized with the VR equipment that simulates the VR environment, comprising the VR headset and the wooden car simulator (Figure 4). For efficient use of time and space, measurements were conducted on both sides of the wooden car. Regardless of the side, the VR simulation consistently replicated right-hand driving. In the simulated driving scenario, participants were randomly assigned to one of the four experimental conditions and instructed to complete a VR drive. Before starting the main experiment, participants underwent a training session to acquaint themselves with the equipment and the driving task. Subsequently, we conducted eye-tracking calibration and validation, along with calibration for seat positioning and steering wheel. After completing the initial preparations, participants proceeded to the main experiment, which involved the continuous (virtual) drive of around 11 km with 12 critical events. During the drive, all participants traversed an identical route and encountered the same sequence of events. The experiment lasted approximately 10 minutes, and afterward, participants completed an optional Autonomous Vehicle Acceptance Model questionnaire.

2.5. Data Preprocessing

The data was recorded in Unity and collected via the eye-tracker integrated in the head-mounted display (HMD) and the steering wheel and pedals. It included information about the critical events, participants’ visual behavior, and handling of the vehicle. The participant’s eye-tracking data consisted of the positions and directions represented as three-dimensional (3D) vectors in Euclidean space. All objects in the VR environment were equipped with colliders, which defined their shapes and boundaries. During the experiment, the eye tracker recorded the vector from each participant’s gaze that intersected with the collider of each object. In other words, the participant’s gaze on the objects was determined by where their gaze hit the objects’ colliders. Both the names and the positions of the objects hit by the participant’s gaze were recorded in 3D vectors for each timestamp. To filter and narrow down the search for determining which objects the participants paid attention to during the drive, we calculated the distance from the participant’s position to each object and selected only the names and positions of the five closest objects to include in the final dataset. The steering data consisted of numerical values representing the rotation of the vehicle steering wheel in degrees. A value of zero indicated no steering (constant direction), negative values indicated steering to the left, and positive values indicated steering to the right. Similarly, the pedal data consisted of acceleration and braking inputs. While the vehicle was driving autonomously, the values remained constant, at either 1 or 0. When the participant provided input during the take-over and manual driving, the values changed to greater than 0. Lastly, the VR scene data consisted of information regarding each event, such as the name, start and end timestamps, and duration, as well as the name of the object that the participant gaze collided with, if any. As such, information on whether the event was successfully completed or not was also included. This process ensured that the data used in the study was reliable and met the necessary requirements for the analysis and testing of the hypothesis.

2.6. Performance Metrics

2.6.1. Reaction Times

To evaluate drivers’ take-over performance, we calculated their reaction time. It was defined as the time interval between the onset of the warning signal and drivers’ following behavioral response. This involved analyzing drivers’ motor engagement when steering, braking, and accelerating the vehicle. For each type of behavior, we first verified whether input values remained constant or varied, indicating whether drivers maneuver with said behavior or not. If values varied over the duration of the critical event, we calculated the rate of change per second over time [58,59], smoothed this rate of change using a mean rolling window, and took its absolute value. This approach allowed us to understand the velocity of the steering wheel maneuver over the duration of the manual drive, as well as sudden changes in braking and accelerating.
Following a peak approach, we then calculated the first derivative of the smoothed rate of change to identify all local maxima (peak velocity), which corresponded to pivotal points of significant change when steering, braking, and accelerating [59]. The first local maxima surpassing a predefined threshold represented the driver’s reaction time. For brake and acceleration, we set a threshold equal to the median of the initial values of the smoothed rate of change plus 0.01. For steering, we set a threshold of 5 degrees if the maximum smoothed rate of change was greater than 3; otherwise, the maximum smoothed rate of change was set as the threshold [21,59,60]. We then identified the first local maximum that exceeded the threshold and used its timestamp as the reaction time, by subtracting it from the timestamp when the event started. In instances where no local maxima exceeded the threshold, the reaction time was determined as the timestamp of the first identified local maximum. We repeated this process for each type of motor engagement (steering, braking, and accelerating) of the driver with the vehicle and for each of the 12 critical events. Because critical events could vary greatly in nature and could require different types of responses [21], we calculated two types of reaction time: fastest reaction time and expected reaction time. The fastest reaction time was determined as the minimum value between steering, braking, and accelerating. The expected reaction time was based on a predefined order of reactions that could be expected from the driver during each event. For instance, some events would require steering to avoid driving hazards on the road, while others would require braking to avoid frontal collisions with pedestrians. This approach allowed us to calculate reaction time in a way that accounts for the different characteristics of each type of motor engagement and the specific conditions at each event.

2.6.2. Situational Awareness

To calculate the behavioral indicator of situational awareness, we processed the participants’ gaze data. Specifically, we examined whether the participant saw the object of interest (“seeing the object of interest”), the number of times the participant saw the object of interest (“gaze hits”), and the duration of their gaze on the object of interest (“dwell time of gaze”). To determine the “seeing of the object of interest”, we identified the data sample where the participant’s gaze collided with the object of interest in each event and saved it as binary categorical data. To calculate the “dwell time of gaze”, we computed the difference between the start and end timestamp for each consecutive data sample when the participant’s gaze collided with the object of interest. We excluded durations shorter than 100 milliseconds, consistent with typical eye gaze durations in human eye movement analysis [61,62]. To establish the number of “gaze hits” per participant within each event, we counted and summed the number of meaningful individual gaze durations (>100ms). Finally, the total “dwell time of gaze” was also calculated by summing over the individual gaze durations. These steps enabled us to quantify the participant’s various aspects of situational awareness in each event during the experiment.

2.6.3. Successful Maneuvering

We assessed participants’ successful maneuvering during the VR drive by analyzing their frontal collision performance during critical traffic events. Specifically, we focused on whether participants avoided colliding with objects in the scene. For each of the 12 critical events, a maneuver was considered successful if the participant did not crash the vehicle with any of the objects of interest inside the event. Conversely, an event was flagged as unsuccessful when a collision occurred. Unity performed this “successful event completion” calculation online during the experiment for each event, tracking participants’ interactions with the objects in the scene based on the vehicle and objects’ positions.

3. Results

A comprehensive analysis was conducted to evaluate the impact of different types of warning signals (audio, visual, audio-visual, and no signal) on reaction time, situational awareness, and the likelihood of successfully managing critical driving events in a simulated environment. Due to the non-normal distribution of the data across all dependent variables, we conducted the non-parametric Friedman test, an extension of the Wilcoxon signed-rank test. This test serves as the non-parametric equivalent of repeated measures analysis of variance (ANOVA) without assuming normality. The results from both Friedman tests and logistic regression models provided a detailed understanding of these effects.

3.1. Reaction Time Analysis

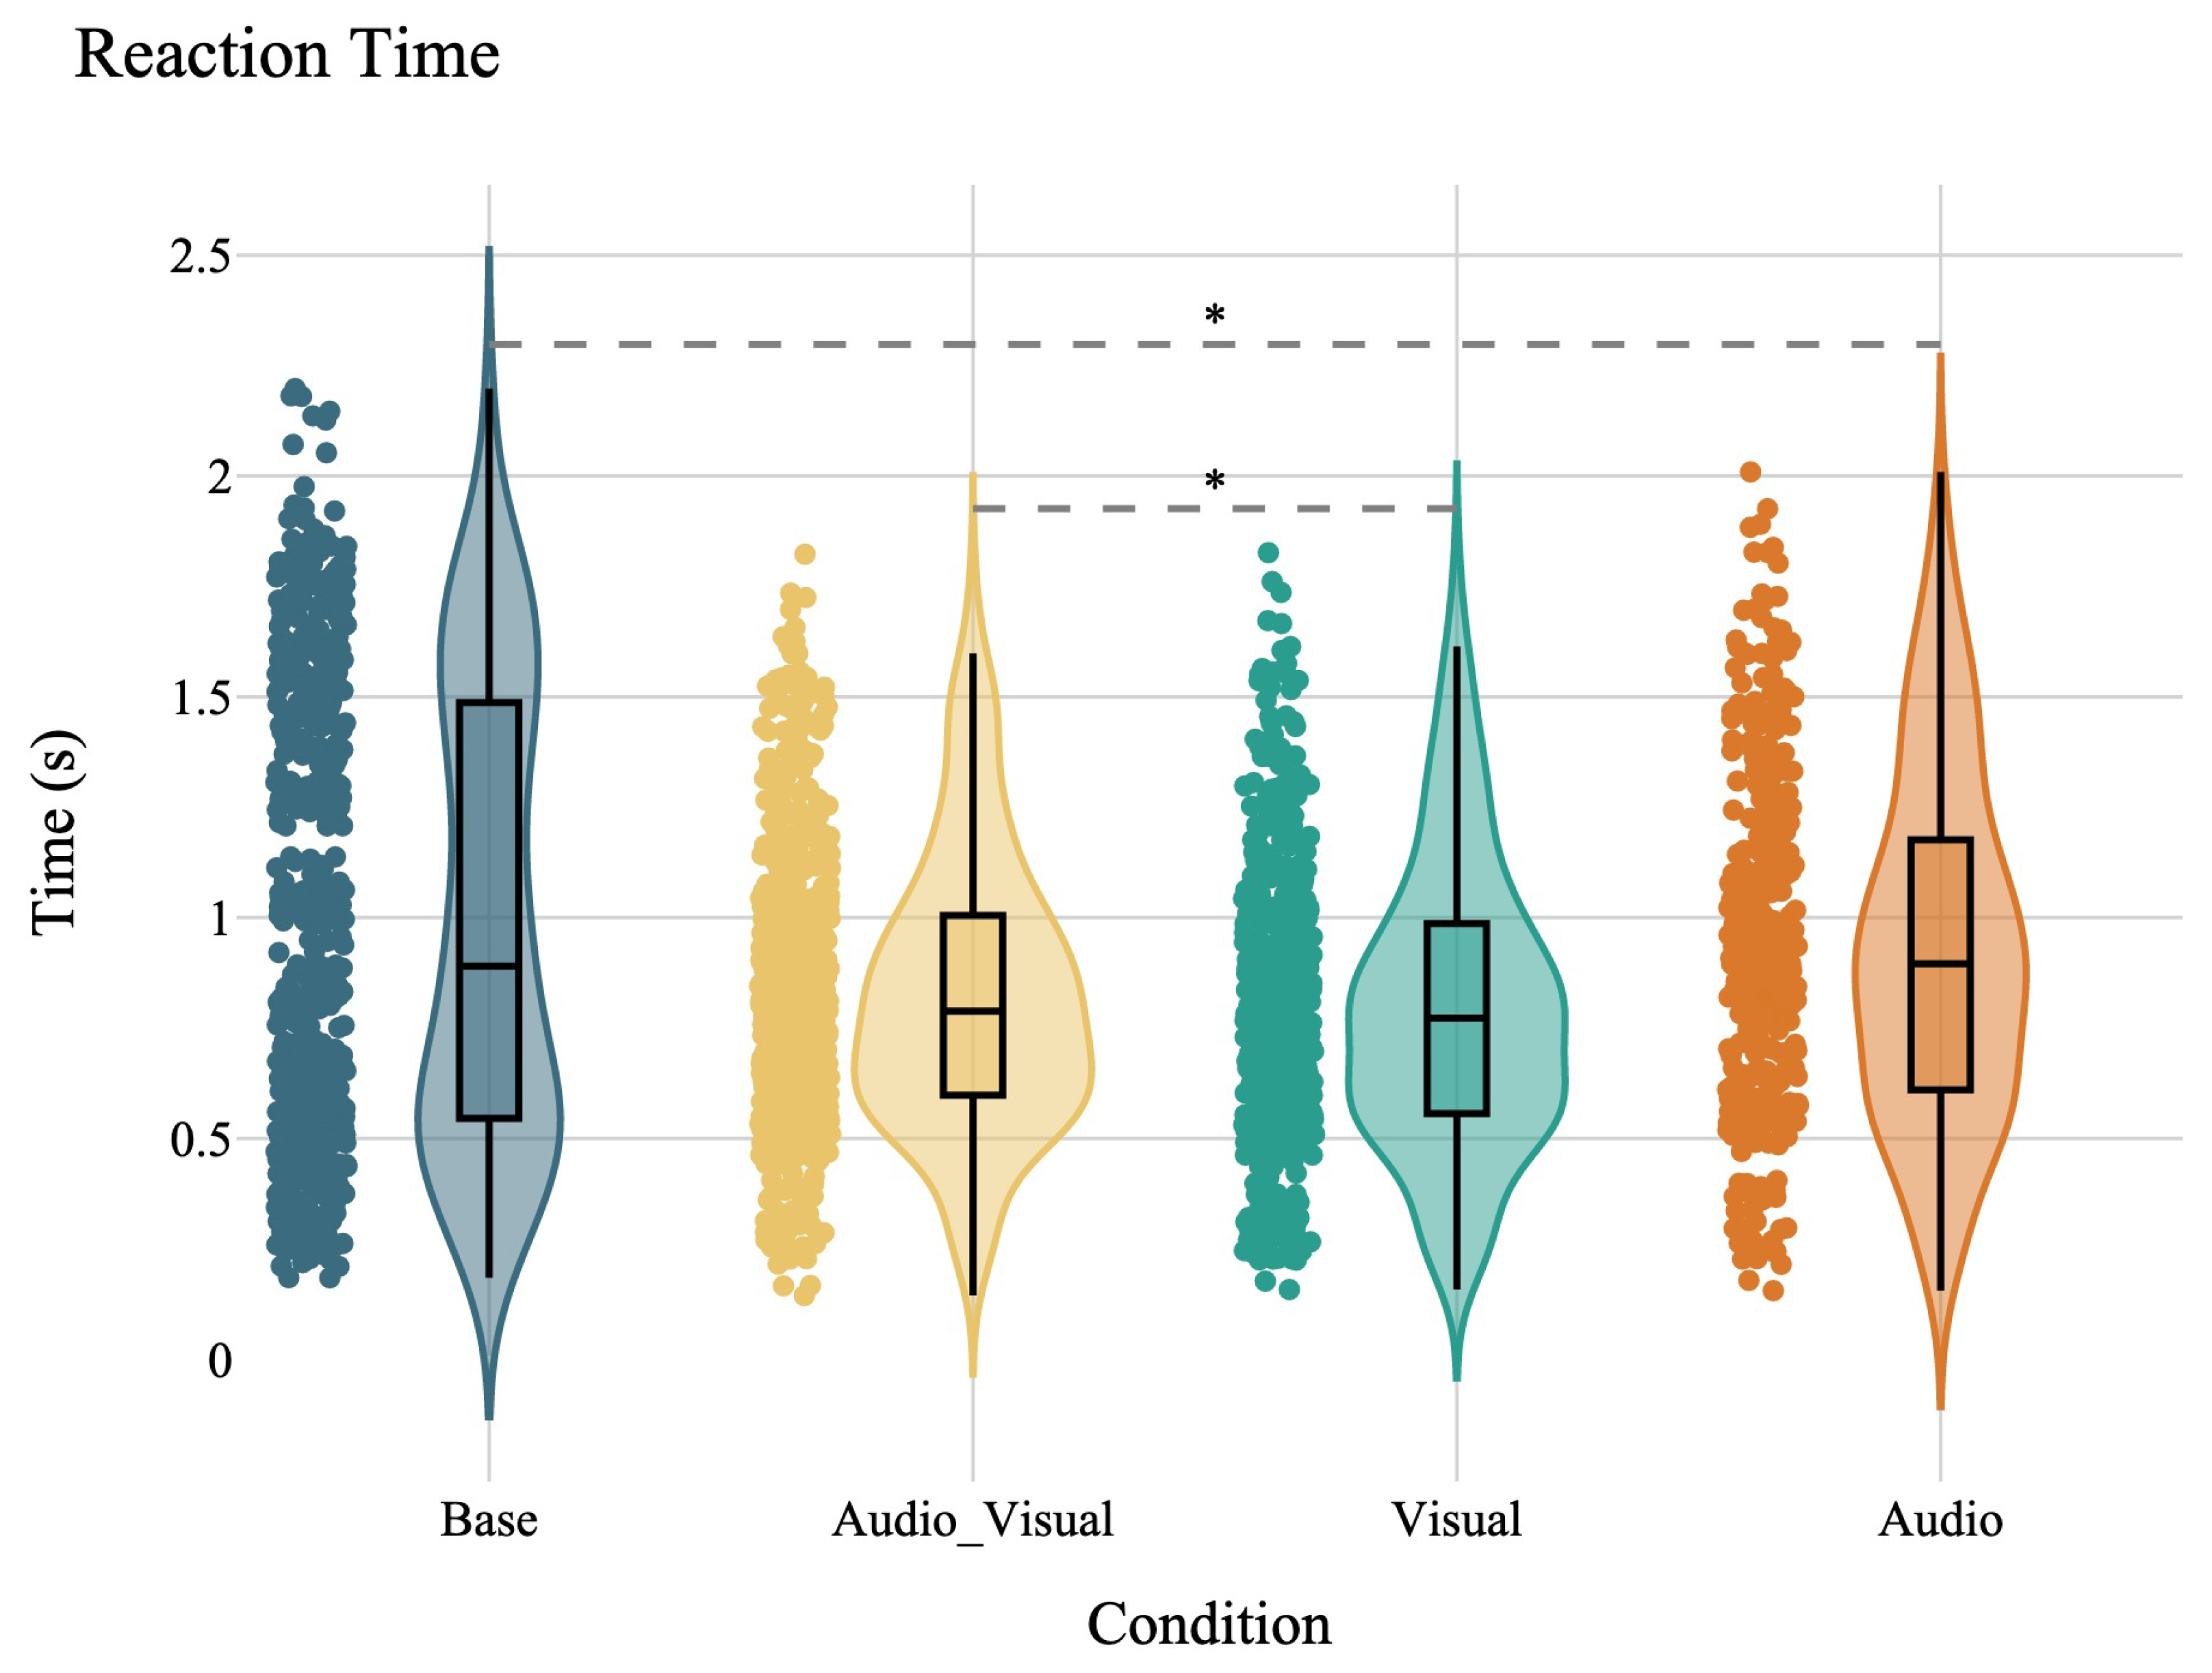
Investigating the main effect of the warning signal on overall reaction time among participants is one of the main purposes of the current study. A Friedman test was conducted to compare the effects of different types of warning signals—audio, visual, and audio-visual—as well as no-signal (reference condition) on the reaction time (log-transformed). The test revealed a significant difference in reaction times across the conditions, χ 2 ( 3 ) = 24.99 , p < . 001 . Post-hoc Wilcoxon signed-rank tests were conducted to follow up on this finding. Significant differences were found between the Base condition and both the audio-visual ( W = 51 , p < . 001 ) and visual conditions ( W = 61 , p < . 001 ), indicating that both audio-visual and visual warnings significantly reduced reaction time compared to no warning signal. Additionally, significant differences were observed between the audio-visual and audio conditions ( W = 64 , p < . 001 ), as well as between the visual and audio conditions ( W = 67 , p = . 001 ), suggesting that visual components, whether alone or in combination with audio signals, are more effective in reducing reaction times than audio signals alone. No significant difference was found between the audio-visual and visual conditions ( W = 188 , p = . 745 ) (Figure 5). These results demonstrate that visual warning signals, whether alone or combined with audio signals, are particularly effective in reducing reaction times in critical driving scenarios, whereas no such effect was observed for audio warning signals alone. The result aligns with our hypothesis, which expects different speeds of motor responses for visual warnings compared to audio warnings.

3.2. Synergy Between Warning Signals and Seeing Objects of Interest

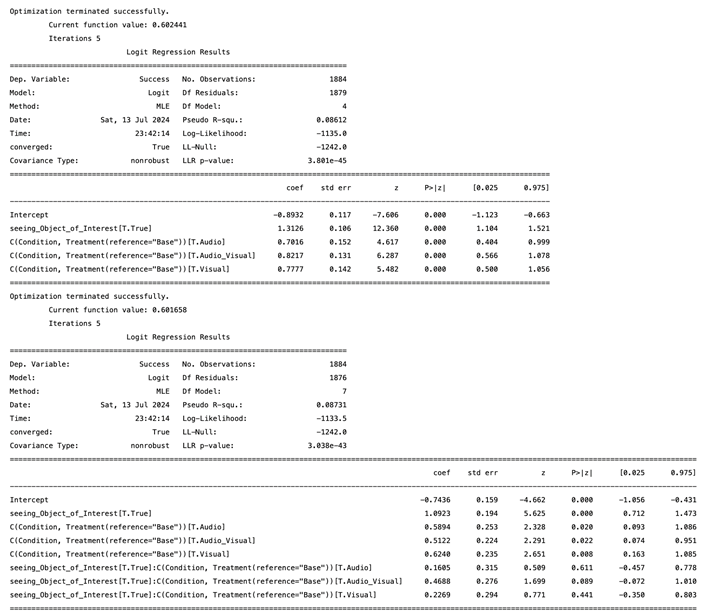
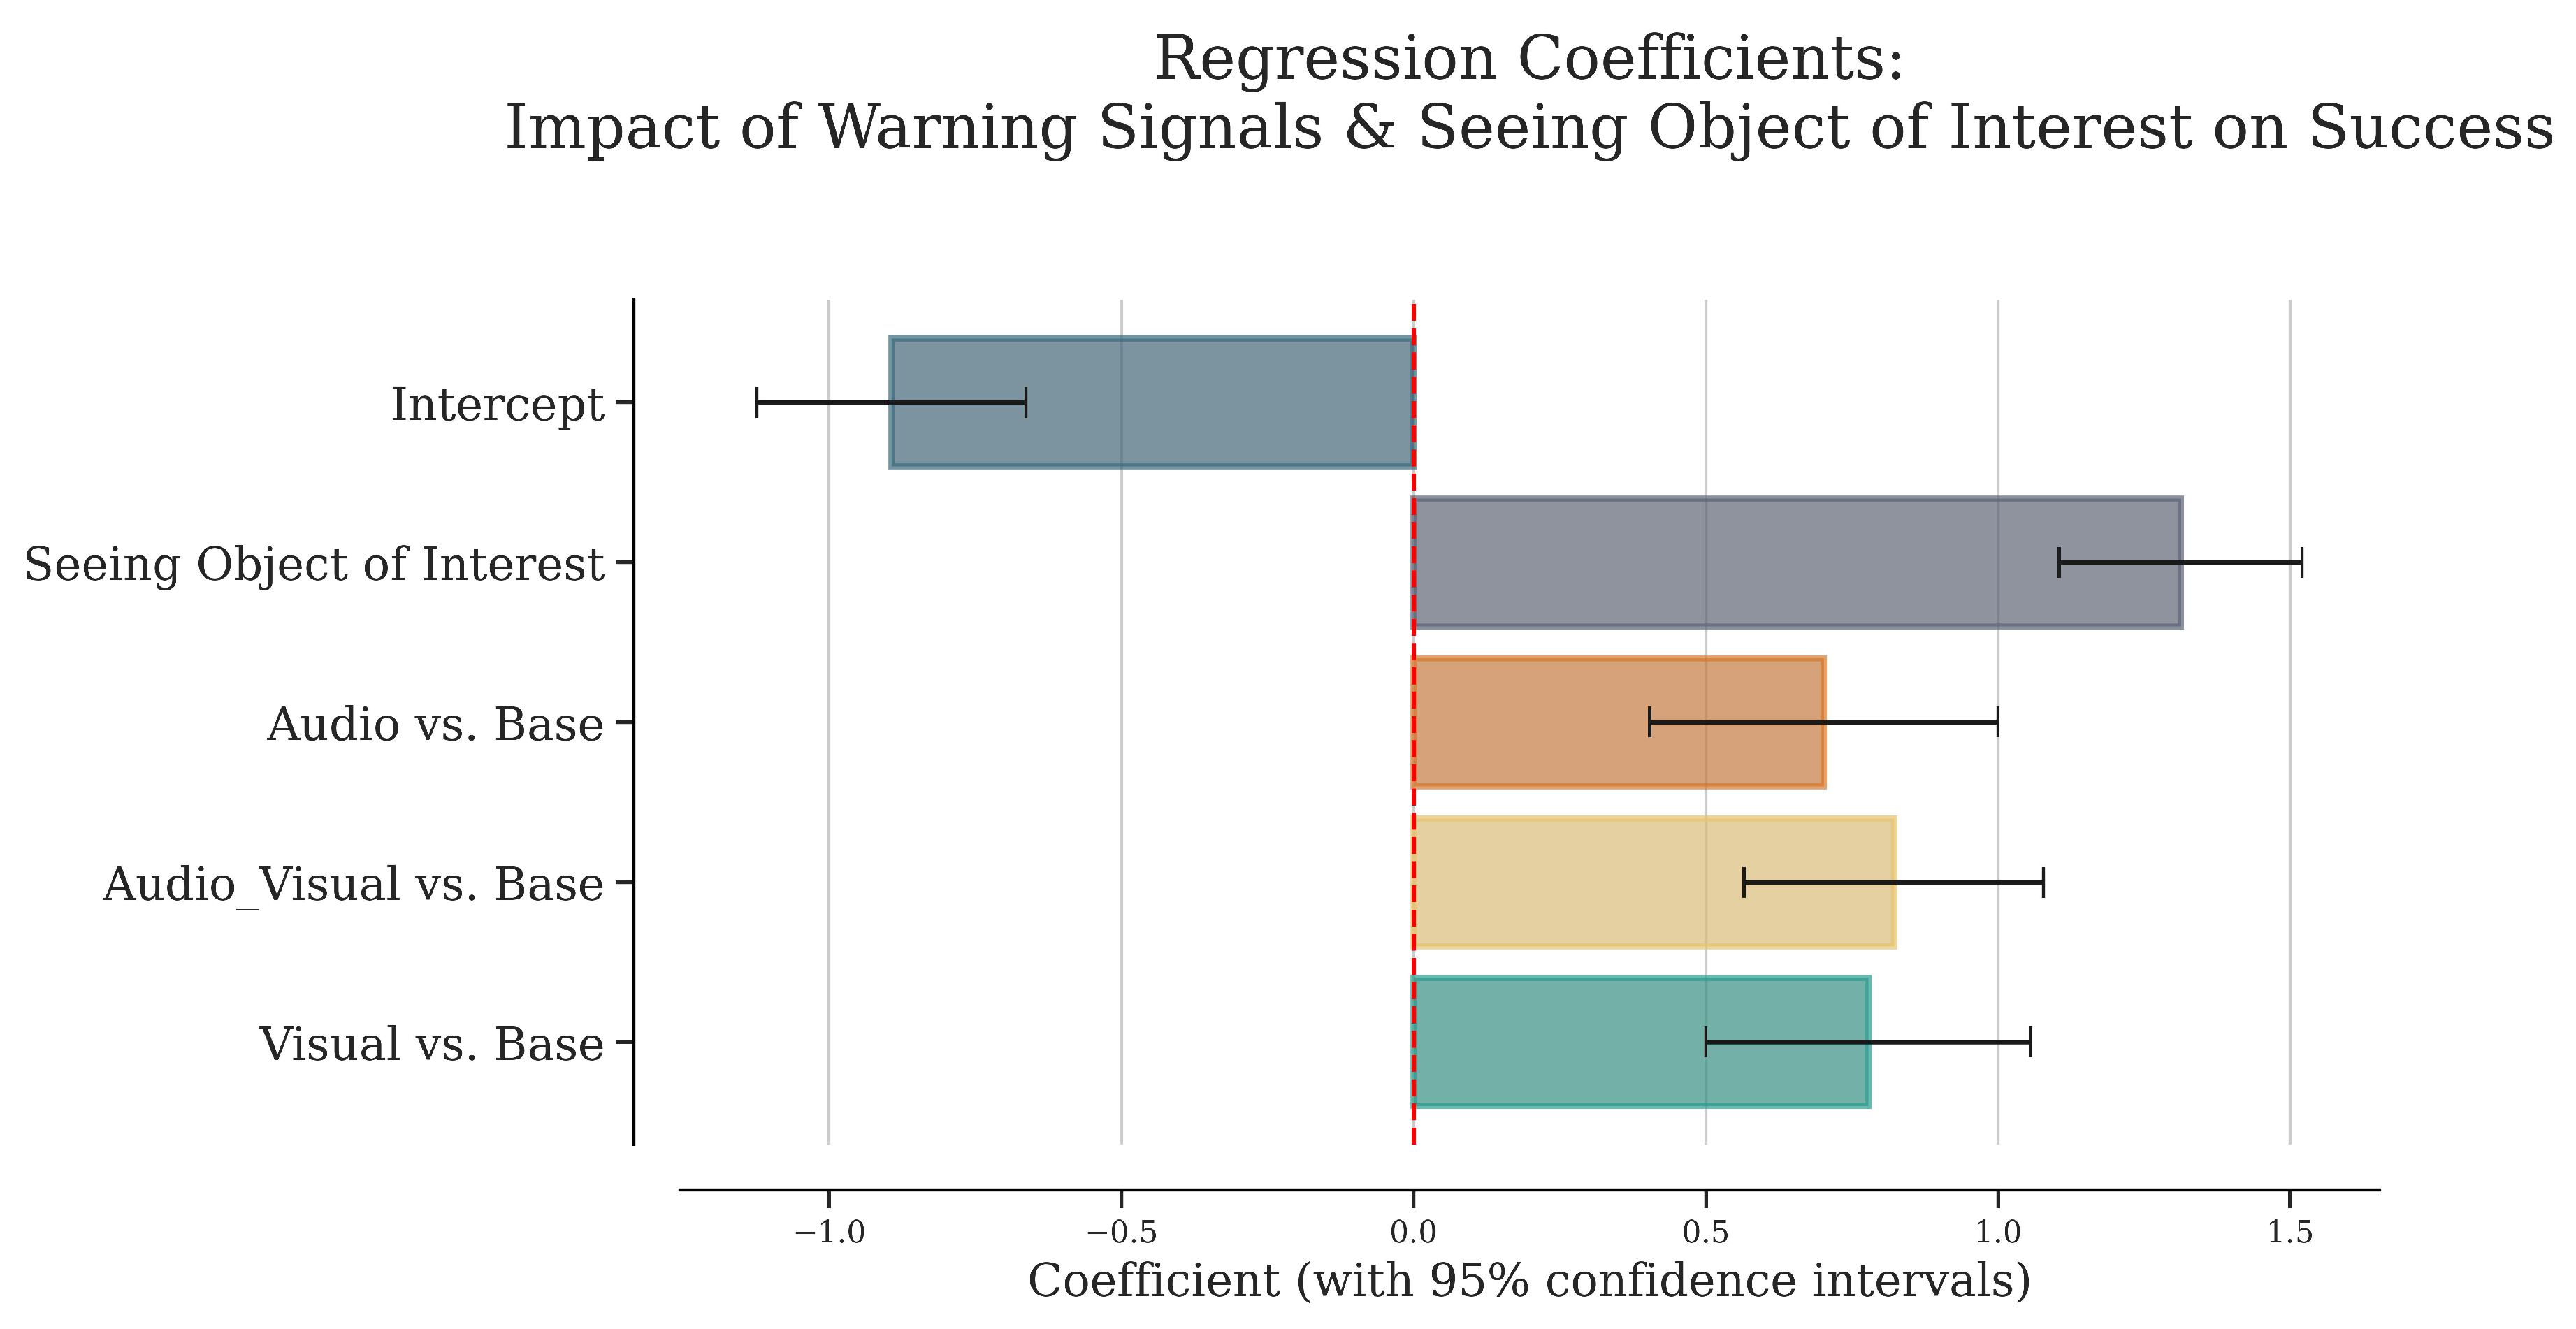
As a first step in investigating the impact of situational awareness, we test whether seeing or not seeing the object of interest influences successful maneuvering. A logistic regression analysis was conducted with the binary variable of seeing the object of interest and different types of warning signals—audio, visual, audio-visual, and the no-signal condition serving as the reference category—on the likelihood of successfully managing critical driving events. The base model, which included 1884 observations, revealed significant positive effects for seeing the object of interest ( β = 1.31 , SE = 0.11, z = 12.36 , p < . 001 ), audio warnings ( β = 0.70 , SE = 0.15, z = 4.62 , p < . 001 ), visual warnings ( β = 0.78 , SE = 0.14, z = 5.48 , p < . 001 ), and audio-visual warnings ( β = 0.82 , SE = 0.13, z = 6.29 , p < . 001 ) (Figure 6). The overall model was significant (LLR p < . 001 ), with a pseudo R 2 value of 0.086, indicating that both the presence of warning signals and the probability of seeing the object of interest significantly increase the likelihood of successfully managing critical driving events. An interaction model was also tested to explore the combined effects of seeing the object of interest and different types of warning signals. The interaction terms, however, were not significant (e.g., object_of_interest * Audio: β = 0.16 , SE = 0.32, z = 0.51 , p = 0.611 ), suggesting no synergistic benefit from the combination of seeing the object of interest and receiving specific types of warnings. The interaction model showed a slightly higher pseudo R 2 value of 0.087, and a log-likelihood of 1133.5 compared to the base model’s 1135.0 (for the full model result refer to Appendix B, Table A2). The audio-visual warnings had the strongest effect, followed by visual and audio warnings, indicating the particular effectiveness of combining audio and visual signals in increasing the probability of seeing objects of interest.

3.3. Dwell Time of Gaze Analysis

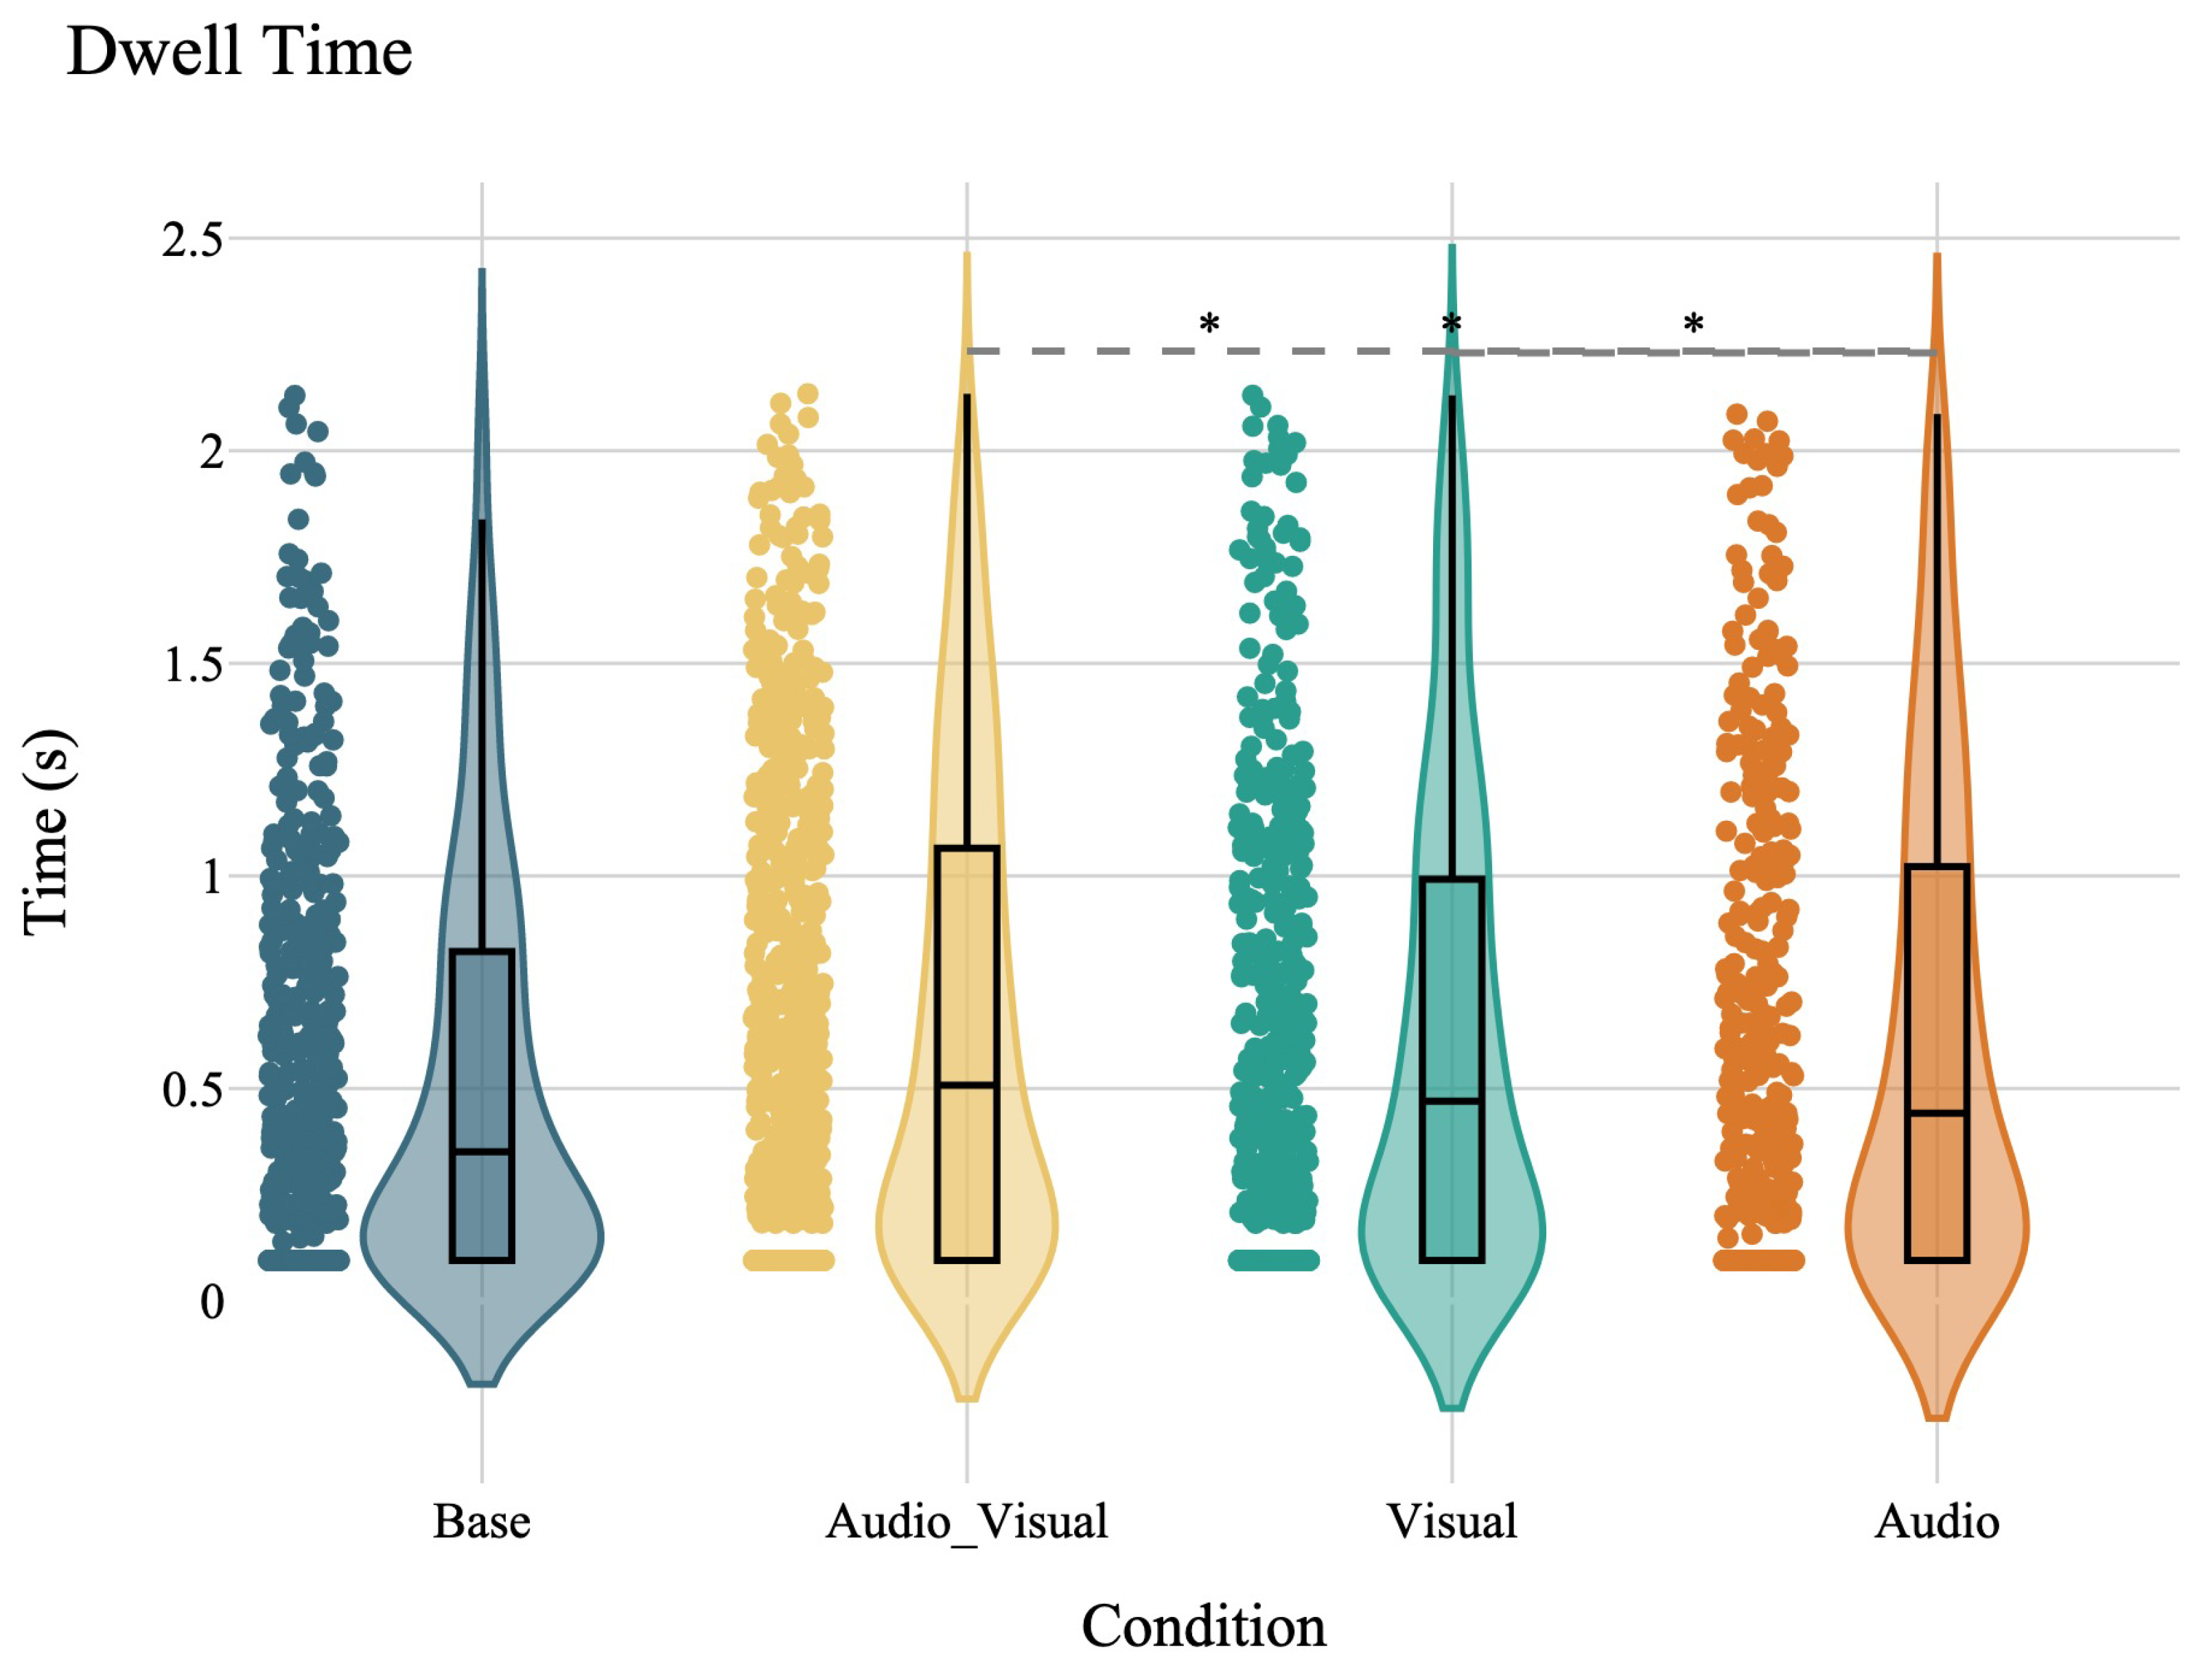
As the next step, we investigate whether the quantitative measure of the duration of gaze on the objects of interest provides more detailed information on situational awareness and the effect of warning signals. A Friedman test was conducted to compare the effects of the warning signals on total dwell time (log-transformed) across conditions. This test revealed a statistically significant difference in dwell times across the conditions, χ 2 ( 3 ) = 11.23 , p = . 011 . Follow-up Wilcoxon signed-rank tests indicated that all warning conditions (audio-visual: W = 92 , p = . 010 ; visual: W = 96 , p = . 014 ; audio: W = 106 , p = . 026 ) resulted in significantly greater total dwell times compared to the base condition, suggesting that any form of warning signal increases driver attention. However, no significant differences were found between the audio-visual and visual conditions ( W = 167 , p = . 425 ), audio-visual and audio conditions ( W = 162 , p = . 362 ), or visual and audio conditions ( W = 178 , p = . 582 ) (Figure 7). The results demonstrate that the effect of an audio warning signal on increasing driver dwell time was comparable to that of a visual warning signal when compared to no warning signal.

3.4. Identifying Success Factors in Critical Event Maneuvering

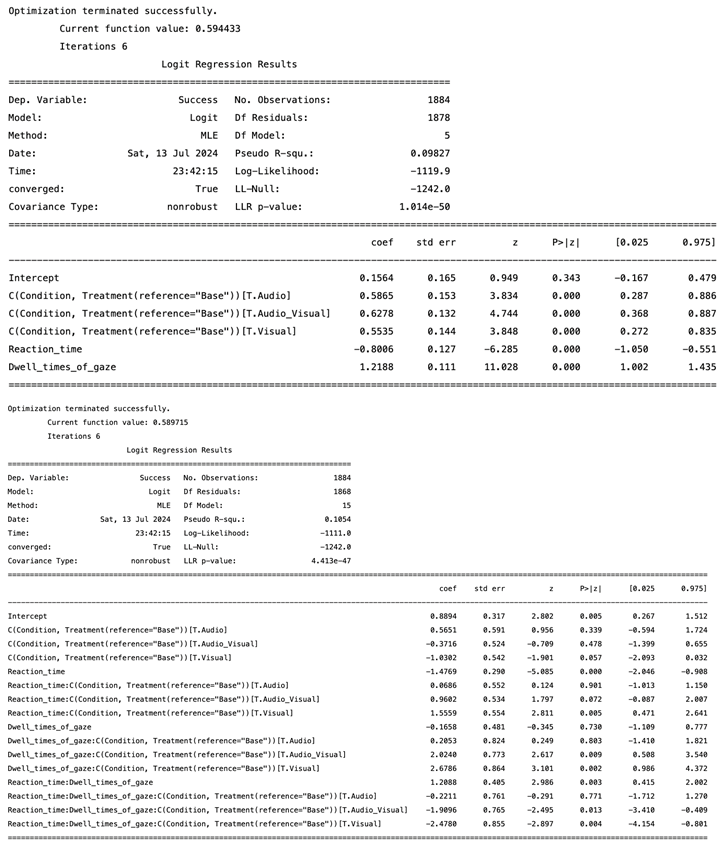
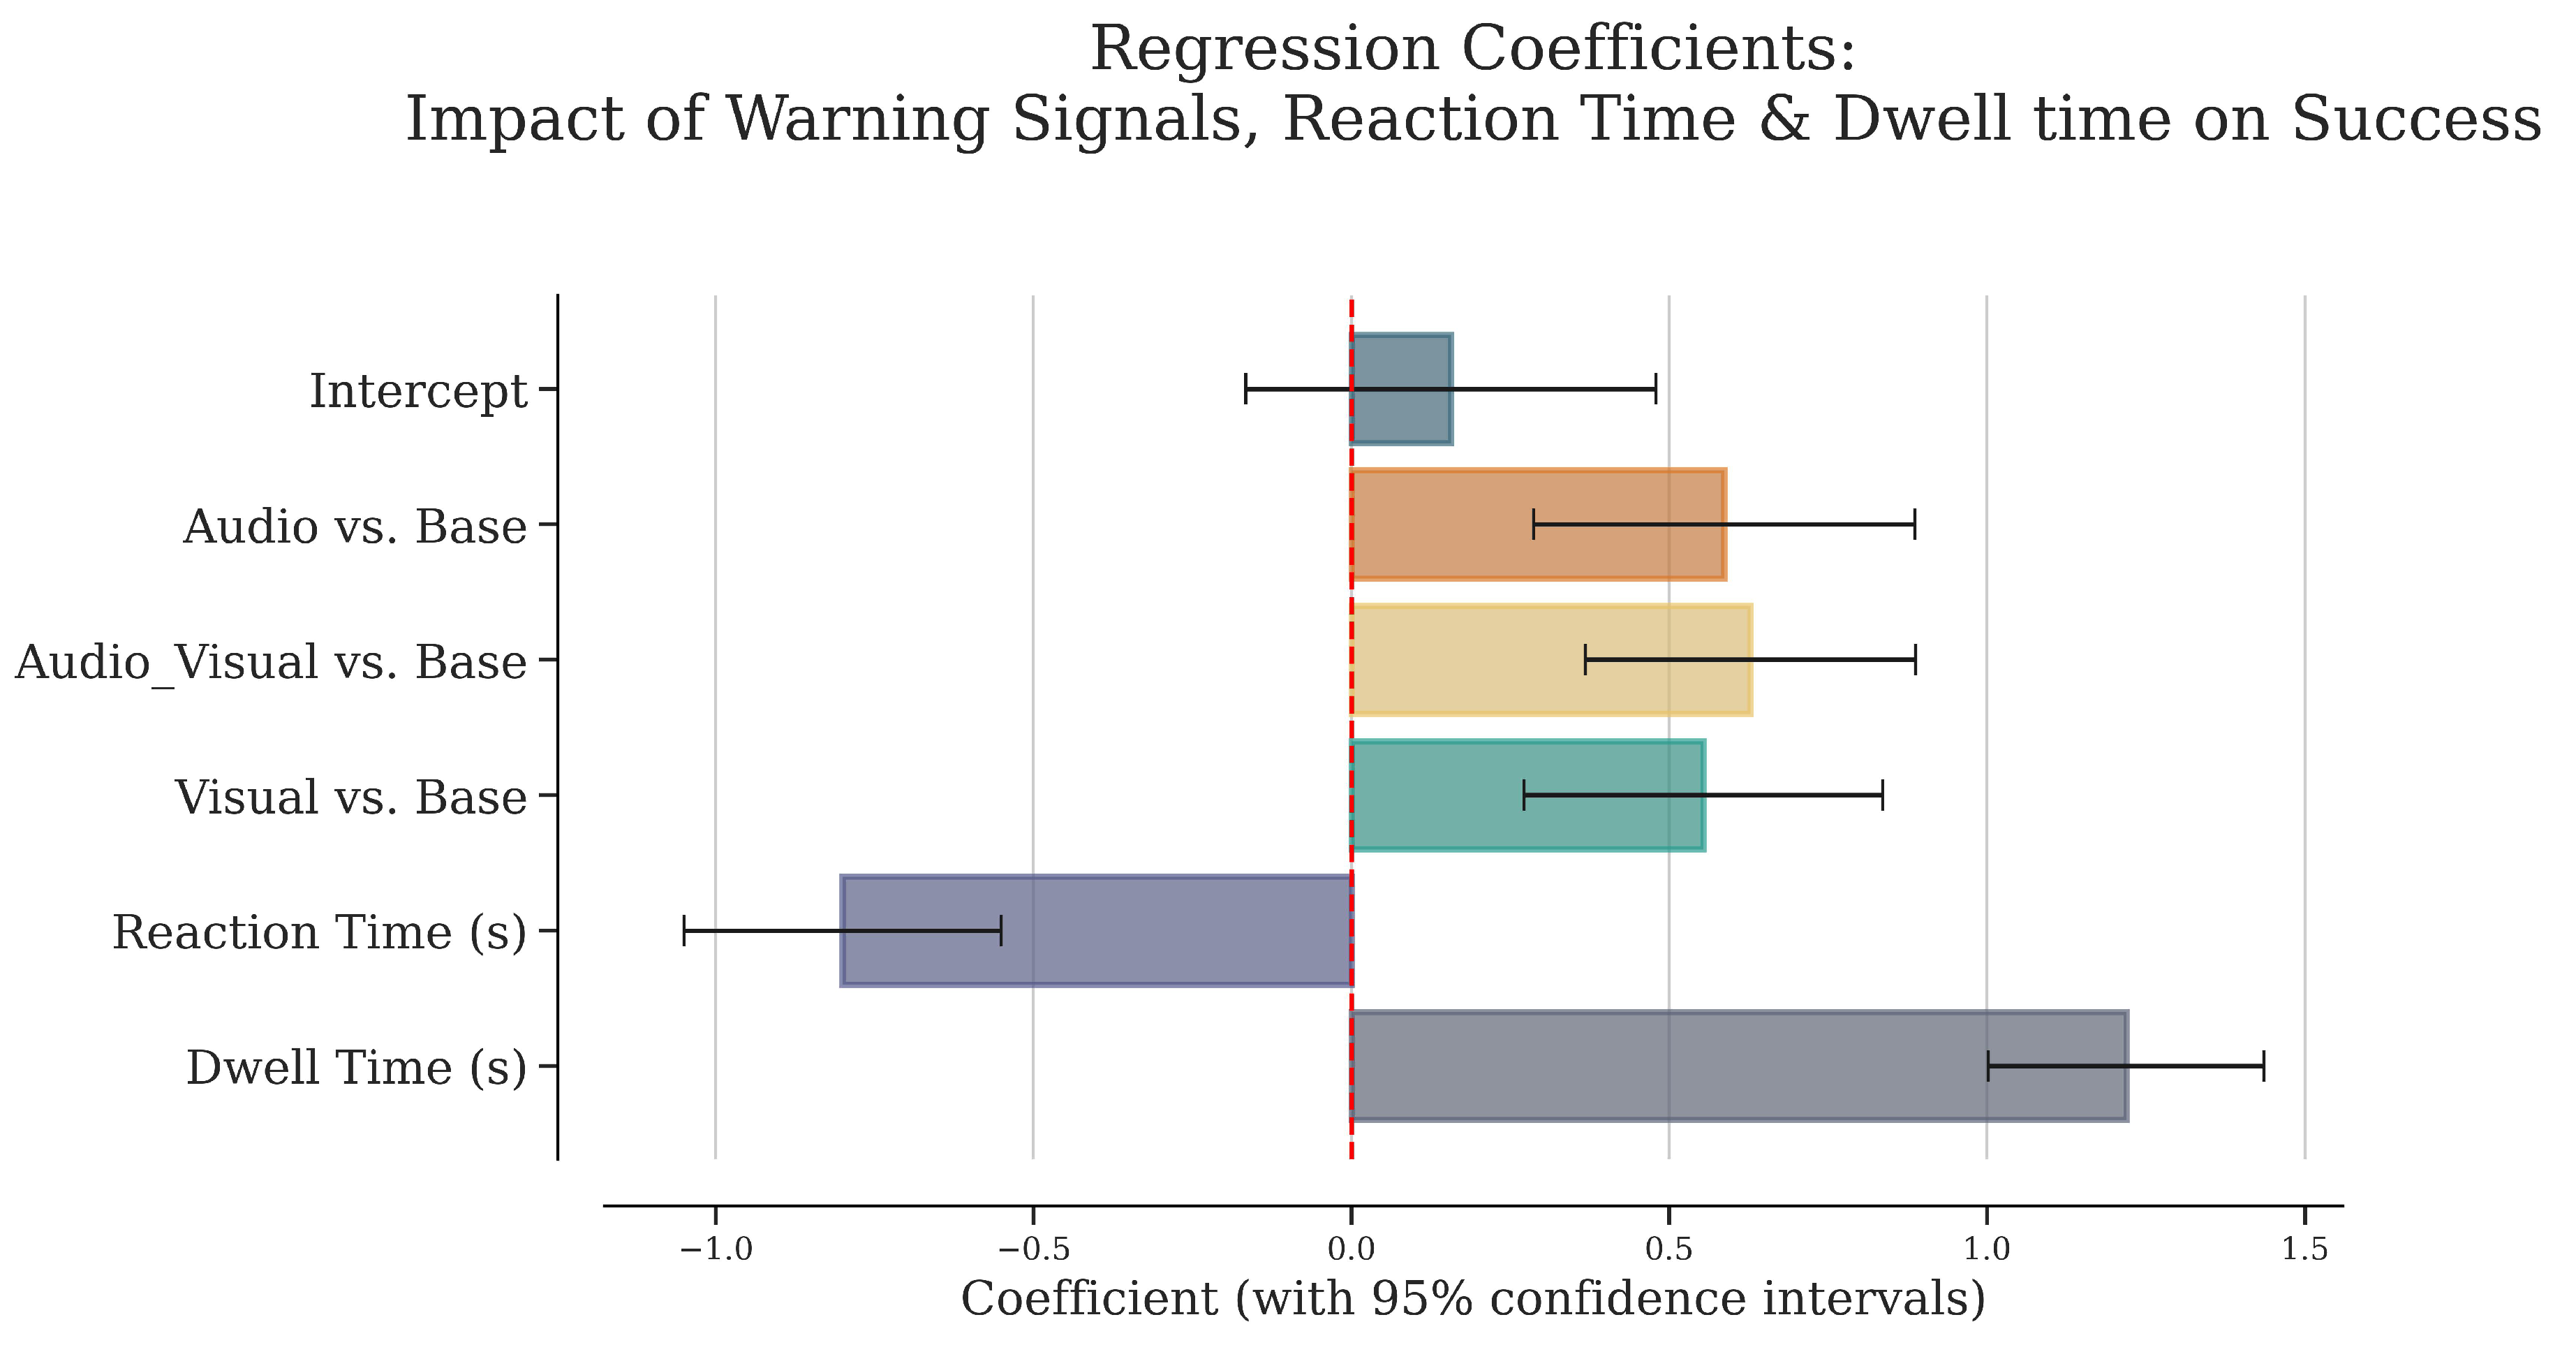
In the final stage of the analysis, we investigate the impact of warning signals on successful maneuvering, as well as incorporate additional variables—specifically reaction time and dwell time—to examine their combined influence on this success. The comparison of these models will allow us to discern the relative contributions of reaction time and dwell time, in conjunction with warning signals, to the overall success rates in managing critical driving scenarios. The base model included 1884 observations and showed a significant overall effect (LLR p = 1.014 × 10 50 ), with a pseudo R 2 of 0.098. The model demonstrated that the presence of an audio warning signal significantly increased the likelihood of success ( β = 0.59 , SE = 0.15, z = 3.83 , p < . 001 ), as did visual warnings ( β = 0.55 , SE = 0.14, z = 3.85 , p < . 001 ) and audio-visual warnings ( β = 0.63 , SE = 0.13, z = 4.74 , p < . 001 ). Longer reaction times were associated with a decrease in likelihood of success ( β = 0.80 , SE = 0.13, z = 6.29 , p < . 001 ), and greater total dwell time increased the likelihood of success ( β = 1.22 , SE = 0.11, z = 11.03 , p < . 001 ). The extended model which included 1884 observations incorporating interaction terms between reaction time, total dwell time, and warning signals was also significant (LLR p = 4.413 × 10 47 ), with a pseudo R 2 of 0.105. However, when interaction terms are included, the main effects of audio and visual signals are not significant anymore. Whereas, the interaction of reaction time and dwell time with the audio-visual condition and visual condition is significant. The model illustrated significant interactions between total dwell time and visual warning ( β = 2.68 , SE = 0.86, z = 3.10 , p = . 002 ), total dwell time and audio-visual warning ( β = 2.02 , SE = 0.77, z = 2.62 , p = . 009 ), and reaction time and visual warning ( β = 1.56 , SE = 0.55, z = 2.81 , p = . 005 ). It can be interpreted that the positive effect of shorter reaction times on increasing success is enhanced by the presence of visual signals (comparing β = 0.80 with β = 1.56 ). Similarly, the positive coefficient between longer dwell time and success, enhanced in visual (comparing β = 1.22 with β = 2.68 ) and audio-visual (comparing β = 1.22 with β = 2.02 ) signals. In addition, the interaction between reaction time and total dwell time was significant ( β = 1.21 , SE = 0.41, z = 2.99 , p = . 003 ) suggesting that the combined effect of quick reactions and increased awareness (dwell time) improves success (Figure 8) (for the full model result, refer to Appendix B, Table A3). Overall, this finding aligns with our hypothesis, suggesting that all types of warning signals significantly enhance the likelihood of successfully managing critical driving events compared to no warning, with audio-visual signals being the most effective. However, simply reacting quickly is not enough; maintaining situational awareness is critical. Additionally, the presence of visual signals enhances reaction time performance, indicating that visual signals help drivers process and react to critical events more effectively. Furthermore, the increase in successful maneuvering is associated with higher situational awareness, particularly with visual and audio-visual signals. In summary, our findings confirm that while all types of warning signals improve the management of critical driving events, visual and audio-visual signals notably enhance both reaction times and situational awareness, highlighting the crucial role of maintaining visual engagement in ensuring driving safety.

3.5. Questionnaire Analysis

To examine the impact of different types of warning signals on reducing anxiety and increasing trust in AVs, we asked participants to score relevant six items from the Autonomous Vehicle Acceptance Model questionnaire. Additionally, to compare the objective use of the body and subjective ratings of such use while using the experimental car, we included three additional items from the questions regarding the importance of using eyes, hands, and feet (for the respective items refer to Appendix A, Table A1). Since we used a subset of the original questionnaire, we began with an exploratory factor analysis. The analysis identified two primary factors based on the eigenvalues, percentage of variance explained, and cumulative percentage. Factor 1 has an eigenvalue of 3.42 and accounts for 38.01% of the variance, while Factor 2 has an eigenvalue of 1.60, explaining 17.83% of the variance. Together, these two factors cumulatively account for 56.09% of the variance in responses, indicating that they capture a substantial portion of the overall variability in the data. Factor one includes six items related to anxiety and perceived safety, while factor two is primarily associated with items related to methods of control (Table 1). The factor scores were computed by summing the products of each item’s score and its respective factor loading. Both positive and negative loadings were considered when calculating the scores for each factor. Therefore, six items related to perceived safety and anxiety were combined into a single "Anxiety_Trust" measure. Due to the distinct characteristics of the methods of control questions, they were retained as three separate items. The results of the exploratory factor analysis demonstrated that the selected items for anxiety and trust, as well as methods of control, constitute a valid subset for measuring these values in the context of AVs usage.
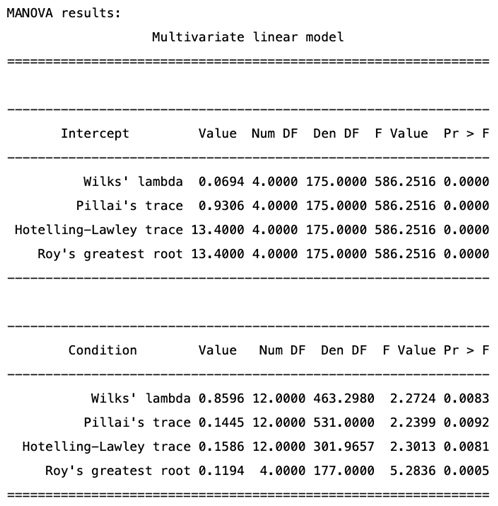
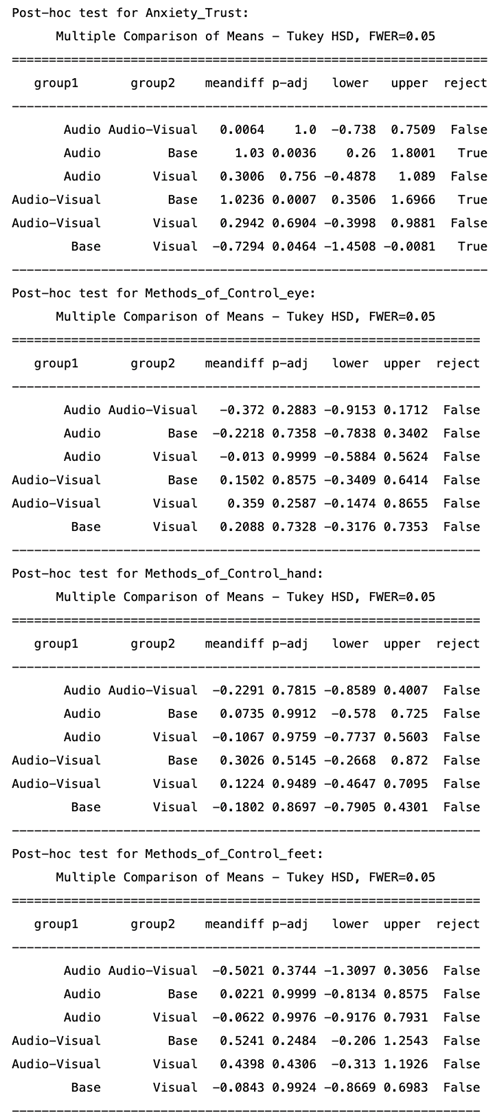
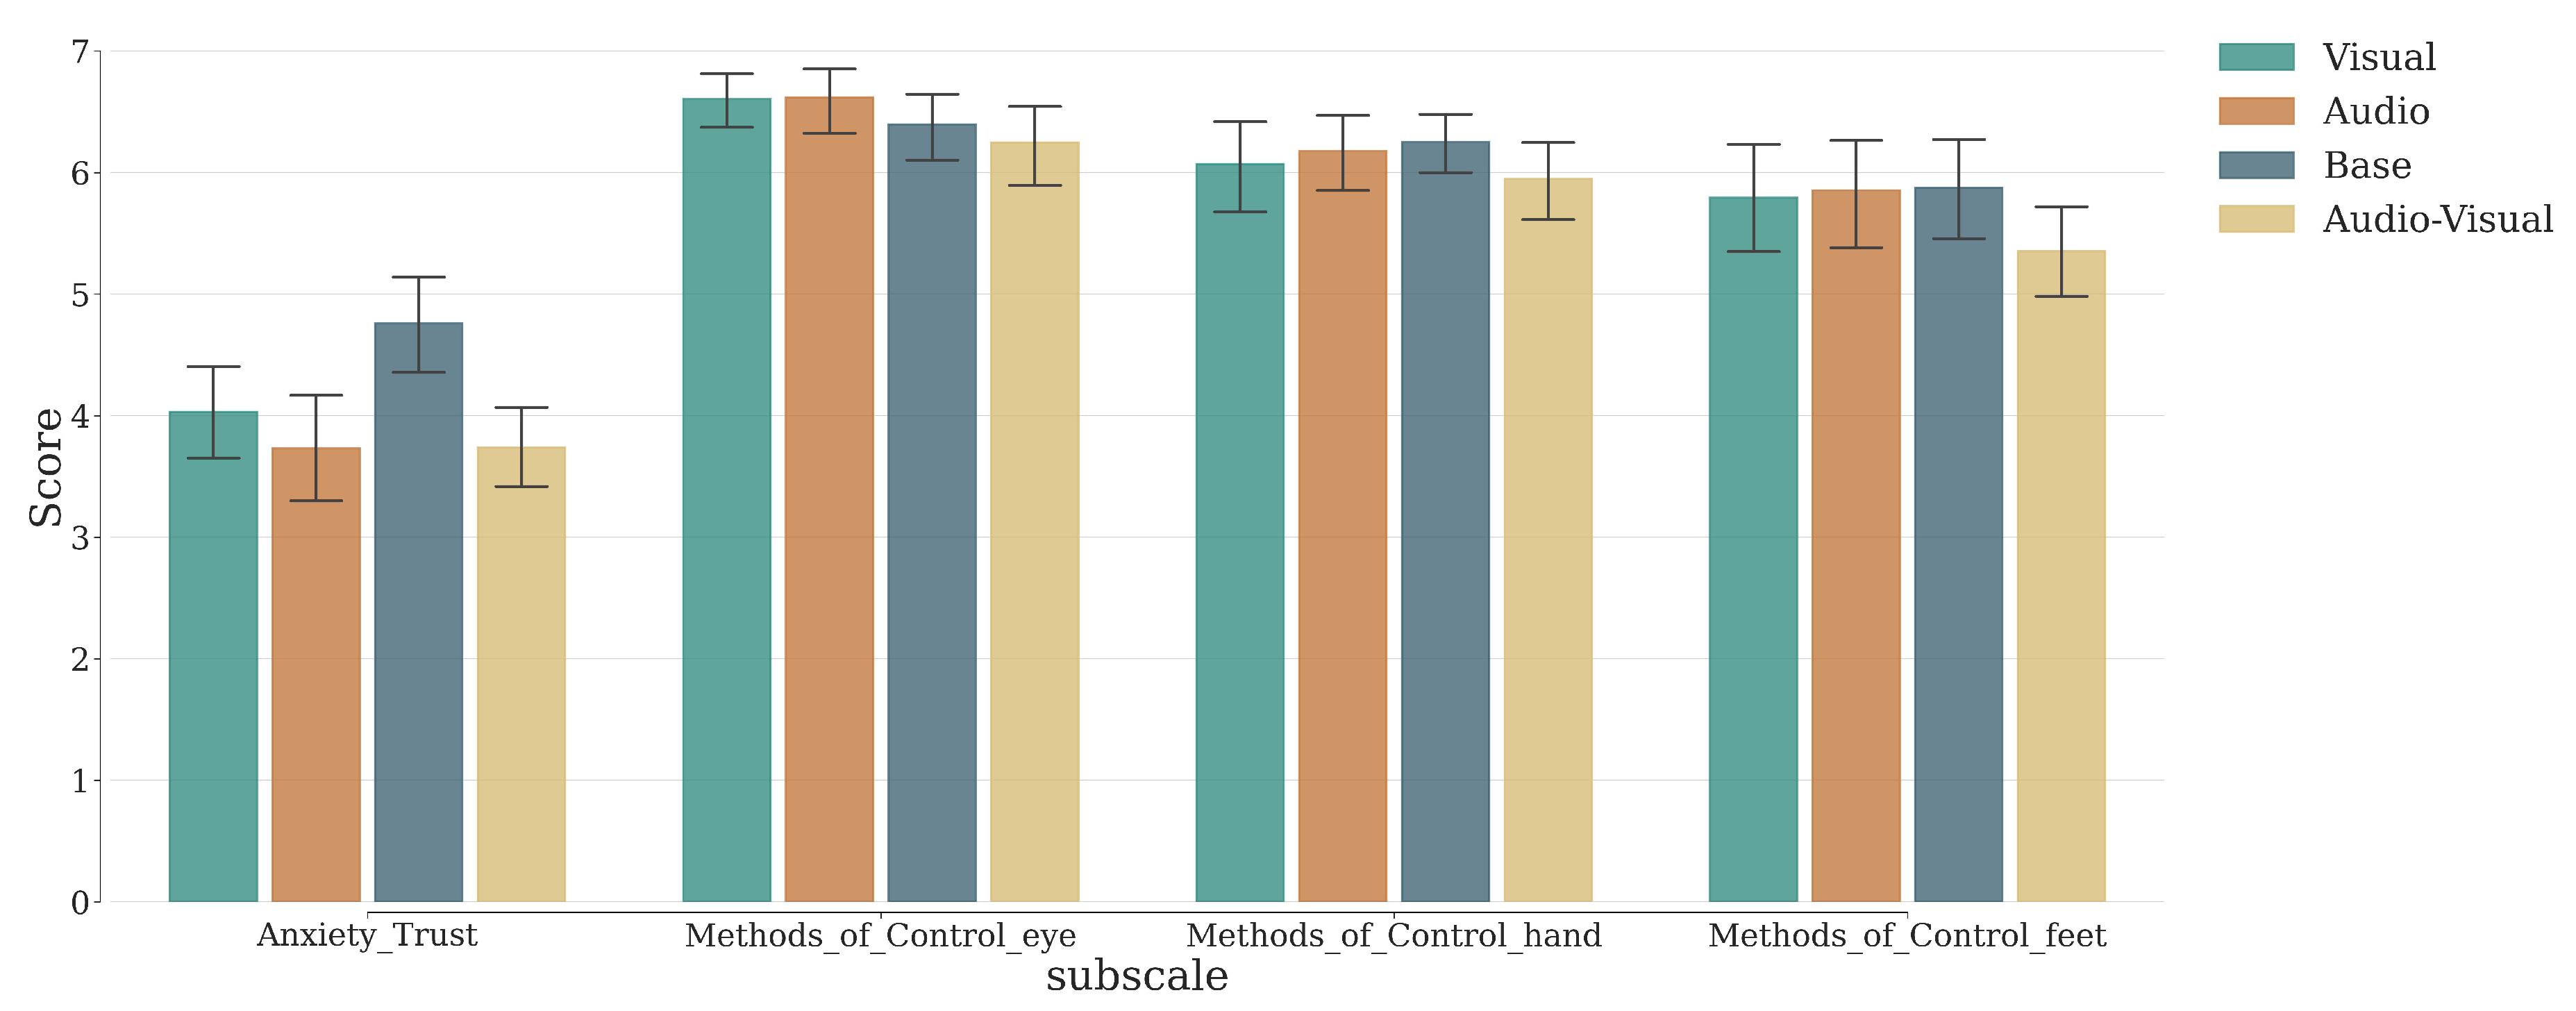
To investigate the effect of the warning signal on relevant acceptance scores, we conducted a Multivariate Analysis of Variance (MANOVA). This analysis aimed to examine the differences in the mean vector of the multiple dependent variables (Anxiety_Trust and the three methods of control scores) across the various levels of the independent variable (four Conditions). The analysis showed significant effects of the conditions on the acceptance of autonomous driving. The multivariate tests for the intercept showed significant effects across all test statistics: Wilks’ Lambda, Λ = 0.0694 , F ( 4 , 175 ) = 586.25 , p < . 0001 ; Pillai’s Trace, V = 0.9306 , F ( 4 , 175 ) = 586.25 , p < . 0001 ; Hotelling-Lawley Trace, T 2 = 13.40 , F ( 4 , 175 ) = 586.25 , p < . 0001 ; and Roy’s Greatest Root, Θ = 13.40 , F ( 4 , 175 ) = 586.25 , p < . 0001 . These results confirm the robustness of the model. Additionally, the multivariate tests for the condition variable indicated significant effects: Wilks’ Lambda, Λ = 0.8596 , F ( 12 , 463.29 ) = 2.27 , p = . 0083 ; Pillai’s Trace, V = 0.1445 , F ( 12 , 531 ) = 2.23 , p = . 0092 ; Hotelling-Lawley Trace, T 2 = 0.1586 , F ( 12 , 301.96 ) = 2.30 , p = . 0081 ; and Roy’s Greatest Root, Θ = 0.1194 , F ( 4 , 177 ) = 5.28 , p = . 0005 . These findings suggest that the different conditions significantly affect the Anxiety_trust measure of autonomous driving, as indicated by Wilks’ Lambda. Post-hoc analyses using Tukey’s HSD test revealed significant differences among the experimental conditions for the Anxiety_Trust variable. Specifically, there was a significant difference between the audio and base conditions (mean difference = 1.03 , p = . 003 ), and between the base and audio_visual conditions (mean difference = 1.02 , p < . 001 ), and between the base and visual conditions (mean difference = 0.72 , p = . 046 ). No other pairwise comparisons for Anxiety_Trust were significant ( p > . 05 ) (for the full result refer to Appendix C, Table A4 and Table A5). For the Methods_of_Control_eye, Methods_of_Control_hand, and Methods_of_Control_feet variables, the post-hoc tests indicated no significant differences between any of the experimental conditions (all p > . 05 ) (Figure 9). These results suggest that all types of warning signals specifically decrease anxiety and increase trust but do not impact the choice of control methods.

3.5.1. Questionnaire and Behavioral Data Comparison

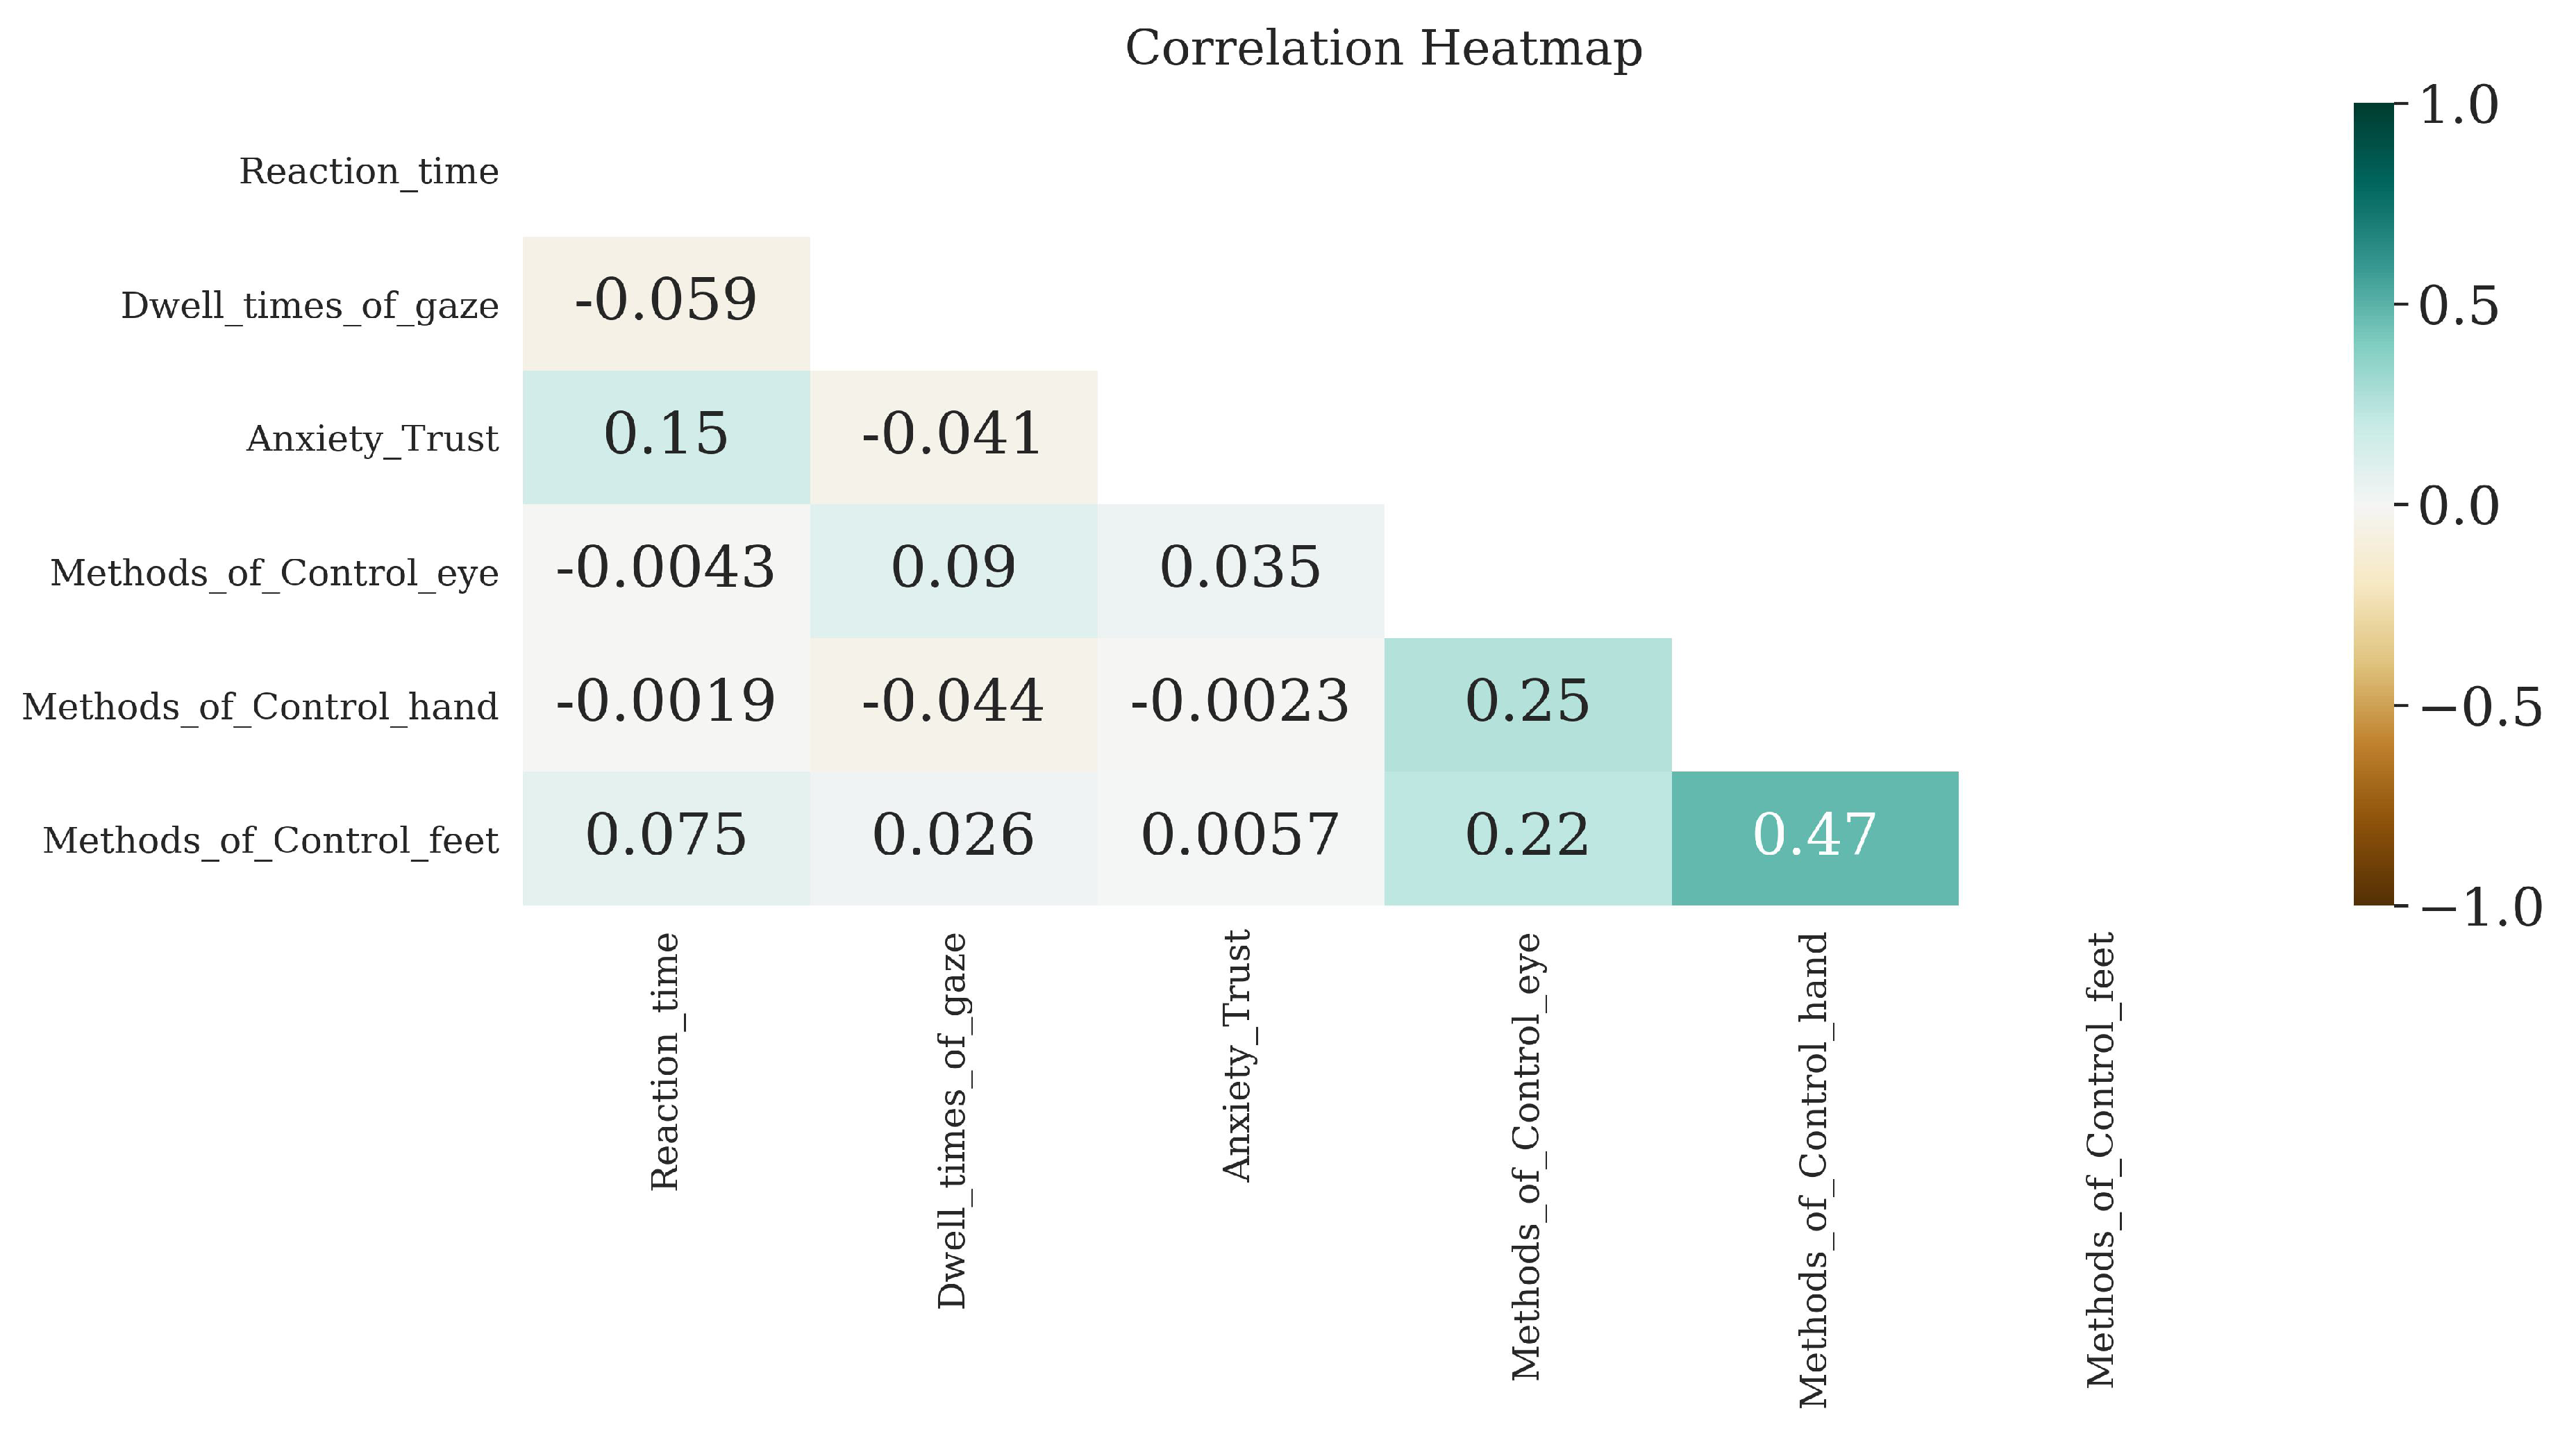
In the last stage of the analysis, we aimed to determine the extent to which self-reported measures, such as anxiety, trust, and preferred methods of control, correlate with participants’ objective behavior during the experiment. To investigate this, we conducted a Spearman’s rank-order correlation to assess the relationship between reaction time and dwell time with questionnaire scales from factor analysis. The correlation between reaction time and Anxiety_Trust factor was found to be non-significant, r s = 0.12 , p = 0.12 . Similarly, the correlations between reaction time and Methods_of_Control_eye ( r s = 0.00 , p = 1.00 ), Methods_of_Control_hand ( r s = 0.02 , p = 0.78 ), and Methods_of_Control_feet ( r s = 0.07 , p = 0.40 ) were also non-significant, indicating no meaningful relationships between reaction time and these variables. A similar series of Spearman’s rank analyses was conducted for dwell time which also showed no significant correlation with the questionnaire measures (Figure 10). Overall, these findings reveal that, in the context of semi-autonomous studies, self-reported measures of acceptance do not reliably correlate with users’ actual behavior while driving.

4. Discussion

The aim of this experiment was to investigate the effect of unimodal and multimodal warning signals on reaction time and situational awareness during the take-over process by collecting visual metrics, motor behavior, and subjective scores in a VR environment. The results demonstrated distinct effects of audio and visual warning signals during the take-over control process. The visual warning signal effectively reduced reaction time and increased dwell time on the object of interest, indicating enhanced situational awareness. In contrast, the audio warning signal increased situational awareness but did not affect reaction time. The multimodal (audio-visual) signal did not exceed the effectiveness of the visual signal alone, suggesting its impact is primarily due to the visual component rather than the audio. Additionally, the positive impact of both unimodal and multimodal signals on successful maneuvering during critical events demonstrates the complex moderating role of these modalities in decreasing reaction time and increasing situational awareness. The results indicate that when visual warnings are present, the negative effect of longer reaction time on success is lessened. In other words, visual warnings, by providing more robust cues, help mitigate the adverse impact of longer reaction time during take-over. Furthermore, the impact of dwell time on success is moderated by the presence of visual or audio-visual warning signals, possibly because the warnings offer sufficient information or cues, reducing the necessity for additional dwell time for success maneuvering. Finally, the positive impact of providing unimodal and multimodal warning signals on reducing anxiety and enhancing trust has been confirmed. In conclusion, various signal modalities impact reaction time and situational awareness differently, thereby influencing the take-over process, while their effect on anxiety and trust components is evident but independent of situational awareness and reaction time.
Despite conducting our experiment in a realistic VR environment, this study has some limitations. Although past studies have suggested that it is important to lower the frequency of critical events [41], here we used 12 critical events in succession. However, the continuous driving session designed in this study was relatively long-lasting in order to compensate for this. Another issue is being in a VR environment for a prolonged period of time can induce motion sickness [63], which can negatively influence the participant’s experience. Yet, the wooden car was designed to provide a higher feeling of immersion to mitigate these side effects. For this research study, we used specific types of warning signals, the audio signal was speech-based rather than a generic tone and the visual signal was sign-based with potential hazards highlighted. Given this design, our findings may not be directly comparable with other studies in which different types of signals were used [64,65]. Regarding the reaction time calculation, we used a particular approach in which three different types of reactions (steering, braking or acceleration) were accounted for. In contrast, most studies usually consider only one type of reaction or a combination of them when calculating reaction time [66]. Similarly, when calculating dwell time of gaze, we had accounted for the entire event duration rather than the duration until the first gaze or actual response [35,38,67]. Thus, for reproducibility of the results, the aforementioned limitations should be considered. Despite these limitations, reaction time and situational awareness are commonly used metrics for evaluating warning signals on take-over processes in AVs [37], and the immersive VR environment enabled a way to assess ecologically valid driver responses over a large and diverse population sample [49,50,68].
The take-over process consists of several cognitive and motor stages, from becoming aware of a potential threat to the actual behavior leading to complete take-over [17,21,69]. This procedure is influenced by various factors, and the effect of signal modality can be examined at each stage. Broadly, this procedure can be divided into two main phases, initial and latter, that overlap with situational awareness and reaction time respectively. In the initial stage of the take-over process, stimuli such as warning signals alert the driver about the critical situation. The driver perceives this message and cognitively processes the transferred information [17,22]. Endsley’s perception and comprehension components of situational awareness align with the initial stages of perceiving and cognitively processing information during the early stage of the take-over process [23,70]. Despite the differences between auditory and visual signals [24,71], the current study aligns with previous findings demonstrating the ability of unimodal and multimodal signals to enhance situational awareness [18]. Thereby fostering the initial stage of the reaction time. While situational awareness defines the early stages of cognitive and motor processes during take-over, reaction time establishes the latter stages.
Following the initial, the subsequent stage involves decision-making and selecting an appropriate response, which is heavily dependent on previous driving experience. Thereafter, the driver’s motor actions are calibrated and transitioned to a ready phase, involving potential adjustments to the steering wheel or pedals. The process culminates with the execution of the reaction required to manage a critical situation [17,22]. According to the definition of reaction time, it passed through two steps of comprehension and movement [29]. Comprehension reaction time overlaps with the concept of situational awareness, while movement reaction time refers more to the latter stages of the take-over process, including calibration and actual motor action. Our calculation of reaction time focused on measuring the actual hand or feet movements from the start of a critical event (including driver calibration) to the movement reaction time. Our findings confirm that both visual and audio-visual signals reduce reaction time to the same extent. The audio modality however was not able to extend its effect to the reaction time phases. Despite the fact that the multimodal signal (audio-visual) helps decrease reaction time, it was not a significant moderator of reaction time in ensuring success. This is explainable when considering the late stages of the take-over process. Before movement calibration and actual action, there is a decision-making stage where visual warning signals are crucial [17,22]. A fundamental characteristic of visual warning signals encompasses the type of information they convey [31]. Indeed, visual warnings can provide additional information in comparison to auditory signals, including spatial information (e.g., depth and speed) and distractor information (e.g., type, kind) [24,31,72]. This complex information enhances decision-making on the more appropriate type of reaction for the situation, compensating for the faster effect of auditory signals. While audio signals impact the early stages of take-over, visual signals provide valuable information that assists in the process.
Enhancing user experience is a critical aspect in the development and adoption of AV technology [36]. Therefore, the ways users subjectively perceive each aspect of the technology should be developed alongside technical advancements. Our experiment showed that all types of signal modalities could create a calmer and trustworthy experience for the driver of an AV. However, we were unable to connect this finding to the cognitive process drivers undergo during the take-over. Further studies should delve deeper into extending subjective measurements to encompass cognitive and behavioral processes that arise during the drive.

5. Conclusions

In conclusion, this study highlights the importance of considering different signal modalities impact on human cognitive processing. A thorough understanding of their characteristics, benefits, and roles can aid in designing HMIs that are compatible with drivers’ perceptual and behavioral reactions during TORs. This human-cognition-inspired design recognizes drivers’ cognitive capabilities and limitations, facilitating driver-vehicle cooperation and intention recognition. Such design enhances safety and trust in AVs. Overall, these considerations are essential for creating a framework to address the challenge of integrating AVs into future transportation systems.

Author Contributions

Conceptualization, A.H., S.D., and J.M.C.; methodology, A.H., S.D., and J.M.C.; software, A.H., S.D., J.M.C., F.N.N. and M.A.W.; validation, A.H., S.D., J.M.C., F.N.N. and M.A.W.; formal analysis, S.D; investigation, F.N.N., M.A.W.; resources, F.N.N., M.A.W.; data curation, A.H., J.M.C.; writing – original draft preparation, S.D., A.H. and J.M.C.; writing – review and editing, A.H., S.D. and J.M.C.; visualization, S.D. and J.M.C; supervision, G.P. and P.K.; project administration, S.D., F.N.N. and M.A.W.; funding acquisition, G.P. and P.K. All authors have read and agreed to the published version of the manuscript.

Funding

This work was supported by the University of Osnabrück in cooperation with the German Research Foundation DFG, which supported this project in the context of funding the Research Training Group “Situated Cognition” under Grant GRK 2185/1 and GRK 2185/2 in part by the Deutsche Forschungsgemeinschaft (DFG, German Research Foundation) - GRK 2340. This project was also supported by DFG in the context of funding the Research Training Group “Computational Cognition” under number 456666331.

Institutional Review Board Statement

The study was conducted in accordance with the Declaration of Helsinki, and approved by the Institutional Ethics Committee of the University of Osnabrück.

Informed Consent Statement

Informed consent was obtained from all subjects involved in the study.

Data Availability Statement

The code for the entire LoopAR experiment is accessible on the GitHub repository at https://github.com/Westdrive-Workgroup/LoopAR-public. It is released under a Creative Commons license. As for the paid assets used in the experiment, the current version featured in this article can be obtained upon request from the corresponding author. Data and the code manuscripts are also available on the OSF platform under a Creative Commons license https://osf.io/hmu96/, DOI: 10.17605/OSF.IO/HMU96.

Acknowledgments

The authors would like to thank the Unity development team from the Neurobiopsychology and Neuroinformatics departments at the University of Osnabrück for their invaluable contributions to the LoopAR project. We extend special gratitude to Linus Tiemann, Nora Maleki, Johannes Maximilian Pingel, Philipp Spaniol, Frederik Nienhaus, Anke Haas, Lynn Keller, and Lea Kühne for their dedicated efforts. Additionally, we acknowledge Marc Vidal de Palol for his expertise in managing the questionnaire and server infrastructure. The success of this project was made possible by the significant roles played by these individuals.

Conflicts of Interest

The authors declare that the research was conducted in the absence of any commercial or financial relationship that could be construed as a potential conflict of interest.

Abbreviations

The following abbreviations are used in this manuscript:
AVs Autonomous Vehicles
VR Virtual Reality
HMIs Human-Machine Interfaces
HMD Head Mounted Display
SAE Society of Automotive Engineers
NDRTs Non-Driving-related Tasks
TORs Take-over Requests
ANOVA Analysis of Variance
MANOVA Multivariate Analysis of Variance
AVAM Autonomous Vehicle Acceptance Model

Appendix A Questionnaire Subset

Table A1. Subset of the Autonomous Vehicle Acceptance Model (AVAM) questionnaire. It includes 6 of the 26 items regarding anxiety and trust and 3 items about the importance of methods of physical control (Heitz et al., 2019).
Question text
Anxiety
19. I would have concerns about using the vehicle.
20. The vehicle could do something frightening to me.
21. I am afraid that I would not understand the vehicle.
Perceived Safety
24. I believe that using the vehicle would be dangerous.
25. I would feel safe while using the vehicle.
26. I would trust the vehicle.
Methods of Control: How important would each of the following be when using the vehicle?
1. Hands
2. Feet
3. Eyes

Appendix B Logistic Regressions Complete Tables

Table A2. Synergy between warning signals and seeing objects of interest.
Preprints 113273 i001
Table A3. Identifying Success Factors in Critical Event Maneuvering.
Preprints 113273 i002

Appendix C Questionnaire Analysis (MANOVA/post-hoc)

Table A4. MANOVA Results.
Preprints 113273 i003
Table A5. Post-hoc tests Results.
Preprints 113273 i004

References

  1. Bazilinskyy, P.; Sakuma, T.; de Winter, J. What driving style makes pedestrians think a passing vehicle is driving automatically? Applied ergonomics 2021, 95, 103428. [Google Scholar] [CrossRef]
  2. Sourelli, A.M.; Welsh, R.; Thomas, P. User preferences, driving context or manoeuvre characteristics? Exploring parameters affecting the acceptability of automated overtaking. Applied ergonomics 2023, 109, 103959. [Google Scholar] [CrossRef]
  3. Zhang, Y.; Ma, Q.; Qu, J.; Zhou, R. Effects of driving style on takeover performance during automated driving: Under the influence of warning system factors. Applied Ergonomics 2024, 117, 104229. [Google Scholar] [CrossRef] [PubMed]
  4. Zhang, Y.; Zhou, X.; Wang, W.; Hu, Y.; Sun, X. Keeping in the lane! Investigating drivers’ performance handling silent vs. alerted lateral control failures in monotonous partially automated driving. International Journal of Industrial Ergonomics 2023, 95, 103429. [Google Scholar] [CrossRef]
  5. "Taxonomy and definitions for terms related to driving automation systems for on-road motor vehicles". SAE International, 2021. Available online: https://www.sae.org/standards/content/j3016_202104/.
  6. Rödel, C.; Stadler, S.; Meschtscherjakov, A.; Tscheligi, M. Towards autonomous cars: The effect of autonomy levels on acceptance and user experience. Proceedings of the 6th international conference on automotive user interfaces and interactive vehicular applications, 2014, pp. 1–8. [CrossRef]
  7. Sentouh, C.; Nguyen, A.T.; Benloucif, M.A.; Popieul, J.C. Driver-automation cooperation oriented approach for shared control of lane keeping assist systems. IEEE Transactions on Control Systems Technology 2019, 27, 1962–1978. [Google Scholar] [CrossRef]
  8. Derakhshan, S.; Nosrat Nezami, F.; Wächter, M.A.; Stephan, A.; Pipa, G.; König, P. A Situated Inspection of Autonomous Vehicle Acceptance–A Population Study in Virtual Reality. International Journal of Human–Computer Interaction, 2024; 1–20. [Google Scholar] [CrossRef]
  9. Körber, M.; Prasch, L.; Bengler, K. Why do I have to drive now? Post hoc explanations of takeover requests. Human factors 2018, 60, 305–323. [Google Scholar] [CrossRef] [PubMed]
  10. Mara, M.; Meyer, K. Acceptance of autonomous vehicles: An overview of user-specific, car-specific and contextual determinants. User experience design in the era of automated driving 2022, 51–83. [Google Scholar] [CrossRef]
  11. Zhang, T.; Tao, D.; Qu, X.; Zhang, X.; Zeng, J.; Zhu, H.; Zhu, H. Automated vehicle acceptance in China: Social influence and initial trust are key determinants. Transportation research part C: emerging technologies 2020, 112, 220–233. [Google Scholar] [CrossRef]
  12. Merat, N.; Seppelt, B.; Louw, T.; Engström, J.; Lee, J.D.; Johansson, E.; Green, C.A.; Katazaki, S.; Monk, C.; Itoh, M.; others. The “Out-of-the-Loop” concept in automated driving: proposed definition, measures and implications. Cognition, Technology & Work 2019, 21, 87–98. [Google Scholar] [CrossRef]
  13. Mole, C.D.; Lappi, O.; Giles, O.; Markkula, G.; Mars, F.; Wilkie, R.M. Getting back into the loop: the perceptual-motor determinants of successful transitions out of automated driving. Human factors 2019, 61, 1037–1065. [Google Scholar] [CrossRef]
  14. Dillmann, J.; den Hartigh, R.; Kurpiers, C.; Pelzer, J.; Raisch, F.; Cox, R.; De Waard, D. Keeping the driver in the loop through semi-automated or manual lane changes in conditionally automated driving. Accident Analysis & Prevention 2021, 162, 106397. [Google Scholar] [CrossRef]
  15. Dillmann, J.; Den Hartigh, R.; Kurpiers, C.; Raisch, F.; De Waard, D.; Cox, R. Keeping the driver in the loop in conditionally automated driving: A perception-action theory approach. Transportation research part F: traffic psychology and behaviour 2021, 79, 49–62. [Google Scholar] [CrossRef]
  16. Weaver, B.W.; DeLucia, P.R. A systematic review and meta-analysis of takeover performance during conditionally automated driving. Human factors 2022, 64, 1227–1260. [Google Scholar] [CrossRef]
  17. Zhang, B.; De Winter, J.; Varotto, S.; Happee, R.; Martens, M. Determinants of take-over time from automated driving: A meta-analysis of 129 studies. Transportation research part F: traffic psychology and behaviour 2019, 64, 285–307. [Google Scholar] [CrossRef]
  18. Liu, W.; Li, Q.; Wang, Z.; Wang, W.; Zeng, C.; Cheng, B. A literature review on additional semantic information conveyed from driving automation systems to drivers through advanced in-vehicle hmi just before, during, and right after takeover request. International Journal of Human–Computer Interaction 2023, 39, 1995–2015. [Google Scholar] [CrossRef]
  19. Baldwin, C.L.; Spence, C.; Bliss, J.P.; Brill, J.C.; Wogalter, M.S.; Mayhorn, C.B.; Ferris, T.K. Multimodal cueing: The relative benefits of the auditory, visual, and tactile channels in complex environments. Proceedings of the Human Factors and Ergonomics Society Annual Meeting. SAGE Publications Sage CA: Los Angeles, CA, 2012, Vol. 56, pp. 1431–1435. [CrossRef]
  20. Cohen-Lazry, G.; Katzman, N.; Borowsky, A.; Oron-Gilad, T. Directional tactile alerts for take-over requests in highly-automated driving. Transportation research part F: traffic psychology and behaviour 2019, 65, 217–226. [Google Scholar] [CrossRef]
  21. Gold, C.; Damböck, D.; Lorenz, L.; Bengler, K. “Take over!” How long does it take to get the driver back into the loop? Proceedings of the human factors and ergonomics society annual meeting. Sage Publications Sage CA: Los Angeles, CA, 2013, Vol. 57, pp. 1938–1942. [CrossRef]
  22. Zhang, B.; Wilschut, E.S.; Willemsen, D.M.; Martens, M.H. Transitions to manual control from highly automated driving in non-critical truck platooning scenarios. Transportation research part F: traffic psychology and behaviour 2019, 64, 84–97. [Google Scholar] [CrossRef]
  23. Endsley, M.R. Toward a theory of situation awareness in dynamic systems. Human factors 1995, 37, 32–64. [Google Scholar] [CrossRef]
  24. Park, Y.; Ji, J.; Kang, H. Effect of a looming visual cue on situation awareness and perceived urgency in response to a takeover request. Heliyon 2024, 10. [Google Scholar] [CrossRef]
  25. Houtenbos, M.; de Winter, J.C.; Hale, A.R.; Wieringa, P.A.; Hagenzieker, M.P. Concurrent audio-visual feedback for supporting drivers at intersections: A study using two linked driving simulators. Applied ergonomics 2017, 60, 30–42. [Google Scholar] [CrossRef]
  26. Naujoks, F.; Mai, C.; Neukum, A. The Effect of Urgency of Take-Over Requests During Highly Automated Driving Under Distraction Conditions. Advances in Human Aspects of Transportation: Part I. AHFE, 2021. [CrossRef]
  27. Sanghavi, H.; Zhang, Y.; Jeon, M. Exploring the influence of driver affective state and auditory display urgency on takeover performance in semi-automated vehicles: Experiment and modelling. International Journal of Human-Computer Studies 2023, 171, 102979. [Google Scholar] [CrossRef]
  28. Brandenburg, S.; Chuang, L. Take-over requests during highly automated driving: How should they be presented and under what conditions? Transportation research part F: traffic psychology and behaviour 2019, 66, 214–225. [Google Scholar] [CrossRef]
  29. Green, M. "How long does it take to stop?" Methodological analysis of driver perception-brake times. Transportation human factors 2000, 2, 195–216. [Google Scholar] [CrossRef]
  30. Zeeb, K.; Buchner, A.; Schrauf, M. Is take-over time all that matters? The impact of visual-cognitive load on driver take-over quality after conditionally automated driving. Accident analysis & prevention 2016, 92, 230–239. [Google Scholar] [CrossRef]
  31. Bazilinskyy, P.; Petermeijer, S.M.; Petrovych, V.; Dodou, D.; de Winter, J.C. Take-over requests in highly automated driving: A crowdsourcing survey on auditory, vibrotactile, and visual displays. Transportation research part F: traffic psychology and behaviour 2018, 56, 82–98. [Google Scholar] [CrossRef]
  32. Capallera, M.; Meteier, Q.; De Salis, E.; Widmer, M.; Angelini, L.; Carrino, S.; Sonderegger, A.; Abou Khaled, O.; Mugellini, E. A contextual multimodal system for increasing situation awareness and takeover quality in conditionally automated driving. IEEE Access 2023, 11, 5746–5771. [Google Scholar] [CrossRef]
  33. Kyriakidis, M.; Happee, R.; De Winter, J.C. Public opinion on automated driving: Results of an international questionnaire among 5000 respondents. Transportation research part F: traffic psychology and behaviour 2015, 32, 127–140. [Google Scholar] [CrossRef]
  34. Hewitt, C.; Politis, I.; Amanatidis, T.; Sarkar, A. Assessing public perception of self-driving cars: The autonomous vehicle acceptance model. Proceedings of the 24th international conference on intelligent user interfaces, 2019, pp. 518–527. [CrossRef]
  35. Cao, Y.; Zhou, F.; Pulver, E.M.; Molnar, L.J.; Robert, L.P.; Tilbury, D.M.; Yang, X.J. Towards standardized metrics for measuring takeover performance in conditionally automated driving: A systematic review. Proceedings of the human factors and ergonomics society annual meeting. SAGE Publications Sage CA: Los Angeles, CA, 2021, Vol. 65, pp. 1065–1069. [CrossRef]
  36. Riegler, A.; Riener, A.; Holzmann, C. A systematic review of virtual reality applications for automated driving: 2009–2020. Frontiers in human dynamics 2021, 3, 689856. [Google Scholar] [CrossRef]
  37. Gold, C.; Happee, R.; Bengler, K. Modeling take-over performance in level 3 conditionally automated vehicles. Accident Analysis & Prevention 2018, 116, 3–13. [Google Scholar] [CrossRef]
  38. Zhou, F.; Yang, X.J.; De Winter, J.C. Using eye-tracking data to predict situation awareness in real time during takeover transitions in conditionally automated driving. IEEE Transactions on Intelligent Transportation Systems 2022, 23, 2284–2295. [Google Scholar] [CrossRef]
  39. Fouladinejad, N.; Fouladinejad, N.; Abd Jalil, M.; Taib, J.M. Modeling virtual driving environment for a driving simulator. 2011 IEEE International Conference on Control System, Computing and Engineering. IEEE, 2011, pp. 27–32. [CrossRef]
  40. Wilkinson, M.; Brown, T.; Ahmad, O. The national advanced driving simulator (NADS) description and capabilities in vision-related research. Optometry (Saint Louis, Mo.) 2012, 83, 285–288. [Google Scholar]
  41. Ho, C.; Gray, R.; Spence, C. To what extent do the findings of laboratory-based spatial attention research apply to the real-world setting of driving? IEEE Transactions on Human-Machine Systems 2014, 44, 524–530. [Google Scholar] [CrossRef]
  42. Weiss, E.; Talbot, J.; Gerdes, J.C. Combining virtual reality and steer-by-wire systems to validate driver assistance concepts. 2022 IEEE Intelligent Vehicles Symposium (IV). IEEE, 2022, pp. 1709–1715. [CrossRef]
  43. Bayarri, S.; Fernandez, M.; Perez, M. Virtual reality for driving simulation. Communications of the ACM 1996, 39, 72–76. [Google Scholar] [CrossRef]
  44. Feliciani, C.; Crociani, L.; Gorrini, A.; Nagahama, A.; Nishinari, K.; Bandini, S. Experiments and Usability Tests of a VR-Based Driving Simulator to Evaluate Driving Behavior in the Presence of Crossing Pedestrians. Traffic and Granular Flow 2019. Springer, 2020, pp. 471–477. [CrossRef]
  45. Le, D.H.; Temme, G.; Oehl, M. Automotive eHMI Development in Virtual Reality: Lessons Learned from Current Studies. HCI International 2020–Late Breaking Posters: 22nd International Conference, HCII 2020, Copenhagen, Denmark, July 19–24, 2020, Proceedings, Part II 22. Springer, 2020, pp. 593–600. [CrossRef]
  46. Sportillo, D.; Paljic, A.; Ojeda, L. Get ready for automated driving using virtual reality. Accident Analysis & Prevention 2018, 118, 102–113. [Google Scholar] [CrossRef]
  47. Eudave, L.; Valencia, M. Physiological response while driving in an immersive virtual environment. 2017 IEEE 14th International Conference on Wearable and Implantable Body Sensor Networks (BSN). IEEE, 2017, pp. 145–148. [CrossRef]
  48. Vaitheeshwari, R.; Yeh, S.C.; Wu, E.H.K.; Chen, J.Y.; Chung, C.R. Stress recognition based on multiphysiological data in high-pressure driving VR scene. IEEE Sensors Journal 2022, 22, 19897–19907. [Google Scholar] [CrossRef]
  49. Ihemedu-Steinke, Q.C.; Erbach, R.; Halady, P.; Meixner, G.; Weber, M. Virtual reality driving simulator based on head-mounted displays. Automotive User Interfaces: Creating Interactive Experiences in the Car 2017, 401–428. [Google Scholar] [CrossRef]
  50. Yeo, D.; Kim, G.; Kim, S. Toward immersive self-driving simulations: Reports from a user study across six platforms. Proceedings of the 2020 CHI Conference on Human Factors in Computing Systems, 2020, pp. 1–12. [CrossRef]
  51. Adhanom, I.B.; MacNeilage, P.; Folmer, E. Eye tracking in virtual reality: a broad review of applications and challenges. Virtual Reality 2023, 27, 1481–1505. [Google Scholar] [CrossRef] [PubMed]
  52. Wang, Y.; Zhang, W.; Wu, S.; Guo, Y. Simulators for driving safety study–a literature review. Virtual Reality: Second International Conference, ICVR 2007, Held as part of HCI International 2007, Beijing, China, July 22-27, 2007. Proceedings 2. Springer, 2007, pp. 584–593. [CrossRef]
  53. Kanade, S.G.; Duffy, V.G. Use of virtual reality for safety training: a systematic review. International Conference on Human-Computer Interaction. Springer, 2022, pp. 364–375. [CrossRef]
  54. Stefan, H.; Mortimer, M.; Horan, B. Evaluating the effectiveness of virtual reality for safety-relevant training: a systematic review. Virtual Reality 2023, 27, 2839–2869. [Google Scholar] [CrossRef]
  55. Zhao, J.; Xu, X.; Jiang, H.; Ding, Y. The effectiveness of virtual reality-based technology on anatomy teaching: a meta-analysis of randomized controlled studies. BMC medical education 2020, 20, 1–10. [Google Scholar] [CrossRef]
  56. Unity 3D. Unity Technologies, 2024. Available online: https://unity.com Accessed: July 13, 2024.
  57. Nezami, F.N.; Wächter, M.A.; Maleki, N.; Spaniol, P.; Kühne, L.M.; Haas, A.; Pingel, J.M.; Tiemann, L.; Nienhaus, F.; Keller, L.; König, S.U.; König, P.; Pipa, G. Westdrive X LoopAR: An Open-Access Virtual Reality Project in Unity for Evaluating User Interaction Methods during Takeover Requests. Sensors 2021, 21, 1879. [Google Scholar] [CrossRef]
  58. Mieschke, P.E.; Elliott, D.; Helsen, W.F.; Carson, R.G.; Coull, J.A. Manual asymmetries in the preparation and control of goal-directed movements. Brain and cognition 2001, 45, 129–140. [Google Scholar] [CrossRef] [PubMed]
  59. Schmidt, K.; Beggiato, M.; Hoffmann, K.H.; Krems, J.F. A mathematical model for predicting lane changes using the steering wheel angle. Journal of safety research 2014, 49, 85–e1. [Google Scholar] [CrossRef] [PubMed]
  60. Lv, C.; Li, Y.; Xing, Y.; Huang, C.; Cao, D.; Zhao, Y.; Liu, Y. Human–Machine Collaboration for Automated Driving Using an Intelligent Two-Phase Haptic Interface. Advanced Intelligent Systems 2021, 3, 2000229. [Google Scholar] [CrossRef]
  61. Salvucci, D.D.; Goldberg, J.H. Identifying fixations and saccades in eye-tracking protocols. Proceedings of the 2000 symposium on Eye tracking research & applications, 2000, pp. 71–78. [CrossRef]
  62. Voloh, B.; Watson, M.R.; König, S.; Womelsdorf, T. MAD saccade: statistically robust saccade threshold estimation via the median absolute deviation. Journal of eye movement research 2019, 12. [Google Scholar] [CrossRef] [PubMed]
  63. Chang, E.; Kim, H.T.; Yoo, B. Virtual reality sickness: a review of causes and measurements. International Journal of Human–Computer Interaction 2020, 36, 1658–1682. [Google Scholar] [CrossRef]
  64. Borojeni, S.S.; Chuang, L.; Heuten, W.; Boll, S. Assisting drivers with ambient take-over requests in highly automated driving. Proceedings of the 8th international conference on automotive user interfaces and interactive vehicular applications, 2016, pp. 237–244. [CrossRef]
  65. Politis, I.; Brewster, S.; Pollick, F. Language-based multimodal displays for the handover of control in autonomous cars. Proceedings of the 7th international conference on automotive user interfaces and interactive vehicular applications, 2015, pp. 3–10. [CrossRef]
  66. Melcher, V.; Rauh, S.; Diederichs, F.; Widlroither, H.; Bauer, W. Take-over requests for automated driving. Procedia Manufacturing 2015, 3, 2867–2873. [Google Scholar] [CrossRef]
  67. Liang, N.; Yang, J.; Yu, D.; Prakah-Asante, K.O.; Curry, R.; Blommer, M.; Swaminathan, R.; Pitts, B.J. Using eye-tracking to investigate the effects of pre-takeover visual engagement on situation awareness during automated driving. Accident Analysis & Prevention 2021, 157, 106143. [Google Scholar] [CrossRef]
  68. Kim, S.; van Egmond, R.; Happee, R. Effects of user interfaces on take-over performance: a review of the empirical evidence. Information 2021, 12, 162. [Google Scholar] [CrossRef]
  69. Winter, J.D.; Stanton, N.A.; Price, J.S.; Mistry, H. The effects of driving with different levels of unreliable automation on self-reported workload and secondary task performance. International journal of vehicle design 2016, 70, 297–324. [Google Scholar] [CrossRef]
  70. Endsley, M.R. From here to autonomy: lessons learned from human–automation research. Human factors 2017, 59, 5–27. [Google Scholar] [CrossRef]
  71. Edworthy, J.; Loxley, S.; Dennis, I. Improving auditory warning design: Relationship between warning sound parameters and perceived urgency. Human factors 1991, 33, 205–231. [Google Scholar] [CrossRef] [PubMed]
  72. Li, Q.; Wang, Z.; Wang, W.; Zeng, C.; Li, G.; Yuan, Q.; Cheng, B. An adaptive time budget adjustment strategy based on a take-over performance model for passive fatigue. IEEE Transactions on Human-Machine Systems 2021, 52, 1025–1035. [Google Scholar] [CrossRef]
Figure 1. (a) The figure illustrates the four experimental conditions during the semi-autonomous drive, with the green area depicting a critical event from start to end. During critical events, participants transitioned from “automatic drive” (hands off wheel) to “manual drive” (hands on wheel). In the no-signal condition, no signal prompted participants to take over vehicle control. In the audio condition, they would hear a "warning" sound, and in the visual condition, they would see a red triangle on the windshield. In the audio-visual condition, participants would hear and see the audio and visual signals together. (b) Aerial view of the implementation of a critical traffic event in the VR environment.
Preprints 113273 g001
Figure 2. Exemplary images of the driver’s view in the audio-visual condition during two different critical events. (a) Auditory and visual feedback alerting the driver at the beginning of a critical event, and the view of the windshield after take-over for the subsequent drive (b). The “warning” logo on the top left was not visible to participants.
Preprints 113273 g002
Figure 3. LoopAR road map bird view from start to end. Image from [57].
Preprints 113273 g003
Figure 4. Two figures illustrating the experimental setup during measurement. (a) Two participants sitting on the wooden car simulator wearing the VR Head Mounted Display. (b) Experimenter ensuring correct positioning of the Head Mounted Display and steering wheel..
Preprints 113273 g004
Figure 5. The plot depicts the distribution of reaction times across different conditions: base, audio_visual, visual, and audio. The y-axis shows the reaction time in seconds, while the x-axis lists the different conditions. The violin plots illustrate the density of each variable, with the box plots inside showing the median. The scatter points overlay the distribution, indicating individual data points. The gray dashed line connects the conditions that are not significantly different.
Preprints 113273 g005
Figure 6. The plot represents the coefficient estimates of the effect of warning signals and seeing objects of interest on success. The Intercept represents the reference level (base condition). The horizontal x-axis represents the regression coefficient, which shows strength and direction of the relationship between predictors (each type of warning signal and seeing objects of interest) and the probability of success. The vertical y-axis lists the warning signal types. Each bar represents the estimated coefficient for the predictor. The horizontal lines through the bars (error bars) represent the 95% confidence intervals for the coefficient estimates. The red dashed line at 0 represents the null hypothesis (coefficient = 0 ).
Preprints 113273 g006
Figure 7. The plot depicts the distribution of dwell time across different conditions: base, audio_visual, visual, and audio. The y-axis shows the dwell time in seconds, while the x-axis lists the different conditions. The violin plots illustrate the density of each variable, with the box plots inside showing the median. The scatter points overlay the distribution, indicating individual data points. The gray dashed line connects the conditions that are not significantly different.
Preprints 113273 g007
Figure 8. The plot represents the coefficient estimates of the warning signal, reaction time and dwell time effect on success. The Intercept represents the reference level (base condition). The horizontal x-axis represents the regression coefficient, which shows strength and direction of the relationship between predictor and the probability of success. The vertical y-axis lists the warning signal types. Each bar represents the estimated coefficient for the predictor. The horizontal lines through the bars (error bars) represent the 95% confidence intervals for the coefficient estimates. The red dashed line at 0 represents the null hypothesis (coefficient = 0 ).
Preprints 113273 g008
Figure 9. Anxiety_Trust and Method of Control Analysis Results. The plot shows the results of post-hoc tests for each dependent variable (questionnaire subscales), comparing the mean scores of each level of the independent variable (condition). The error bars represent the standard error of the mean (SEM), illustrating the variability of each mean score across different conditions.
Preprints 113273 g009
Figure 10. Correlation matrix. The plot shows the result of the Spearman rank correlation between reaction time, dwell time and gaze hits count with the questionnaire subscales. Dwell times with Anxiety_Trust ( r s = 0.084 , p = 0.320 ), with Methods_of_Control_eye ( r s = 0.077 , p = 0.363 ), with Methods_of_Control_hand ( r s = 0.018 , p = 0.834 ) and with Methods_of_Control_feet ( r s = 0.090 , p = 0.284 ).
Preprints 113273 g010
Table 1. Exploratory factor analysis result.
Dimension Items Factor Communality
1 2
Anxiety_Trust Anxiety_1 .77 .11 .60
Anxiety_2 .66 -.12 .45
Anxiety_3 .45 -.01 .20
Perceived_safety_1 .78 -.00 .61
Perceived_safety_2 -.78 -.12 .62
Perceived_safety_3 -.69 -.05 .47
Methods
of Control Eye .02 .38 .15
Hand .03 .66 .44
Feet .00 .57 .32
Note. Factor loadings and communality for Varimax-rotated four factor solutions for 9 Autonomous Vehicle Acceptance Model items (N=182). The largest loading for each item on each factor is inbold.
Disclaimer/Publisher’s Note: The statements, opinions and data contained in all publications are solely those of the individual author(s) and contributor(s) and not of MDPI and/or the editor(s). MDPI and/or the editor(s) disclaim responsibility for any injury to people or property resulting from any ideas, methods, instructions or products referred to in the content.
Copyright: This open access article is published under a Creative Commons CC BY 4.0 license, which permit the free download, distribution, and reuse, provided that the author and preprint are cited in any reuse.
Prerpints.org logo

Preprints.org is a free preprint server supported by MDPI in Basel, Switzerland.

Subscribe

© 2024 MDPI (Basel, Switzerland) unless otherwise stated