Preprint
Article

Bemotrizinol-Loaded Nanostructured Lipid Carriers for the Development of Sunscreen Emulsions

Altmetrics

Downloads

152

Views

81

Comments

0

Submitted:

25 July 2024

Posted:

26 July 2024

You are already at the latest version

Alerts
Abstract
The efficacy and safety of organic UV-filters could benefit from their incorporation into lipid nanoparticles because of the ability of such carriers to reflect solar radiations, thus acting synergically as physical sunscreens. In this work, bemotrizinol (BMTZ), a broad-spectrum UV-filter, was loaded into nanostructured lipid carriers (NLC) whose lipid matrix contained different oils to assess the effects of the lipid core composition on the properties of the resulting NLC. Subsequently, the effects of incorporating different concentrations of optimized BMTZ-loaded NLC on the technological properties of O/W emulsions (pH, viscosity, spreadability, occlusion factor, in vitro BMTZ release and skin permeation, in vitro sun protection factor) were assessed. Optimized BMTZ-loaded NLC showed mean size=190.6±9.8 nm, PDI=0.153±0.013, ζ-potential=-10.6±1.7 mV, loading capacity=8% w/w. The incorporation of increasing concentrations of optimized BMTZ-loaded into emulsions provided slight increase of spreadability, lower viscosity and no change of pH, occlusion factor and BMTZ release compared to the control. No BMTZ skin permeation was observed from all formulations. About 20% increase of sun protection factor values was obtained for vehicles containing BMTZ-loaded NLC. Therefore, BMTZ-loaded NLC incorporation into emulsions could be a promising strategy to develop safer and more effective sunscreen formulations.
Keywords: 
Subject: Chemistry and Materials Science  -   Nanotechnology

1. Introduction

Nowadays, organic (chemical) and inorganic (physical) UV-filters play a fundamental role in preventing the deleterious effect of skin exposure to solar radiation, such as erythema, sunburns, actinic keratosis, cutaneous carcinoma, and melanoma [1-3]. Nevertheless, their safety, both for humans and environment, has been repeatedly questioned [4-6]. To improve sunscreen products’ efficacy and safety, several researchers have proposed the incorporation of organic UV-filters into lipid nanoparticles because of the ability of such colloidal carriers to reflect solar radiations, thus acting in synergy as physical sunscreens and allowing reducing the amount of organic UV-filter required to achieve the desired photo-protection [7-11]. In addition, lipid nanoparticles, namely solid lipid nanoparticles (SLN) and nanostructured lipid carriers (NLC), show many advantages as topical delivery systems, including high biocompatibility, controlled release of their payload, ability to modulate drug skin penetration/permeation, and improvement of skin hydration because of their occlusive properties, which depend on the composition of their lipid matrix [12-15]. Indeed, the structure of the lipid core is the main feature that differentiates SLN from NLC, being both types of nanoparticles made up of a lipid matrix stabilized by surfactants in aqueous media [16,17]. In particular, the lipid core of SLN, the first generation of lipid nanoparticles, consists of solid lipids, whose highly ordered arrangement leads to poor drug incorporation and drug leakage during storage. These drawbacks were overcome by developing a second generation of lipid nanoparticles, namely NLC, using mixtures of solid and liquid lipids as nanoparticle matrix, thus increasing both the stability and drug loading ability of the resulting colloidal systems.
In recent years, the awareness of the harmful effects of skin exposure to UV-A radiation and the limited availability of safe organic UV-filters effective in absorbing UV-A rays have prompted the researchers to focus on the development of sunscreen products with improved photo-protective activity against UV-A.
Bemotrizinol (BMTZ) has been launched in the market as a broad-spectrum sunscreen agent due to its ability to absorb UV radiation in the range 280-380 nm [18]. A recent study [19] demonstrated an improvement of the in vitro photo-protective activity of BMTZ-loaded NLC obtained using carnauba wax as solid lipid and caprylic/capric triglyceride as liquid lipid. However, several studies pointed out that SLN and NLC show different technological properties depending on the type of lipids and the ratio solid/liquid lipids, which, in turn, could affect their ability to improve the efficacy and safety of the loaded active ingredients [20,21,22].
Therefore, the aim of this work was to assess the effects of different lipid core compositions on the physico-chemical characteristics of NLC loading BMTZ to design new sunscreen formulations with suitable technological properties. Mixtures containing different ratios of solid (cetyl palmitate) and liquid lipids (isopropyl myristate, decyl oleate and caprylic/capric triglyceride) were assessed to prepare BMTZ-loaded NLC. All lipids were chosen due to their wide use and safety as cosmetic ingredients [23,24]. After choosing the ratio solid/ liquid lipid that provided NLC with small particle size and low polydispersity index, different percentages of BMTZ (1, 3, 5, 7 % w/w) were incorporated in such NLC. The thermal behavior of the resulting nanocarriers was investigated by differential scanning calorimetry to gain information about BMTZ location into the nanoparticles. NLC were prepared using the phase inversion temperature (PIT) method that could allow easy formulation scaling up, as it did not require specific equipment or special operative conditions. The optimized BMTZ-loaded NLC were incorporated, at different concentrations, into an O/W emulsion and the technological properties (pH, viscosity, spreadability, occlusion factor, BMTZ in vitro release and skin permeation, in vitro sun protection factor) of the resulting formulations were evaluated.

2. Materials and Methods

2.1. Materials

Isopropyl myristate (IPM), disodium EDTA (EDTA), imidazolidinyl urea (Kemipur 100®), and benzyl alcohol were supplied by Galeno (Carmignano, Prato, Italy). Decyl oleate (Cetiol V®, DO), diethylhexylcyclohexane (Cetiol S®), caprylic/capric triglyceride (Myritol 318®, MYR), cetyl palmitate (Cutina CP®, CP), and bis-ethylhexyloxyphenol methoxyphenyl triazine (bemotrizinol, Tinosorb S®, BMTZ) were a kind gift from BASF (Ludwigshafen, Germany). Steareth-21 (Brij 721®), Steareth-2 (Brij 72®), and oleth-20 (Brij 98®) were bought from Sigma-Aldrich (Milan, Italy). Glyceryl oleate (Tegin O®, GO) was obtained from A.C.E.F. S.p.A. (Fiorenzuola D’Arda-Piacenza, Italy). Cetyl alcohol and tocopheryl acetate (TA) were purchased from Farmalabor (Canosa di Puglia, Bari, Italy). Argan oil was purchased from Makeitlab (Barletta, Italy). Triticum vulgare germ oil (Wheat oil), and coconut alkanes (and) coco-caprylate/caprate (Greensyl®) were supplied by Camelis (Parma, Italy). Butyrospermum Parkii oil (Shea Oil), and cetearyl ethylhexanoate (and) isopropyl myristate (Crodamol® CAP) were obtained from Aroma-Zone (Paris, France). Parfum was a gift from Muller and Koster (Liscate, Milan, Italy).

2.2. Preparation of Nanostructured Lipid Carriers (NLC)

NLC, whose composition is reported in Table 1 and Table 2, were prepared using the phase inversion temperature (PIT) method, as previously described [25,26]. Briefly, the oil phase (containing different percentages of BMTZ when BMTZ-loaded NLC were prepared) and aqueous phase were heated at about 90 °C separately. Then, the aqueous phase, consisting of deionized water containing Kemipur 100® 0.35 % w/w as preservative, was added slowly to the oil phase under stirring (700 rpm). The resulting colloidal suspension was allowed cooling down to room temperature under continuous stirring. The sample turned into clear at the phase inversion temperature (PIT) that was recorded using a conductivity meter (model 525, Crison, Modena, Italy). The samples were stored in airtight jars at room temperature and in the dark until used.

2.3. Characterization of Unloaded and Bemotrizinol Loaded NLC

NLC morphology was evaluated by transmission electron microscopy (TEM) analysis. 5 μL of each ample were placed on a Formvar (200-mesh) copper grid (TAAB Laboratories Equipment, Berks, UK). After removing the excess of sample by filter paper, a drop of 2% (w/w) aqueous solution of uranyl acetate was added. After drying at room temperature, the sample was analyzed by a transmission electron microscope (model JEM 2010, Jeol, Peabody, MA, USA) operating at an acceleration voltage of 200 KV.
NLC mean particle size and size distribution (polydispersity index, PDI) were assessed by dynamic light scattering using a Zetasizer Nano ZS90 (Malvern Instruments, Malvern, UK), using a 4 mW laser diode at 670 nm and scattering light at 90°. All analyses were performed after diluting the sample (1:5, sample/distilled water) and letting it settle down to 25°C for 2 min. Values were reported based on intensity and expressed as Z-average. The same Zetasizer was used to assess ζ-potential by laser Doppler velocimetry, diluting all samples with KCl 1 mM (pH 7.0) before analysis.

2.4. Differential Scanning Calorimetry (DSC) Analyses

DSC analyses were performed using a Mettler Toledo STARe thermoanalytical system (Greifensee, Switzerland) equipped with a DSC822 calorimetric cell. A Mettler STARe software (version 16.00) (Greifensee, Switzerland) was used to obtain and analyze data. The calorimeter was calibrated using Indium (99.95%), based on the setting of the instrument. The sensitivity was automatically chosen as the maximum possible by the calorimetric system. 100 µL aluminum calorimetric pans were used. Enthalpy changes were calculated from the peak areas. Freshly prepared NLC samples (80 µL) were put into the pan, which was hermetically closed, and submitted, under N2 flow (70 mL/min), to the following scans: a scan from 10 to 60 °C (4 °C/min); an isotherm at 60 °C (4 min); a scan from 60 to 10 °C (4 °C/min); an isotherm at 10 °C (4 min). The procedure was repeated three times. The enthalpy variation (ΔH) was obtained by integration of the area under the transition peak and the recrystallization index (RI), expressed as a percentage, was calculated from the following equation 1 [27]:
R I % = H n a n o p a r t i c l e s H b u l k   m a t e r i a l × c o n c e n t r a t i o n l i p i d   p h a s e × 100

2.5. Stability Studies on Nanostructured Lipid Carriers (NLC)

Stability of all NLC samples was evaluated by determining particle sizes, PDI and ζ-potential values at intervals (24 h, one week, one month, two months) during storage at room temperature and in the dark. Analyses were performed only on samples that did not show any sign of precipitation.

2.6. Preparation of O/W Emulsions

The composition of O/W emulsions containing free BMTZ or BMTZ loaded NLC is illustrated in Table 3. All formulations were prepared by hot–cold procedure, in an open system.
Phase A and B were heated separately to 70 °C and the water phase was added to the oil phase under vigorous stirring (Turbomixer Silverson SL2, Silverson Machines Inc., East Longmeadow, MA, USA). After the emulsifying process, the formulation was cooled to 40 °C under slow and continuous stirring. At this temperature, the preservatives (phase C) and the fragrance (phase D) were added. Afterwards, for samples BNLC, CNLC and DNLC, the required amount of BMTZ loaded NLC (phase E) was added under gentle mixing. Then, the emulsion was cooled to room temperature without stopping the stirring. All samples were stored in airtight glass jars until used. The pH of each formulation was determined 48 h after its preparation to allow it to settle down. Prior to performing, at room temperature, the pH measurement by a Crison pH-meter mod. Basic 20 (Crison Instruments, Barcelona, Spain), the sample was diluted with distilled water to one-tenth of its original concentration as previously reported [28].

2.7. Stability Studies on O/W Emulsions

All O/W emulsions were stored at room temperature for three months sheltered from light. At intervals (48 h, one week, two weeks, one month, two months, three months), samples were evaluated by determining their appearance, pH and viscosity.

2.8. Spreadability

The parallel-plate method was used to assess sample spreadability as previously reported [29,30]. 1 g of sample was placed between two 20 x 20 cm glass plate and a 200 g weight was put on the upper plate. After 1 min., the weight was removed and the spreading diameter (expressed in centimeters) was measured. Each measurement was carried out in triplicate.

2.9. Occlusive Properties

The occlusion factor of the investigated formulations was assessed as previously de-scribed [31,32]. Briefly, beakers (100 ml) filled with 50 mL of distilled water were covered with filter paper (cellulose acetate filter, perfecte 2, 90 mm, cut-off size: 4 -7 µm, Cartiera Cordenons, Pordenone, Italy), and sealed. After spreading the formulation evenly (200 mg) on the filter surface (18.8 cm2; applied amount 10.6 mg/cm2), the samples were accurately weighted and stored at 32°C (skin surface temperature) for 48 hours (50-55 % RH) in an incubator (Incubator IN 30, Memmert GmbH, Schwabach, Germany). After this period, water evaporation through the filter paper was determined by weighting each sample. The water loss from beakers covered with filter paper free of sample formulation was used as reference. The occlusion factor (F) was calculated as follows (equation 2):
F = 100 x [(A-B)/A]
Where A is the water loss without sample (reference) and B is the water loss with sample. Each experiment was performed in triplicate.

2.10. Viscosity

Viscosity of all emulsions was determined 48 h after their preparation to allow them to settle down [33]. Measurements were performed using a Brookfield DV-II+Pro viscometer (Brookfield Engineering Laboratories, Inc., Middleboro, MA, USA) equipped with the spindle number 6 at 25±0.5 °C and 6 rpm. The instrument was calibrated according to the procedures described in the operating instructions of the instrument manual using silicone oil as standard fluid. Samples were left to settle down for 1 h prior to performing the measurement. Each determination was performed in triplicate and the results were expressed in cPs.

2.11. In Vitro Release of Bemotrizinol

BMTZ release rate from the O/W emulsions under investigation was determined ac-cording to a procedure previously described [25,34]. Briefly, Franz-type diffusion cells (LGA, Berkeley, CA, USA) were used and BMTZ release was assessed through cellulose membranes moistened by immersion in distilled water for 1 hour at room temperature (surface area available for diffusion: 0.75 cm2, receptor volume: 4.5 mL). For ensuring pseudo-sink conditions, a mixture consisting of water/ethanol (50/50 v/v) was used as receiving phase [25] and was constantly stirred (700 rpm) and thermostated at 35°C to maintain the membrane surface at 32°C. After applying the sample (2 mg/cm2) on the membrane surface, aliquots of the receiving solution (600 μL) were withdrawn at intervals (0, 30, 60, 90, 120, 240 min) and replaced with an equal volume of receptor phase pre-thermostated to 35°C. BMTZ content in the receiving solution samples was determined spectrophotometrically (UV-VIS Spectrophotometer Shimadzu mod. UV-1601, Shimadzu Italia, Milan, Italy) at 340 nm. A calibration curve was constructed in the range 0.1 -10.0 μg/mL by dissolving BMTZ in ethanol (limit of detection 0.01 μg/mL, limit of quantification 0.05 μg/mL). Each experiment was performed in triplicate and results were expressed as mean ± S.D.

2.12. In Vitro Skin Permeation Experiments

Skin permeation experiments through excised human skin were performed as previously reported [4]. In vitro experiments were performed on stratum corneum and epidermis (SCE) membranes because, in vitro, the dermis could behave as an additional barrier to the penetration of lipophilic compounds such as BMTZ. Briefly, SCE membranes were prepared from adult (mean age 35 ± 9 years) human skin samples obtained from abdominal plastic surgery. The subcutaneous fat was trimmed and the resulting skin samples were immersed skin sample in distilled water at 60 ± 1 °C for 2 min. Then, SCE membranes were removed from the dermis using a scalpel blade, dried in a desiccator (25% RH) and stored at 4 ± 1 °C until used. 1 h prior to starting the experiment, dried SCE samples were rehydrated by immersion in distilled water at room temperature. SCE samples were placed in the same Franz-type diffusion cells described above. The receiving solution consisted of water/ethanol (50/50 v/v), which was constantly stirred and thermostated at 35 °C to maintain the membrane surface at 32 °C. 2 mg/cm2 of each formulation were applied to the skin surface in the donor compartment and the experiments were run for 24 h. At intervals (0, 30, 60, 90, 120, 240 min), samples of the receiving solution (600 µL) were withdrawn and replaced with an equal volume of receiving solution pre-thermostated at 35 °C. Samples of the receiving solution were analyzed spectrophotometrically as described above. Each formulation was tested in triplicate on three different skin specimens.

2.13. Determination of In Vitro Sun Protection Factor (SPF)

In vitro sun protection factor (SPF) values of O/W emulsions containing free or NLC loaded BMTZ were calculated according to the method described by Mansur et al. [35], with minor modifications. Each sample was properly diluted in deionised water (final concentration 200 μg/mL) and analysed spectrophotometrically (UV-VIS Spectrophotometer Shimadzu mod. UV-1601, Shimadzu Italia, Milan, Italy) acquiring absorption data every 5 nm in the range 290–320 nm. SPF values were calculated according to the following equation (3):
Preprints 113333 i001
where CF is the correction factor (= 10), EE(λ) is the erythemal effect of the radiation with wavelength λ, I(λ) is the solar intensity of radiation with wavelength λ, and Abs(λ) is the absorbance of the sunscreen product at wavelength λ. The values of EE(λ) x I(λ) at each wavelength in the range 290-320 nm, determined by Sayre et al. 36, were used to calculated SPF values.

2.14. Statistical Analysis

For all measurements, mean values ± standard deviation (S.D.) were calculated. Statistical analyses were performed using Student’s t-test. Values were considered statistically different when p < 0.05.

3. Results and Discussion

Three different oils, isopropyl myristate (IPM), decyl oleate (DO), and caprylic/capric triglyceride (MYR), were mixed with the solid lipid cetyl palmitate to prepare NLC to load the UV-filter bemotrizinol. All NLC contained the same total amount of lipids (7 % w/w) but different solid/liquid lipid ratios, namely 6%/ 1%, 5%/2%, 4%/3%. The choice of the total amount of lipid was based on previous studies performed on NLC containing a mixture of cetyl palmitate and IPM as lipid matrix, showing that a 7% w/w total amount of lipid allowed obtaining NLC with better technological properties [25]. Oleth-20 and glyceryl oleate were used as surfactant and co-surfactant, respectively. Unloaded NLC were coded according to the following criteria: for NLC containing isopropyl myristate the code IPM was used; for NLC containing caprylic/capric triglyceride the code MYR was used; for NLC containing decyl oleate the code DO was used; NLC containing 1% w/w of liquid lipid were coded using the number 1; NLC containing 2% w/w of liquid lipid were coded using the number 2; NLC containing 3% w/w of liquid lipid were coded using the number 3. The morphology of such nano-carriers (unloaded and BMTZ loaded NLC) was assessed by TEM that showed roughly spherical nanoparticles with no significant sign of aggregation. As all NLC provided similar TEM images, pictures obtained from only one sample of unloaded NLC containing IPM 3.0% w/w and the corresponding NLC loading BMTZ 1 % w/w are shown in Figure 1.
As regards unloaded NLC, mean particle sizes ranged from 37.4 to 48.1 nm and PDI values were well below 0.300 (see Table 4), thus confirming the ability of the phase inversion temperature (PIT) method to provide lipid nanoparticles with small mean sizes and narrow size distribution, as previously reported [25,36]. For all unloaded NLC, no significant relationship was observed between the percentage of liquid lipid and the mean size of the resulting nanoparticles. Among the investigated liquid lipids, IPM led to nanoparticles with smaller mean size compared to MYR and DO while no relevant difference was observed comparing PDI and ζ-potential values. The smaller mean size of NLC obtained using IPM could be due to the higher HLB values of this liquid oil (HLB IPM = 11.5; HLB DO and MYR = 11) that could lead to stronger interactions between the lipid core and the surfactant/co-surfactant layer resulting in smaller curvature radius of the nanoparticles [37].
To better elucidate the mechanisms involved in the production of NLC with different mean sizes depending on the type of liquid lipid used, differential scanning calorimetry (DSC) studies were performed on both unloaded and BMTZ loaded NLC. DSC is a widely used technique to characterize lipid nano-carriers that provides useful information about the interactions occurring among the NLC components [4,38]. In particular, parameters involved in NLC stability and drug loading ability, such as lipid modifications and crystallinity degree, can be studied by DSC. Indeed, during the cooling step in the NLC preparation process, lipids can crystallize in different polymorphic forms: α, thermodynamically unstable, β’, metastable, and β, stable [39]. In our study, we used as solid lipid cetyl palmitate, which shows two endothermic peaks, at about 39 and 50 °C due, respectively to the fusion of the α and β forms [27,40].
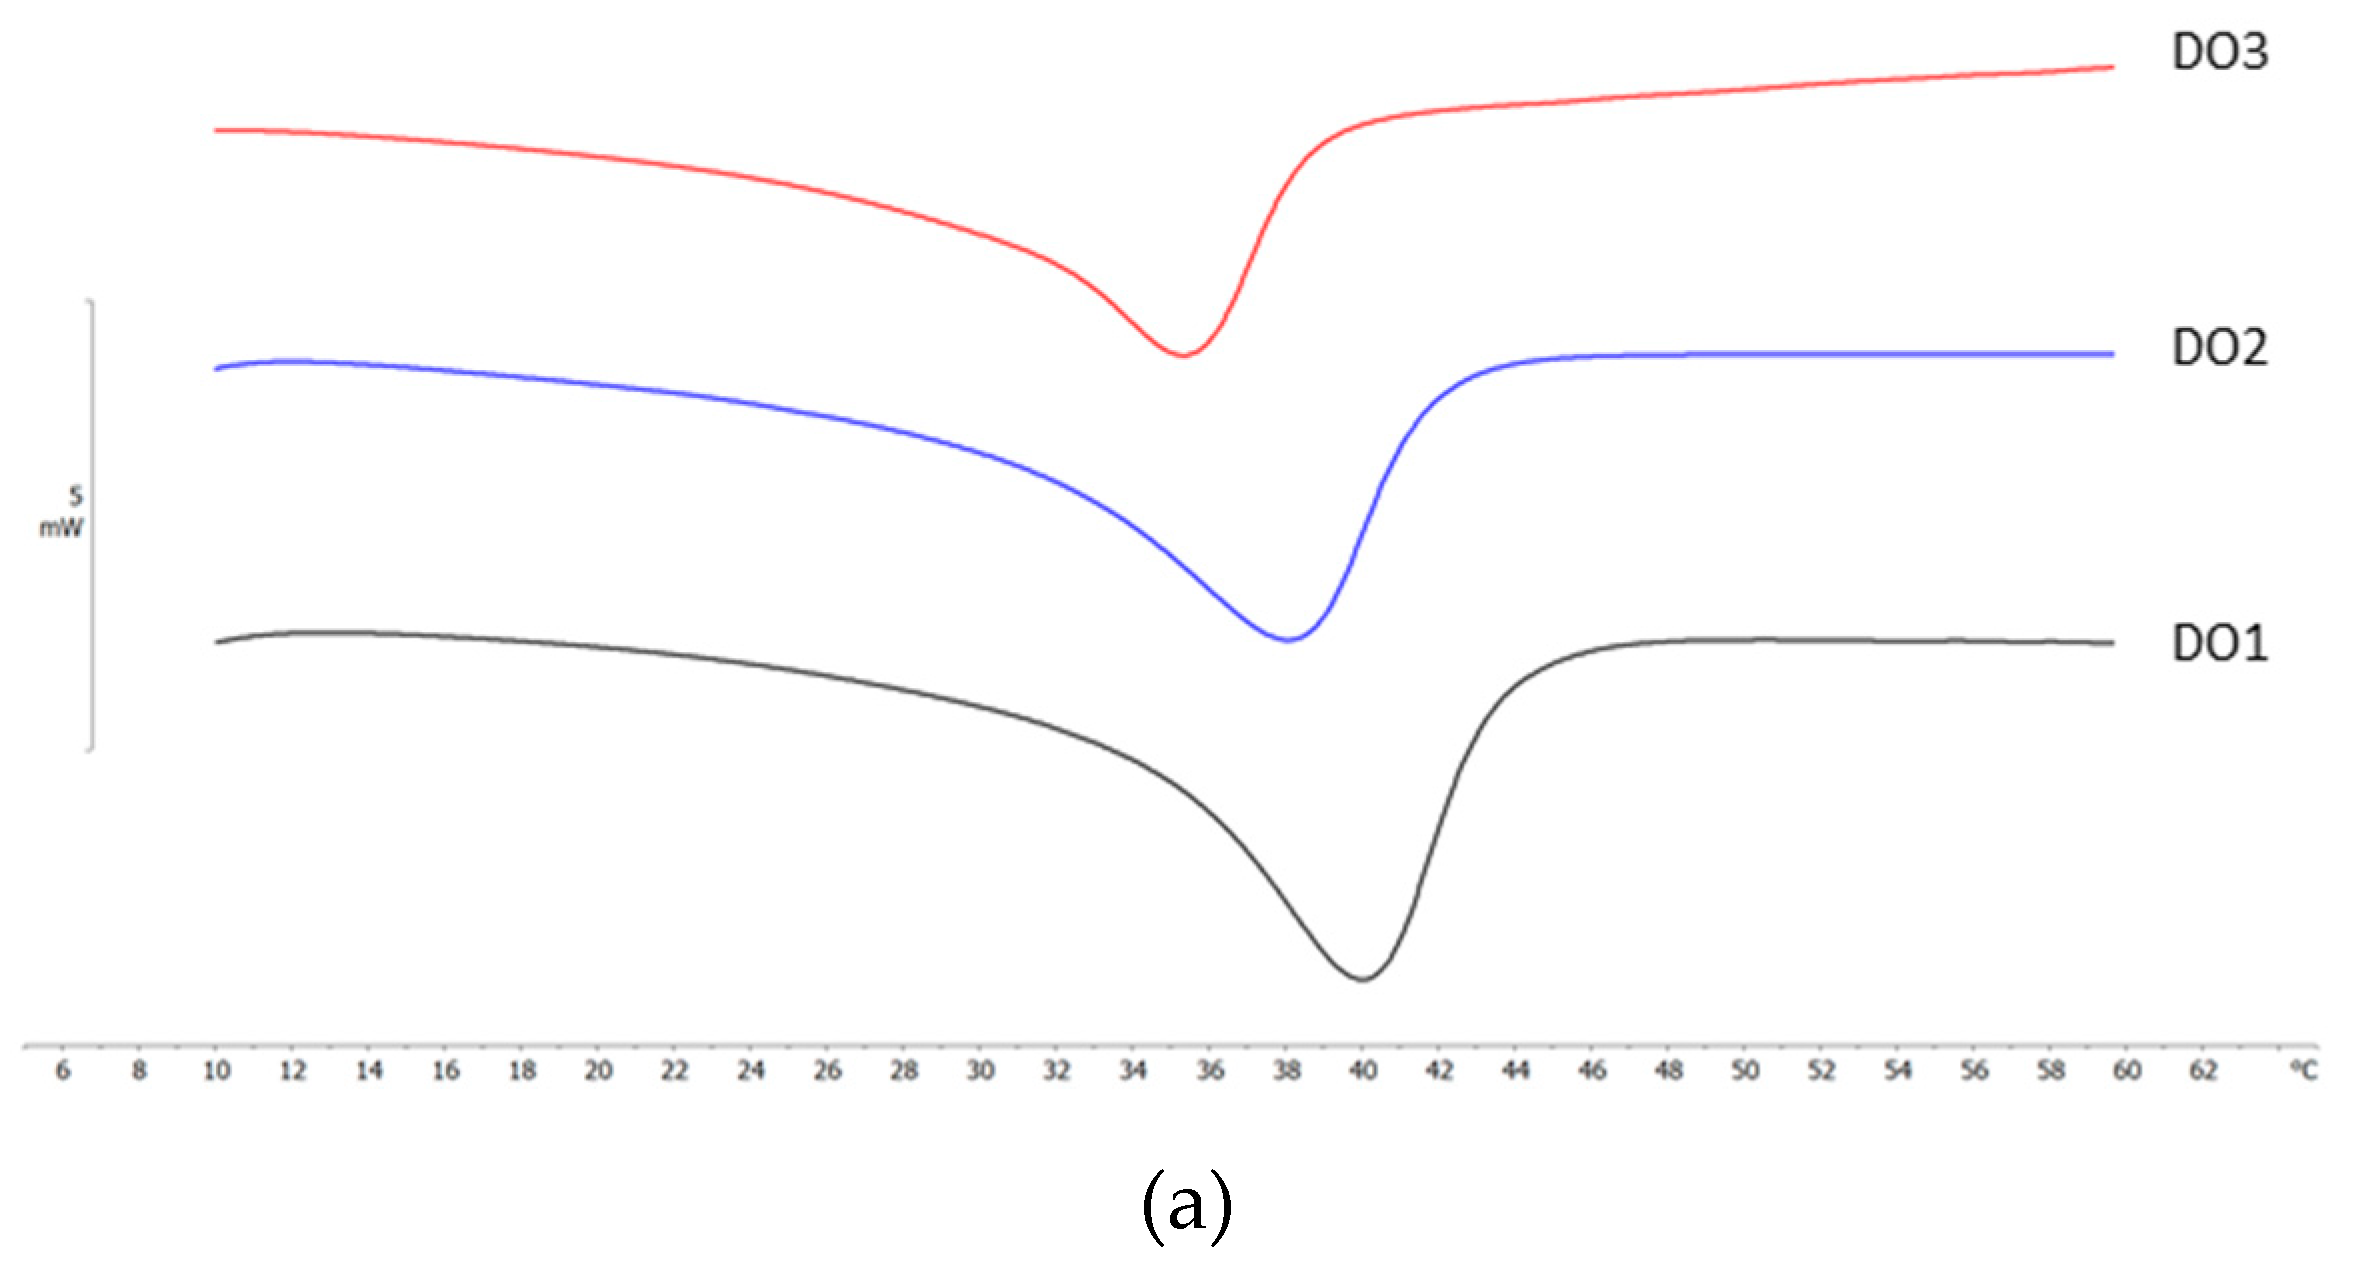
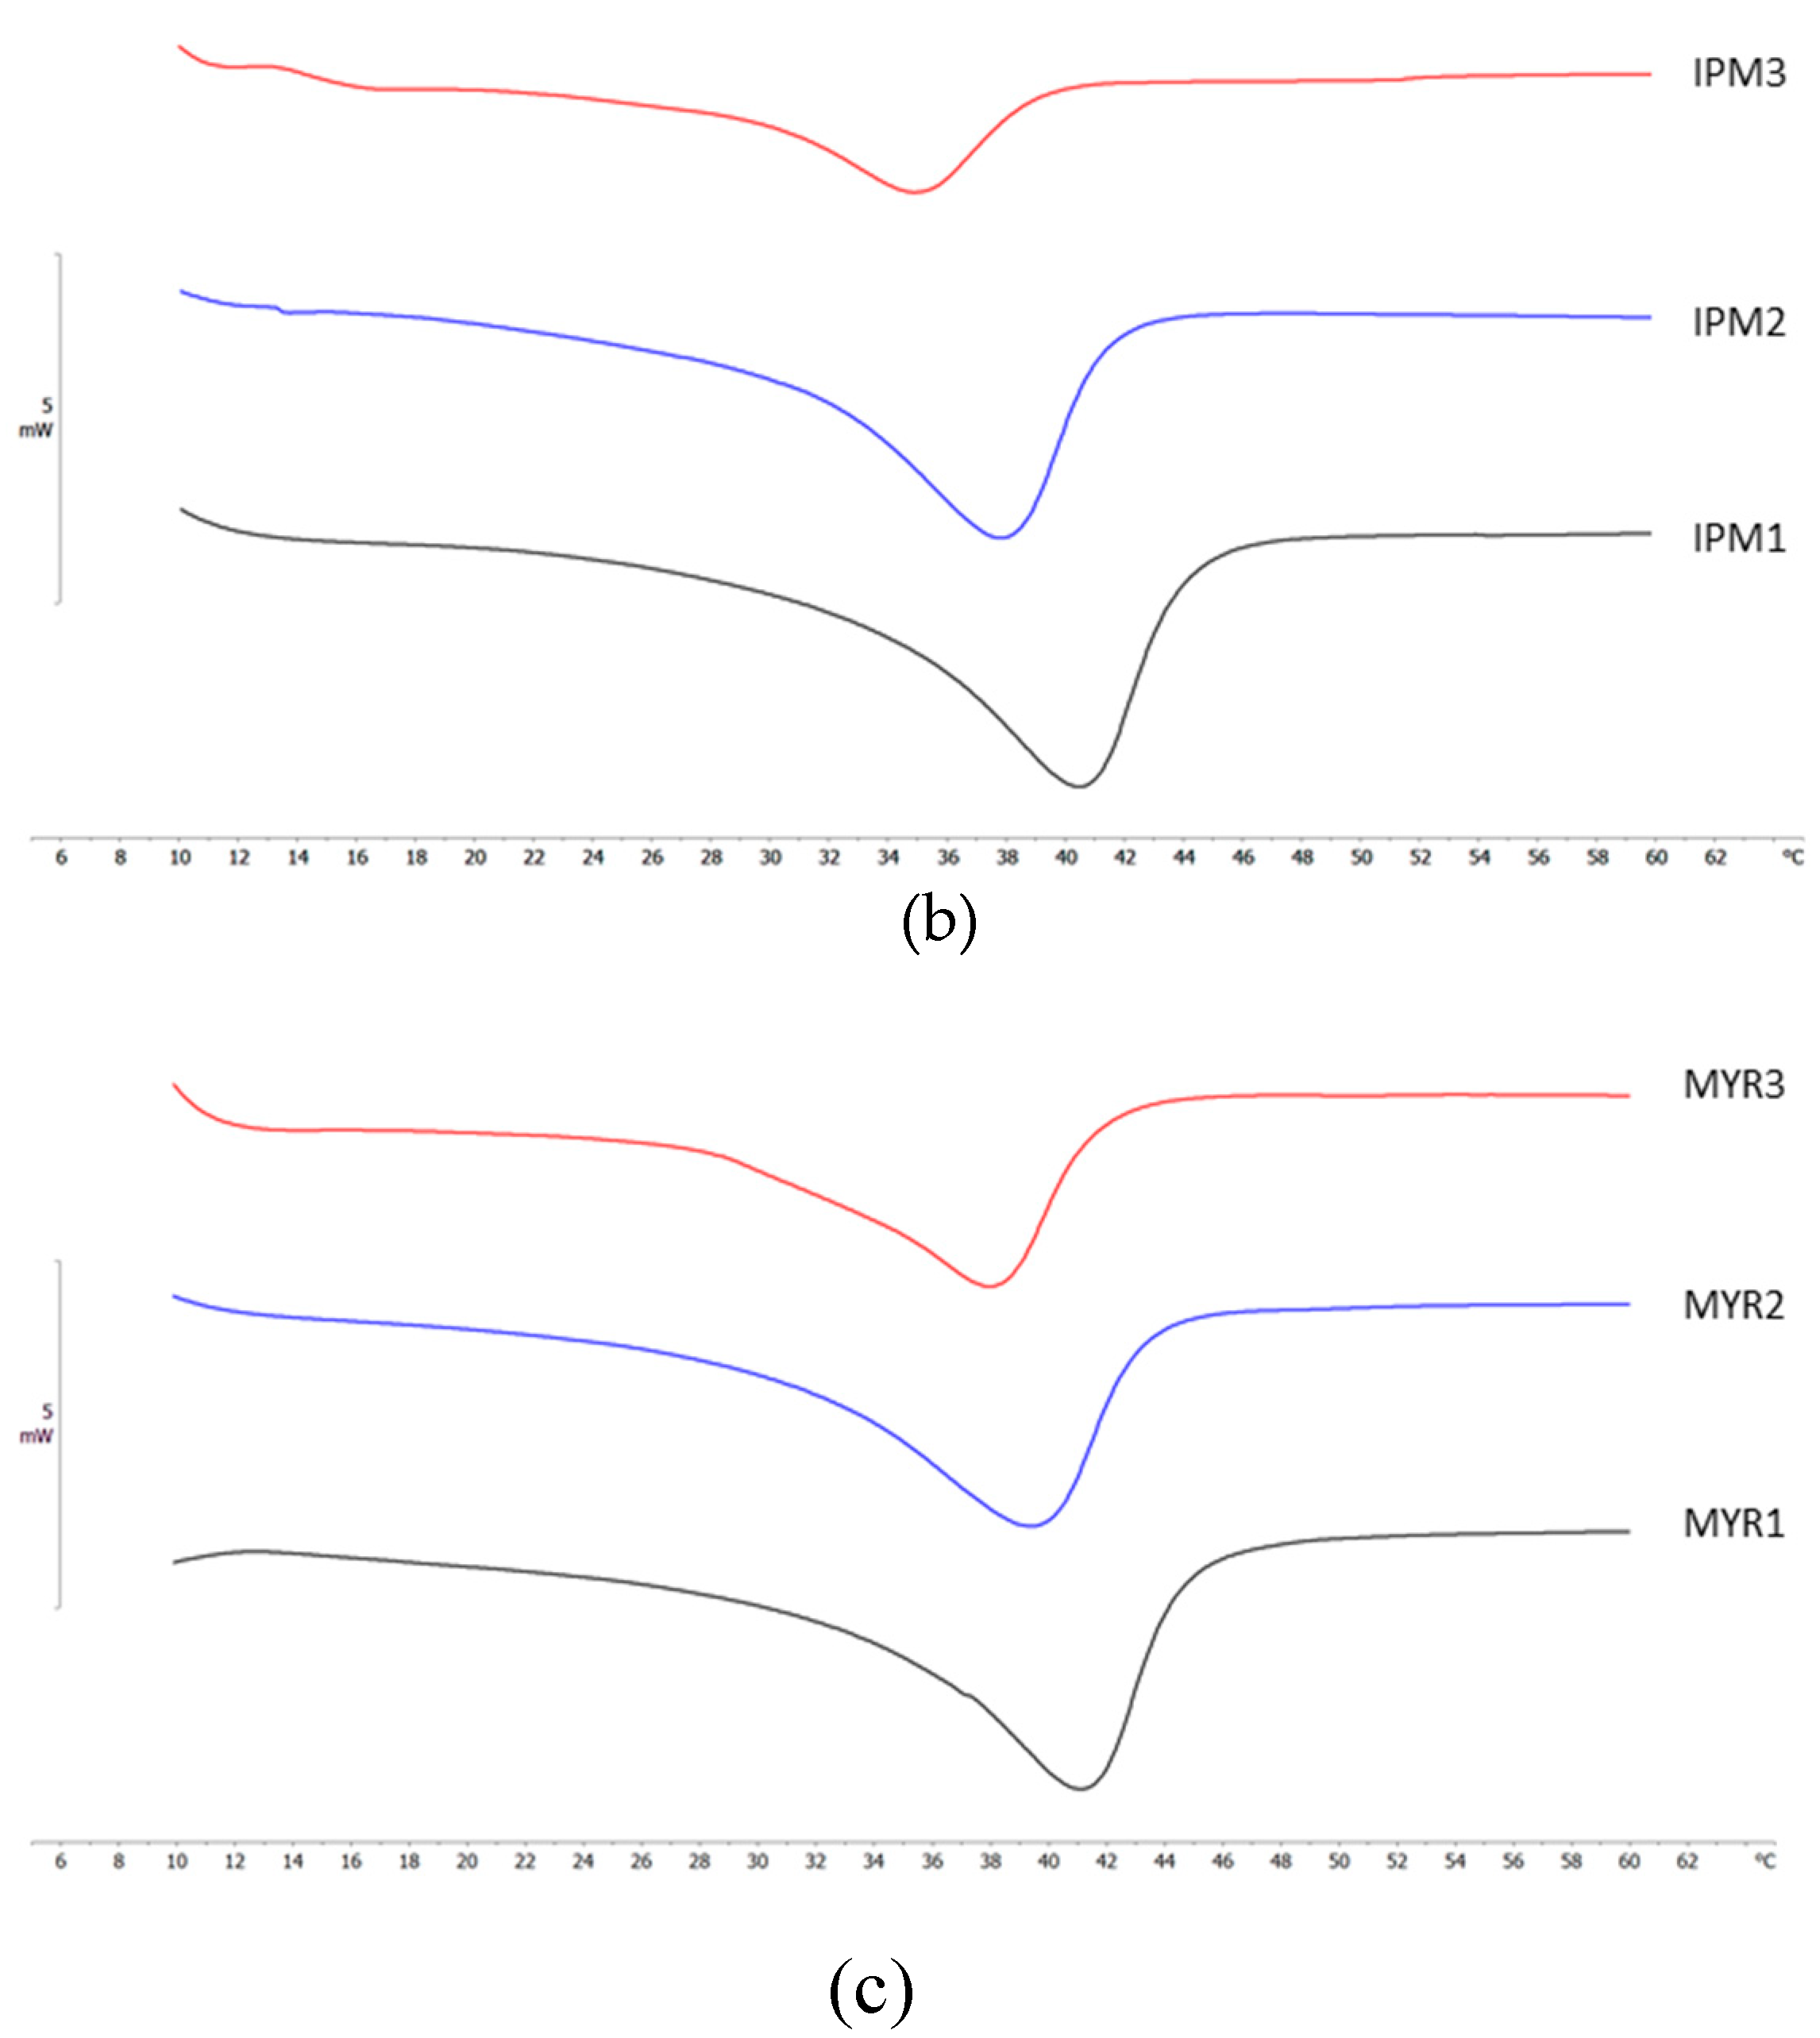
The calorimetric curves of NLC containing different amounts of DO, IPM, and MYR (Figure 2a, 2b, and 2c, respectively) pointed out that the presence of a liquid lipid in the NLC core led to a decrease of both the transition temperature (Tm) and the peak intensity (ΔH) as the percentage of liquid lipid increased. A similar depression of the calorimetric parameters has been already reported by others [41] studying the effects of increasing the concentrations of MYR in the solid lipid core of SLN.
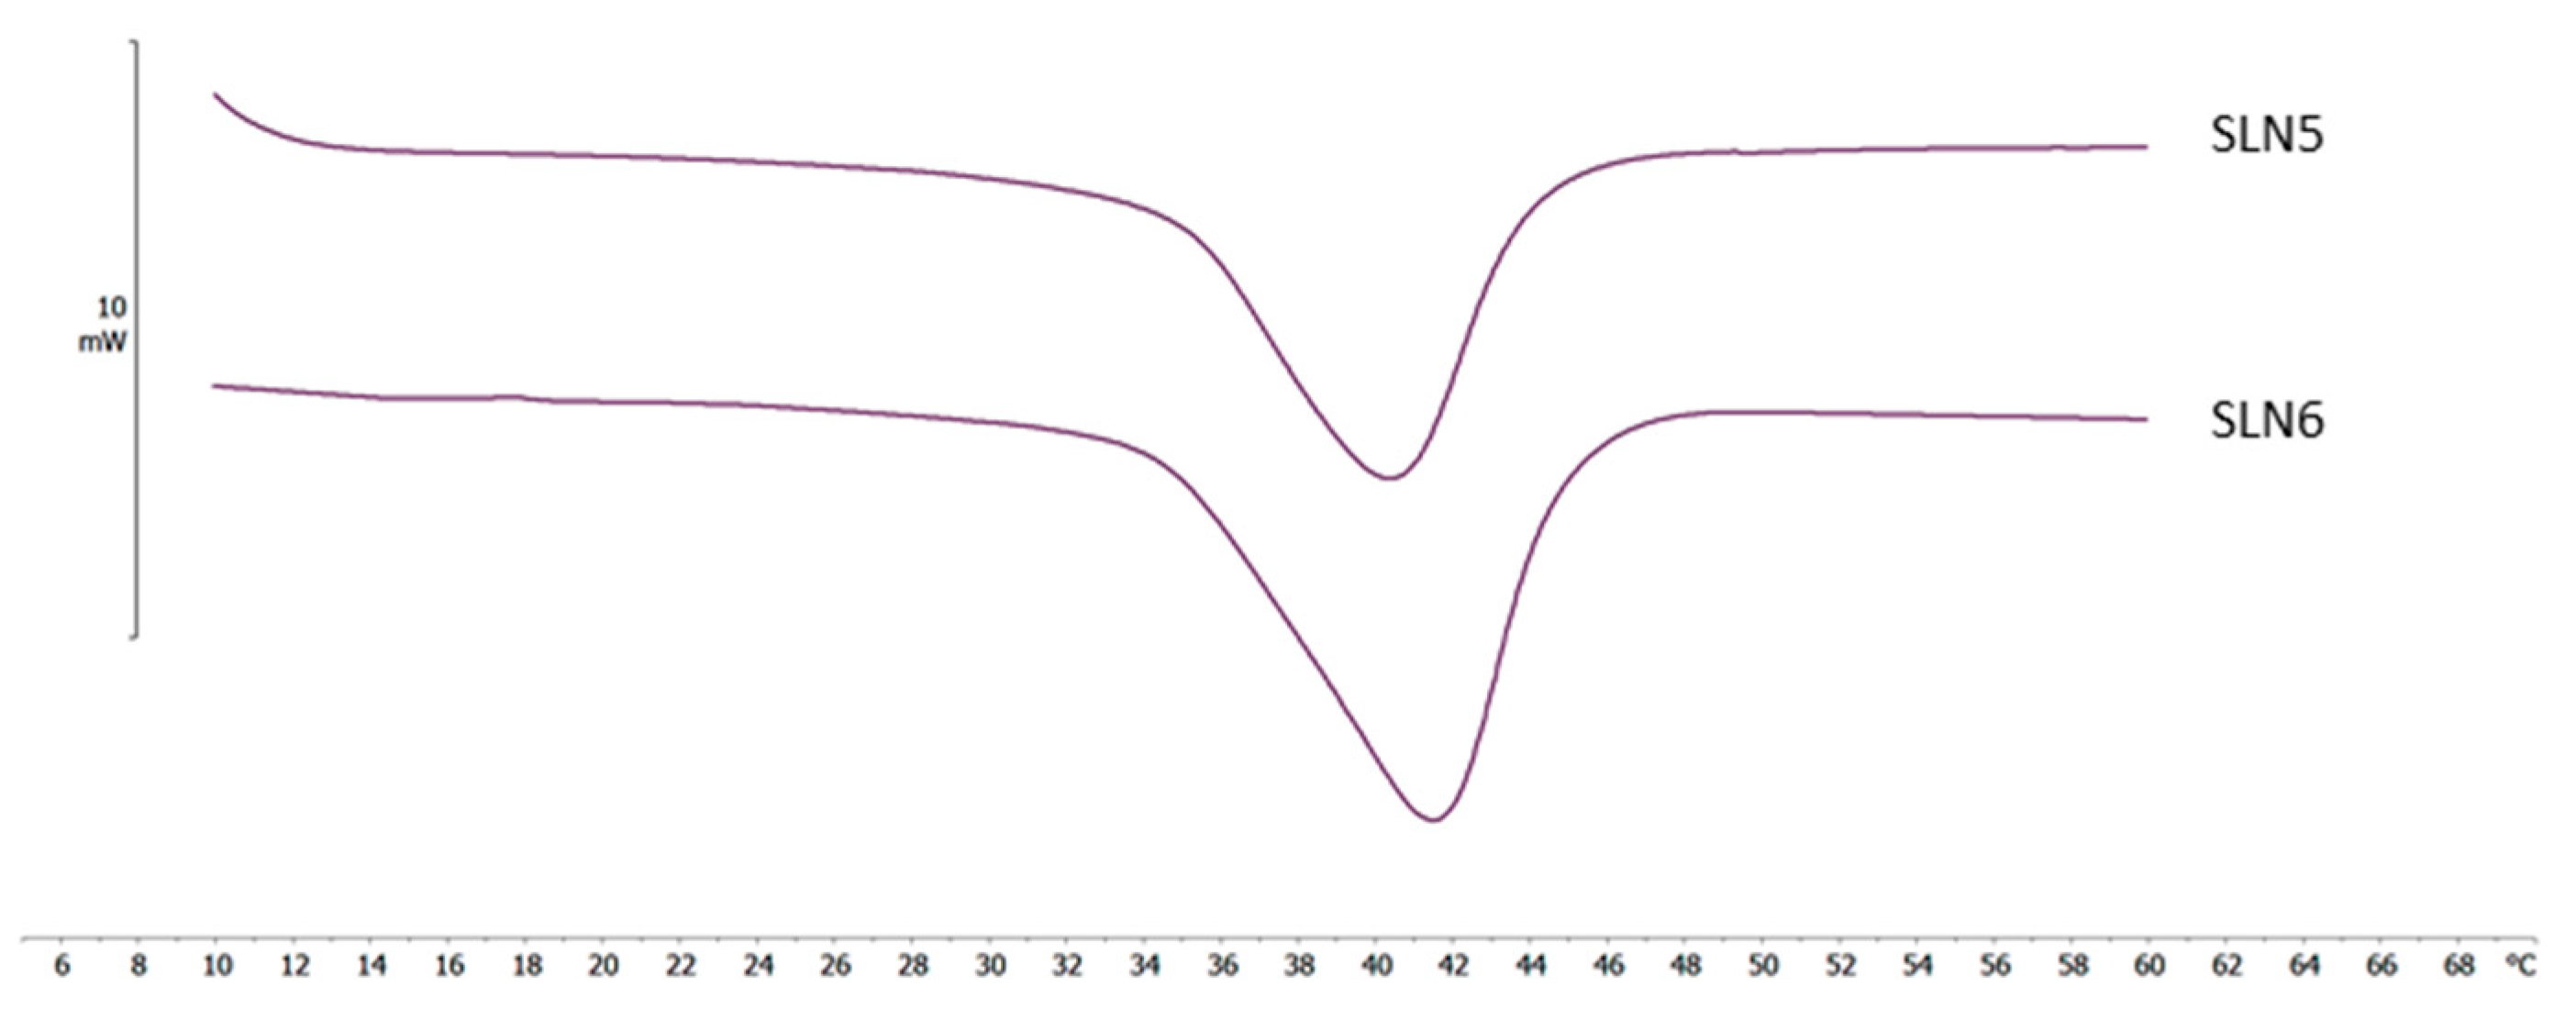
To understand if the decrease of the peak temperature and intensity was due to the lower amount of cetyl palmitate or to the increase of liquid lipid into the NLC core, solid lipid nanoparticles (SLN) containing 6% or 5% w/w cetyl palmitate were prepared (using the same procedure described to obtain unloaded NLC) and analyzed by DSC. Cetyl palmitate amounts lower than 5% w/w were not tested, as they did not lead to SLN formation. As shown in Figure 3, the peak intensity of SLN containing 6% w/w or 5% w/w cetyl palmitate was quite similar but the Tm value of SLN containing 5% cetyl palmitate was smaller than that of SLN containing 6% cetyl palmitate. A reduction of the melting temperature by decreasing the amount of cetyl palmitate in the SLN matrix has already been reported and it has been attributed to a reduced crystallization and a faster transition of the α form into the stable β form after crystallization [42]. However, although the amount of cetyl palmitate used to prepare the lipid nanoparticles affected the transition temperature and the peak intensity, the effect was not as pronounced as that due to the amount of liquid lipid. Therefore, the decrease of ΔH and Tm values seemed to be due mainly to the content of liquid lipid rather than to the amount of solid lipid contained in the lipid core.
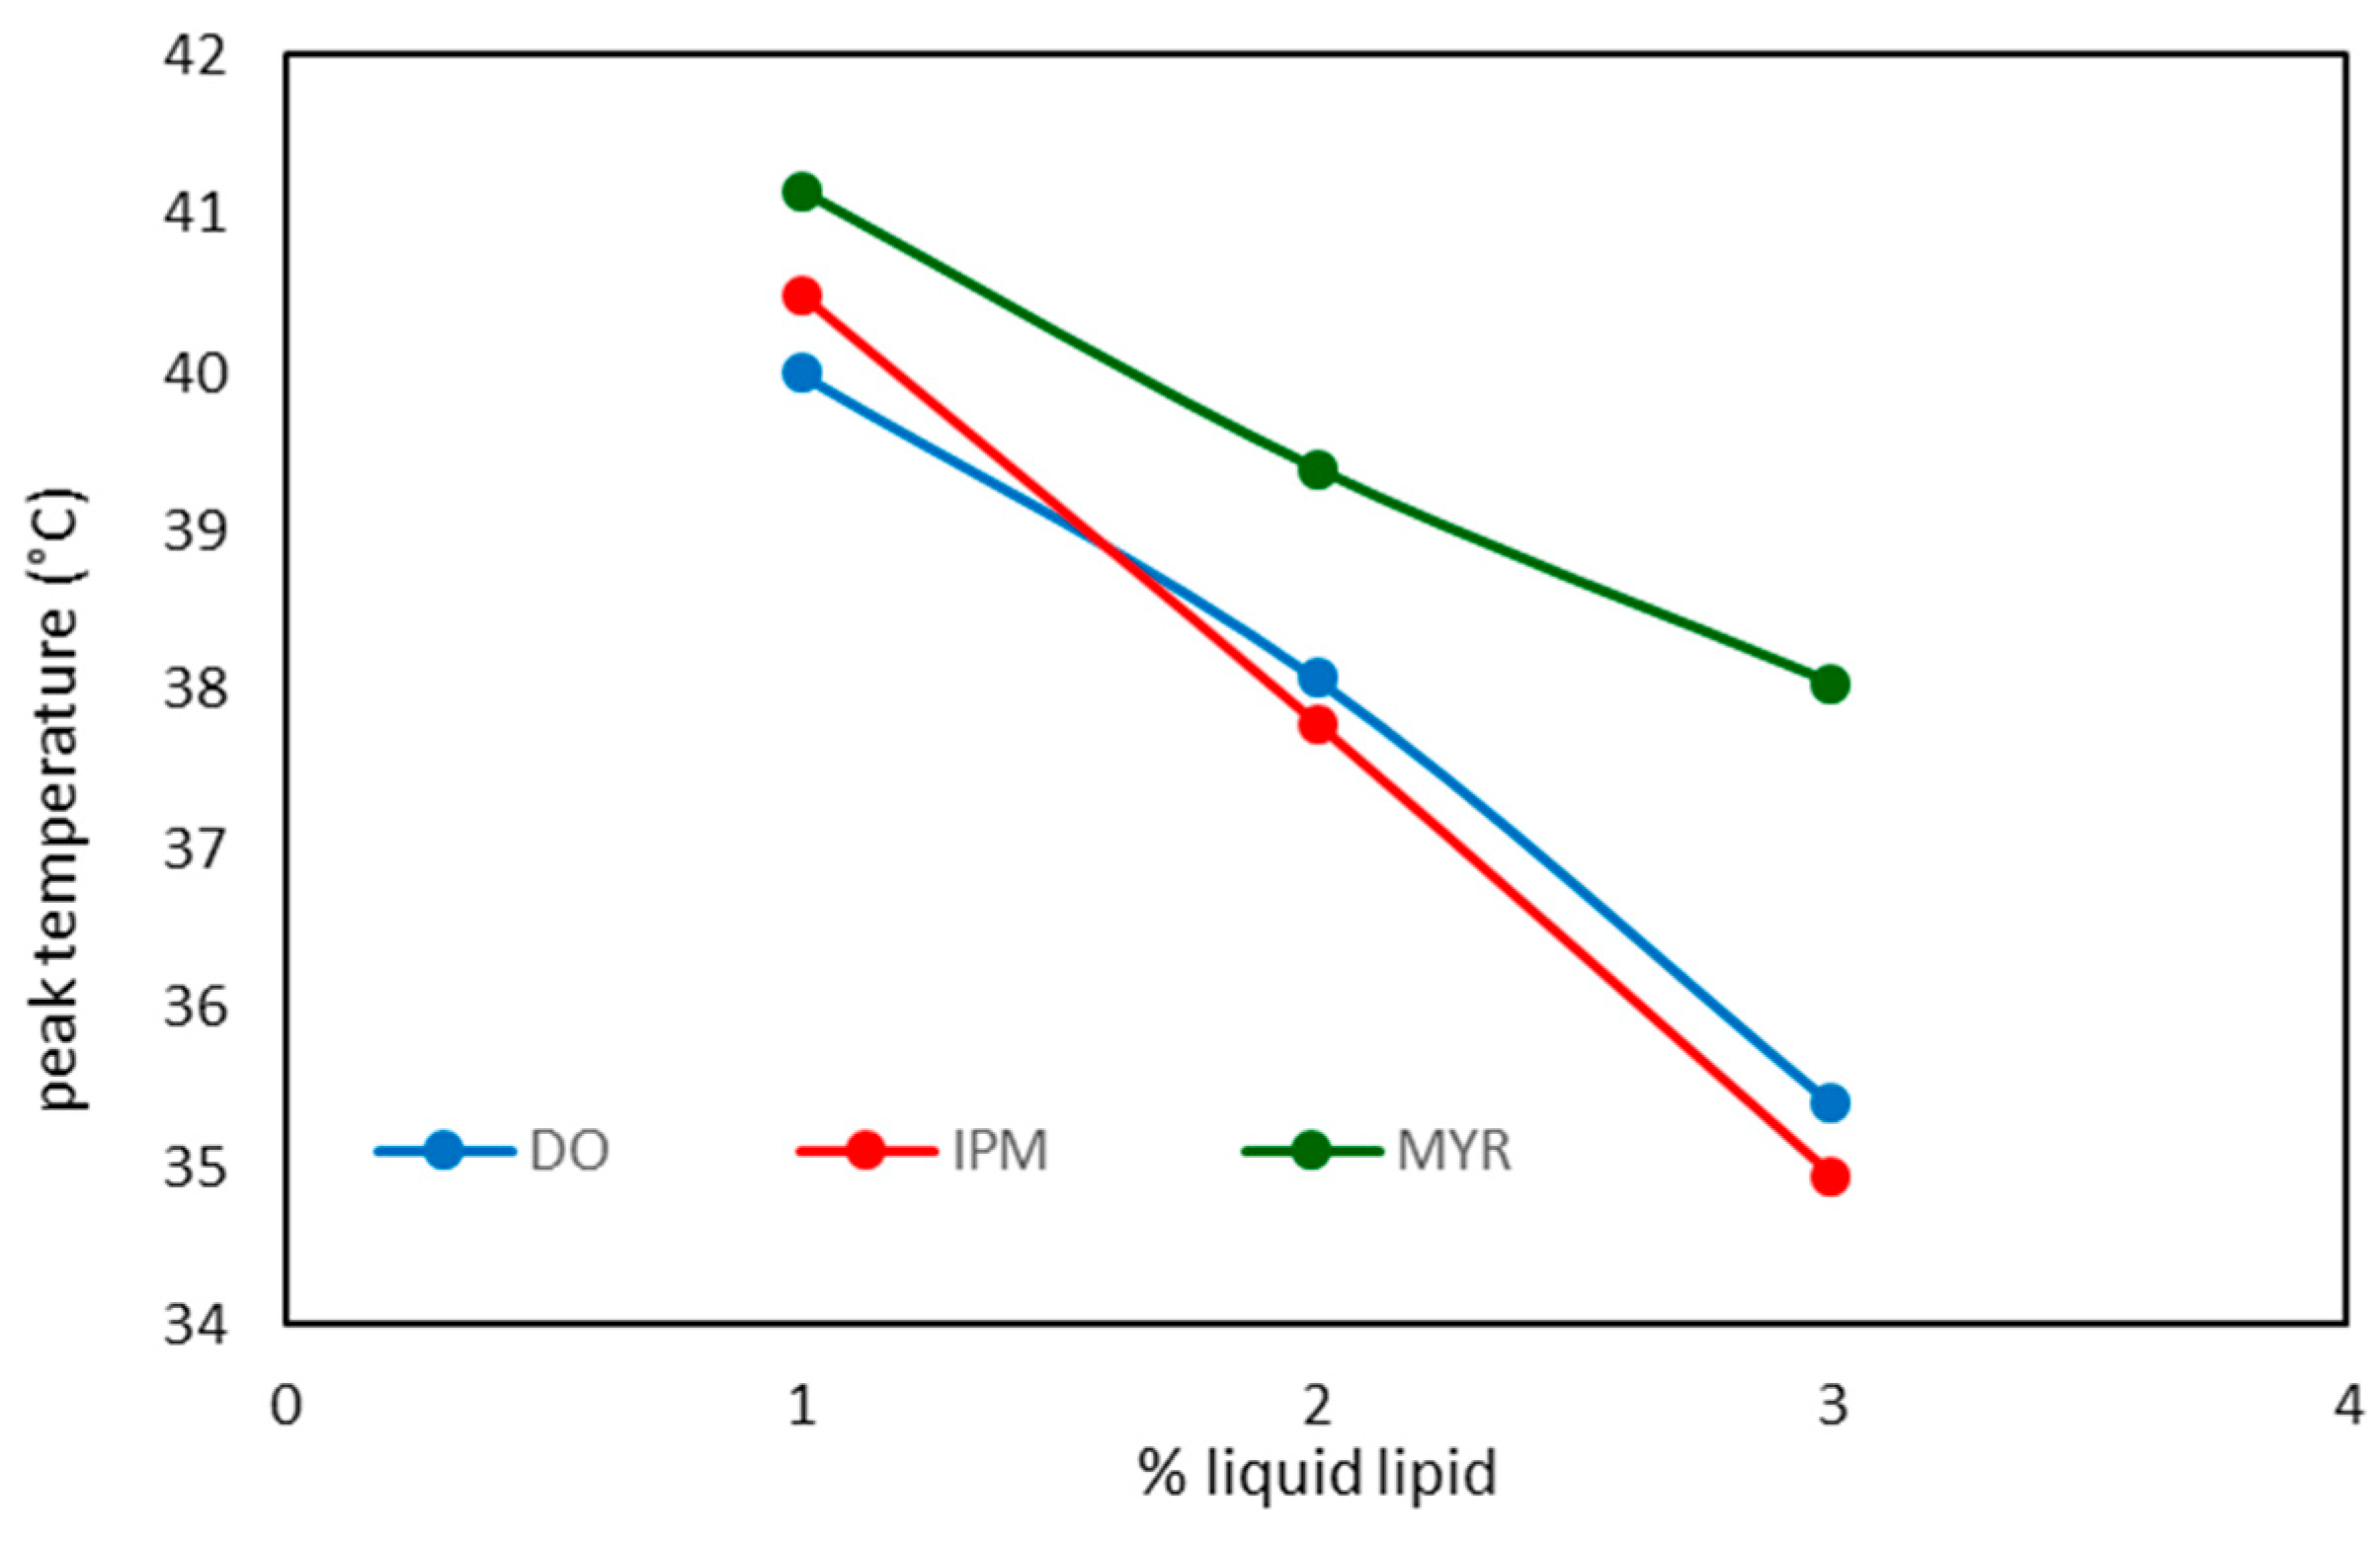
As shown in Figure 4, a pseudo-linear relationship between the transition temperatures of unloaded NLC and the percentage of liquid lipid in the NLC core was observed as the higher the liquid lipid percentage the lower the melting temperature, regardless of the type of liquid lipid used. However, the depression of Tm values due to the increase of liquid lipid content was more pronounced in the NLC containing IPM followed by DO and, then, by MYR.
As mentioned above, during the cooling step of the NLC preparation process, lipids can crystallize in different polymorphic forms (unstable, metastable and stable). In thermodynamically unstable configurations, lipid molecules have higher mobility and higher capability to incorporate drugs. As reported in the literature [27], the enthalpy variation (ΔH) is closely related to the system crystallinity: a reduction of the enthalpy variation indicates a less ordered and, then, less crystalline structure. However, the different type of liquid lipid used could affect the crystallinity of the system. The data illustrated in Table 5 pointed out an inverse correlation between the recrystallization index (RI) and the percentage of liquid lipid in the NLC matrix as an increase of liquid lipid content led to a reduction of RI. This trend was observed for all investigated oils but no relationship was detected between oil lipophilicity and RI values. As a lower NLC matrix crystallinity is thought to allow higher active ingredient loading [27,41], NLC showing the lowest RI values (3% w/w liquid lipid) were chosen to load the sunscreen agent BMTZ. BMTZ-loaded NLC were coded according to the following criteria: for NLC containing isopropyl myristate, the code I was used; for NLC containing caprilic/capric triglyceride, the code M was used; for NLC containing decyl oleate, the code D was used; NLC containing 1%, 3%, 5% and 7% w/w BMTZ were coded as BMTZ1, BMTZ3, BMTZ5 and BMTZ7, respectively.
As shown in Table 6, raising the percentage of BMTZ incorporated into the NLC the mean size of the nanoparticles increased, regardless of the type of liquid lipid used to prepare the colloidal carriers. All BMTZ-loaded NLC showed PDI values lower than 0.300, thus pointing out that such colloidal systems were monodispersed.
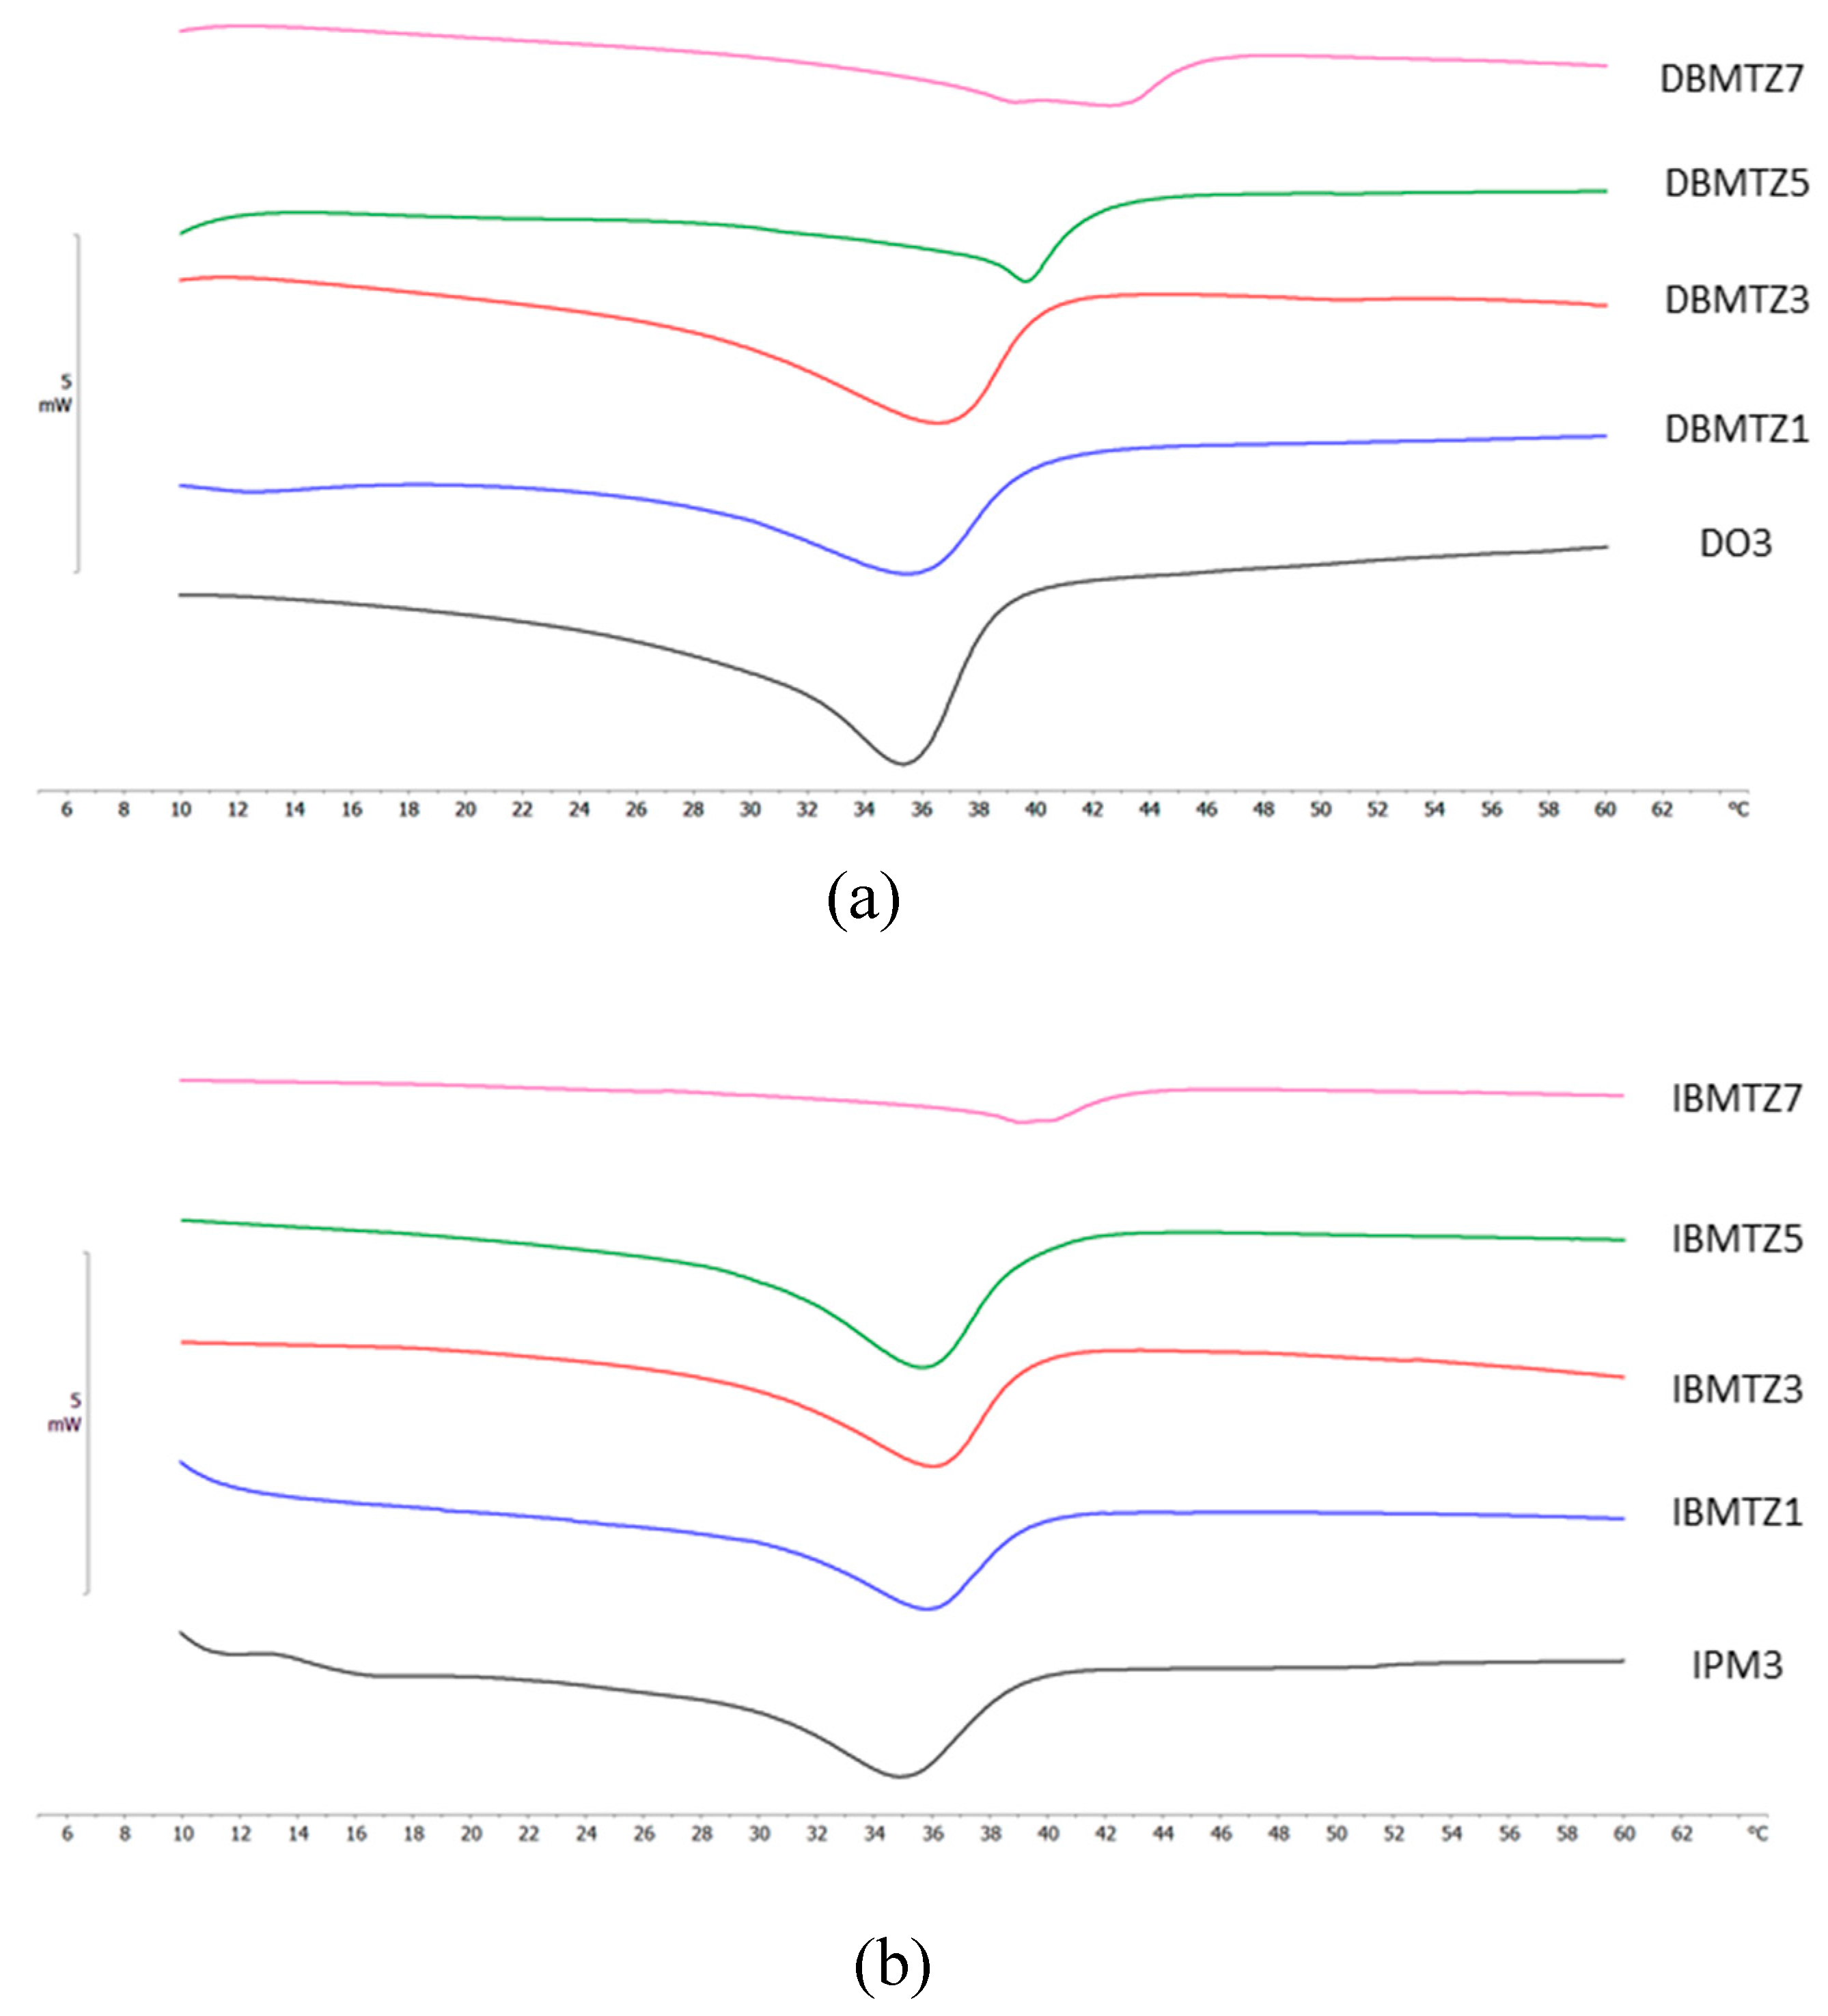
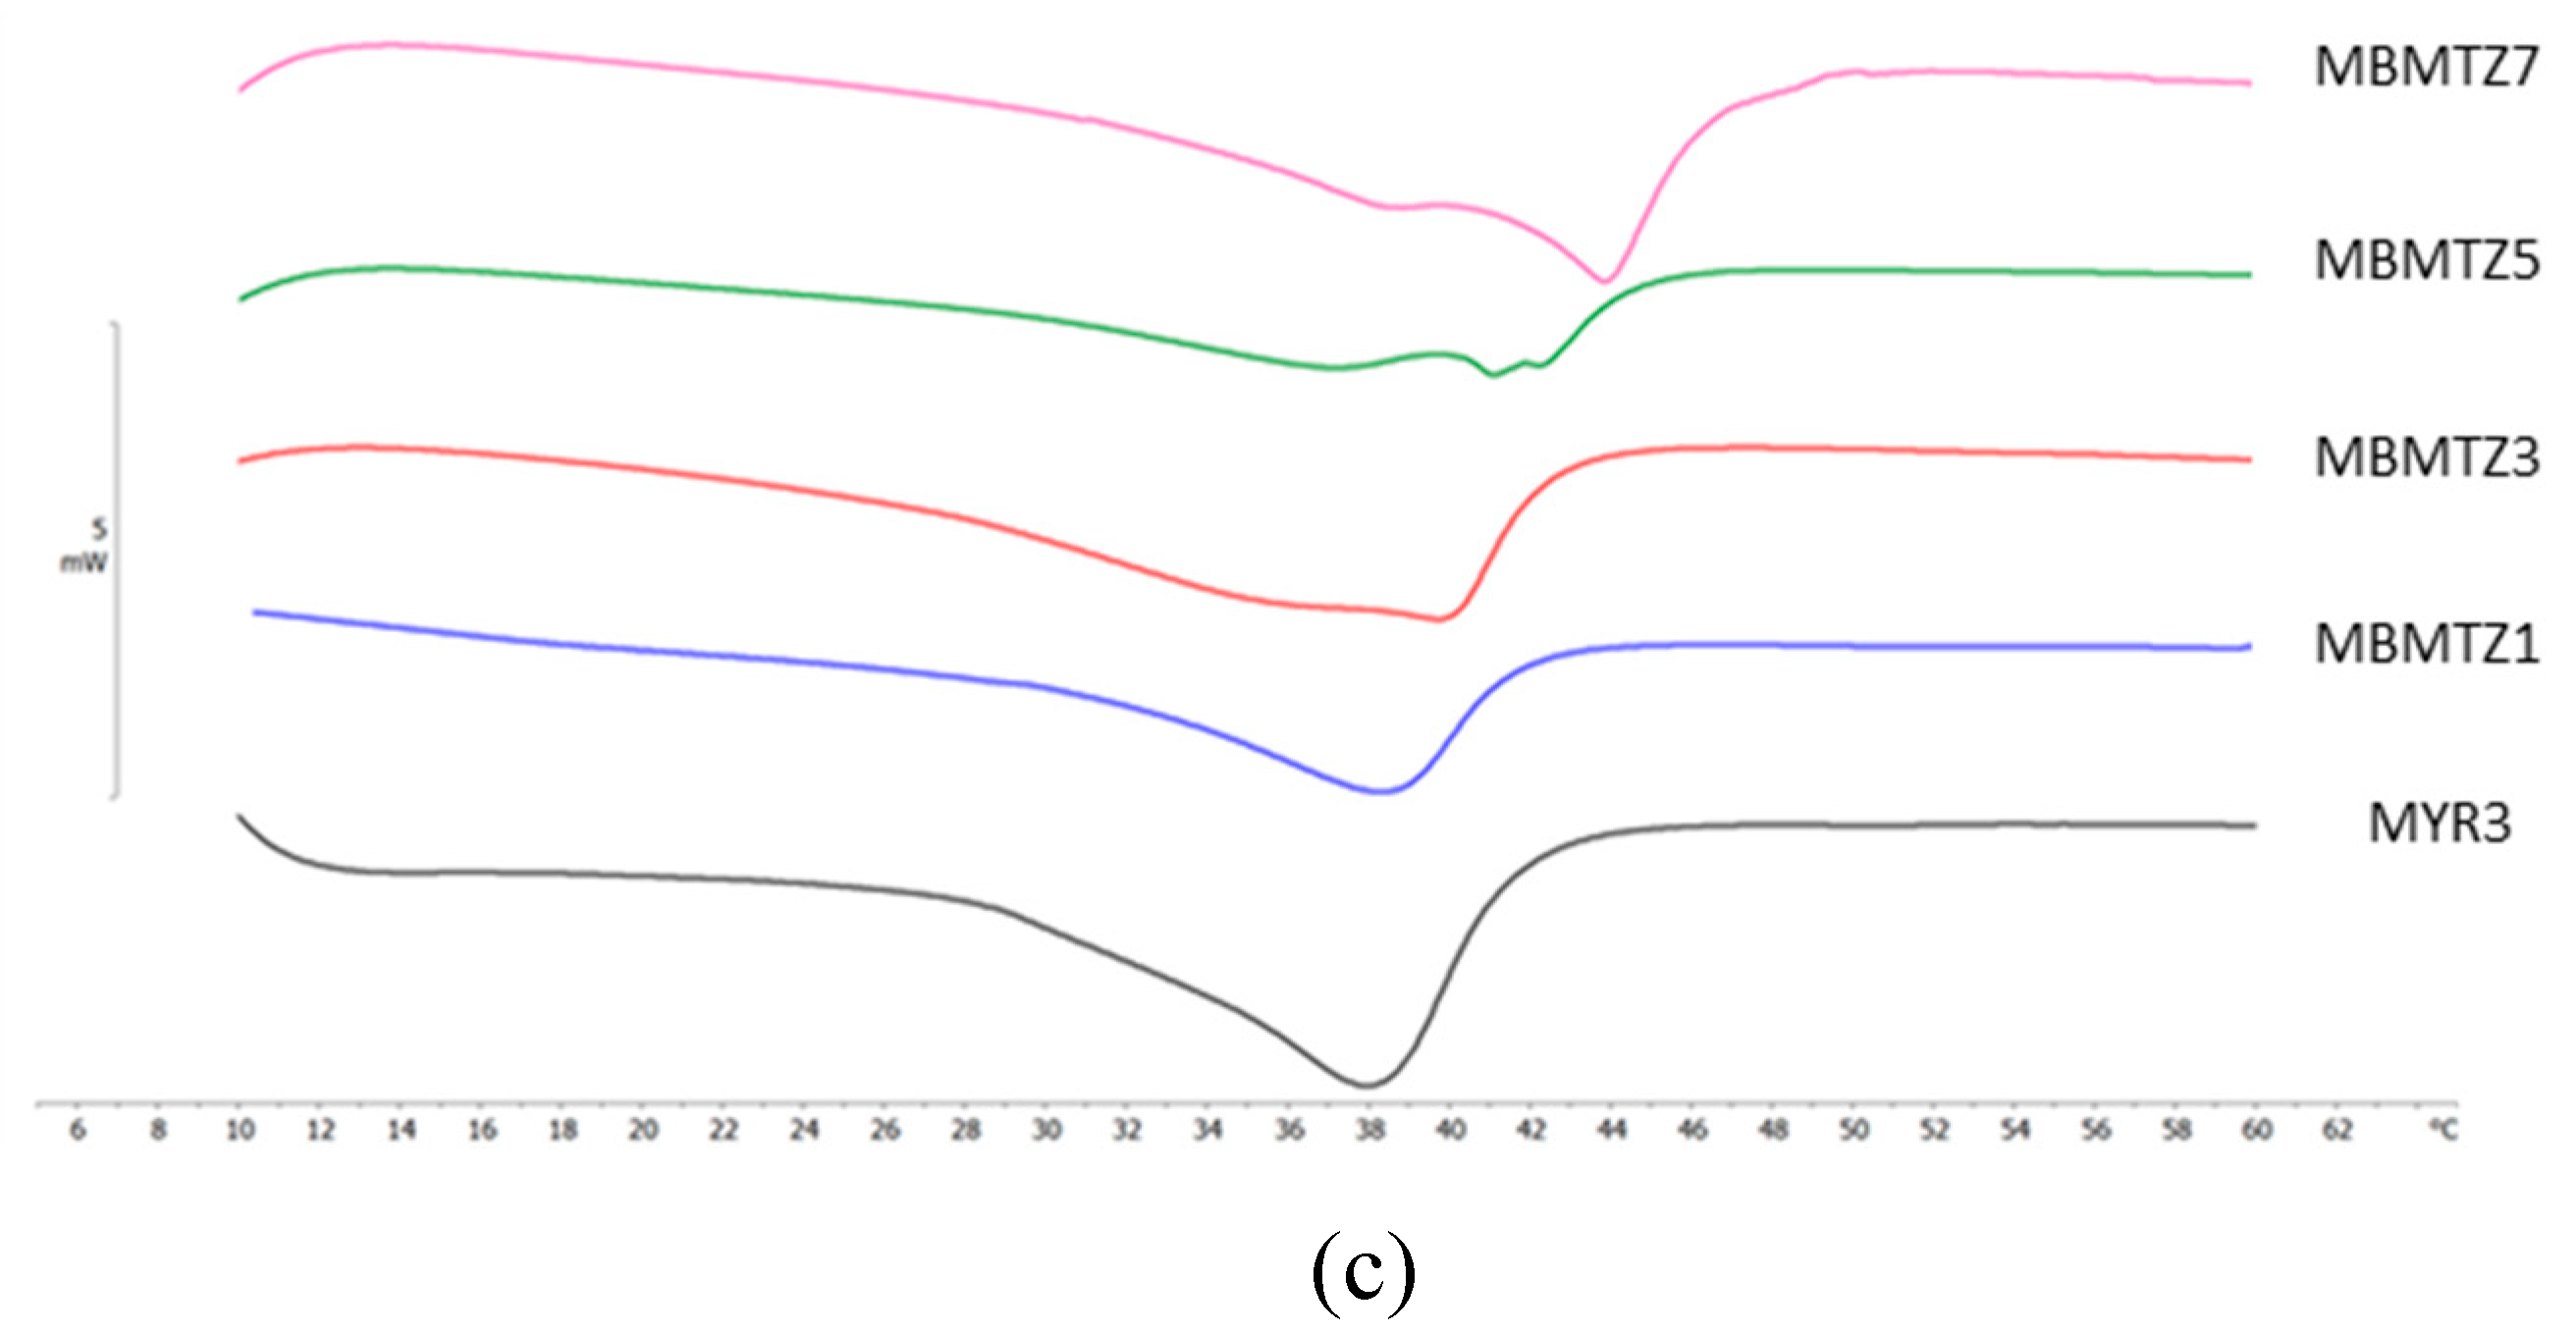
Calorimetric curves of NLC containing 3% w/w of liquid lipid and different percentages of BMTZ are depicted in Figure 5a-c. The incorporation of BMTZ into NLC affected the thermal behavior of the resulting colloidal systems depending on the type of liquid lipid used.
Regarding NLC prepared using DO as oil, a shift of the calorimetric peak towards higher temperatures was observed as the amount of BMTZ loaded into the NLC increased (Figure 5a). It is noteworthy that at low percentage of BMTZ (1-3 % w/w) a single peak was present; at 5% w/w BMTZ the main peak was preceded by a large shoulder while at 7% BMTZ, two distinct peaks were observed. This behavior suggests that BMTZ, up a certain amount, distributed uniformly into the NLC structure, whereas at high amount, regions rich in compound and regions poor in compound coexisted in the NLC structure, as indicated by the presence of two peaks.
Using IPM as liquid lipid, the incorporation of BMTZ up to 5% w/w led to small variations of the peak temperature and shape while at 7% w/w the calorimetric peak shifted to higher temperatures and its intensity decreased (Figure 5b). The presence of a single peak suggests that BMTZ locates uniformly in the NLC structure up to 5%. At higher amount, BMTZ does not distribute uniformly in the NLC matrix, as suggested by the presence of two peaks in the calorimetric curve.
The effect of loading BMTZ into NLC prepared using MYR was strongly dependent on the percentage of BMTZ (Figure 5c). The incorporation of BMTZ 1% w/w resulted in a slight increase of Tm and a lowering of ΔH. BMTZ 3% w/w led to the shift of the main peak to higher temperatures and the presence of a large shoulder at a temperature lower than that of the main peak. In the presence of BMTZ 5% w/w, the shoulder became a well-defined peak and the main peak split into two peaks, both at higher temperatures. When BMTZ was loaded at 7% w/w, all peaks moved to higher temperatures, the central peak became the main one whereas the right peak decreased turning into a shoulder. This behavior suggested a different location of BMTZ into the core of NLC prepared using MYR depending on the percentage of BMTZ loaded.
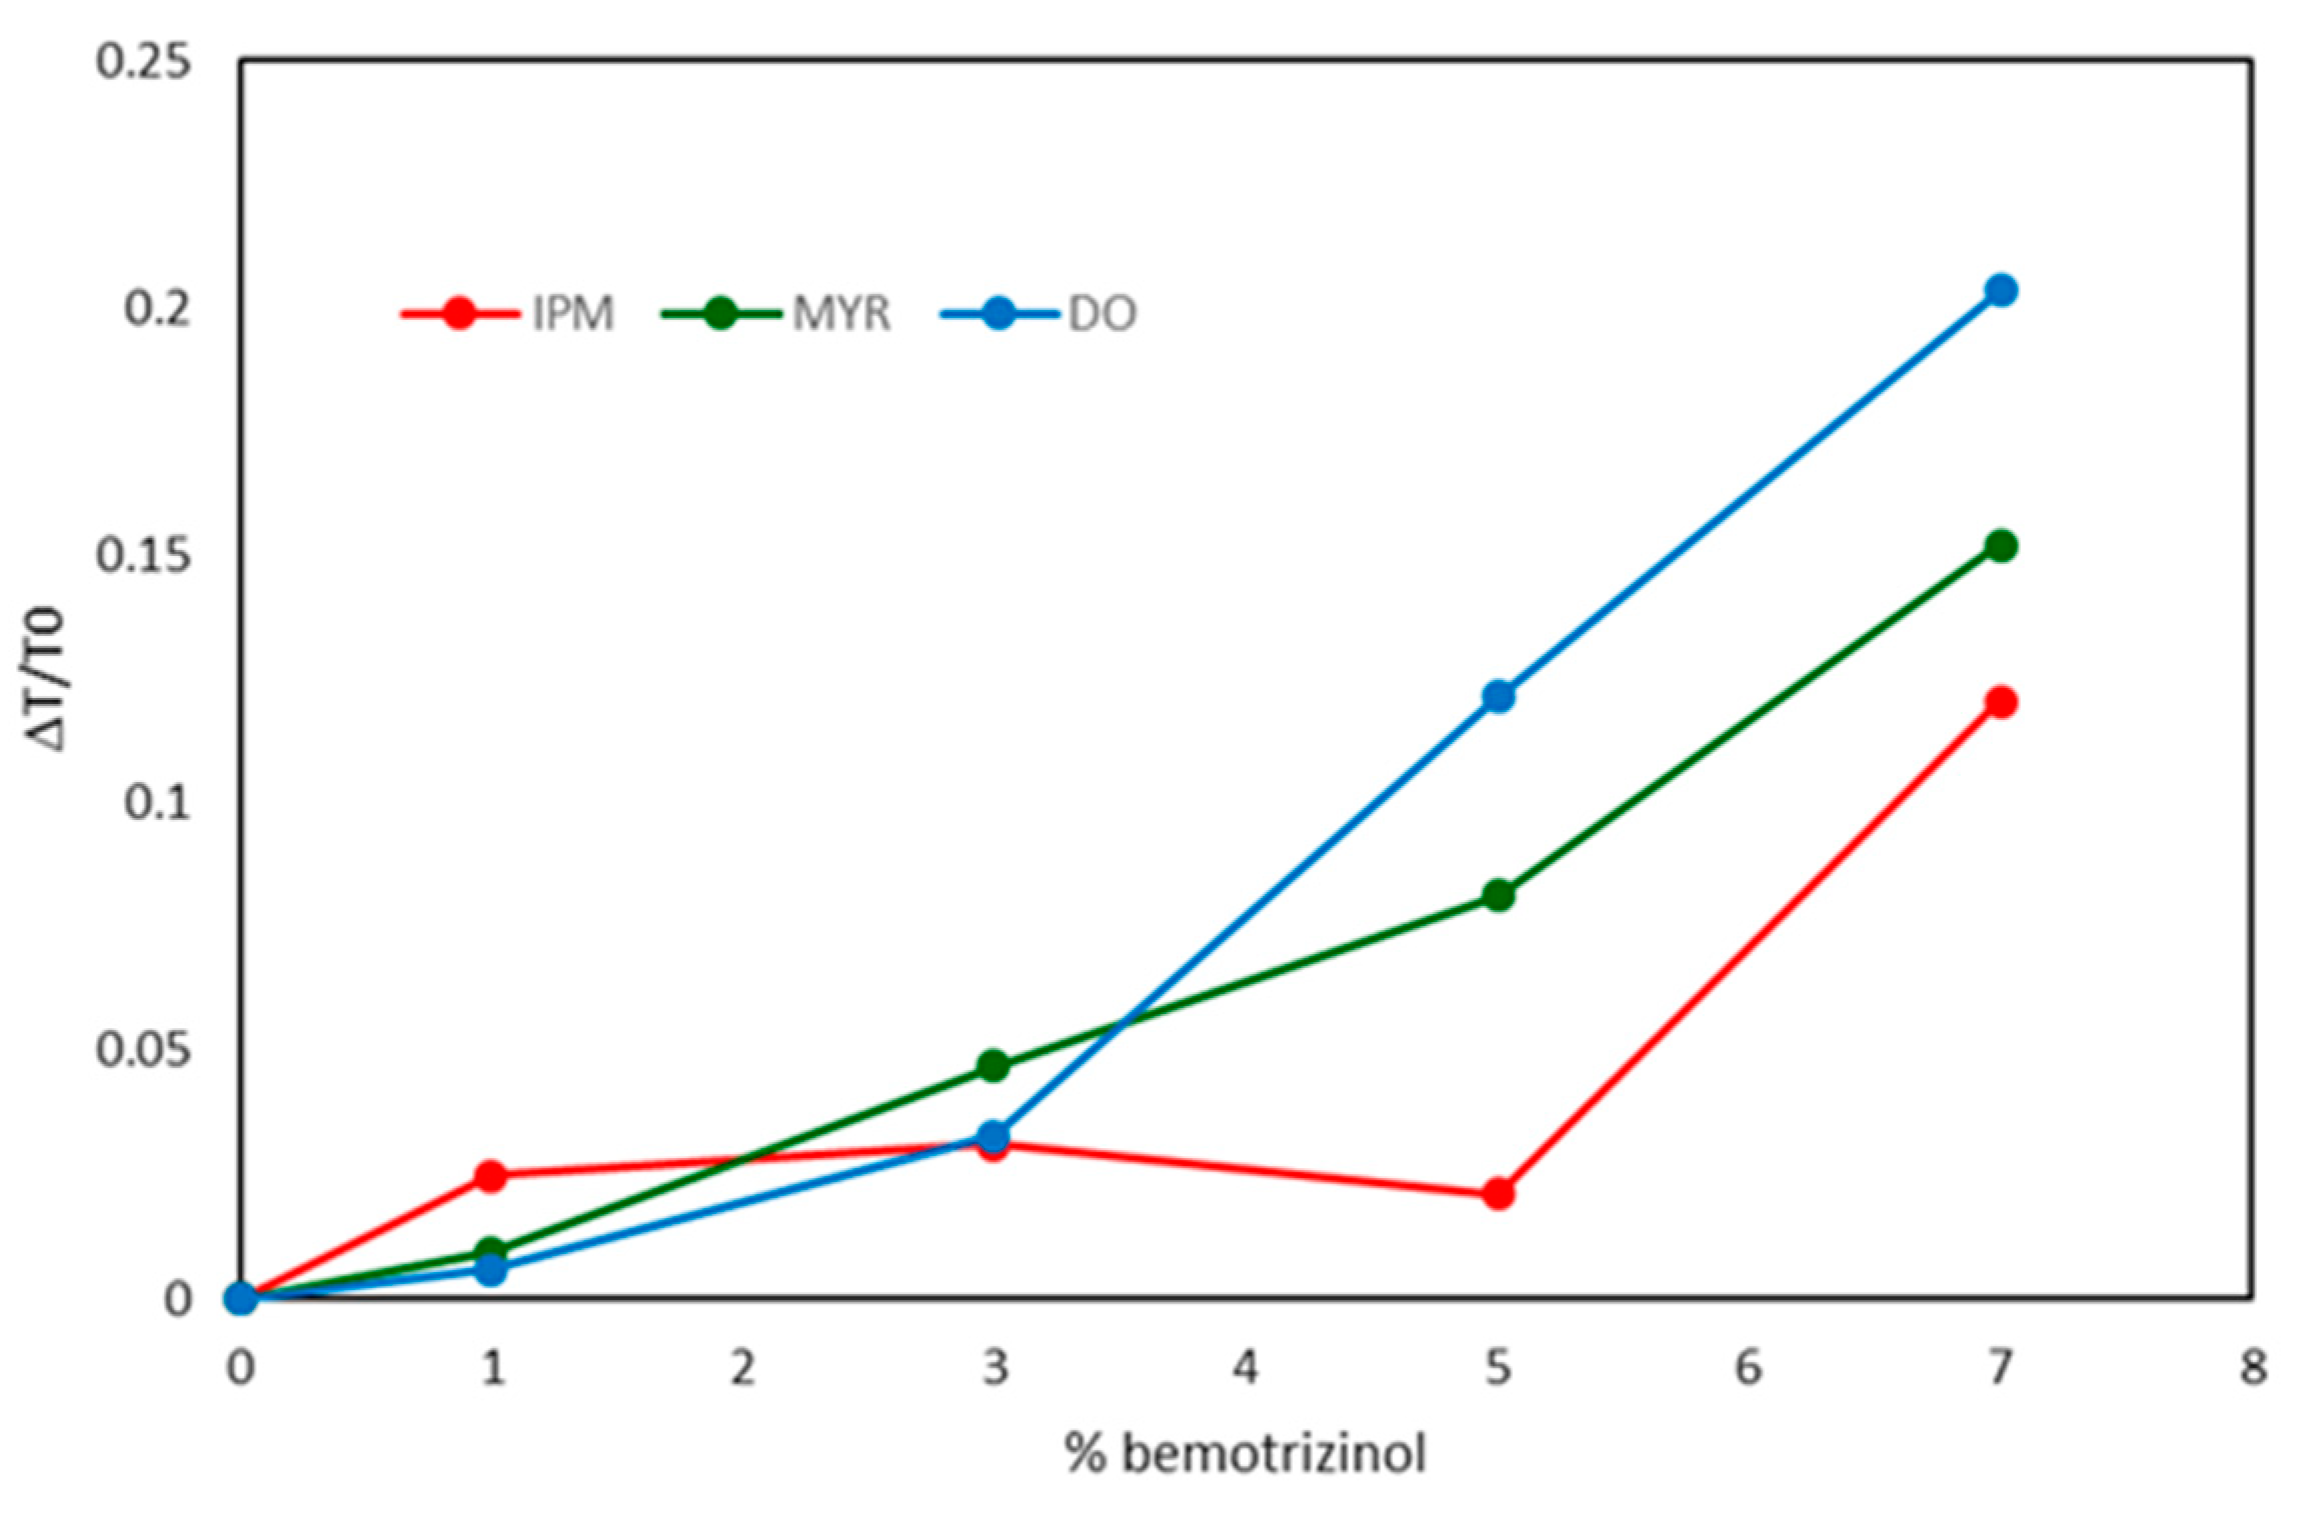
Plotting the temperature variation of the NLC main peak as a function of the percentage of BMTZ loaded into the NLC, a different pattern was observed depending on BMTZ concentration (Figure 6). At low BMTZ percentages (1-3 % w/w), no appreciable difference was observed among the oils used to prepare NLC while for NLC containing BMTZ 5-7% w/w the temperature increase of the mean peak was strongly dependent on the type of liquid lipid. The enthalpy variation (ΔH) and the percentage of recrystallization index (RI %) of NLC containing different percentages of BMTZ are listed in Table 7.
From the calorimetric data, some hypotheses about the localization of BMTZ into the NLC structure could be put forward. In NLC containing DO, the variation of the peak temperature and RI % values suggest that BMTZ probably located preferentially in the solid lipid causing a stabilization of the ordered phase and a decrease of the crystallinity. When IPM was used to prepare NLC, both the peak temperature and the crystallinity index remained almost unaltered up to BMTZ 5% loading; this behavior could indicate that BMTZ preferentially locates among the liquid lipid molecules leaving unaltered the solid lipid. At 7%, BMTZ could locate in the liquid lipid as well as in the solid lipid. As far as NLC containing MYR are concerned, multi-peaks calorimetric curves, which were characterized by a temperature increase and a fluctuating crystallinity index, were observed; therefore, BMTZ could locate preferentially in the solid lipid in a not uniform way producing the stabilization of the ordered phase. The different distribution of BMTZ in the NLC core could affect both the stability and the loading capacity of the nano-carriers.
ζ-potential is regarded as a predictive parameter of the stability of colloidal systems. In particular, ζ-potential values greater than 30 mV, as absolute value, are thought to be required to obtain stable colloidal suspensions [43]. As shown in Table 6, all BMTZ-loaded NLC had ζ-potential values close to -10 mV, thus suggesting poor stability of such colloidal carriers during storage. Stability studies pointed out that using DO or MYR as liquid lipid to prepare BMTZ-loaded NLC, a precipitate started forming one week after their preparation when BMTZ percentages greater than 3% w/w were loaded while at lower BMTZ loading the NLC remained clear up to two months of storage. The use of IPM allowed obtaining BMTZ-loaded NLC that did not show any sign of precipitate after two months of storage at room temperature for all BMTZ percentages loaded into NLC. No significant change of mean size, PDI and ζ-potential values was observed for BMTZ-loaded NLC that remained clear after two months of storage (data not shown). Previous studies on lipid nanoparticles prepared using the PIT method highlighted a good nano-carrier stability despite of ζ-potential values lower than 30 mV [4,26]. According to Stokes’ law, another factor that could contribute to colloidal suspension stability was the particle size. However, the difference in particle sizes of the NLC under investigation could not account for the storage stability observed as BMTZ-loaded NLC having close sizes (e.g. IBMTZ7, MBMTZ5 and DBMTZ5) showed different stability. In a previous work [25], the good stability of NLC with ζ-potential values lower than 30 mV was attributed to a steric stabilization provided by the long polyoxyethylene chains of the surfactant oleth-20 located on the nanoparticle surface. In addition to a likely steric stabilization, the results of the present study suggest that the different distribution of the active ingredient in the lipid matrix, highlighted by DSC data, may play a significant role in determining the stability of the nanoparticle suspension.
As NLC containing IPM proved stable at the highest percentage of BMTZ incorporation, this type of NLC was chosen to evaluate BMTZ loading capacity. Such parameter was determined as the maximum amount of BMTZ that could be incorporated leading to a colloidal suspension with no sign of precipitation, as already reported for other active ingredients [26,41]. When BMTZ was incorporated into NLC prepared using IPM 3.0% w/w, a loading capacity as high as 8% w/w was achieved. As these nanoparticles showed mean size (190.6 ± 9.8 nm), PDI (0.153 ± 0.013) and ζ-potential value (-10.6 ± 1.7 mV) suitable for the development of topical formulations, such NLC were incorporated into O/W emulsions. The same formulations containing analogous percentages of free BMTZ were prepared as control. The formulation free of BMTZ was coded A, formulations containing 0.4, 0.8 and 1.6 % w/w free BMTZ were coded B, C, D, respectively. Formulations containing the corresponding amount of BMTZ loaded into NLC were coded BNLC, CNLC and DNLC.
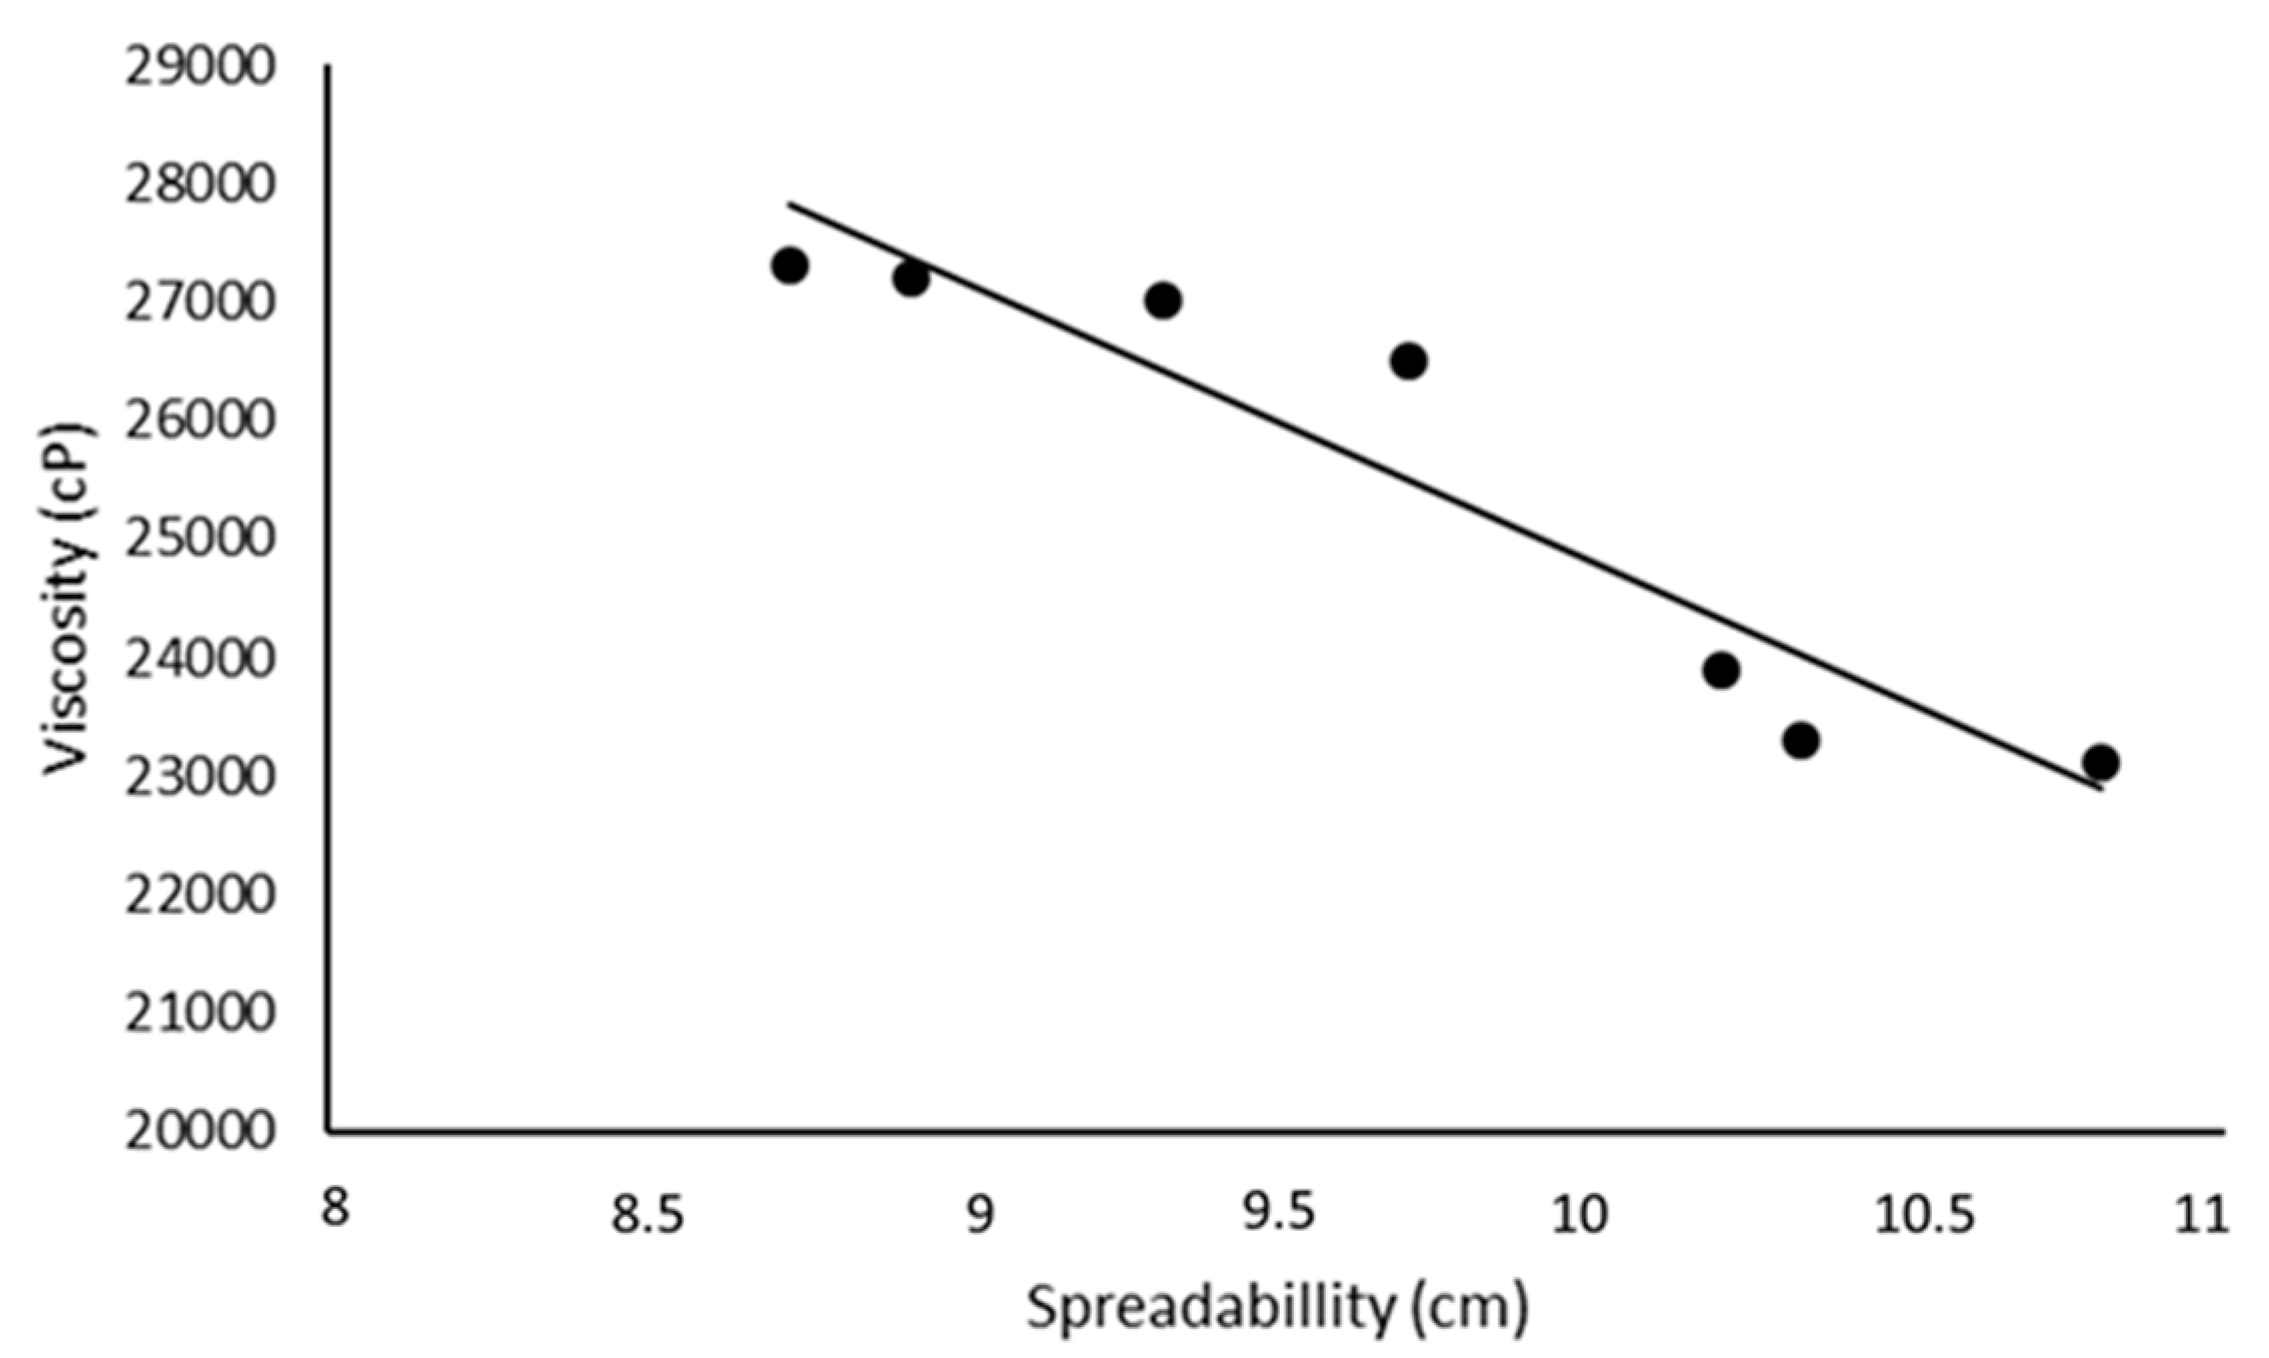
As shown in Table 8, pH values of all investigated emulsions ranged from 6.5 to 7.5. Although the skin surface shows pH values in the range 5.0-5.5, formulations with pH value close to the physiological value could be regarded as safe. The incorporation of different percentages of BMTZ-loaded NLC into O/W emulsions led to a drop of viscosity and an increase of spreadability in comparison to the corresponding O/W emulsions containing free BMTZ. Plotting viscosity values vs spreadability, an almost linear relationship (r2=0.893) was observed (Figure 7), thus confirming the predictability of spreadability by measuring the viscosity of topical formulations [44,45].
As reported in the literature [16], the occlusive properties of O/W emulsions could be affected by both the type and amount of oils used. The occlusive factors, reported in Table 8, pointed out a similar behavior of all investigated formulations, independently of the incorporation of different concentrations of BMTZ-loaded NLC or free BMTZ. According to previous studies [20,31], the lower the crystallinity of lipid nanoparticles, the lower the occlusive properties. Therefore, the lack of any relevant effect on the occlusive factor of the NLC under investigation could be attributed to their low crystallinity resulting from their high content of liquid lipid.
BMTZ in vitro release from the formulations under investigation was expressed as cumulative amount released after 4h because the sensitivity of the analytical method did not allow BMTZ quantification in the period 0-3 h. Experiments lasted only 4h because sunscreen formulations are not expected to remain on the skin surface for longer periods. As shown in Table 8, no significant difference (p>0.05) was observed comparing BMTZ release from formulations containing BMTZ-loaded NLC and free BMTZ. These results suggest that BMTZ delivery from the nanoparticles could not be regarded as the rate-limiting step in BMTZ release from the vehicle.
According to the literature [46,47], active ingredients loaded into lipid nanoparticles permeate mainly into the epidermis and the deeper layers of the skin while systemic absorption is restricted, thus avoiding undesired side effects. Assali and Zaid [48] reported that lipid nanoparticles having particle size above 100 nm and consisting of biodegradable materials could be regarded as safe. Therefore, the particle size (190.6 ± 9.8 nm) and safety of the solid/liquid lipids of the optimized BMTZ loaded NLC investigated in this work suggest that topical application of these nanocarriers could not represent a risk for human health. In addition, in in vitro skin permeation experiments, no BMTZ could be detected after 4 h in the receiving compartment, thus supporting the safety of the investigated formulations.
As shown in Table 8, BMTZ release from the emulsions under investigation was poor. However, the emulsion we used to perform in vitro release tests was not an optimized one but it was only a first formulation attempt to evaluate the effects of BMTZ loaded NLC on the technological properties of the resulting emulsions. As the vehicle could strongly affect release and skin permeation of the active ingredient, we have planned further studies on O/W emulsions with different compositions and incorporating BMTZ loaded NLC to assess the effects on BMTZ release and skin permeation from these vehicles.
As in vivo determination of SPF values of sunscreen formulations is expensive and time-consuming, different in vitro methods have been developed as alternative to in vivo tests in humans [49-52]. In this work, the spectrophotometric method based on Mansur equation [35] to determine in vitro SPF values was used as this type of test had already been applied to evaluate the photo-protective effects of emulsions containing active ingredients incorporated into lipid nanoparticles [53]. In the literature, the reliability of this spectrophotometric method has been debated owing to its poor ability to predict in vivo results, which was mainly attributed to an incorrect application of the method [54,55]. A recent study by Hermund et al. [56], compared the SPF values of three commercial sunscreen formulations obtained using the Mansur method with the SPF value reported by the manufacturer. A good agreement between claimed SPF and SPF values obtained by the Mansur equation was observed, thus underlining the usefulness of this in vitro method in the screening of sunscreen formulations during the development step.
In this work, the Mansur equation was used as a screening tool and its reliability was assessed comparing the obtained results with those determined in silico by the BASF sunscreen simulator (www.basf.com/sunscreen-simulator). This software has been developed on the data reported by Sayre et al. [36] that conceptualize SPF as the ratio of areas under the transmittance vs wavelength plot of sunscreen products. The BASF sunscreen simulator predicted SPF values of 1.9, 2,7 and 4.2 for formulations containing 0.4, 0.8 and 1.6 % w/w of free BMTZ, respectively. It is necessary to underline that this software cannot account for vehicle effects and UV-filter incorporation into nanocarriers.
As shown in Table 8, the emulsion without UV-filter provided a very low SPF value. The incorporation of increasing amount of free BMTZ raised the SPF value up to 5.3. These values were in good agreement with those predicted using the BASF sunscreen simulator, taking into account that the emulsion without UV-filter has an SPF value of 1.22. Formulations containing BMTZ loaded into NLC showed an improvement (about 20% for all investigated vehicles) of SPF value in comparison with the corresponding emulsions containing the same amount of free BMTZ. These results support the ability of NLC to behave as UV-blockers that has already been reported by others studying the effects of lipid nanoparticles as photo-protective agents [31,53]. Therefore, incorporating BMTZ into suitable NLC could be a promising strategy to develop sunscreen formulations with reduced content of synthetic UV-filter while achieving higher SPF values. Further studies have been planned to evaluate the in vivo sun protection factor (SPF) of the investigated formulations to evaluate their actual potential in designing commercial sunscreen products.

4. Conclusions

The incorporation of different oils (decyl oleate, isopropyl myristate and caprilic/capric triglyceride) into the lipid core of NLC strongly affected their ability to load bemotrizinol. Isopropyl myristate provided the most stable NLC along with the greatest loading capacity for bemotrizinol (8% w/w). The incorporation of different percentages of NLC loading 8% w/w bemotrizinol into O/W emulsions did not lead to significant changes of the technological properties of the resulting formulations. Vehicles containing BMTZ-loaded NLC showed an increase of about 20% of in vitro SPF value in comparison with the corresponding emulsions prepared using the same percentage of free BMTZ. Therefore, loading BMTZ into NLC could be regarded as a useful tool to develop sunscreen products with improved safety and efficacy.

Author Contributions

Conceptualization, M.G.S. and L.M.; methodology, M.G.S. and L.M..; validation, M.G.S., F.C., C.P. and L.M.; formal analysis, M.G.S. and L.M.; investigation, D.S. and S.R.; resources, M.G.S., C.P., F.C., L.M.; data curation, M.G.S. and L.M.; writing—original draft preparation, M.G.S. and L.M.; writing—review and editing, M.G.S., D.S., L.M.; visualization, M.G.S., D.S., L.M..; supervision, L.M.; project administration, M.G.S., F.C., C.P. and L.M. All authors have read and agreed to the published version of the manuscript.

Funding

This research received no external funding.

Data Availability Statement

The data generated and/or analyzed during the current study are available from the corresponding author on reasonable request.

Conflicts of Interest

The authors declare no conflicts of interest.

References

  1. Lionetti, N.; Rigano, L. The new sunscreens among formulation strategy, stability issues, changing norms, safety and efficacy evaluations. Cosmetics 2017, 4, 15. [Google Scholar] [CrossRef]
  2. Li, H.; Colantonio, S.; Dawson, A.; Lin, X.; Beecker, J. Sunscreen application, safety, and sun protection: the evidence. Journal of Cutaneous Medicine and Surgery 2019, 23(4), 357–369. [Google Scholar] [CrossRef] [PubMed]
  3. Sander, M.; Sander, M.; Burbidge, T.; Beecker, J. The efficacy and safety of sunscreen use for the prevention of skin cancer. CMAJ 2020, 192(50), E1802–E1808. [Google Scholar] [CrossRef] [PubMed]
  4. Montenegro, L.; Turnaturi, R.; Parenti, C.; Pasquinucci, L. In vitro evaluation of sunscreen safety: effects of the vehicle and repeated applications on skin permeation from topical formulations. Pharmaceutics 2018, 10, 27. [Google Scholar] [CrossRef] [PubMed]
  5. Ouchene, L.; Litvinov, I.V.; Netchiporouk, E. Systemic absorption of common organic sunscreen ingredients raises possible safety concerns for patients. Journal of Cutaeous Medicine and Surgery 2019, 23(4), 449–450. [Google Scholar] [CrossRef] [PubMed]
  6. Oral, D.; Yirun, A.; Erkekoglu, P. Safety concerns of organic ultraviolet filters: special focus on endocrine-disrupting properties. Journal of Environmental Pathology, Toxicology, and Oncology 2020, 39, 201–212. [Google Scholar] [CrossRef] [PubMed]
  7. Nesseem, D. Formulation of sunscreens with enhancement sun protection factor response based on solid lipid nanoparticles. International Journal of Cosmetic Science 2011, 33(1), 70–79. [Google Scholar] [CrossRef]
  8. Nikolić, S.; Keck, C.M.; Anselmi, C.; Müller, R.H. Skin photoprotection improvement: synergistic interaction between lipid nanoparticles and organic UV filters. International Journal of Pharmaceutics 2011, 414, 276–284. [Google Scholar] [CrossRef]
  9. Khater, D.; Nsairat, H.; Odeh, F.; Saleh, M.; Jaber, A.; Alshaer, W.; Al Bawab, A.; Mubarak, M.S. Design, preparation, and characterization of effective dermal and transdermal lipid nanoparticles: a review. Cosmetics 2021, 8, 39. [Google Scholar] [CrossRef]
  10. Chavda, V.P.; Acharya, D.; Hala, V.; Daware, S.; Vora, L.K. Sunscreens: A comprehensive review with the application of nanotechnology. Journal of Drug Delivery Science and Technology 2023, 86, 104720. [Google Scholar] [CrossRef]
  11. de Araújo, M.M.; Schneid, A.C.; Oliveira, M.S.; Mussi, S.V.; de Freitas, M.N.; Carvalho, F.C.; Bernes Junior, E.A.; Faro, R.; Azevedo, H. NLC-Based Sunscreen Formulations with Optimized Proportion of Encapsulated and Free Filters Exhibit Enhanced UVA and UVB Photoprotection. Pharmaceutics 2024, 16, 427. [Google Scholar] [CrossRef] [PubMed]
  12. Müller, R.H.; Radtke, M.; Wissing, S.A. Solid lipid nanoparticles (SLN) and nanostructured lipid carriers (NLC) in cosmetic and dermatological preparations. Advanced. Drug Delivery Reviews 2002, 54 (Suppl. S1), S131–55. [Google Scholar] [CrossRef] [PubMed]
  13. Pardeike, J.; Hommoss, A.; Müller, R.H. Lipid nanoparticles (SLN, NLC) in cosmetic and pharmaceutical dermal products. International Journal of Pharmaceutics 2009, 366, 170–184. [Google Scholar] [CrossRef] [PubMed]
  14. Kakadia, P.G.; Conway, B.R. Lipid nanoparticles for dermal drug delivery. Current Pharmaceutical Design 2015, 21(20), 2823–2829. [Google Scholar] [CrossRef] [PubMed]
  15. Kim, M.H.; Jeon, Y.E.; Kang, S.; Lee, J.Y.; Lee, K.W.; Kim, K.T.; Kim, D.D. Lipid Nanoparticles for Enhancing the Physicochemical Stability and Topical Skin Delivery of Orobol. Pharmaceutics 2020, 12(9), 845. [Google Scholar] [CrossRef]
  16. Tran, P.; Lee, S.E.; Kim, D.H.; Pyo, Y.C.; Park, J.S. Recent advances of nanotechnology for the delivery of anticancer drugs for breast cancer treatment. J Pharm Investig 2020, 50, 261–270. [Google Scholar] [CrossRef]
  17. Shirodkar, R.K.; Kumar, L.; Mutalik, S.; Lewis, S. Solid lipid nanoparticles and nanostructured lipid carriers: emerging lipidbased drug delivery systems. Pharmaceutical Chemistry Journal 2019, 53, 440–453. [Google Scholar] [CrossRef]
  18. Chatelain, E.; Gabard, B. Photostabilization of butyl methoxydibenzoylmethane (Avobenzone) and ethylhexyl methoxycinnamate by bis-ethylhexyloxyphenol methoxyphenyl triazine (Tinosorb S), a new UV broadband filter. Photochemistry and Photobiology 2001, 74(3), 401–406. [Google Scholar] [CrossRef] [PubMed]
  19. Medeiros, T.S.; Moreira, L.M.C.C.; Oliveira, T.M.T.; Melo, D.F.; Azevedo, E.P.; Gadelha, A.E.G.; Fook, M.V.L.; Oshiro-Júnior, J.A.; Damasceno, B.P.G.L. Bemotrizinol-loaded carnauba wax-based nanostructured lipid carriers for sunscreen: optimization, characterization, and in vitro evaluation. AAPS PharmSciTech 2020, 21(8), 288. [Google Scholar] [CrossRef]
  20. Wissing, S.; Müller, R.H. The influence of the crystallinity of lipid nanoparticles on their occlusive properties. International Journal of Pharmaceutics 2002, 242, 377–379. [Google Scholar] [CrossRef]
  21. Souto, E.B.; Almeida, A.J.; Müller, R.H. Lipid nanoparticles (SLN®, NLC®) for cutaneous drug delivery: structure, protection and skin effects. Journal of Biomedical Nanotechnoogy 2007, 3(4), 317–331. [Google Scholar] [CrossRef]
  22. Subramaniam, B.; Siddik, Z.H.; Nagoor, N.H. Optimization of nanostructured lipid carriers: understanding the types, designs, and parameters in the process of formulations. Journal of Nanoparticle Research 2020, 22, 141. [Google Scholar] [CrossRef]
  23. Fiume, M.M.; Heldreth, B.A.; Bergfeld, W.F.; Belsito, D.V.; Hill, R.A.; Klaassen, C.D.; Liebler, D.C.; Marks, J.G.Jr.; Shank, R.C.; Slaga, T.J.; Snyder, P.W.; Andersen, F.A. Safety assessment of alkyl esters as used in cosmetics. International Journal of Toxicology 2015, 34 (Suppl 2), 5S–69S. [Google Scholar] [CrossRef]
  24. Fiume, M.M.; Bergfeld, W.F.; Belsito, D.V.; Hill, R.A.; Klaassen, C.D.; Liebler, D.C.; Marks, J.G.Jr.; Shank, R.C.; Slaga, T.J.; Snyder, P.W.; Heldreth, B. Amended safety assessment of triglycerides as used in cosmetics. International Journal of Toxicology 2022, 41 (Suppl. S3), 22S–68S. [Google Scholar] [CrossRef] [PubMed]
  25. Montenegro, L.; Santagati, L.M.; Sarpietro, M.G.; Castelli, F.; Panico, A.; Siciliano, E.A.; Lai, F.; Valenti, D.; Sinico, C. In vitro skin permeation of idebenone from lipid nanoparticles containing chemical penetration enhancers. Pharmaceutics 2021, 13, 1027. [Google Scholar] [CrossRef]
  26. Sarpietro, M.G.; Torrisi, C.; Pignatello, R.; Castelli, C.; Montenegro, L. Assessment of the technological properties of idebenone and tocopheryl acetate co-loaded lipid nanoparticles. Applied Sciences 2021, 11, 3553. [Google Scholar] [CrossRef]
  27. Ruktanonchai, U.; Limpakdee, S.; Meejoo, S.; Sakulkhu, U.; Bunyapraphatsara, N.; Junyaprasert, V.; Puttipipatkhachorn, S. The effect of cetyl palmitate crystallinity on physical properties of gamma-oryzanol encapsulated in solid lipid nanoparticles. Nanotechnology 2008, 9(9), 095701. [Google Scholar] [CrossRef] [PubMed]
  28. Montenegro, L.; Rapisarda, L.; Ministeri, C.; Puglisi, G. Effects of lipids and emulsifiers on the physicochemical and sensory properties of cosmetic emulsions containing vitamin E. Cosmetics 2015, 2, 35–47. [Google Scholar] [CrossRef]
  29. Chaudhary, B.; Verma, S. Preparation and evaluation of novel in situ gels containing acyclovir for the treatment of oral herpes simplex virus infections. Scientific WorldJournal 2014, 2014, 1–7. [Google Scholar] [CrossRef]
  30. Bakhrushina, E. O.; Anurova, M. N.; Zavalniy, M. S.; Demina, N. B.; Bardakov, A.I.; Krasnyuk, I.I. Dermatologic Gels Spreadability Measuring Methods Comparative Study. Int J Appl Pharm. 2022, 14, 164–168. [Google Scholar]
  31. Wissing, S.A.; Lippacher, A.; Muller, R.H. Investigations on the occlusive properties of solid lipid nanoparticles (SLN). Journal of Cosmetic Science 2001, 52(5), 313–324. [Google Scholar]
  32. Montenegro, L.; Parenti, C.; Turnaturi, R.; Pasquinucci, L. Resveratrol-loaded lipid nanocarriers: correlation between in vitro occlusion factor and in vivo skin hydrating effect. Pharmaceutics 2017, 9, 58. [Google Scholar] [CrossRef]
  33. Fallica, F.; Leonardi, C.; Toscano, V.; Santonocito, D.; Leonardi, P.; Puglia, C. Assessment of Alcohol-Based Hand Sanitizers for Long-Term Use, Formulated with Addition of Natural Ingredients in Comparison to WHO Formulation 1. Pharmaceutics 2021, 13, 571. [Google Scholar] [CrossRef] [PubMed]
  34. Puglia, C.; Santonocito, D.; Bonaccorso, A.; Musumeci, T.; Ruozi, B.; Pignatello, R.; Carbone, C.; Parenti, C.; Chiechio, S. Lipid Nanoparticle Inclusion Prevents Capsaicin-Induced TRPV1 Defunctionalization. Pharmaceutics 2020, 12, 339. [Google Scholar] [CrossRef] [PubMed]
  35. Mansur, J.S.; Breder, M.N.R.; Mansur, M.C.A.; Azulay, R.D. Determinação do fator de proteção solar por espectrofotometria. Anais Brasileiros de Dermatologia 1986, 61(3), 121–124. [Google Scholar]
  36. Sayre, R.M.; Agin, P.P.; LeVee, G.J.; Marlowe, E. Comparison of in vivo and in vitro testing of sunscreen formulas. Photochemistry and Photobiology 1979, 29(3), 559–566. [Google Scholar] [CrossRef]
  37. Gonzalez Solveyra, E.; Szleifer, I. What is the role of curvature on the properties of nanomaterials for biomedical applications? Wires Nanomedicine and Nanobiotechnology 2016, 8(3), 334–354. [Google Scholar] [CrossRef] [PubMed]
  38. Alajami, H.N.; Fouad, E.A.; Ashour, A.E.; Kumar, A.; Yassin, A.E.B. Celecoxib-loaded solid lipid nanoparticles for colon delivery: formulation optimization and in vitro assessment of anti-cancer activity. Pharmaceutics 2022, 14, 131. [Google Scholar] [CrossRef] [PubMed]
  39. Müller, R.H.; Mäder, K.; Gohla, S. Solid lipid nanoparticles (SLN) for controlled drug delivery - a review of the state of the art. European Journal of Pharmaceutics and Biopharmaceutics 2000, 50(1), 161–77. [Google Scholar] [CrossRef] [PubMed]
  40. Pardeshi, C.; Rajput, P.; Belgamwar, V.; Tekade, A.; Patil, G.; Chaudhary, K.; Sonje, A. Solid lipid based nanocarriers: an overview. Acta Pharmaceutica 2012, 62(4), 433–472. [Google Scholar] [CrossRef]
  41. Jenning, V.; Thünemann, A.F.; Gohla, S.H. Characterisation of a novel solid lipid nanoparticle carrier system based on binary mixtures of liquid and solid lipids. International Journal of Pharmaceutics 2000, 199(2), 167–177. [Google Scholar] [CrossRef]
  42. Bunjes, H.; Westesen, K.; Koch, M.H.J. Crystallization tendency and polymorphic transitions in triglyceride nanoparticles. International Journal of Pharmaceutics 1996, 129, 159–173. [Google Scholar] [CrossRef]
  43. Samimi, S.; Maghsoudnia, N.; Eftekhari, R.B.; Dorkoosh, F. Lipid-based nanoparticles for drug delivery systems. Eds. Micro and Nano Technologies, Characterization and Biology of Nanomaterials for Drug Delivery. Amsterdam: Elsevier 2019, 47–76. [Google Scholar]
  44. Lardy, F.; Vennat, B.; Pouget, M.P.; Pourrat, A. Functionalization of hydrocolloids: principal component analysis applied to the study of correlations between parameters describing the consistency of hydrogels. Drug Development and Industrial Pharmacy 2000, 26(7), 715–721. [Google Scholar] [CrossRef]
  45. Garg, A.; Aggarwal, D.; Garg, S.; Singla, A.K. Spreading of semisolid formulations: An update. Pharmaceutical Technology 2002, 26(9), 84–105. [Google Scholar]
  46. Ahmad, J. Lipid nanoparticles based cosmetics with potential application in alleviating skin disorders. Cosmetics 2021, 8, 84. [Google Scholar] [CrossRef]
  47. Chu, C.C.; Hasan, Z.A.A.; Tan, C.P.; Nyam, K.L. In vitro safety evaluation of sunscreen formulation from nanostructured lipid carriers using human cells and skin model. Toxicology in Vitro 2022, 84, 105431. [Google Scholar] [CrossRef] [PubMed]
  48. Assali, M.; Zaid, A. Features, applications, and sustainability of lipid nanoparticles in cosmeceuticals. Saudi Pharmaceutical Journal 2022, 30, 53–65. [Google Scholar] [CrossRef]
  49. Santos, E.P.; Freitas, Z.M.; Souza, K.R.; Garcia, S.; Vergnanini, A. In vitro and in vivo determinations of sun protection factors of sunscreen lotions with octylmethoxycinnamate. International Journal of Cosmetic Science 1999, 21(1), 1–5. [Google Scholar] [CrossRef]
  50. Sheu, M.T.; Lin, C.W.; Huang, M.C.; Shen, C.H. Correlation of in vivo and in vitro measurements of sun protection factor. Journal of Food and Drug Analysis 2003, 11(2), 12. [Google Scholar] [CrossRef]
  51. Kaur, C.D.; Saraf, S. In vitro sun protection factor determination of herbal oils used in cosmetics. Pharmacognosy Research 2010, 2(1), 22–25. [Google Scholar]
  52. Pissavini, M.; Tricaud, C.; Wiener, G.; Lauer, A.; Contier, M.; Kolbe, L.; Trullás Cabanas, C.; Boyer, F.; Meredith, E.; de Lapuente, J.; Dietrich, E.; Matts, P.J. Validation of a new in vitro Sun Protection Factor method to include a wide range of sunscreen product emulsion types. International Journal of Cosmetic Science 2020, 42(5), 421–428. [Google Scholar] [CrossRef]
  53. Jose, J.; Netto, G. Role of solid lipid nanoparticles as photoprotective agents in cosmetics. Journal of Cosmetic Dermatology 2019, 18(1), 315–321. [Google Scholar] [CrossRef]
  54. Ácsová, A.; Hojerová, J.; Janotková, L.; Bendová, H.; Jedličková, L.; Hamranová, V.; Martiniaková, S. The Real UVB Photoprotective Efficacy of Vegetable Oils: In Vitro and in Vivo Studies. Photochemical & Photobiological Sciences 2021, 20, 139–151. [Google Scholar]
  55. Yang, S.I.; Liu, S.; Brooks, G.J.; Lanctot, Y.; Gruber, J. V Reliable and Simple Spectrophotometric Determination of Sun Protection Factor: A Case Study Using Organic <scp>UV</Scp> Filter-based Sunscreen Products. J Cosmet Dermatol 2018, 17, 518–522. [Google Scholar] [PubMed]
  56. Hermund, D.B.; Torsteinsen, H.; Vega, J.; Figueroa, F.L.; Jacobsen, C. Screening for New Cosmeceuticals from Brown Algae Fucus Vesiculosus with Antioxidant and Photo-Protecting Properties. Mar Drugs 2022, 20, 687. [Google Scholar] [CrossRef] [PubMed]
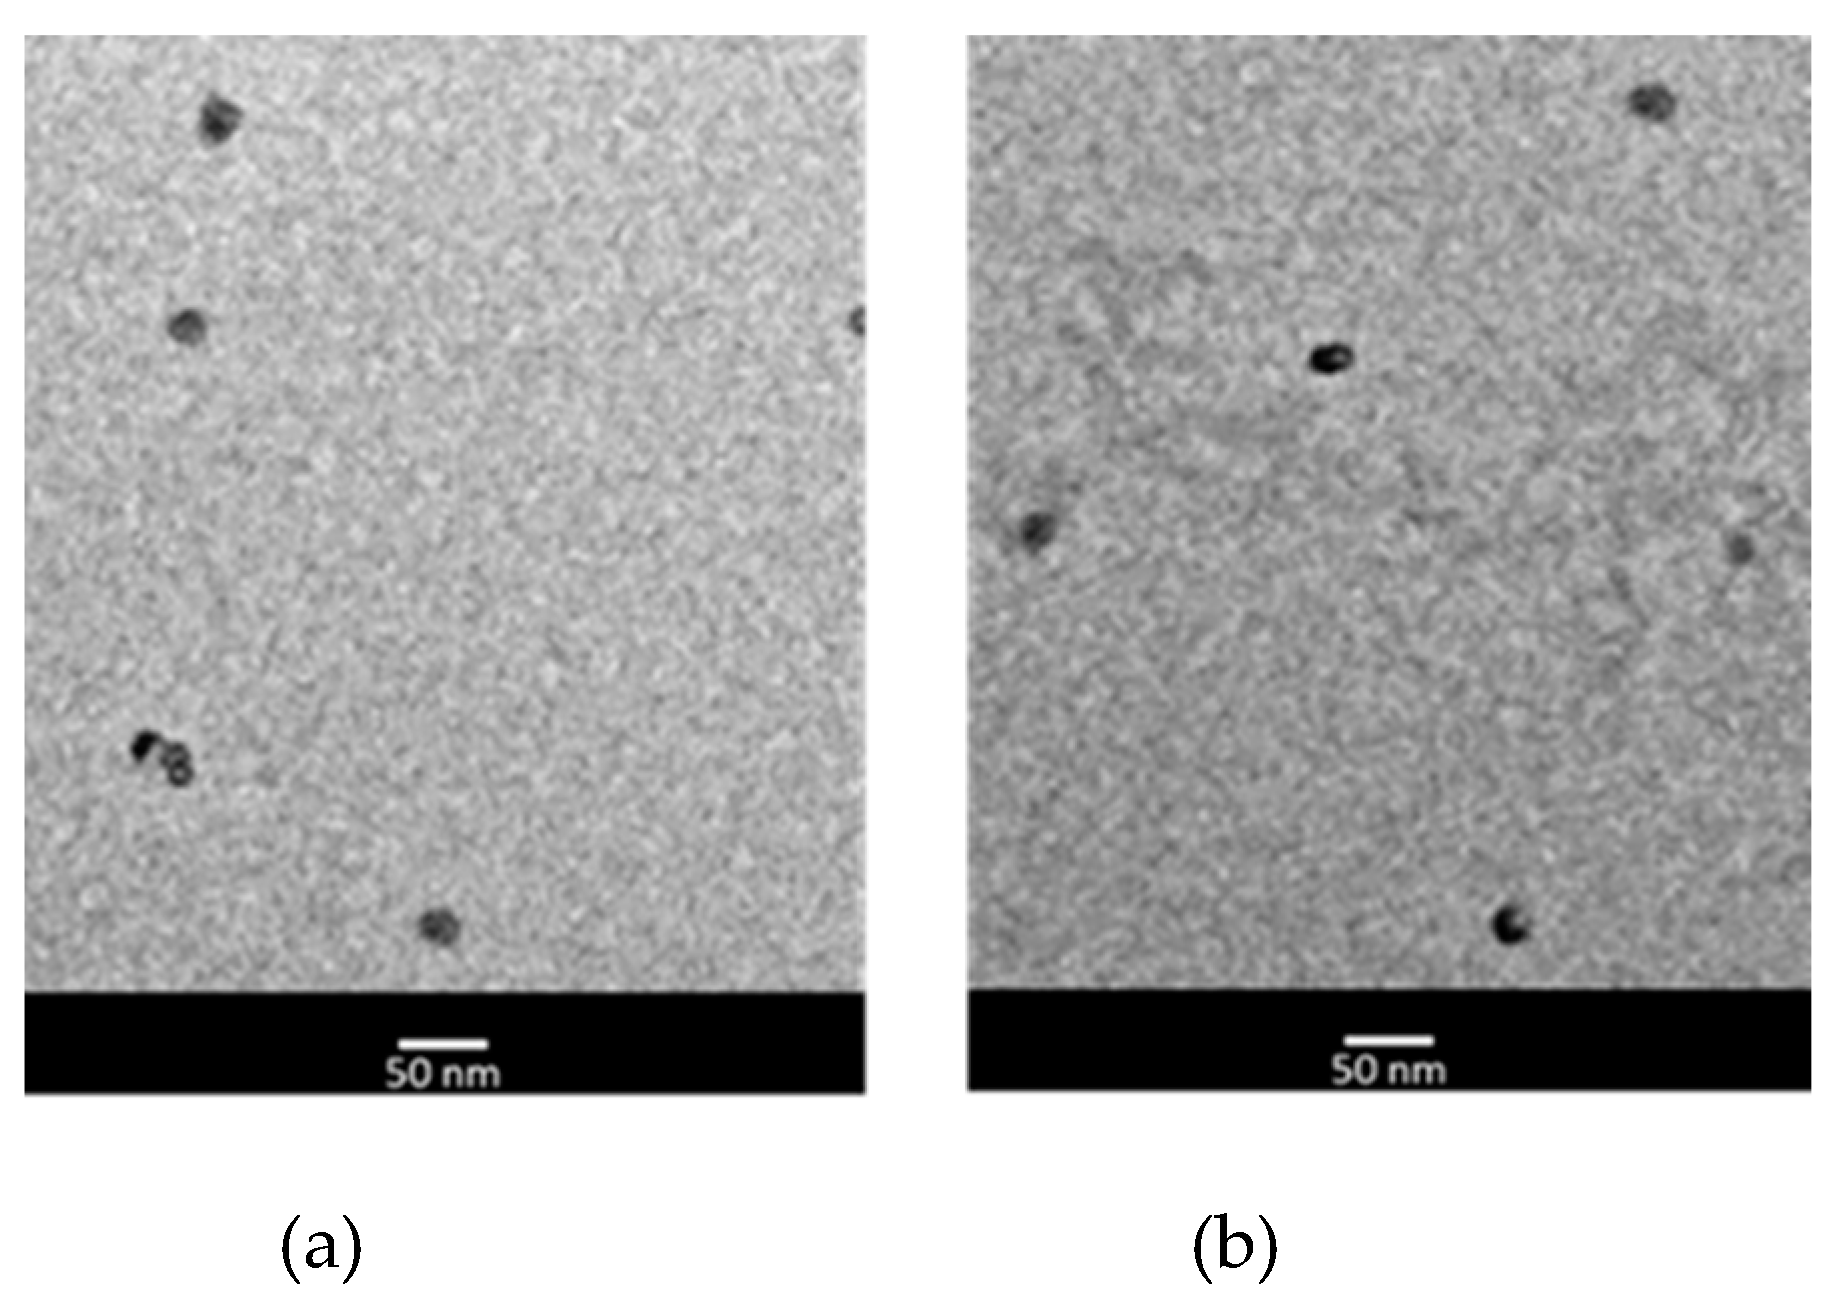
Figure 1. Transmission electron microscopy images of (a) nanostructured lipid carriers prepared using isopropyl myristate 3.0% w/w, and (b) nanostructured lipid carriers prepared using isopropyl myristate 3.0% w/w and loading bemotrizinol 1% w/w.
Preprints 113333 g001
Figure 2. Calorimetric curves, in heating mode, of nanostructured lipid carriers prepared with different percentages of (A) decyl oleate (1% w/w=DO1, 2% w/w=DO2, 3% w/w=DO3), (B) isopropyl myristate (1% w/w=IPM1, 2% w/w=IPM2, 3% w/w=IPM3), and (C) caprylic/capric triglyceride (1% w/w=MYR1, 2% w/w=MYR2, 3% w/w=MYR3). Each experiment was performed in triplicates (n=3).
Preprints 113333 g002aPreprints 113333 g002b
Figure 3. Calorimetric curves, in heating mode, of solid lipid nanoparticles (SLN) containing cetyl palmitate 5% w/w (SLN5) and 6 % w/w (SLN6). Each experiment was performed in triplicate (n=3).
Preprints 113333 g003
Figure 4. Transition temperature of the main peak of nanostructured lipid carriers (NLC) as a function of the percentage of liquid lipid content in the NLC core. Transition temperature data were obtained from experiments performed in triplicates (n=3) and their S.D. was within 10%. DO=decyl oleate; IPM=isopropyl myristate; MYR=caprilic/capric triglyceride.
Preprints 113333 g004
Figure 5. Calorimetric curves, in heating mode, of nanostructured lipid carriers (NLC) prepared using different percentages of bemotrizinol (BMTZ) and 3% w/w of the liquid lipid (a) decyl oleate (DO3=unloaded NLC; DBMTZ1, DBMTZ3, DBMTZ5 and DBMTZ 7 loading 1, 3, 5, 7% w/w BMTZ respectively); (b) isopropyl myristate (IPM3= unloaded NLC; IBMTZ1, IBMTZ3, IBMTZ5 and IBMTZ 7 loading 1, 3, 5, 7% w/w BMTZ respectively) and (c) caprilic/capric triglyceride (MYR3=unloaded NLC; MBMTZ1, MBMTZ3, MBMTZ5 and MBMTZ 7 loading 1, 3, 5, 7% w/w BMTZ respectively). Each experiment was performed in triplicates (n=3).
Preprints 113333 g005aPreprints 113333 g005b
Figure 6. Peak temperature variation of nanostructured lipid carriers (NLC) prepared using isopropyl myristate (IPM), decyl oleate (DO) and caprilic/capric triglyceride (MYR) as a function of bemotrizinol (BMTZ) percentage. (ΔT=T-T0 where T is the peak temperature of BMTZ loaded NLC and T0 is the peak temperature of unloaded NLC). Peak temperature variation data were obtained from experiments performed in triplicates (n=3) and their S.D. was within 10%.
Preprints 113333 g006
Figure 7. Relationship between viscosity and spreadability of O/W emulsions containing free bemotrizinol or nanostructured lipid carriers loaded with bemotrizinol. As reported in Table 8, each data represents the mean ± S.D. of three replicates (n=3).
Preprints 113333 g007
Table 1. Composition (% w/w) of the lipid phase of unloaded nanostructured lipid carriers (NLC) containing different percentages of lipids.
NLC code Oleth-20 GOa CPb IPMc MYRd DOe
IPM1 8.7 4.4 6.0 1.0 --- ---
IPM2 8.7 4.4 5.0 2.0 --- ---
IPM3 8.7 4.4 4.0 3.0 --- ---
MYR1 8.7 4.4 6.0 --- 1.0 ---
MYR2 8.7 4.4 5.0 --- 2.0 ---
MYR3 8.7 4.4 4.0 --- 3.0 ---
DO1 8.7 4.4 6.0 --- --- 1.0
DO2 8.7 4.4 5.0 --- --- 2.0
DO3 8.7 4.4 4.0 --- --- 3.0
aGO =glyceryl oleate; bCP =cetyl palmitate; cIPM =isopropyl myristate; dMYR =caprylic/capric triglyceride; eDO =decyl oleate.
Table 2. Composition (% w/w) of the lipid phase of nanostructured lipid carriers (NLC) containing different percentages of bemotrizinol.
NLC code Oleth-20 GOa CPb IPMc MYRd DOe BMTZf
IBMTZ1 8.7 4.4 4.0 3.0 --- --- 1.0
IBMTZ3 8.7 4.4 4.0 3.0 --- --- 3.0
IBMTZ5 8.7 4.4 4.0 3.0 --- --- 5.0
IBMTZ7 8.7 4.4 4.0 3.0 --- --- 7.0
MBMTZ1 8.7 4.4 4.0 --- 3.0 --- 1.0
MBMTZ3 8.7 4.4 4.0 --- 3.0 --- 3.0
MBMTZ5 8.7 4.4 4.0 --- 3.0 --- 5.0
MBMTZ7 8.7 4.4 4.0 --- 3.0 --- 7.0
DBMTZ1 8.7 4.4 4.0 --- --- 3.0 1.0
DBMTZ3 8.7 4.4 4.0 --- --- 3.0 3.0
DBMTZ5 8.7 4.4 4.0 --- --- 3.0 5.0
DBMTZ7 8.7 4.4 4.0 --- --- 3.0 7.0
aGO =glyceryl oleate; bCP =cetyl palmitate; cIPM =isopropyl myristate; dMYR =caprylic/capric triglyceride; eDO =decyl oleate; fBMTZ = bemotrizinol.
Table 3. Composition (% w/w) of O/W emulsions containing free bemotrizinol and bemotrizinol-loaded nanostructured lipid carriers (NLC).
Ingredient Formulation code
A B BNLC C CNLC D DNLC
Phase A
Cetiol Sa 3.0 3.0 3.0 3.0 3.0 3.0 3.0
MYRb 2.0 2.0 2.0 2.0 2.0 2.0 2.0
Greensylc 1.0 1.0 1.0 1.0 1.0 1.0 1.0
Crodamol CAPd 2.0 2.0 2.0 2.0 2.0 2.0 2.0
Argan oil 1.0 1.0 1.0 1.0 1.0 1.0 1.0
Wheat oil 1.0 1.0 1.0 1.0 1.0 1.0 1.0
Shea oil 1.0 1.0 1.0 1.0 1.0 1.0 1.0
TAe 0.1 0.1 0.1 0.1 0.1 0.1 0.1
Brij 72f 3.0 3.0 3.0 3.0 3.0 3.0 3.0
Brij 721g 2.0 2.0 2.0 2.0 2.0 2.0 2.0
Cetyl palmitate 4.0 4.0 4.0 4.0 4.0 4.0 4.0
Cetyl alcohol 1.0 1.0 1.0 1.0 1.0 1.0 1.0
BMTZh --- 0.4 --- 0.8 --- 1.6 ---
Phase B
EDTAi 0.1 0.1 0.1 0.1 0.1 0.1 0.1
Water q.s.l q.s.l q.s.l q.s.l q.s.l q.s.l q.s.l
Phase C
Kemipur 100m 0.35 0.35 0.35 0.35 0.35 0.35 0.35
Benzyl alcohol 0.25 0.25 0.25 0.25 0.25 0.25 0.25
Phase D
Parfum 0.1 0.1 0.1 0.1 0.1 0.1 0.1
Phase E
BMTZ-NLCn --- --- 5.0 --- 10.0 --- 20.0
aCetiol S=diethylhexylcyclohexane; bMYR=caprylic/capric triglyceride; cGreensyl= coconut alkanes and coco-caprylate/caprate; dCrodamol CAP=cetearyl ethylhexanoate and isopropyl myristate; eTA= tocopheryl acetate; fBrij 72=Steareth-2; gBrij 721= Steareth-21; hBMTZ=bemotrizinol; iEDTA= disodium EDTA; lq.s.= quantum sufficit to 100% w/w; mKemipur 100= imidazolidinyl urea; nBMTZ-NLC=bemotrizinol-loaded nanostructure lipid carriers.
Table 4. Mean nanoparticle size (Z-average ± S.D.), polydispersity index (PDI ± S.D.) and ζ potential (Zeta ± S.D.) of unloaded nanostructured lipid carriers (NLC). Each data represents the mean ± S.D. of three replicates (n=3).
NLC code Z-average ± S.D. (nm) PDI Zeta ± S.D. (mV)
IPM1 38.5 ± 1.5 0.102 ± 0.008 -10.3 ± 1.1
IPM2 37.4 ± 1.8 0.111 ± 0.007 -9.2 ± 1.2
IPM3 37.9 ± 2.0 0.107 ± 0.011 -11.3 ± 0.9
MYR1 47.9 ± 2.8 0.115 ± 0.008 -8.9 ± 1.0
MYR2 45.6 ± 1.6 0.105 ± 0.009 -10.4 ± 1.7
MYR3 48.1 ± 1.9 0.109 ± 0.007 -9.4 ± 0.8
DO1 45.3 ± 1.4 0.153 ± 0.009 -11.5 ± 1.6
DO2 41.1 ± 2.0 0.171 ± 0.012 -9.9 ± 1.2
DO3 41.7 ± 2.3 0.166 ± 0.008 -10.6 ± 1.8
Table 5. Enthalpy variation (ΔH) and recrystallization index (RI %) of unloaded nanostructured lipid carriers (NLC) containing different percentages of liquid lipids. ΔH data represent the mean ± S.D. of three replicates (n=3).
NLC code ΔH ± S.D.
(J/g)
RI %
DO 1 9.46 ± 0.38 63.9
DO 2 7.22 ± 0.14 58.5
DO 3 5.01 ± 0.05 50.8
IPM 1 8.96 ± 0.24 60.5
IPM 2 6.59 ± 0.20 53.4
IPM 3 2.23 ± 0.08 22.6
MYR 1 10.37 ± 0.45 70.0
MYR 2 7.80 ± 0.15 63.0
MYR 3 4.21 ± 0.17 42.6
Table 6. Mean nanoparticle size (Z-average ± S.D.), polydispersity index (PDI ± S.D.) and ζ potential (Zeta ± S.D.) of bemotrizinol loaded nanostructured lipid carriers (NLC). Each data represents the mean ± S.D. of three replicates (n=3).
NLC code Z-average ± S.D.
(nm)
PDI Zeta ± S.D. (mV)
IBMTZ1 33.2 ± 2.1 0.217 ± 0.015 -10.4± 1.3
IBMTZ3 35.5 ± 1.9 0.090 ± 0.004 -9.9 ± 1.7
IBMTZ5 45.3 ± 2.3 0.115 ± 0.009 -11.8 ± 1.4
IBMTZ7 72.5 ± 6.3 0.149 ± 0.014 -9.9 ± 1.3
MBMTZ1 49.8 ± 2.9 0.127 ± 0.011 -11.2 ± 1.4
MBMTZ3 58.4 ± 2.1 0.136 ± 0.009 -10.2 ± 1.9
MBMTZ5 78.1 ± 3.9 0.191 ± 0.018 -11.5 ± 0.9
MBMTZ7 99.3 ± 2.5 0.289 ± 0.019 -9.9 ± 1.2
DBMTZ1 45.0 ± 4.1 0.129 ± 0.013 -10.7 ± 1.5
DBMTZ3 50.8 ± 4.3 0.167 ± 0.015 -11.2 ± 1.4
DBMTZ5 66.9 ± 3.3 0.181 ± 0.018 -11.3 ± 1.8
DBMTZ7 81.5 ± 2.8 0.264 ± 0.019 -10.8 ± 0.7
Table 7. Enthalpy variation (ΔH) and percentage of recrystallization index (RI %) of nanostructured lipid carriers (NLC) containing 3% w/w liquid lipid, 4% w/w solid lipid and different percentages of bemotrizinol. ΔH data represent the mean ± S.D. of three replicates (n=3).
NLC code ΔH ± S.D. (J/g) RI %
DBMTZ1 2.72 ± 0.12 27.5
DBMTZ3 3.67 ± 0.13 37.1
DBMTZ5 2.03 ± 0.04 20.6
DBMTZ7 1.94 ± 0.09 19.6
IBMTZ1 2.00 ± 0.04 20.2
IBMTZ3 2.46 ± 0.11 24.8
IBMTZ5 2.93 ± 0.06 29.6
IBMTZ7 0.83 ± 0.03 8.4
MBMTZ1 2.10 ± 0.10 21.2
MBMTZ3 4.04 ± 0.12 40.9
MBMTZ5 2.58 ± 0.05 26.1
MBMTZ7 4.37 ± 0.21 44.2
Table 8. Occlusion factor (F), pH, spreadability (S), viscosity (V), cumulative amount of bemotrizinol released after 4 h (Q) and sun protection factor (SPF) of O/W emulsions containing free bemotrizinol or bemotrizinol-loaded nanostructured lipid carriers. Each data represents the mean ± S.D. of three replicates (n=3).
Emulsion code pH F S (cm) V (cP) Q (μg) SPF
A 6.6 ± 0.1 50.41 ± 1.52 8.92 ± 0.31 27200 ± 1200 --- 1.22 ± 0.04
B 7.5 ± 0.2 53.31 ± 1.43 9.71 ± 0.22 26500 ± 1400 0.60 ± 0.12 3.03 ± 0.11
BNLC 7.0 ± 0.1 51.45 ± 0.99 10.33 ± 0.40 23300 ± 900 0.98 ± 0.23 3.54 ± 0.12
C 7.4 ± 0.1 51.70 ± 1.32 8.73 ± 0.38 27300 ± 1500 0.88 ± 0.17 4.14 ± 0.18
CNLC 7.4 ± 0.2 49.83 ± 1.44 10.2 ± 0.14 23900 ± 1100 0.87 ± 0.19 4.78 ± 0.21
D 7.5 ± 0.1 50.66 ± 0.98 9.32 ± 0.02 27000 ±1400 0.71 ± 0.11 5.26 ± 0.28
DNLC 7.4 ± 0.1 51.07 ± 1.02 10.8 ± 0.28 23100 ± 1000 0.66 ± 0.13 6.34 ± 0.29
Disclaimer/Publisher’s Note: The statements, opinions and data contained in all publications are solely those of the individual author(s) and contributor(s) and not of MDPI and/or the editor(s). MDPI and/or the editor(s) disclaim responsibility for any injury to people or property resulting from any ideas, methods, instructions or products referred to in the content.
Copyright: This open access article is published under a Creative Commons CC BY 4.0 license, which permit the free download, distribution, and reuse, provided that the author and preprint are cited in any reuse.
Prerpints.org logo

Preprints.org is a free preprint server supported by MDPI in Basel, Switzerland.

Subscribe

© 2024 MDPI (Basel, Switzerland) unless otherwise stated