Preprint
Article

Methyl Orange Adsorption Using Chitosan-Based Composite Aerogels Produced by Supercritical Gel Drying

Altmetrics

Downloads

132

Views

41

Comments

0

Submitted:

26 July 2024

Posted:

26 July 2024

You are already at the latest version

Alerts
Abstract
Chitosan-based composites are interesting materials for dye adsorption. In this work, methyl orange (MO) adsorption using chitosan (CH) and chitosan-graphene oxide (CH-GO) aerogels produced by supercritical gel drying was assessed, by studying the effect of driving force (25-100 ppm) and adsorbent dosage (1-8 g/L). It was highlighted that the difference in the performance between the two adsorbents was non-negligible only at high concentrations, due to more intense interactions between the adsorbent active sites and MO molecules. Starting from a 10 ppm MO solution, using a dosage of 8 g/L it was possible to achieve adsorption efficiency of about 85%, meaning that small amounts of nanostructured devices can result in good process outcomes. Freundlich isotherm reliably describes the system behavior, leading to the consideration that adsorption between MO and CH-GO takes place between different active sites. Moreover, PSO kinetic describes the general trend of this system through time, unveiling heterogeneous chemisorption; lastly, the multi-linear IPD kinetic model confirms that in the case of nanostructured porous devices, there are different mass transfer phenomena that control molecule diffusion through the system.
Keywords: 
Subject: Engineering  -   Chemical Engineering

1. Introduction

Synthetic dyes are a wide class of compounds, whose production is rapidly expanding (up to 105 tons per year) due to their utilization in textile, leather, paper, printing, cosmetic, and pharmaceutical industries [1,2,3]. The largest contribution to this consumption rate comes from textiles industry, that accounts for about 75% of the employment of global dyestuff [4]. However, up to date, there is no strict regulation on dye content in industrial effluents, leading to uncontrolled release in water bodies. Indeed, synthetic dyes are reported to be harmful for the environment and the human health. Environmental concerns grow from dye recalcitrancy in water bodies, which modifies color, transparency and pH: plant growth is inhibited, photosynthesis is compromised, and the whole ecosystem is dysregulated [5,6,7,8]. On the other hand, synthetic dyes pose a threat also on human health: they are reported to exert inflammatory, genotoxic, mutagenic and carcinogenic effects on liver, kidney, skin, etc. [1,9,10]. Therefore, it is very relevant to recognize a way to remediate color-bearing effluents. In this work, methyl orange (MO) has been considered as model anionic dye.
There are several techniques that can be applied to remove dyes from industrial sewages, like: biological processes [11,12,13]; chemical techniques, like Advanced Oxidation Processes (AOP), among which stand out Fenton [14,15] and photo-Fenton [16,17,18] processes, and photocatalysis [19,20,21]; physical processes, the most widespread of which are adsorption [22,23,24,25,26,27], coagulation, flocculation, and membrane separation [28,29,30]. Although appealing, most of the biological and chemical processes suffer from low productivity, slow kinetics, poor scalability, and tendency to generate reaction intermediates that are potentially more dangerous than dyes themselves [3]. On an industrial scale, physical methods draw the most attention due to their simplicity and cost-effectiveness. Adsorption is the most frequently employed unit operation in the field, since it does not lead to the generation of toxic intermediates, and the solute can be easily recovered from the sorbent by simply coupling the system with a desorption step. Working in such a way, dyes can be recovered in a controlled manner. In general, adsorption outcomes rely on the combination adsorbent-adsorbate: namely, the adsorbent should be chosen with respect to the specific molecule to be removed from the contaminated solution. Moreover, since adsorption takes place at the solid-fluid interface, highly porous solids are to be preferred [28], since they offer large specific surface areas. Aerogels represent promising adsorbents, for the following reasons: they possess specific surface areas up to 1000 m2/g, that means large availability of active sites; being filled mostly with air, porosity values range from 60 to 99.9%; they are low-density materials (10-1-10-2 g/cm3) [31,32,33]. Starting from a hydrogel, aerogels can be produced using supercritical CO2 (SC-CO2) gel drying: employing the fluid-dynamical properties of supercritical fluids, like zero surface tension and high diffusivities [34,35,36]. No tension is exerted on the gel nanostructured network, preserving completely the original structure and, consequently, the adsorption potential of the material.
Different materials can be selected for adsorption purposes, like metal organic frameworks (MOFs), active carbons, biopolymers, etc. [37]. Biopolymers like chitosan, alginate, cellulose, etc., are particularly interesting from an industrial point of view as adsorbent materials, due to their low cost, availability and eco-friendliness [38]. Among the wide range of biopolymers, chitosan (CH), obtained by deacetylating chitin from seafood, gained recognition in wastewater treatment for numerous reasons. Firstly, it is environmentally friendly, biodegradable, biocompatible and non-toxic. From a chemical point of view, it is rich in amin and hydroxyl groups: this feature allows chitosan to bind with anionic and cationic dyes; moreover, it can be easily functionalized with specific additives to enhance sorption capacity, pH-sensitivity, and mechanical resistance [39,40,41]. One of the most common additives, added to chitosan-based adsorbents, is graphene oxide (GO), produced by the oxidation and functionalization of graphite sheets. GO is an interesting choice for adsorption, since during activation multiple functional groups are introduced, such as carbonyl, epoxy, carboxyl and hydroxyl; GO, therefore, can interact with different dyes, among which also methyl orange [42,43,44].
Several attempts are reported in the scientific literature, to remove MO using CH-GO porous structures. Zhu et al. [45] prepared chitosan-graphene oxide composites by freeze-drying, and proved that the structures that showed the largest specific surface area resulted in improved adsorption performances: MO was removed up to 95.3% from the starting solution. However, the GO/CH mass ratio that reached the largest adsorption efficiency was 10:1. Indeed, GO preparation requires time-consuming procedures and significant amounts of toxic solvents: the goal could be to obtain the same efficiencies using significantly lower amounts of filler. For this system, the saturation capacity was about 38.67 mg/g. Moreover, kinetic analysis highlighted that chemisorption takes place between MO and the composite. Shi et al. [46] also carried out a study on the effect of GO on MO adsorption. They stated that a GO excess in the adsorbent can be detrimental to MO removal; once formulation was optimized, saturation capacity increased up to 543.4 mg/g. pH influences adsorption too: acidic pH results in highest MO removals, due to the accumulation of positive charges on the adsorbent surfaces. Other chitosan-based porous structures were employed for MO removal, incorporating MOFs and GO in the chitosan framework [47]. Indeed, in this case, it was confirmed that smaller amounts of filler result in improved dye adsorption, provided that a balance between chemical and physical adsorption is ensured: respectively, they are associated with surface functional groups and pore size distribution. Using optimized adsorbent formulation, the maximum adsorption capacity was about 412 mg/g.
To the best of our knowledge, it is not reported any attempt to use nanostructured chitosan-based aerogels produced using SC-CO2 gel drying for MO adsorption. Therefore, the aim of this work is to produce chitosan aerogels via supercritical drying, eventually loaded with GO, and to assess their utilization towards MO removal. Morphological analysis on the produced aerogels was carried out; the effect of driving force and adsorbent dosage were studied. Isotherm and kinetic analysis are also proposed, to understand how adsorption takes place onto nanostructured devices.

2. Materials and Methods

2.1. Materials

Chitosan (deacetylation degree ≥75%, medium molecular weight, viscosity 200-800 cps), acetic acid (purity ≥99%), sodium hydroxide (NaOH, reagent grade, purity ≥97.0%, pellets, anhydrous), graphene oxide, and methyl orange (dye content 85%) were bought from Sigma Aldrich (St. Louis, MO). Distilled water was produced in a home-made lab-scale distillation column. CO2 (99.9% pure) was purchased by Morlando Group Srl (Napoli, Italy).

2.2. Methods

2.2.1. Chitosan-Based Gels Preparation

Pure chitosan hydrogel were prepared using a 3% w/w polymer concentration in a 3% v/v acetic acid aqueous solution; whereas, CH-GO hydrogels were obtained following this procedure: the amount of GO corresponding to 10% w/w with respect to chitosan weight was suspended in distilled water and sonicated to guarantee graphene sheets exfoliation and homogenous dispersion in water; then, chitosan was added and mixed in the as-prepared suspension. The obtained chitosan-based solutions were stirred at 300 rpm and degassed to remove air bubbles. Sol-gel transition was ensured by adding dropwise a 1 M NaOH solution, until pH increased up to 13. pH was monitored using a pH-meter (Hanna Instrument, mod. HI 2210). Once this transition was over, residual salts were removed by rinsing thoroughly the hydrogel using distilled water.
Solvogels were obtained gradually swapping water with ethanol, employing water/ethanol solutions with increasing ethanol concentrations, namely: 10, 30, 50, 70, 90 and 100% v/v. Each solvent exchange step lasted 1 hour, exception being made for the last one, that lasted overnight.

2.2.2. Supercritical Gel Drying

Once solvogels were obtained, supercritical drying was performed on the obtained samples. Specifically, they were dried at 200 bar and 35 °C, and using a CO2 mass flow rate of 0.8 kg/h, accordingly to previous experiments carried out by our research group on this matter [36]. SC-CO2 drying was carried out following this procedure: samples were loaded in a high-pressure vessel, whose volume is 300 cc; CO2 was liquefied passing through a refrigerating bath (Julabo, mod. ED-F35) filled with ethylene glycol, to avoid cavitation during pumping. This latter step was achieved using a high-pressure pump (Gilson, mod. 146562). Before reaching the high-pressure vessel, pressurized CO2 was preheated using thin heating bands, to ensure reaching supercritical conditions. Then, SC-CO2 passes in the vessel, and extracts the ethanol embedded in the solvogel. The mixture ethanol-CO2 was separated in a vessel operated at room conditions. Pressure was regulated using a micro-metering valve (Milli-Mite 1300 Series HOKE); CO2 flow rate was monitored using a calibrated rotameter. Temperature was continuously monitored and controlled along the process line, using thermocouples coupled with electrical resistances or heating bands, regulated by PID controllers (Watlow, mod. 93). Pressure was monitored using test gauges. Each drying was carried out in a continuous way, and was set to last about 6 hours. Once drying was over, depressurization was slowly achieved by using a depressurization rate of about 3 bar/min. Each drying experiment was carried out at least three times.

2.2.3. Characterizations

CH and CH-GO morphology was analyzed using field emission scanning electronic microscopy (FESEM, Carl Zeiss Supra 35). Aerogels were cryofractured in liquid nitrogen and coated with gold using a sputter coater (Agar auto sputter coater, mod. 108 A, Stansted, UK), operated for 180 s. At least three different sections were analyzed to check process repeatability and morphological homogeneity. Pore size distribution was evaluated using SigmaScan Pro 5 as analysis software.

2.2.4. Adsorption Experiments

Adsorption experiments were carried out batch-wise at room conditions and spontaneous pH, agitating a known amount of adsorbent at 300 rpm. A MO stock solution was prepared, and by successive dilutions the desired initial concentrations (C0), i.e., 10, 25, 50, and 100 ppm, for the experiments were obtained. MO concentration was monitored using a UV-Vis spectrophotometer (Model Cary 60, Varian, Palo Alto, CA, USA), after implementing a calibration curve: the equation used for calibration is A=0.75·C, where “A” is the measured absorbance, and “C” is the concentration. The results were elaborated using this nomenclature: “Ceq” (ppm) is the equilibrium concentration in the dyed solution; “qt” is the adsorbed amount per unit of adsorbent mass, at an instant of time “t” (mg/g). Consistently, “qeq” is the adsorbed amount per unit of adsorbent mass at equilibrium conditions (mg/g). Either qt or qeq are calculated as (C0-C) ·Vsolution/madsorbent. Removal efficiency, i.e., “η”, is calculated as (C0-Ceq)·100/C0. Adsorption experiments were carried out in triplicate.
Isotherm and kinetic analysis were carried out by linearizing the experimental data as indicated by the equations of interest. Linear regression analysis was performed by an in-built statistical calculus in the program Origin 2018.

3. Results

3.1. Aerogel Morphology

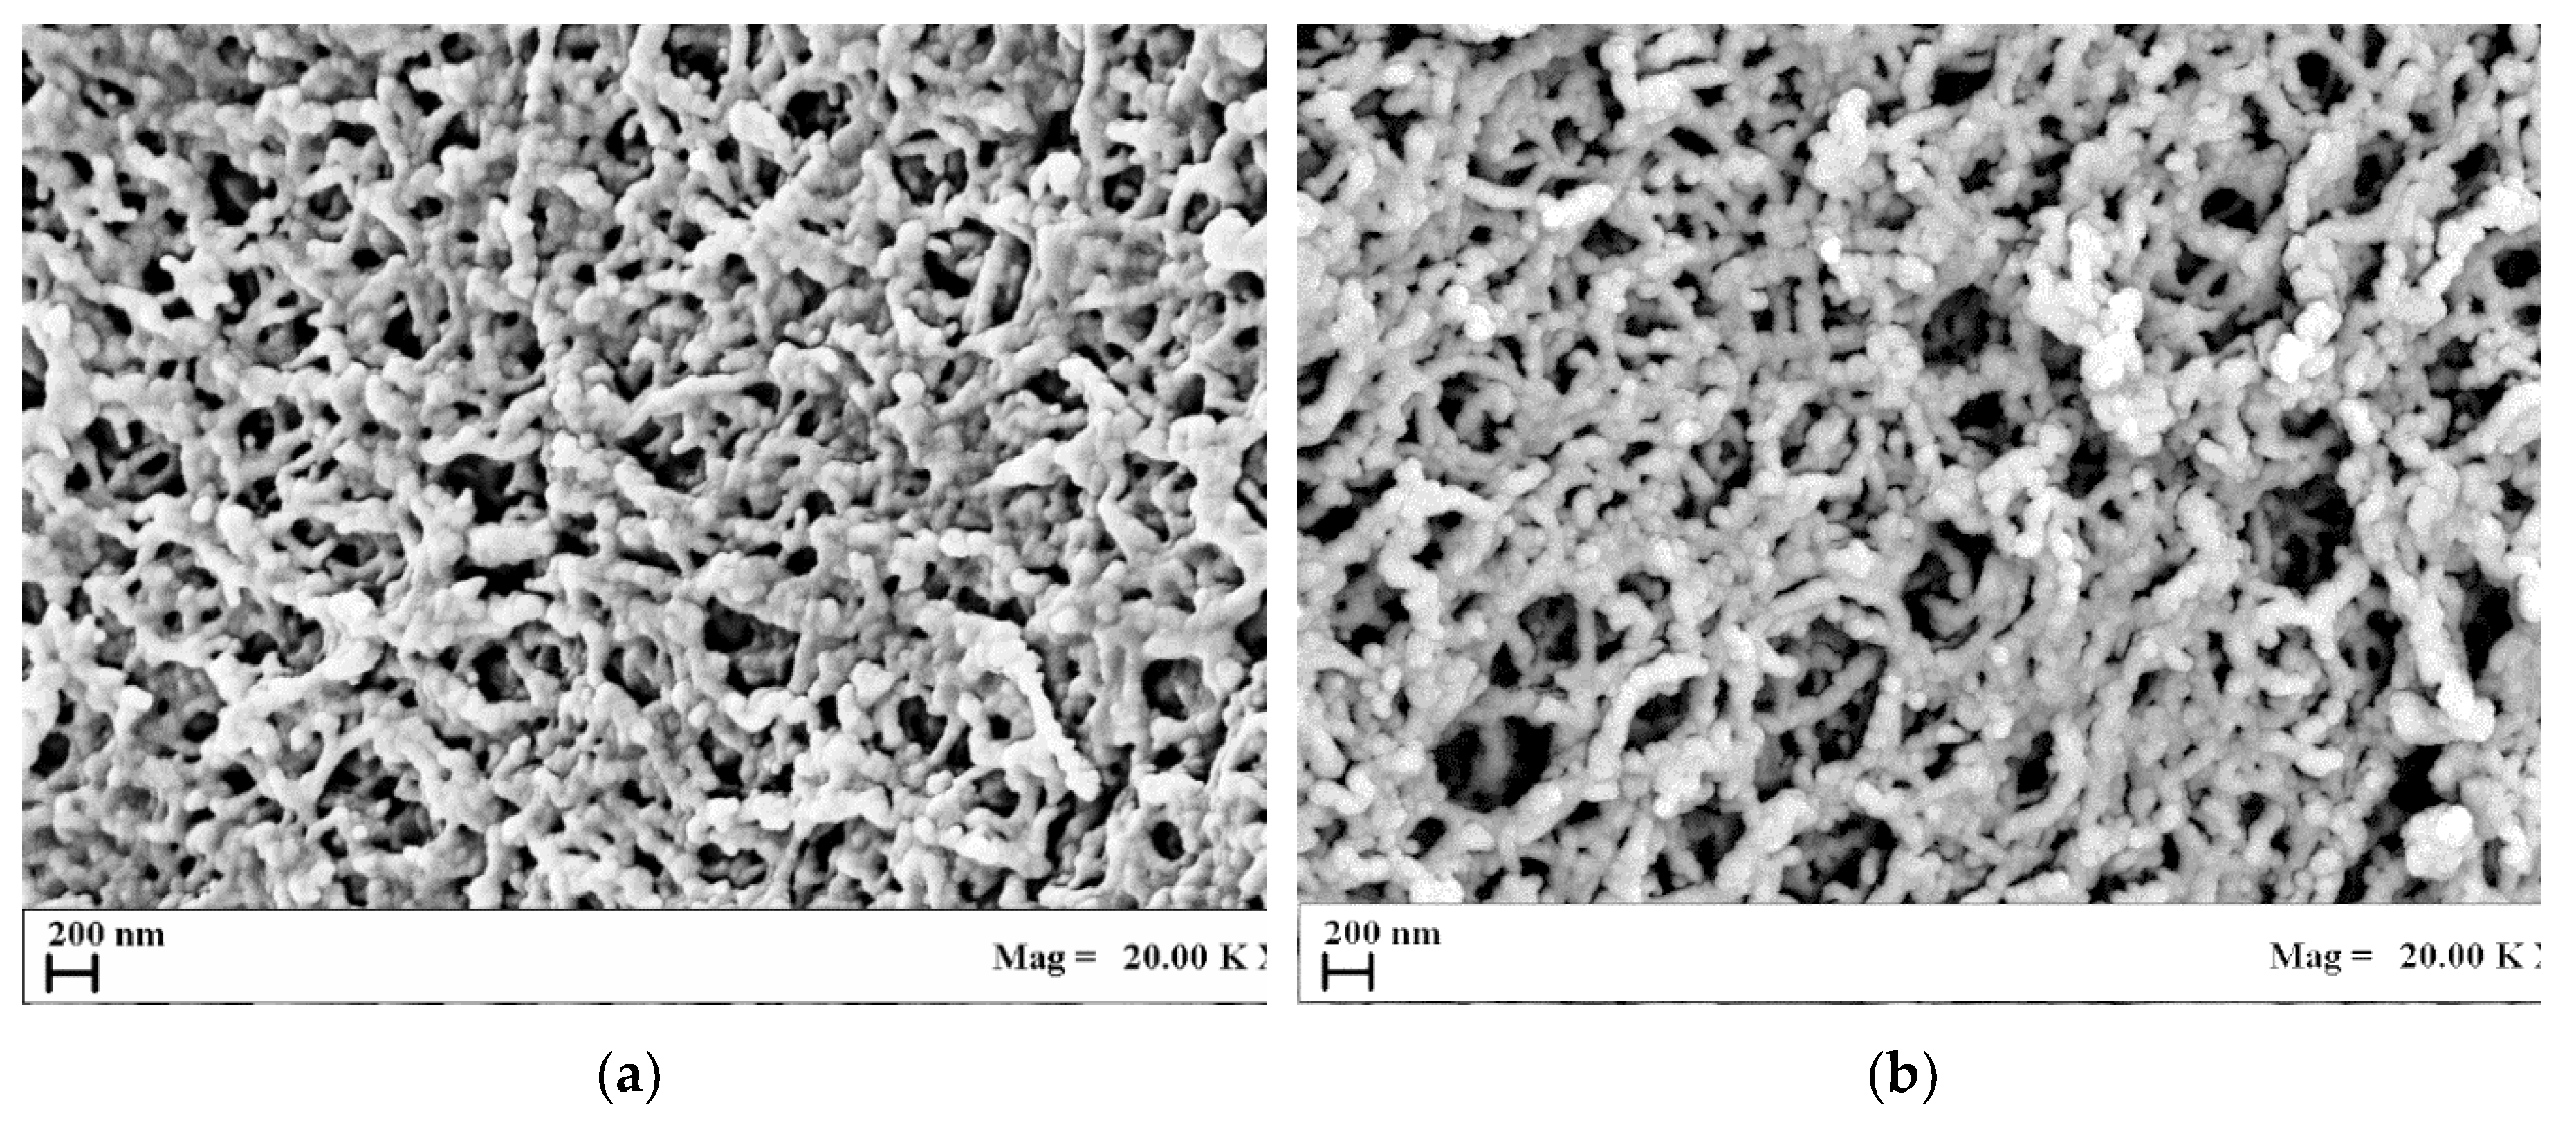
Prior to adsorption experiments, it is important to assess adsorbent general characteristics. Most of all, morphological analysis provides an idea of the tortuosity the dye must overcome to intrude in the inner adsorbent nanostructure. Figure 1 reports FESEM images of CH and CH-GO aerogel cross sections.
Figure 1. FESEM images of: (a) CH; (b) CH-GO cross sections.
Preprints 113389 g001
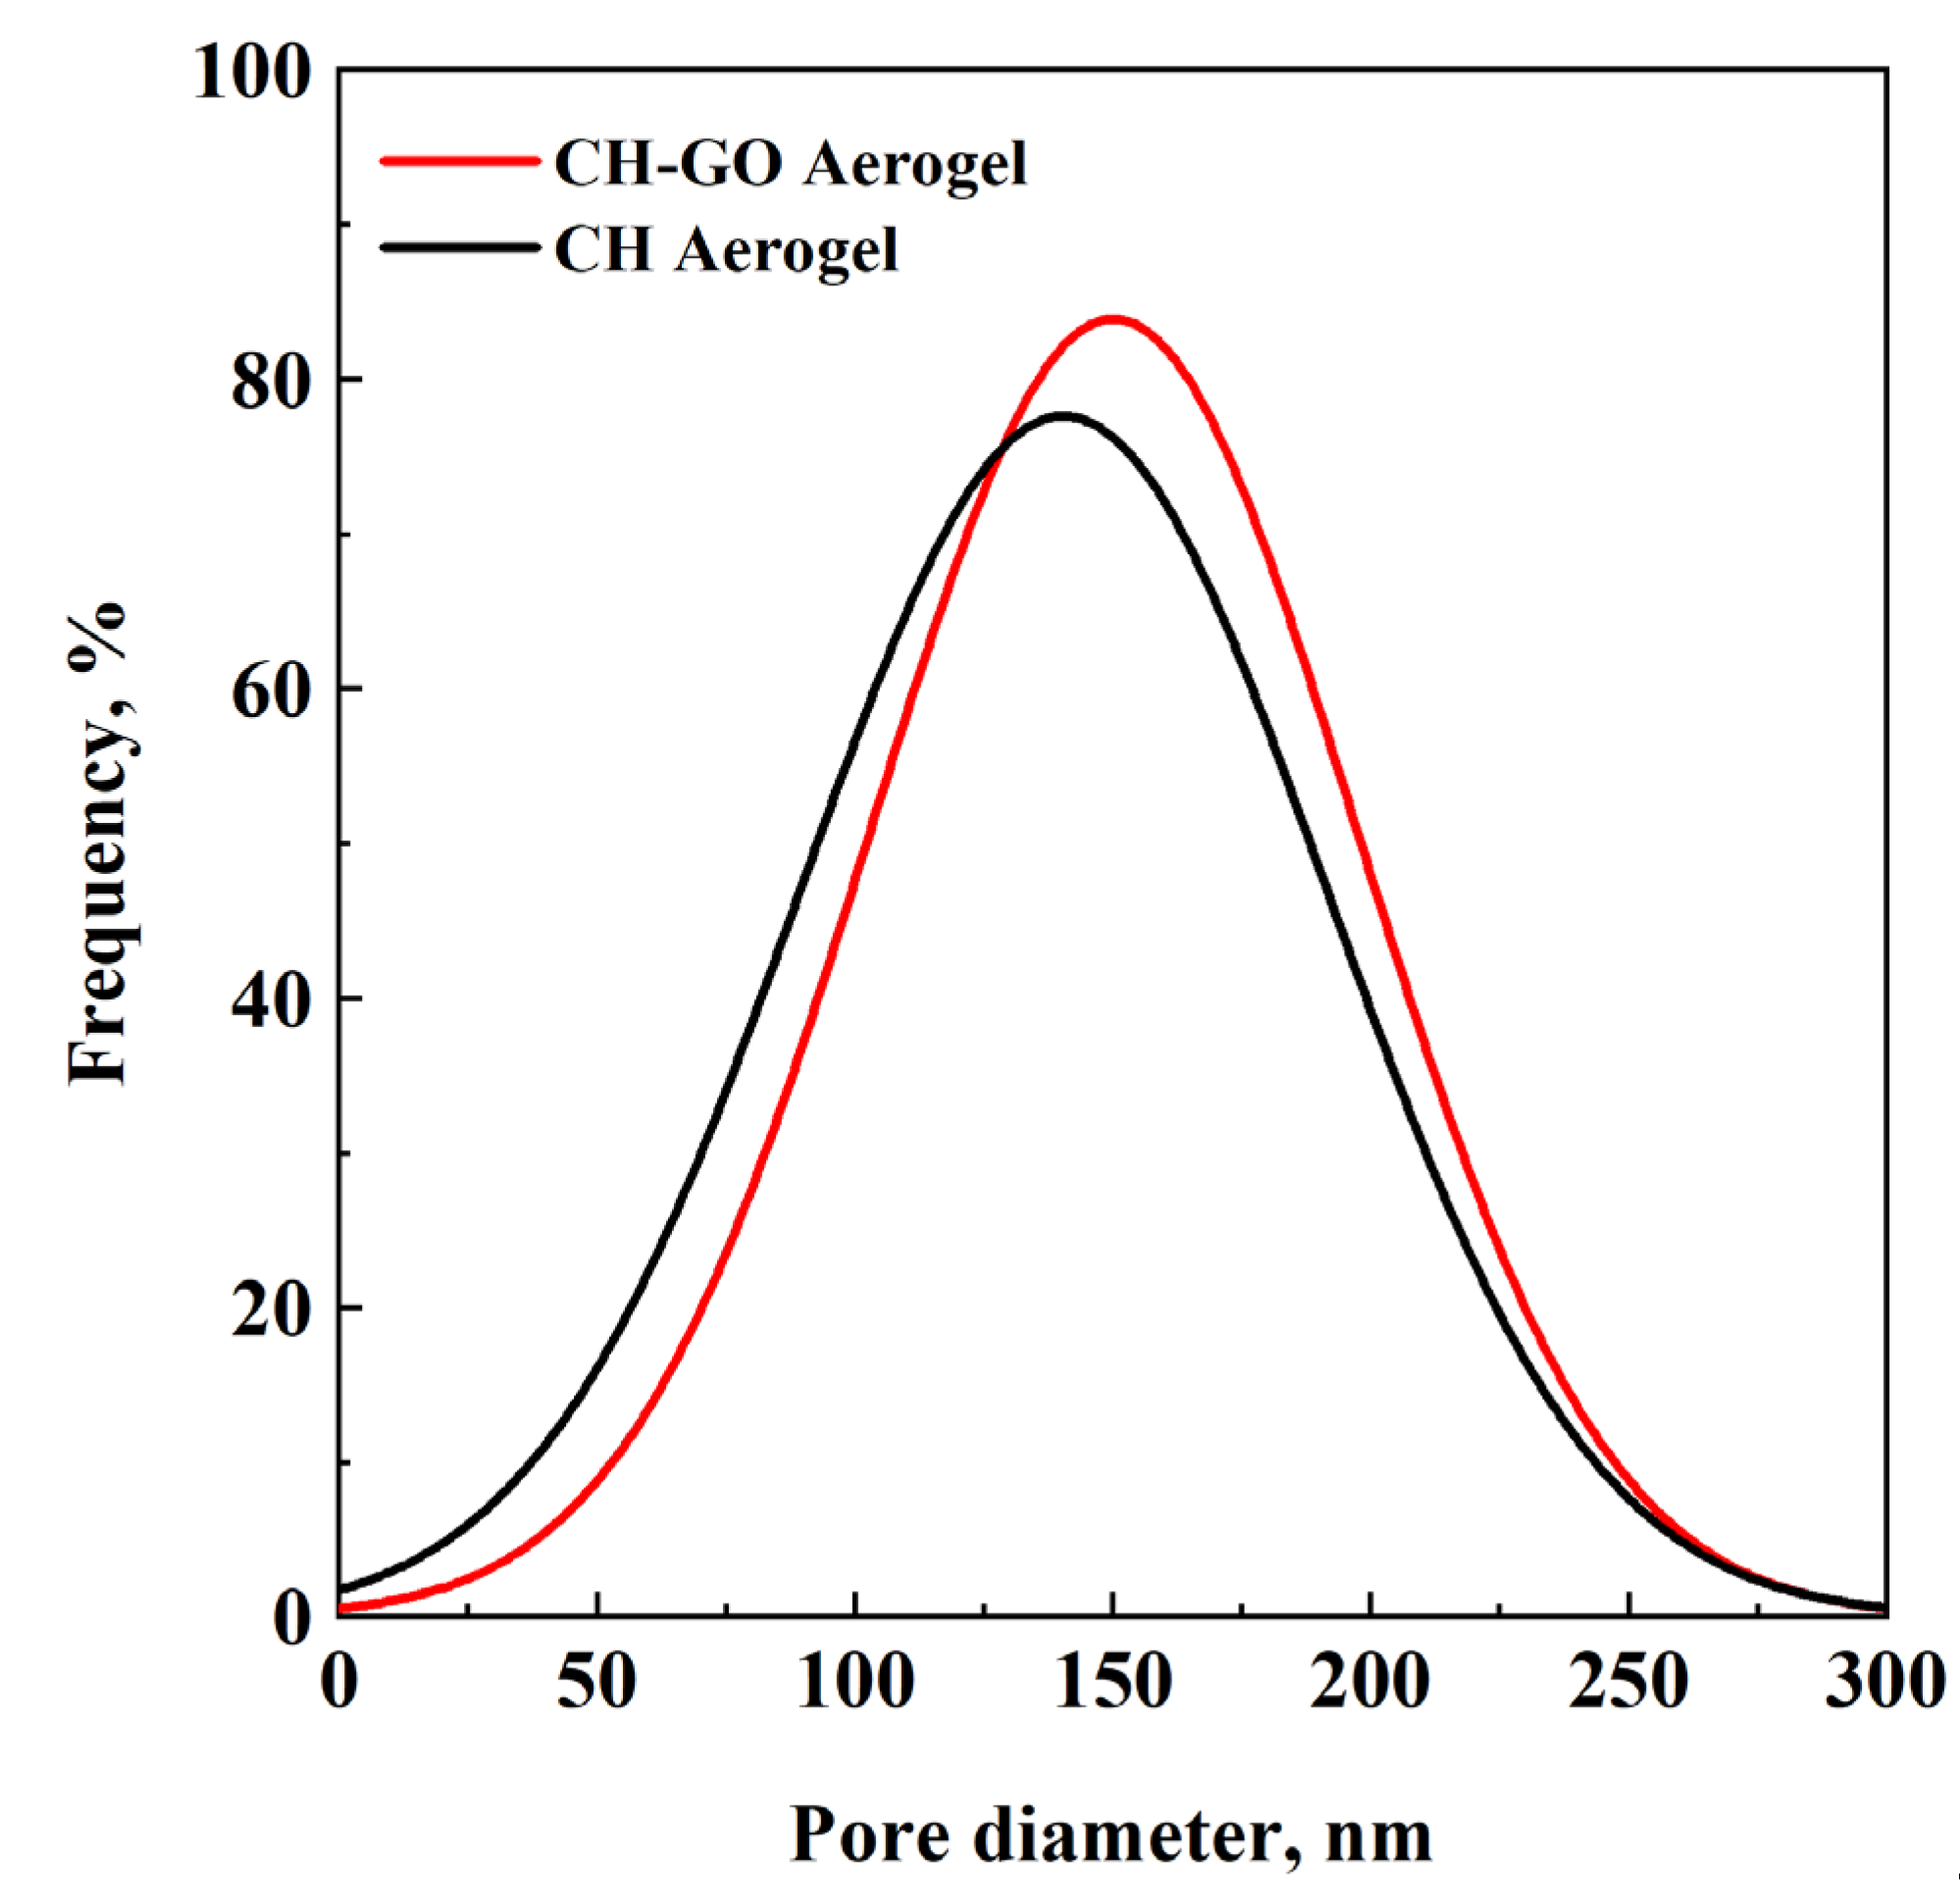
Figure 2. Pore Size Distribution of CH and CH-GO aerogels.
Preprints 113389 g002
The mean pore diameter is about 150 ± 40 nm in both cases. Pore size distributions are relevant for adsorption purposes: indeed, a variation in mean pore size and standard deviation could result in different internal mass transfer phenomena faced by the dye, during diffusion. Therefore, potential differences in the adsorption outcomes between the two adsorbents can be associated with different chemical interactions, rather than morphological discrepancies.

3.2. Effect of Driving Force

To begin, the effect of MO driving force in the range 25-100 ppm was studied. This approach is useful for multiple purposes, namely: it is needed to collect equilibrium points to obtain the adsorption isotherms; moreover, it can provide a comparison between pure chitosan and GO-loaded chitosan aerogels. For this first analysis, an adsorbent dosage of 1 g/L was employed, using 50 mg of adsorbent in 50 mL MO solution. In Figure 3, it is reported the collection of MO concentration vs. time experimental points. Moreover, the most relevant results are collected in Table 1.
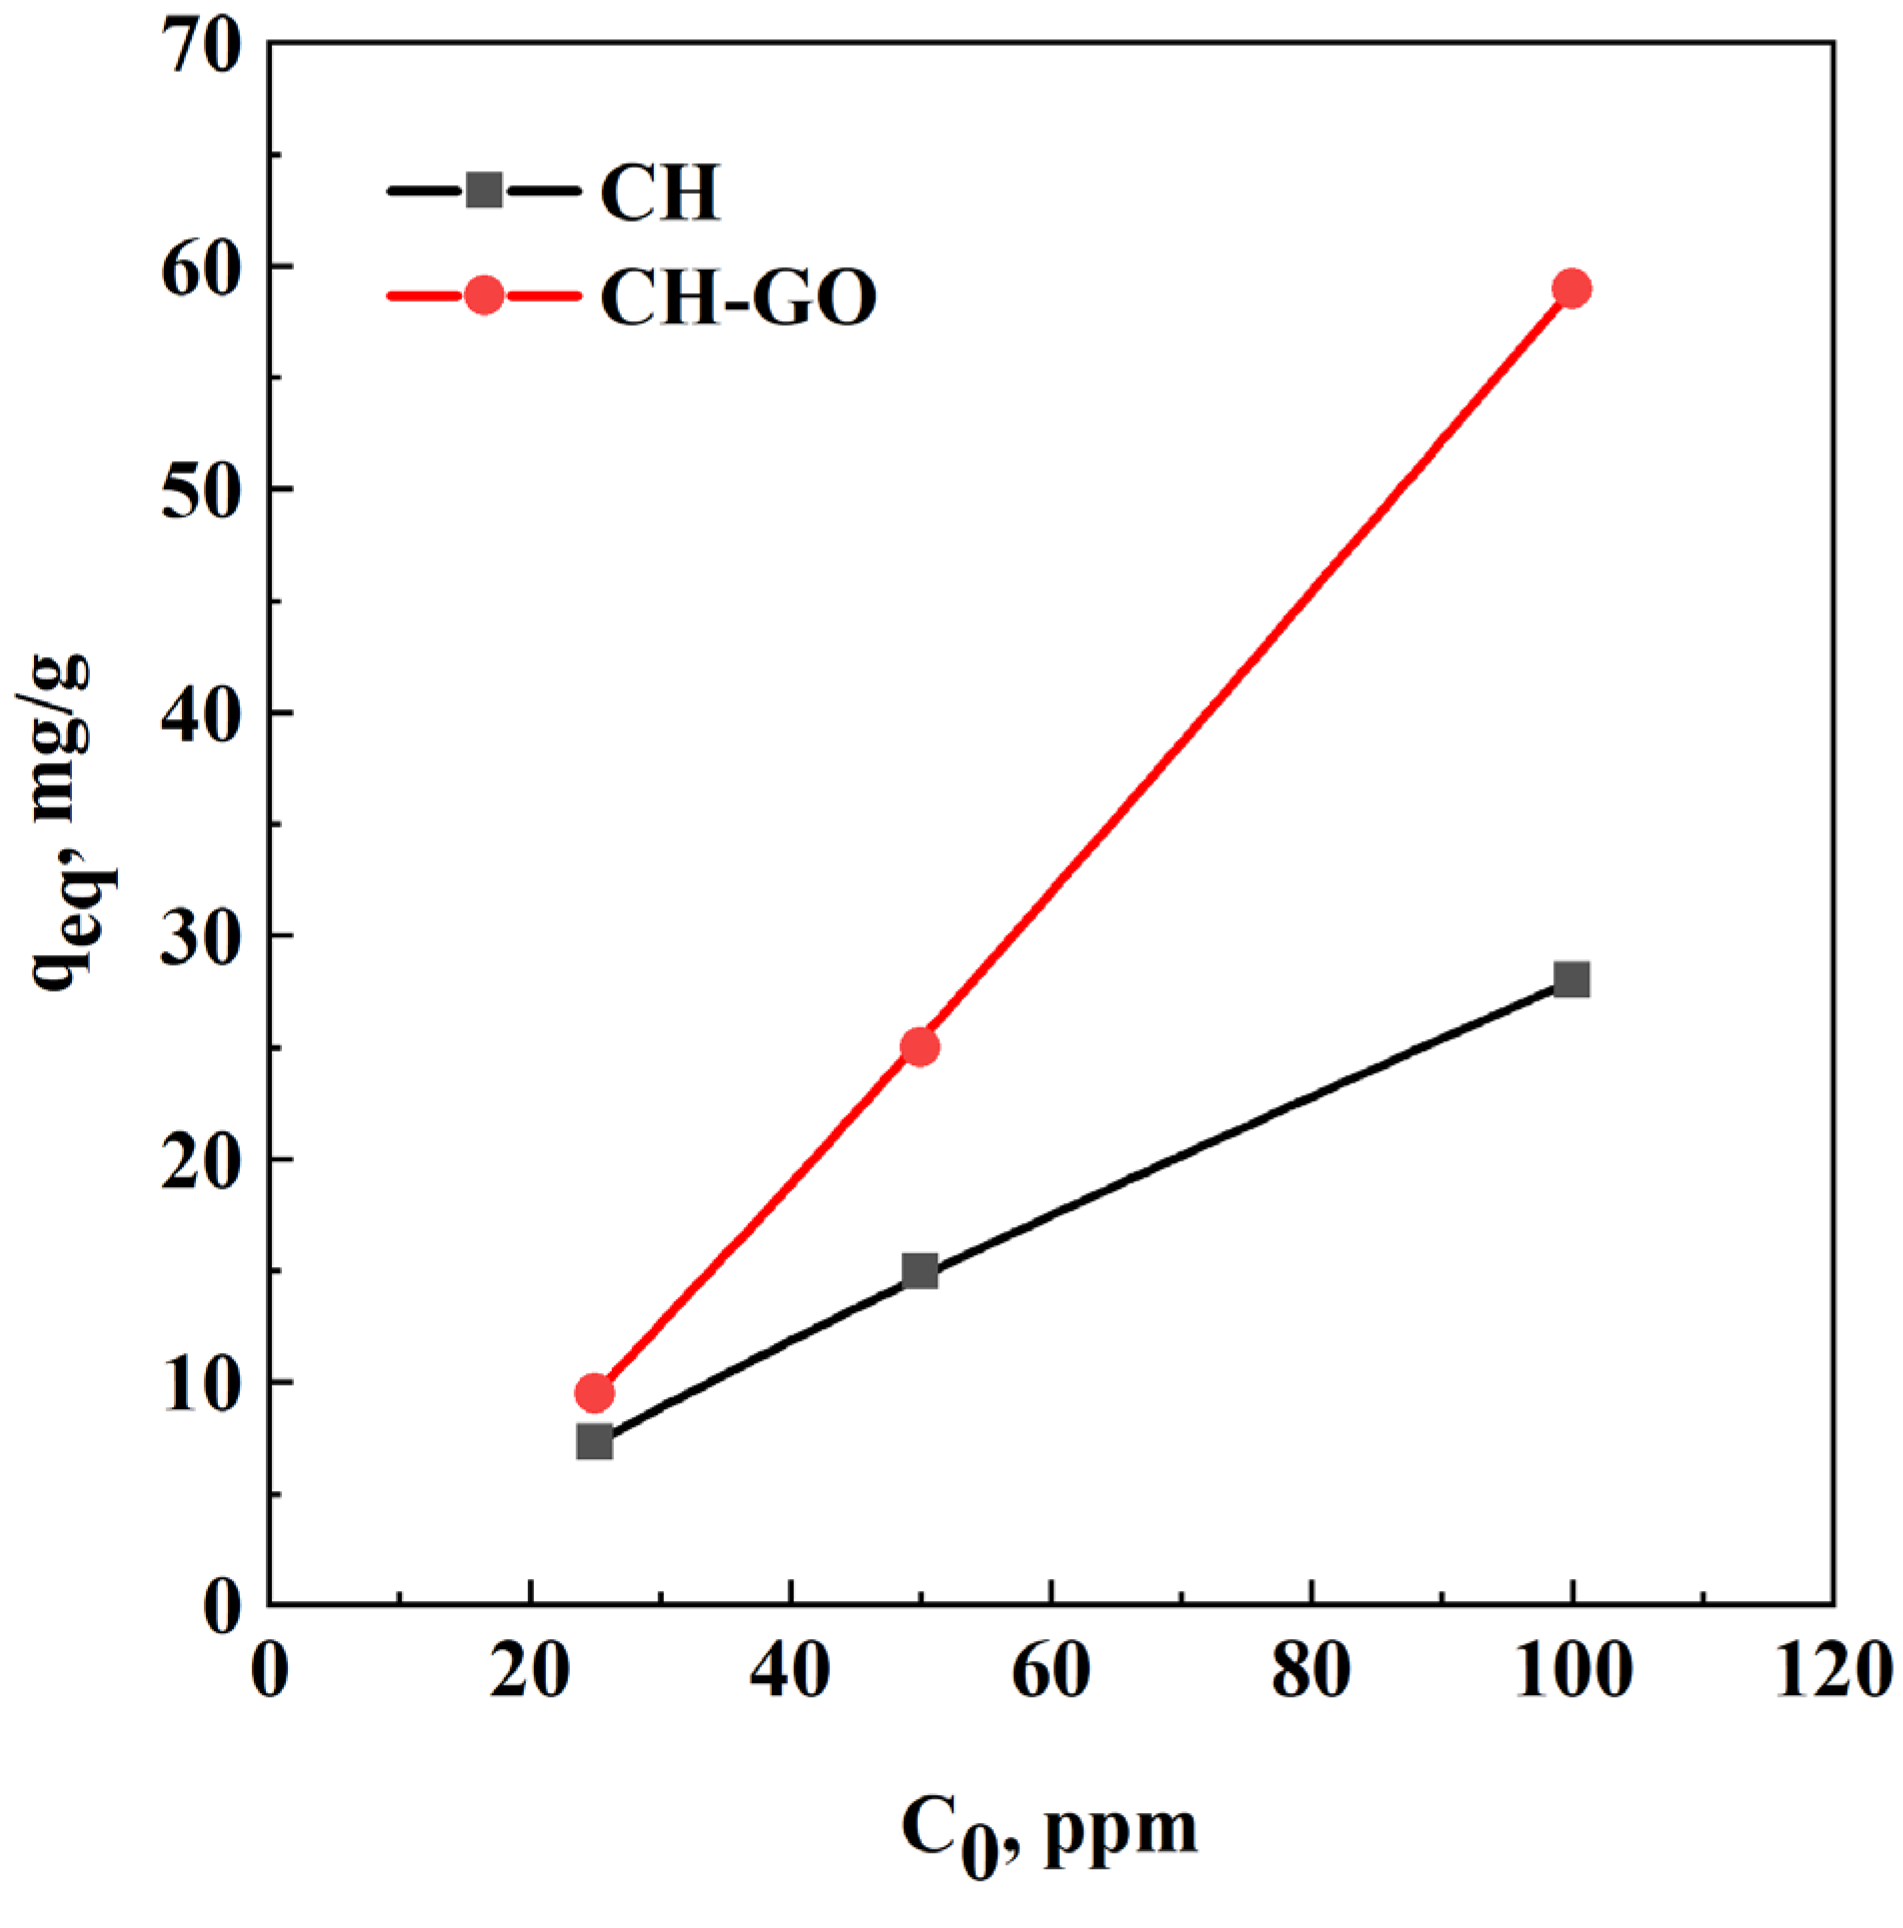
The obtained experimental points follow the expected trend of exponential decrease: the larger is the contact time, the higher it is the amount of dye adsorbed until equilibrium is reached. First, initial MO concentration, namely the driving force, plays a significant role in the adsorption process, using either CH or CH-GO adsorbents. For instance, looking at the data in Table 1 related to pure CH aerogels, the adsorption capacity increases linearly with the driving force. In addition, the values of qeq obtained in the studied range of initial concentrations seem not to approach to a plateau value: it means that the structure could still take up MO molecules if larger driving forces were employed. Further indication of this behavior can be found analyzing the η values: especially for CH-GO, adsorption efficiency increases from 38% to 59% once C0 is moved from 25 to 100 ppm: adsorbents active sites were not fully employed at small driving forces. Therefore, low adsorption efficiencies detected at small initial concentrations are not due to active sites unavailability; but, more likely to kinetic limitations.
As far as the addition of graphene oxide is concerned, it shows a positive effect towards MO uptake. However, such effect can be appreciated once driving force is increased, since the experiments carried out at 25 ppm show basically an overlap with experimental points, also at equilibrium conditions. The explanation to this behavior can be associated with the effect of the driving force: if dye intrusion is limited by small concentration gradients, few MO molecules can diffuse inside the nanostructure. Therefore, there is no chance to establish more numerous adsorbate-adsorbent interactions, either with chitosan or graphene oxide active sites. On the other hand, when molecules are allowed to intrude in the nanostructure, the interaction between graphene oxide and MO is more likely to take place, showing the positive effect of compounding the filler within chitosan structure. A graphical representation of the effect of driving force on MO uptake is reported in Figure 4.
Figure 4 shows graphically the differences between CH and CH-GO performances towards MO adsorption. As mentioned before, graphene oxide addition shows remarkable differences with respect to pure chitosan aerogels only when employing large driving forces. It should be also remarked that such positive performances are obtained using a GO/CH mass ratio of 1:10: this consideration can be associated with the effective filler dispersion in the nanostructure. If filler clustering took place, GO would have offered smaller surfaces available for adsorption, limiting the effective interactions with the solute.
Overall, in this work it is possible to conclude that CH-GO aerogels are more efficient than pure CH ones, although small amounts of filler are introduced in the structure: therefore, further analyses will be carried out only on the composite aerogels.

3.3. Effect of Adsorbent Dosage

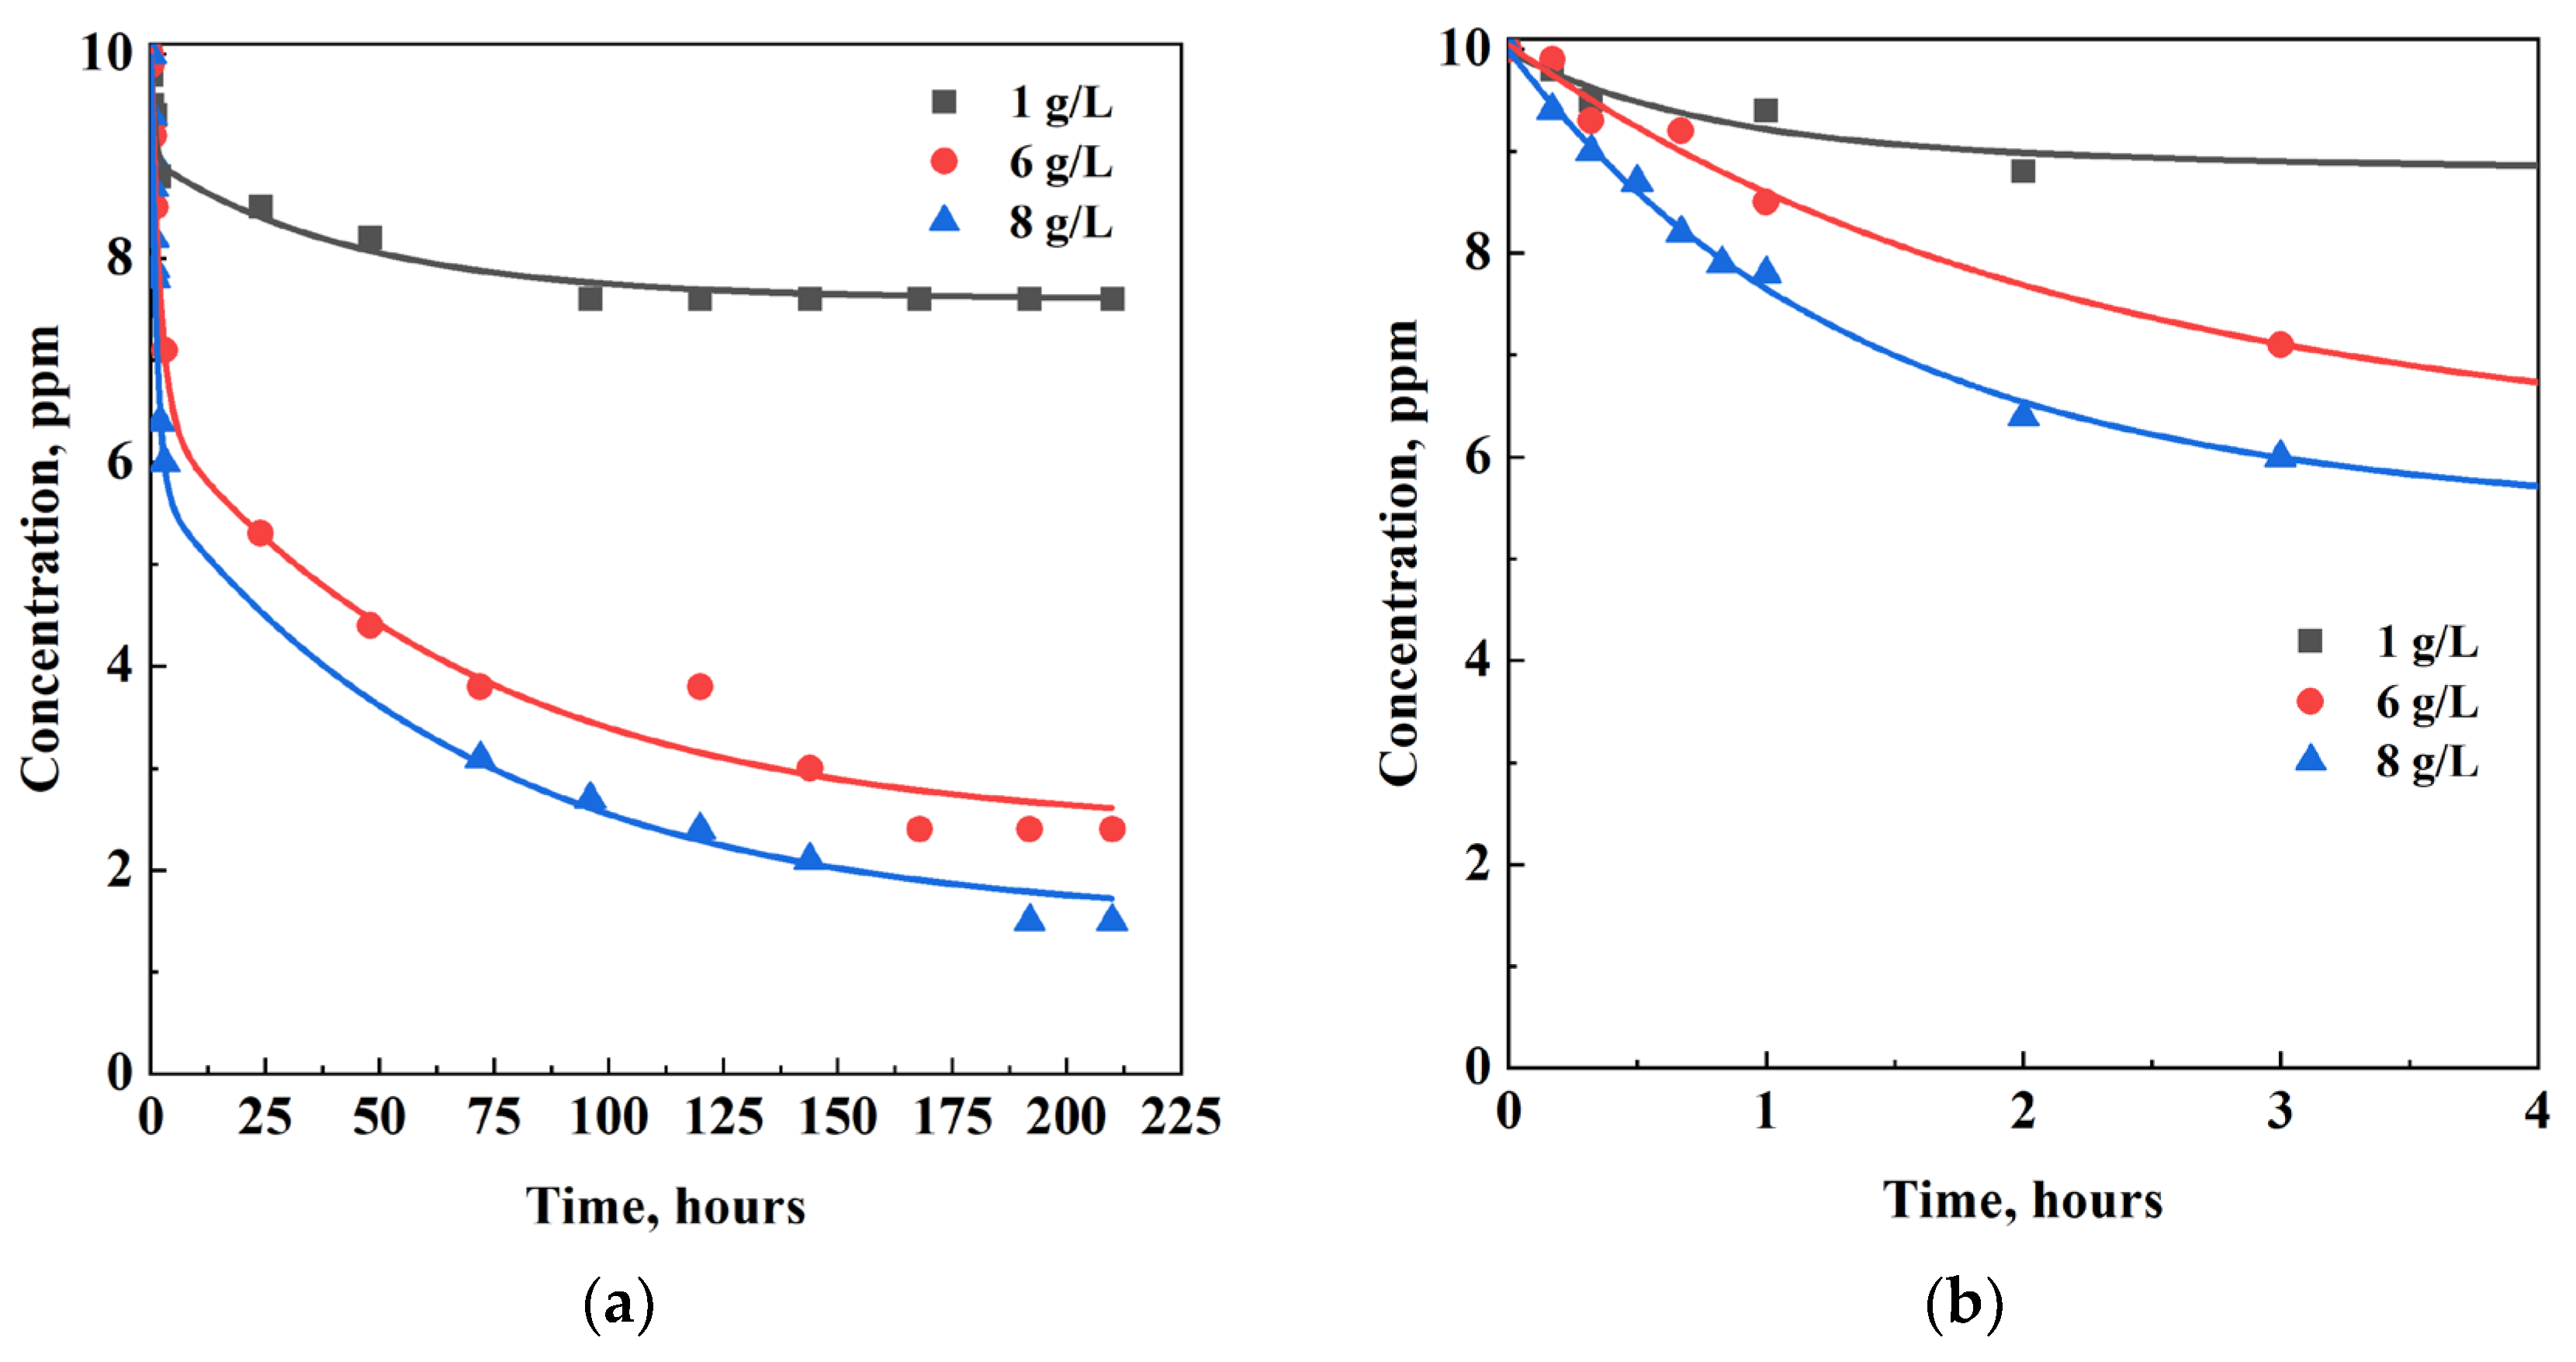
The effect of CH-GO dosage was studied on 50 mL of 10 ppm MO solutions, testing different adsorbent dosages, namely: 1, 6 and 8 g/L. The MO concentration vs. time experimental points, collected for each dosage, are reported in Figure 5, in which an enlargement of the first 4 hours is reported to appreciate the differences at small contact times. The equilibrium values and adsorption efficiencies related to each dosage are reported in Table 2.
As expected, high adsorbent dosages have a positive effect on MO uptake, although there is no linear trend between adsorbent mass and adsorbed amount. This consideration is valid both for equilibrium points (Figure 5a and Table 2), and for smaller contact times (Figure 5b). On the other hand, the effect of CH-GO dosage is relevant mainly at large contact times, whereas in the first steps of the process there is no large gap between the adsorbed amount of dye in the different cases.
Moreover, adsorption efficiencies increase from 24% to 85% using CH-GO dosage of 8 g/L instead of 1 g/L: such results prove that it is possible to remove a very large percentages of MO by using only 400 mg of CH-GO aerogel for 50 mL solutions.

3.4. Adsorption Isotherms

To obtain equilibrium points to build the adsorption isotherms of MO uptake by CH-GO, the data relative to the analysis carried out on the effect of driving force have been considered. There are several models and equations to be used to model dye uptake, but Langmuir (Equation 1) and Freundlich (Equation 2) are the most widespread ones [48].
C e q q e q = 1 q m a x K L + C e q q m a x
l n q e q = l n K F + 1 n l n C e q
Langmuir isotherm cannot describe correctly MO adsorption by CH-GO, whereas in previous works it was found that maximum adsorption capacity by CH adsorbents on MO was about 356 mg/g. Considering the overall better results obtained using CH-GO composites, it can be expected that they possess larger adsorption capacities at saturation.
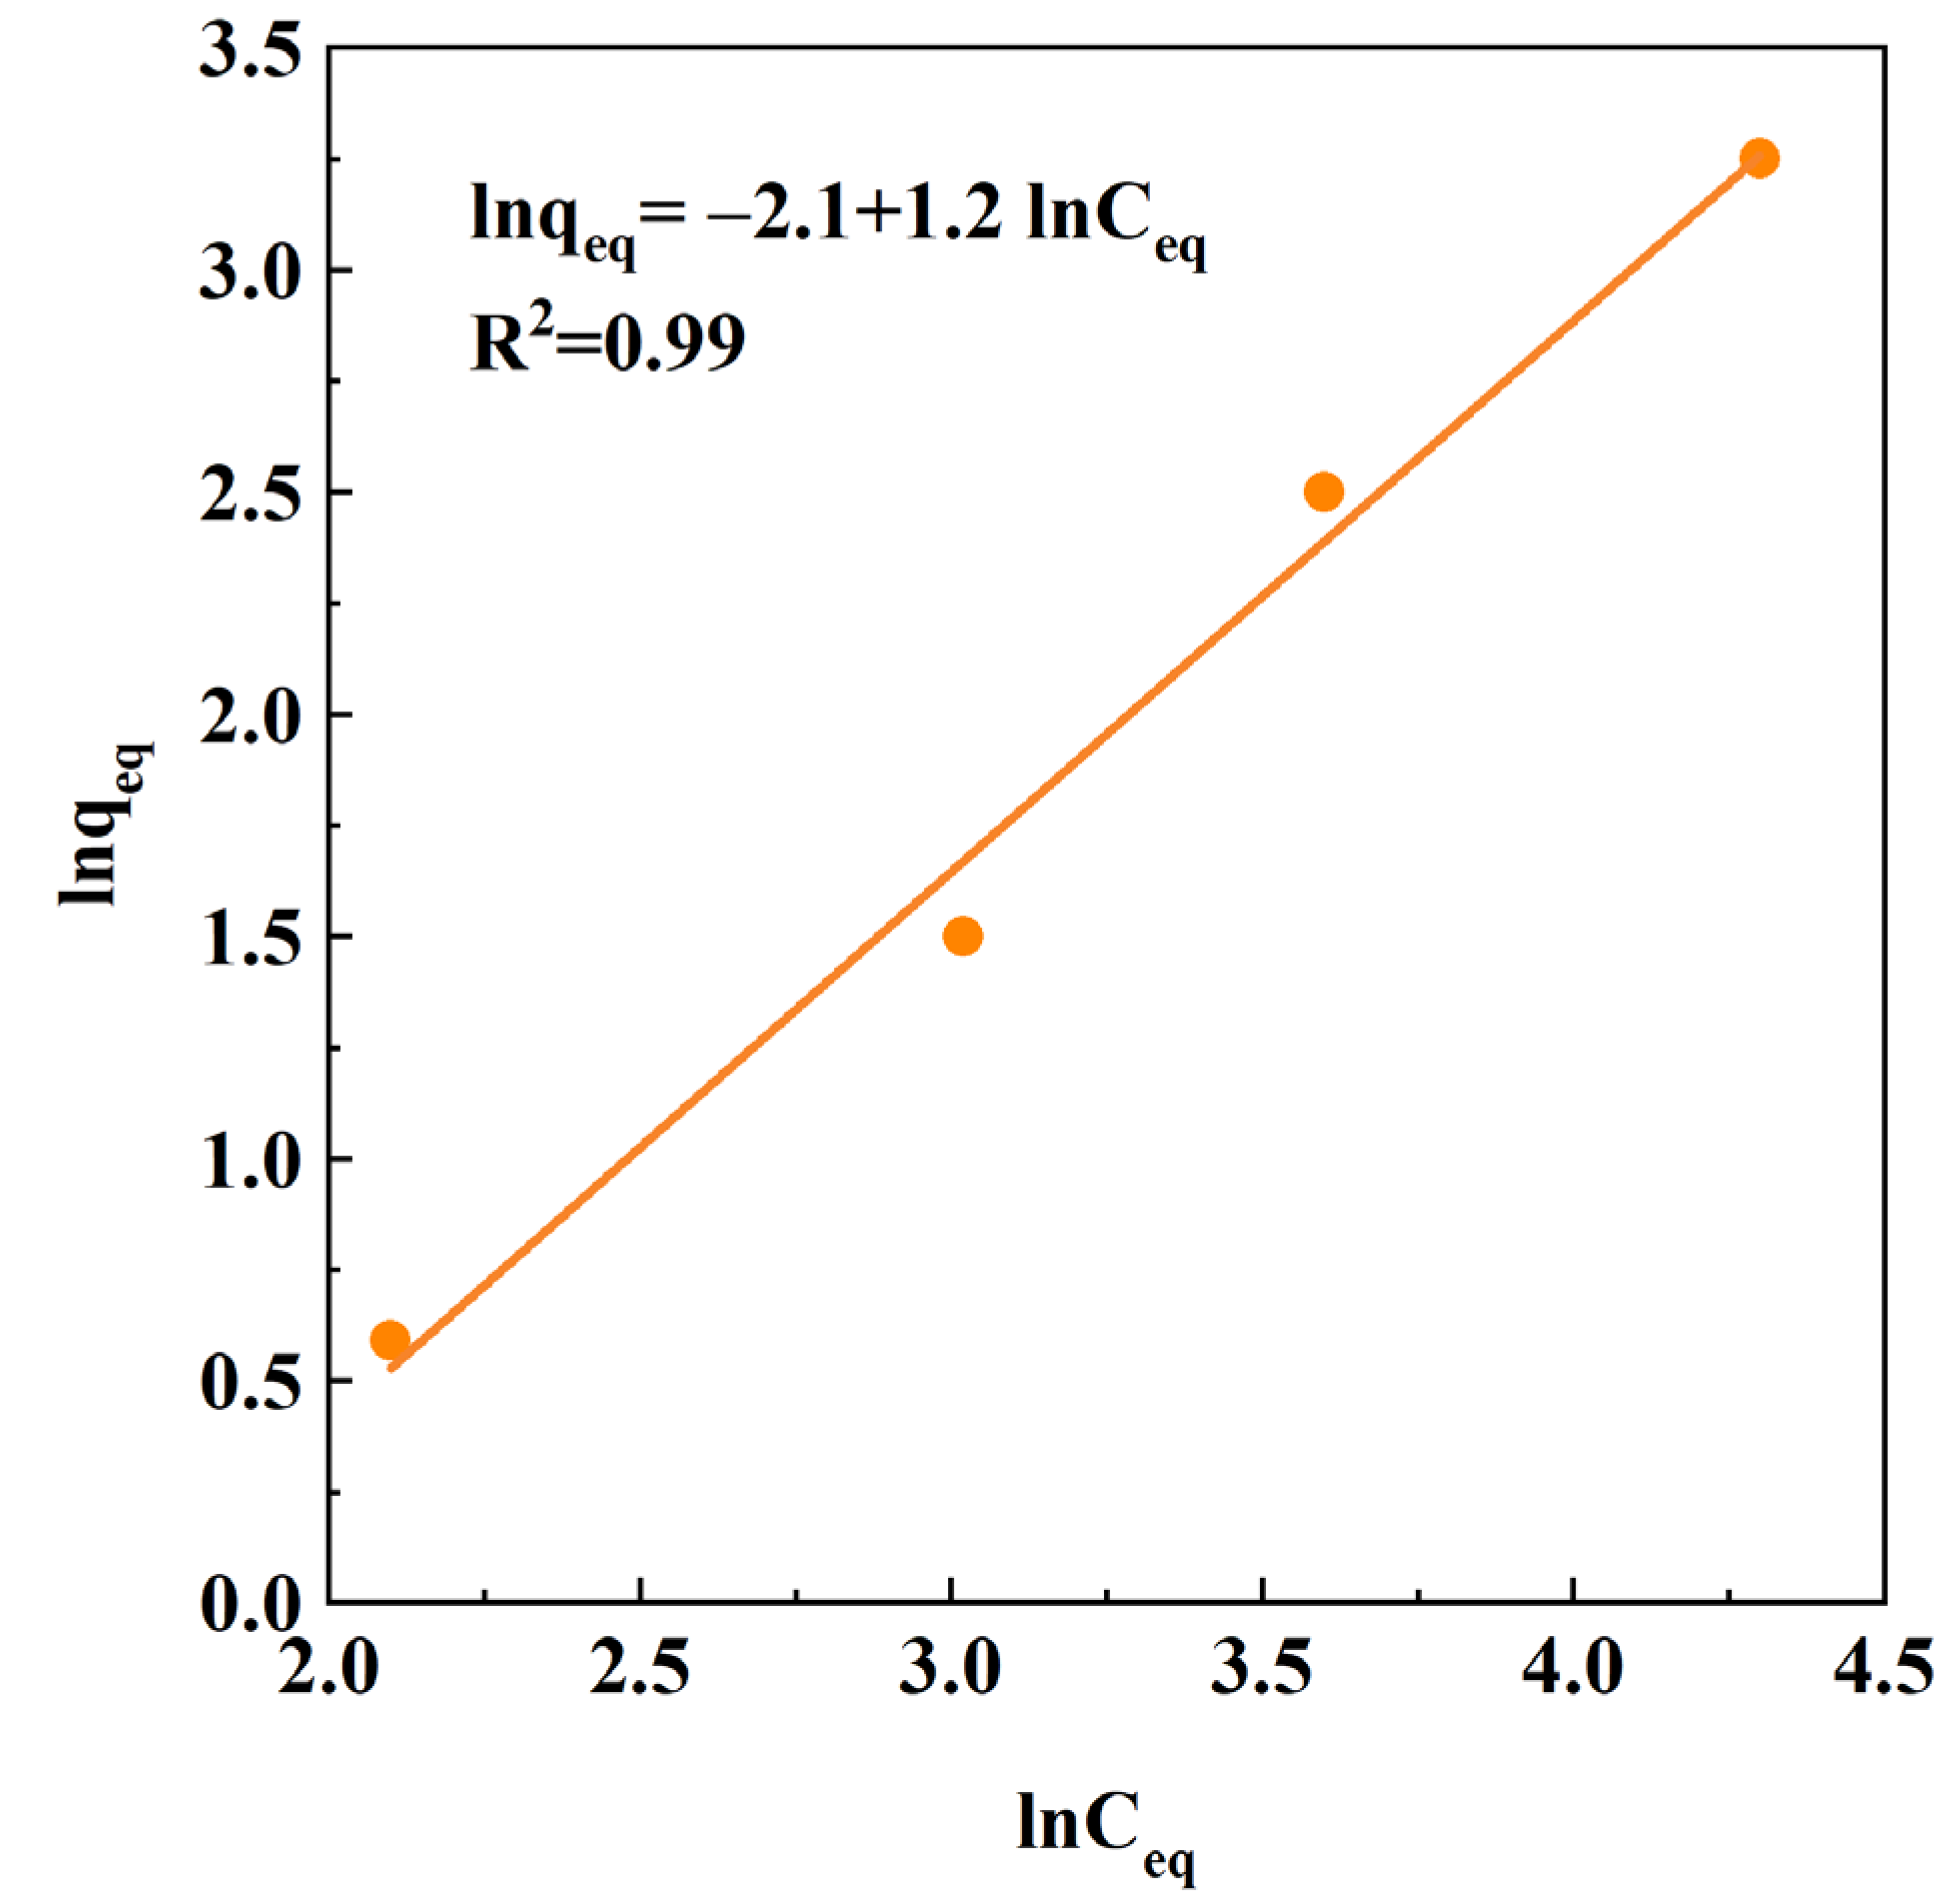
On the other hand, Freundlich isotherm describes much more accurately the behavior of the produced composite, although it does not allow the extrapolation of the maximum adsorption capacity. The data relative to Freundlich isotherm are reported in Figure 6.
The R2 parameter shown in Figure 6 proves that Freundlich is a good fit for the system methyl orange/CH-GO. Recalling Equation 2, the most relevant parameter are: KF and 1/n. KF, that is also called “Freundlich constant”, in this case, its value is 0.12 L/mg; 1/n is equal to 1.25. Indeed, by looking at the Freundlich isotherm, provided that Ceq is larger than e, it is noted that the larger is 1/n, the higher is the slope and the value of dye adsorbed corresponding to a fixed value of Ceq. In previous works carried out by our research group, the value of 1/n was lower than 1 for pure chitosan aerogels, meaning that the process is more favorable using CH-GO composites than pure CH.

3.5. Kinetic Analysis

The utilization of nanoporous aerogels is still uncommon in wastewater treatment; however, to have a general overview on the behavior of such adsorbents, it is crucial to perform kinetic analyses. In this part of the work, kinetic analysis was carried out on the data relative to different driving forces, i.e., C0=10, 25, 50, and 100 ppm. There are different kinetic models available in the scientific literature to describe the behavior of adsorbed matter over time; but, the most employed ones are: pseudo-first order (PFO) kinetics (Equation 3), pseudo-second order (PSO) kinetics (Equation 4), and intraparticle diffusion (IPD) model (Equation 5), whose equations are the following [48,49]:
ln q e q q t = k 1 t + l n q e q
t q t = 1 q e q t + 1 k 2 q e q 2
q t = I + K I D t 1 2
The pseudo-first order kinetic model associates the adsorption capacity directly with the “distance to equilibrium”; whereas, the pseudo-second order kinetic model involves the square of such distance. Indeed, it is reported that the PSO model is valid when adsorption takes place on two surface sites: therefore, it is a “heterogenous” interaction between the dye molecules and adsorbent active sites. Reportedly, it is the most frequent model used to describe dye adsorption kinetics.
Intraparticle diffusion model is interesting as well, since it associates the trend followed by the experimental data to specific mass transport phenomena, e.g.: mass transfer across the external boundary layer film; adsorption on the active sites; diffusion from the pores to the active sites. Reporting the data in a qt vs. t1/2 plot, if multilinearities are present, it is possible to understand if there are different mass transfer phenomena involved [50]. For this reason, in this work, a separate kinetic analysis has been dedicated to IPD model.
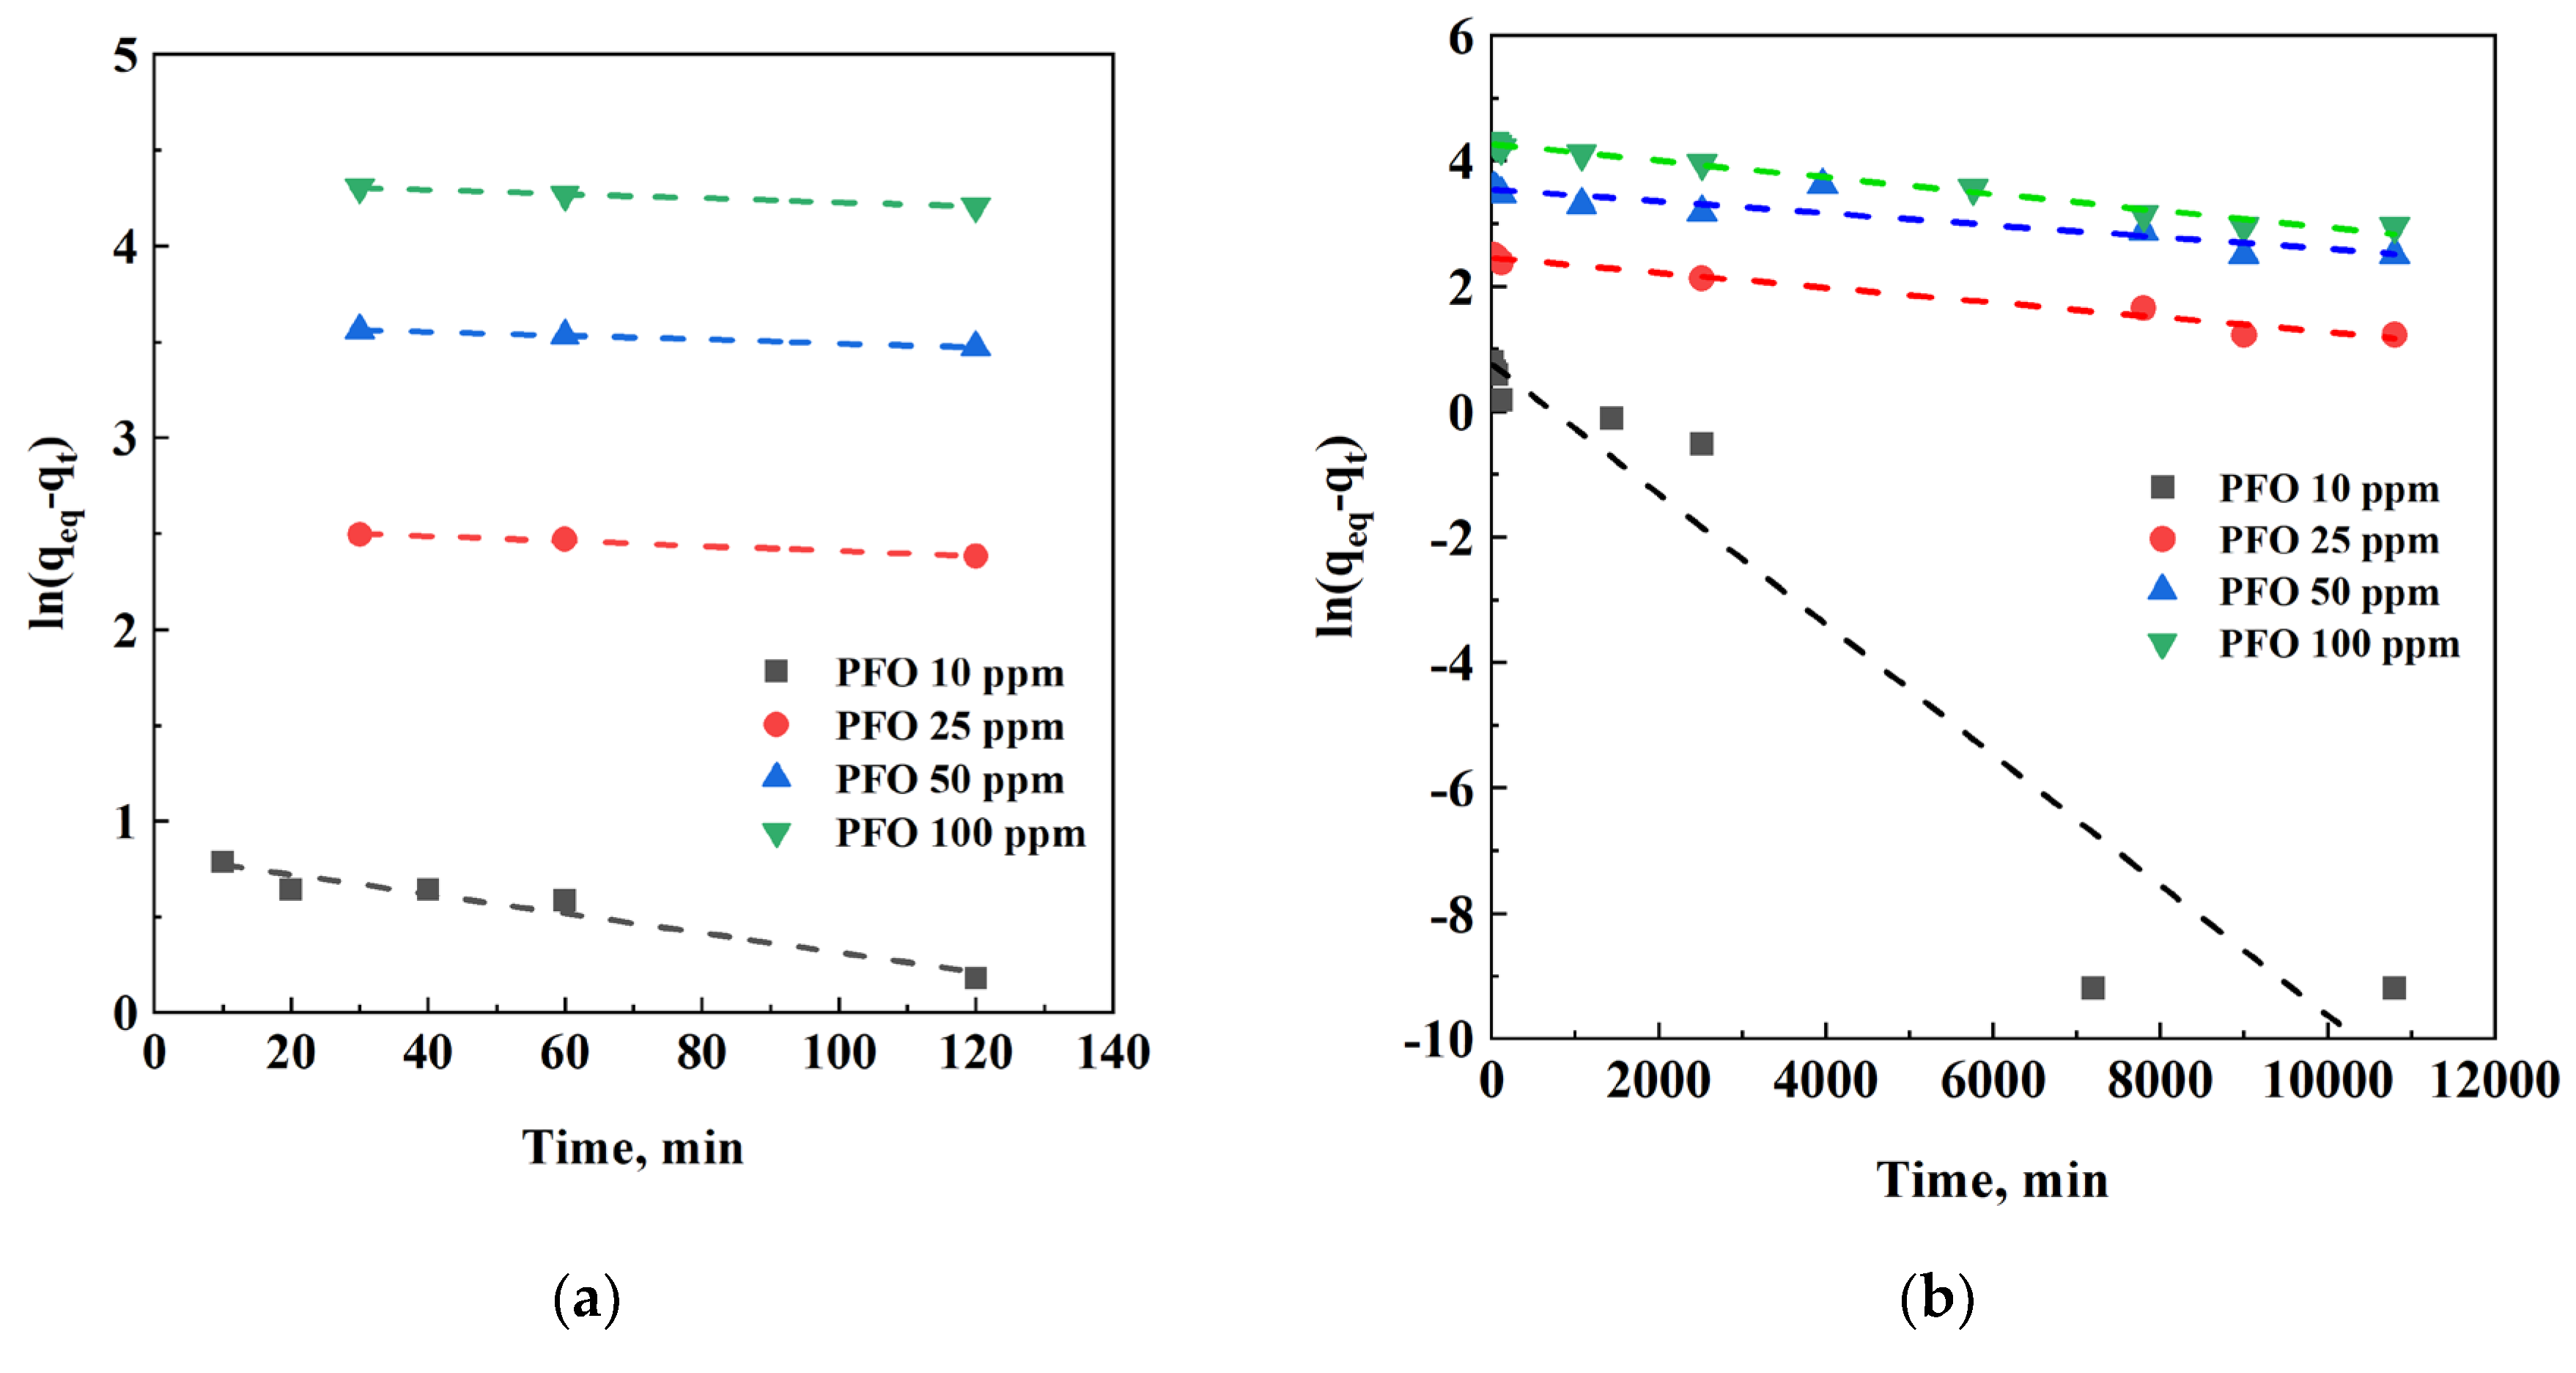
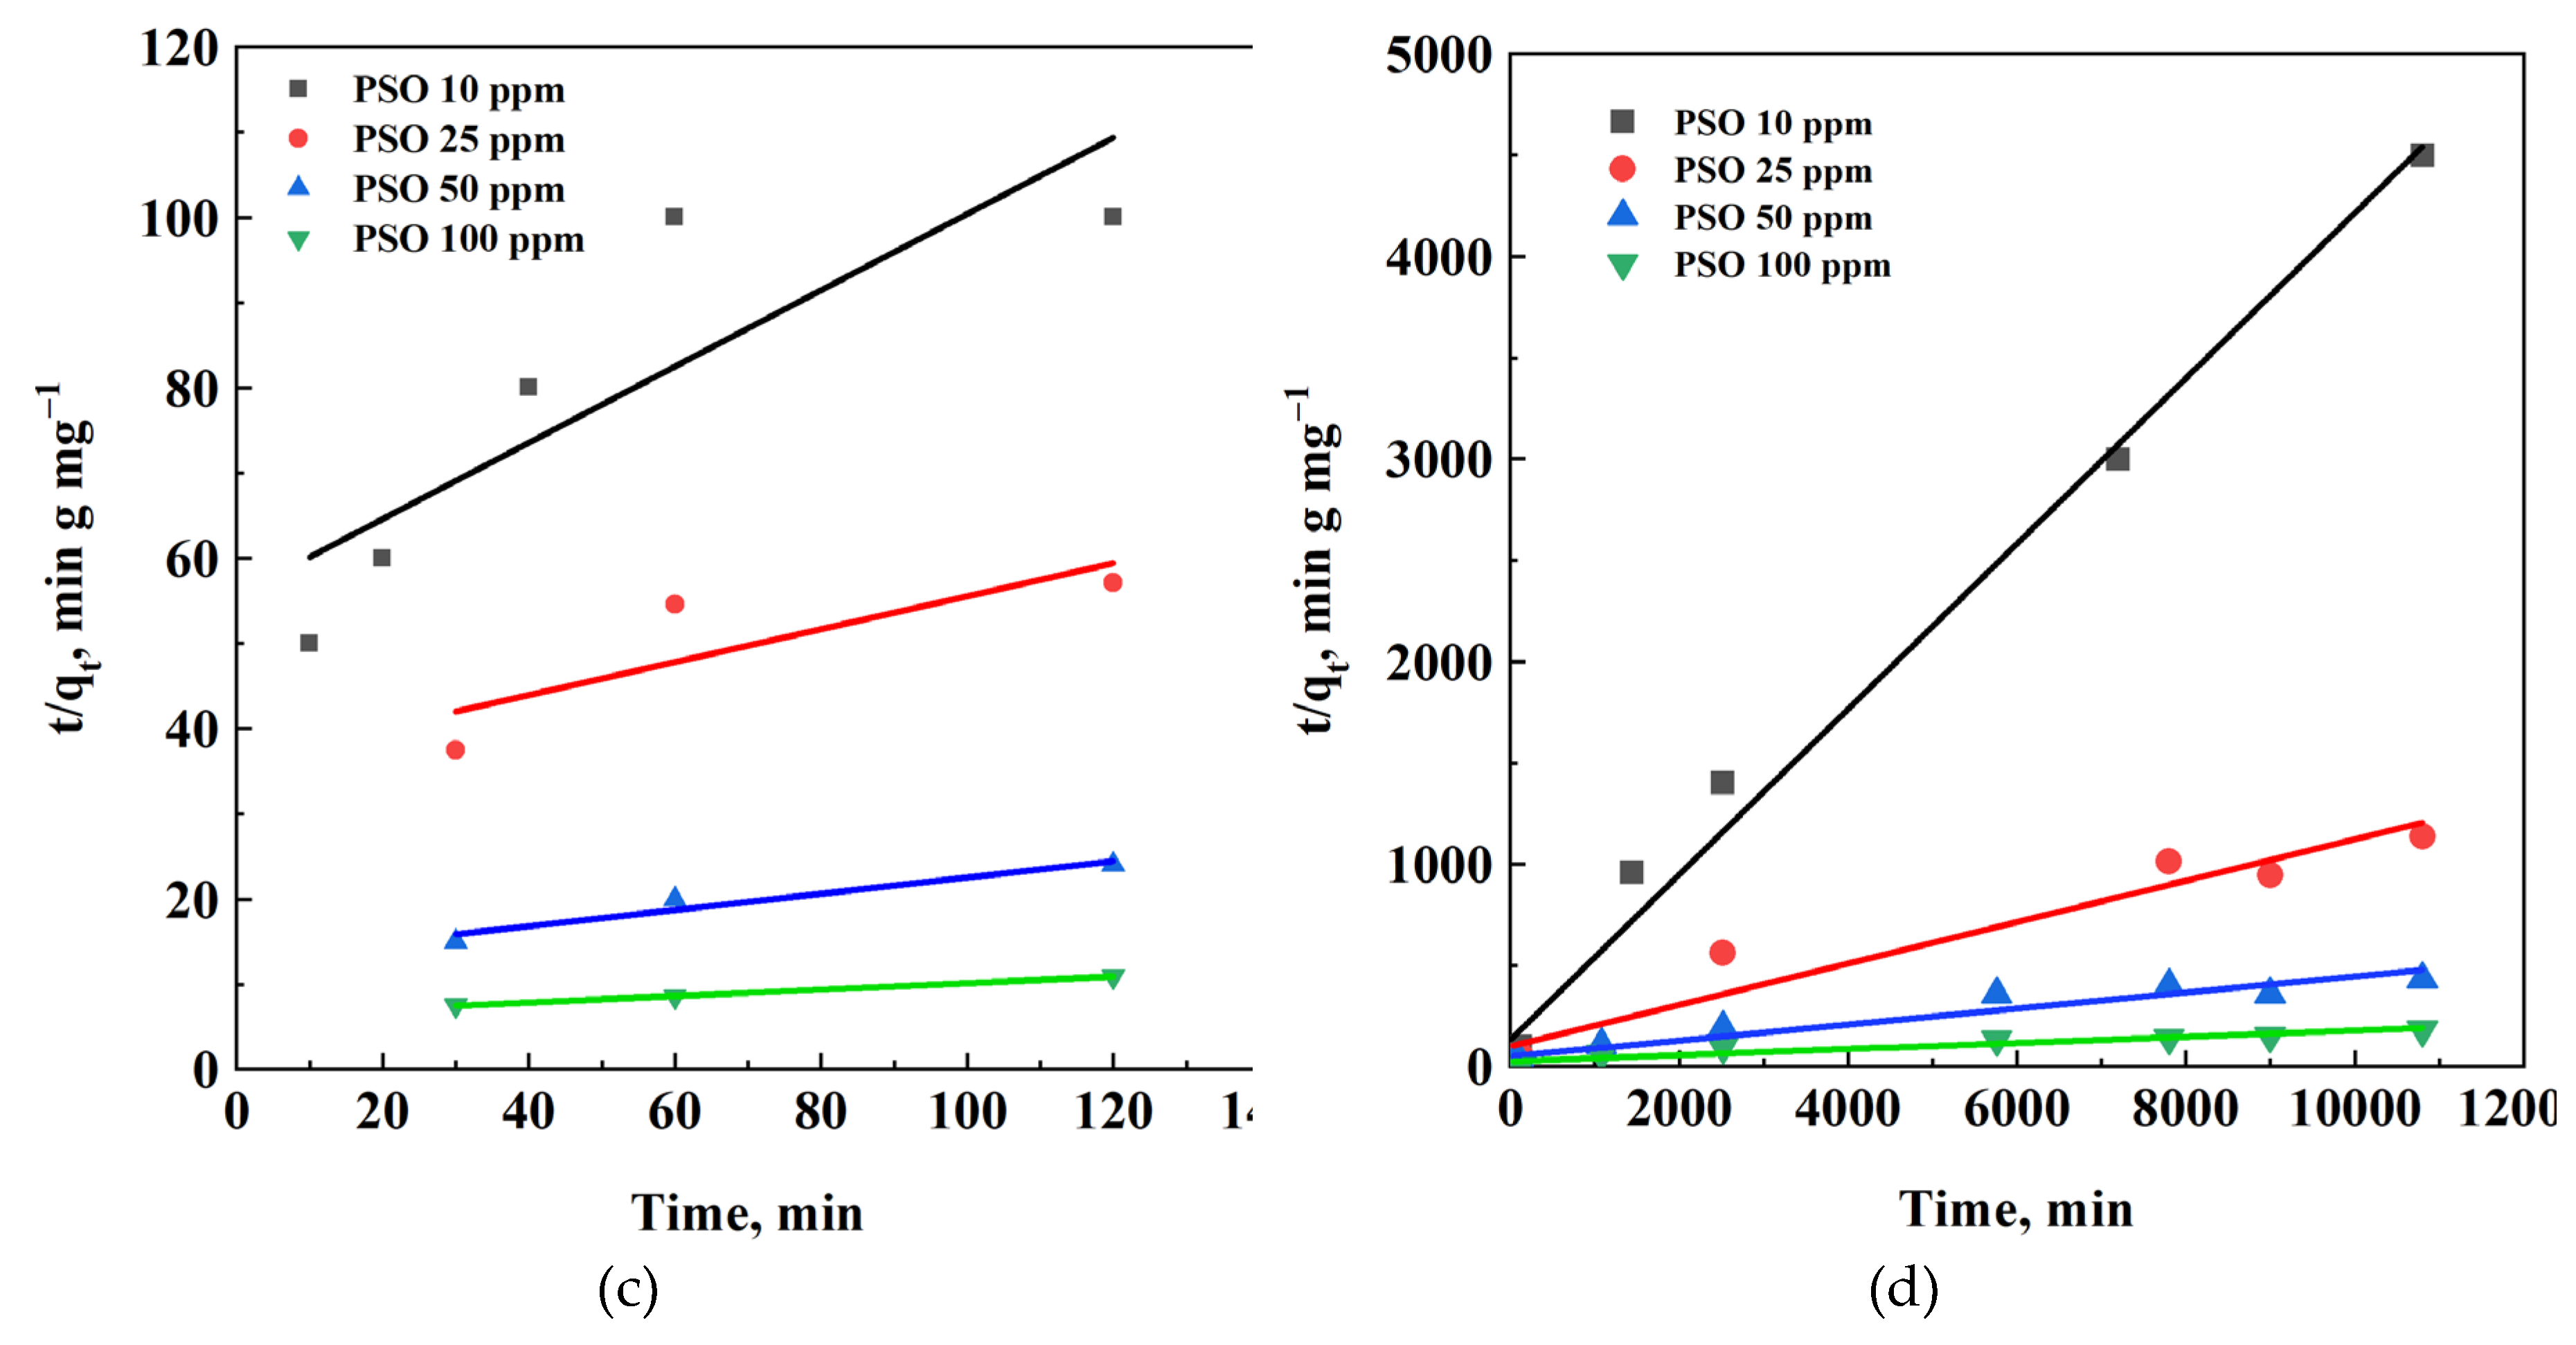
Firstly, PFO and PSO kinetics were employed, and the study was carried out as follows: the first 120 minutes were considered as the first steps of the process, and a dedicated analysis was conducted on such points; then, the whole dataset was considered. In Figure 7 and Table 3 the data relative to the two separate analyses are reported.
Focusing on the first steps of adsorption, i.e., up to 120 minutes, the R2 values are, in general, better described by the PFO model, it means that there is a linear correlation between the adsorption rate and the difference between qt and qeq. PSO model is empirically associated with multiple interactions between the sorbate and the sorbent; therefore, it can be said that in the first steps of the process, is valid the PFO model, and weaker interactions take place between MO and CH-GO active sites, in the adopted adsorption conditions. However, looking at the global dataset and the kinetic models parameters, the PSO model can be regarded as more reliable than PFO. Indeed, the equilibrium adsorption capacity is estimated with a smaller error using PSO rather than PFO, by comparison between Table 3 and Table 1. Moreover, the values of k2 follow an inverse proportionality trend with respect to initial driving force: coherently, the larger is the initial concentration, the more time is needed to reach the equilibrium value. In addition, it is suggested that the reliability of the PSO model implies chemical adsorption between the solute and the sorbent [45]. Overall, PFO and PSO kinetic analysis prove that MO adsorption on CH-GO composites takes place, heterogeneously, between the dye molecule and different active sites available on the adsorbent surface.
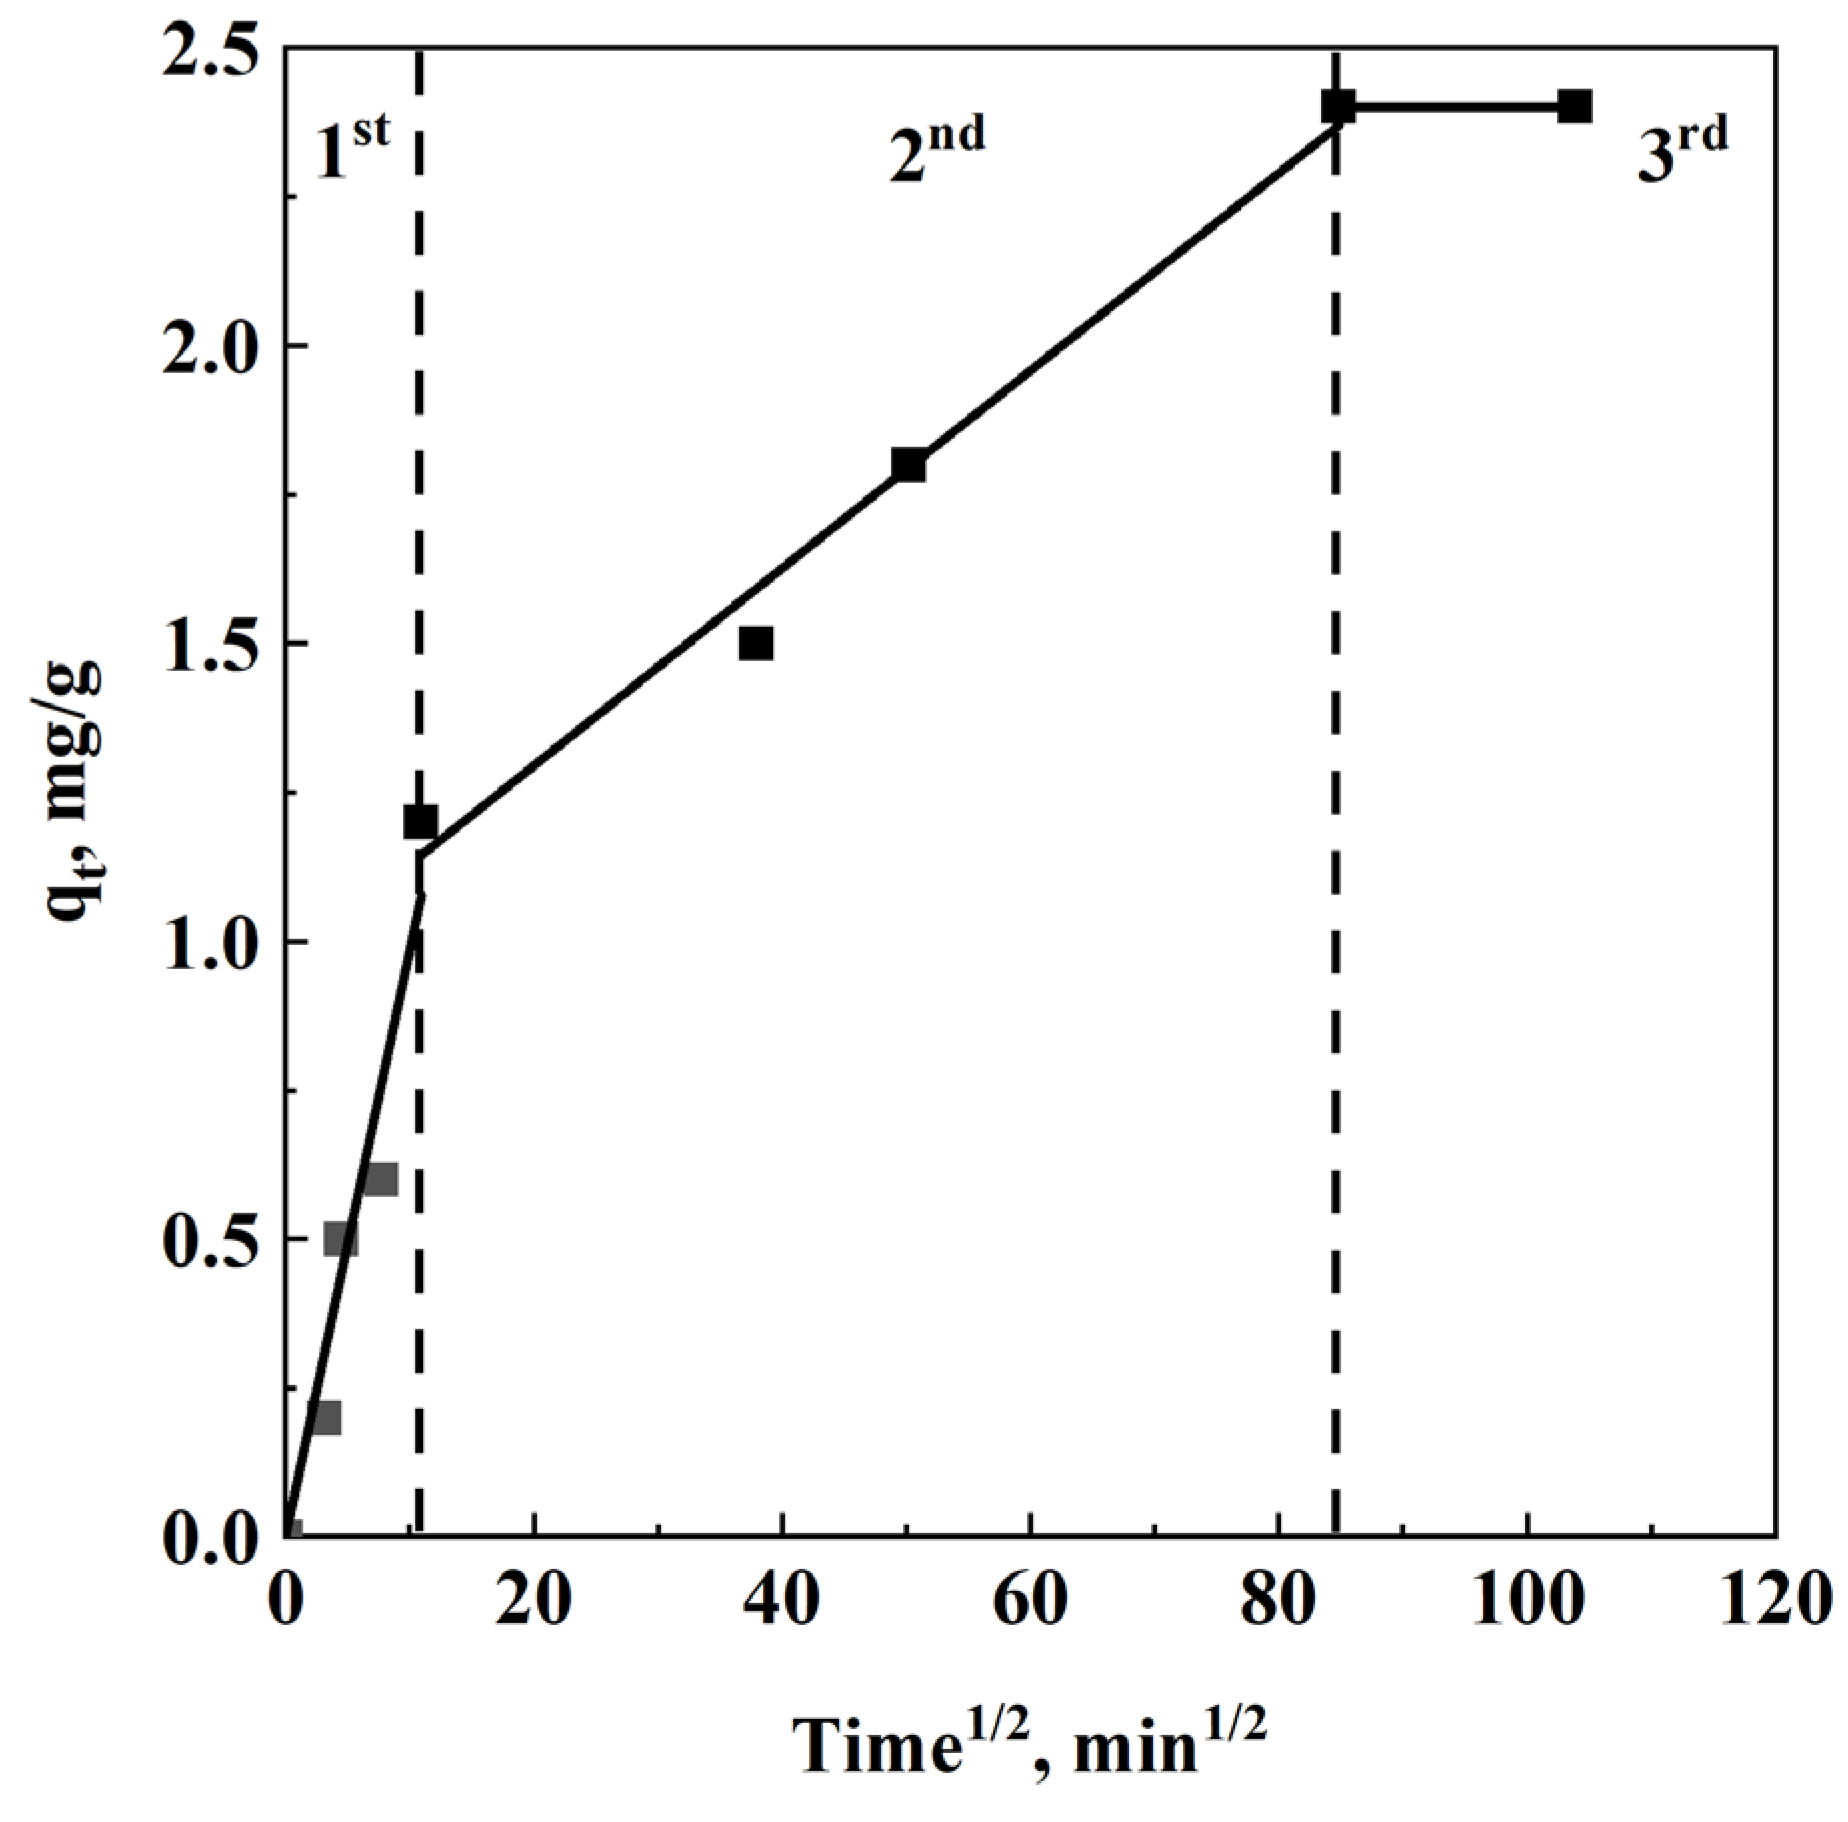
The IPD model was applied on the 10, 25, 50 and 100 ppm dataset too. Although model parameters were different from case to case, the general trend was followed for every initial concentration. Thus, a representative example is reported in Figure 8, relative to the adsorption experiment carried out at C0=10 ppm using 50 mg of CH-GO in 50 mL solution.
Figure 8 highlights that there are different linearities describing the adsorption experimental points during time. Coherently with literature indications, the plot can be divided in three main regions, and the first one has the steeper gradient. Other regions show smaller slopes, due to slower mass transport phenomena. Indeed, the first and faster step is associated with the boundary layer diffusion: in this case, adsorption takes place on the external surface of the adsorbent. The second portion is related to a rate limiting intraparticle diffusion: namely, the dye intrudes in the inner structure of the adsorbent. The third step is attributed to final equilibrium stage. In the case of the 10 ppm solution, by comparing the IPD kinetic analysis with the points in Figure 5, it seems coherent that the plateau value is approached at about 120 hours: the equilibrium stage from the kinetic analysis starts from about that time. Overall, the IPD kinetic analysis is coherent with both literature data and the obtained experimental points.

4. Conclusions

Chitosan/graphene oxide nanostructured adsorbents, produced by supercritical drying at 200 bar and 35 °C, were proved to be effective adsorbents for MO dye. Indeed, the nanostructure was better employed at larger driving forces, meaning that there exists a kinetic limitation that weighs on MO removal. Moreover, removal efficiency of 85% was achieved by using a CH-GO dosage of 8 g/L, that represents a promising result for further studies. Kinetic analyses proved that MO adsorption on CH-GO composite is a complex multi-step process, that involves different mass transfer phenomena that in view of an industrial scale-up, should be accelerated.
Overall, although the first results obtained in the present work are promising, future studies will be dedicated to make the system more efficient towards MO removal, by testing the effect of pH on adsorption efficiency, and to further investigate the phenomenology that stands behind adsorption using nanostructured biopolymeric sorbents.

Author Contributions

Conceptualization, L.B. and S.C.; methodology, L.B. and S.C.; validation, L.B. and S.C. and A.Z.; formal analysis, A.Z.; investigation, A.Z.; resources, E.R.; data curation, L.B. and A.Z.; writing—original draft preparation, A.Z.; writing—review and editing, L.B., S.C., E.R. and A.Z.; supervision, E.R. All authors have read and agreed to the published version of the manuscript.

Funding

This research received no external funding.

Acknowledgments

The authors thank Alessandra Paolillo for the help provided to perform the experiments, during the development of her Master Thesis in Chemical Engineering at the Department of Industrial Engineering, University of Salerno.

Conflicts of Interest

The authors declare no conflicts of interest.

References

  1. Al-Tohamy, R.; Ali, S.S.; Li, F.; Okasha, K.M.; Mahmoud, Y.A.-G.; Elsamahy, T.; Jiao, H.; Fu, Y.; Sun, J. A Critical Review on the Treatment of Dye-Containing Wastewater: Ecotoxicological and Health Concerns of Textile Dyes and Possible Remediation Approaches for Environmental Safety. Ecotoxicol. Environ. Saf. 2022, 231, 113160. [Google Scholar] [CrossRef] [PubMed]
  2. Tkaczyk, A.; Mitrowska, K.; Posyniak, A. Synthetic Organic Dyes as Contaminants of the Aquatic Environment and Their Implications for Ecosystems: A Review. Sci. Total Environ. 2020, 717, 137222. [Google Scholar] [CrossRef] [PubMed]
  3. Katheresan, V.; Kansedo, J.; Lau, S.Y. Efficiency of Various Recent Wastewater Dye Removal Methods: A Review. J. Environ. Chem. Eng. 2018, 6, 4676–4697. [Google Scholar] [CrossRef]
  4. Slama, H.B.; Chenari Bouket, A.; Pourhassan, Z.; Alenezi, F.N.; Silini, A.; Cherif-Silini, H.; Oszako, T.; Luptakova, L.; Golińska, P.; Belbahri, L. Diversity of Synthetic Dyes from Textile Industries, Discharge Impacts and Treatment Methods. Appl. Sci. 2021, 11, 6255. [Google Scholar] [CrossRef]
  5. Uddin, F. Environmental Hazard in Textile Dyeing Wastewater from Local Textile Industry. Cellulose 2021, 28, 10715–10739. [Google Scholar] [CrossRef]
  6. Verma, Y. Acute Toxicity Assessment of Textile Dyes and Textile and Dye Industrial Effluents Using Daphnia Magna Bioassay. Toxicol. Ind. Health 2008, 24, 491–500. [Google Scholar] [CrossRef] [PubMed]
  7. Islam, M.; Mostafa, M. Textile Dyeing Effluents and Environment Concerns - A Review. J. Environ. Sci. & Natural Resources 2019, 11, 131–144. [Google Scholar] [CrossRef]
  8. Yadav, A.K.; Jain, C.K.; Malik, D.S. Toxic Characterization of Textile Dyes and Effluents in Relation to Human Health Hazards. J, Sust. Env. Res. 2014, 3, 95–102. [Google Scholar]
  9. Islam, T.; Repon, Md.R.; Islam, T.; Sarwar, Z.; Rahman, M.M. Impact of Textile Dyes on Health and Ecosystem: A Review of Structure, Causes, and Potential Solutions. Environ. Sci. Pollut. Res. 2022, 30, 9207–9242. [Google Scholar] [CrossRef]
  10. Sudarshan, S.; Harikrishnan, S.; RathiBhuvaneswari, G.; Alamelu, V.; Aanand, S.; Rajasekar, A.; Govarthanan, M. Impact of Textile Dyes on Human Health and Bioremediation of Textile Industry Effluent Using Microorganisms: Current Status and Future Prospects. J. Appl. Microbiol. 2023, 134, lxac064. [Google Scholar] [CrossRef]
  11. Tang, K.H.D.; Darwish, N.M.; Alkahtani, A.M.; AbdelGawwad, M.R.; Karácsony, P. Biological Removal of Dyes from Wastewater: A Review of Its Efficiency and Advances. Trop. Aqua. Soil Pollut. 2022, 2, 59–75. [Google Scholar] [CrossRef]
  12. Donkadokula, N.Y.; Kola, A.K.; Naz, I.; Saroj, D. A Review on Advanced Physico-Chemical and Biological Textile Dye Wastewater Treatment Techniques. Rev. Environ. Sci. Biotechnol. 2020, 19, 543–560. [Google Scholar] [CrossRef]
  13. Singh, P.K.; Singh, R.L. Bio-Removal of Azo Dyes: A Review. Int. J. Appl. Sci. Biotechnol. 2017, 5, 108–126. [Google Scholar] [CrossRef]
  14. Nidheesh, P.V.; Gandhimathi, R.; Ramesh, S.T. Degradation of Dyes from Aqueous Solution by Fenton Processes: A Review. Environ. Sci. Pollut. Res. 2013, 20, 2099–2132. [Google Scholar] [CrossRef]
  15. Fernandes, N.C.; Brito, L.B.; Costa, G.G.; Taveira, S.F.; Cunha–Filho, M.S.S.; Oliveira, G.A.R.; Marreto, R.N. Removal of Azo Dye Using Fenton and Fenton-like Processes: Evaluation of Process Factors by Box–Behnken Design and Ecotoxicity Tests. Chem.-Biol. Interact. 2018, 291, 47–54. [Google Scholar] [CrossRef] [PubMed]
  16. Ay, F.; Catalkaya, E.C.; Kargi, F. A Statistical Experiment Design Approach for Advanced Oxidation of Direct Red Azo-Dye by Photo-Fenton Treatment. J. Hazard. Mater. 2009, 162, 230–236. [Google Scholar] [CrossRef] [PubMed]
  17. Soon, A.N.; Hameed, B.H. Heterogeneous Catalytic Treatment of Synthetic Dyes in Aqueous Media Using Fenton and Photo-Assisted Fenton Process. Desalination 2011, 269, 1–16. [Google Scholar] [CrossRef]
  18. Garciamontano, J.; Ruiz, N.; Munoz, I.; Domenech, X.; Garciahortal, J.; Torrades, F.; Peral, J. Environmental Assessment of Different Photo-Fenton Approaches for Commercial Reactive Dye Removal. J. Hazard. Mater. 2006, 138, 218–225. [Google Scholar] [CrossRef]
  19. Cheng, S.; Zhao, S.; Xing, B.; Liu, Y.; Zhang, C.; Xia, H. Preparation of Magnetic Adsorbent-Photocatalyst Composites for Dye Removal by Synergistic Effect of Adsorption and Photocatalysis. J. Cleaner Prod. 2022, 348, 131301. [Google Scholar] [CrossRef]
  20. Hasanpour, M.; Hatami, M. Photocatalytic Performance of Aerogels for Organic Dyes Removal from Wastewaters: Review Study. J. Mol. Liq. 2020, 309, 113094. [Google Scholar] [CrossRef]
  21. Akbari, A.; Sabouri, Z.; Hosseini, H.A.; Hashemzadeh, A.; Khatami, M.; Darroudi, M. Effect of Nickel Oxide Nanoparticles as a Photocatalyst in Dyes Degradation and Evaluation of Effective Parameters in Their Removal from Aqueous Environments. Inorg. Chem. Commun. 2020, 115, 107867. [Google Scholar] [CrossRef]
  22. Yagub, M.T.; Sen, T.K.; Afroze, S.; Ang, H.M. Dye and Its Removal from Aqueous Solution by Adsorption: A Review. Adv. Colloid Interface Sci. 2014, 209, 172–184. [Google Scholar] [CrossRef] [PubMed]
  23. Zhang, F.; Chen, X.; Wu, F.; Ji, Y. High Adsorption Capability and Selectivity of ZnO Nanoparticles for Dye Removal. Colloids Surf. A 2016, 509, 474–483. [Google Scholar] [CrossRef]
  24. Malek, N.N.A.; Jawad, A.H.; Ismail, K.; Razuan, R.; ALOthman, Z.A. Fly Ash Modified Magnetic Chitosan-Polyvinyl Alcohol Blend for Reactive Orange 16 Dye Removal: Adsorption Parametric Optimization. Int. J. Biol. Macromol. 2021, 189, 464–476. [Google Scholar] [CrossRef] [PubMed]
  25. Harja, M.; Buema, G.; Bucur, D. Recent Advances in Removal of Congo Red Dye by Adsorption Using an Industrial Waste. Sci. Rep. 2022, 12, 6087. [Google Scholar] [CrossRef] [PubMed]
  26. Jawad, A.H.; Abdulhameed, A.S.; Mastuli, M.S. Acid-Factionalized Biomass Material for Methylene Blue Dye Removal: A Comprehensive Adsorption and Mechanism Study. J. Taibah Univ. SCI 2020, 14, 305–313. [Google Scholar] [CrossRef]
  27. El Maguana, Y.; Elhadiri, N.; Benchanaa, M.; Chikri, R. Activated Carbon for Dyes Removal: Modeling and Understanding the Adsorption Process. J. Chem. 2020, 1–9. [Google Scholar] [CrossRef]
  28. Moosavi, S.; Lai, C.W.; Gan, S.; Zamiri, G.; Akbarzadeh Pivehzhani, O.; Johan, M.R. Application of Efficient Magnetic Particles and Activated Carbon for Dye Removal from Wastewater. ACS Omega 2020, 5, 20684–20697. [Google Scholar] [CrossRef]
  29. Bal, G.; Thakur, A. Distinct Approaches of Removal of Dyes from Wastewater: A Review. Mater. Today: Proc. 2022, 50, 1575–1579. [Google Scholar] [CrossRef]
  30. Solayman, H.M.; Hossen, Md.A.; Abd Aziz, A.; Yahya, N.Y.; Leong, K.H.; Sim, L.C.; Monir, M.U.; Zoh, K.-D. Performance Evaluation of Dye Wastewater Treatment Technologies: A Review. J. Environ. Chem. Eng. 2023, 11, 109610. [Google Scholar] [CrossRef]
  31. Zhao, S.; Malfait, W.J.; Guerrero-Alburquerque, N.; Koebel, M.M.; Nyström, G. Biopolymer Aerogels and Foams: Chemistry, Properties, and Applications. Angew Chem. Int. Ed. 2018, 57, 7580–7608. [Google Scholar] [CrossRef] [PubMed]
  32. Idumah, C.I.; Ezika, A.C.; Okpechi, V.U. Emerging Trends in Polymer Aerogel Nanoarchitectures, Surfaces, Interfaces and Applications. Surf. Interfaces 2021, 25, 101258. [Google Scholar] [CrossRef]
  33. Shi, H.; Cui, J.; Shen, H.; Wu, H. Preparation of Silica Aerogel and Its Adsorption Performance to Organic Molecule. Adv. Mater. Sci. Eng. 2014, 2014, 1–8. [Google Scholar] [CrossRef]
  34. Basak, S.; Singhal, R.S. The Potential of Supercritical Drying as a “Green” Method for the Production of Food-Grade Bioaerogels: A Comprehensive Critical Review. Food Hydrocolloids 2023, 141, 108738. [Google Scholar] [CrossRef]
  35. Li, C.; Dang, Q.; Yang, Q.; Chen, D.; Zhu, H.; Chen, J.; Liu, R.; Wang, X. Study of the Microstructure of Chitosan Aerogel Beads Prepared by Supercritical CO 2 Drying and the Effect of Long-Term Storage. RSC Adv. 2022, 12, 21041–21049. [Google Scholar] [CrossRef] [PubMed]
  36. Tabernero, A.; Baldino, L.; Misol, A.; Cardea, S.; Del Valle, E.M.M. Role of Rheological Properties on Physical Chitosan Aerogels Obtained by Supercritical Drying. Carbohydr. Polym. 2020, 233, 115850. [Google Scholar] [CrossRef] [PubMed]
  37. Dutta, S.; Gupta, B.; Srivastava, S.K.; Gupta, A.K. Recent Advances on the Removal of Dyes from Wastewater Using Various Adsorbents: A Critical Review. Mater. Adv. 2021, 2, 4497–4531. [Google Scholar] [CrossRef]
  38. Dassanayake, R.S.; Acharya, S.; Abidi, N. Recent Advances in Biopolymer-Based Dye Removal Technologies. Molecules 2021, 26, 4697. [Google Scholar] [CrossRef]
  39. Sadiq, A.C.; Olasupo, A.; Ngah, W.S.W.; Rahim, N.Y.; Suah, F.B.M. A Decade Development in the Application of Chitosan-Based Materials for Dye Adsorption: A Short Review. Int. J. Biol. Macromol. 2021, 191, 1151–1163. [Google Scholar] [CrossRef]
  40. Leudjo Taka, A.; Klink, M.J.; Yangkou Mbianda, X.; Naidoo, E.B. Chitosan Nanocomposites for Water Treatment by Fixed-Bed Continuous Flow Column Adsorption: A Review. Carbohydr. Polym. 2021, 255, 117398. [Google Scholar] [CrossRef]
  41. Crini, G.; Badot, P.-M. Application of Chitosan, a Natural Aminopolysaccharide, for Dye Removal from Aqueous Solutions by Adsorption Processes Using Batch Studies: A Review of Recent Literature. Prog. Polym. Sci. 2008, 33, 399–447. [Google Scholar] [CrossRef]
  42. Robati, D.; Mirza, B.; Rajabi, M.; Moradi, O.; Tyagi, I.; Agarwal, S.; Gupta, V.K. Removal of Hazardous Dyes-BR 12 and Methyl Orange Using Graphene Oxide as an Adsorbent from Aqueous Phase. Chem. Eng. J. 2016, 284, 687–697. [Google Scholar] [CrossRef]
  43. Molla, A.; Li, Y.; Mandal, B.; Kang, S.G.; Hur, S.H.; Chung, J.S. Selective Adsorption of Organic Dyes on Graphene Oxide: Theoretical and Experimental Analysis. Appl. Surf. Sci. 2019, 464, 170–177. [Google Scholar] [CrossRef]
  44. Mishra, A.K.; Ramaprabhu, S. Functionalized Graphene Sheets for Arsenic Removal and Desalination of Sea Water. Desalination 2011, 282, 39–45. [Google Scholar] [CrossRef]
  45. Zhu, W.; Jiang, X.; Liu, F.; You, F.; Yao, C. Preparation of Chitosan—Graphene Oxide Composite Aerogel by Hydrothermal Method and Its Adsorption Property of Methyl Orange. Polymers 2020, 12, 2169. [Google Scholar] [CrossRef] [PubMed]
  46. Shi, Y.; Song, G.; Li, A.; Wang, J.; Wang, H.; Sun, Y.; Ding, G. Graphene Oxide-Chitosan Composite Aerogel for Adsorption of Methyl Orange and Methylene Blue: Effect of pH in Single and Binary Systems. Colloids Surf., A 2022, 641, 128595. [Google Scholar] [CrossRef]
  47. Zhang, W.; Huang, T.; Ren, Y.; Wang, Y.; Yu, R.; Wang, J.; Tu, Q. Preparation of Chitosan Crosslinked with Metal-Organic Framework (MOF-199)@aminated Graphene Oxide Aerogel for the Adsorption of Formaldehyde Gas and Methyl Orange. Int. J. Biol. Macromol. 2021, 193, 2243–2251. [Google Scholar] [CrossRef] [PubMed]
  48. Benjelloun, M.; Miyah, Y.; Akdemir Evrendilek, G.; Zerrouq, F.; Lairini, S. Recent Advances in Adsorption Kinetic Models: Their Application to Dye Types. Arabian J. Chem. 2021, 14, 103031. [Google Scholar] [CrossRef]
  49. Revellame, E.D.; Fortela, D.L.; Sharp, W.; Hernandez, R.; Zappi, M.E. Adsorption Kinetic Modeling Using Pseudo-First Order and Pseudo-Second Order Rate Laws: A Review. Cleaner Engineering and Technology 2020, 1, 100032. [Google Scholar] [CrossRef]
  50. Cheung, W.H.; Szeto, Y.S.; McKay, G. Intraparticle Diffusion Processes during Acid Dye Adsorption onto Chitosan. Bioresour. Technol. 2007, 98, 2897–2904. [Google Scholar] [CrossRef]
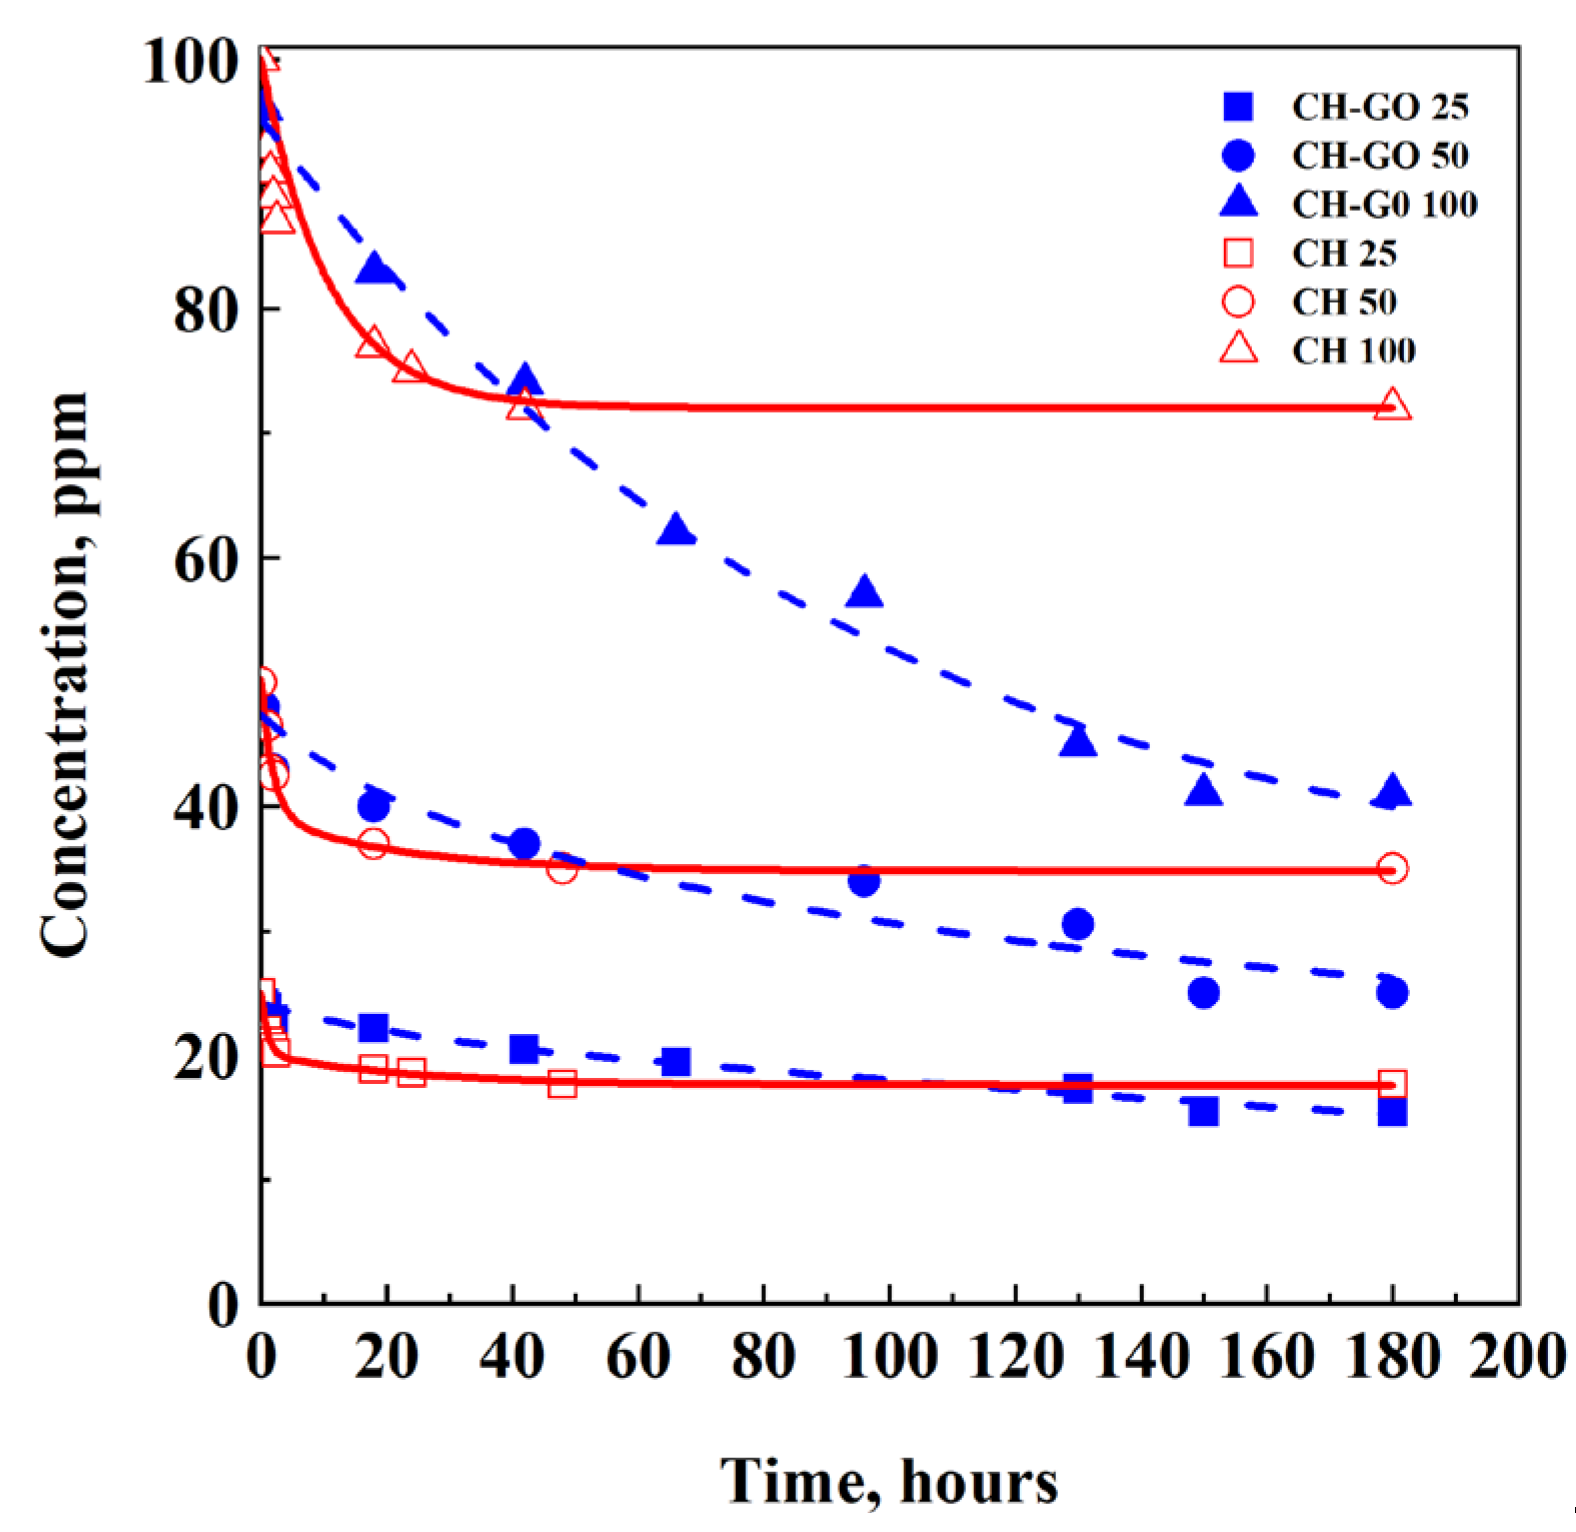
Figure 3. MO concentration vs. time points, obtained at 25, 50 and 100 ppm using CH (solid lines) and CH-GO (dashed lines) aerogels.
Preprints 113389 g003
Figure 4. qeq vs C0.
Preprints 113389 g004
Figure 5. Concentration vs. time points at different dosages. (a) experimental points up to 210 hours; (b) enlargement of the first 4 hours.
Preprints 113389 g005
Figure 6. Freundlich linearized isotherm.
Preprints 113389 g006
Figure 7. Kinetic points of: (a) PFO up to 120 minutes; (b) PFO global; (c) PSO up to 120 minutes; (d) PSO global.
Preprints 113389 g007aPreprints 113389 g007b
Figure 8. IPD kinetics for 10 ppm MO solution.
Preprints 113389 g008
Table 1. Adsorption experiment results.
C0, ppm Adsorbent Ceq, ppm qeq, mg/g η, %
25 CH 17.7 7.3 29.2
CH-GO 15.5 9.5 38.0
50 CH 35.0 15.0 30.0
CH-GO 25.0 25.0 50.0
100 CH 72.0 28.0 28.0
CH-GO 41.0 59.0 59.0
Table 2. Adsorption results at different CH-GO dosage, from 10 ppm MO solutions.
CH-GO dosage, g/L Ceq, ppm qeq, mg/g η, %
1 7.6 2.4 24
6 2.4 1.3 76
8 1.5 1.1 85
Table 3. Kinetic parameters for PFO and PSO.
120 min Global
C0, ppm 10 25 50 100 10 25 50 100
PFO k1, min-1 0.0051 0.0013 0.0009 0.00108 0.0010 0.00011 9.53 E-05 0.00013
qeq,calc, mg/g 2.27 12.66 36.28 76.38 2.16 11.62 64.69 71.32
R2 0.938 0.985 0.999 0.991 0.930 0.974 0.822 0.983
PSO k2, g (mg min)-1 0.0036 0.0010 0.0007 0.0002 0.0012 0.0001 3.32 E-05 9.43 E-06
qeq,calc, mg/g 2.24 5.17 10.50 26.29 2.45 9.79 25.08 64.94
R2 0.731 0.689 0.937 0.999 0.993 0.950 0.928 0.919
Disclaimer/Publisher’s Note: The statements, opinions and data contained in all publications are solely those of the individual author(s) and contributor(s) and not of MDPI and/or the editor(s). MDPI and/or the editor(s) disclaim responsibility for any injury to people or property resulting from any ideas, methods, instructions or products referred to in the content.
Copyright: This open access article is published under a Creative Commons CC BY 4.0 license, which permit the free download, distribution, and reuse, provided that the author and preprint are cited in any reuse.
Prerpints.org logo

Preprints.org is a free preprint server supported by MDPI in Basel, Switzerland.

Subscribe

© 2024 MDPI (Basel, Switzerland) unless otherwise stated