
Submitted:
26 July 2024
Posted:
29 July 2024
You are already at the latest version
Abstract
NiO nanoparticles have been synthetized by calcination of layered double hydroxides (LDHs) precursors prepared using dimethylamine (DMA) as a precipitating agent. The incorporation of Ce and La oxides to the structure was investigated. The samples were characterized by element chemical analysis, powder X-ray diffraction, FT-IR spectroscopy, thermal analysis and specific surface area analysis. Furthermore, the optical band gaps of the semiconductor samples were estimated by ultraviolet-visible diffuse reflectance spectroscopy. The results showed that it is possible to obtain Ni-LDHs precursor with good crystallinity and a small crystal size, which can be used as precursors of NiO nanoparticles with ≈3.7 nm of crystal size. The semiconductors obtained have good values of band gaps with rather large specific surface areas, which make them suitable for their use as photocatalysts.
Keywords:
LDH
; Hydrotlacita-like
; Nickel óxide semiconductor
1. Introduction
Nanoparticles have attracted extensive research interest due to their great potential for many applications such as photoelectrochemical cells, heterogeneous catalyst, optical switching and single electron transistors [1,2,3,4]. The morphology of the particles has an effect on the properties and also influences the self-assembly process [5,6,7].
Nickel and its oxide nanoparticles display superior magnetic, electrical, thermal, optical, catalytic and mechanical performance [8,9,10,11]. Nanostructured NiO particles are of great interest, since in addition to having important applications as thermistors, sensors and additives, for gas and ceramic [12,13,14,15], they are also of great interest as precursors of Ni-based catalysts [16,17,18,19,20,21]. NiO nanoparticles have also a wide range of applications as a p-type semiconductor due to its stable wide band gap (3.6–4.0 eV) [22,23], although bulk NiO is an antiferromagnetic insulator [24,25].
NiO crystalline nanoparticles have been synthesized by several physical, chemical and biological methods [14]. Some of the synthesis approaches are chemical reactive processes, electrodeposition, solution growth, pulsed-laser deposition, high-temperature nickel oxidation, spray pyrolysis, sputtering, sol–gel technique, the reverse-micellar route, pulsed laser ablation and by microemulsion [10,11,26,27,28,29]. Metal oxides particles in a size between 1 and 100 nm with high surface area are desirable adsorbents, carriers and catalysts. NiO nanoparticles have catalytic activity in pyrolyzing biomass components, a property which is attributed to the different effects in terms of volume, quantum size, surface and macroscopic quantum tunnel. NiO nanoparticles have many important properties over those of bulk and micro-NiO particles [30]. El Kemary et al. [29] synthesized NiO nanoparticles using the reaction of nickel chloride with hydrazine at room temperature and thermal decomposition of the Ni(OH)2 thus formed. It was reported that upon calcination of Ni(OH)2 at 400 °C nanoparticles with size of 45 nm and the energy band gap of 3.54 eV are obtained [29]. Salavati-Niasari et al. [3] studied the effect of calcination temperature and the effect of the metal-to-ligand ratio on the particle size of NiO nanoparticles obtained from nickel phthalate complexes by a solid-state thermal decomposition route. Thus, by increasing the ligand-to-metal ratio and decreasing the calcination temperature, the particle size is reduced without agglomeration, obtaining nanoparticles in a range of 15 to 36 nm. Also, Hosny [22] studied the effect of changing the metal anion and metal-to-ligand ratio on the crystal lattice and the particle size of NiO nanoparticles obtained by solid-state decomposition of nickel anthranilic acid semi-solid complexes, obtaining NiO nanoparticles with a size of 8 nm.
The combination of different compounds which have excellent electronic properties can improve the electronic properties of the resulting composite material [31,32]. In recent years, a great number of examples with heterojunctions to modify the photocatalyst and improve its photocatalytic activity has been reported. This type of constructions has been considered as one of the solutions to the serious recombination of photo-generated holes and electrons. Yu’s team proposed the concept of S-scheme heterojunction by an electrostatic interaction, the built-in electric field and the band bending to ensure strong redox photocatalyst [33,34].
Among the rare earth oxide series, lanthanum oxide (La2O3) is a p-type semiconductor that has been extensively researched due to its unique chemical and physical properties, which make it suitable for certain electronic applications. It is the only lanthanide oxide with an empty Ln-4f shell [35]. La2O3 has a wide band gap of 5.5 eV, is thermally stable and non-toxic, and has a significant relative dielectric constant (K > 20) [36,37]. Because of these properties, La2O3 is used in potential applications like biosensors, catalysts, dielectric layers, fuel cells, gas sensors, rechargeable batteries, photoelectric conversion, and optical devices for measuring various body temperatures, and biomedical [37]. Quan et al. [38] designed and constructed a novel S-scheme La2O3/AgCl heterojunction catalyst with La-Cl bond by ball milling method. The catalytic activity and stability of La2O3/AgCl photocatalyst for BPA degradation were significantly improved; where the formation of heterojunction structure and interfacial La-Cl bond effectively promoted the transfer and quenching of relatively useless holes and electrons in La2O3 and AgCl.
Cerium oxide (CeO2) is another lanthanide oxide with great interest. This oxide is a n-type semiconductor with a wide band gap which has high oxygen storage capacity, strong redox capability and it has been considered as a promising material for photocatalytic applications [39,40,41]. By the combination of CeO2 with other semiconductors it is possible to improve the photocatalytic efficiency [42,43,44,45]. This improvement is possible by the transference of photoexcited electrons from the conduction band of CeO2 to the conduction band of the other semiconductor rather than recombining with the holes in the valence band. Meanwhile, the photoexcited holes will flow from the valence band of the semiconductor to the valence band of CeO2. In this way, Sherly et al. [46] have studied the effect of CeO2 on the structural, optical and photocatalytic properties of ZnO, observing an improvement on the photocatalytic efficiency of ZnO by the inter particle electron and hole transfer between both semiconductors.
Furthermore, the synthesis of NiO nanoparticles using layered double hydroxides (LDH) as precursors has been described in the literature. Zheng et al. [47] generated in situ NiO and Co1.29Ni1.71O4 by oxidizing and calcining Ni-Co layered double hydroxides (LDHs) to construct an S-scheme heterojunction heterogeneous catalyst in order to improve the electron transfer efficiency and promote the catalyst performance. The resulting catalyst has higher light absorption intensity and photocurrent response than Ni-Co LDH, and also a smaller electronic impedance and good separation efficiency of electrons and holes.
Layered Double Hydroxides, also known as hydrotalcite-like compounds, are a family of solids with at least two different metal cations in their layers and anions occupying the interlayer space [48,49,50]. The layered structure of these materials could be explained from the brucite structure, where, during the coprecipitation process, an isomorphic substitution of divalent cations by trivalent cations takes place in the octahedral environment formed by OH- ions [M(OH)6]. The isomorphic substitution gives rise to positively charged layers. The electroneutrality of the compound is achieved by the incorporation of anions in the interlayered space, so that LDH are also known as anionic clays. LDHs could incorporate a great diversity of anions in their interlayer, both organic and inorganic ones, with a variety of size and charge [51]. In addition, water molecules may occupy the remaining free space in the interlayer space. The wide range of anions and divalent and trivalent cations that can be used to prepare LDH, provide them a diversity of composition, based on the general formula , and being the divalent and trivalent cations in the octahedral positions, and the interlayer anion, with defined as the molar ratio [48,52].
LDHs are easily prepared, are cheap and their composition can be easily tuned. Therefore, LDH have emerged as promising materials due to their properties and applications in numerous fields, such as water decontamination [53,54], catalysis [55,56,57,58], drug delivery [59,60], electroactivity [61], biomedicine [62], and others. Moreover, LDHs prove to be excellent precursors of high specific surface area mixed metal oxides (MMOs) with applications in various industrial sectors such as semiconductors, photocatalyst, catalysts, electrodes, adsorbents, etc. [63,64,65,66].
Among the methods reported in the literature to prepare LDH, coprecipitation is the most commonly used. This method is based on the slow addition of a mixed solution of the desired and cations in a fixed ratio over an alkaline solution, generally an aqueous NaOH solution. The synthesis is carried out at constant pH by the addition of a second alkaline solution, allowing the coprecipitation of both metallic salts [52]. The nature and concentration of the cations and the anions, the precipitation medium, the pH and temperature are important parameters to control the process. Kloprogge et al. [67] reported the influence of the pH in the synthesis of Zn/Al LDH, the range 11-12 being that in which the samples exhibit the best crystallinity.
The alkaline compound used to provide the precipitation medium could influence in the precipitation rate and agglomerate formation of the final material. Studies on the effect of the precipitating agent used during the synthesis process of the LDHs precursors of the Ni-Fe-Al2O3 catalysts obtained by calcination and applied in the methanation reaction can be found in the literature. Hwang et al. [68,69] used NaOH, NH3aq, Na2CO3 and (NH4)2CO3 as precipitating agents, showing that the precipitation rate is different depending on the compound used, with Na+-based precipitation media leading to a higher precipitation rate than NH4+-based ones. The crystal size varies in the sense NiFeAl-NaOH > NiFeAl-NH3aq> NiFeAl-Na2CO3 > NiFeAl-(NH4)2CO3. As for the catalytic performance, it increases in the sense: NiFeAl-NaOH < NiFeAl-NH3aq < NiFeAl-Na2CO3 < NiFeAl-(NH4)2CO3.
In a previous work, the synthesis of ZnAl LDHs using different amines [methylamine (MMA), dimethylamine (DMA) and trimethylamine (TMA)] in the coprecipitation medium as modifying agents of the morphology and crystallinity of LDH have been reported [70]. The use of organic compounds of a basic nature, such as amines, allows to obtain well crystallized compounds, overall, when DMA or TMA are used.
In this work the results obtained using dimethylamine (DMA) as precipitating agent to prepare NiO-Al2O3, NiO-La2O3-Al2O3 and NiO-Ce2O3-Al2O3 semiconductors are discussed. The aim is to study the effect of the precipitating agent on the properties of the nanostructured NiO particles using LDH as precursors. It is aimed to achieve a higher dispersion of Al, La and Ce oxides and the formation of highly dispersed NiO nanoparticles.
2. Materials and Methods
2.1. Materials
Ni(NO3)2·6H2O (98-102%), Al(NO3)3·9H2O (98-102%), La(NO3)3·6H2O (98-102%) and NaOH (98%) were purchased from Panreac. Ce(NO3)3·6H2O (98-102%) was purchased from Scharlau. Dimethylamine (99.5%) was purchased from Panreac. All reagents were used as received.
2.2. Synthesis
The samples were synthetized by the co-precipitation method at constant pH 10 [19]. The cation solutions in Ni/Al molar ratio 70/30 and in Ni/X/Al molar ratio 70/5/25, (X = La, Ce), were prepared. The precipitation of the LDH precursors was carried out in a 4.5 M aqueous solution of dimethylamine and 2 M anhydrous sodium carbonate. The synthesis started with the dropwise addition of the cations solution by means of an addition pump that regulates the dripping at a rate of 2 mL/min, on the solution used as the precipitation medium, which had been previously heated to 60 °C. The pH of the medium was kept constant at a value close to 10 by adding the necessary volume of a 3 M NaOH solution using a CRISON pH-Burette 240. The slurry obtained was submitted to an aging process at 60 °C during 1 h under intense agitation. Finally, the solid was separated from the aqueous phase by centrifugation. It was washed repeatedly with distilled water until pH close to 7, in order to remove the counterions of the starting salts. The solids were dried in an air oven at 40 °C and manually grounded using an agate mortar. The solids were then calcined at 600 °C for 6 h in air with a heating ramp of 10 °C/min.
2.3. Characterization
The element chemical analysis for metal ions was carried out at NUCLEUS (University of Salamanca, Spain) by an atomic emission spectrometer with inductively coupled plasma source (ICP-OES) Ultima II of YOBIN IVON.
Powder X-ray diffraction (PXRD) patterns were recorded in a PANalytical X′Pert diffractometer equipped with a Cu-Kα radiation (λmean = 0.15418 nm) and a fast X′Celerator detector. The diffractogram was collected over 2θ range from 5° to 80° with a step size of 0.05° and scan time 15.25 s per step. The Scherrer equation, D = kλ/βcosθ [71,72], where k is the shape factor, a constant taken in this case as 0.9; λ is the wavelength of the radiation used; β the full width at half maximum (FWHM) and θ the diffraction angle. Warren correction for instrument line broadening was considered, using diffraction data from standard silicon (Si) powder.
A Perkin-Elmer Spectrum One instrument was used to record the transmission FT-IR spectra from 4000 cm-1 to 450 cm-1 with a nominal resolution of 2 cm-1 using compressed KBr pellets.
Thermogravimetric (TG) and differential thermal analysis (DTA) were performed using an SDT Q600 instrument from TA Instruments. Thermal analysis was performed by heating from room temperature to 900 °C at a rate of 10 °C/min in a continuous flow of oxygen (L'Air Liquide, 99.995%) (50 ml/min).
The specific surface area (SSA) of the samples were estimated from the N2 adsorption-desorption isotherm (L'Air Liquide, 99.999%) at -196 °C recorded on a Micromeritics ASAP 2020 instrument. Before measurement, a portion of ca. 0.15 g of the powdered calcined sample was degassed in vacuum (< 30 µm Hg) at 250 °C and held for 30 min before measurement. The specific surface area was calculated by the multipoint Brunauer-Emmett-Teller (BET) method [73,74] in the of relative pressure p/p0 range from 0.05 to 0.3.
3. Results
3.1. Element Chemical Analysis
The results of the elemental chemical analysis for the LDH precursors are included in Table 1. The M2+/M3+ molar ratios are also included in this Table; for samples incorporating rare earth elements, the molar percentage of M3+ is the sum of the molar percentage of Al3+ and the molar percentage of Ce3+ or La3+. From the element chemical analysis data for the cations composing the sample, the chemical formula of each LDH has been calculated assuming the general chemical formula [Ni1-y-zXyAlz (OH)2](CO3)z/2 · n(H2O), where X is Ce or La and that carbonate is the only interlayer anion. The water molecules per chemical formula have been calculated from the TG curves of LDHs precursors (discussed below).
The M2+/M3+ molar ratio obtained is somewhat lower than the expected one from the amounts of reagents in the reaction mixture. Only the sample containing Ce shows a value close to the expected one, with only a very small deviation (<2%). The lowest ratio is found for the NiAl-DMA sample. This deviation from the theoretical molar ratio is probably due to an incomplete precipitation of Ni, which a small part could remain in the precipitation medium solution and be removed in the washing process.
The carbonate anion content has been calculated from the molar ratio M3+/(M3++M2+) and taking into account that it is a divalent anion. It is also assumed that carbonate is the only interlayered anion balancing the positive charge of the layers, as it is shown by the FT-IR spectroscopy results (discussed below).
3.2. Powder X-ray Diffraction (PXRD)
The PXRD patterns of the LDH precursors are included in Figure 1A. The diffractograms reveal the layered structure of the solids, corresponding to a 3R-polytype of hydrotalcite-like structure [77]. In all cases, the most intense diffraction peak is recorded close to 11.6° (2θ), ascribed to the diffraction by planes (003), with a spacing of 7.65 Å. This spacing is in agreement with the values reported by Miyata et al. [78] for hydrotalcite-like structure compounds with carbonate anion occupying the interlayer space. The diffraction by (006) planes is recorded close to 23.2° (2θ), with a spacing of 3.82 Å. The diffraction by (009) planes would be expected to be between 35° and 40° (2θ), not being possible to identify it due to overlapping with other diffraction peaks. Diffraction peaks by (110) and (113) planes are recorded at 61.2° (2θ) and 62.5° (2θ), with spacing of 1.51 Å and 1.48 Å, respectively.
As observed by Ho et al. [79], the crystallinity of the hydrotalcite-like phase decreases with the incorporation of rare earth elements. Thus, the diffraction peaks (003) and (006) of the NiCeAl-DMA and NiLaAl-DMA samples are less intense and broader than the peaks recorded for the NiAl-DMA sample. Moreover, the diffraction peaks (110) and (113) show a lower resolution in the samples containing cations of these rare earth elements, probably because of a broadening of the peaks due to a lower crystallinity of these samples. This can also be explained by a lower ordering both in the direction of layer stacking and a lower ordering within the layers. Due to the large size of the La3+ cation (ionic radius in octahedral coordination: 117.2 pm [80]) compared to Ni2+ (83 pm) and Al3+ (67.5 pm), it is very likely that its inclusion in the brucite-like layers takes place up to a certain, small, value, as further inclusion would destabilise the structure. So that, the La3+ not included in the layers is segregated as La2(CO3)(OH)2 in the NiLaAl-DMA sample [81]. A similar fact takes place in the NiCeAl-DMA sample, where due to the large ion size of Ce3+ (115 pm), the cubic CeO2 phase is formed after oxidising to Ce4+ (101 pm) [82]. This phenomenon has been observed previously in similar compounds with Y3+ (104 pm) [83]. The larger size of these ions compared to the others undoubtedly increases the distortion of the structure, resulting in the broadening of some of the diffraction peaks.
From the powder X-ray diffraction diagrams, the lattice parameters c and a describing the unit cell of the hydrotalcite-like structure compounds can be determined [84,85,86], the values of which are given in Table 2. These parameters have been calculated from the maxima positions of diffraction peaks due to planes (003), (006) and (110) [84]; so that, c = 3 · [1/2 · (d(003) + 2·d(006))] ≈ 22.7 – 23.1 Å, and a = 2 · d(110) ≈ 3.019 − 3.037 Å. Also, the average crystallite size (D) in the direction of the layer stacking (Table 2) has been calculated using the Full Width at Half Maximum (FWHM) value of diffraction peak (003) and the Scherrer equation, D = kλ/βcosθ [71,72]. The differences found in the lattice parameters of the samples containing Ce3+ and La3+ with respect to the NiAl-DMA sample are less than 1% in all cases, so they can be accepted to be coincident within the experimental error. As for the average crystallite size, it can be observed that for the samples containing Ce3+ and La3+ it decreases, similarly to their crystallinity.
The PXRD diagrams of the samples calcined at 600 °C are included in Figure 1B. The diagram for the NiAl-DMA-C600 sample shows the formation of the bunsenite (periclase-type) phase of NiO, determined by comparison of the positions and relative intensities of the diffraction peaks with the JCPDS database [87]. The absence of diffraction peaks associated to the Al2O3 phase is probably due to the formation of an amorphous Al2O3 phase, as observed by other authors for these calcination temperatures [88,89]; however, as described by these authors, when calcination is carried out at higher temperatures it is possible to observe the formation of the corresponding mixed oxide, suggesting that the Al3+ is dissolved in the NiO phase [88]. In samples containing Ce3+ or La3+, the formation of the oxides of these elements, CeO2 and La2O3, respectively, can be observed next to the NiO phase. For all samples, the most intense diffraction peak of the NiO phase, which is attributed to the (002) plane of the crystal structure, is recorded at a position close to 43.5° (2θ), with a spacing of 2.09 Å. As with the LDHs precursor, the crystallinity of the NiO phase is reduced when rare earth element cations are incorporated.
Table 3 includes the lattice parameter a values describing the unit cell of the NiO phase, with cubic NaCl-type structure, for each of the LDH calcined samples. A slightly lower lattice parameter a value than that reported in the literature (4.177 Å) [90] is calculated for the NiAl-DMA-C600 sample. This decrease could be due to the insertion of Al3+ cations into the NiO crystal lattice, which, due to the smaller ionic radius of the Al3+ cation with respect to the Ni2+ cation, would produce a decrease in the unit cell dimensions of the nickel oxide [90,91]. A similar explanation could be applied to the value obtained for the lattice parameter a of the NiLaAl-DMA-C600 sample, in which the insertion of La3+ cations into the NiO crystal lattice could take place producing an increase in the unit cell dimensions due to the larger size of the La3+ cation (117.2 pm). For the NiCeAl-DMA-C600 sample, a lattice parameter a value similar to that found in the literature for NiO (4.177 Å) is found [90], so a priori it would not be possible to think about the insertion of Ce3+ cations (115 pm) in the NiO crystal lattice. However, it could also happen that the two effects mentioned above are taking place, i.e. that on the one hand the insertion of Al3+ cations in the lattice leads to a decrease of the lattice parameter a, while on the other hand the insertion of a larger size cation, like Ce3+ cation, induces an increase of the lattice parameter, which results in an average value of the parameter a similar to that reported in the literature for the NiO structure.
From the FWHM value of the diffraction peak corresponding to the (002) plane, the average crystal size (D) has been calculated by the Scherrer equation [71,72]; the calculated values are included in Table 3. It is observed that for the three samples studied, the NiO phase shows a crystallite size close to 3.7 nm. The use of DMA as a precipitation agent leads to a smaller NiO crystal size than that found for the LDH precursors prepared with NaOH as precipitation agent [79], and it is not significantly modified by the incorporation of Ce and La, obtaining quite similar crystal sizes in the three samples studied.
3.3. FT-IR Spectroscopy
The FT-IR spectra of the LDH precursors show the characteristic bands of hydrotalcite-like compounds with carbonate as the interlayered anion (Figure 2A). A broad band can be observed around 3440 cm-1 due to the stretching vibrational modes of the hydroxyl groups in the brucite-like layers and the water molecules in the interlayer space. The width of this band is caused by the different strengths of the O-H bonds due to the formation of multiple hydrogen bonds between the OH groups with each other and with the interlayer H2O molecules. In addition, the band at 1630 cm-1 is due to the bending mode of the water molecules in the interlayer space [92].
A shoulder can be observed around 2980 cm-1 which is due to the hydrogen bonding interaction between the hydroxyl groups and the carbonate anions in the interlayer space [88,93,94,95]. The bands at 1363 cm-1, 800 cm-1 and 603 cm-1 are attributed to the antisymmetric stretching ν3(E′), out-of-plane bending ν2(A2″) and angular bending ν4(E′) vibrational modes, respectively [92]. The spectra of the LDH precursor promoted with Ce and La (Figure 2A) show a band at 1496 cm-1 due to the splitting of the band associated to the ν3(E′) as a consequence of a decrease in the symmetry of the carbonate anion in its interaction with the water molecules that also occupy the interlayer space. This symmetry decrease also leads to the activation of the ν1(A1′) mode originally forbidden for a D3h symmetry, but allowed for both C2v and Cs [92,96,97]. This vibrational mode is associated to the very weak shoulder identified around 1050 cm-1.
On the other hand, in the low wavenumber region (below 1000 cm-1) the bands corresponding to the Metal-O stretching and Metal-OH bending vibrational modes are recorded. The FT-IR spectra show the bands at 564 cm-1 and 430 cm-1 due to the Ni-OH and Al-OH vibrational modes, respectively [98]. For LDHs promoted with rare earth elements, a band at 852 cm-1 due to the stretching vibrational modes of Ce-O and La-O bonds is also observed [99,100].
None of the bands characteristic of DMA are observed in the FT-IR spectra of the synthesised samples, which would indicate a correct washing of the obtained solids.
The FT-IR spectra of the LDH calcined at 600 °C show bands characteristic of metal oxides derived from the LDH precursor composition (Figure 2B). All spectra show a broad band around 3440 cm-1 and the bands at 1634 cm-1due to the stretching and bending vibrations of OH groups of water molecules adsorbed on the solids. Furthermore, the spectra show two bands centered at 1510 cm-1 and 1406 cm-1 corresponding to the above mentioned vibrational modes for the carbonate anion, which could come from a slight recarbonation process from the adsorption of atmospheric CO2 in contact with the samples after calcination [101]. The band registered at 857 cm-1 in the FT-IR spectra of NiLaAl-DMA-C600 sample is ascribed to the out-of-plane bending mode of vibration, which confirms the presence of carbonate [102]. Below 1100 cm-1 a broad band is found due to the overlapping of different bands due to the Metal-O and Metal-O-Metal vibrational modes. The band recorded at 1087 cm-1 is typical for γ-alumina due to the Al–O vibration mode [103,104]. The band at 820 cm-1 is attributed to the vibrational mode of surface Al–O bond and the band at 598 cm-1 is assigned to the stretching vibrational mode of octahedrally coordinated Al–O [104]. The Ni–O stretching vibration modes are found in the range 500–400 cm-1 [104,105]. The bands due to the stretching and bending modes of the La-O and Ce-O bonds, which should appear in the 700 to 500 cm-1 range [106,107], are not observed as they are overlapped with the Ni-O and Al-O modes mentioned above.
3.4. Thermal Analysis
Figure 3 shows the thermogravimetric curves of the LDHs precursors, together with the DTA curves. All samples show a similar behaviour. Below 230 °C, the first two decomposition stages (removal of adsorbed and interlayered water) take place successively and overlapping, which makes difficult their resolution. The endothermic effects of that stages are clearly identified in the DTA curves, in which the first effect appears, in turn, unfolded. Between 230 and 400 °C, the last two decomposition processes (dehydroxylation of the layers and decarbonation) of the layered compound take place. As in the initial stage, these processes occur practically simultaneously. As it can be seen in the DTA curves, these processes are recorded as a single endothermic peak. Only in the sample containing La, a third decomposition process can be observed between 350 and 500 °C. This process could be due to the decomposition of the La2(CO3)2(OH)2 phase, where the carbonate anion would be forming stronger bonds, which would hinder the decarbonation process, requiring a higher temperature for its decomposition. Like in the previous decomposition processes, this third stage corresponds to an endothermic process.
From the TG curves, the total mass loss percentages were calculated for each sample, finding a mass loss of 38.5%, 36.6% and 38.4% for the samples NiAl-DMA, NiCeAl-DMA and NiLaAl-DMA, respectively. Consequently, the residues after the decomposition process were between 62-64% of the initial sample mass. The mass loss difference between the sample containing Ce and the NiAl-DMA sample could be attributable to the presence of CeO2, which has been identified by PXRD, segregated during the co-precipitation process. In the sample with La, the presence of a La2(CO3)2(OH)2 phase is also observed by PXRD, Figure 1A; however, no minor mass loss is observed due to the decomposition process of this second phase and formation of La2O3. Furthermore, from the first stage decomposition of the TG curves were calculated the number of water molecules per chemical formula of each sample (Table 1), being practically the same in all three samples.
3.5. Specific Surface Area and Porosity
The textural properties of the LDHs calcined at 600 °C have been studied from the N2 adsorption-desorption isotherms at -196 °C. The corresponding isotherms are included in Figure 4, where it can be observed how the isotherm recorded for the NiAl-DMA-C600 sample is clearly different from the isotherms of the Ce- and La-containing samples. The isotherm of the NiAl-DMA-C600 sample corresponds to type IV according to the IUPAC classification [108,109]. Type IV isotherms are typical of mesoporous materials, where the most characteristic feature is the hysteresis loop, which is associated to condensation in the pores. At high p/p0 values an adsorption limit is reached, leading to a plateau, indicating the complete filling of the pores. The initial part of the type IV isotherm can be attributed to monolayer-multilayer adsorption [74]. The hysteresis loop observed in the desorption process corresponds to type H1 according to the IUPAC classification [74,108], generally associated to porous materials with well-defined cylindrical-type pores or compact agglomerates of uniform spheres. In the case of the samples containing Ce and La, the isotherms correspond to type II according to the IUPAC classification [108,109], characteristic of adsorption on non-porous or mesoporous materials, where unrestricted monolayer-multilayer adsorption can occur. In addition, the isotherms of both samples show a hysteresis cycle, corresponding to type H3 according to the IUPAC classification [74,108], whose presence indicates that adsorption takes place in slit-shaped pores formed by layered particles.
The SSA values, calculated by the BET (SBET) method [73,74], together with the pore volume (VP) and the average pore diameter calculated by the BJH method [74,110] are included in Table 4. It can be observed how the samples incorporating Ce and La oxides show lower BET specific surface area values compared to the NiAl sample. In contrast to what was reported by Ho et al. [79] for samples prepared using NaOH as the precipitating agent, when DMA is used as precipitating agent, the surface area decreases when rare earth elements are incorporated. This difference can be explained by the distortions in the layers induced by the incorporation of Ce or La, which affect the degree of stacking and agglomeration, leading to changes in the N2 adsorption-desorption curves and surface area values of the samples. Furthermore, these changes could be also due to the formation of pores with different sizes caused by the segregation of CeO2 and La2O3. Thus, as can be seen in Table 4, the pore volume and the average pore diameter increases when Ce is incorporated in the sample, and even more when La is incorporated. In all cases, from BJH average desorption pore diameter values, the presence of small pore sizes, less than 15 nm, can be confirmed.
3.6. UV-Visible Diffuse Reflectance Spectroscopy
The optical Diffuse Reflectance Spectra (DRS) of the calcined samples are included in Figure S1. The optical band gap was estimated using Tauc’s equation [75,76]: , where is the absorption coefficient, A is an energy independent constant and is equal to 1/2 and 2 for direct and indirect transitions, respectively. According to the literature, NiO nanoparticles have a direct band gap [22], so Figure S2 shows the plots of vs. and the optical band gaps of the samples were calculated by the Tauc method [75] (Figure 7, Table 5). The curves indicate that the values of the direct band gap (Eg) are equal to 3.43, 3.53 and 3.59 eV for NiO nanoparticles derived from LDH precursors of NiAl-DMA, NiCeAl-DMA and NiLaAl-DMA, respectively. The band gap values suggest that NiO nanoparticles are semiconductors.
The lowest band gap value is determined for the NiAl-DMA-C600 sample, indicating an improvement in the conductivity of the material. Although all the samples show similar crystal sizes (≈3.7 nm), the crystallinity of the NiO phase decreases with the incorporation of Ce or La. The improvement in the conductivity of the material could be due to the higher crystallinity of the Ni and Al sample. In the case of the samples incorporating Ce or La, the band gap values do not differ significantly from those obtained for the Ni,Al sample, presenting, in both cases, band gap values lower than those reported in the literature [22,23]. Thus, the synthesis method guarantees the production of new materials with better electrical properties than those of NiO obtained by other means, with the advantage of improving their behaviour in photocalytic processes.
4. Conclusions
Hydrotalcite-like solids as semiconductors precursors were prepared with Ni and Al as major cations, and with the addition of La and Ce, in a 70/30 divalent/trivalent molar ratio using DMA as precipitating agent. This synthesis methodology provides LDH precursors with good crystallinity, being the solid with only Ni and Al in the structure the one that showed better crystallinity against the LDH precursors incorporating Ce or La. This improvement in the crystallinity of the LDH precursor can also be observed in the NiO nanoparticles obtained in each case, which has an impact on the electrical properties of the materials obtained. According to this methodology, p-type semiconductors with band gap values between 3.4 and 3.6 eV are obtained, which better than those reported in the literature. In addition, the incorporation of Ce or La cations in the samples leads to a reduction of the specific surface area of the semiconductors obtained, which together with the good band gap values, make these materials suitable for their application as photocatalysts.
Supplementary Materials
The following supporting information can be downloaded at the website of this paper posted on Preprints.org.
References
- Alivisatos, A.P. Semiconductor Clusters, Nanocrystals, and Quantum Dots. Science (1979) 1996, 271, 933–937. [Google Scholar] [CrossRef]
- Fasol, G. Nanowires: Small Is Beautiful. Science (1979) 1998, 280, 545–546. [Google Scholar] [CrossRef]
- Salavati-Niasari, M.; Mohandes, F.; Davar, F.; Mazaheri, M.; Monemzadeh, M.; Yavarinia, N. Preparation of NiO Nanoparticles from Metal-Organic Frameworks via a Solid-State Decomposition Route. Inorganica Chim Acta 2009, 362, 3691–3697. [Google Scholar] [CrossRef]
- Kim, J.Y.; Kim, H.M.; Shin, D.H.; Ihn, K.J. Synthesis of CdS Nanoparticles Dispersed within Poly(Urethane Aerylate-Co-Styrene) Films Using an Amphiphilic Urethane Acrylate Nonionomer. Macromol Chem Phys 2006, 207, 925–932. [Google Scholar] [CrossRef]
- Jun, Y.W.; Jung, Y.Y.; Cheon, J. Architectural Control of Magnetic Semiconductor Nanocrystals. J Am Chem Soc 2002, 124, 615–619. [Google Scholar] [CrossRef] [PubMed]
- Peng, X. Mechanisms for the Shape-Control and Shape-Evolution of Colloidal Semiconductor Nanocrystals. Advanced Materials 2003, 15, 459–463. [Google Scholar] [CrossRef]
- Manna, L.; Scher, E.C.; Li, L.S.; Alivisatos, A.P. Epitaxial Growth and Photochemical Annealing of Graded CdS/ZnS Shells on Colloidal CdSe Nanorods. J Am Chem Soc 2002, 124, 7136–7145. [Google Scholar] [CrossRef]
- Aricò, A.S.; Bruce, P.; Scrosati, B.; Tarascon, J.-M.; Van Schalkwijk, W. Nanostructured Materials for Advanced Energy Conversion and Storage Devices; 2005. [Google Scholar]
- Ansari, F.; Bazarganipour, M.; Salavati-Niasari, M. NiTiO3/NiFe2O4 Nanocomposites: Simple Sol-Gel Auto-Combustion Synthesis and Characterization by Utilizing Onion Extract as a Novel Fuel and Green Capping Agent. Mater Sci Semicond Process 2016, 43, 34–40. [Google Scholar] [CrossRef]
- Salavati-Niasari, M.; Davar, F.; Fereshteh, Z. Synthesis of Nickel and Nickel Oxide Nanoparticles via Heat-Treatment of Simple Octanoate Precursor. J Alloys Compd 2010, 494, 410–414. [Google Scholar] [CrossRef]
- Salavati-Niasari, M.; Mir, N.; Davar, F. Synthesis and Characterization of NiO Nanoclusters via Thermal Decomposition. Polyhedron 2009, 28, 1111–1114. [Google Scholar] [CrossRef]
- Zhao, L.; Su, G.; Liu, W.; Cao, L.; Wang, J.; Dong, Z.; Song, M. Optical and Electrochemical Properties of Cu-Doped NiO Films Prepared by Electrochemical Deposition. Appl Surf Sci 2011, 257, 3974–3979. [Google Scholar] [CrossRef]
- Khodair, Z.T.; Ibrahim, N.M.; Kadhim, T.J.; Mohammad, A.M. Synthesis and Characterization of Nickel Oxide (NiO) Nanoparticles Using an Environmentally Friendly Method, and Their Biomedical Applications. Chem Phys Lett 2022, 797. [Google Scholar] [CrossRef]
- Ahmad, W.; Chandra Bhatt, S.; Verma, M.; Kumar, V.; Kim, H. A Review on Current Trends in the Green Synthesis of Nickel Oxide Nanoparticles, Characterizations, and Their Applications. Environ Nanotechnol Monit Manag 2022, 18. [Google Scholar] [CrossRef]
- Dhas, S.D.; Maldar, P.S.; Patil, M.D.; Nagare, A.B.; Waikar, M.R.; Sonkawade, R.G.; Moholkar, A.V. Synthesis of NiO Nanoparticles for Supercapacitor Application as an Efficient Electrode Material. Vacuum 2020, 181. [Google Scholar] [CrossRef]
- Christian Enger, B.; Lødeng, R.; Holmen, A. A Review of Catalytic Partial Oxidation of Methane to Synthesis Gas with Emphasis on Reaction Mechanisms over Transition Metal Catalysts. Appl Catal A Gen 2008, 346, 1–27. [Google Scholar] [CrossRef]
- Ho, P.H.; Sanghez De Luna, G.; Ospitali, F.; Fornasari, G.; Vaccari, A.; Benito, P. Open-Cell Foams Coated by Ni/X/Al Hydrotalcite-Type Derived Catalysts (X = Ce, La, Y) for CO2 Methanation. Journal of CO2 Utilization 2020, 42, 101327. [Google Scholar] [CrossRef]
- Ho, P.H.; Sanghez De Luna, G.; Poggi, A.; Nota, M.; Rodríguez-Castellón, E.; Fornasari, G.; Vaccari, A.; Benito, P. Ru−CeO2 and Ni−CeO2 Coated on Open-Cell Metallic Foams by Electrodeposition for the CO2 Methanation. Ind Eng Chem Res 2021, 60, 6730–6741. [Google Scholar] [CrossRef]
- Ho, P.H.; de Luna, G.S.; Angelucci, S.; Canciani, A.; Jones, W.; Decarolis, D.; Ospitali, F.; Aguado, E.R.; Rodríguez-Castellón, E.; Fornasari, G.; et al. Understanding Structure-Activity Relationships in Highly Active La Promoted Ni Catalysts for CO2 Methanation. Appl Catal B 2020, 278, 119256. [Google Scholar] [CrossRef]
- Li, P.; Zhu, M.; Tian, Z.; Han, Y.; Zhang, Y.; Zhou, T.; Kang, L.; Dan, J.; Guo, X.; Yu, F.; et al. Two-Dimensional Layered Double Hydroxide Derived from Vermiculite Waste Water Supported Highly Dispersed Ni Nanoparticles for CO Methanation. Catalysts 2017, 7, 79. [Google Scholar] [CrossRef]
- Zhang, M.; Li, P.; Zhu, M.; Tian, Z.; Dan, J.; Li, J.; Dai, B.; Yu, F. Ultralow-Weight Loading Ni Catalyst Supported on Two-Dimensional Vermiculite for Carbon Monoxide Methanation. Chin J Chem Eng 2018, 26, 1873–1878. [Google Scholar] [CrossRef]
- Hosny, N.M. Synthesis, Characterization and Optical Band Gap of NiO Nanoparticles Derived from Anthranilic Acid Precursors via a Thermal Decomposition Route. Polyhedron 2011, 30, 470–476. [Google Scholar] [CrossRef]
- Shi, M.; Qiu, T.; Tang, B.; Zhang, G.; Yao, R.; Xu, W.; Chen, J.; Fu, X.; Ning, H.; Peng, J. Temperature-Controlled Crystal Size of Wide Band Gap Nickel Oxide and Its Application in Electrochromism. Micromachines 2021, 12, 80. [Google Scholar] [CrossRef] [PubMed]
- Li, T.Y.; Ho, M.K.; Hsu, T.E.; Chiu, H.H.; Wu, K.T.; Peng, J.C.; Wu, C.M.; Chan, T.S.; Vijaya Kumar, B.; Muralidhar Reddy, P.; et al. Antiferromagnetic Spin Correlations above the Bulk Ordering Temperature in NiO Nanoparticles: Effect of Extrinsic Factors. Appl Surf Sci 2022, 578. [Google Scholar] [CrossRef]
- Napari, M.; Huq, T.N.; Maity, T.; Gomersall, D.; Niang, K.M.; Barthel, A.; Thompson, J.E.; Kinnunen, S.; Arstila, K.; Sajavaara, T.; et al. Antiferromagnetism and P-Type Conductivity of Nonstoichiometric Nickel Oxide Thin Films. InfoMat 2020, 2, 769–774. [Google Scholar] [CrossRef]
- Purushothaman, K.K.; Joseph Antony, S.; Muralidharan, G. Optical, Structural and Electrochromic Properties of Nickel Oxide Films Produced by Sol-Gel Technique. Solar Energy 2011, 85, 978–984. [Google Scholar] [CrossRef]
- Danial, A.S.; Saleh, M.M.; Salih, S.A.; Awad, M.I. On the Synthesis of Nickel Oxide Nanoparticles by Sol–Gel Technique and Its Electrocatalytic Oxidation of Glucose. J Power Sources 2015, 293, 101–108. [Google Scholar] [CrossRef]
- Gondal, M.A.; Saleh, T.A.; Drmosh, Q.A. Synthesis of Nickel Oxide Nanoparticles Using Pulsed Laser Ablation in Liquids and Their Optical Characterization. Appl Surf Sci 2012, 258, 6982–6986. [Google Scholar] [CrossRef]
- El-Kemary, M.; Nagy, N.; El-Mehasseb, I. Nickel Oxide Nanoparticles: Synthesis and Spectral Studies of Interactions with Glucose. Mater Sci Semicond Process 2013, 16, 1747–1752. [Google Scholar] [CrossRef]
- Li, J.; Yan, R.; Xiao, B.; Liang, D.T.; Lee, D.H. Preparation of Nano-NiO Particles and Evaluation of Their Catalytic Activity in Pyrolyzing Biomass Components. Energy and Fuels 2008, 22, 16–23. [Google Scholar] [CrossRef]
- Algarou, N.A.; Slimani, Y.; Almessiere, M.A.; Alahmari, F.S.; Vakhitov, M.G.; Klygach, D.S.; Trukhanov, S.V.; Trukhanov, A.V.; Baykal, A. Magnetic and Microwave Properties of SrFe12O19/MCe0.04Fe1.96O4 (M = Cu, Ni, Mn, Co and Zn) Hard/Soft Nanocomposites. Journal of Materials Research and Technology 2020, 9, 5858–5870. [Google Scholar] [CrossRef]
- Trukhanov, A.V.; Algarou, N.A.; Slimani, Y.; Almessiere, M.A.; Baykal, A.; Tishkevich, D.I.; Vinnik, D.A.; Vakhitov, M.G.; Klygach, D.S.; Silibin, M.V.; et al. Peculiarities of the Microwave Properties of Hard–Soft Functional Composites SrTb0.01Tm0.01Fe11.98O19–AFe2O4 (A = Co, Ni, Zn, Cu, or Mn). RSC Adv 2020, 10, 32638–32651. [Google Scholar] [CrossRef] [PubMed]
- Wang, L.; Cheng, B.; Zhang, L.; Yu, J. In Situ Irradiated XPS Investigation on S-Scheme TiO2 @ZnIn2S4 Photocatalyst for Efficient Photocatalytic CO2 Reduction. Small 2021, 17. [Google Scholar] [CrossRef] [PubMed]
- Xu, Q.; Zhang, L.; Cheng, B.; Fan, J.; Yu, J. S-Scheme Heterojunction Photocatalyst. Chem 2020, 6, 1543–1559. [Google Scholar] [CrossRef]
- Richard, D.; Errico, L.A.; Rentería, M. Electronic, Structural, and Hyperfine Properties of Pure and Cd-Doped Hexagonal La2O3 Semiconductor. Comput Mater Sci 2015, 102, 119–125. [Google Scholar] [CrossRef]
- Ohmi, S.; Kobayashi, C.; Kashiwagi, I.; Ohshima, C.; Ishiwara, H.; Iwai, H. Characterization of La2O3 and Yb2O3 Thin Films for High-k Gate Insulator Application. J Electrochem Soc 2003, 150, F134. [Google Scholar] [CrossRef]
- Ismail, W.; Belal, A.; Abdo, W.; El-Shaer, A. Investigating the Physical and Electrical Properties of La2O3 via Annealing of La(OH)3. Sci Rep 2024, 14. [Google Scholar] [CrossRef] [PubMed]
- Quan, Y.; Liu, M.; Wu, H.; Tian, X.; Dou, L.; Ren, C.; Wang, Z. Construction of La2O3/AgCl S-Scheme Heterojunction with Interfacial Chemical Bond for Efficient Photocatalytic Degradation of Bisphenol A. Appl Surf Sci 2024, 664. [Google Scholar] [CrossRef]
- Balavi, H.; Samadanian-Isfahani, S.; Mehrabani-Zeinabad, M.; Edrissi, M. Preparation and Optimization of CeO2 Nanoparticles and Its Application in Photocatalytic Degradation of Reactive Orange 16 Dye. Powder Technol 2013, 249, 549–555. [Google Scholar] [CrossRef]
- Feng, T.; Wang, X.; Feng, G. Synthesis of Novel CeO2 Microspheres with Enhanced Solar Light Photocatalyic Properties. Mater Lett 2013, 100, 36–39. [Google Scholar] [CrossRef]
- Li, P.; Chen, X.; Li, Y.; Schwank, J.W. A Review on Oxygen Storage Capacity of CeO2-Based Materials: Influence Factors, Measurement Techniques, and Applications in Reactions Related to Catalytic Automotive Emissions Control. Catal Today 2019, 327, 90–115. [Google Scholar] [CrossRef]
- Zeng, C.H.; Xie, S.; Yu, M.; Yang, Y.; Lu, X.; Tong, Y. Facile Synthesis of Large-Area CeO2/ZnO Nanotube Arrays for Enhanced Photocatalytic Hydrogen Evolution. J Power Sources 2014, 247, 545–550. [Google Scholar] [CrossRef]
- Faisal, M.; Bahadar Khan, S.; Rahman, M.M.; Jamal, A.; Akhtar, K.; Abdullah, M. Role of ZnO-CeO2 Nanostructures as a Photo-Catalyst and Chemi-Sensor; 2011. [Google Scholar]
- Li, C.; Zhang, X.; Dong, W.; Liu, Y. High Photocatalytic Activity Material Based on High-Porosity ZnO/CeO2 Nanofibers. Mater Lett 2012, 80, 145–147. [Google Scholar] [CrossRef]
- Li, C.; Chen, R.; Zhang, X.; Shu, S.; Xiong, J.; Zheng, Y.; Dong, W. Electrospinning of CeO2-ZnO Composite Nanofibers and Their Photocatalytic Property. Mater Lett 2011, 65, 1327–1330. [Google Scholar] [CrossRef]
- Sherly, E.D.; Vijaya, J.J.; Kennedy, L.J. Effect of CeO2 Coupling on the Structural, Optical and Photocatalytic Properties of ZnO Nanoparticle. J Mol Struct 2015, 1099, 114–125. [Google Scholar] [CrossRef]
- Zheng, C.; Jiang, G.; Li, Y.; Jin, Z. NiO and Co1.29Ni1.71O4 Derived from NiCo LDH Form S-Scheme Heterojunction for Efficient Photocatalytic Hydrogen Evolution. J Alloys Compd 2022, 904. [Google Scholar] [CrossRef]
- Cavani, F.; Trifirò, F.; Vaccari, A. Hydrotalcite-Type Anionic Clays: Preparation, Properties and Applications. Catal Today 1991, 11, 173–301. [Google Scholar] [CrossRef]
- Rives, V. Study of Layered Double Hydroxides by Thermal Methods. In Layered Double Hydroxides: Present and Future; Rives, V., Ed.; NOVA Science Publishers, Inc: New York, 2001; pp. 127–152. [Google Scholar]
- Kameliya, J.; Verma, A.; Dutta, P.; Arora, C.; Vyas, S.; Varma, R.S. Layered Double Hydroxide Materials: A Review on Their Preparation, Characterization, and Applications. Inorganics 2023, 11, 121. [Google Scholar] [CrossRef]
- Wang, Q.; O’hare, D. Recent Advances in the Synthesis and Application of Layered Double Hydroxide (LDH) Nanosheets. Chem Rev 2012, 112, 4124–4155. [Google Scholar] [CrossRef] [PubMed]
- Rives, V. Layered Double Hydroxides: Present and Future; NOVA Science Publishers, Inc: New York, 2001; ISBN 978-1-61209-289-8. [Google Scholar]
- Mandal, S.; Patil, V.S.; Mayadevi, S. Alginate and Hydrotalcite-like Anionic Clay Composite Systems: Synthesis, Characterization and Application Studies. Microporous and Mesoporous Materials 2012, 158, 241–246. [Google Scholar] [CrossRef]
- Sun, P.; Ma, R.; Ma, W.; Wu, J.; Wang, K.; Sasaki, T.; Zhu, H. Highly Selective Charge-Guided Ion Transport through a Hybrid Membrane Consisting of Anionic Graphene Oxide and Cationic Hydroxide Nanosheet Superlattice Units. NPG Asia Mater 2016, 8, e259-10. [Google Scholar] [CrossRef]
- Dutta, K.; Das, S.; Pramanik, A. Concomitant Synthesis of Highly Crystalline Zn-Al Layered Double Hydroxide and ZnO: Phase Interconversion and Enhanced Photocatalytic Activity. J Colloid Interface Sci 2012, 366, 28–36. [Google Scholar] [CrossRef] [PubMed]
- Song, F.; Hu, X. Exfoliation of Layered Double Hydroxides for Enhanced Oxygen Evolution Catalysis. Nat Commun 2014, 5, 1–9. [Google Scholar] [CrossRef] [PubMed]
- Fan, G.; Li, F.; Evans, D.G.; Duan, X. Catalytic Applications of Layered Double Hydroxides: Recent Advances and Perspectives. Chem. Soc. Rev. 2014, 43, 7040–7066. [Google Scholar] [CrossRef] [PubMed]
- Fan, M.T.; Miao, K.P.; Lin, J.D.; Zhang, H.Bin; Liao, D.W. Mg-Al Oxide Supported Ni Catalysts with Enhanced Stability for Efficient Synthetic Natural Gas from Syngas. Appl Surf Sci 2014, 307, 682–688. [Google Scholar] [CrossRef]
- Khan, A.I.; Lei, L.; Norquist, A.J.; O’Hare, D. Intercalation and Controlled Release of Pharmaceutically Active Compounds from a Layered Double Hydroxide. Chemical communications 2001, 2342–2343. [Google Scholar] [CrossRef] [PubMed]
- Peng, F.; Wang, D.; Cao, H.; Liu, X. Loading 5-Fluorouracil into Calcined Mg/Al Layered Double Hydroxide on AZ31 via Memory Effect. Mater Lett 2018, 213, 383–386. [Google Scholar] [CrossRef]
- Patel, R.; Park, J.T.; Patel, M.; Dash, J.K.; Gowd, E.B.; Karpoormath, R.; Mishra, A.; Kwak, J.; Kim, J.H. Transition-Metal-Based Layered Double Hydroxides Tailored for Energy Conversion and Storage. J Mater Chem A Mater 2018, 6, 12–29. [Google Scholar] [CrossRef]
- Saifullah, B.; Hussein, M.Z. Inorganic Nanolayers: Structure, Preparation, and Biomedical Applications. Int J Nanomedicine 2015, 10, 5609–5633. [Google Scholar] [CrossRef] [PubMed]
- Prasad, C.; Tang, H.; Liu, Q.Q.; Zulfiqar, S.; Shah, S.; Bahadur, I. An Overview of Semiconductors/Layered Double Hydroxides Composites: Properties, Synthesis, Photocatalytic and Photoelectrochemical Applications. J Mol Liq 2019, 289. [Google Scholar] [CrossRef]
- Asghar, H.; Maurino, V.; Iqbal, M.A. Development of Highly Photoactive Mixed Metal Oxide (MMO) Based on the Thermal Decomposition of ZnAl-NO3-LDH. Eng 2024, 5, 589–599. [Google Scholar] [CrossRef]
- Lee, S.Bin; Ko, E.H.; Park, J.Y.; Oh, J.M. Mixed Metal Oxide by Calcination of Layered Double Hydroxide: Parameters Affecting Specific Surface Area. Nanomaterials 2021, 11, 1153. [Google Scholar] [CrossRef]
- Prabagar, J.S.; Vinod, D.; Sneha, Y.; Anilkumar, K.M.; Rtimi, S.; Wantala, K.; Shivaraju, H.P. Novel GC3N4/MgZnAl-MMO Derived from LDH for Solar-Based Photocatalytic Ammonia Production Using Atmospheric Nitrogen. Environmental Science and Pollution Research 2023, 30, 90383–90396. [Google Scholar] [CrossRef] [PubMed]
- Kloprogge, J.T.; Hickey, L.; Frost, R.L. The Effects of Synthesis PH and Hydrothermal Treatment on the Formation of Zinc Aluminum Hydrotalcites. J Solid State Chem 2004, 177, 4047–4057. [Google Scholar] [CrossRef]
- Li, P.; Yu, F.; Altaf, N.; Zhu, M.; Li, J.; Dai, B.; Wang, Q. Two-Dimensional Layered Double Hydroxides for Reactions of Methanation and Methane Reforming in C1 Chemistry. Materials 2018, 11, 221. [Google Scholar] [CrossRef] [PubMed]
- Hwang, S.; Hong, U.G.; Lee, J.; Seo, J.G.; Baik, J.H.; Koh, D.J.; Lim, H.; Song, I.K. Methanation of Carbon Dioxide over Mesoporous Ni-Fe-Al2O3 Catalysts Prepared by a Coprecipitation Method: Effect of Precipitation Agent. Journal of Industrial and Engineering Chemistry 2013, 19, 2016–2021. [Google Scholar] [CrossRef]
- Misol, A.; Labajos, F.M.; Morato, A.; Rives, V. Synthesis of Zn,Al Layered Double Hydroxides in the Presence of Amines. Appl Clay Sci 2020, 189, 105539. [Google Scholar] [CrossRef]
- Brown, J.G. X-Rays and Their Applications; Plenum/Ros.; Plenum Publishing Corporation: New York, 1966; ISBN 0-306-20021-X. [Google Scholar]
- Jenkins, R.; de Vries, J.L. Worked Examples in X-Ray Analysis, 2nd ed.; Springer: New York, NY, 1970; ISBN 978-1-4899-2649-4. [Google Scholar]
- Brunauer, S.; Emmett, P.H.; Teller, E. Adsorption of Gases in Multimolecular Layers. J Am Chem Soc 1938, 60, 309–319. [Google Scholar] [CrossRef]
- Lowell, S.; Shields, J.E.; Thomas, M.A.; Thommes, M. Characterization of Porous Solids and Powders: Surface Area, Pore Size and Density; Springer: The Netherlands, 2010. [Google Scholar]
- Makuła, P.; Pacia, M.; Macyk, W. How To Correctly Determine the Band Gap Energy of Modified Semiconductor Photocatalysts Based on UV–Vis Spectra. J Phys Chem Lett 2018, 9, 6814–6817. [Google Scholar] [CrossRef] [PubMed]
- Tauc, J.; Grigorovici, R.; Vancu, A. Optical Properties and Electronic Structure of Amorphous Germanium. physica status solidi (b) 1966, 15, 627–637. [Google Scholar] [CrossRef]
- Drits, V.A.; Bookin, A.S. Crystal Structure and X-Ray Identification of Layered Double Hydroxides. In Layered Double Hydroxides: Present and Future; Rives, V., Ed.; NOVA Science Publishers, Inc: New York, 2001; pp. 41–100. [Google Scholar]
- Miyata, S. Anion-Exchange Properties of Hydrotalcite-Like Compounds. Clays Clay Miner 1983, 31, 305–311. [Google Scholar] [CrossRef]
- Ho, P.H.; de Luna, G.S.; Angelucci, S.; Canciani, A.; Jones, W.; Decarolis, D.; Ospitali, F.; Aguado, E.R.; Rodríguez-Castellón, E.; Fornasari, G.; et al. Understanding Structure-Activity Relationships in Highly Active La Promoted Ni Catalysts for CO2 Methanation. Appl Catal B 2020, 278, 119256. [Google Scholar] [CrossRef]
- Huheey, J.E.; Keiter, E.A.; Keiter, R.L. Inorganic Chemistry: Principles of Structure and Reactivity, 4th ed.; HarperCollins College Publishers: New York, 1993. [Google Scholar]
- Wierzbicki, D.; Debek, R.; Motak, M.; Grzybek, T.; Gálvez, M.E.; Da Costa, P. Novel Ni-La-Hydrotalcite Derived Catalysts for CO2 Methanation. Catal Commun 2016, 83, 5–8. [Google Scholar] [CrossRef]
- Daza, C.E.; Gallego, J.; Moreno, J.A.; Mondragón, F.; Moreno, S.; Molina, R. CO2 Reforming of Methane over Ni/Mg/Al/Ce Mixed Oxides. Catal Today 2008, 133–135, 357–366. [Google Scholar] [CrossRef]
- Fernández, J.M.; Barriga, C.; Ulibarri, M.A.; Labajos, F.M.; Rives, V. New Hydrotalcite-like Compounds Containing Yttrium. Chemistry of Materials 1997, 9, 312–318. [Google Scholar] [CrossRef]
- Drits, V.A.; Bookin, A.S. Crystal Structure and X-Ray Identification of Layered Double Hydroxides. In Layered Double Hydroxides: Present and Future; Rives, V., Ed.; NOVA Science Publishers, Inc: New York, 2001; pp. 41–100. [Google Scholar]
- Cavani, F.; Trifirò, F.; Vaccari, A. Hydrotalcite-Type Anionic Clays: Preparation, Properties and Applications. Catal Today 1991, 11, 173–301. [Google Scholar] [CrossRef]
- Bookin, A.S.; Drits, V.A. Polytype Diversity of the Hydrotalcite-like Minerals I. Possible Polytypes and Their Diffraction Features. Clays Clay Miner 1993, 41, 551–557. [Google Scholar] [CrossRef]
- JCPDS, F. Joint Committee on Powder Diffraction Standards; International Centre for Diffraction Data: Pennsylvania, U.S.A, 1977. [Google Scholar]
- Labajos, F.M.; Rives, V.; Ulibarri, M.A. Effect of Hydrothermal and Thermal Treatments on the Physicochemical Properties of Mg-Al Hydrotalcite-like Materials. J Mater Sci 1992, 27, 1546–1552. [Google Scholar] [CrossRef]
- Hu, X.; Li, P.; Zhang, X.; Yu, B.; Lv, C.; Zeng, N.; Luo, J.; Zhang, Z.; Song, J.; Liu, Y. Ni-Based Catalyst Derived from NiAl Layered Double Hydroxide for Vapor Phase Catalytic Exchange between Hydrogen and Water. Nanomaterials 2019, 9, 1688. [Google Scholar] [CrossRef] [PubMed]
- Kovanda, F.; Rojka, T.; Bezdička, P.; Jirátová, K.; Obalová, L.; Pacultová, K.; Bastl, Z.; Grygar, T. Effect of Hydrothermal Treatment on Properties of Ni-Al Layered Double Hydroxides and Related Mixed Oxides. J Solid State Chem 2009, 182, 27–36. [Google Scholar] [CrossRef]
- Meza-Fuentes, E.; Rodriguez-Ruiz, J.; Rangel, M.D.C. Characteristics of NiO Present in Solids Obtained from Hydrotalcites Based on Ni/Al and Ni-Zn/Al. Dyna (Medellin) 2019, 86, 58–65. [Google Scholar] [CrossRef]
- Nakamoto, K. Infrared and Raman Spectra of Inorganic and Coordination Compounds. Part A: Theory and Applications in Inorganic Chemistry, 6th ed.; John Wiley and Sons Inc.: Hoboken, New Jersey, 2009; ISBN 9780471743392. [Google Scholar]
- Kloprogge, J.T.; Wharton, D.; Hickey, L.; Frost, R.L. Infrared and Raman Study of Interlayer Anions CO32−, NO3−, SO42− and ClO4− in Mg/Al-Hydrotalcite. American Mineralogist 2002, 87, 623–629. [Google Scholar] [CrossRef]
- Kloprogge, J.T.; Frost, R.L. Fourier Transform Infrared and Raman Spectroscopic Study of the Local Structure of Mg-, Ni-, and Co-Hydrotalcites. J Solid State Chem 1999, 146, 506–515. [Google Scholar] [CrossRef]
- Kooli, F.; Kosuge, K.; Tsunashima, A. Mg-Zn-Al-CO3 and Zn-Cu-Al-CO3 Hydrotalcite-like Compounds: Preparation and Characterization. J Mater Sci 1995, 30, 4591–4597. [Google Scholar] [CrossRef]
- Mališová, M.; Horňáček, M.; Mikulec, J.; Hudec, P.; Jorík, V. FTIR Study of Hydrotalcite. Acta Chimica Slovaca 2018, 11, 147–156. [Google Scholar] [CrossRef]
- Benito Martín, P. Influencia de La Radiación Microondas En El Proceso de Síntesis de Compuestos Tipo Hidrotalcita y Óxidos Relacionados, Universidad de Salamanca, 2007.
- Abdolmohammad-Zadeh, H.; Kohansal, S.; Sadeghi, G.H. Nickel-Aluminum Layered Double Hydroxide as a Nanosorbent for Selective Solid-Phase Extraction and Spectrofluorometric Determination of Salicylic Acid in Pharmaceutical and Biological Samples. Talanta 2011, 84, 368–373. [Google Scholar] [CrossRef] [PubMed]
- Jayakumar, G.; Irudayaraj, A.A.; Raj, A.D. Investigation on the Synthesis and Photocatalytic Activity of Activated Carbon–Cerium Oxide (AC–CeO2) Nanocomposite. Appl Phys A Mater Sci Process 2019, 125, 1–9. [Google Scholar] [CrossRef]
- Kumar, P.R.; Maharajan, T.M.; Chinnasamy, M.; Prabu, A.P.; Suthagar, J.A.; Kumar, K.S. Hydroxyl Radical Scavenging Activity of La2O3 Nanoparticles. The Pharma Innovation Journal 2019, 8, 759–763. [Google Scholar]
- Patil, S.P.; Jadhav, L.D.; Dubal, D.P.; Puri, V.R. Characterization of NiO-Al2O3 Composite and Its Conductivity in Biogas for Solid Oxide Fuel Cell. Materials Science- Poland 2016, 34, 266–274. [Google Scholar] [CrossRef]
- Cai, G.Bin; Chen, S.F.; Liu, L.; Jiang, J.; Yao, H.Bin; Xu, A.W.; Yu, S.H. 1,3-Diamino-2-Hydroxypropane-N,N,N′,N′-Tetraacetic Acid Stabilized Amorphous Calcium Carbonate: Nucleation, Transformation and Crystal Growth. CrystEngComm 2010, 12, 234–241. [Google Scholar] [CrossRef]
- Liu, C.; Shih, K.; Gao, Y.; Li, F.; Wei, L. Dechlorinating Transformation of Propachlor through Nucleophilic Substitution by Dithionite on the Surface of Alumina. J Soils Sediments 2012, 12, 724–733. [Google Scholar] [CrossRef]
- Yadav, S.K.; Jeevanandam, P. Synthesis of NiO-Al2O3 Nanocomposites by Sol-Gel Process and Their Use as Catalyst for the Oxidation of Styrene. J Alloys Compd 2014, 610, 567–574. [Google Scholar] [CrossRef]
- Jeevanandam, P.; Koltypin, Y.; Gedanken, A. Preparation of Nanosized Nickel Aluminate Spinel by a Sonochemical Method; 2002; Volume 90. [Google Scholar]
- Culica, M.E.; Chibac-Scutaru, A.L.; Melinte, V.; Coseri, S. Cellulose Acetate Incorporating Organically Functionalized CeO2 NPs: Efficient Materials for UV Filtering Applications. Materials 2020, 13, 2955. [Google Scholar] [CrossRef] [PubMed]
- Kabir, H.; Nandyala, S.H.; Rahman, M.M.; Kabir, M.A.; Stamboulis, A. Influence of Calcination on the Sol–Gel Synthesis of Lanthanum Oxide Nanoparticles. Appl Phys A Mater Sci Process 2018, 124. [Google Scholar] [CrossRef]
- Thommes, M.; Kaneko, K.; Neimark, A.V.; Olivier, J.P.; Rodriguez-Reinoso, F.; Rouquerol, J.; Sing, K.S.W. Physisorption of Gases, with Special Reference to the Evaluation of Surface Area and Pore Size Distribution (IUPAC Technical Report). Pure and Applied Chemistry 2015, 87, 1051–1069. [Google Scholar] [CrossRef]
- Brunauer, S.; Deming, L.S.; Deming, W.E.; Teller, E. On a Theory of the van Der Waals Adsorption of Gases. J Am Chem Soc 1940, 62, 1723–1732. [Google Scholar] [CrossRef]
- Barrett, E.P.; Joyner, L.G.; Halenda, P.P. The Determination of Pore Volume and Area Distributions in Porous Substances. I. Computations from Nitrogen Isotherms. J Am Chem Soc 1951, 73, 373–380. [Google Scholar] [CrossRef]
Figure 1.
PXRD diagrams of LDH precursors (A) and LDHs calcined at 600 °C (B).
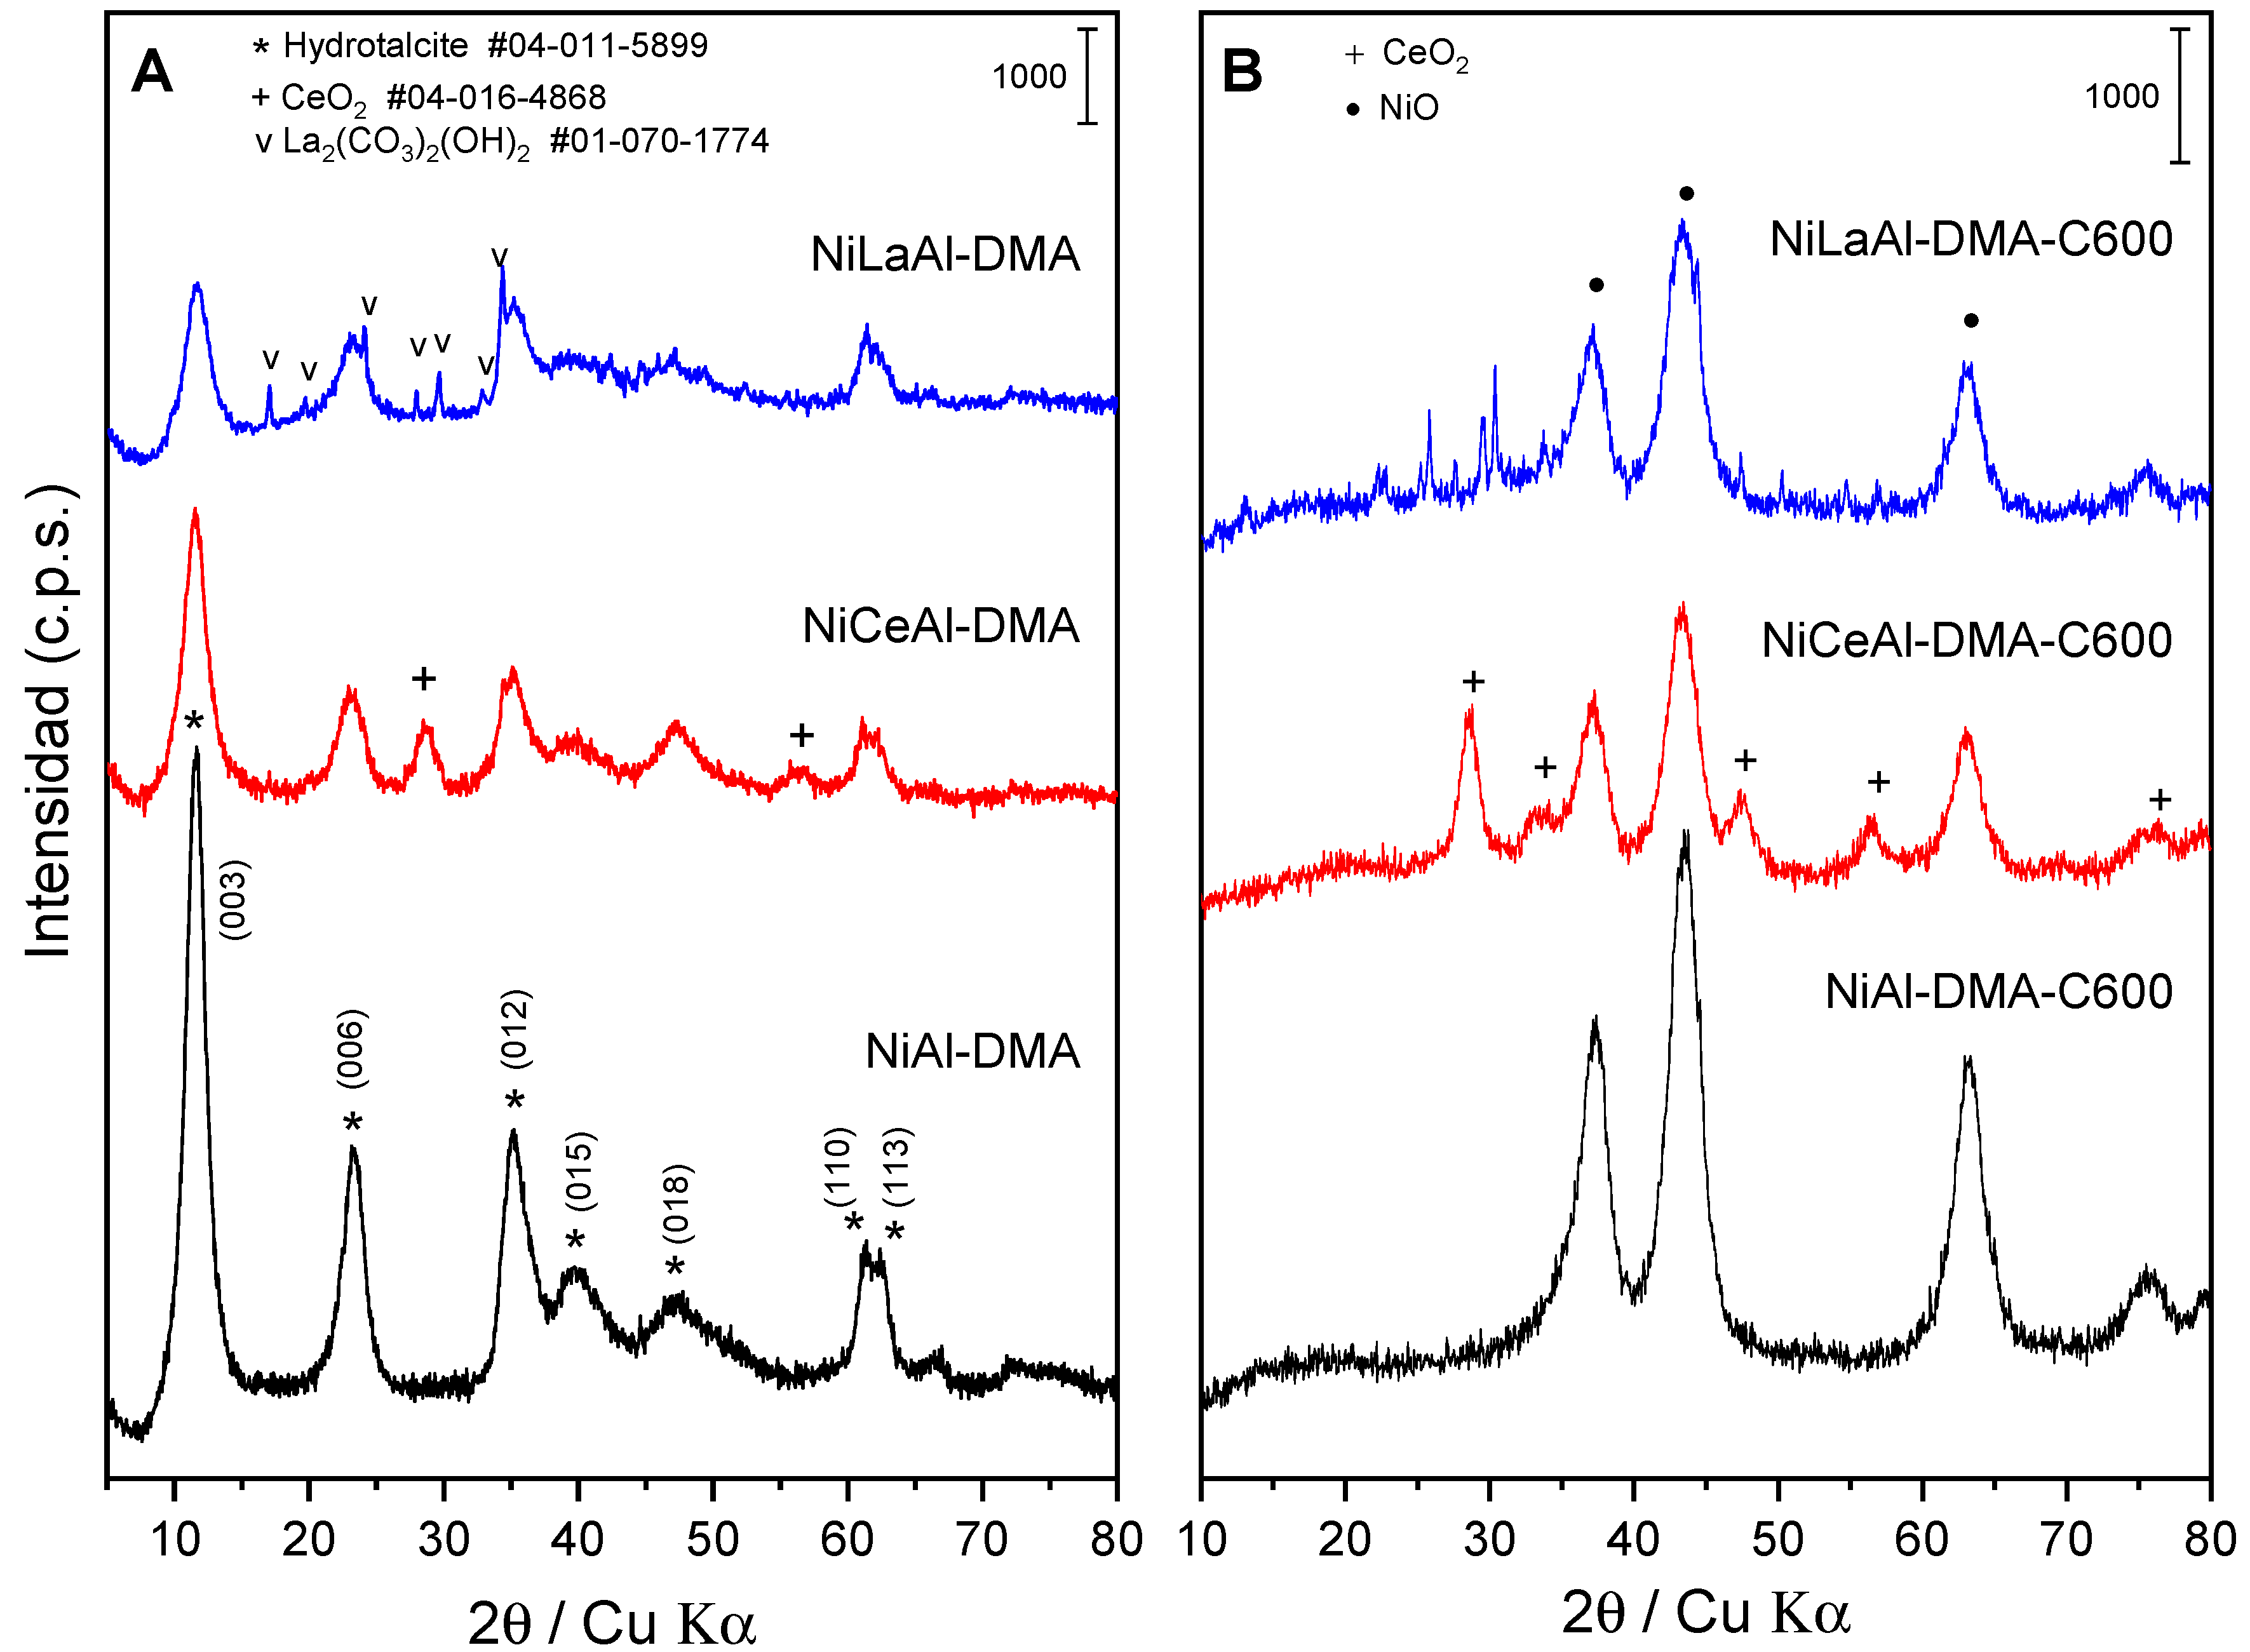
Figure 2.
FT-IR spectra of LDHs precursors (A) and the LDHs calcined at 600 °C (B).
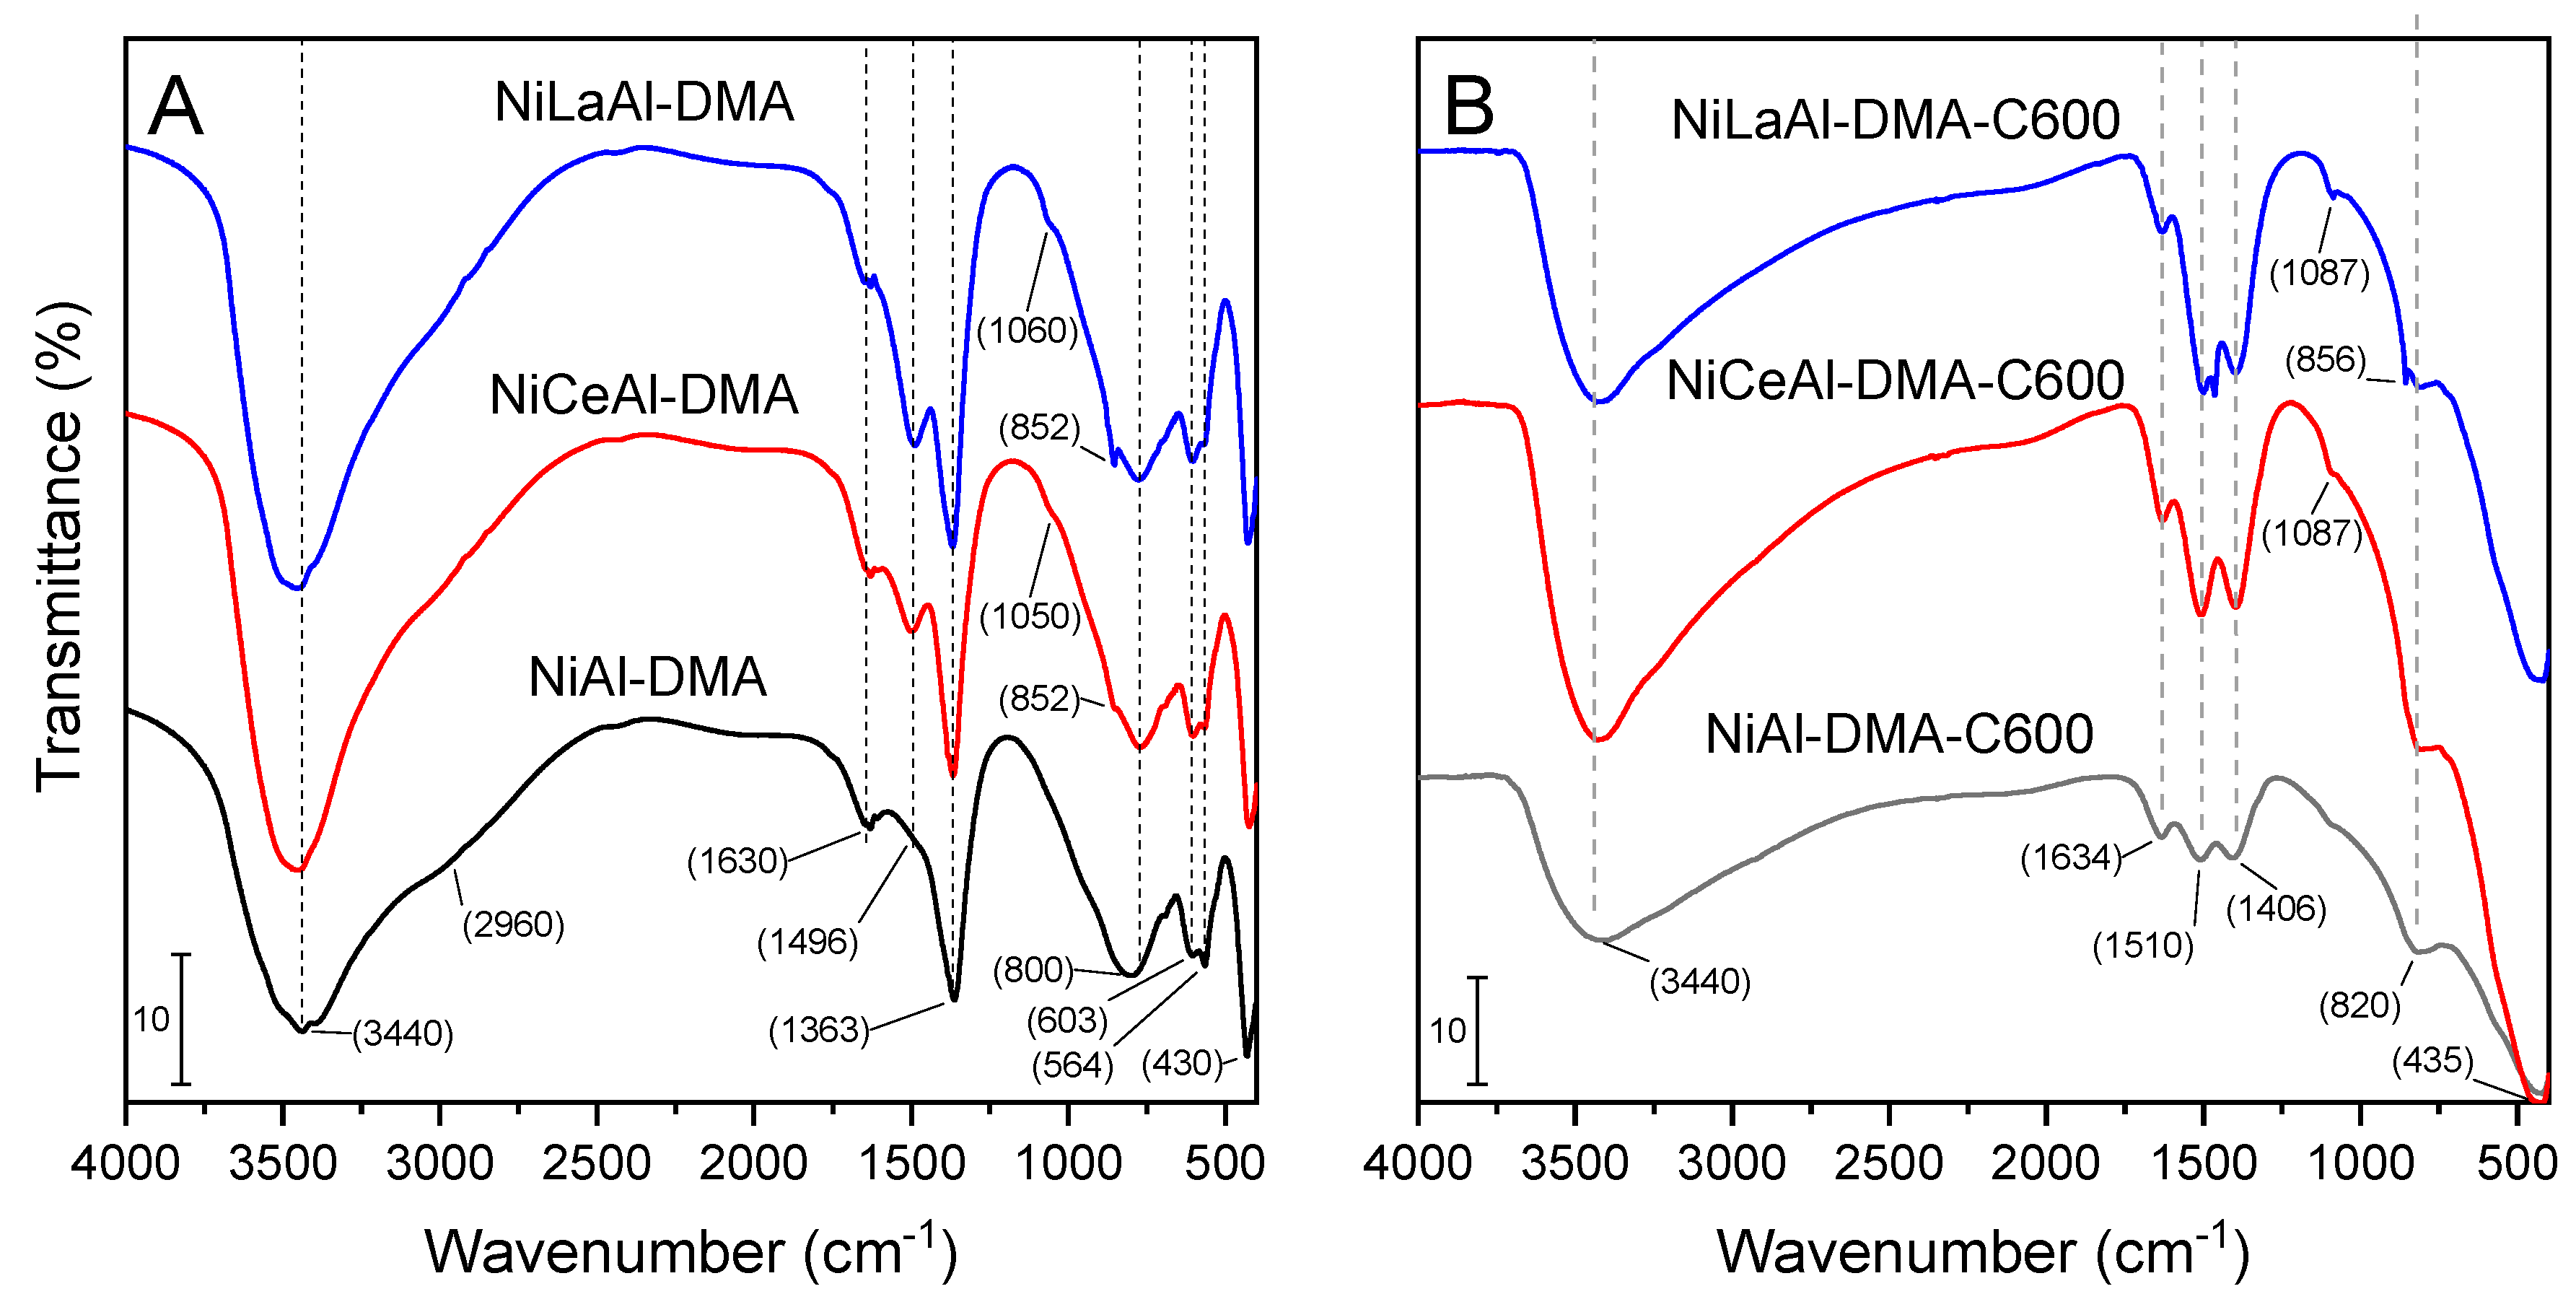
Figure 3.
TG and DTA curves of LDH precursors.
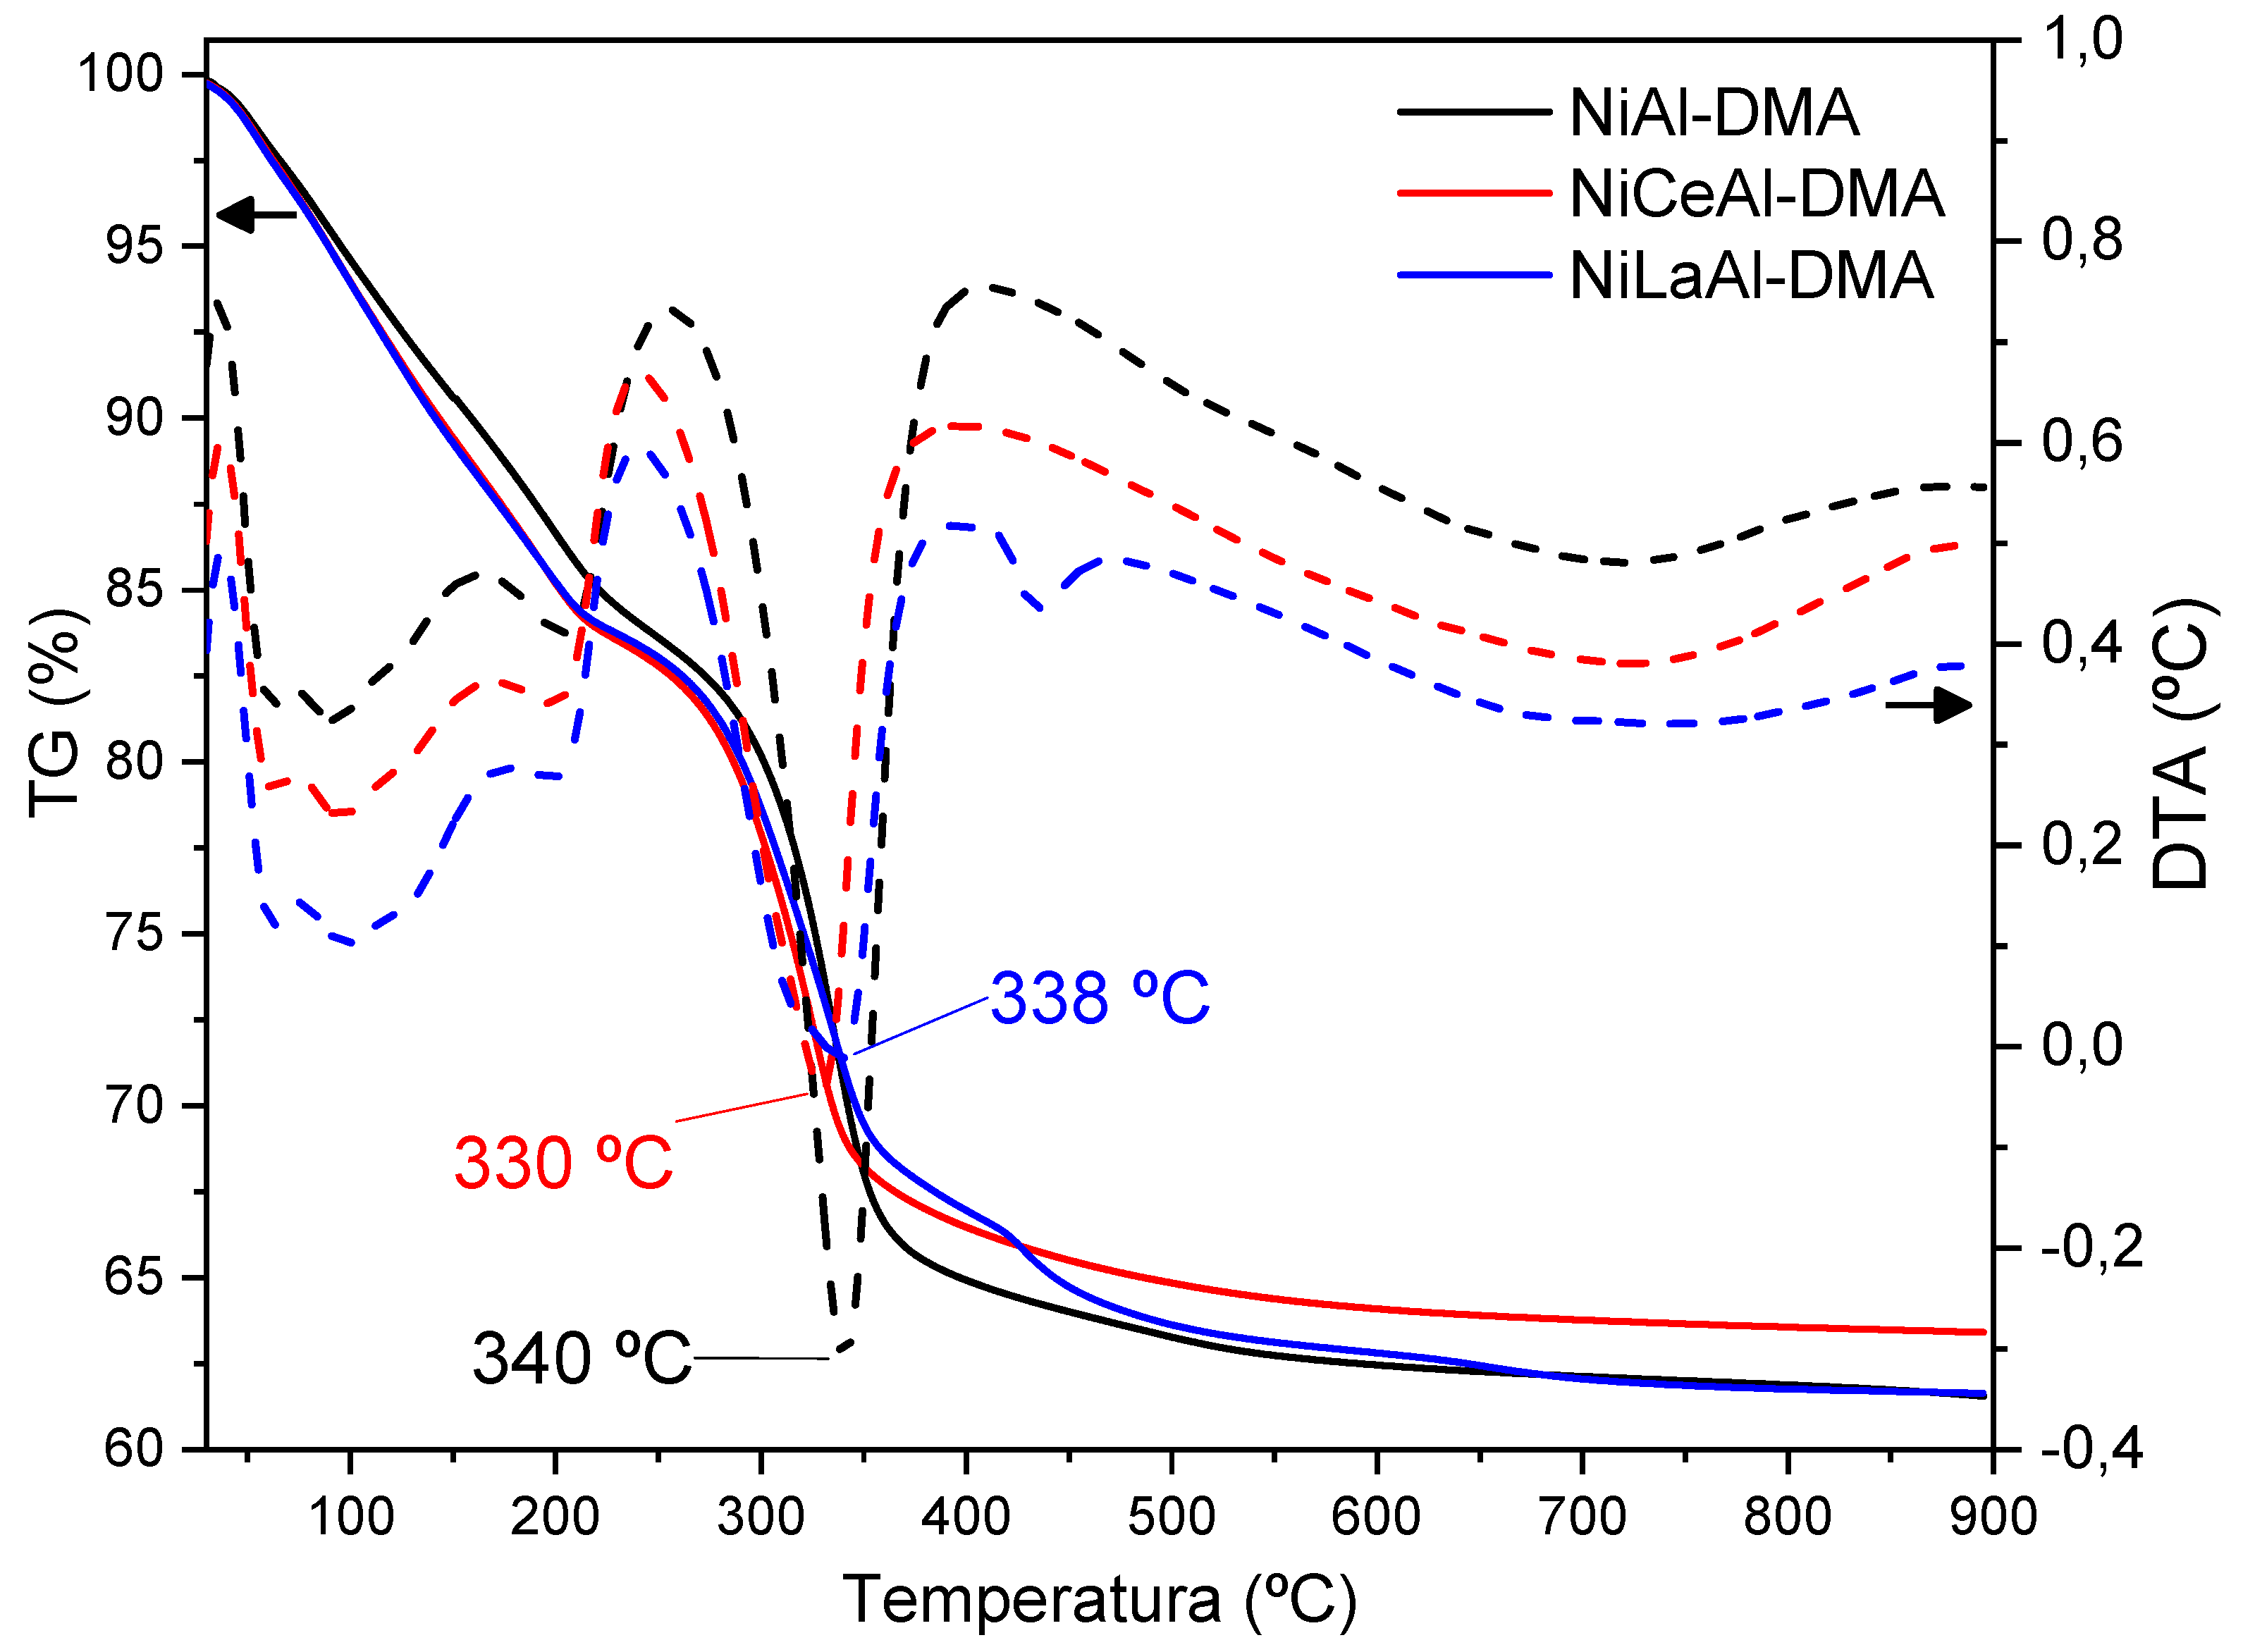
Figure 4.
N2 adsorption-desorption isotherms of the LDHs calcined at 600 °C.
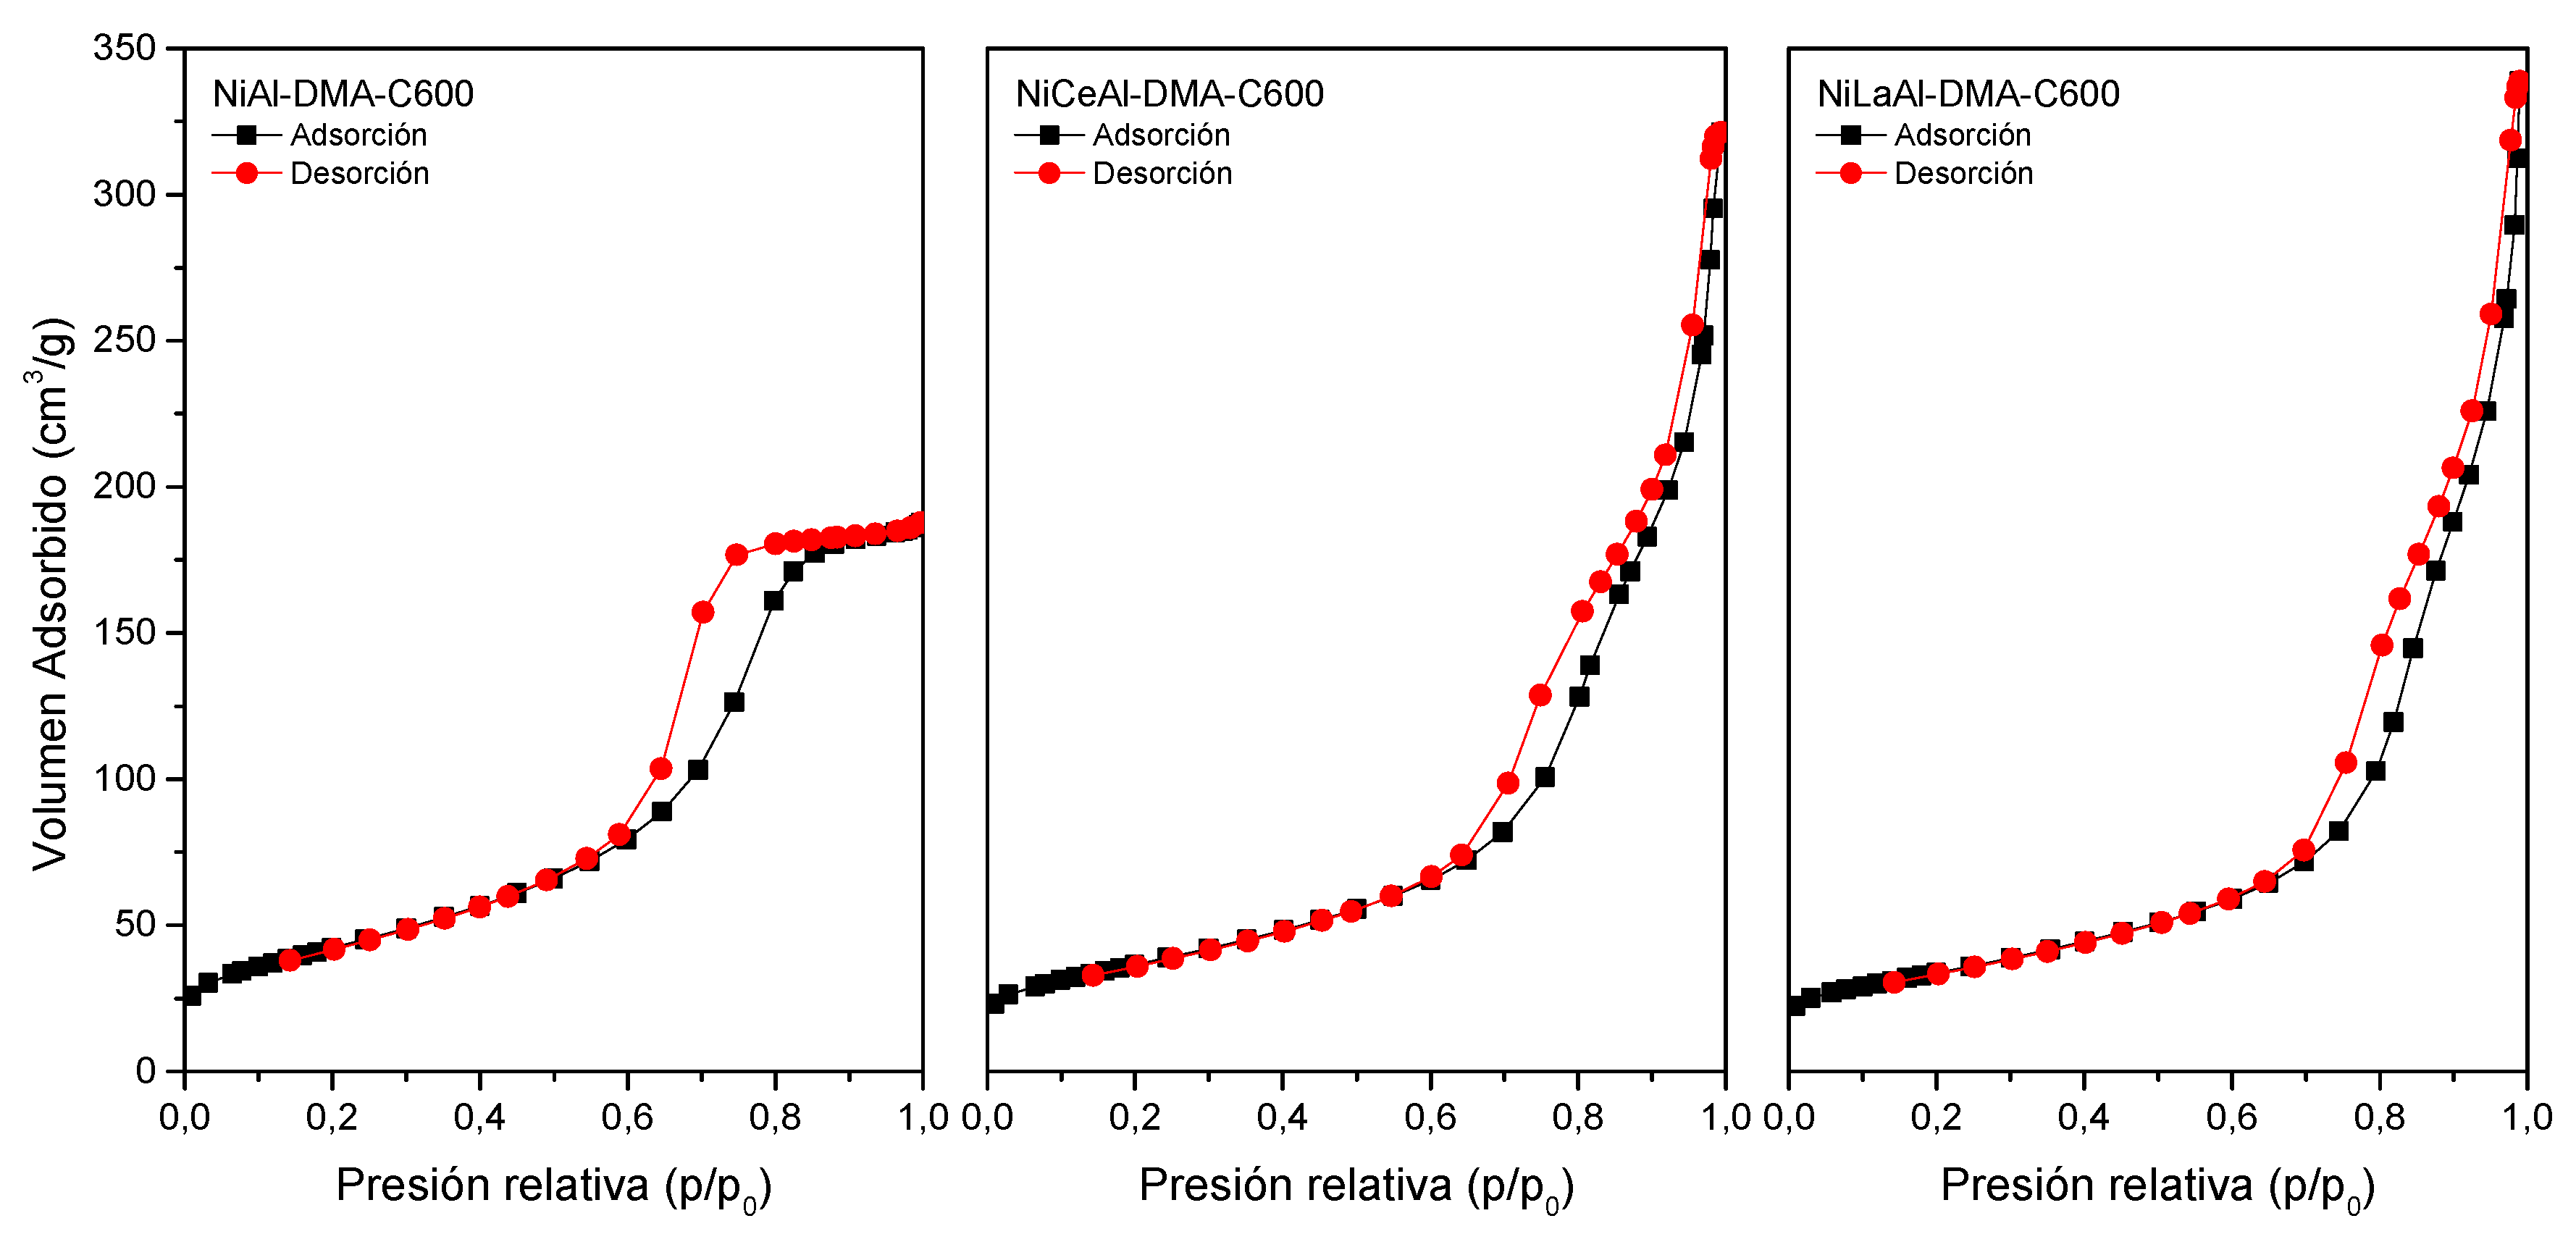

Table 1.
Element chemical analysis results and chemical formulae of LDHs samples. (X = Ce o La).
| Sample | Ni a | X a | Al a | M2+/M3+ b | Formulae |
|---|---|---|---|---|---|
| NiAl-DMA | 0.643 | - | 0.310 | 2.07 | [Ni0.68Al0.32(OH)2](CO3)0.16 · 0.99 H2O |
| NiCeAl-DMA | 0.625 | 0.026 | 0.247 | 2.29 | [Ni0.70Ce0.03Al0.27(OH)2](CO3)0.15 · 1.04 H2O |
| NiLaAl-DMA | 0.596 | 0.042 | 0.233 | 2.17 | [Ni0.68La0.05Al0.27(OH)2](CO3)0.16 · 1.05 H2O |
a Mol per 100 g, b Molar ratio.
Table 2.
Lattice parameters c and a and average crystallite size (D) of the LDH precursors.
| Sample | c (Å) | (Å) | D (nm) |
|---|---|---|---|
| NiAl-DMA | 22.96 | 3.028 | 4.7 |
| NiCeAl-DMA | 23.09 | 3.037 | 3.9 |
| NiLaAl-DMA | 23.00 | 3.019 | 3.7 |
Table 3.
Lattice parameter a and average crystallite size (D) of the NiO phase of the LDH samples calcined at 600 °C.
Table 3.
Lattice parameter a and average crystallite size (D) of the NiO phase of the LDH samples calcined at 600 °C.
| Sample | (Å) | D (nm) |
|---|---|---|
| NiAl-DMA-C600 | 4.168 | 3.7 |
| NiCeAl-DMA-C600 | 4.178 | 3.8 |
| NiLaAl-DMA-C600 | 4.186 | 3.6 |
Table 4.
Specific surface area BET, pore volume and BJH average pore diameter of the LDH calcined at 600 °C.
Table 4.
Specific surface area BET, pore volume and BJH average pore diameter of the LDH calcined at 600 °C.
| Sample | SBET (m²/g) | VP (mm3/g) | BJH average desorption pore diameter (nm) |
|---|---|---|---|
| NiAl-DMA-C600 | 150 | 290 | 5.6 |
| NiCeAl-DMA-C600 | 130 | 460 | 11.3 |
| NiLaAl-DMA-C600 | 120 | 480 | 13.1 |
Table 5.
Linear fit equations and band gaps energy values of semiconductors.
| Sample | Slope below | Fundamental peak | Eg (eV) |
|---|---|---|---|
| NiAl-DMA-C600 | y = - 0.10939 + 0.04658 x | y = - 1.86911 + 0.55943 x | 3.43 |
| NiCeAl-DMA-C600 | y = - 0.1369 + 0.05688 x | y = - 3.39866 + 0.98163 x | 3.53 |
| NiLaAl-DMA-C600 | y = - 0.03613 + 0.01913 x | y = - 3.29396 + 0.9276 x | 3.59 |
Disclaimer/Publisher’s Note: The statements, opinions and data contained in all publications are solely those of the individual author(s) and contributor(s) and not of MDPI and/or the editor(s). MDPI and/or the editor(s) disclaim responsibility for any injury to people or property resulting from any ideas, methods, instructions or products referred to in the content. |
© 2024 by the authors. Licensee MDPI, Basel, Switzerland. This article is an open access article distributed under the terms and conditions of the Creative Commons Attribution (CC BY) license (http://creativecommons.org/licenses/by/4.0/).
Copyright: This open access article is published under a Creative Commons CC BY 4.0 license, which permit the free download, distribution, and reuse, provided that the author and preprint are cited in any reuse.


