1. Introduction
The use of inertial measurement units (IMU) as wearable sensors is continuously expanding in various domains, including healthcare [
1] [
2], sports [
3], rehabilitation [
4], and human computer interaction [
5]. The improvement and innovation in sensor technology is a key requisite to such expansion.
Each specific application of inertial measurement units (IMUs) is characterized by unique operational demands, leading to diverse usage modalities under a wide array of conditions. These units are affixed to various segments of the human body, and the signals of interest may include distinct subsets of accelerometers and gyroscopes, as well as different spatial orientations of the device. In some applications, such as energy expenditure estimation, these signals are sampled over long periods of time with signals of interest at low frequencies, ranging from 3 to 15 days at between 20 Hz and 100 Hz. Others, such as sports analysis, require sampling for just a few minutes with signals at frequencies closer to 1 kHz [
6].
Because of this variability of needs, there is a wide and growing offer of devices of this type on the market, usually with closed characteristics suitable for a specific type of monitoring problem [
7].
Our interest lies in developing a general-purpose, configurable wearable device capable of capturing both high-frequency signals for precise, short-term monitoring and low-frequency signals for extended monitoring. This device aims to optimize energy consumption and storage capacity, essential for enhancing its operational efficiency and usability in various monitoring contexts. Additionally, we intend for this device to serve as an affordable alternative to gold-standard systems such as the Xsens, making advanced monitoring technologies more accessible while maintaining a high level of accuracy and reliability.
This requires precise control of the hardware, as well as rigorous characterization of the device’s performance, so that it can be optimized while maintaining the accuracy and robustness that will be required for its use in applications.
In this paper the first iteration of the design of such wearable sensor is presented, with emphasis in its evaluation and characterization [
8][
9][
10]. The device was assembled and then analyzed in several aspects: power consumption, sampling performance and error characterization.
The results show a good response and put on the spotlight the most critical optimizations needed to improve the device to reach the goal of a smart general-use unit for human motion monitoring.
2. Materials and Methods
After a series of preliminary tests, a sensor capable of satisfying the best consumption/performance ratio in the context described above was selected. The optimization of components and smaller hardware resources was also started, seeking to increase the density of components on the PCB, by means of 0402 resistors and capacitors, suppressing unnecessary sockets, etc.
2.1. Description of the sensor
The LSM6DSL IMU sensor from STMicroelectronics was selected [
11]. This choice is motivated by the elimination of the magnetometer component, its low power consumption, and its specific performance as a sensor for use in wearables, as shown in
Table 1 for the main characteristics of the sensor.
2.2. Description of the Microcontroller
The selected control unit is the STM32L051[
12] low power microcontroller from the same manufacturer as the sensor. The characteristics of this unit meet our requirements for the integrated peripherals minimizing the consumption. It is also available with a pinless package and 7 mm wide, which together with the elimination of the external clock optimizes the space on the PCB, as detailed in
Table 2 for the main characteristics of the microcontroller.
2.3. Description of the Device Design
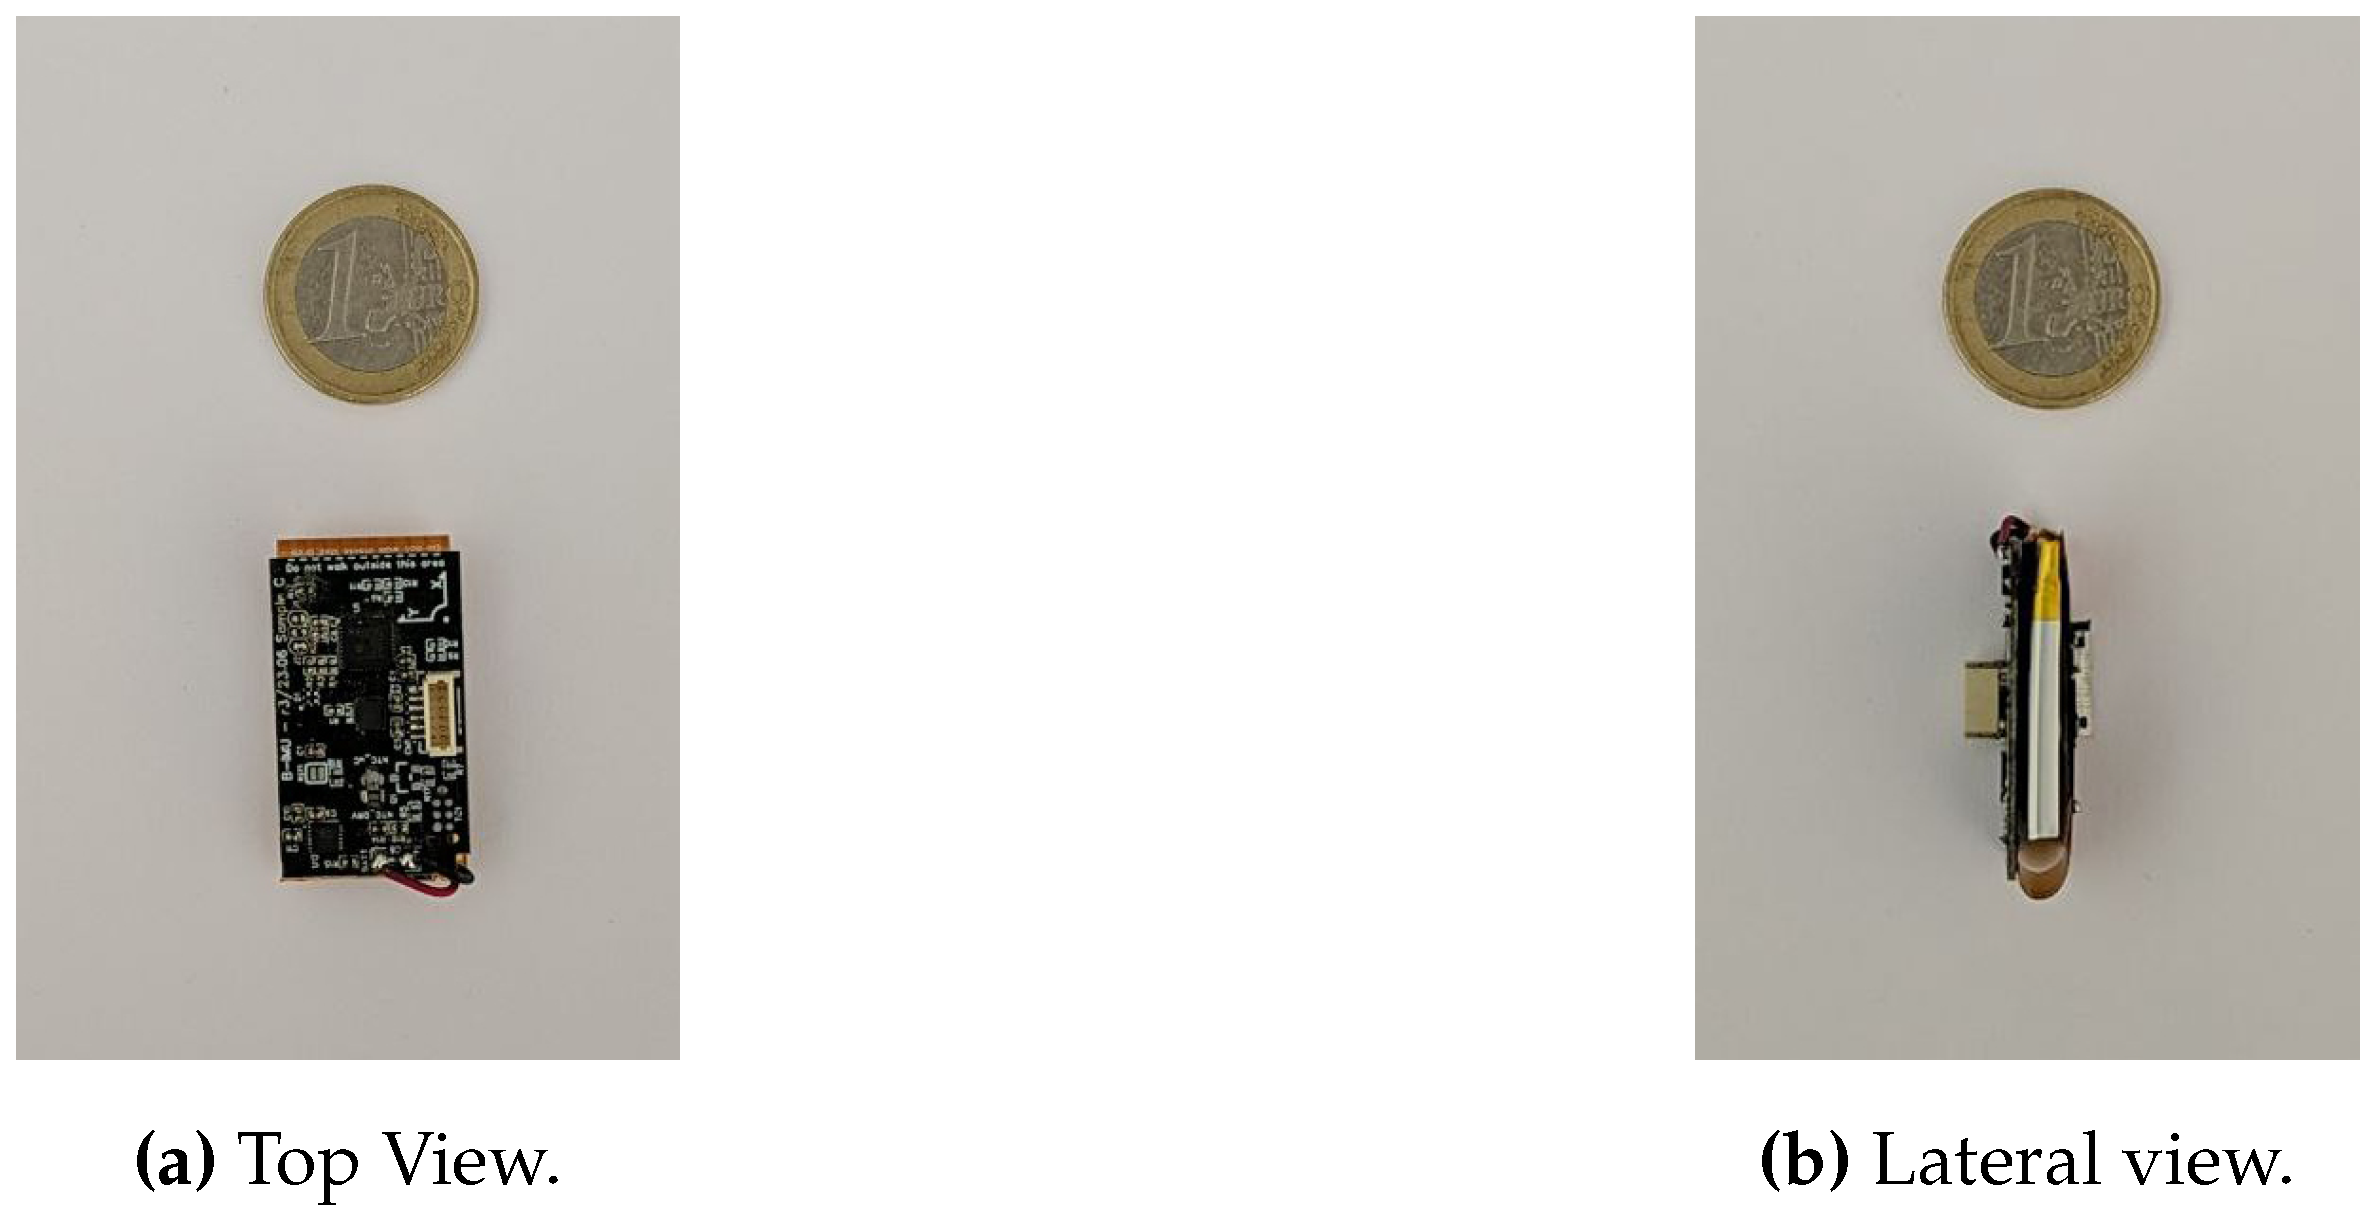
The device design consists of two PCBs placed on both sides of the battery and connected by a flex cable as can be seen in
Figure 1. On the main side most of the system components are located on the other side only the SD card socket and the contacts for the socket. This saves space and miniaturizes the entire assembly.
For battery management, the circuit utilizes the STNS01PUR integrated chip, which combines a battery management system (BMS) for safe charging with a 3.1V LDO voltage regulator. This chip provides overcharge, over-discharge, and overcurrent protection to prevent the battery from being damaged under fault conditions. Additionally, it features a charger enable input to stop the charging process when battery overtemperature is detected by external circuitry.
When shutdown mode is activated, the battery power consumption is minimized to less than 500 nA, maximizing battery life during shelf time or shipping. The battery used is a 220mAh 402030 LiPo with an integrated NTC thermistor.
To simplify the device’s operation and eliminate the need for push buttons, we have opted to utilize the tilt function of the IMU accelerometer. The test parking functionality (sync SD) is activated by shaking the sensor when it is tilted beyond a specific threshold of 4g. This feature is employed to enhance the device’s functionality. Additionally, a low-power RGB LED is used to indicate different modes and sensor states. It achieves this through a combination of its three colors, and patterns of continuous or intermittent flashing, as well as fading in and out.
2.4. Test Procedures
This section details the test procedures used to validate and assess the proposed system’s performance. We systematically evaluate the solution’s accuracy, reliability, and efficiency, highlighting its potential in high data capture rate scenarios.
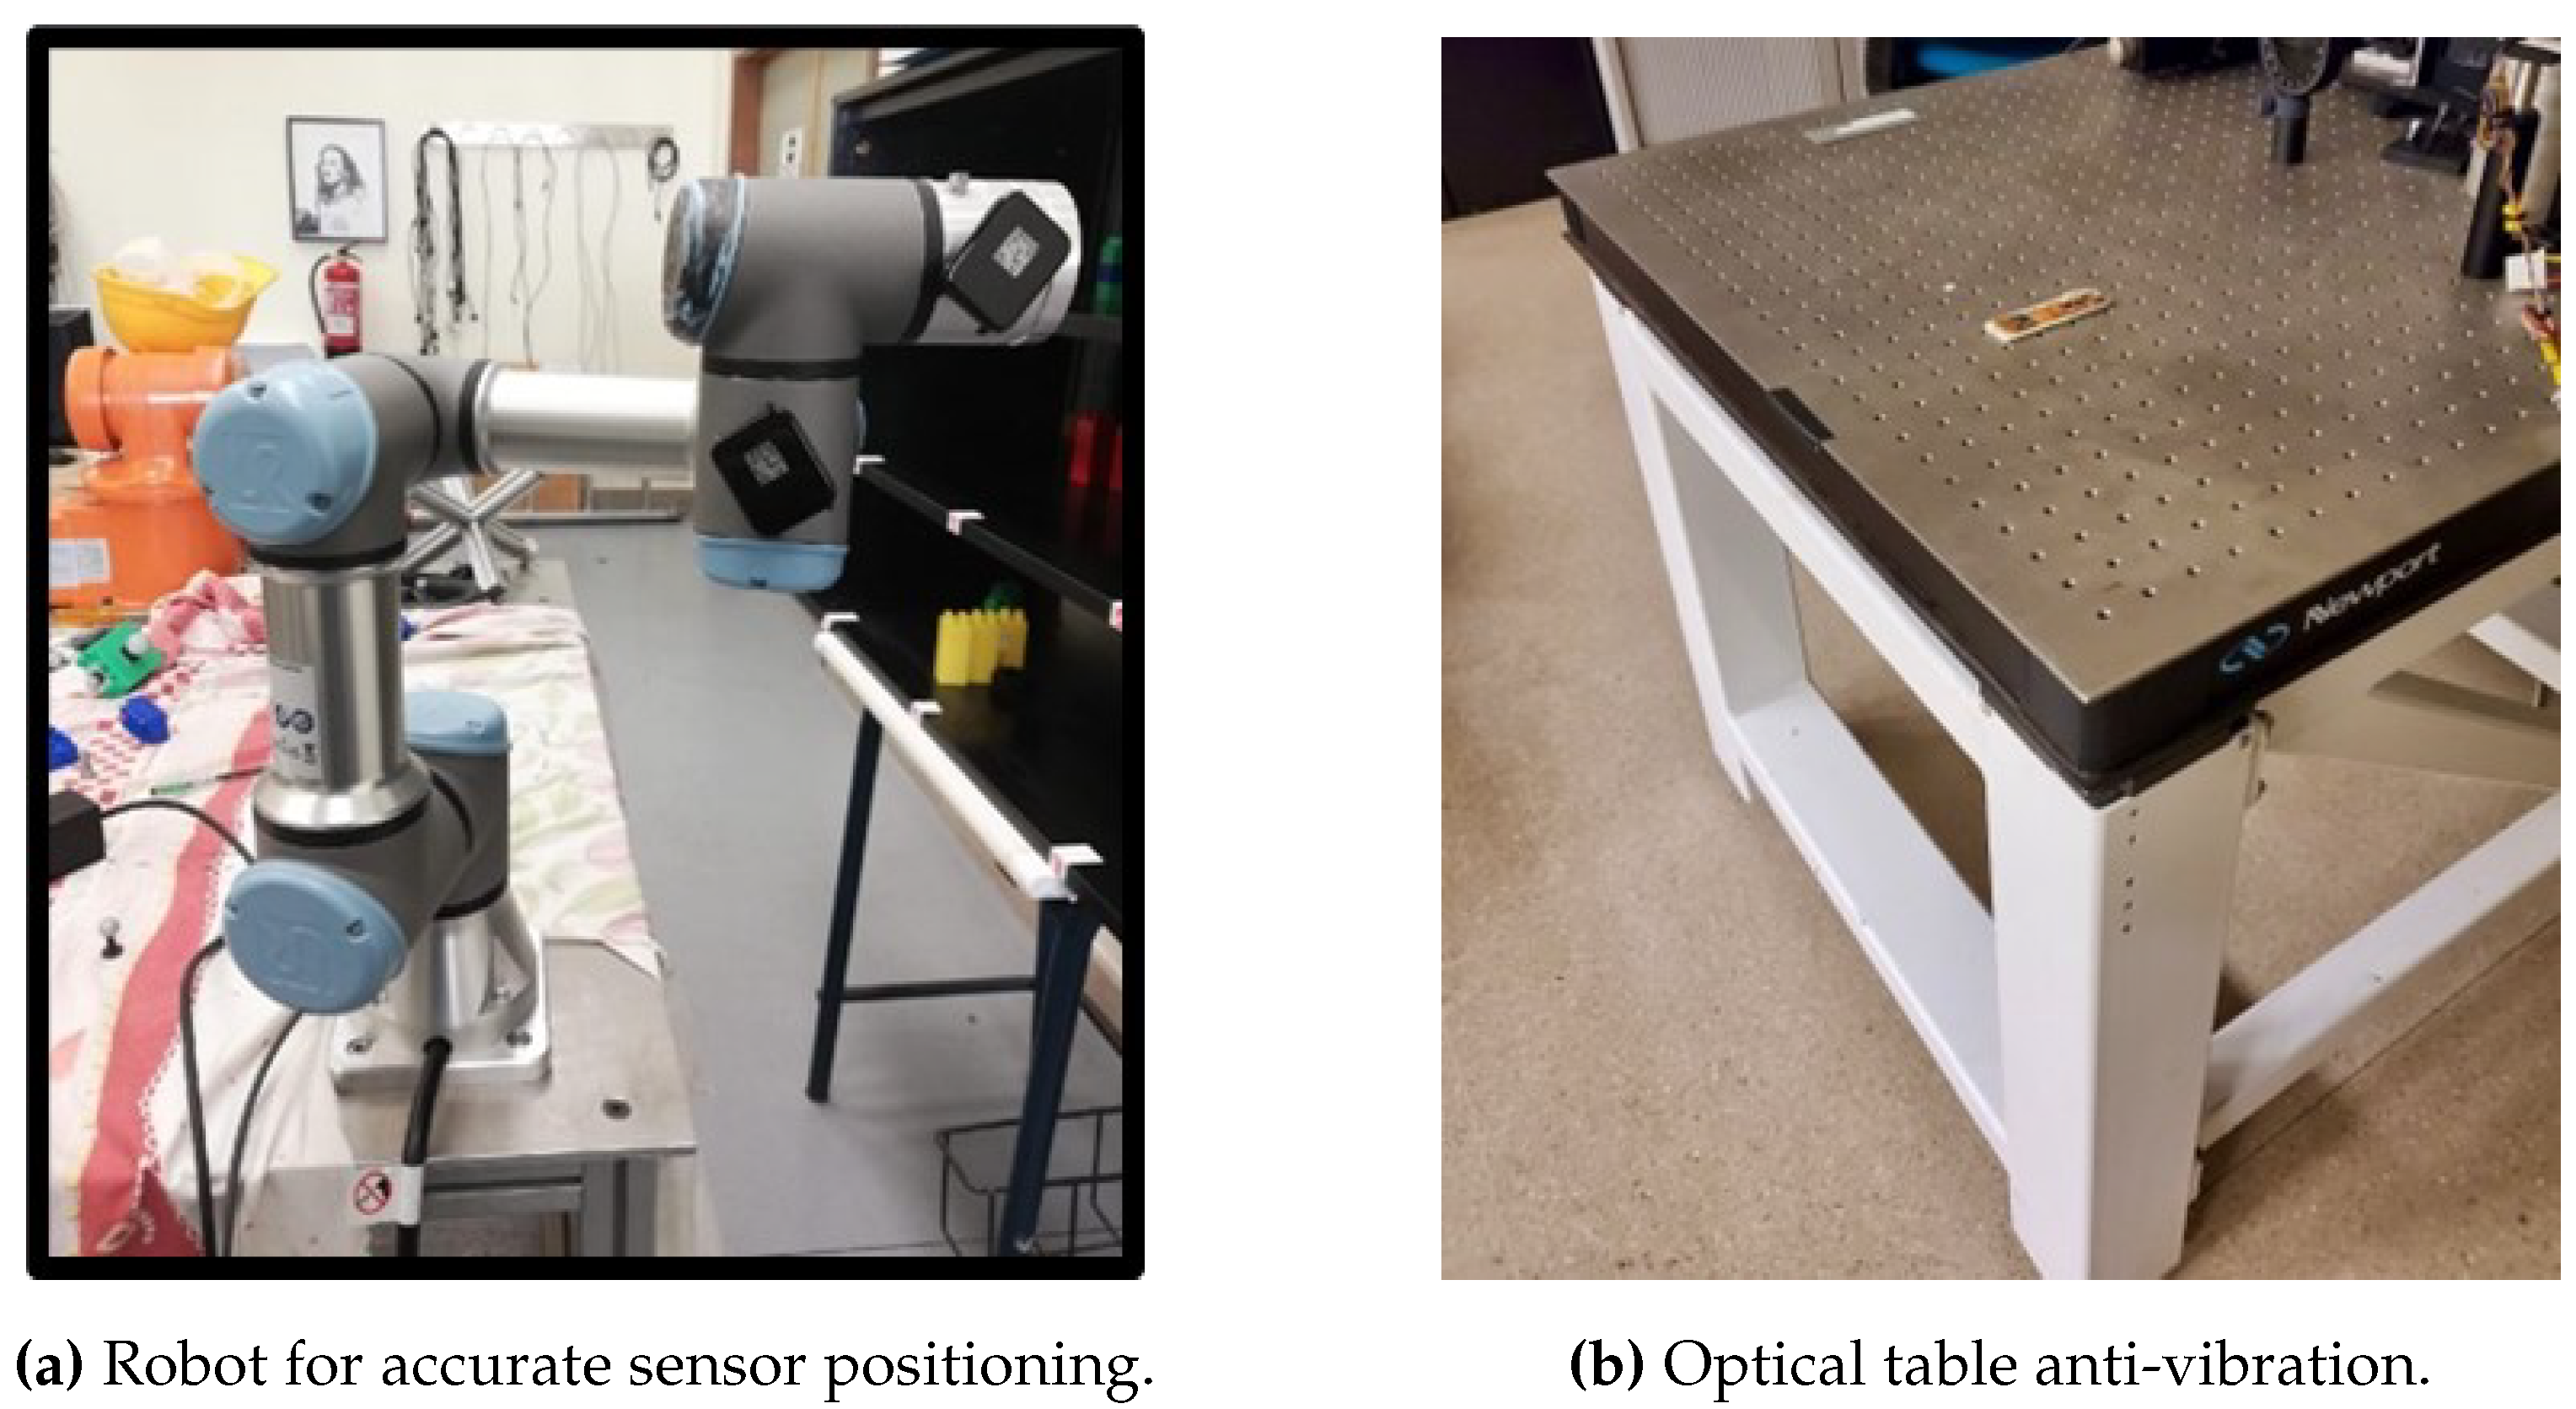
Before obtaining any result, the IMU box alignment matrix is calculated to ensure accurate orientation of the device axes relative to the box axes within the device. The experiment begins by aligning each box axis with gravity as a consistent reference. This alignment is done by placing the device in the end effector of a UR3 robot (
Figure 2. The theoretical acceleration matrix A represents ideal outputs under perfect alignment, while the measured matrix B records actual outputs given the current device orientation. The alignment matrix R is derived as
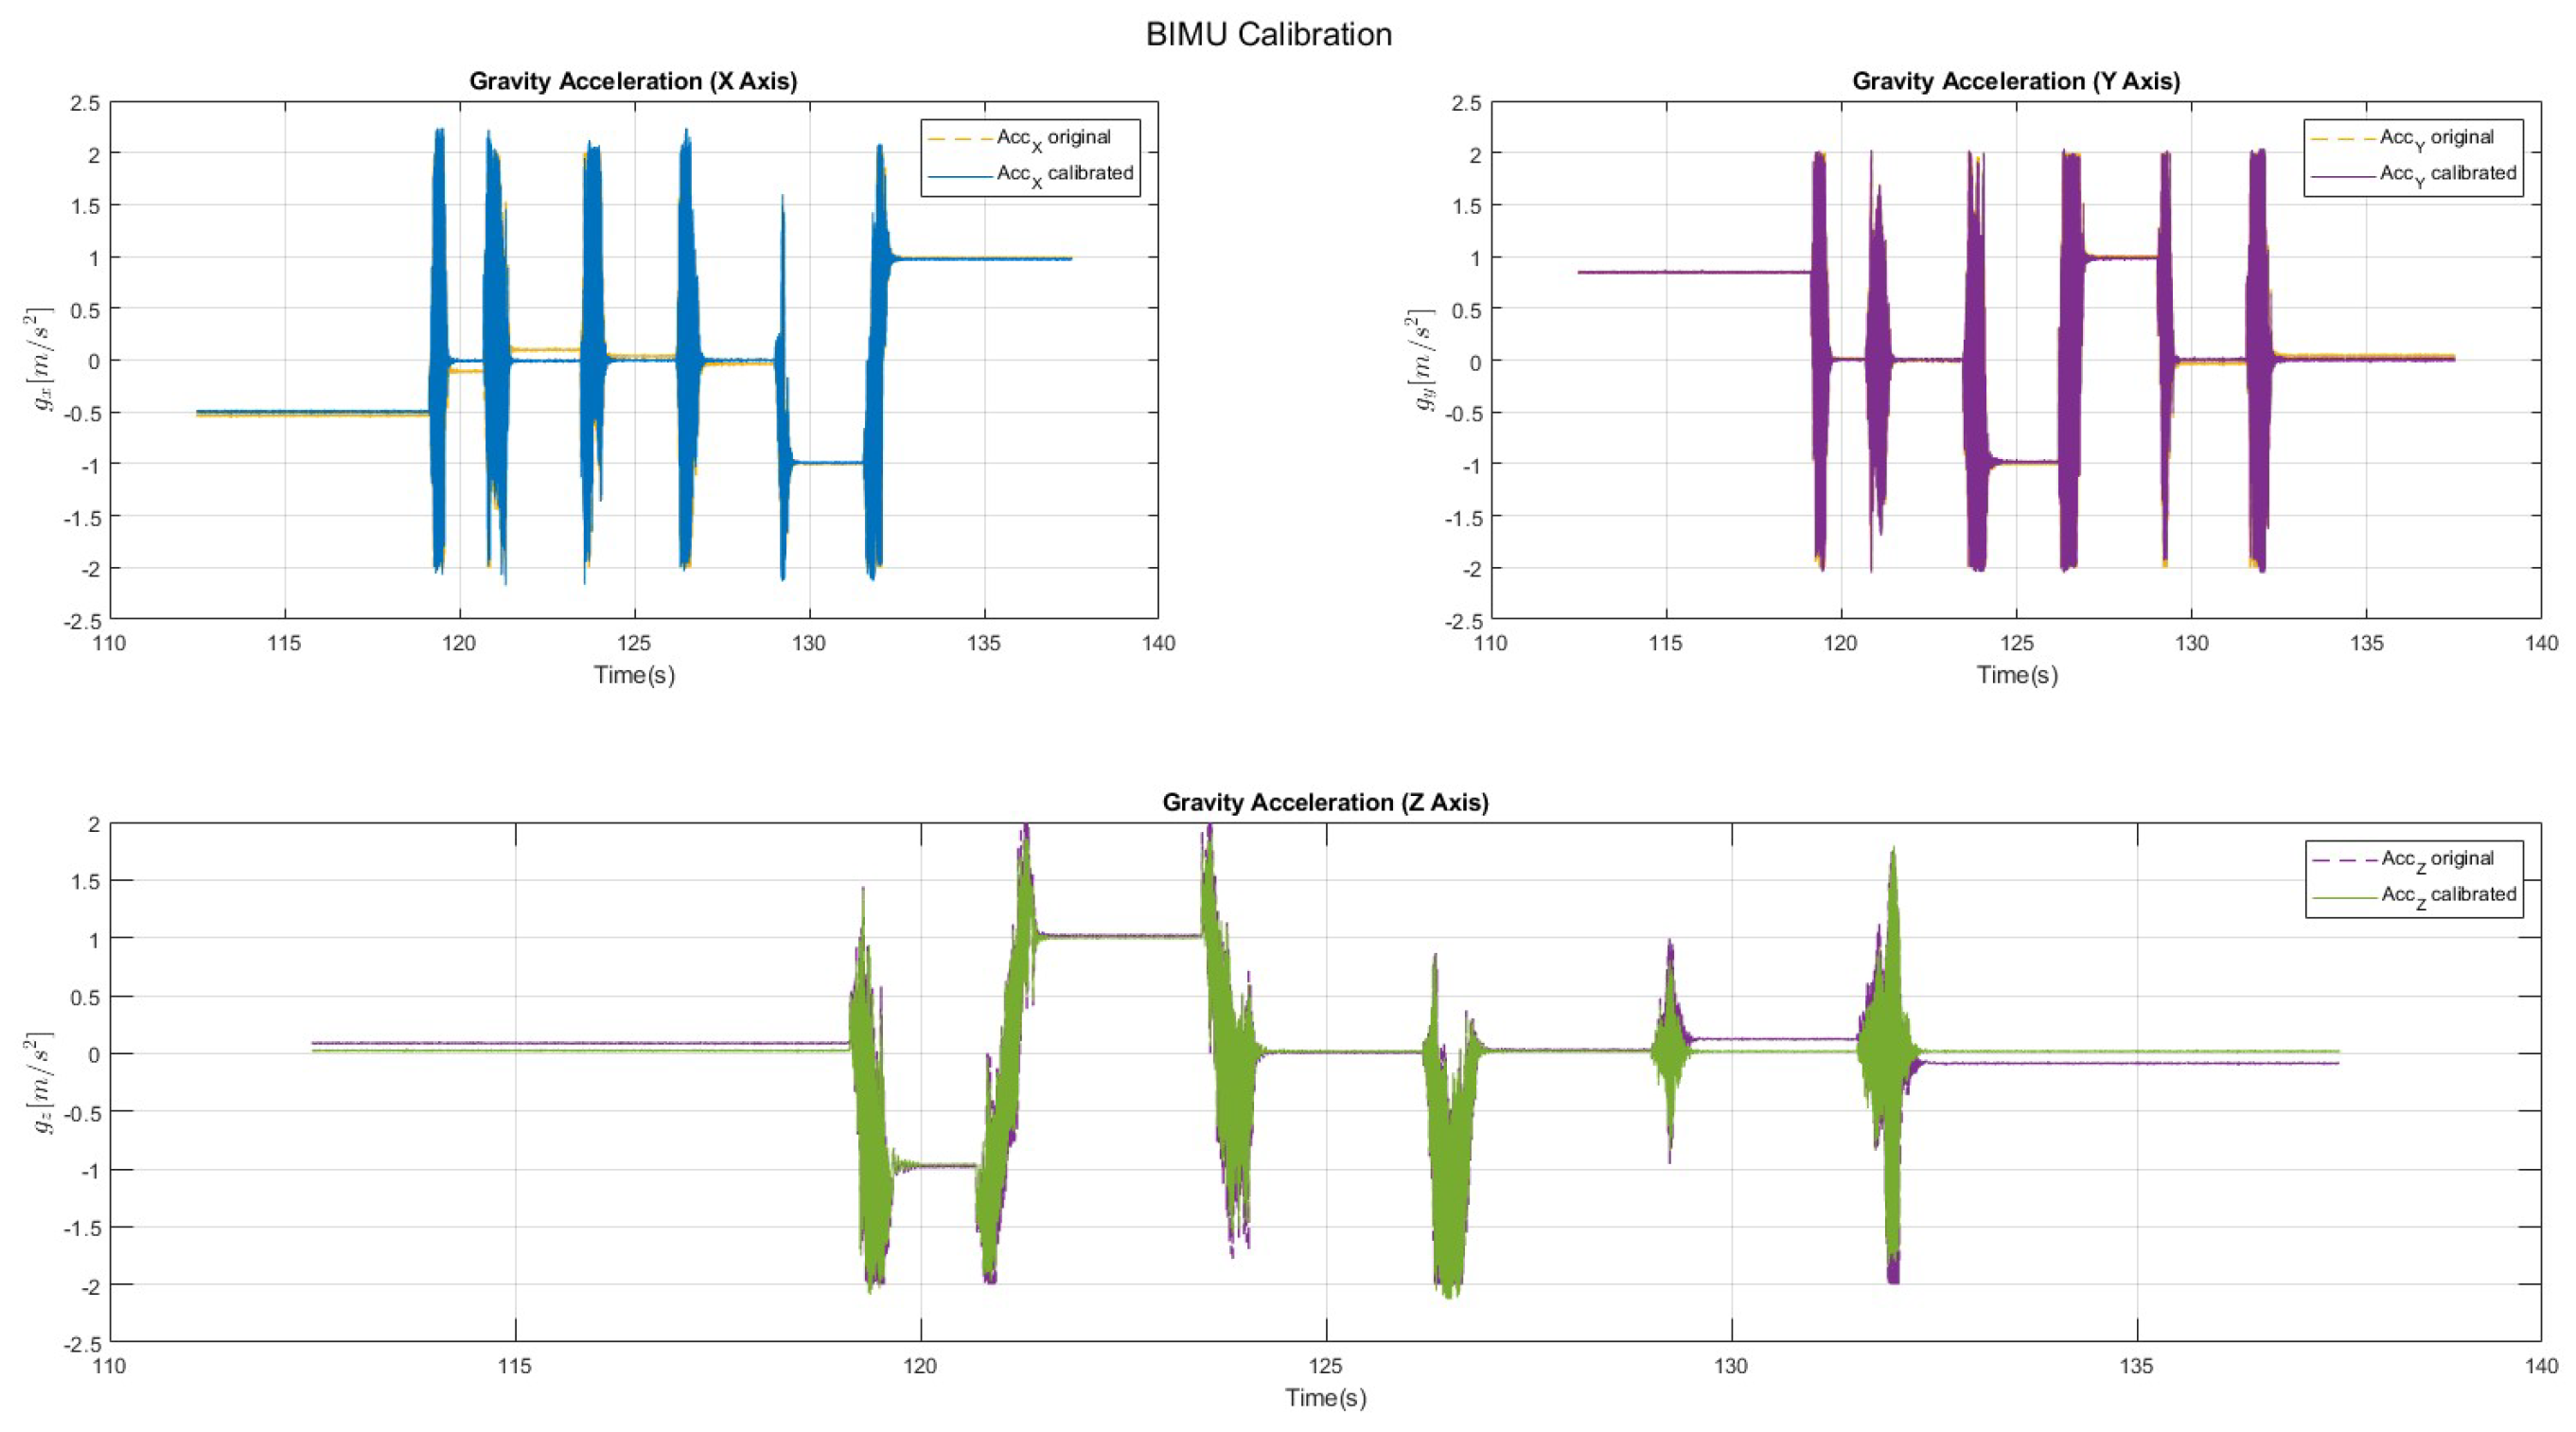
This misalignment was quantitatively assessed and corrected using an alignment matrix. As depicted in
Figure 3, the original signal exhibited noticeable discrepancies when compared to the corrected signal. After applying the calibration matrix, the corrected signal demonstrates a significant improvement, closely matching the intended orientation and minimizing the observed deviations.
2.4.1. Sampling Frequency
In evaluating the LSM6DSL and STM32L051K8 system, we focused on the constraints of the SPI communication protocol. Using a digital analyzer, we scrutinized the SPI signals between the sensor, microcontroller, and SD card memory. We specifically adjusted the sensor’s sampling frequency at various rates to identify the point at which the SPI buffer becomes saturated.
The sensor has been precisely configured to operate within a measurement range of ±4g for acceleration and 250 degrees per second (dps) for angular velocity.
2.4.2. Power Analysis
A systematic approach was employed by integrating a 0.1 shunt resistor for precise current measurement. Additionally, a FLIR E60 camera was utilized to analyze temperature variations, enhancing the assessment of thermal dynamics within the system. This setup allowed for the monitoring of charging efficiency and thermal performance under various operational conditions and modes. The documentation and analysis of energy consumption across different states provide a comprehensive understanding of the system’s energy dynamics, facilitating phase optimization.
2.4.3. Standard Deviation
The standard deviation (
2) is a statistical measure that quantifies data dispersion and, within the scope of this study, enables the evaluation of consistency and precision of measurements along each axis. The method employed to calculate this parameter involved the sensor collecting data over a 10-minute duration. The sensor was situated on a stable, vibration-isolated table,
Figure 2.
2.4.4. Drift
Drift refers to any systematic change or undesired variation in sensor measurements over time, occurring independently of external changes in operating conditions. To characterize drift, the sensor was placed in a stable, anti-vibration table for 24 hours. Subsequently, a linear regression analysis was applied to estimate the drift along each axis (x, y, and z).
2.4.5. Fixed Bias
The fixed bias represents a consistent error in sensor measurements that is inherent due to its systematic nature. To neutralize this error, measurements from opposite directions are summed, which effectively doubles the fixed bias for each sensor type (
3). Samples were collected over 150 seconds by positioning the device at opposite angles for accelerometer readings along each axis, and by applying reverse angular velocities for each axis during the gyroscope evaluation using a robot arm, as illustrated in
Figure 2.
2.4.6. Scale Factor
The scale factor measures how the sensor responds to specific measurements within its range. It is calculated by subtracting the averages of two measurements to eliminate fixed bias effects and then doubling the sensor output (
4). For accelerometers, the specific reference measurement is local gravity, and for gyroscopes, it is the rotational speed of the device.
2.4.7. Power Spectral Density
Following [
10], noise characteristics were analyzed using power spectral density. In this analysis, the sensor was kept at rest for ninety minutes during two separate tests. Power spectral density (PSD) quantifies the intensity of unwanted signals across different frequencies, providing insights into the sensor’s response to environmental variations and electronic interferences. This comprehensive analysis is crucial for understanding the sensor’s operational fidelity under real-world conditions.
2.4.8. Allan Deviation
The Allan deviation test was also conducted as described in [
10]. The sensor was kept at rest for ninety minutes during two separate tests. The Allan deviation assesses the stability of the sensor’s measurements over time, identifying the types of noise that affect the sensor. This detailed examination is essential for determining the long-term reliability and accuracy of the sensor in various operational scenarios.
3. Results
3.1. Sampling Frecuency
The device been designed to operate at a maximum frequency of 4000 Hz, which establishes its upper limit for data acquisition speed. Each sensor access requires a reading time of approximately 112 microseconds. This reading duration encompasses the time needed for the sensor to capture the data and make it available for processing.
In addition to the sensor reading time, the microcontroller requires an additional 108 microseconds to process the data read from the sensors. During this time, the microcontroller performs necessary computations and transmits the processed data to the memory for storage. The combined cycle of reading and processing thus totals a medium of 220 microseconds for each operation.
3.2. Power Analysis
The power consumption analysis, delineates distinctive patterns across four key phases of device operation, each represented by a specific colour code.
During the idle phase (blue), the device consumes 5.9mA, which is the minimum current required to maintain standby functionalities. The file-opening phase (purple) results in a significant consumption spike, peaking at 44mA, due to the energy demand associated with data manipulation. In the capture phase (green), the device consumes 8.5mA, reflecting additional power requirements for data acquisition. The saving phase (orange) shows consumption spikes up to 53mA, indicating the energy intensity needed for write operations to the SD card. All these values are detailed in Table 2.
The average consumption for a 32MHz microcontroller clock frequency and sampling at 4000Hz is 18 mA, providing an estimated sensor autonomy of 12.2 hours.
The STNS01 battery charger is designed for single-cell battery, using a CC-CV (Constant Current - Constant Voltage) algorithm for batteries up to 4.2V. Charging starts in constant current mode, adjustable up to 0.2mA. Upon reaching the float voltage of 4.2V, the charger shifts to constant voltage mode, maintaining the voltage and gradually reducing the charging current. The process ends when the current drops below 10% of IFAST, signaling the completion of the charge cycle.
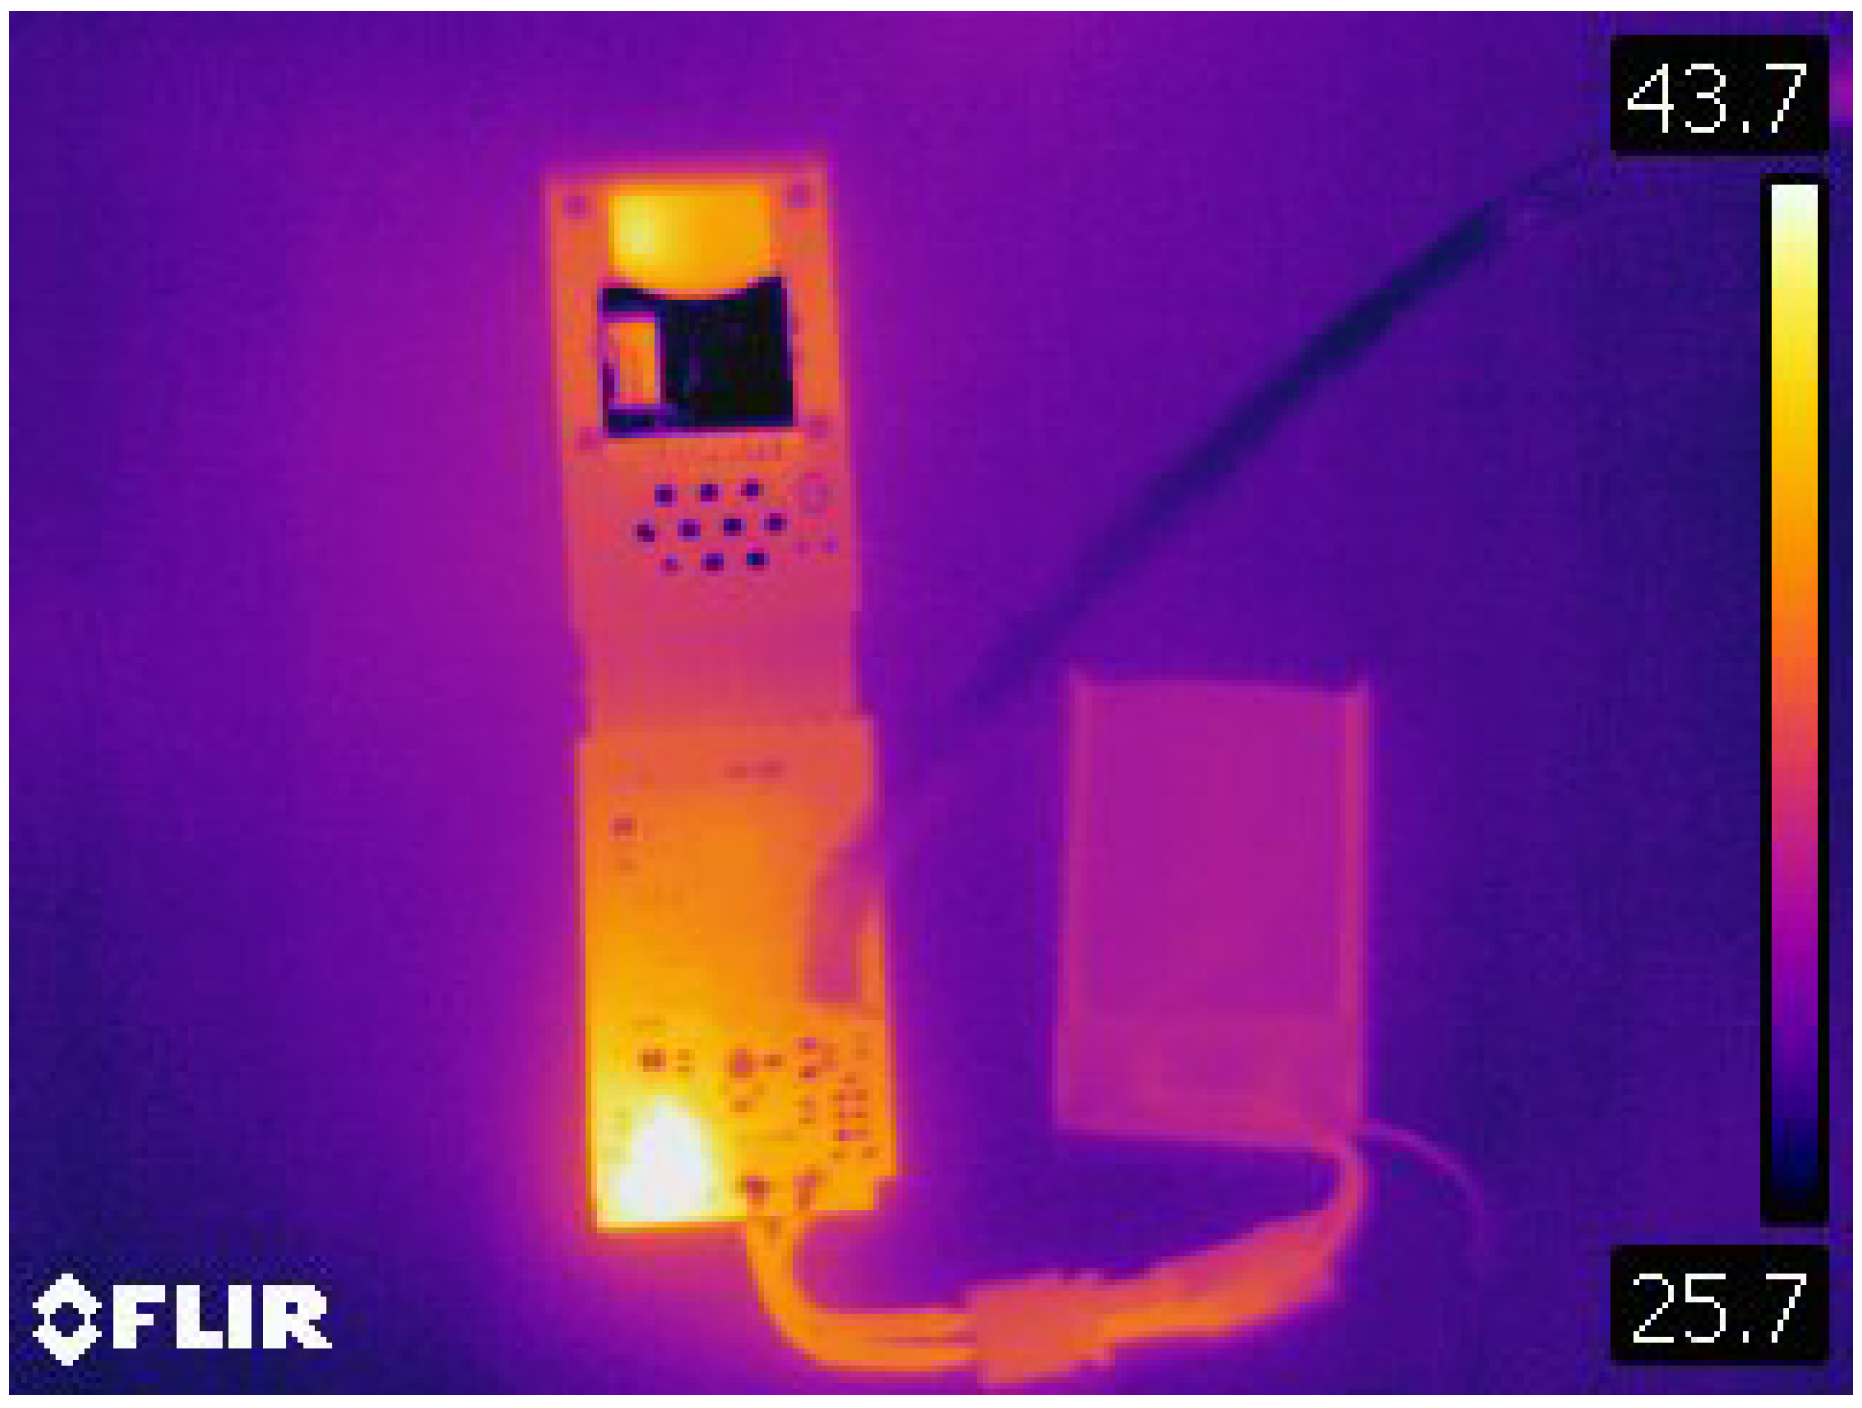
In the thermal image presented (
Figure 5), the charging process of a sensor is observed, wherein the STNS01 chip functions as a Battery Management System (BMS). The thermographic profile clearly shows the STNS01 as the predominant heat source, achieving a maximum temperature of 43.7°C. This temperature is within the expected and safe operational limits for the circuit.
3.3. Standard Deviation
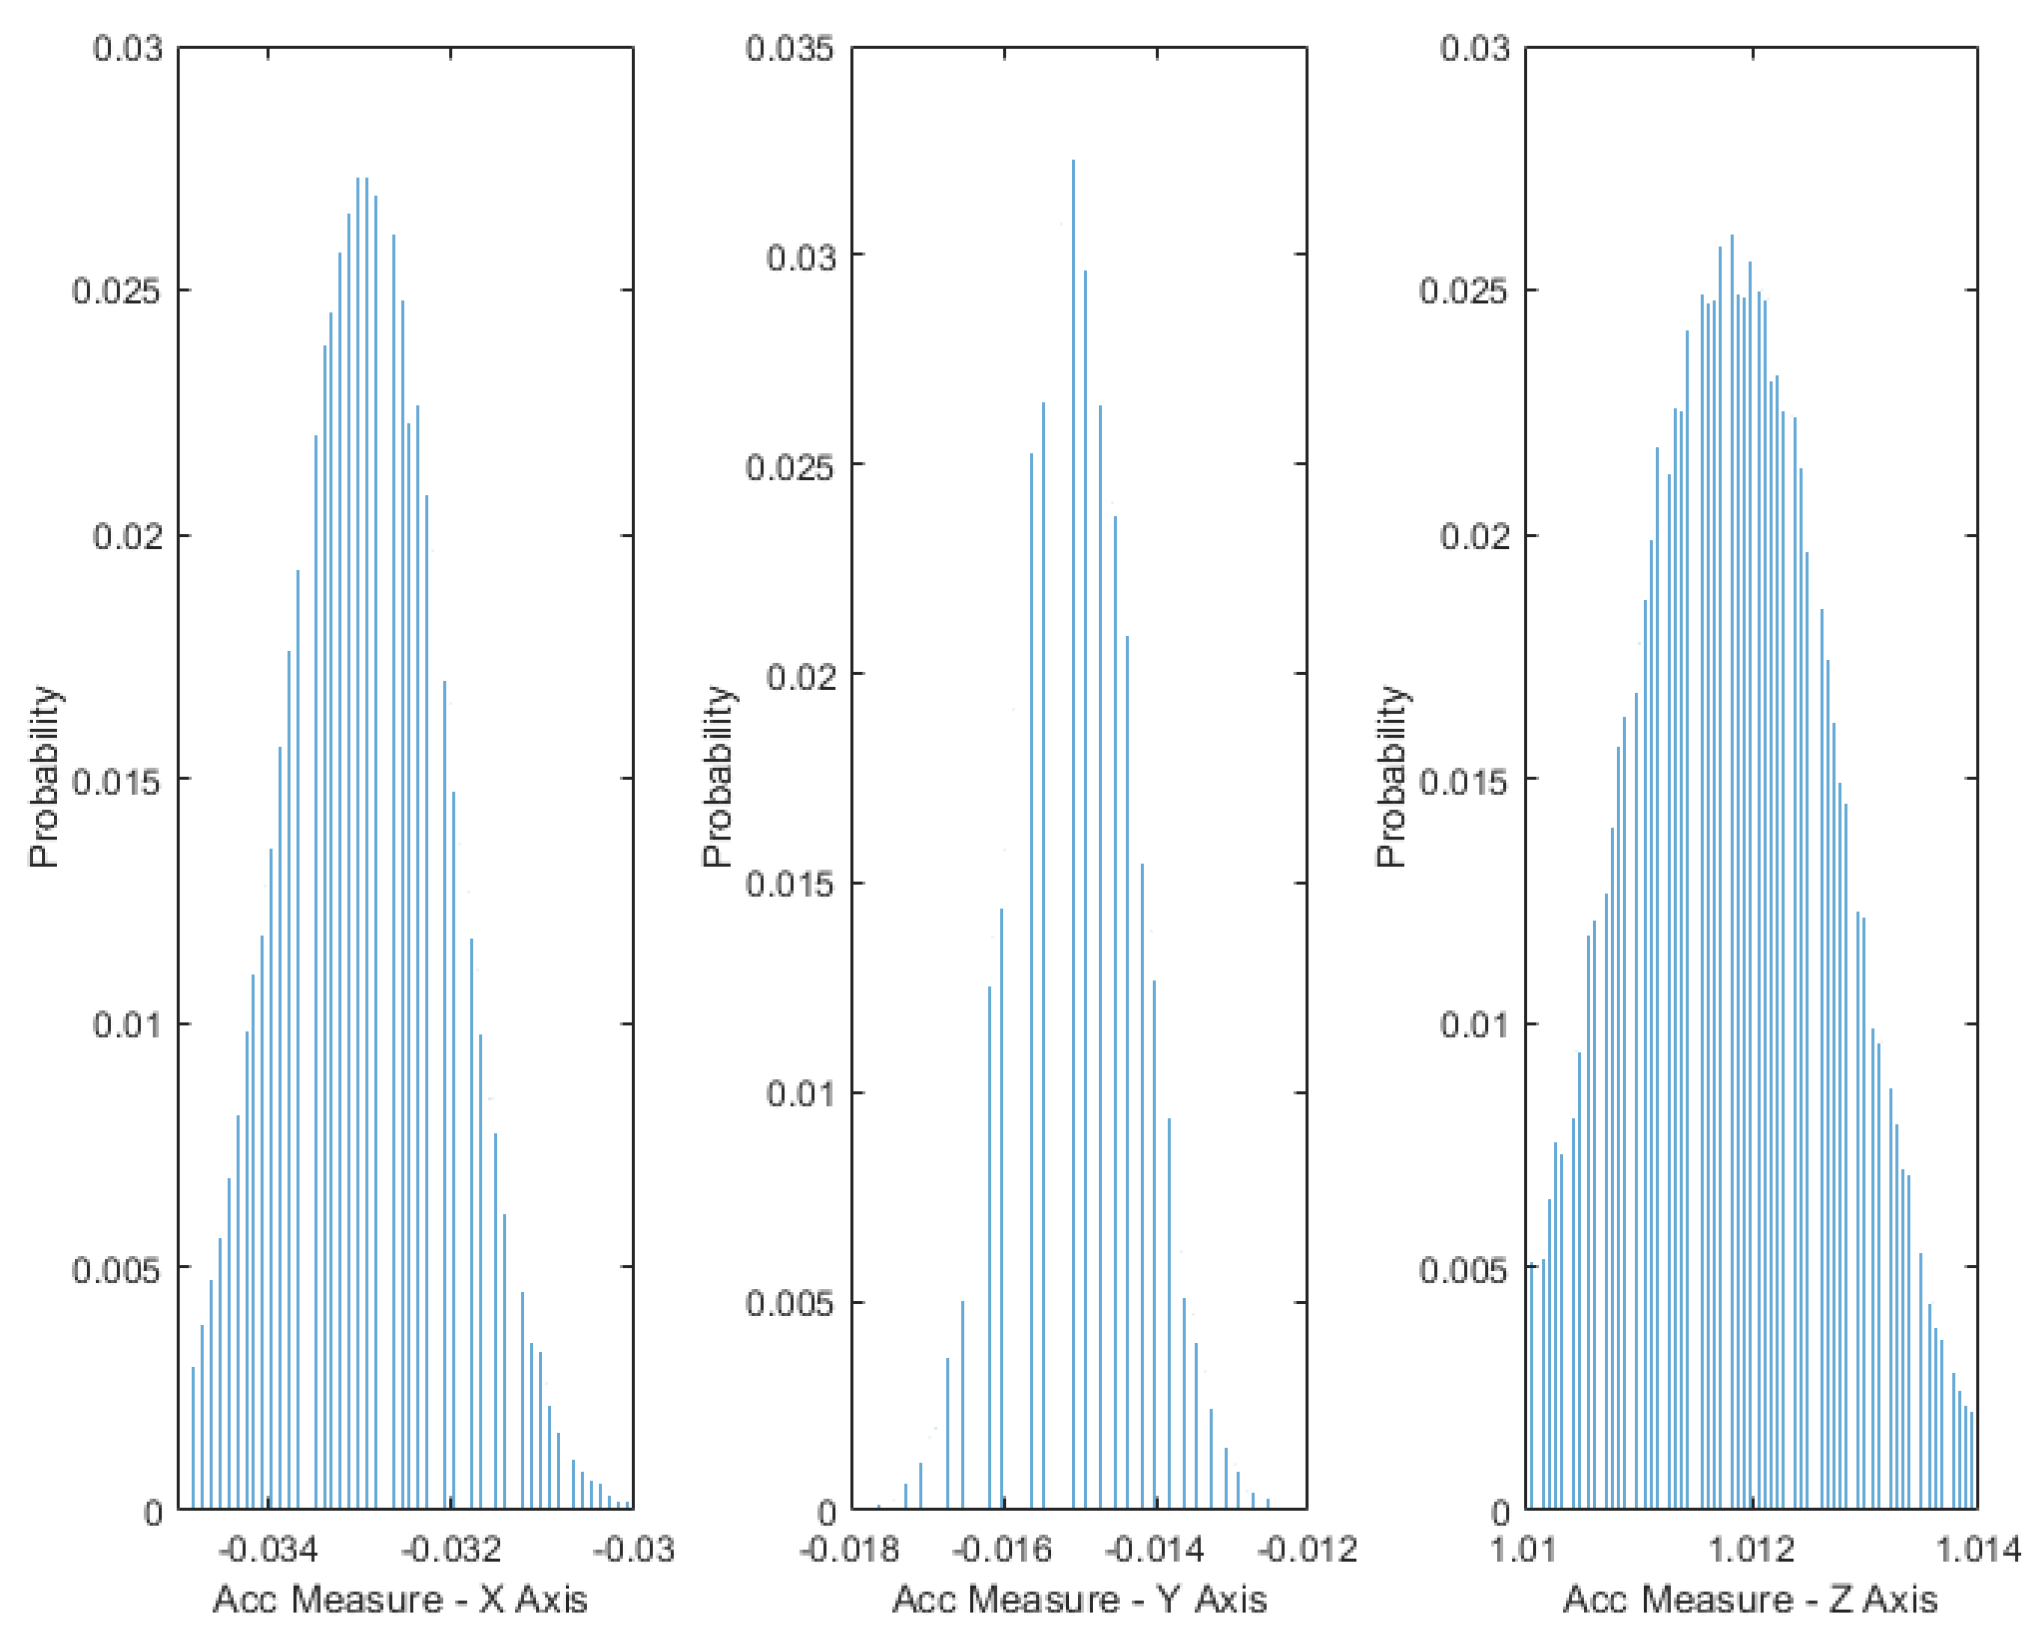
The obtained results reveal the standard deviations of the accelerometer in the X, Y, and Z axes (
Figure 6), providing a quantitative measure of the noise level present in the measurements. The standard deviation in the X-axis is 0.912 mg, in the Y-axis is 0.812 mg, and in the Z-axis is 0.956 mg. It is noteworthy that, despite the presence of noise, the results exhibit relatively low standard deviations.
Additionally, gyroscope data also indicate low variability in the measurements. The standard deviations in the X, Y, and Z axes of the gyroscope are 0.09310 dps, 0.41426 dps, and 0.26584 dps, respectively. This consistency in the gyroscope results complements the overall quality of the measurements.
3.4. Drift
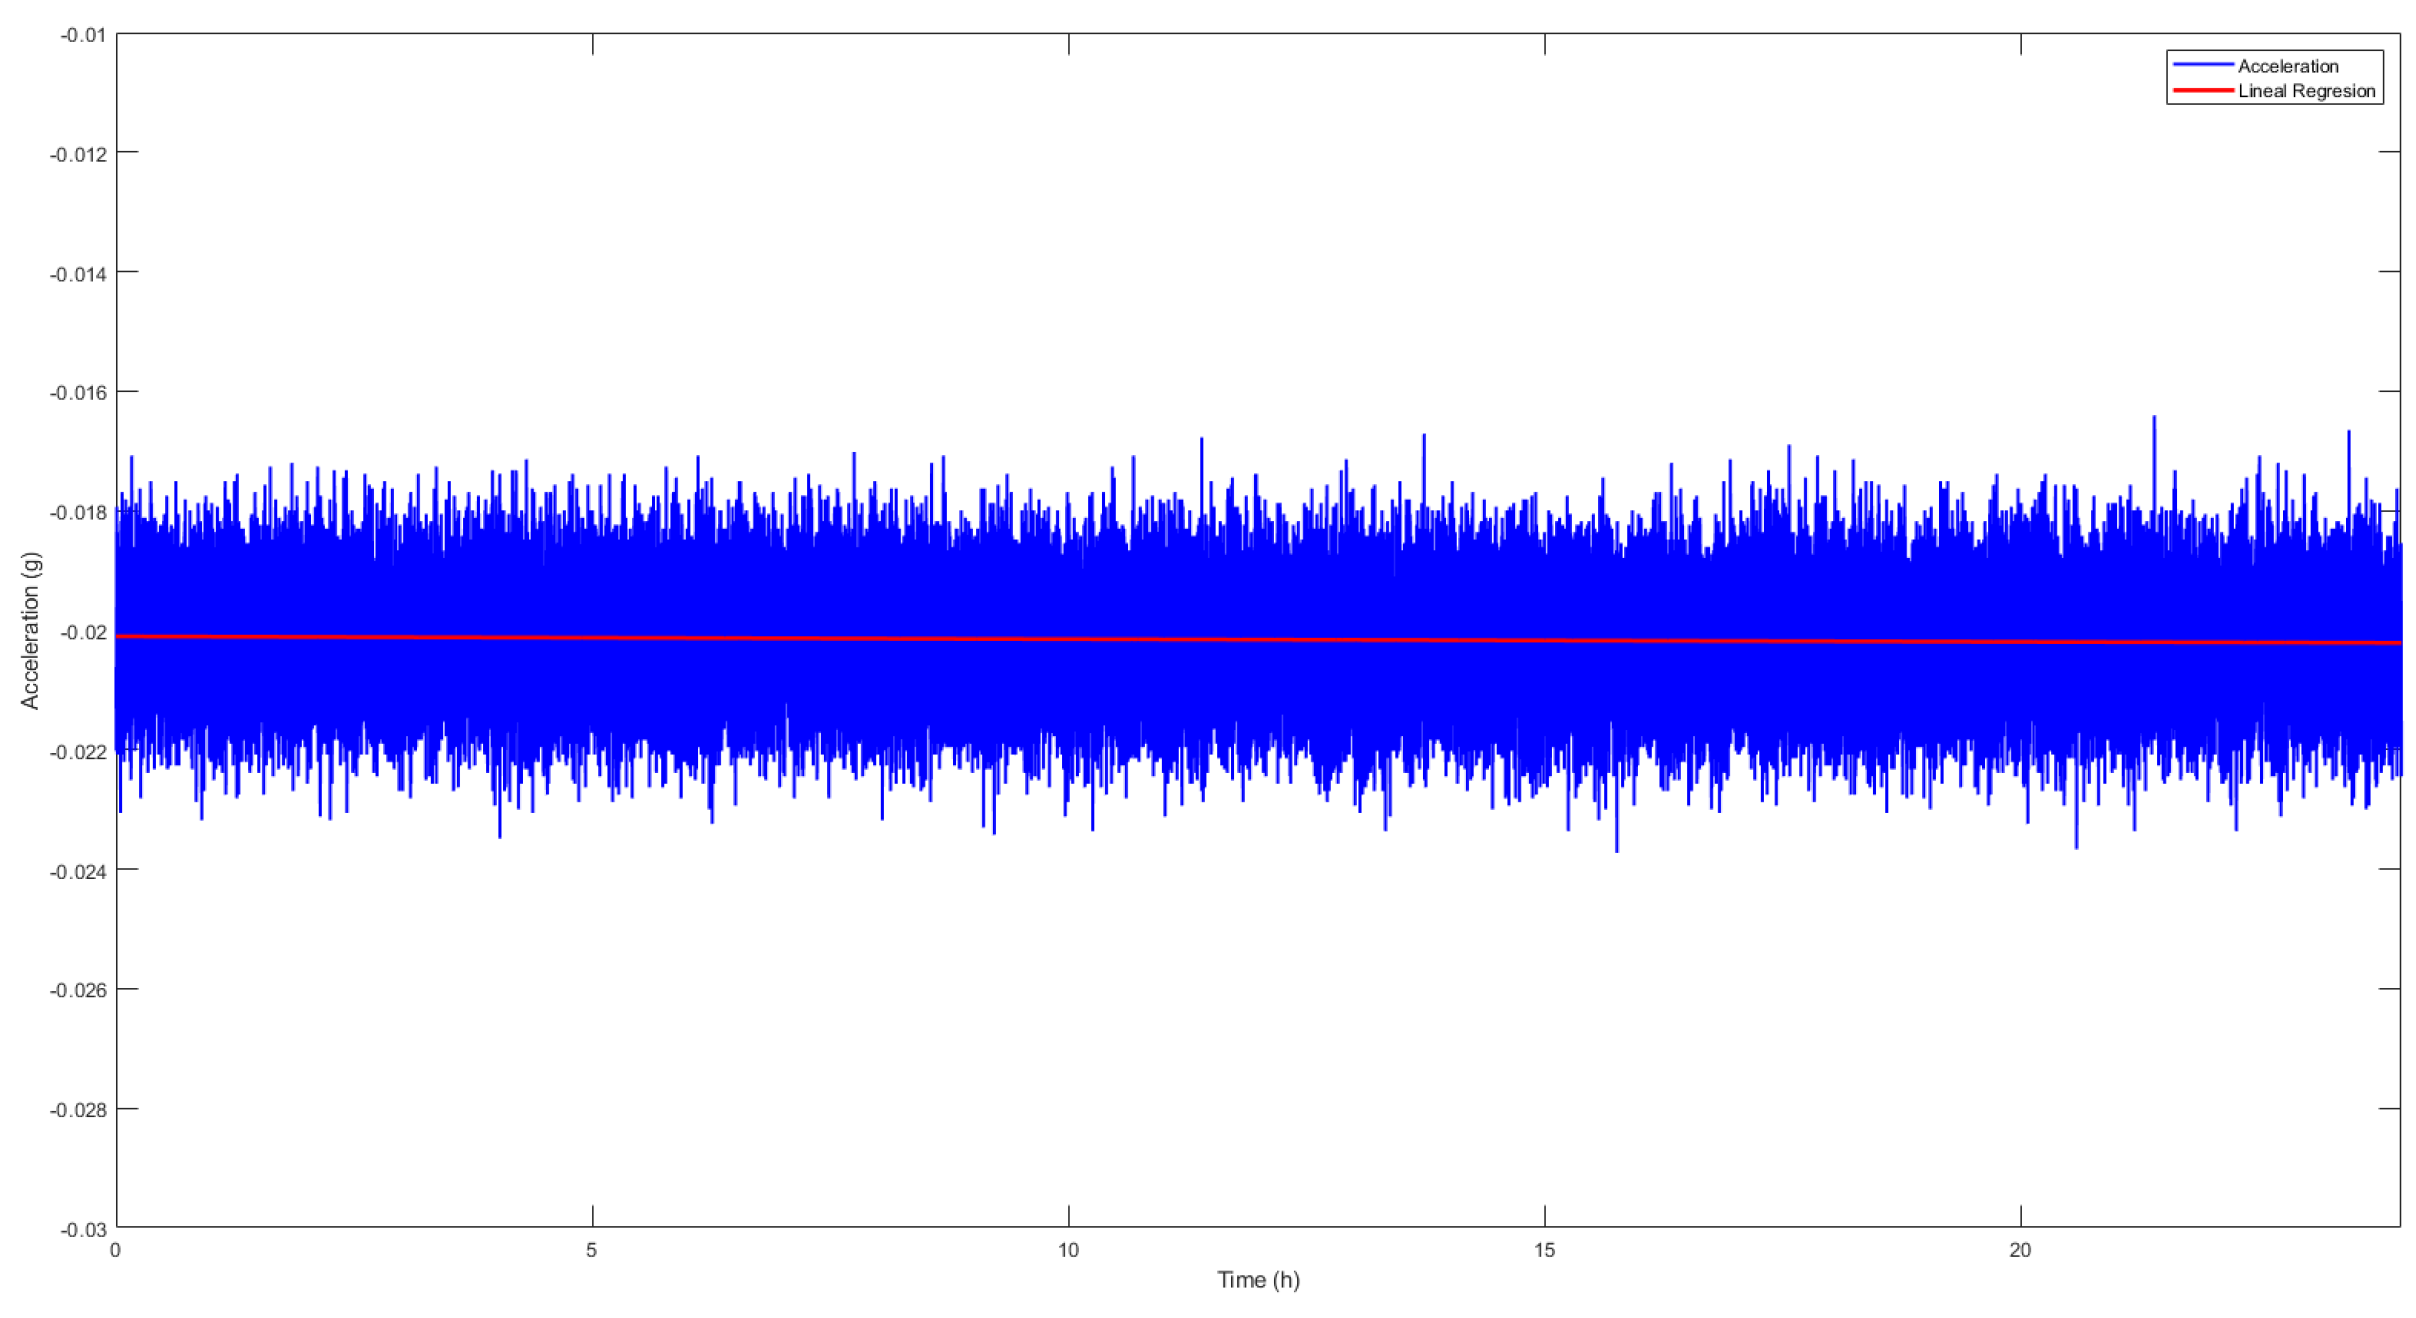
Following a continuous 24-hour data collection period, te calculated drift values for the x (
Figure 7), y, and z axes were -0.4523e-06 g, 2.7690e-06 g, and 0.2511e-06 g for the accelerometer, respectively. In the case of the gyroscope the drfit is 4.4976e-05 dps for X axis, -4.5143e-05 dps for Y axis, and 2.1891e-05 dps for Z axis. These values are significantly lower than the sensitivity threshold and thus, they can be considered negligible.
3.5. Fixed Bias
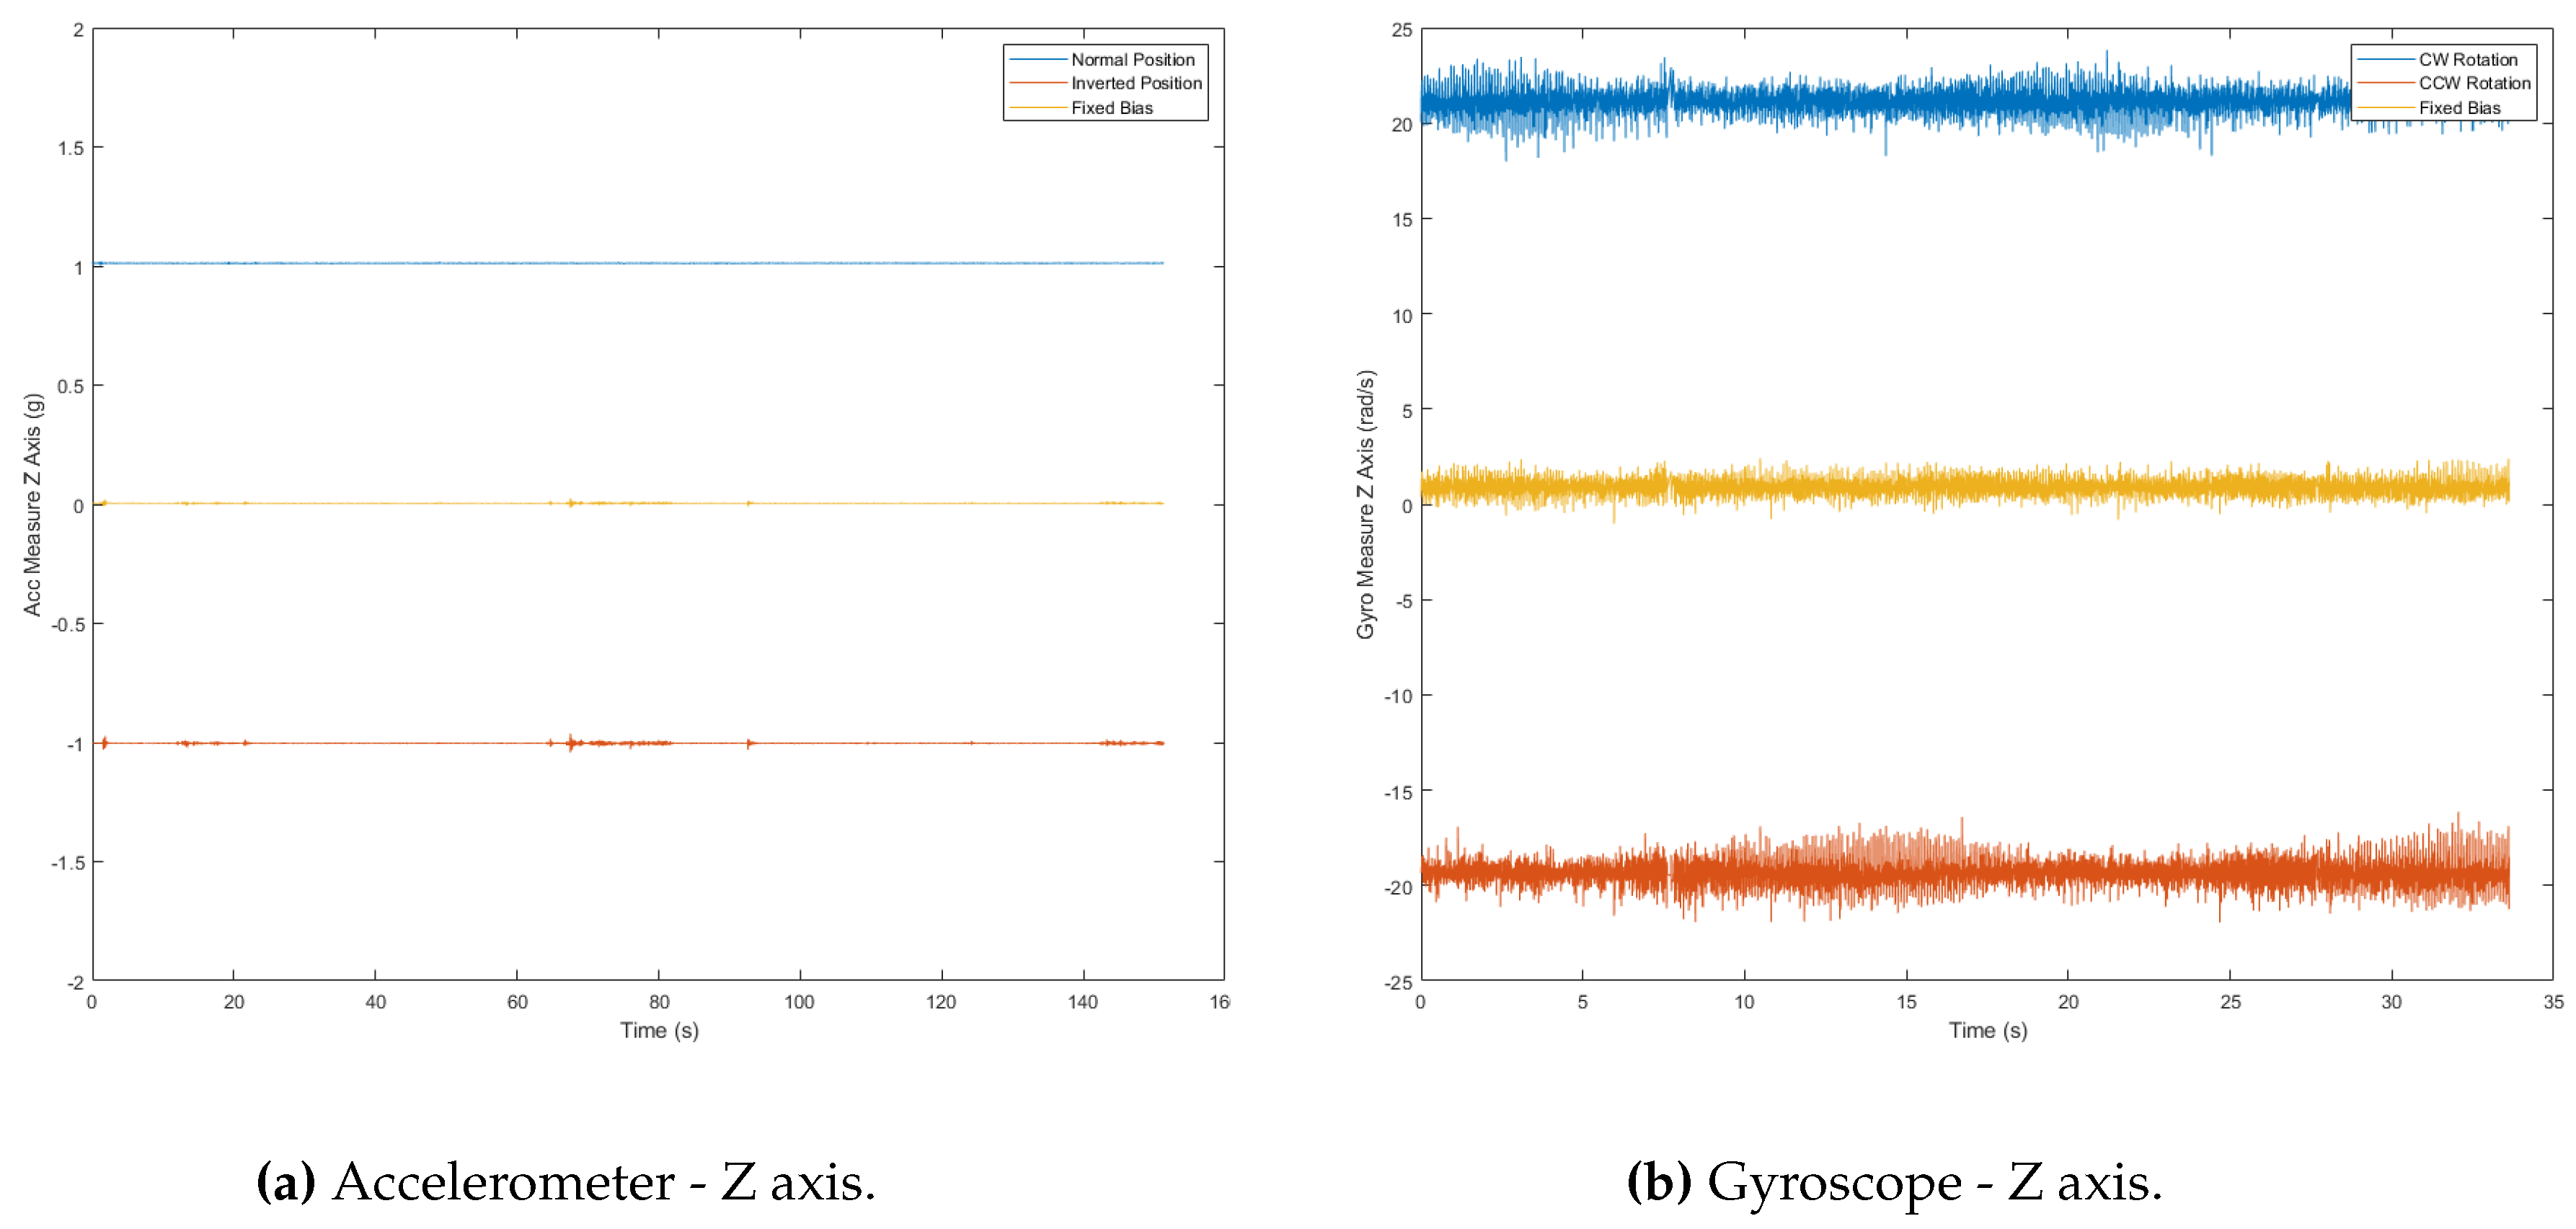
The fixed bias values for the accelerometer (
Figure 8) are notably close to zero, minimizing systematic errors. The mean fixed bias for the x-axis is 4.33mg, for the y-axis is -8.52mg, and for the z-axis is 3.07mg. These results suggest minimal systematic offset along each axis.
Conversely, the gyroscope’s fixed bias results (
Figure 8) deviate further from the ideal zero values. The mean fixed bias along the x-axis is 0.90840 dps, along the y-axis is -1.69095 dps, and along the z-axis is 0.02031 dps. These deviations may stem from manufacturing tolerances, sensor imperfections, or environmental conditions, introducing systematic errors in measurements and impacting the gyroscope’s accuracy.
3.6. Scale Factor
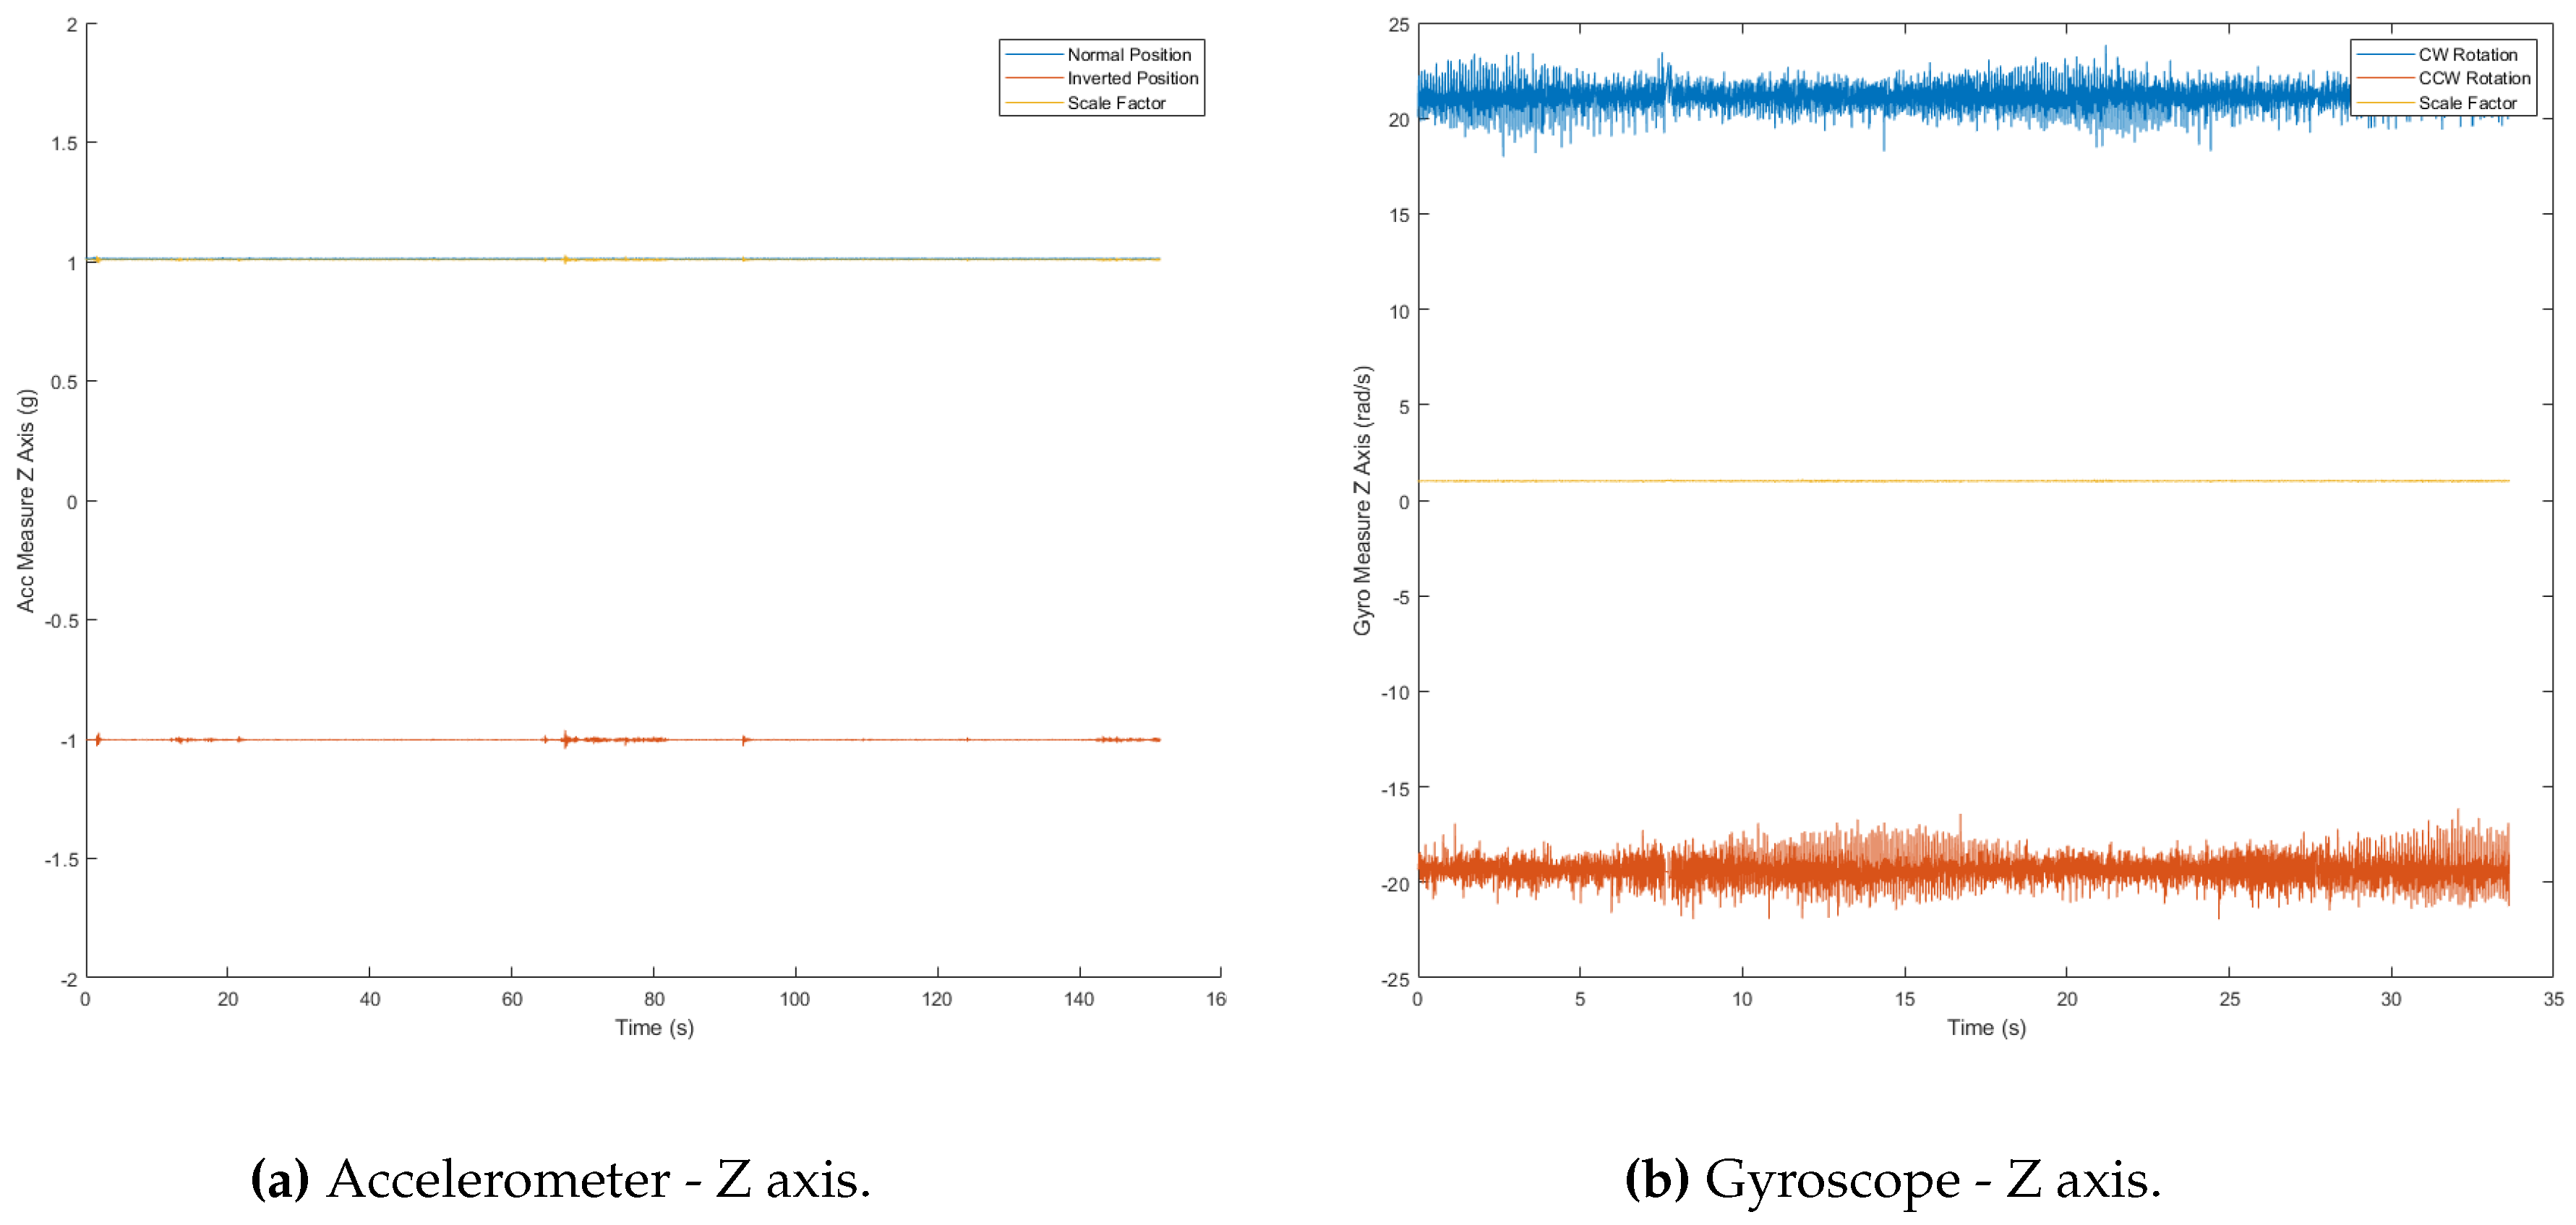
The obtained scale factor results for both the accelerometer and gyroscope demonstrate exceptional performance and consistency. The accelerometer exhibits mean scale factors close to the ideal value of 1: along the x-axis is 1.00744, along the y-axis is 0.99888, and along the z-axis is 1.00100 (
Figure 9 ) Similarly, the gyroscope’s mean scale factors, though slightly deviating from 1, indicate remarkable consistency. Along the x-axis, the scale factor is 1.01115, along the y-axis is 0.99969, and along the z-axis is 0.99201.
3.7. Power Spectral Density.
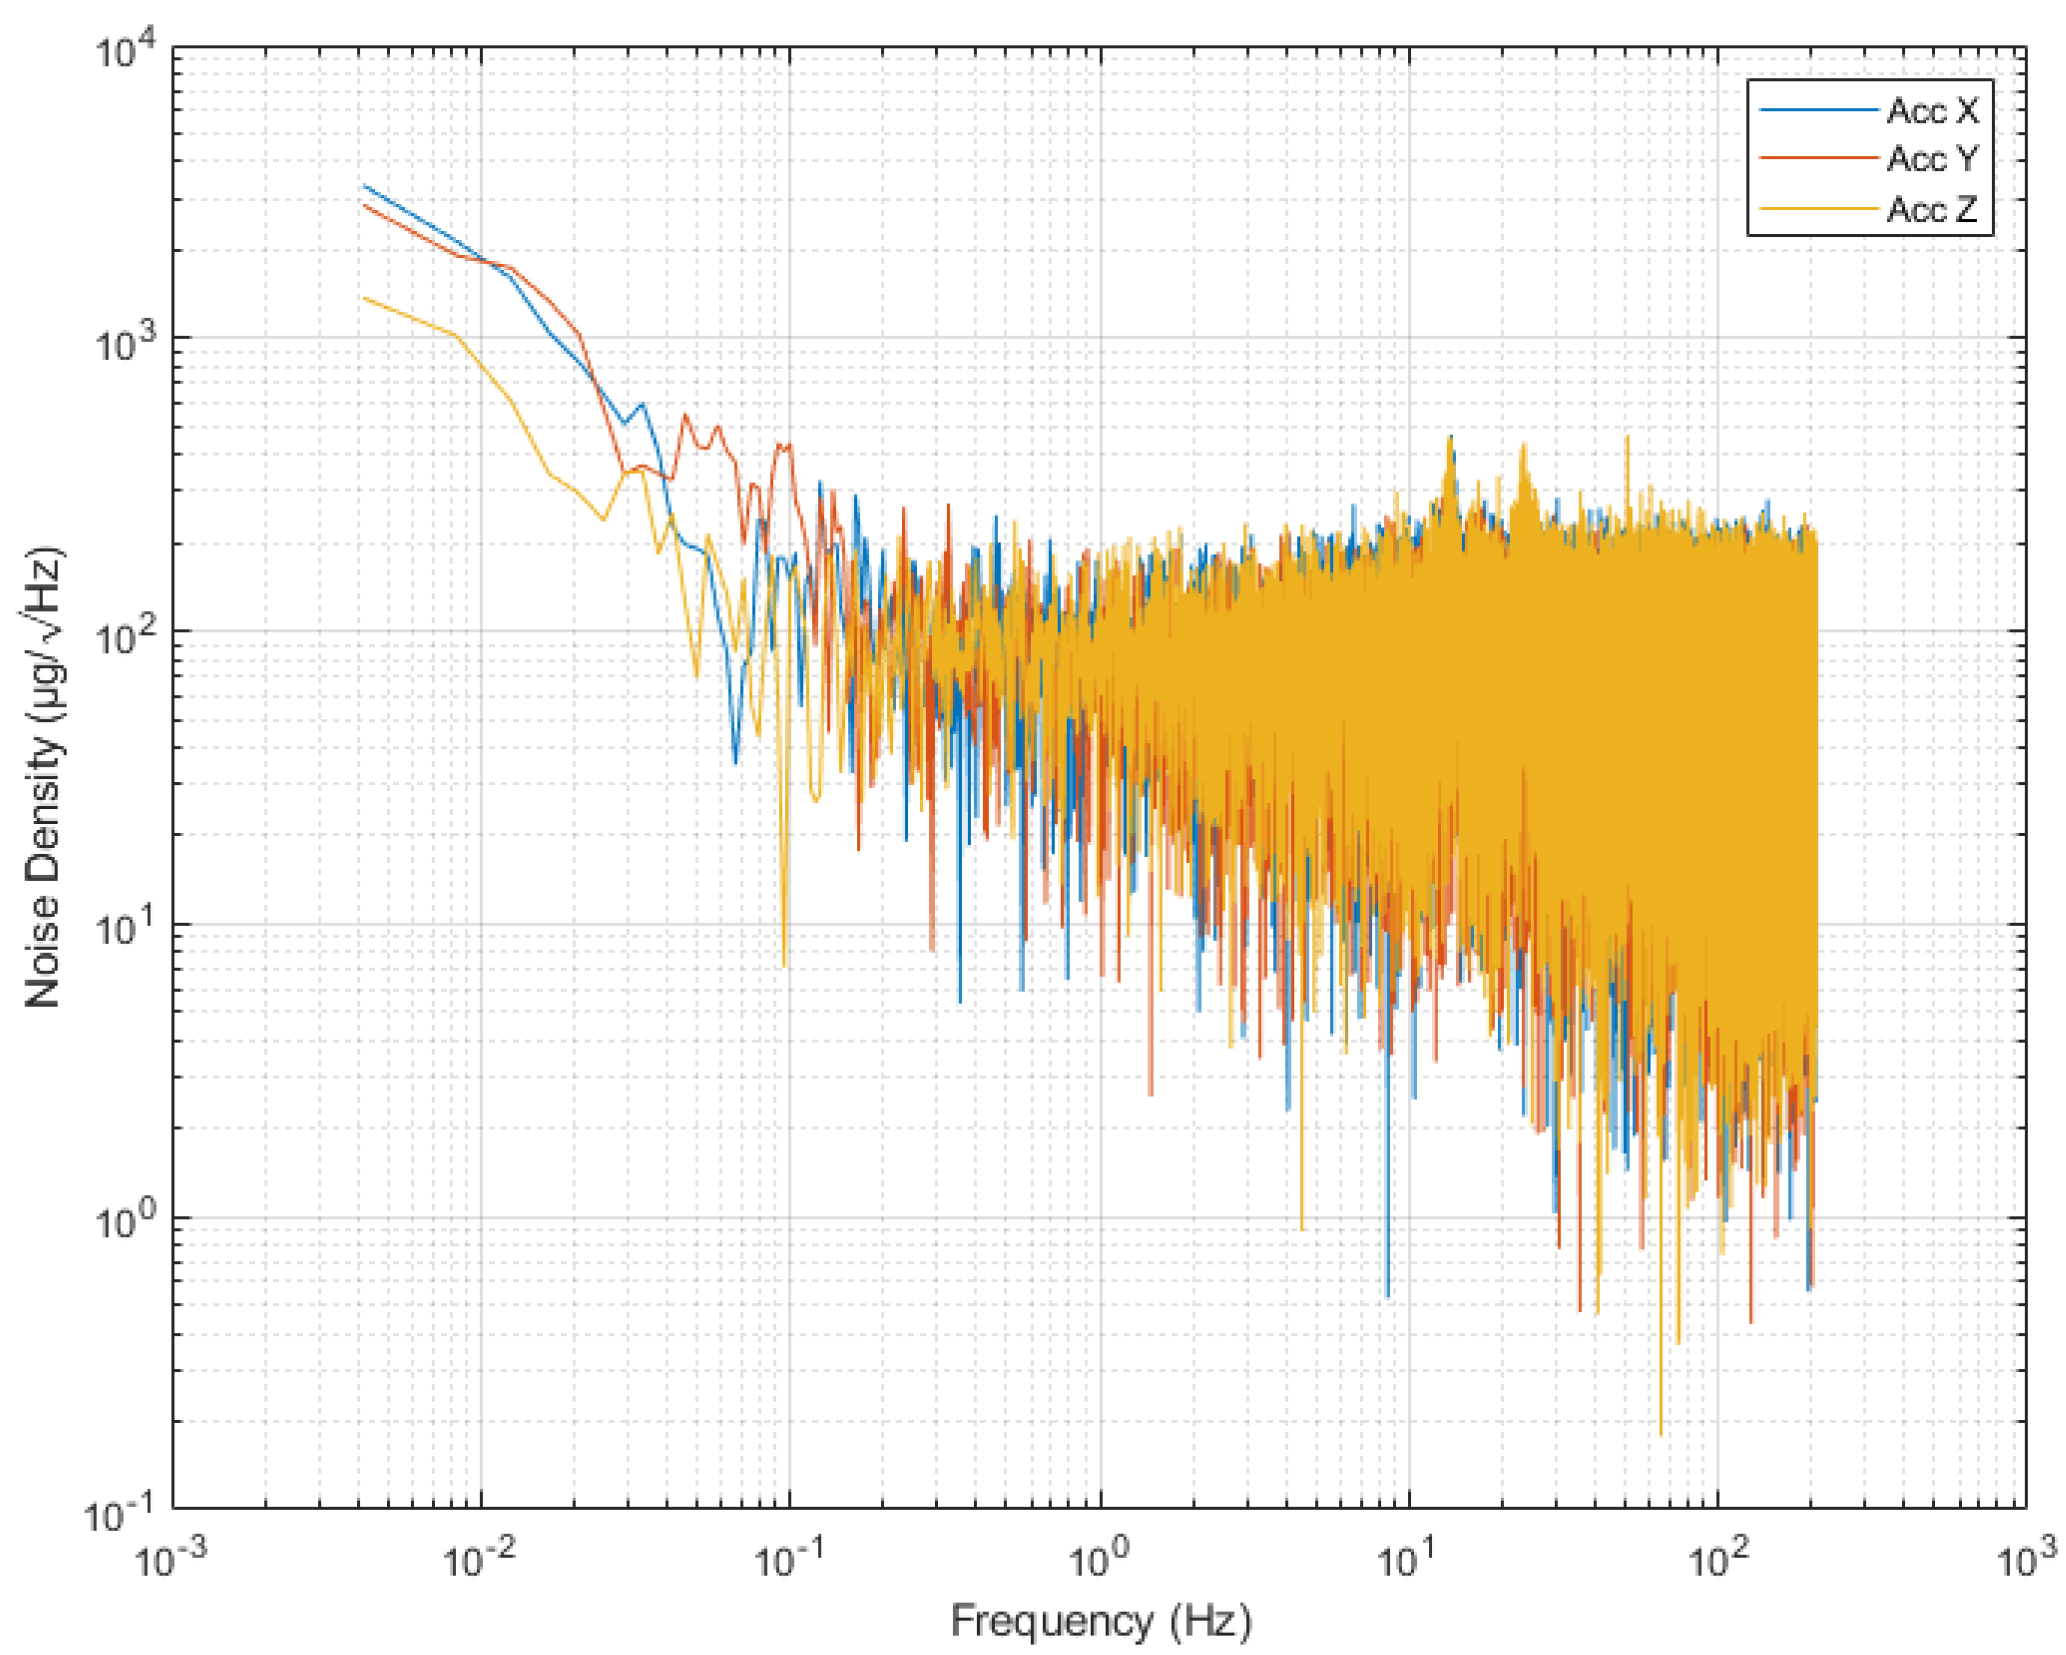
Noise density plots in Power Spectral Density (PSD) provide valuable insights into sensor performance, as illustrated in
Figure 10 for accelerometer and gyroscope PSDs.
The noise density in the accelerometer for the X and Y axes (
Table 4) closely matches the datasheet specification of 80 µg/
[
11], except for the Z axis, which exhibits a significantly higher value. Conversely, the gyroscope’s power spectral density (PSD) for the Y and Z axes shows approximately 20 mdps/
, compared to the specified 4 mdps/
in the datasheet [
11]. In this case, the X axis is the closest to the desired value, with a PSD of 7.26 mdps/
.
3.8. Allan Deviation
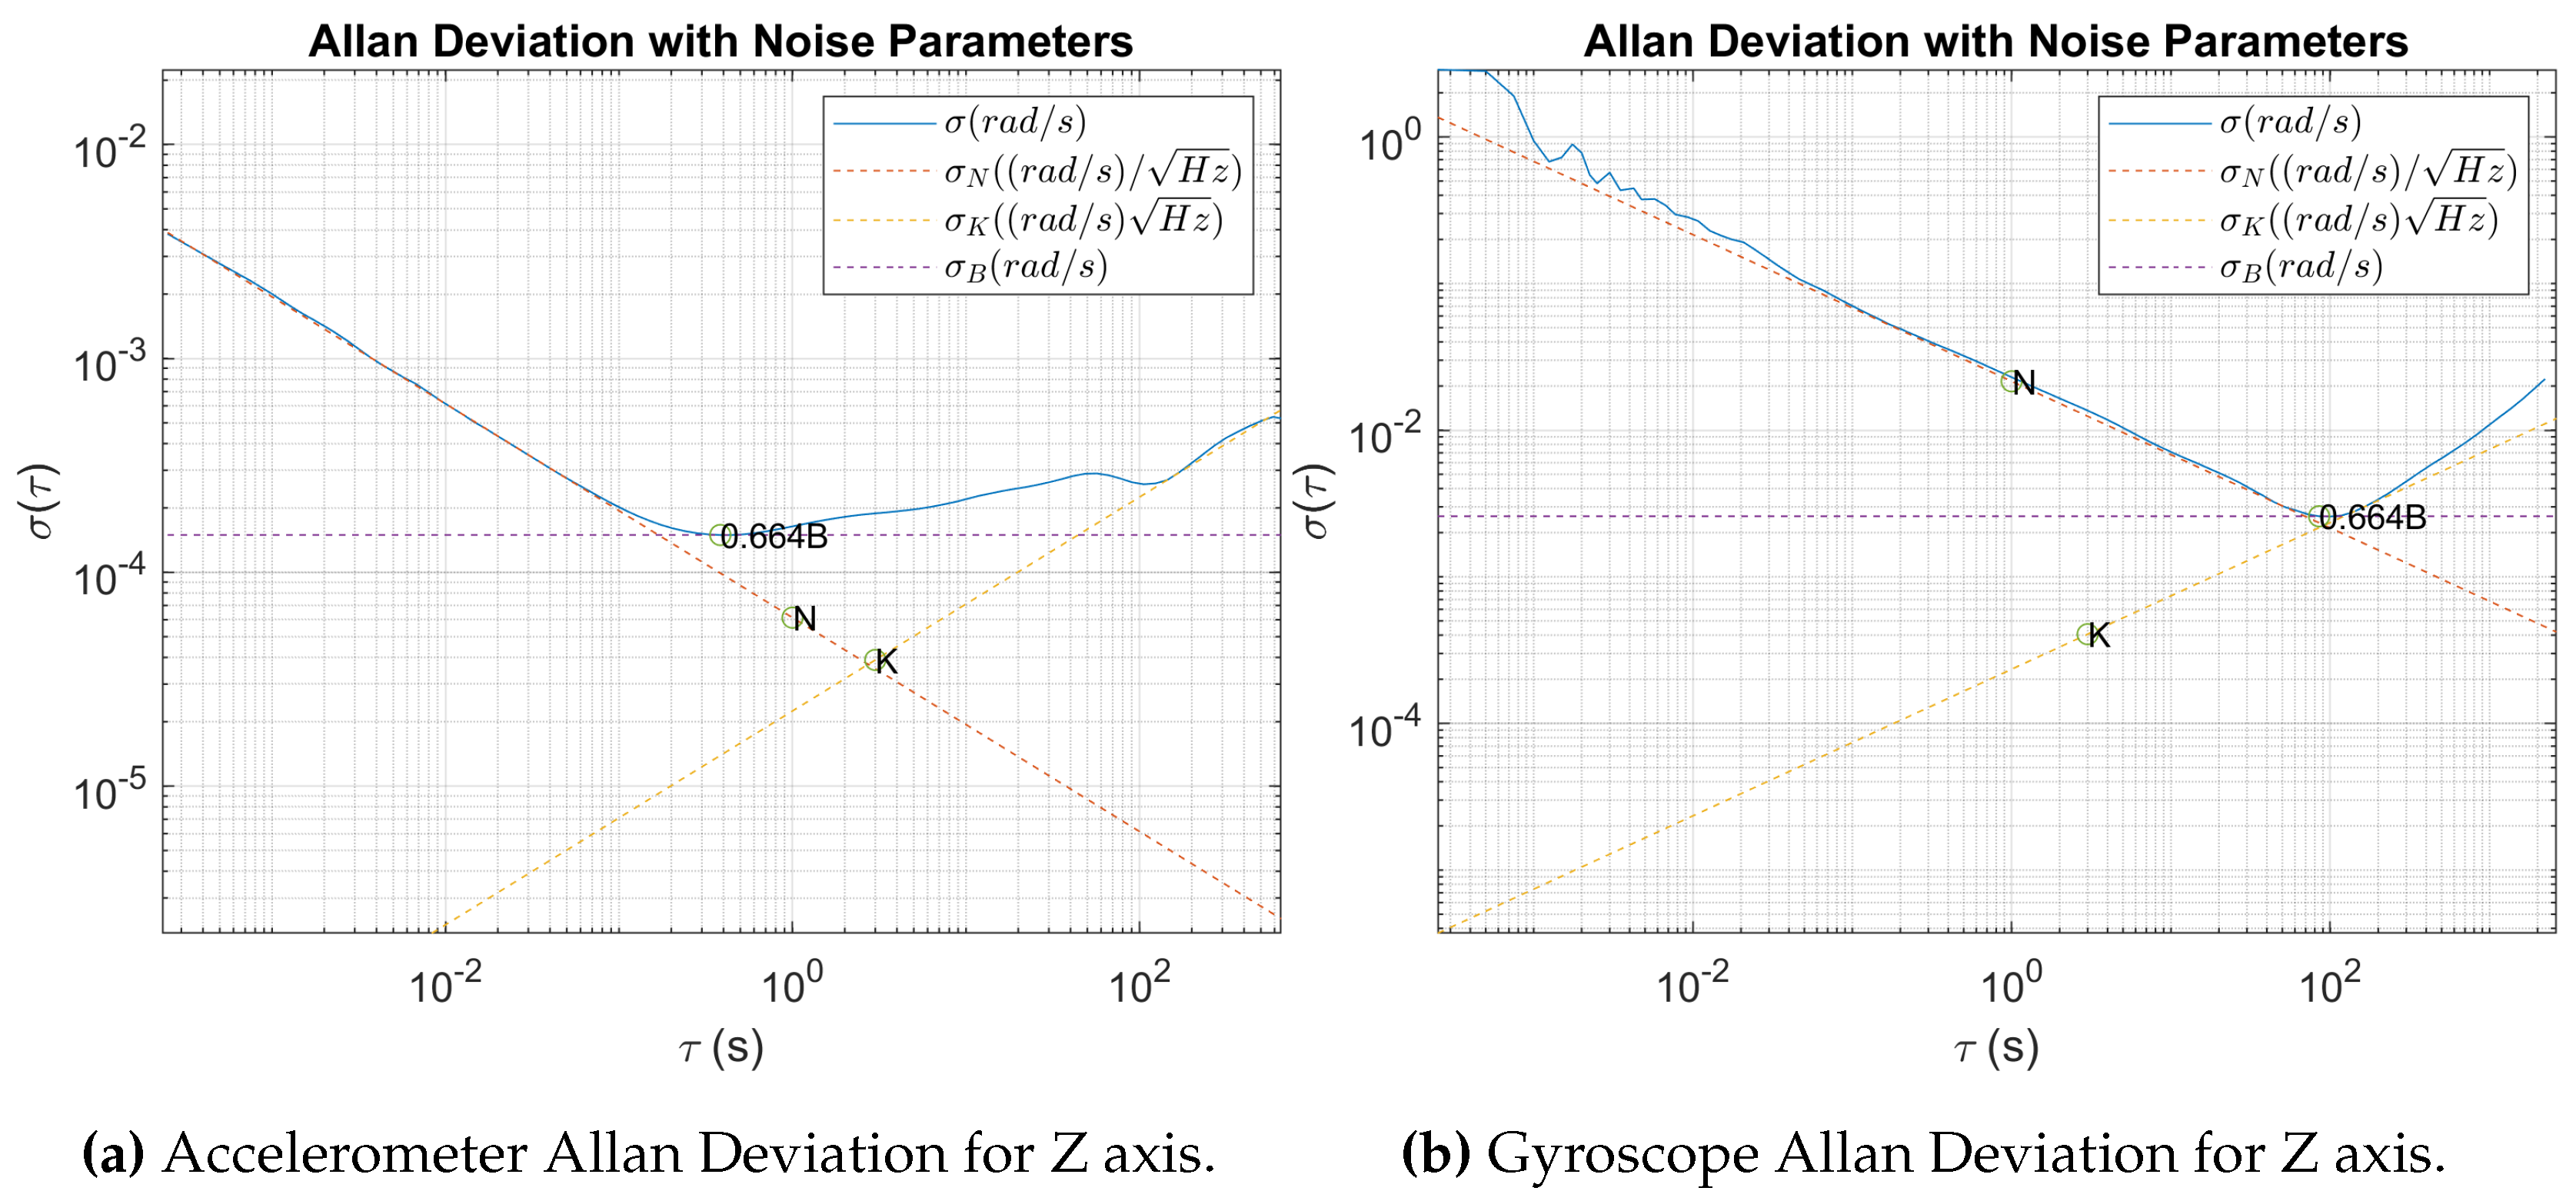
The Allan deviation analysis of the acccelerometer
Figure 11 and of the gyroscope reveals critical insights into its noise characteristics, highlighting Angular Random Walk, Bias Instability, and Rate Random Walk.
The Allan deviation plot (
Figure 11) for the Z-axis of the a provides valuable insights into the sensor’s noise characteristics. The blue line represents the Allan deviation over various integration times (
). Initially, at short integration times, the plot exhibits a negative slope close to -0.5, indicating the presence of Angular Random Walk (ARW). The fitted red dashed line for ARW confirms this with a slope of -0.5, suggesting that the dominant noise source at high frequencies is ARW, which is typical for white noise in gyroscope measurements. The ARW coefficient (N) is extracted and represented by the point ’N’ on the graph, showing the expected behavior of the gyroscope in the presence of random walk noise.
As the integration time increases, the plot transitions to a flatter region, highlighted by the purple dashed line, indicating Bias Instability (B). This flat region signifies that the noise is dominated by a constant bias drift over time. The Bias Instability coefficient (0.664B) is identified, representing the minimal variance achieved over the specified . At longer integration times, the plot exhibits a positive slope close to 0.5, suggesting the presence of Rate Random Walk (RRW). The yellow dashed line fitted for RRW confirms this behavior, indicating that low-frequency noise begins to dominate, leading to a divergence in the Allan deviation. The coefficient K for RRW is also extracted, providing a comprehensive understanding of the gyroscope’s noise performance across different time scales. This analysis is crucial for applications requiring precise gyroscopic measurements over varying durations, as it helps in identifying and mitigating the impact of different noise sources.
4. Discussion
The sampling frequency depends on the SPI interface and by the processing time required in the microcontroller. Both factors define the limits that can be achieved and must be considered in the optimization of the device.
The power consumption analysis reveals that the primary peaks occur during the processes of opening and saving data to the SD card. Consequently, achieving optimal energy management will be closely linked to the size of the acquisition buffer storage, as larger buffers can reduce the frequency of these high-power operations. This implies that by adjusting the buffer size appropriately, the number of times the system needs to access the SD card can be minimized, thereby enhancing overall energy efficiency.
The PSD results show discrepancies which could arise from variations in calibration during production, differences in environmental conditions during testing, or potential measurement errors. Understanding these factors is crucial for a comprehensive evaluation of the sensor’s actual performance.
The analysis indicates the necessity for three further refinements in the design. First, the sensor-controller connection should utilize a dedicated SPI interface, while the SD card should be connected via the SDIO interface. This will enhance storage speed and eliminate potential bottlenecks in the sampling and storage process. Second, replacing the BMS components with an LDO and using the microcontroller for battery management will reduce power consumption and heat generation from the current BMS components, which can affect the IMU results. Finally, eliminating the SD socket will save space and costs, while increasing the device’s hermeticity.
Author Contributions
Conceptualization, D.V. and J.A.; methodology, D.V. and G.G.; software, D.V. and G.G..; validation, D.V., G.G. and J.A.; formal analysis, D.V.; investigation, D.V. and G.G.; resources, A.L.; data curation, A.L.; writing—original draft preparation, G.G.; writing—review and editing, J.A.; visualization, D.A.; supervision, J.A.; project administration, A.L.; funding acquisition, J.A. All authors have read and agreed to the published version of the manuscript.
Funding
This research was partly funded by the program Research Missions of the Principado de Asturias, and by the program in Precision Personalized Medicine, Instituto de Salud Carlos III, Spanish Government.
Institutional Review Board Statement
Not applicable
Data Availability Statement
The data presented in this study are available on request from the corresponding author.
Acknowledgments
Thanks to Alejandro Castellanos for helping with the robot programming to get sensor data.
Conflicts of Interest
The authors declare no conflicts of interest.
Abbreviations
The following abbreviations are used in this manuscript:
| ADC |
Analog-to-Digital Converter |
| ARW |
Angular Random Walk |
| BMS |
Battery Management System |
| FIFO |
First In, First Out |
| IMU |
Inertial Measurement Unit |
| LDO |
Low Dropout Regulator |
| MDPI |
Multidisciplinary Digital Publishing Institute |
| NTC |
Negative Temperature Coefficient |
| PCB |
Printed Circuit Board |
| PSD |
Power Spectral Density |
| RAM |
Random Access Memory |
| RRW |
Rate Random Walk |
References
- Friend, S.H.; Ginsburg, G.S.; Picard, R.W. Wearable Digital Health Technology. New England Journal of Medicine 2023, 389, 2100–2101. [Google Scholar] [CrossRef] [PubMed]
- Blair, S. Physical inactivity: the biggest public health problem of the 21st century. Br J Sports Med 2009, 43. [Google Scholar]
- Nijmeijer, E.M.; Heuvelmans, P.; Bolt, R.; Gokeler, A.; Otten, E.; Benjaminse, A. Concurrent validation of the Xsens IMU system of lower-body kinematics in jump-landing and change-of-direction tasks. Journal of Biomechanics 2023, 154. [Google Scholar] [CrossRef] [PubMed]
- Gu, C.; Lin, W.; He, X.; Zhang, L.; Zhang, M. IMU-based motion capture system for rehabilitation applications: A systematic review. Biomimetic Intelligence and Robotics 2023, 3. [Google Scholar] [CrossRef]
- Digo, E.; Gastaldi, L.; Antonelli, M.; Pastorelli, S.; Cereatti, A.; Caruso, M. Real-time estimation of upper limbs kinematics with IMUs during typical industrial gestures. Procedia Computer Science, 2022, Vol. 200.
- Liang, W.; Wang, F.; Fan, A.; Zhao, W.; Yao, W.; Yang, P. Extended Application of Inertial Measurement Units in Biomechanics: From Activity Recognition to Force Estimation. Sensors 2023, 23. [Google Scholar] [CrossRef] [PubMed]
- Rodríguez-Martín, D.; Pérez-López, C.; Samà, A.; Cabestany, J.; Català, A. A wearable inertial measurement unit for long-term monitoring in the dependency care area. Sensors (Switzerland) 2013, 13, 14079–14104. [Google Scholar] [CrossRef] [PubMed]
- Ailneni, S. ; others. Characterization of MEMS based Inertial Measurement Unit. 1st International Conference on Range Technology, ICORT 2019, 2019. [CrossRef]
- Zhang, P.; Zhan, X.; Zhang, X.; Zheng, L. Error characteristics analysis and calibration testing for MEMS IMU gyroscope. Aerospace Systems 2019, 2. [Google Scholar] [CrossRef]
- IEEE Standard Specification Format Guide and Test Procedure for Single-Axis Interferometric Fiber Optic Gyros. <italic>IEEE Std 952-1997</italic> <b>1998</b>, pp. IEEE Standard Specification Format Guide and Test Procedure for Single-Axis Interferometric Fiber Optic Gyros. IEEE Std 952-1997. [CrossRef]
- STMicroelectronics. LSM6DSL Datasheet, 2023.
- STMicroelectronics. STM32L051 Datasheet, 2023.
|
Disclaimer/Publisher’s Note: The statements, opinions and data contained in all publications are solely those of the individual author(s) and contributor(s) and not of MDPI and/or the editor(s). MDPI and/or the editor(s) disclaim responsibility for any injury to people or property resulting from any ideas, methods, instructions or products referred to in the content. |
© 2024 by the authors. Licensee MDPI, Basel, Switzerland. This article is an open access article distributed under the terms and conditions of the Creative Commons Attribution (CC BY) license (https://creativecommons.org/licenses/by/4.0/).
