1. Introduction
With the growth of the internet and the extensive dissemination and development of information and communication technologies, a data revolution has been fostered, leading companies from diverse application contexts to generate vast amounts of data. Consequently, these companies face the significant challenge of transforming such data into information for decision-making through artificial intelligence and machine learning [
1,
2,
3,
4,
5,
6]. In a similar vein, thanks to the availability of not only data but also computational resources and tools, there has been a renewed interest in applying machine learning techniques to solve problems where conventional methods exhibit shortcomings [
7,
8,
9].
Machine learning is a technique within artificial intelligence that seeks to emulate the human brain's capability by extracting generalized knowledge or patterns from a set of historical data to make predictions when faced with new data [
10,
11]. Machine learning can be categorized into two types: supervised and unsupervised. In supervised learning, the model is trained with labeled data, meaning examples that include both inputs and their correct outputs. In unsupervised learning, the data is unlabeled, and the goal is to identify patterns and ratios within the data to group them into categories [
7,
12,
13,
14], which are typically determined through distance or similarity metrics [
15].
One of the most widely utilized unsupervised learning models is K-means, where specifying the number of groups or clusters to form from the dataset instances based on distance metrics is essential as an input parameter [
16,
17]. K-means aims to organize the instances of a dataset into K groups, minimizing the sum of squared distances between instances and their centroids [
18,
19]. To determine the optimal number of clusters, the elbow method or elbow criterion is frequently used, which involves plotting the inertias obtained for different numbers of clusters and identifying the inflection point or elbow, where the decrease in inertias becomes less pronounced [
20,
21,
22,
23,
24].
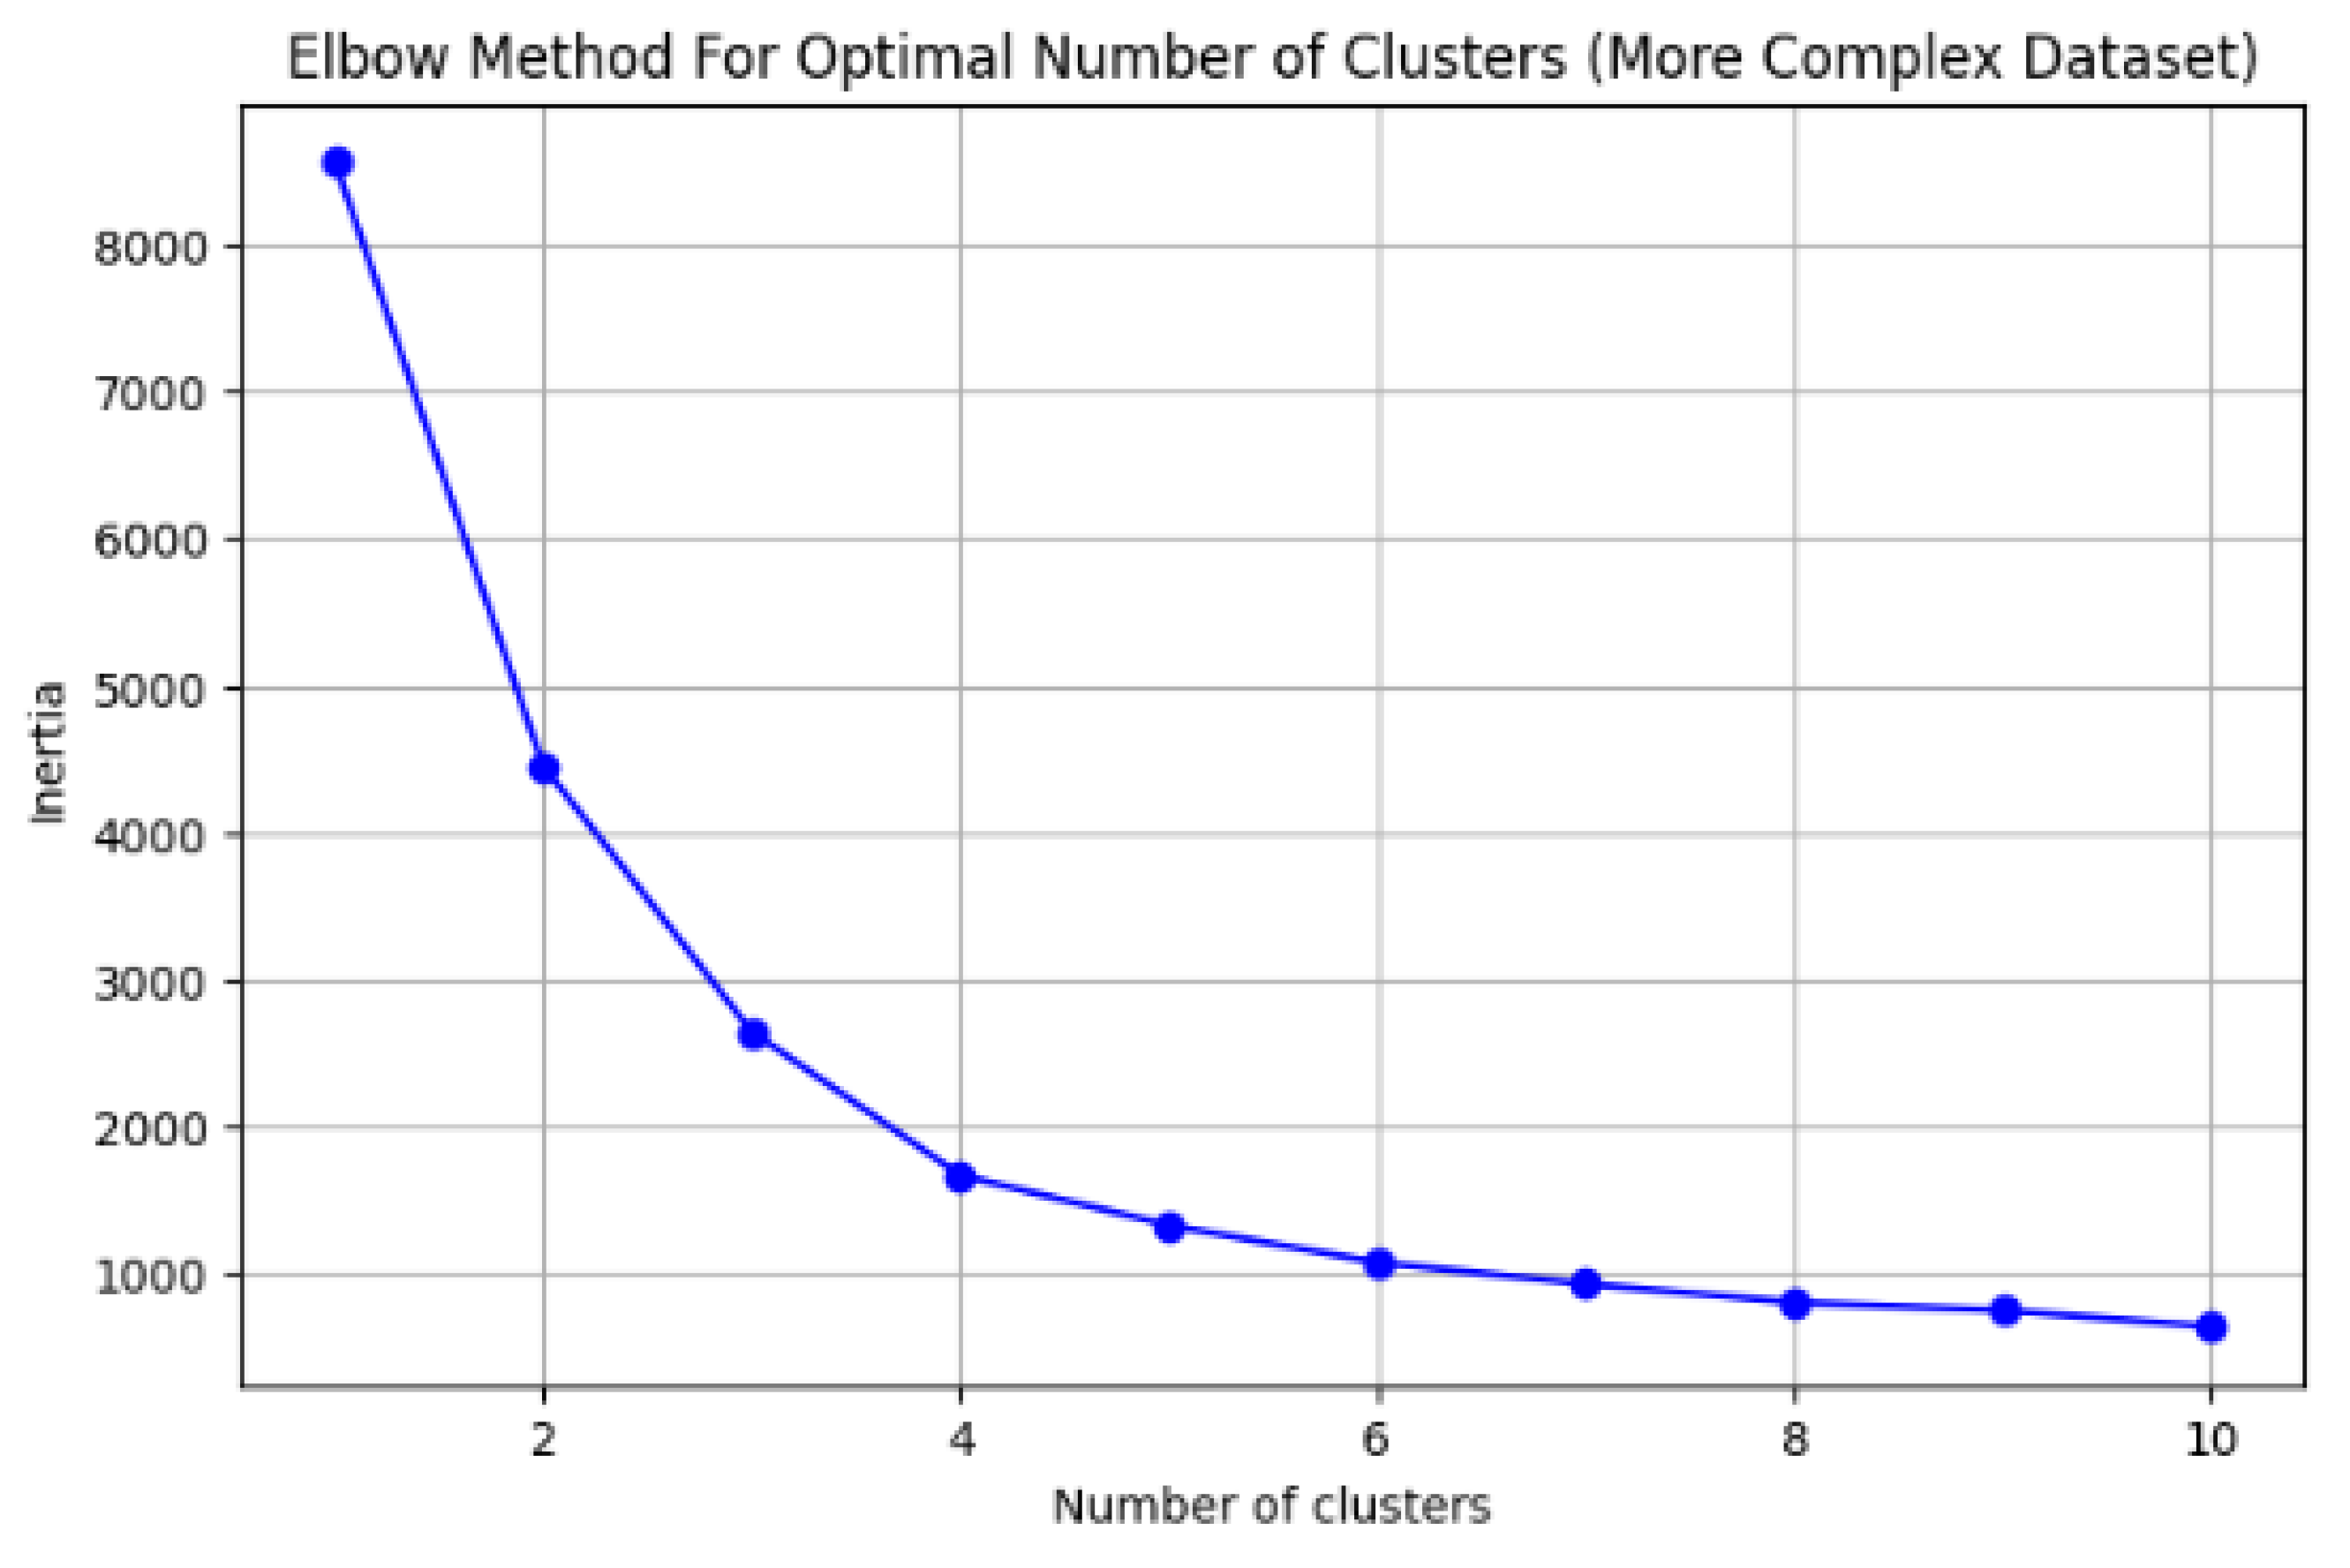
Despite the widespread use of the elbow method, one of its major challenges is visually determining the point where the variation is least pronounced, especially in datasets where data separation is not clear, as seen in
Figure 3, where this selection criterion could be quite subjective. Therefore, it is necessary to have mathematical tools that enable a more precise and less subjective determination of the optimal number of clusters [
25,
26]. In this work, we propose a mathematical and computational method for determining the optimal number of clusters in unsupervised learning, supported by the KMeans model. This method is based on the mathematical analysis of the inertias or sums of intra-cluster squared distances for different numbers of clusters, thereby obtaining the most probable number of clusters to use for grouping the data. This method serves as an alternative to the shortcomings of the elbow method when it is difficult to visually distinguish the optimal number of clusters. It is also noteworthy that the proposed method can be used with datasets where the optimal number of clusters can be easily differentiated using the elbow method, thereby serving as a means to corroborate these results.
The method was implemented using the advantages provided by the sklearn, numpy, and matplotlib libraries [
27]. Additionally, it was validated with five datasets generated through artificial intelligence, where the number of clusters is clearly distinguishable, allowing for verification of the method's relevance. This method aims to serve as a reference for use in various work contexts involving supervised learning supported by K-means, enabling more efficient and effective determination of the optimal number of clusters.
The remainder of this work is organized as follows:
Section 2 presents the methodological phases considered for the development of this study.
Section 3 describes the results obtained, including the design and implementation of the method, as well as the evaluation of its efficacy in determining the optimal number of clusters and its computational efficiency. Additionally, this section discusses the proposed method in comparison to other state-of-the-art approaches. Finally,
Section 4 presents the conclusions and future work derived from this research.
2. Materials and Methods
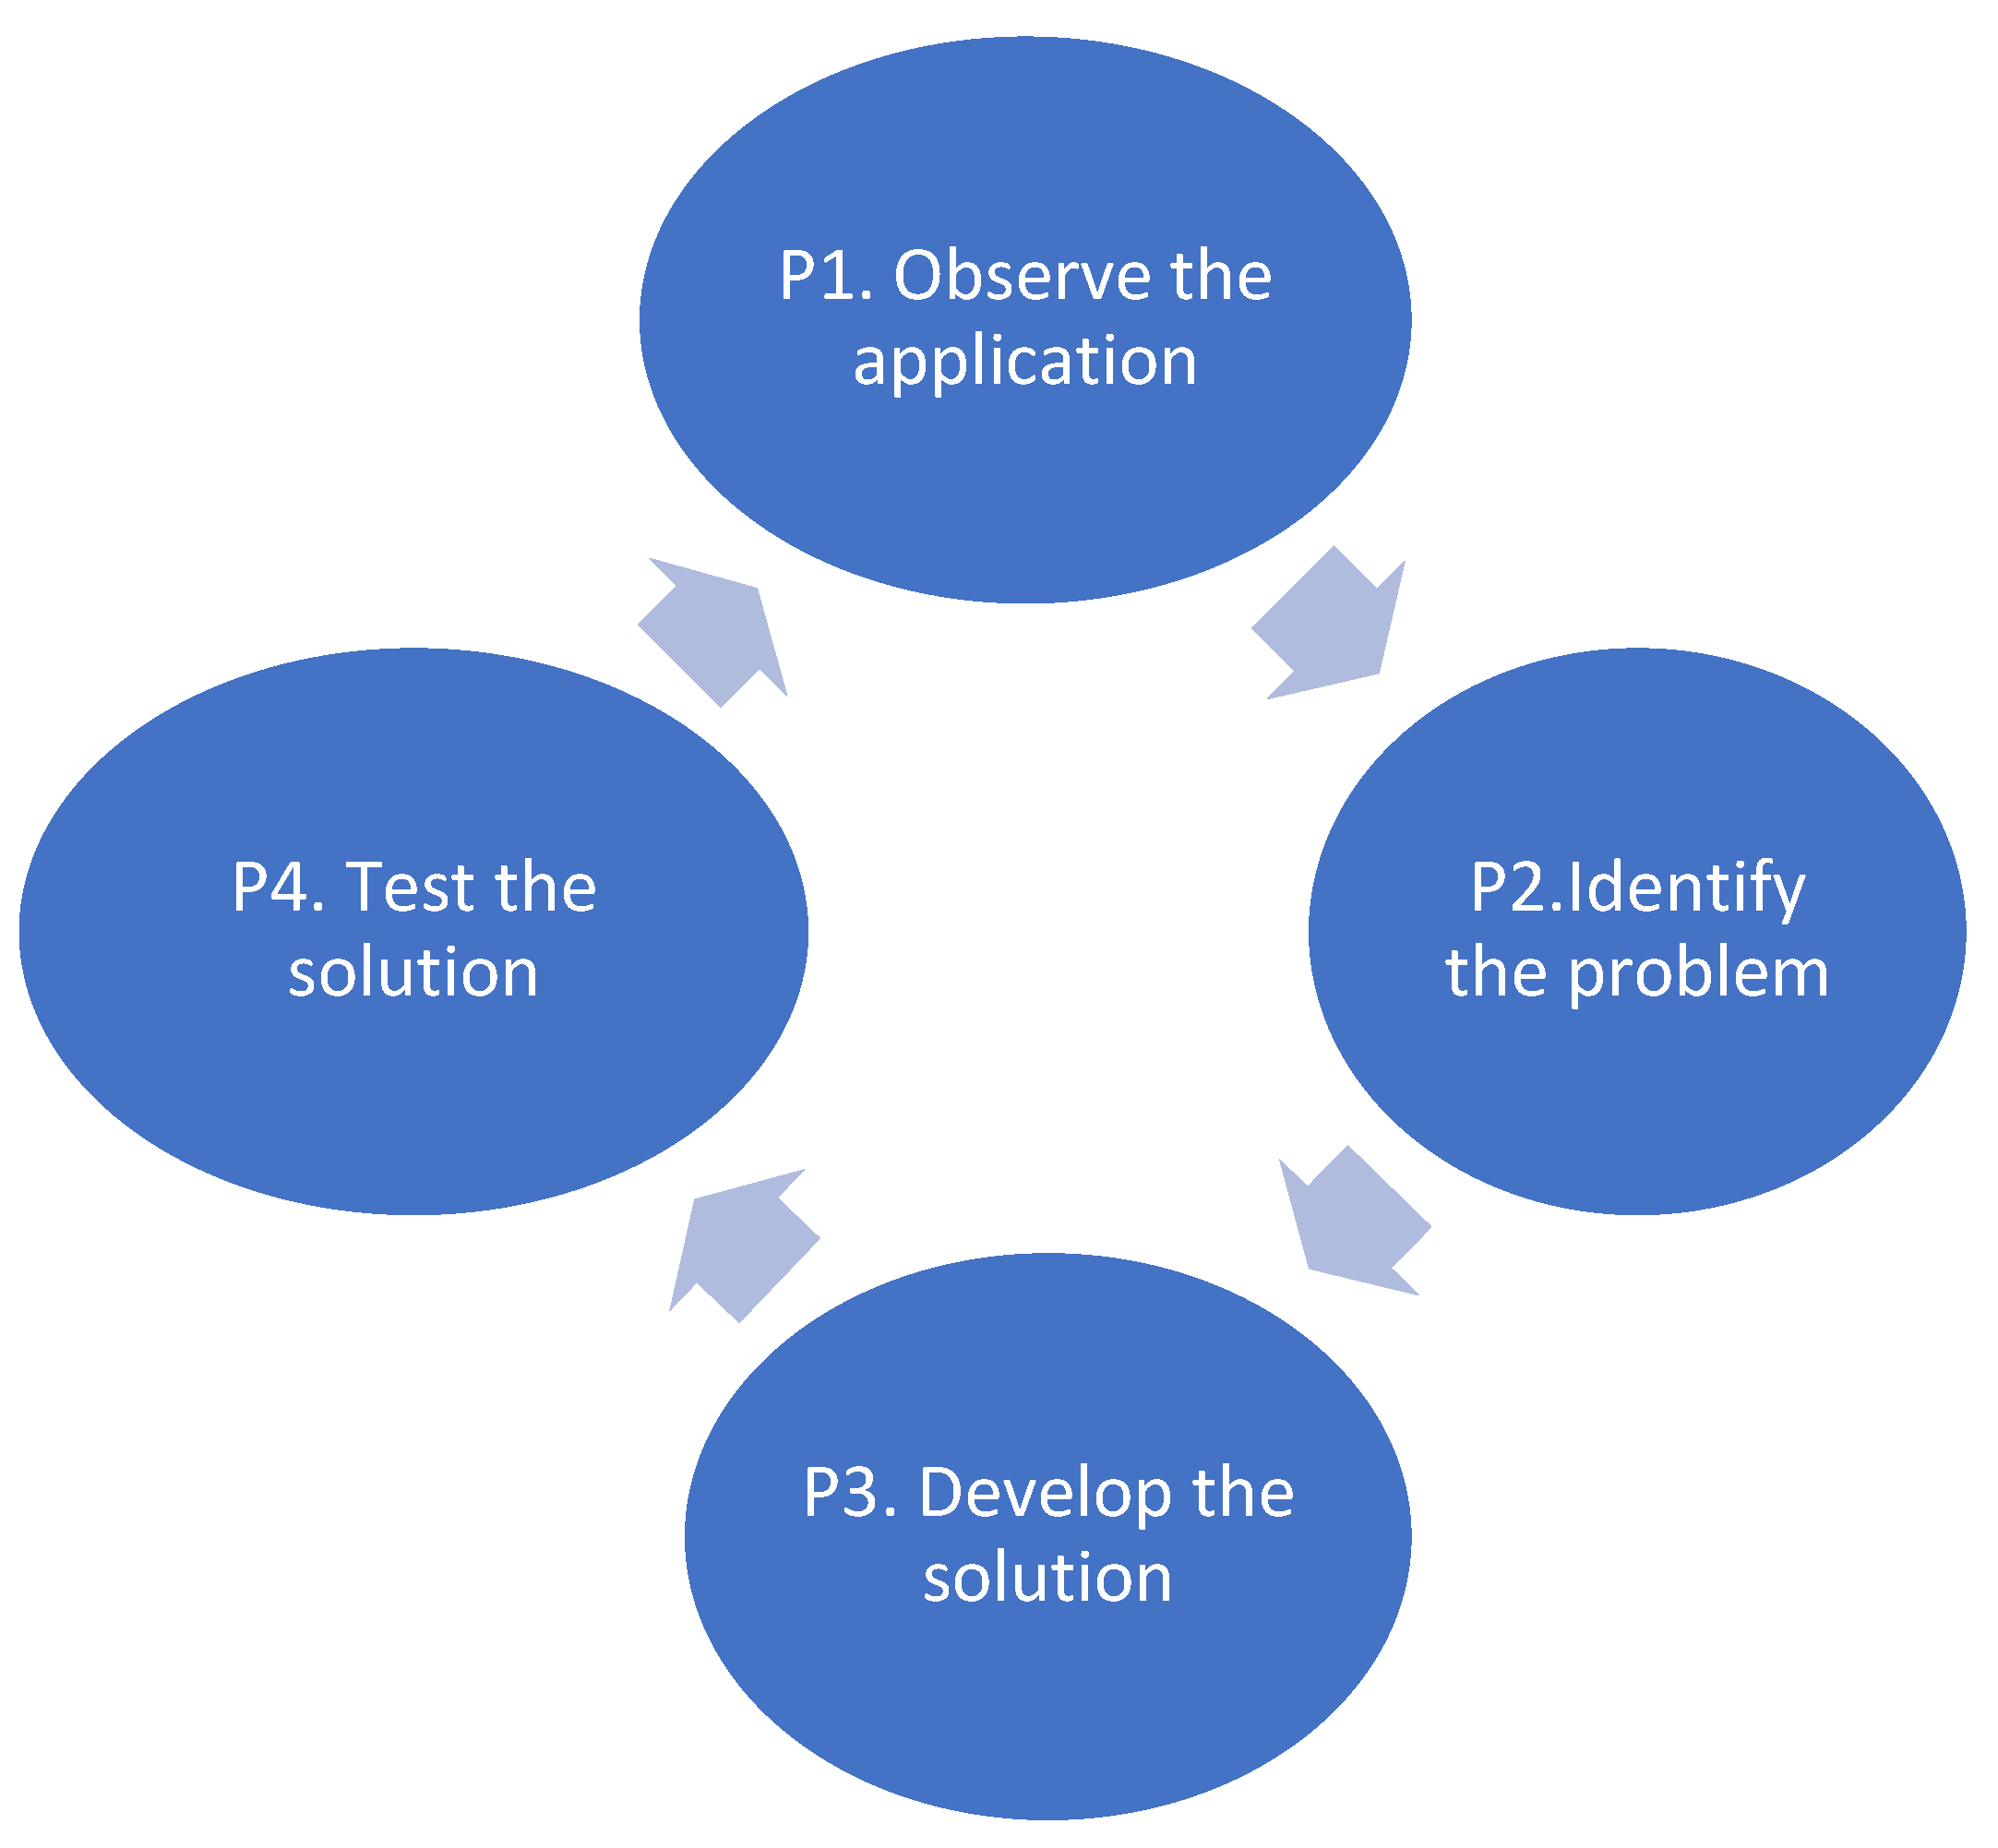
For the development of this research, the four methodological phases of Pratt's iterative research pattern were considered [
28]: P1. Observe the application, P2. Identify the problem, P3. Develop the solution, P4. Test the solution (see
Figure 1).
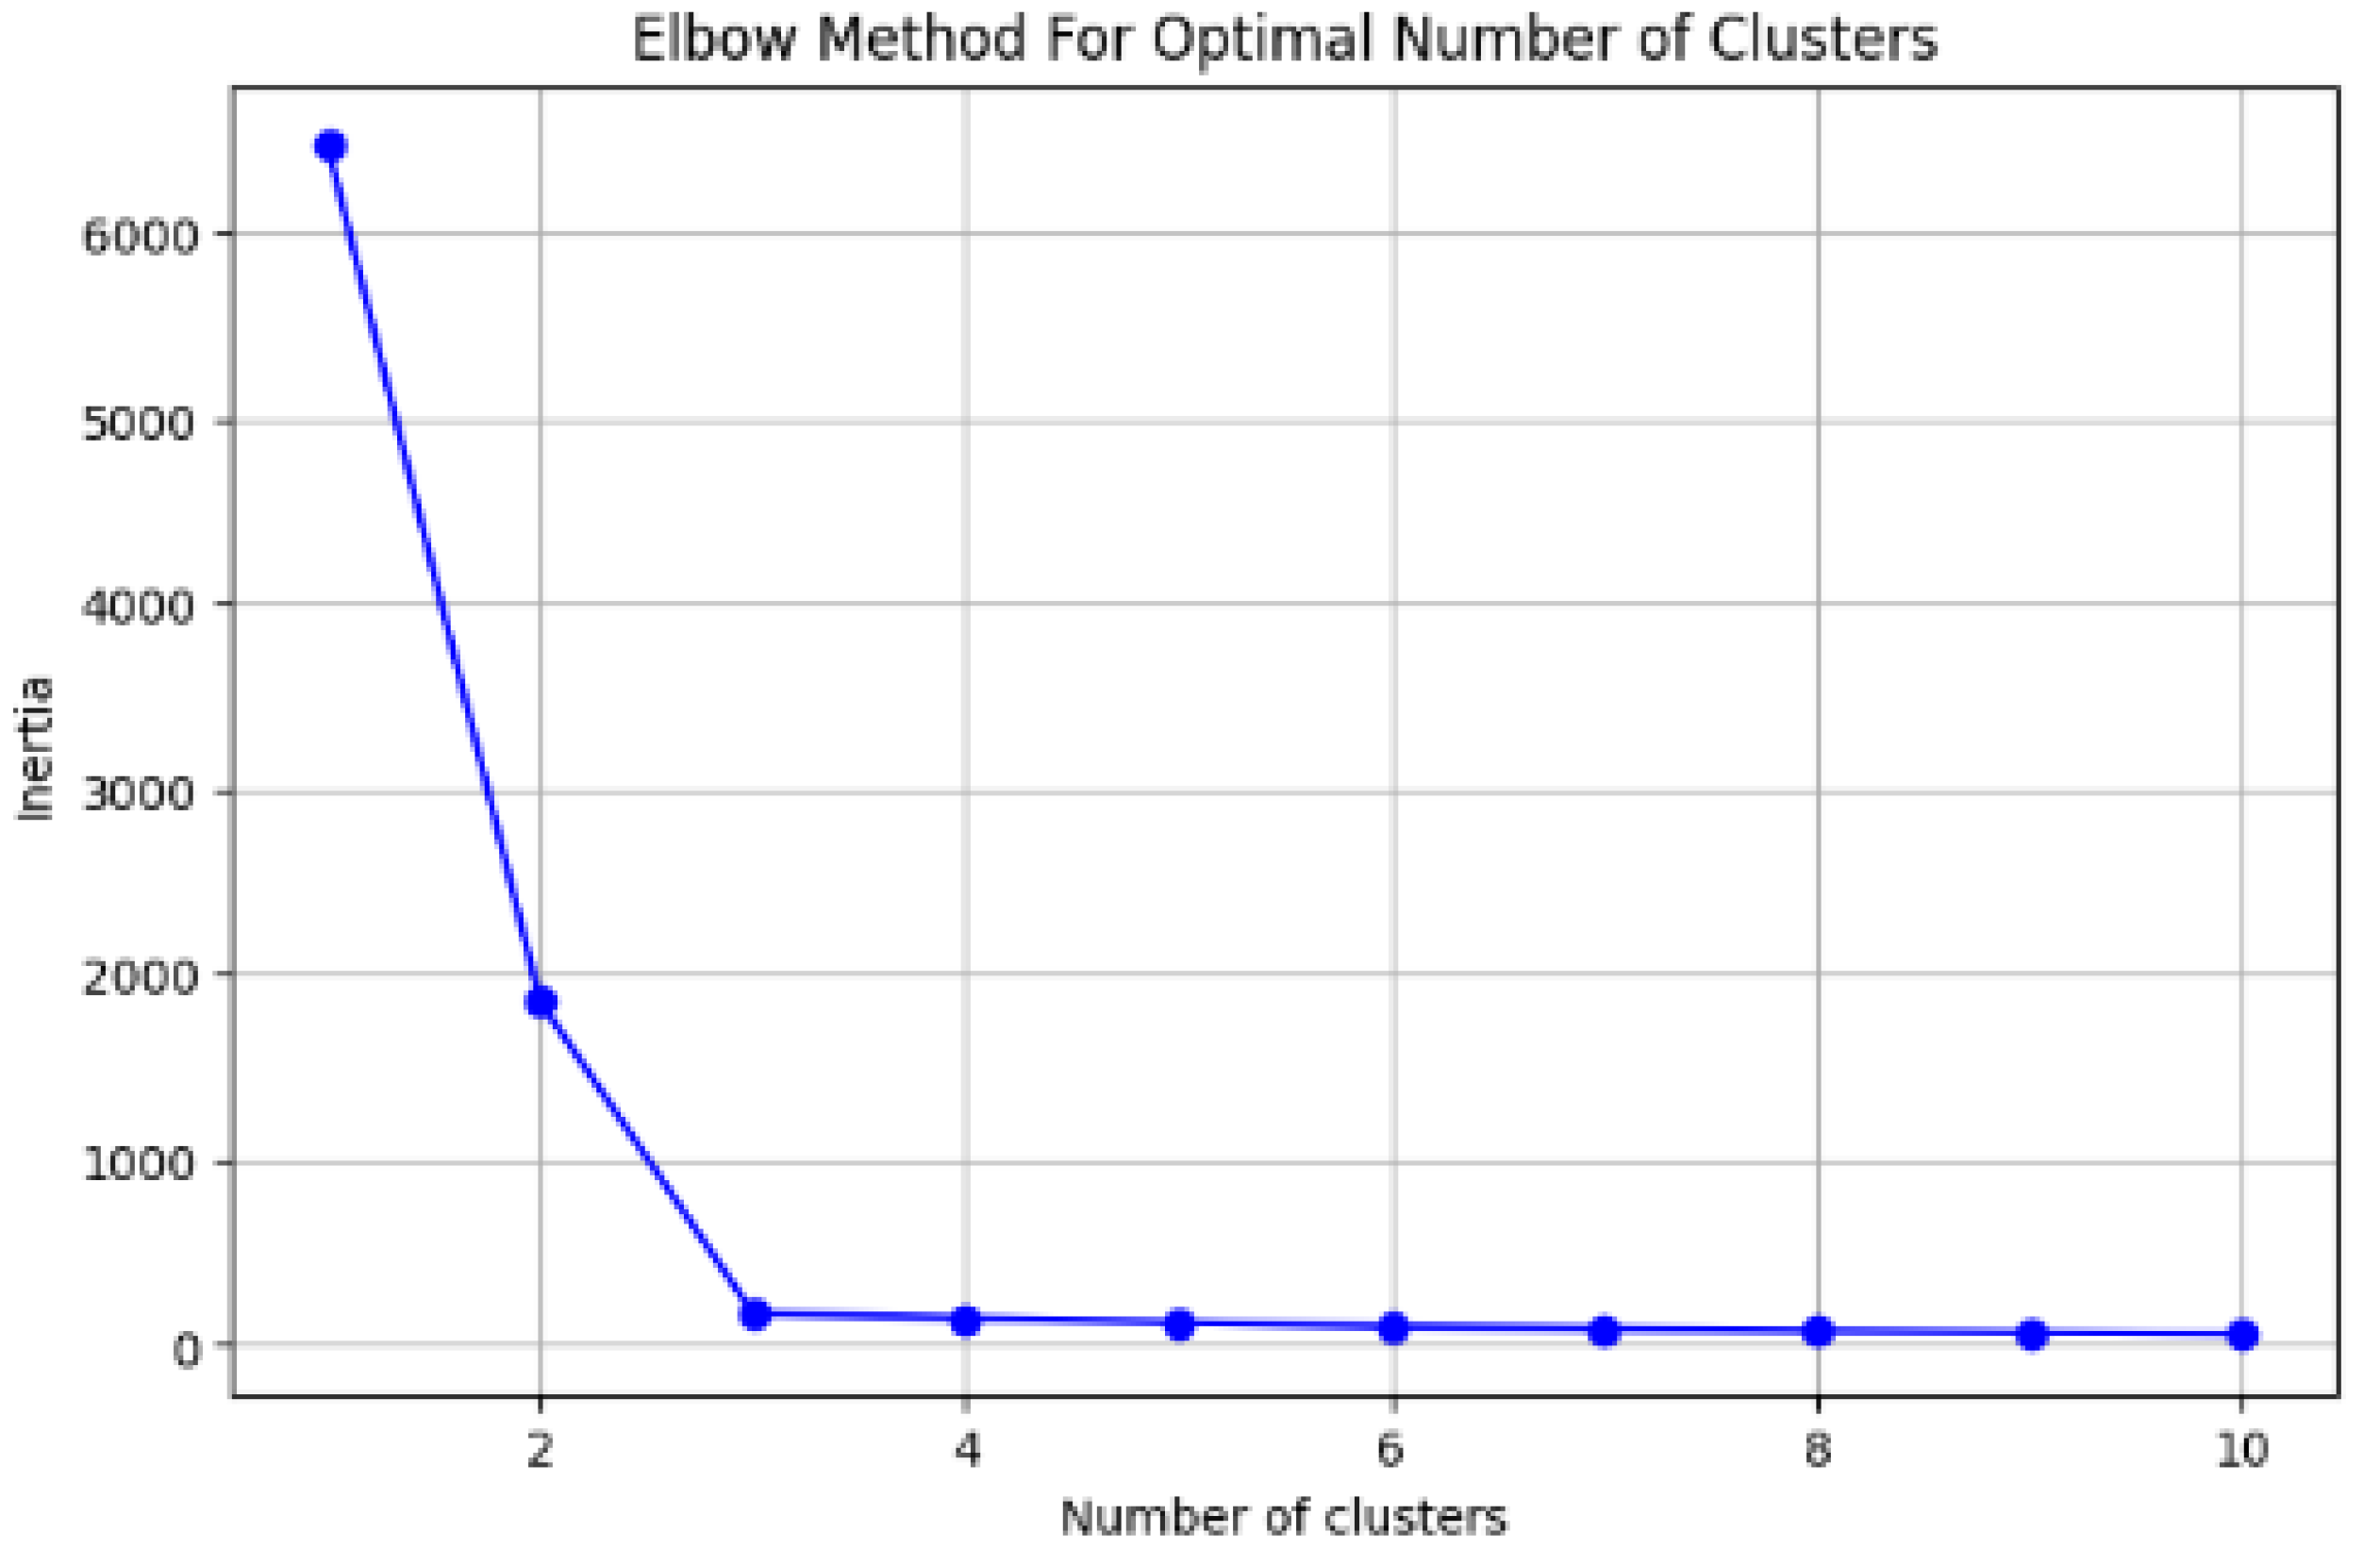
In the first phase of the methodology, the elbow method was characterized, which is employed in the K-means model to determine the optimal number of clusters into which the dataset should be divided for a more effective and precise interpretation of each group. For instance,
Figure 2 shows the plot of inertia calculated from 1 to 10 clusters for a dataset of 100 instances. It is evident that starting from the third cluster, the inertia does not show significant variations, indicating that the optimal value is k=3.
It is worth noting that each point in the graph in
Figure 2 corresponds to the inertia for a given number of clusters k, which is determined by equation (1).
Where n is the total number of instances in the dataset, corresponds to the i-th instance of the dataset, is the centroid of the j-th cluster, C is the set of all cluster centroids, and is the squared Euclidean distance between instance and centroid .
On the other hand, within phase 2, the limitation of the elbow method was identified, which can be summarized as the difficulty in visually differentiating the point where the cluster inertia is less pronounced [
25]. For instance,
Figure 3 presents a graph of the calculated inertia from 1 to 10 clusters for a dataset with 100 instances, in which it is not easy to discern the optimal number of clusters.
In phase 3 of the methodology, a mathematical method was designed based on obtaining the first numerical derivative of each inertia point and the subsequent numerical ratio between the derivatives of consecutive inertia points. This was done to determine the maximum ratio between contiguous derivatives and to assess the probability of each cluster being the optimal number. Subsequently, the method was implemented computationally using the sklearn, numpy, and matplotlib libraries. The sklearn library was used to determine the cluster inertias, the numpy library was utilized to calculate the numerical derivatives and identify the maximum variation, and finally, the matplotlib library was employed to generate the corresponding graphs for the clusters and the elbow method.
Finally, in phase 4, once the mathematical method was implemented, its validation was carried out using 5 datasets generated by AI, in which the optimal number of clusters is 2, 3, 4, 5, and 6 clusters. This allowed for verifying the effectiveness of the method in correctly identifying the number of clusters. Additionally, the performance of the method was evaluated by monitoring RAM consumption and execution time in a Google Colab cloud environment.
3. Results and Discussion
This section may be divided by subheadings. It should provide a concise and precise description of the experimental results, their interpretation, as well as the experimental conclusions that can be drawn.
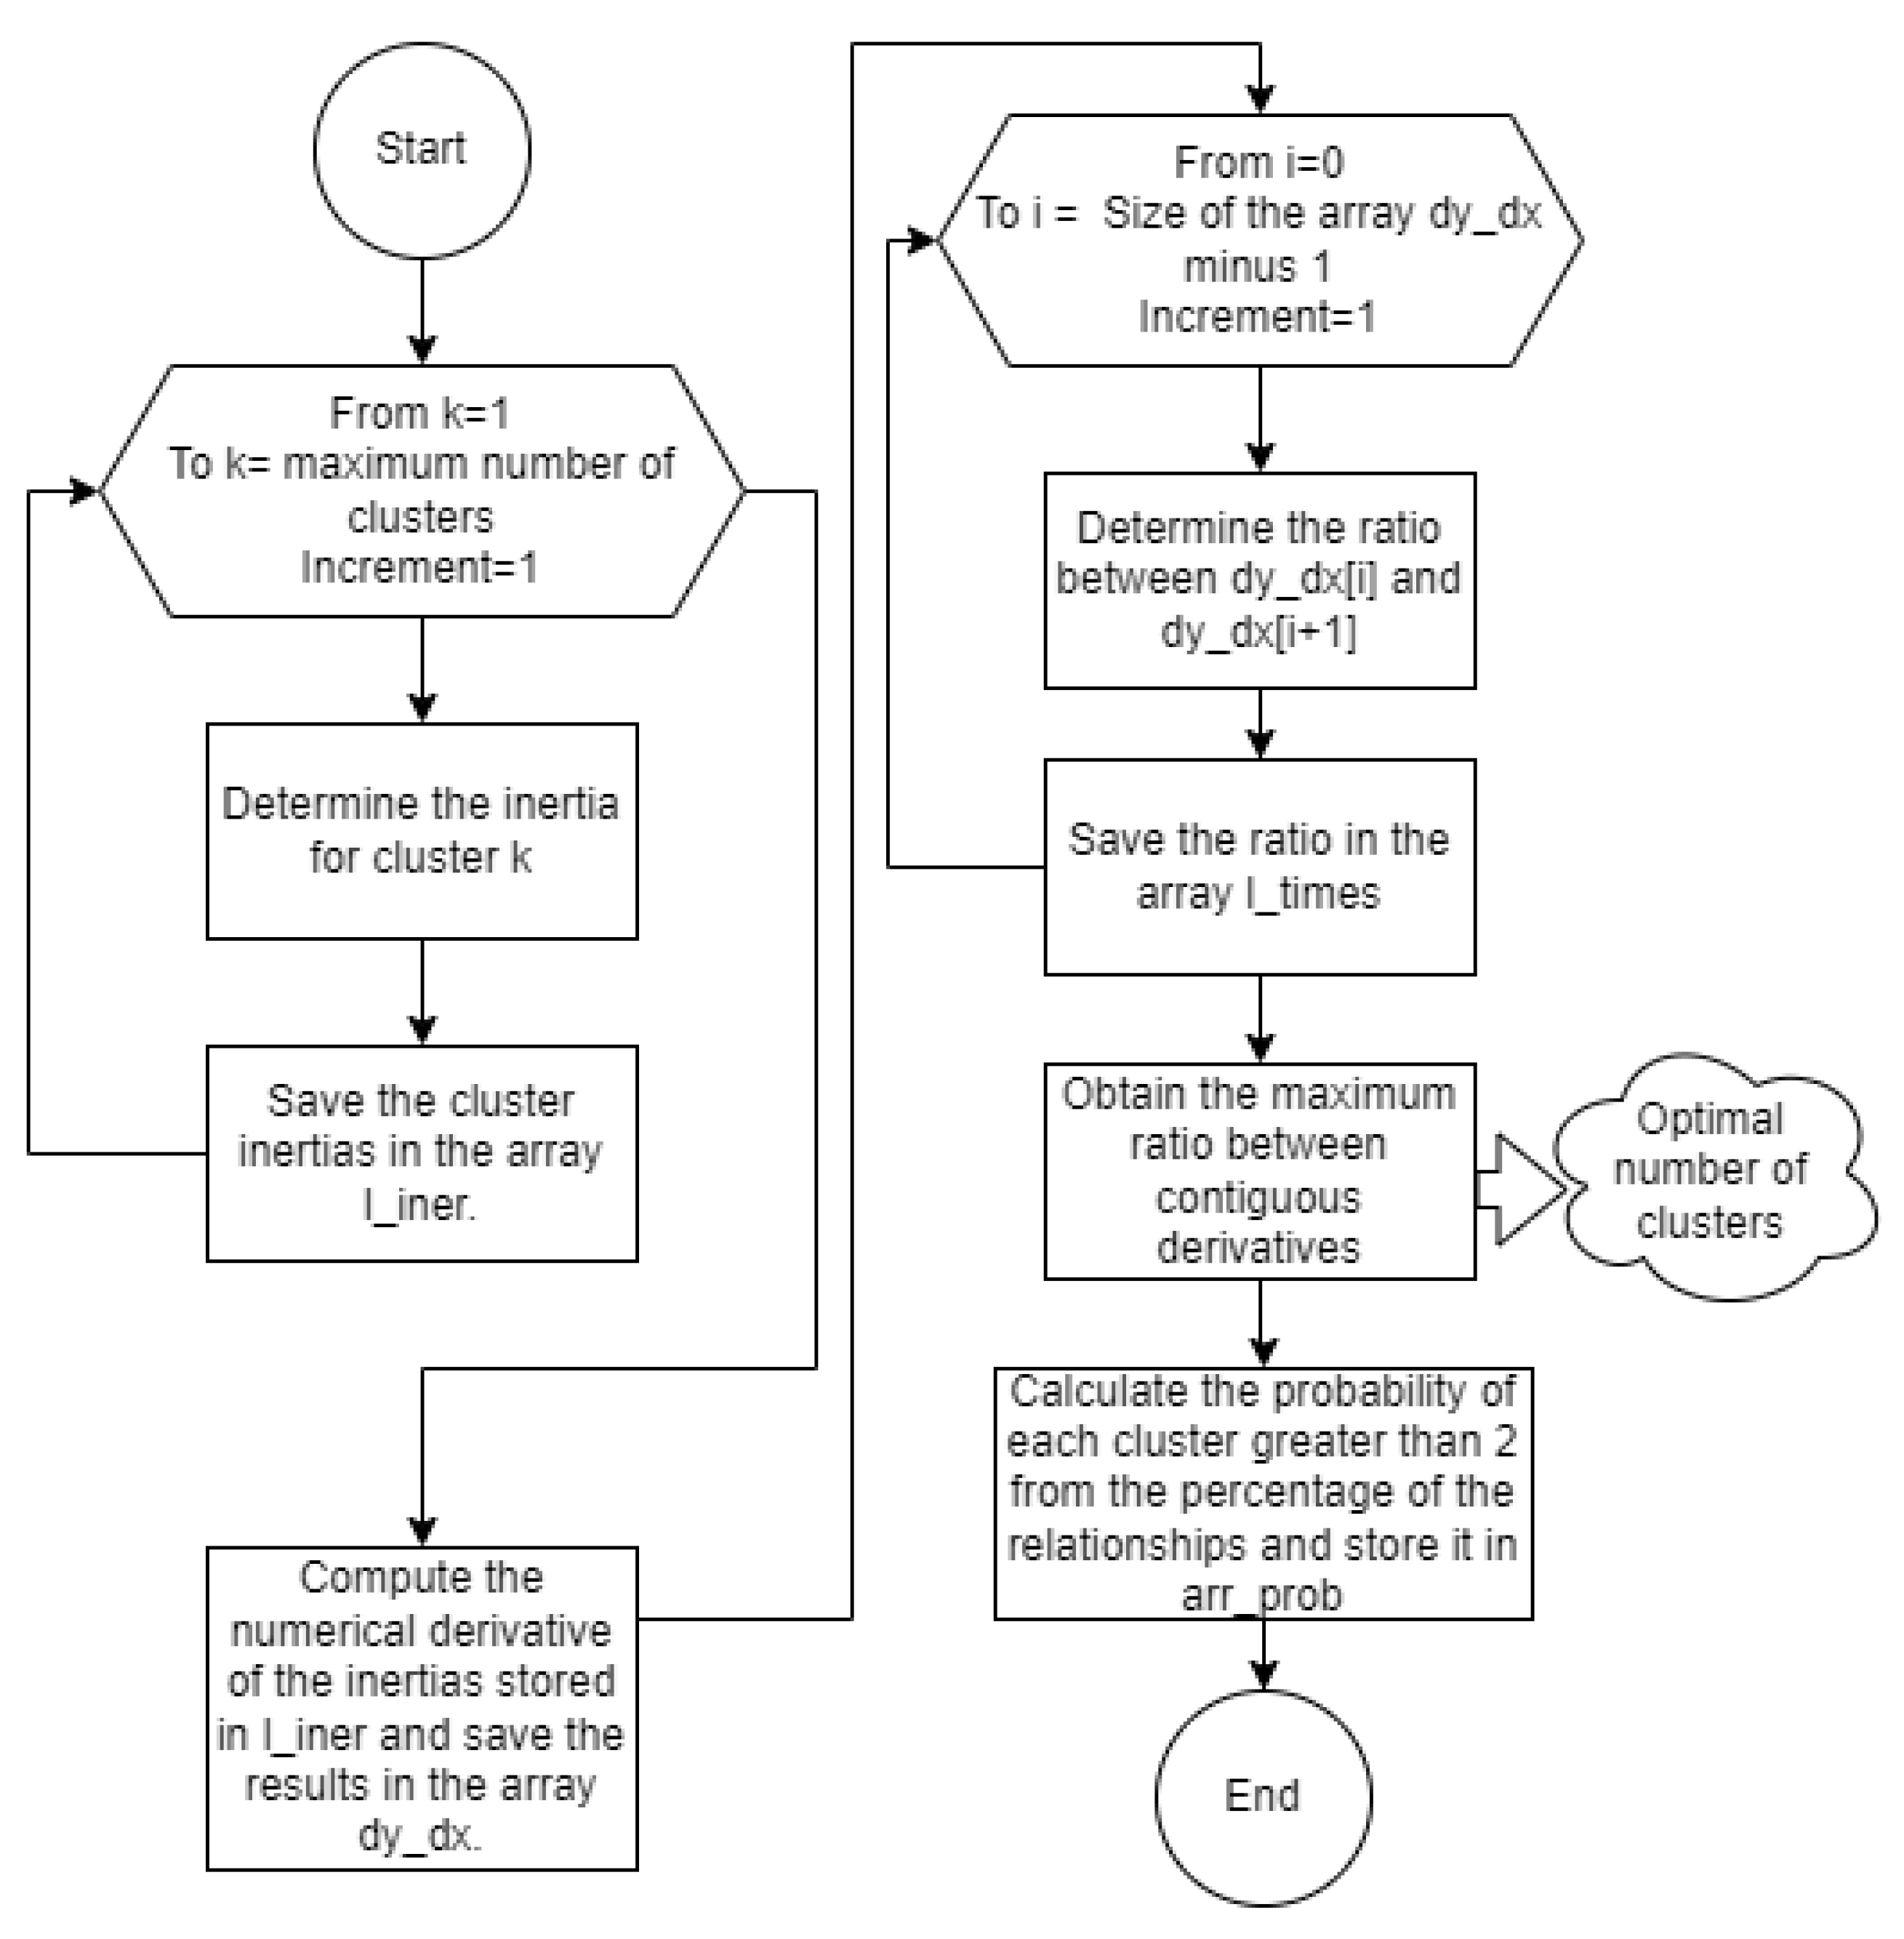
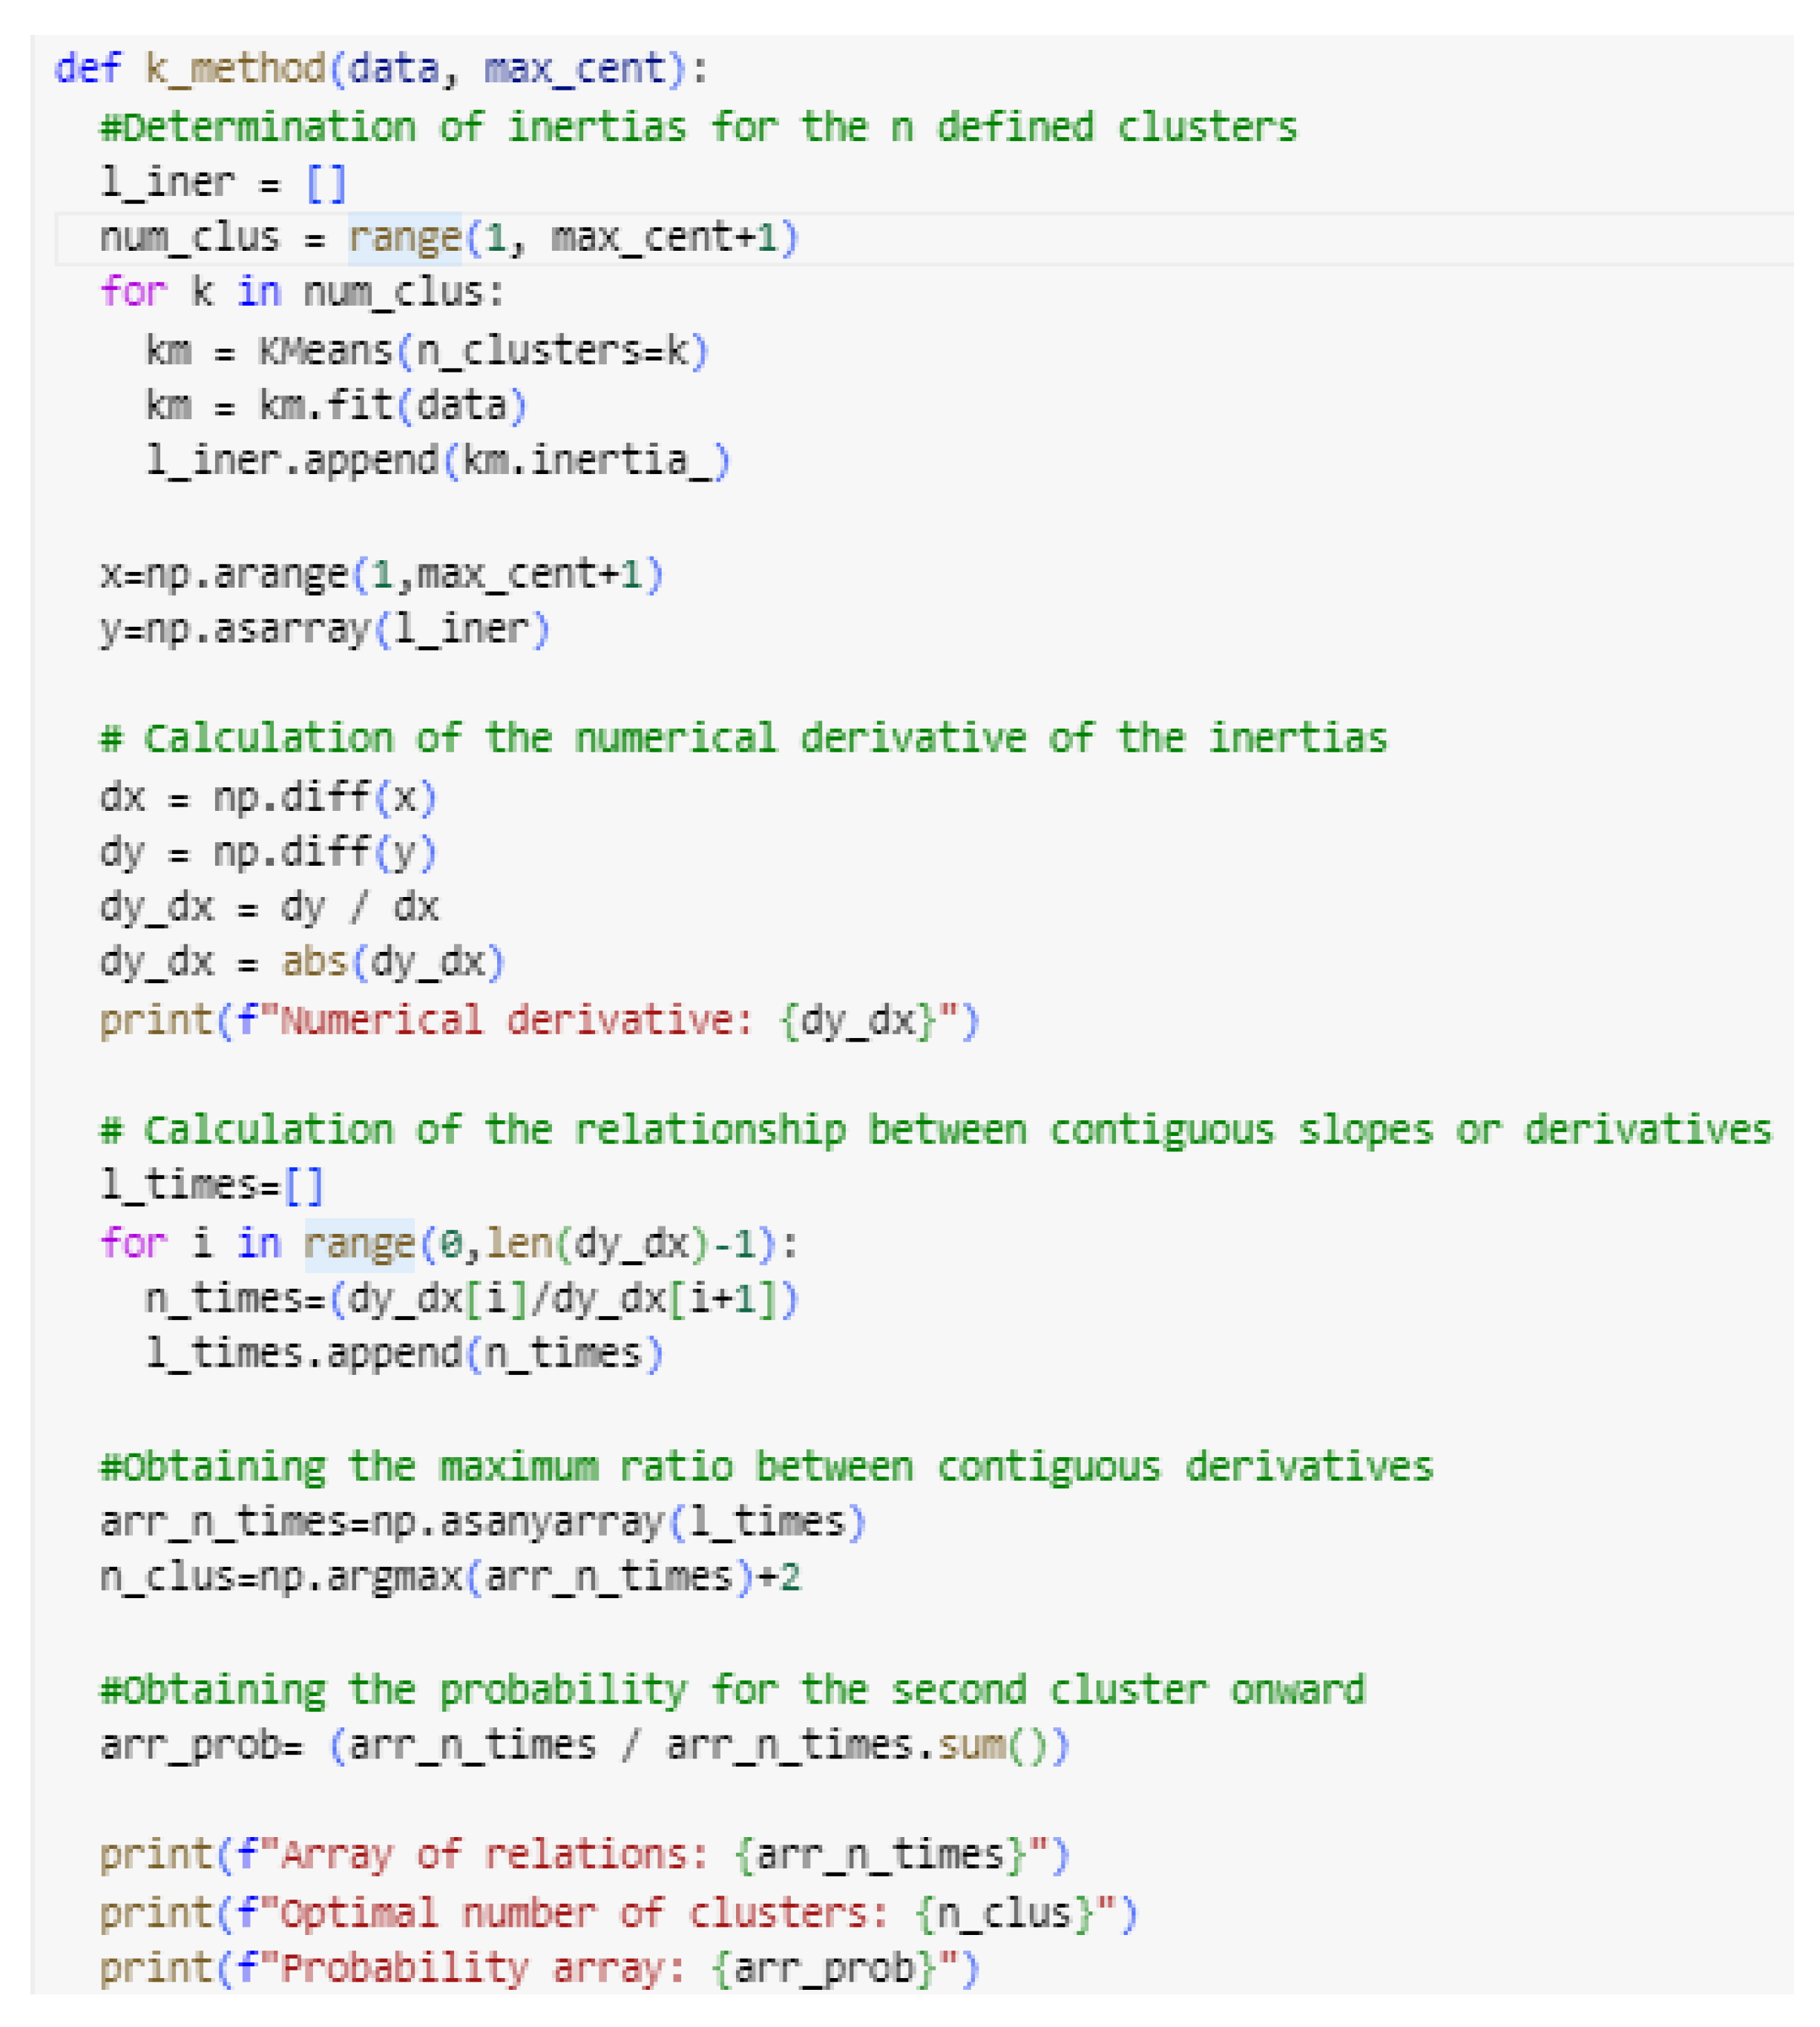
According to
Figure 4, an iteration is first performed from 1 to the maximum defined number of clusters to determine the inertia for each cluster count, with these inertia values stored in an array named l_iner. Once the different inertias for the various clusters are calculated, the method computes the numerical derivative of the values stored in the l_iner array, with the resulting derivatives stored in the dy_dx array. Subsequently, an iteration is performed over the dy_dx array from index 1 to the array's length minus 1, calculating the ratio between the derivative dy_dx[i] and the subsequent derivative dy_dx[i+1]. These ratios are then stored in the l_times array. The maximum ratio from the l_times array corresponds to the optimal number of clusters. Additionally, the selection probability for each cluster is determined based on the percentage of each ratio in the l_times array.
The method designed and presented in
Figure 4 was implemented in Python (see
Figure 5) using the sklearn and numpy libraries. The sklearn library was used to determine the inertias associated with each considered number of clusters (inertia_ attribute). Similarly, the numpy library was used to compute the numerical derivative of the cluster inertias (diff() function), as well as the maximum ratio between contiguous derivatives and the selection probability for each cluster greater than 2 (argmax() function). Additionally, it is important to highlight that the matplotlib library was used to generate the elbow and clustering graphs.
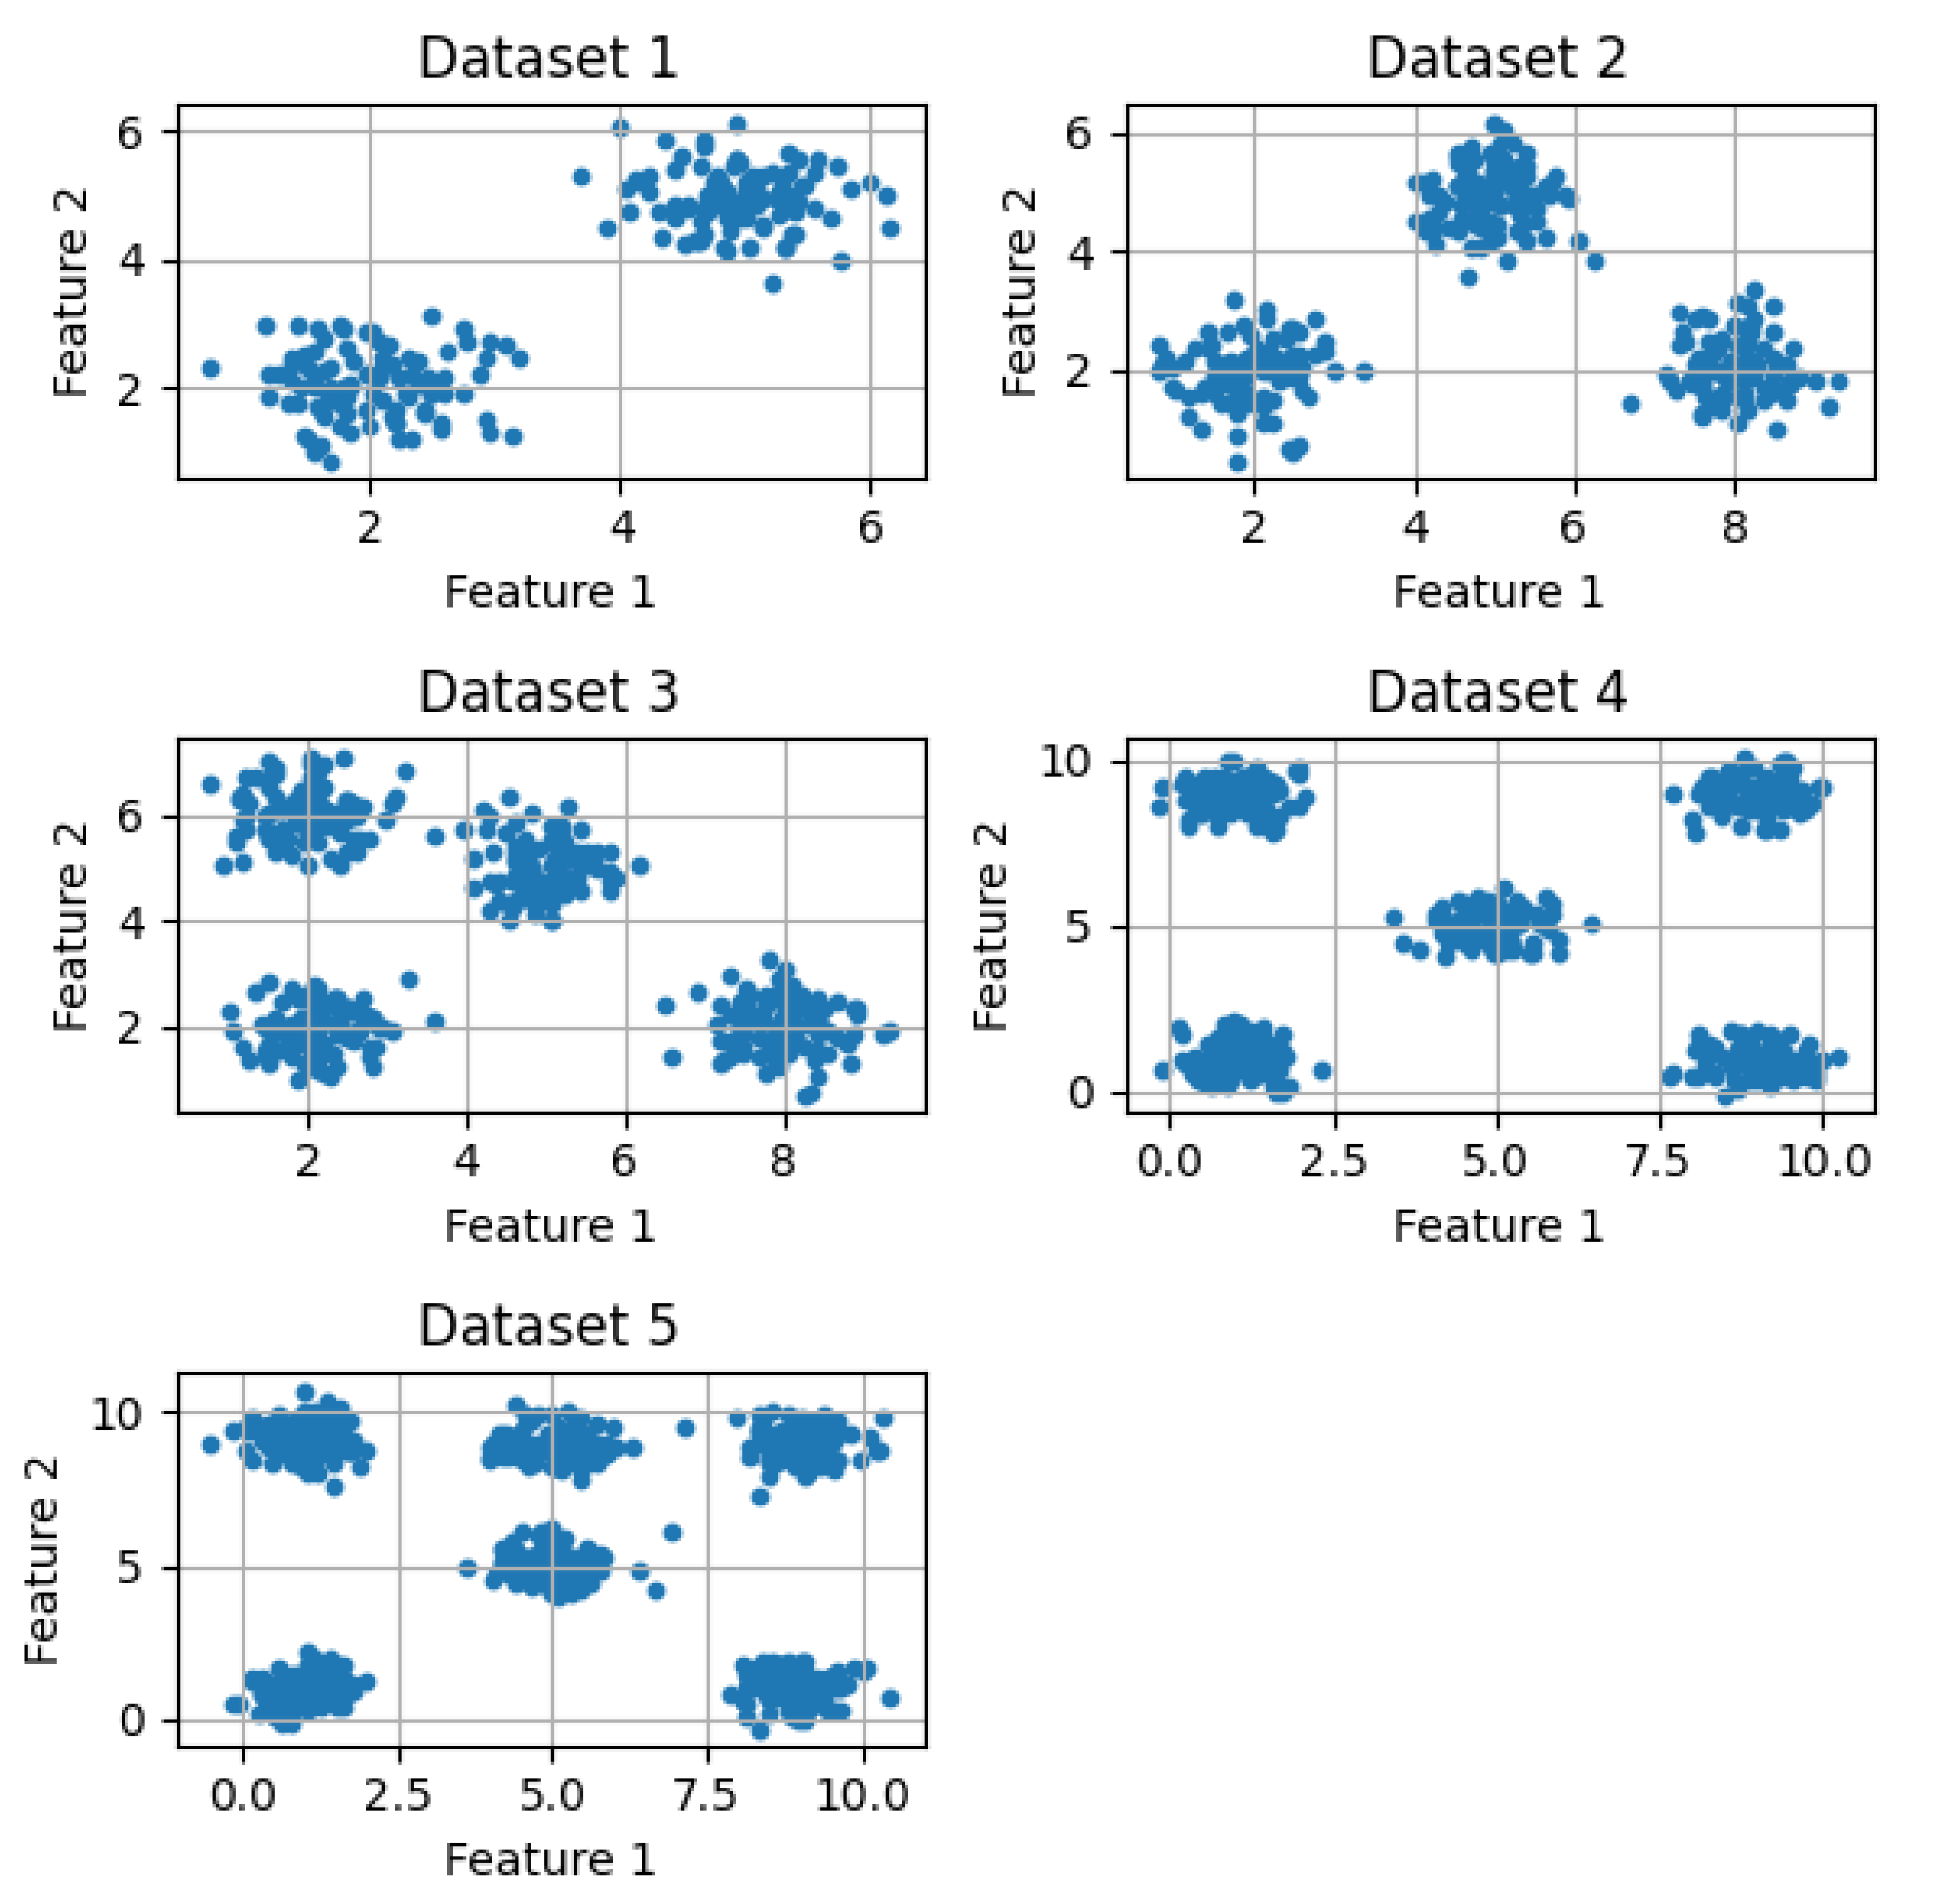
To evaluate the effectiveness of the proposed method, 5 datasets of 100 instances each were generated with the aid of AI. Each dataset shows a clear division into groups of 2, 3, 4, 5, and 6, respectively (see
Figure 6). These datasets were used to assess the proposed method, aiming to determine if the number of clusters obtained by the method matches the groups observed in each dataset.
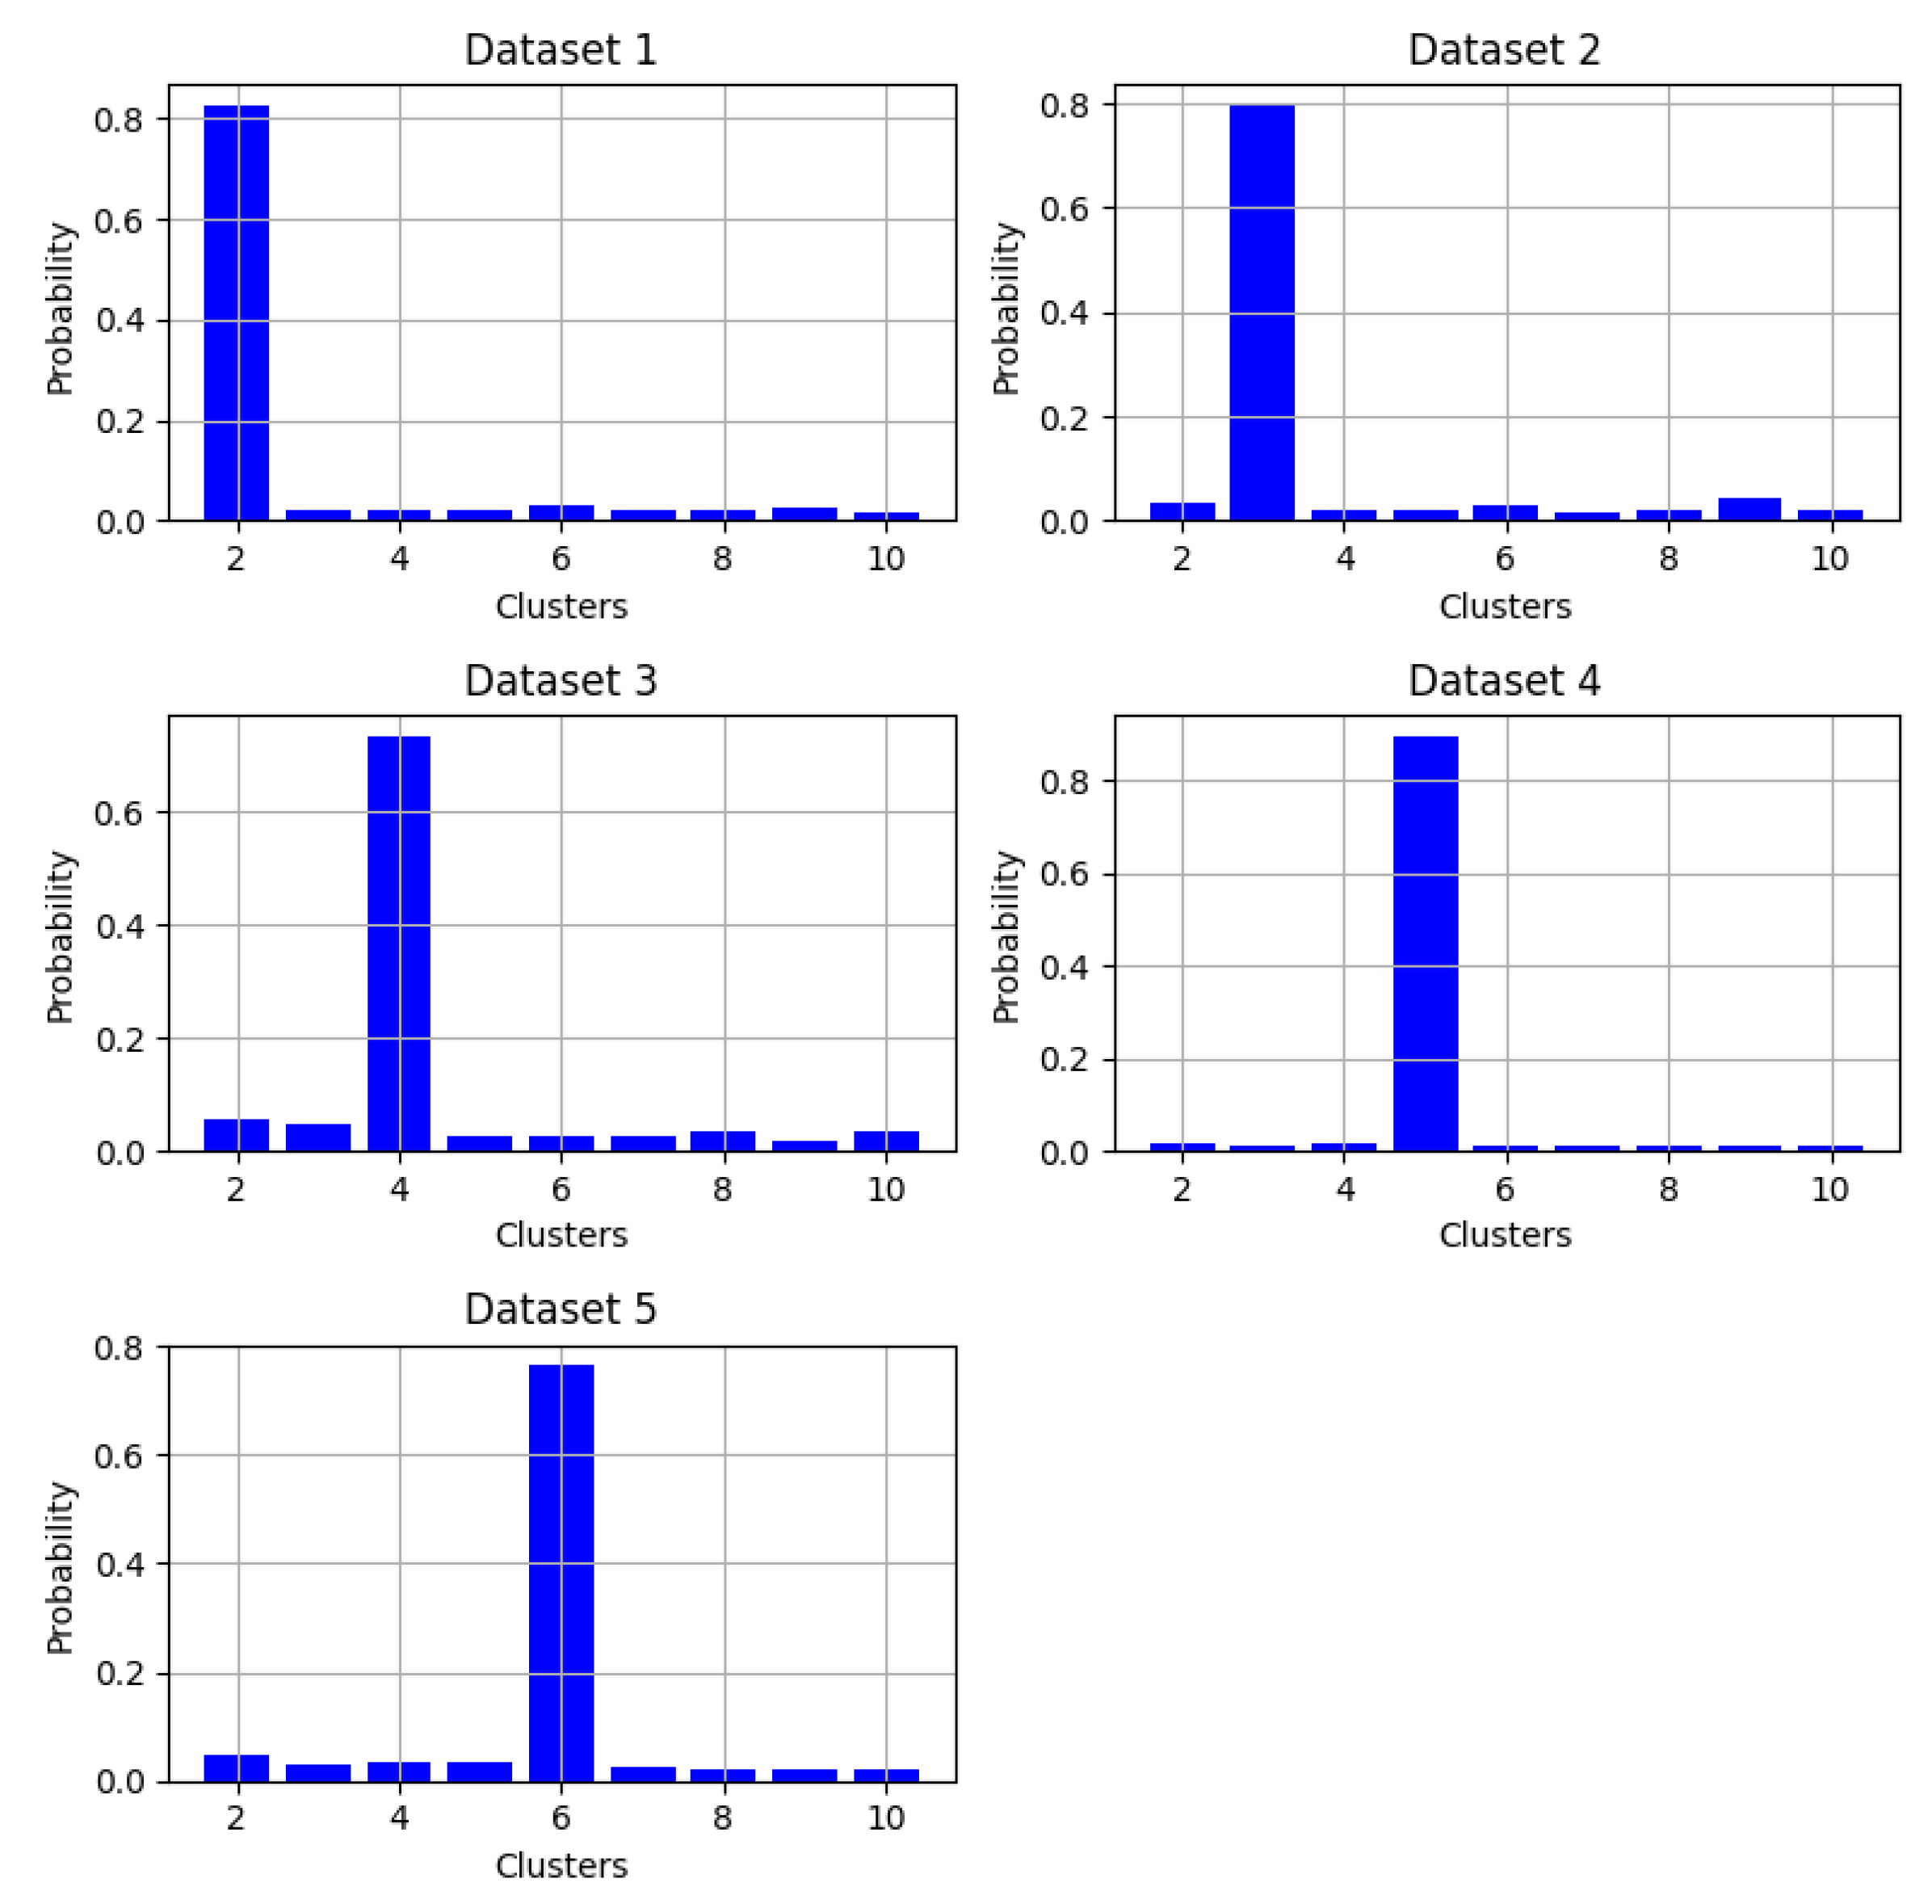
Once the validation datasets were defined, the proposed method was applied to each of them with a maximum of 10 clusters. The probability of being an optimal cluster within each dataset was determined for each cluster, yielding the results presented in
Figure 7. As shown in
Figure 7, the optimal cluster identified by the model matches the correct optimal cluster for each dataset provided by the AI, with each case achieving a probability above 0.6, while the other clusters did not exceed 0.1.
Finally, to evaluate the computational efficiency of the model, the processing time of the computational method was measured by executing it from 10 to 100 runs in the Google Colab environment (with 12.67 GB of available RAM). The resulting graph is presented in
Figure 8.
From
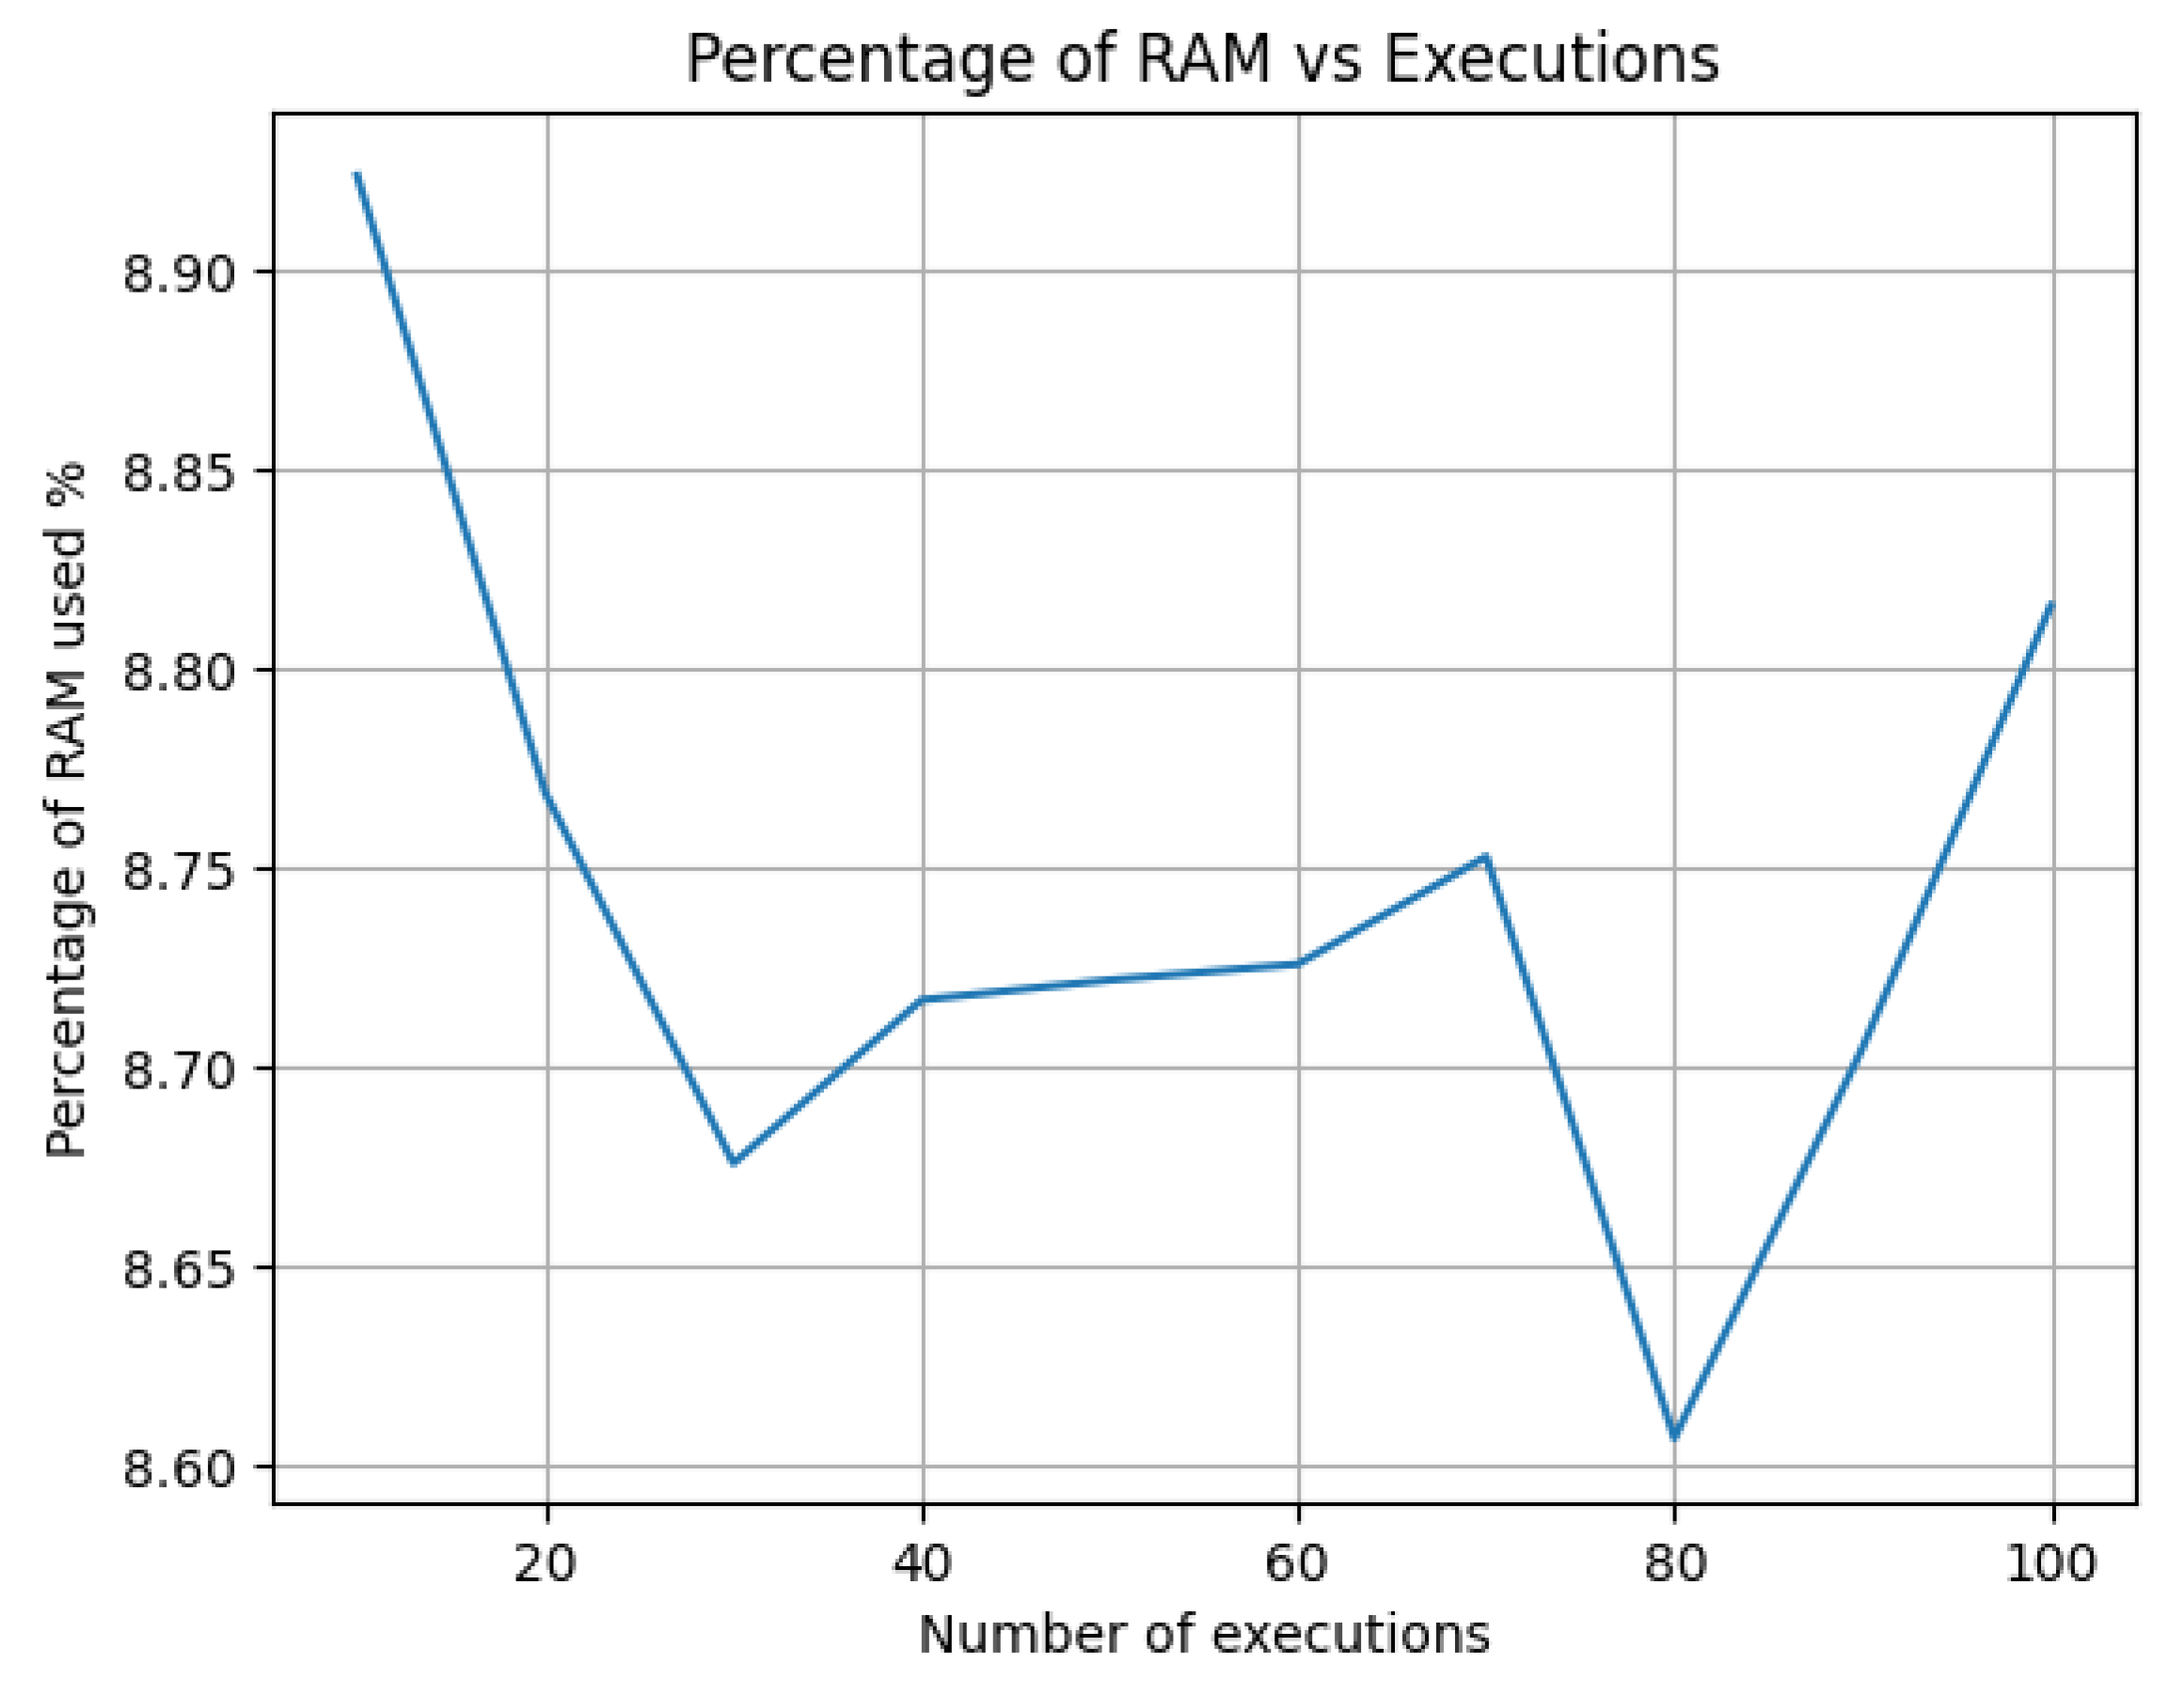
Figure 8, it can be observed that in the generic environment of Google Colab, for every additional 3 executions, the method execution time increases by approximately 1 millisecond. Additionally, when measuring the percentage of RAM usage after performing invocations in increments of 10 up to 100, it is found that the percentage of RAM remains between 8.6% and 8.9% (see
Figure 9). This allows us to conclude that the method for calculating the optimal number of clusters in KMeans does not require a significant computational load and can be executed without difficulty in generic environments such as those provided by the Google Colab platform.
As a discussion point, it is important to mention that the proposal presented in this article contributes to the issue addressed in [
25] and [
26], where it is noted that the visual inspection method of the elbow is not always an effective solution for identifying the optimal number of clusters, especially in datasets lacking clear group divisions. In this regard, the proposed method allows determining the probability that a number of clusters is optimal for a particular dataset, based on the use of numerical derivatives and the relationship between contiguous numerical derivatives. Thus, this proposal contributes to reducing subjectivity in calculating the optimal number of clusters compared to the approaches presented in [
29,
30], where the elbow method is used for obtaining the optimal number of clusters with datasets from political and marketing contexts.
4. Conclusions
One of the most widely used approaches in machine learning is unsupervised learning, which begins with an unlabeled dataset to identify relationships between instances and determine possible categories for grouping the data. In this context, one of the most popular methods in unsupervised learning is KMeans, where it is necessary to specify the number of clusters to group the data as an input parameter. Identifying the optimal number of clusters is a significant challenge. This article proposes a mathematical method that allows for a more precise determination of the optimal number of clusters compared to the visual inspection method of the elbow, which is inaccurate when the dataset does not present well-defined groups.
The method proposed in this article is based on the numerical derivative of the inertia for each cluster count and the ratio between contiguous derivatives, such that from the maximum ratio between these derivatives, it is possible to determine the optimal number of clusters. For the implementation of this method, open-source tools and/or libraries such as scikit-learn, numpy, and matplotlib were utilized, which proved to be suitable for obtaining cluster inertia, determining numerical derivatives, obtaining the maximum ratio between contiguous derivatives, and generating the corresponding graphs for clusters and the elbow method.
The proposed method was validated using 5 datasets of 100 instances, each containing well-defined groups (2, 3, 4, 5, and 6 clusters), generated by AI. The evaluation conducted enabled the determination that the optimal clusters calculated by the proposed method coincide with the groupings observed in each dataset. As an additional contribution, the method not only determines the optimal cluster but also the probability associated with each cluster being optimal.
Regarding efficiency evaluation, the conducted tests led to the conclusion that in a generic environment such as Google Colab, for every 3 method executions, the processing time increases by 1 millisecond, implying that the proposed method uses an average of around 0.3 milliseconds per execution. Similarly, when conducting a varying number of executions incremented by 10 up to 100, it was observed that the percentage of RAM usage remained between 8.6% and 8.9%. This indicates that the proposed method does not require significant computational overhead and can be executed without difficulty in generic environments like those provided by the Google Colab platform.
As a future work stemming from the present research, the first step is to implement a cloud service for identifying the optimal number of clusters in KMeans, based on the proposed computational method. Similarly, there is an intention to extrapolate the proposed method to the domain of hierarchical clustering, thereby providing an alternative to the visual dendrogram method.
Author Contributions
Conceptualization and methodology, Chanchí Gabriel ; software, validation and formal analysis, Barreto Sandra.; investigation, resources, data curation, writing—original draft preparation, Chanchí Gabriel; writing—review and editing; visualization.; supervision.; project administration.; funding acquisition, Barrera Dayana. All authors have read and agreed to the published version of the manuscript.
Funding
This research was funded by Universidad Nacional Abierta y Distancia UNAD
Data Availability Statement
All data are contained within the article.
Conflicts of Interest
The authors declare no conflicts of interest.
References
- Jessen, H.C.; Paliouras, G. Data Mining in Economics, Finance, and Marketing. 2001, pp. 295–299. [CrossRef]
- Bahari, T.F.; Elayidom, M.S. An Efficient CRM-Data Mining Framework for the Prediction of Customer Behaviour. Procedia Comput. Sci. 2015, 46, 725–731. [Google Scholar] [CrossRef]
- Miklosik, A.; Evans, N. Impact of Big Data and Machine Learning on Digital Transformation in Marketing: A Literature Review. IEEE Access 2020, 8, 101284–101292. [Google Scholar] [CrossRef]
- Seng, J.-L.; Chen, T.C. An analytic approach to select data mining for business decision. Expert Syst. Appl. 2010, 37, 8042–8057. [Google Scholar] [CrossRef]
- Erevelles, S.; Fukawa, N.; Swayne, L. Big Data consumer analytics and the transformation of marketing. J. Bus. Res. 2016, 69, 897–904. [Google Scholar] [CrossRef]
- Moubayed, A.; Injadat, M.; Nassif, A.B.; Lutfiyya, H.; Shami, A. E-Learning: Challenges and Research Opportunities Using Machine Learning Data Analytics. IEEE Access 2018, 6, 39117–39138. [Google Scholar] [CrossRef]
- Duarte, V.; Zuniga-Jara, S.; Contreras, S. Machine Learning and Marketing: A Systematic Literature Review. IEEE Access 2022, 10, 93273–93288. [Google Scholar] [CrossRef]
- Simeone, O. A Very Brief Introduction to Machine Learning With Applications to Communication Systems. IEEE Trans. Cogn. Commun. Netw. 2018, 4, 648–664. [Google Scholar] [CrossRef]
- Dong, H.; Munir, A.; Tout, H.; Ganjali, Y. Next-Generation Data Center Network Enabled by Machine Learning: Review, Challenges, and Opportunities. IEEE Access 2021, 9, 136459–136475. [Google Scholar] [CrossRef]
- Armengol, E.; Boixader, D.; Grimaldo, F. Special Issue on Pattern Recognition Techniques in Data Mining. Pattern Recognit. Lett. 2017, 93, 1–2. [Google Scholar] [CrossRef]
- ÇELİK, Ö. A Research on Machine Learning Methods and Its Applications. J. Educ. Technol. Online Learn. 2018, 1, 25–40. [Google Scholar] [CrossRef]
- Gao, Y.; Liu, Y.; Jin, Y.; Chen, J.; Wu, H. A Novel Semi-Supervised Learning Approach for Network Intrusion Detection on Cloud-Based Robotic System. IEEE Access 2018, 6, 50927–50938. [Google Scholar] [CrossRef]
- Shi, H.; Sakai, T. Self-Supervised and Few-Shot Contrastive Learning Frameworks for Text Clustering. IEEE Access 2023, 11, 84134–84143. [Google Scholar] [CrossRef]
- Usama, M.; et al. Unsupervised Machine Learning for Networking: Techniques, Applications and Research Challenges. IEEE Access 2019, 7, 65579–65615. [Google Scholar] [CrossRef]
- Ay, M.; Özbakır, L.; Kulluk, S.; Gülmez, B.; Öztürk, G.; Özer, S. FC-Kmeans: Fixed-centered K-means algorithm. Expert Syst. Appl. 2023, 211, 118656. [Google Scholar] [CrossRef]
- Kapoor, A.; Singhal, A. A comparative study of K-Means, K-Means++ and Fuzzy C-Means clustering algorithms. In Proceedings of the 2017 3rd International Conference on Computational Intelligence & Communication Technology (CICT), IEEE, Feb. 2017; pp. 1–6. [Google Scholar] [CrossRef]
- Subasi, A. Clustering examples. In Practical Machine Learning for Data Analysis Using Python; Elsevier, 2020; pp. 465–511. [CrossRef]
- Alsubaei, F.S.; Hamed, A.Y.; Hassan, M.R.; Mohery, M.; Elnahary, M.K. Machine learning approach to optimal task scheduling in cloud communication. Alexandria Eng. J. 2024, 89, 1–30. [Google Scholar] [CrossRef]
- He, J.; Jiang, D.; Zhang, D.; Li, J.; Fei, Q. Interval model validation for rotor support system using Kmeans Bayesian method. Probabilistic Eng. Mech. 2022, 70, 103364. [Google Scholar] [CrossRef]
- Sreekala, K.; Sridivya, R.; Rao, N.K.K.; Mandal, R.K.; Moses, G.J.; Lakshmanarao, A. A hybrid Kmeans and ML Classification Approach for Credit Card Fraud Detection. In Proceedings of the 2024 3rd International Conference for Innovation in Technology (INOCON), IEEE, Mar. 2024; pp. 1–5. [Google Scholar] [CrossRef]
- Sharma, T.; et al. Hierarchical Clustering of World Cuisines. In Proceedings of the 2020 IEEE 36th International Conference on Data Engineering Workshops (ICDEW), IEEE, Apr. 2020; pp. 98–104. [Google Scholar] [CrossRef]
- Syakur, M.A.; Khotimah, B.K.; Rochman, E.M.S.; Satoto, B.D. Integration K-Means Clustering Method and Elbow Method For Identification of The Best Customer Profile Cluster. IOP Conf. Ser. Mater. Sci. Eng. 2018, 336, 012017. [Google Scholar] [CrossRef]
- Dahlan, A.; Wahyu Wibowo, F. Kmeans - Chimpanzee Leader Election Optimization Algorithms-Based Data Analysis in Clustering Model. In Proceedings of the 2023 6th International Seminar on Research of Information Technology and Intelligent Systems (ISRITI), IEEE, Dec. 2023; pp. 42–46. [Google Scholar] [CrossRef]
- Rykov, A.; De Amorim, R.C.; Makarenkov, V.; Mirkin, B. Inertia-Based Indices to Determine the Number of Clusters in K-Means: An Experimental Evaluation. IEEE Access 2024, 12, 11761–11773. [Google Scholar] [CrossRef]
- Kodinariya, T.M.; Makwana, P.R. Review on determining of cluster in K-means. Int. J. Adv. Res. Comput. Sci. Manag. Stud. 2013, 1, 90–95 Available online: https://wwwresearchgatenet/publication/313554124 (accessed on 20 July 2024). Available online: https://www.researchgate.net/publication/313554124 (accessed on 20 July 2024).
- Lin, Q.; Son, J. A close contact identification algorithm using kernel density estimation for the ship passenger health. J. King Saud Univ. - Comput. Inf. Sci. 2023, 35, 101564. [Google Scholar] [CrossRef]
- Mirjalili, V.; Raschka, S. Python machine learning. Marcombo, 2020.
- Chanchì-Golondrino, G.E. Estimación del atributo de satisfacción en test con usuarios mediante técnicas de análisis de sentimientos. Prospectiva 2023, 21, 40–50. [Google Scholar] [CrossRef]
- Uddin, M.A.; et al. Data-driven strategies for digital native market segmentation using clustering. Int. J. Cogn. Comput. Eng. 2024, 5, 178–191. [Google Scholar] [CrossRef]
- Dang, Y.; et al. Discerning the process of cultivated land governance transition in China since the reform and opening-up-- Based on the multiple streams framework. Land use policy 2023, 133, 106844. [Google Scholar] [CrossRef]
|
Disclaimer/Publisher’s Note: The statements, opinions and data contained in all publications are solely those of the individual author(s) and contributor(s) and not of MDPI and/or the editor(s). MDPI and/or the editor(s) disclaim responsibility for any injury to people or property resulting from any ideas, methods, instructions or products referred to in the content. |
© 2024 by the authors. Licensee MDPI, Basel, Switzerland. This article is an open access article distributed under the terms and conditions of the Creative Commons Attribution (CC BY) license (http://creativecommons.org/licenses/by/4.0/).
