Preprint
Article

Resting-State EEG Alterations of Practice-Related Spectral Activity and Connectivity Patterns in Depression

Altmetrics

Downloads

177

Views

81

Comments

0

A peer-reviewed article of this preprint also exists.

Submitted:

26 July 2024

Posted:

30 July 2024

You are already at the latest version

Alerts
Abstract
Background: Depression presents with altered energy regulation and neural plasticity. Previous electroencephalography (EEG) studies showed that practice increases power in beta range (13-30 Hz) in healthy subjects but not in those with impaired plasticity. Here, we ascertain whether depression presents with alterations of spectral activity and connectivity before and after practice. Methods: We used publicly available resting state EEG (64 electrodes) of 122 subjects. Based on Beck Depression Inventory (BDI) score, they were assigned to either high BDI (hBDI, BDI>13, N=46) or control (CTL, BDI<7, N=75) group. We analyzed spectral activity, theta-beta and theta-gamma phase-amplitude coupling (PAC) of EEG recorded before and after a learning task. Results: At baseline, compared to CTL, hBDI group exhibited greater beta power over fronto-parietal regions and gamma over right parieto-occipital area. After practice, increases in all frequency ranges were observed only in CTL. Theta-beta and theta-gamma PAC were greater in hBDI before the task but not after the task. Conclusions: The lack of substantial post-task growth of beta power in depressed subjects likely represents power saturation due to greater baseline values. We speculate that inhibitory/excitatory imbalance, altered plasticity mechanisms, and energy dysregulation present in depression may contribute to this phenomenon.
Keywords: 
Subject: Medicine and Pharmacology  -   Neuroscience and Neurology

1. Introduction

Depression and anxiety represent major mental health concerns with their prevalence showing upward trend mostly in young subjects [1,2]. Although the clinical diagnosis remains the purview of mental health professionals, several approaches and instruments have been used to identify biomarkers and predictors of depression as well as its response to therapies. Electroencephalography (EEG) recorded at rest is a particularly cost-effective and widely accessible method for functional brain imaging. Power analysis of EEG frequency bands in individuals with depression can yield insightful results. Notably, a debated EEG correlate of major depression is the frontal asymmetry in the alpha range, that is, the unequal activation of the two hemispheres [3] often associated with altered emotional processing and regulation.
A series of works now supports the hypothesis that depression could be described as a network disorder with particular emphasis on metabolic regulation, synaptic plasticity, and excitatory/inhibitory balance [4,5,6]. In this respect, there is cumulating evidence that depression is characterized by: i) an imbalance of excitation and inhibition processes [7,8,9]; ii) plasticity alterations [10,11,12]; and iii) dysregulation of energy mechanisms [5], a dysfunction that has direct effects on both excitation/inhibition balance and plasticity. The impaired energy balance in depression has been substantiated by findings of brain lactate increases in these patients [13,14] and by the fact that lactate increases are coupled with mitochondrial dysfunction [15,16,17,18]. Direct evidence of elevated lactate levels in depressed patients has been reported in the ventricular CSF [19,20] and in the anterior cingulate [21] using magnetic resonance spectroscopy (MRS). However, MRS limited availability and high costs preclude its use for extended studies and clinical appplication in depression.
Recent evidence suggests that EEG beta frequency band may have a metabolic meaning, as its power magnitude directly correlates with high levels of cerebral lactate concentration [22,23], and thus with energy mechanisms involved in long-term potentiation (LTP) processes. Indeed, we found in normal subjects that local levels of beta power during resting wake increase immediately after a visuo-motor learning task over the areas previously involved in the learning activity [24]. Importantly, such beta power increases vanish after either quiet wake or sleep [24,25], in agreement with the animal findings of lactate concentration decrements during quiet wake [22]. Further support for the association between energy dysregulation and beta power comes from studies in patients with Parkinson’s disease showing that the levels of beta power are greater than in normal controls and do not increase with practice [26]. Parkinson’s disease is a disorder that often presents with depressive symptomatology and is characterized by impaired LTP processes and energy dysregulation [27,28,29], similarly to depression. Therefore, we hypothesize that the EEG during resting state will show greater beta power in subjects with depression than in normal controls and display significant increases of beta power following practice in a task in controls but not in subjects with depression.
In this study, we took advantage of a publicly available dataset of EEG recorded during quiet wake in two groups of college students, one with normal Beck Depression Inventory (BDI) scores and the other one with high BDI scores [30,31]. We analyzed the EEG recordings collected before and after performance in a probabilistic learning task.

2. Materials and Methods

2.1. Subjects, Task and Experimental Design

The dataset used for this study was retrieved from the open-access data archive OpenNeuro (https://openneuro.org/datasets/ds003478/versions/1.1.0) and included clinical data and raw resting EEG recordings from 122 college students [30,31]. Participants were recruited based on a mass survey with BDI [32] conducted at the University of Arizona. General criteria to enter the study were: i) age between 18 and 25 years; ii) no history of seizures or head trauma; and iii) no current use of medications with psychoactive effects. Before the experimental procedure, subjects were clinically re-assessed with the Electronic Mini International Neuropsychological Interview and were classified as belonging to one of two groups. Participants without a history of major depressive disorders, BDI scores<7 at both the initial and subsequent assessment, and without symptoms suggesting an Axis I disorder were included in the control group (CTL, N=75, mean age: 19±1.21; 40 women). Individuals with high BDI scores (>13) at the two testing points were included in the high BDI (hBDI) group (N=46, mean age: 19±1.14, 34 women). In addition to BDI, all participants completed the Spielberger Trait Anxiety Inventory (TAI)[33] and the Behavioral Inhibition Scale/Behavioral Activation Scale (BIS/BAS), a measure of reward and punishment reactivity [34].
EEG recordings were acquired at rest before and after a probabilistic learning task [30,31]. The probabilistic learning task is fully described by Cavanagh and colleagues [30,31]. Briefly, after the baseline EEG recording, participants completed two runs of a compulsory choice probabilistic learning task training and a testing phase [35]. During the training, three pairs of Japanese Hiragana characters were displayed; each pair of stimuli was linked to a probability of receiving a "Correct" or "Incorrect" feedback of 80%/20%, 70%/30%, or 60%/40%. Each presentation lasted from 4300 to 4700 ms and the stimuli disappeared upon the participant's response. Feedback was provided 50 to 100 ms after the response during this training phase but not during the test. During the test phase, all possible combinations of stimuli pairs were presented eight times for a total of 120 trials.
As reported by Cavanagh and colleagues [30,31], the project and the consent forms were approved by the local IRB. Each participant provided written informed consent before entering the study.

2.2 EEG Data Acquisition and Preprocessing

Scalp EEG recordings were recorded for 6 minutes (3 minutes eyes open, EO, and 3 minutes eyes closed) using a Synamps2 system with 64 Ag/AgCl electrodes (band-pass filter: 0.5–100 Hz, sampling rate: 500 Hz, impedances <10 kΩ). The online reference was a single electrode placed between Cz and CPz) [31]. EEG recordings were performed before and after one-hour training and testing of probabilistic task. After downloading the publicly available raw data, we preprocessed the EEG signal only for the eyes open condition using the public MATLAB toolbox EEGLAB (version 2022) [36]. The continuous EEG signal was filtered using a Finite Impulse Response Filter (FIR) from 1 to 90 Hz and Notch filtered from 56 to 64 Hz to remove power line noise. The signal was then visually inspected to remove channels with poor signal quality. Independent Component Analysis (ICA) was run using the Infomax algorithm to identify eye blinks and horizontal eye movements, high-frequency muscular activity, heartbeat, and other periodic EEG artifacts. Component rejection was performed automatically using the EEGLAB toolbox IC Label, which automatically provides a proportion (in %) of independent components identified in EEG data that are classified into specific categories based on their characteristics [37]. Components labeled as Muscle (50-100%), Eye (80-100%), Heart (80-100%), and Line noise (80-100%) were rejected from the signal, resulting in an average of 36±13.32 components kept per subject. Electrodes with bad signal quality were reconstructed using spherical spline interpolation and the signal was re-referenced on the average channel activity. Subsequent analyses were carried out using custom data analysis scripts using the MATLAB-based Fieldtrip Toolbox [38].

2.2.1. Spectral Current Density Analyses

The preprocessed data was transformed by applying the Fieldtrip current source density (CSD) algorithm to estimate the current flow underlying an EEG topography and reduce the impact of volume conduction on scalp-recorded data. After spatial filtering, the spectral profile for both the pre-task and post-task activity was estimated via Fast-Fourier transform (multi-taper FFT with Hanning window) (from 1 to 90 Hz, 0.5 Hz bins). In addition to the “original” spectral power, we determined the distinct contributions of the oscillatory and fractal components. We thus decomposed the signal using Irregularly Resampled Auto Spectral Analysis (IRASA) [39]. This technique allows for the analysis of the “fractal background” (i.e., 1/f distribution of a time series) that reflects the background overall brain activity without specific rhythmic patterns. For the “original”, fractal, and oscillatory signals, statistical analyses were conducted on the theta (4-8 Hz), alpha (8.5-13 Hz), beta (13.5-25.5 Hz), gamma (30-90 Hz), low gamma (30-55 Hz), and high gamma (65-90 Hz) frequency ranges. We further parametrized the fractal, scale-free, signal component by computing the Power-Law Exponent (PLE). For each participant, the fractal component was thus transformed in log-log coordinates and the distribution slope was computed for each channel using the MATLAB linear regression function fitlm, resulting in a single beta coefficient per channel.

2.2.2 Phase-Amplitude Coupling (PAC)

In addition to the analysis of brain oscillatory activity and the distinct contributions of periodic and scale-free signals, we explored differences in functional connectivity to better understand how low-frequency and high-frequency oscillatory activity coordinate information processing in the brain. We first analyzed phase-amplitude coupling (PAC) between the phase of theta and the amplitudes of beta and gamma oscillations, and computed the modulation index (MI) [40]. The selected bandwidth for both beta (11.5 Hz, ranging from 13.5 to 25 Hz) and gamma amplitude estimation (50 Hz, ranging from 30 to 80 Hz) exceeds the highest frequency within the theta phase band (4-8 Hz). This ensures a robust detection of PAC according to the criteria that the amplitude bandwidth should at least match the peak phase frequency. PAC estimation first involved filtering the signal using a two-way Butterworth Filter and then its Hilbert transformation. As described by Tort and colleagues [40], we assessed PAC by dividing the phase (0-360°) into 18 segments and calculating the average amplitude for each segment, adjusted by the mean amplitude across all segments. As displayed in the formula below, the MI is derived by contrasting the observed amplitude-phase distribution (P) with a theoretical uniform PAC distribution (Q) using the Kullback-Leibler distance (D) grounded in the principles of Shannon's entropy.
M I = D ( P , Q ) / l o g ( N b i n s )
PAC values were computed individually for each subject, trial, and channel, and subsequently averaged to derive a single modulation index (MI) value per amplitude and phase for each channel.

2.3 Statistical Analyses

2.3.1 Clinical Measures

We used the following clinical outcome measures: BDI scores, including its anhedonia and melancholia subscales; STAI scores; BIS scores with the reward, fun-seeking, and drive subscales; and BAS scores. Differences between the hBDI and CTL groups were assessed with non-parametric independent samples Mann-Whitney tests. Spearman correlation analyses were used to explore possible relationships between clinical scores, demographic variables, and EEG-derived measures. Finally, logistic regression analysis was performed to investigate whether BIS/BAS domains could serve as predictors of depressive symptomatology.

2.3.2 Task Performance Accuracy

We obtained the task performance data from the first author of the original studies [30,31]. We averaged the mean accuracy for the two runs of the training and test phases to check for group differences with Mann-Whitney tests. Spearman correlation analyses were run between task accuracy and changes in resting state EEG activity.

2.3.3 Spectral Current Density Analyses

We first examined pre-task resting-state EEG activity to identify baseline differences between the two groups. Then, we conducted a similar comparison of post-task activity between the two groups. Finally, we investigated the impact of probabilistic learning practice on post-task activity in the two groups separately (post-task vs. pre-task). In all cases, we assessed whether significant differences were present from the original, periodic, and fractal components of the signal.
Statistical analyses on the original (or mixed) spectral power, the oscillatory, the scale-free components, and the extracted PLE values were thus computed using the non-parametric Monte Carlo-based permutation procedure as implemented in Fieldtrip [41]. At the first level of analysis, the null hypothesis that the two groups are equal (hBDI vs CTL, independent t-test) was tested using a critical alpha of 0.05 and a minimum number of two neighboring electrodes to form a cluster. The second-level cluster-level statistic was computed using the sum of the t values within each cluster of electrodes. The maximum statistic value from the cluster-level analysis was finally compared using the Monte Carlo method with a distribution of maximum cluster values obtained after 10,000 permutations.

2.3.4 PAC

Differences in theta-beta MI and theta-gamma MI strength between the hBDI and CTL groups, as well as changes with learning practice, were assessed using non-parametric cluster-based permutation testing (10,000 permutations, alpha=0.05). As for the spectral analyses, initial comparisons were made between pre-task MI values across the two groups. Then, practice-related changes in functional connectivity (post vs. pre-task) within each group were evaluated, and subsequent comparisons examined post-task changes between the two groups.

3. Results

Age and tests’ score for the two groups are summarized in Table 1. Briefly, as noted in the Methods, the hBDI group, which included a higher percentage of women (34 women out of 46 participants, 74%) than the CTL group (40 out of 75, 54%), had greater scores for BDI, TAI, and BIS. No significant group differences were observed for all BAS scores. We found no difference between men and women for all the clinical tests’ scores.
BDI scores displayed a very strong positive correlation with TAI (ρ=0.83, p<0.001; confidence intervals (CI): 0.87, 0.75), and a moderate correlation with BIS scores (ρ=0.49, p<0.001; CI: 0.63, 0.32). TAI scores positively correlated with BIS scores (ρ=0.61, p<0.001; CI: 0.71, 0.48) and, to a lesser extent, negatively correlated with BAS scores (ρ=-0.18, p=0.047; CI: -0.00083, -0.35).
Logistic regression analysis showed that the BIS score was a good predictor of acute depressive symptomatology (X2=27.51, p<0.001; Wald stat= 20.24, p<0.001; AUC=0.77; Accuracy=0.75; Sensitivity=0.56; Specificity=0.87), with greater sensitivity when the analysis was restricted to women (CTL: N=39; hBDI: N=33; X2=18.65, p<0.001; Wald stat= 13.49, p=0.0002; AUC=0.77; Accuracy=0.74; Sensitivity=0.70; Specificity=0.77).

3.1. At Baseline, hBDI Displays Greater Beta and Gamma Oscillatory Activity Than CTL

We first analyzed the EEG collected at baseline before the probabilistic learning task. Cluster-based permutation statistics on the “original” spectral activity highlighted significant differences between the two groups in both beta and gamma frequency ranges (Figure 1, first column, see also Suppl Figure 1 and Figure 2A). Specifically, compared to the CTL, the hBDI group displayed greater beta power in a cluster of electrodes located over the frontal region (Cluster t=25.81, p=0.028), and greater gamma power in two clusters, one over the central midline (Cluster t=23.70, p=0.021) and the other one over the occipital region (Cluster t=21.14, p=0.023). No significant group differences were observed for the other frequency ranges. Analysis of the individual beta and gamma frequency peaks in the significant clusters were similar in the two groups (beta, hBDI: 16.53±3.51 Hz, CTL: 16.84±3.30 Hz; W=1753, p=0.45; gamma, hBDI: 31.98±5.53 Hz, CTL: 32.83±7.89 Hz, W=1823, p=0.23), suggesting that the greater beta and gamma activity we found in hBDI is not due to a shift in frequency peaks.
We then focused on the two EEG components obtained with IRASA. The analysis of the pure oscillatory component isolated from the fractal (Figure 1, second column, see also Suppl. Figure 1 and Figure 2B) confirmed greater beta oscillatory activity over fronto-parietal areas in the hBDI group (Cluster t=125.41, p=0.004), as well as greater gamma activity over the right parieto-occipital region (Cluster t=19.98, p=0.023). Furthermore, the hBDI group displayed lower alpha activity in a cluster of electrodes over the right frontal (Cluster t= -27.76, p=0.016) and left temporal (Cluster 2: t=-6.31, p=0.040) scalp regions.
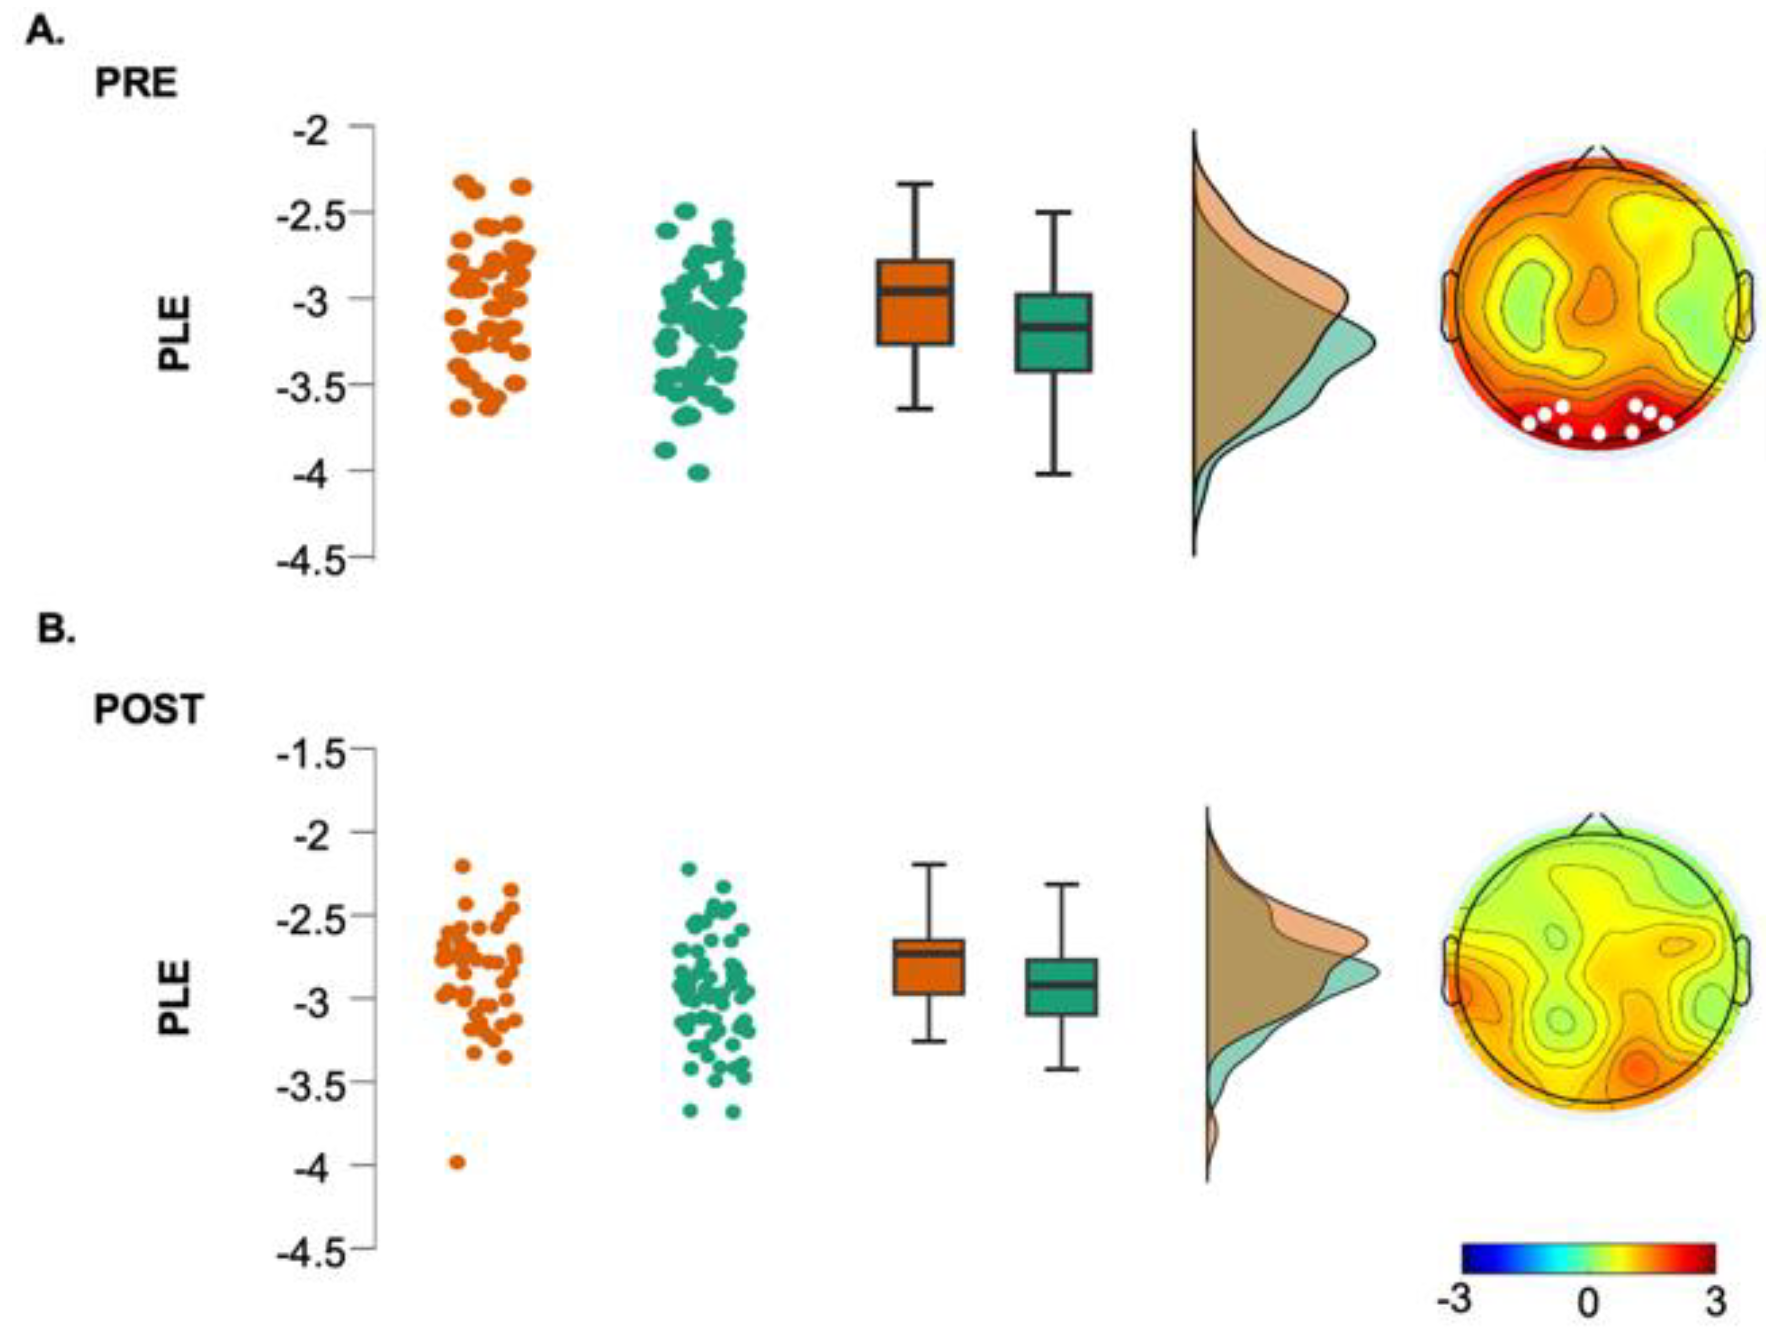
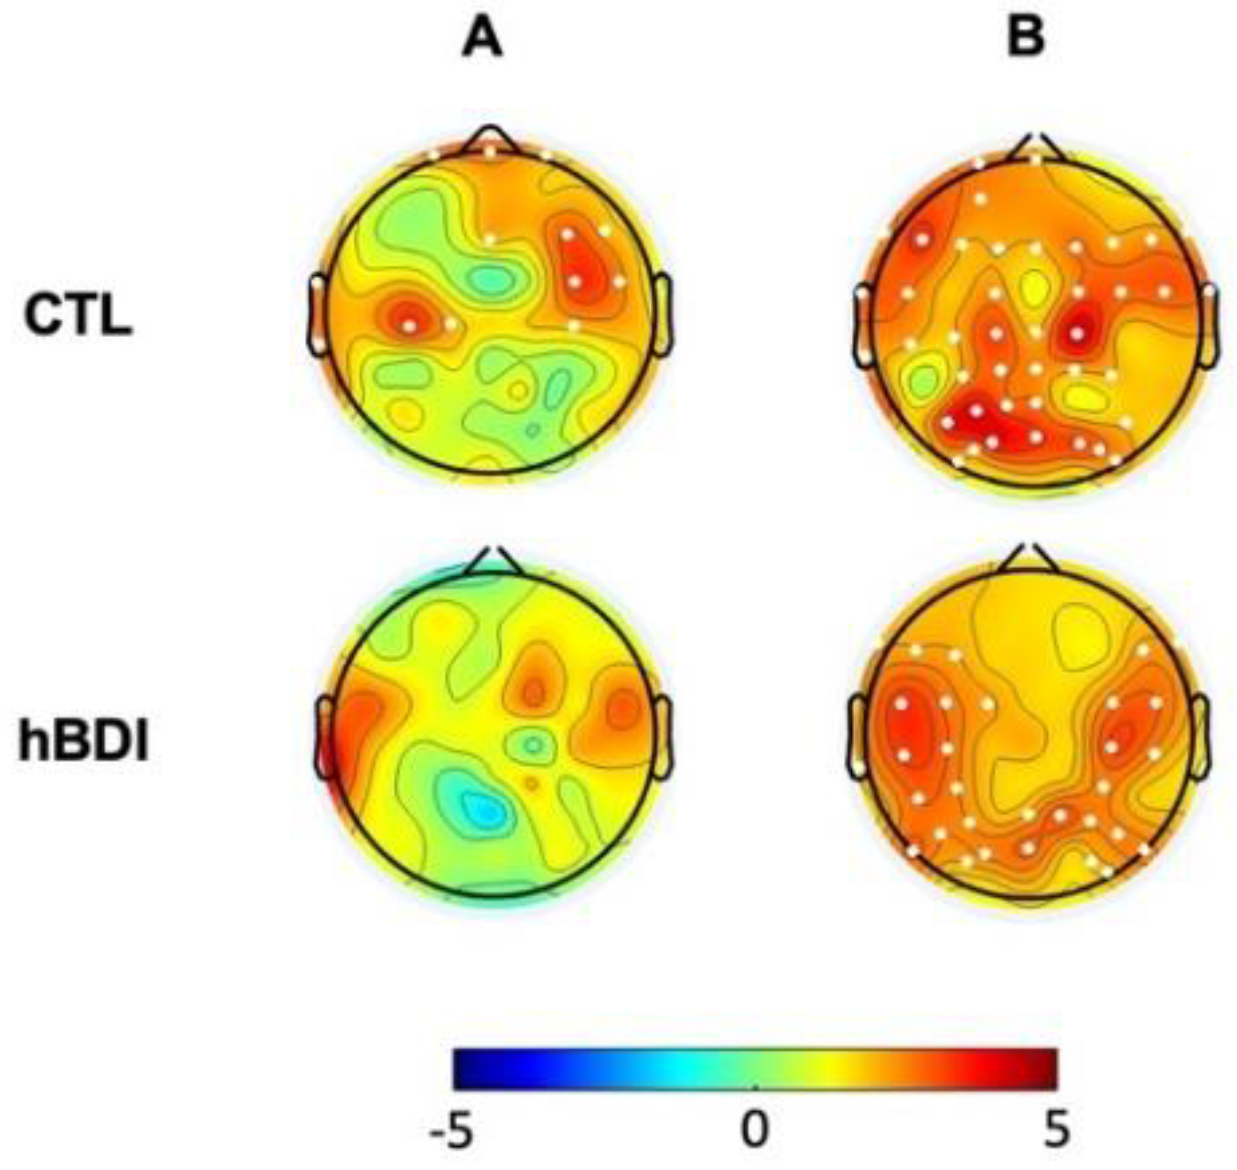
Regarding the fractal component, group differences were found only for the gamma range (Cluster t = 74.22, p=0.003), with greater values for the hBDI group in midline and parieto-occipital electrodes (Figure 1, third column, see also Suppl. Figure 1 and Figure 2C). Cluster-based analysis of the PLE index highlighted a significant group difference bilaterally over the parieto-occipital area (Cluster t= 24.18, p=0.03), with hBDI having a reduced slope compared to the CTL (Figure 2A).
In summary, we found that the baseline EEG of the hBDI group was characterized by greater activity in the high frequency ranges (beta and gamma) than the CTL’s, mostly over fronto-parietal regions, with minor discrepancies between the original oscillatory, pure oscillatory, and fractal components. We did not find any significant correlation between original, oscillatory, and fractal components and the clinical measures for each of the two groups.

3.2 The hBDI Group Displayed Greater Theta-Beta and Theta-Gamma PAC

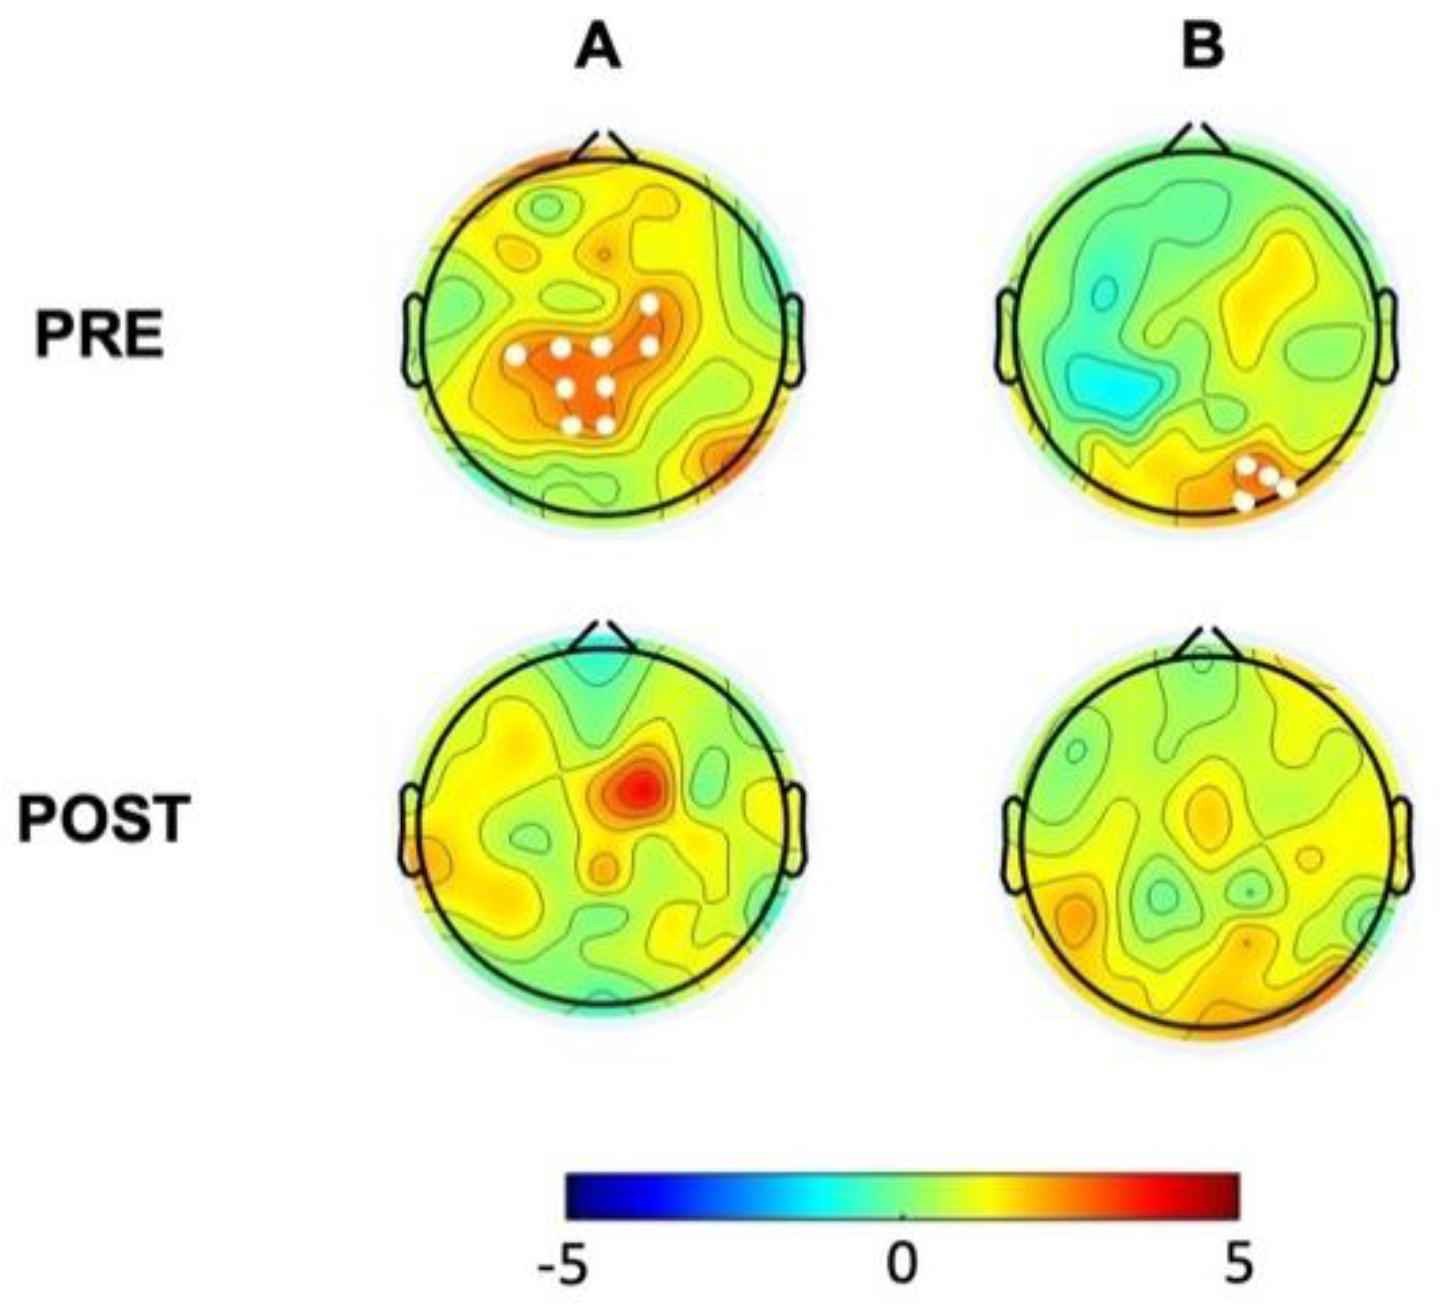
We then analyzed PAC for theta-beta and theta-gamma by extracting the corresponding MI in the baseline EEG recordings. Non-parametric permutation analyses demonstrated increased theta-beta coupling mostly over a centro-parietal cluster (T=23.16; p=0.0175) (Figure 3A, first line) and greater theta-gamma coupling over the right occipital areas (T=10.12; p=0.048) in the hBDI group compared to the CTL group (Figure 3B, first line).

3.3 EEG activity at Rest Changes After One-Hour Task Practice

After the baseline EEG, all subjects underwent two blocks of training and testing in a probabilistic learning task. The performance of the two groups was similar in both the training (CTL: mean±SD: 68+9%; hBDI: 68±10%; Mann-Whitney U=1755, p=0.87) and the test (CTL: 65±9%; hBDI: 67±10%; U=1776, p=0.79).
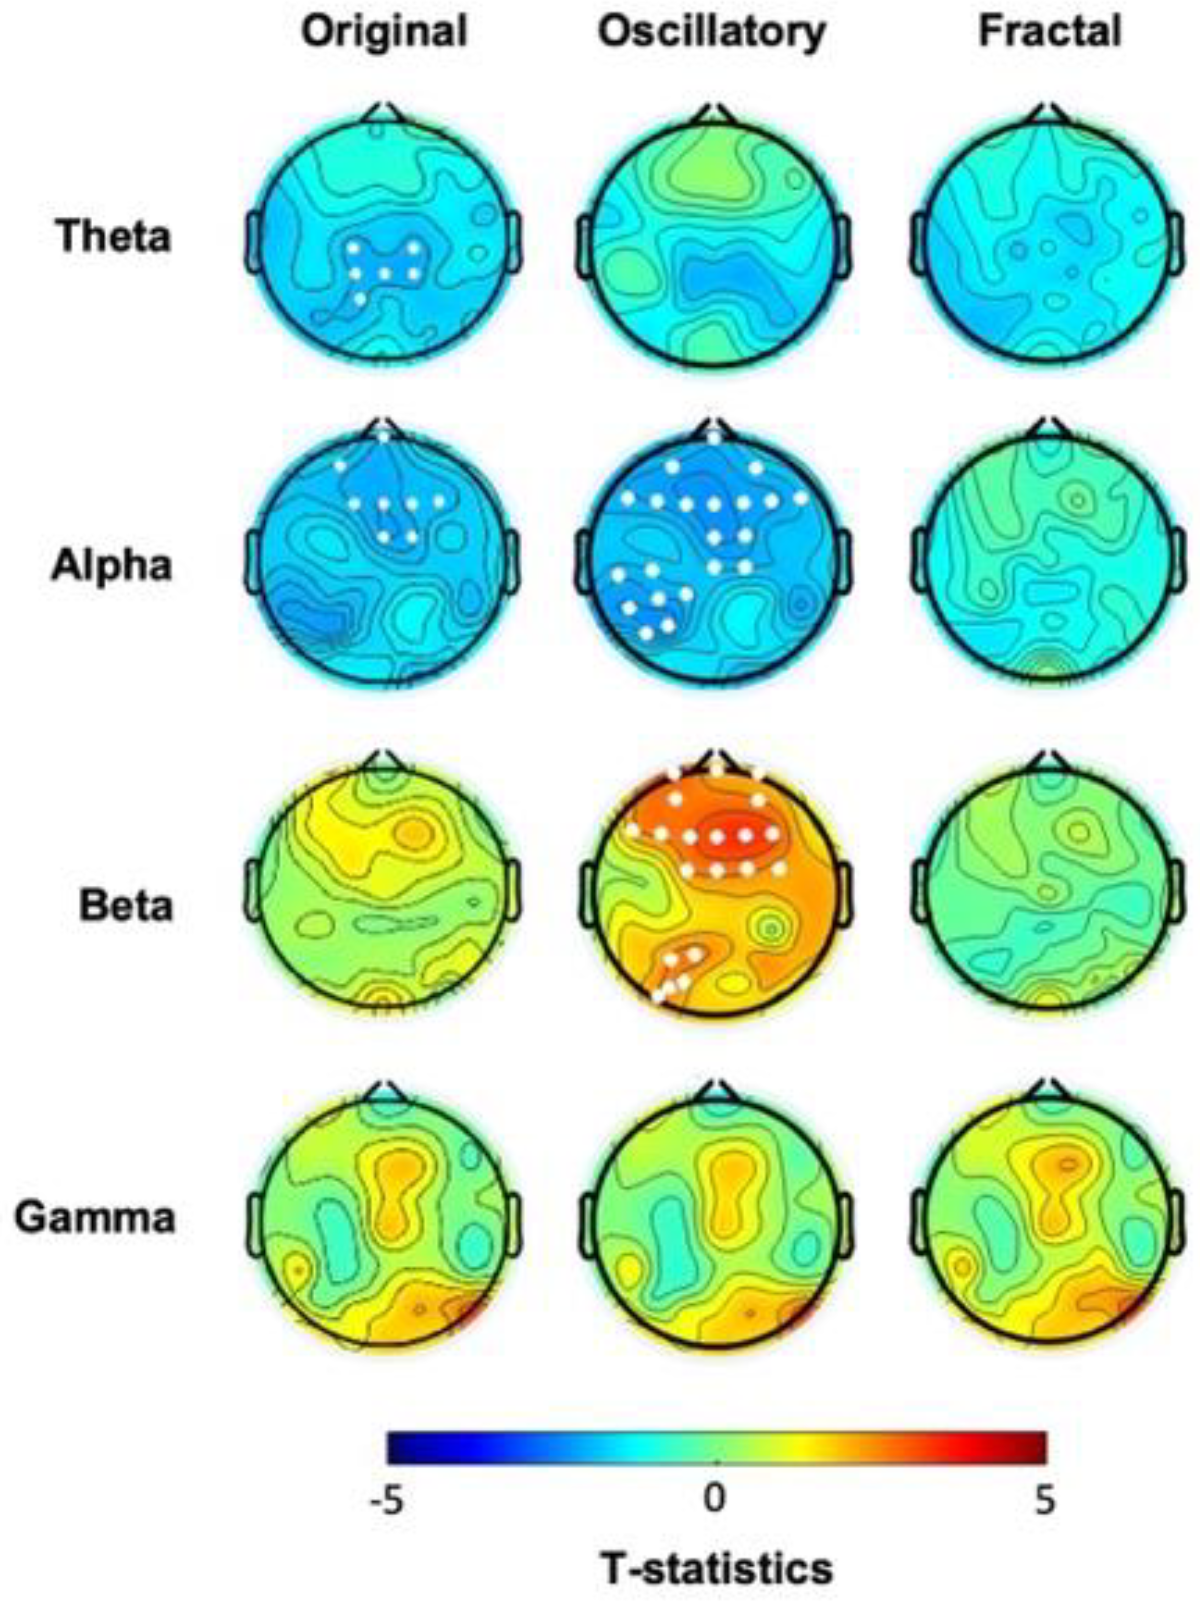
Cluster-based analysis of the “original” spectral activity following the task revealed lower power values in the low-frequency ranges, i.e., theta and alpha in hBDI compared to CTL (Figure 4, first column, see also Suppl Figure S3, suppl Figure 4A). The post-task result differs from the pre-task finding of local increases in the hBDI group for the higher frequency ranges, i.e., beta and gamma (see Figure 1, first column). Specifically, in the post-task recordings, compared to CTL, the hBDI group showed less theta range activity over a centro-parietal region (Cluster t=-12.87, p=0.028) and in alpha range in a cluster of electrodes over the frontal region (Cluster t=-16.72, p=0.025) (Figure 4, first column). There was no group difference for the peak frequency of theta (CTL: 5.82±1.48 Hz; hBDI: 5.83±1.44 Hz; W=1568, p=0.863) and alpha (CTL: 9.98±1.01 Hz; hBDI: 10.33±1.18Hz; W=1288, p=0.077) for the electrodes included in the clusters.
We then ascertained whether this change of pattern was present for the oscillatory and fractal components in the post-task recordings. While we found no significant group differences for the fractal component (Figure 4, third column, see also Suppl Figure 3C; suppl Figure 4C) as well as for the PLE (Figure 2B), the analysis of the oscillatory component confirmed that the hBDI group showed lower alpha power in a cluster of electrodes over the frontal region extending to the left parietal area (Cluster t=-46.49, p=0.014) (Figure 4, second column, see also Suppl Figure S3 and suppl Figure 4B). Nevertheless, the hBDI group showed greater beta power in electrodes over the frontal region (Cluster t=40.28, p=0.017) and, to a smaller extent, over the left parieto-occipital area (Cluster t=12.53, p=0.0497) (Figure 4, second column).
Altogether, the analyses of the post-task original and the pure oscillatory components produced results diverging from the pre-task findings in terms of group differences. Specifically, for the original oscillatory component, visual inspection of the pre- and post-task group differences (Figure 1 and Figure 4, see Table 2) suggests that task practice generated a more substantial power increase in the CTL than the hBDI group for all frequencies. For the pure oscillatory component, the group difference for the beta range fell in the post-task EEG in terms of both power amplitude and cluster magnitude (first columns of both Figure 1 and Figure 4) with the opposite effect for alpha frequency. Together with the absence of group differences in the gamma range in the post-task recordings, these findings support the hypothesis that, despite similar performance accuracy, the task activity induced different patterns of oscillatory changes in the two groups. To verify this hypothesis, we thus searched for post-pre task EEG changes in each of the two groups separately.
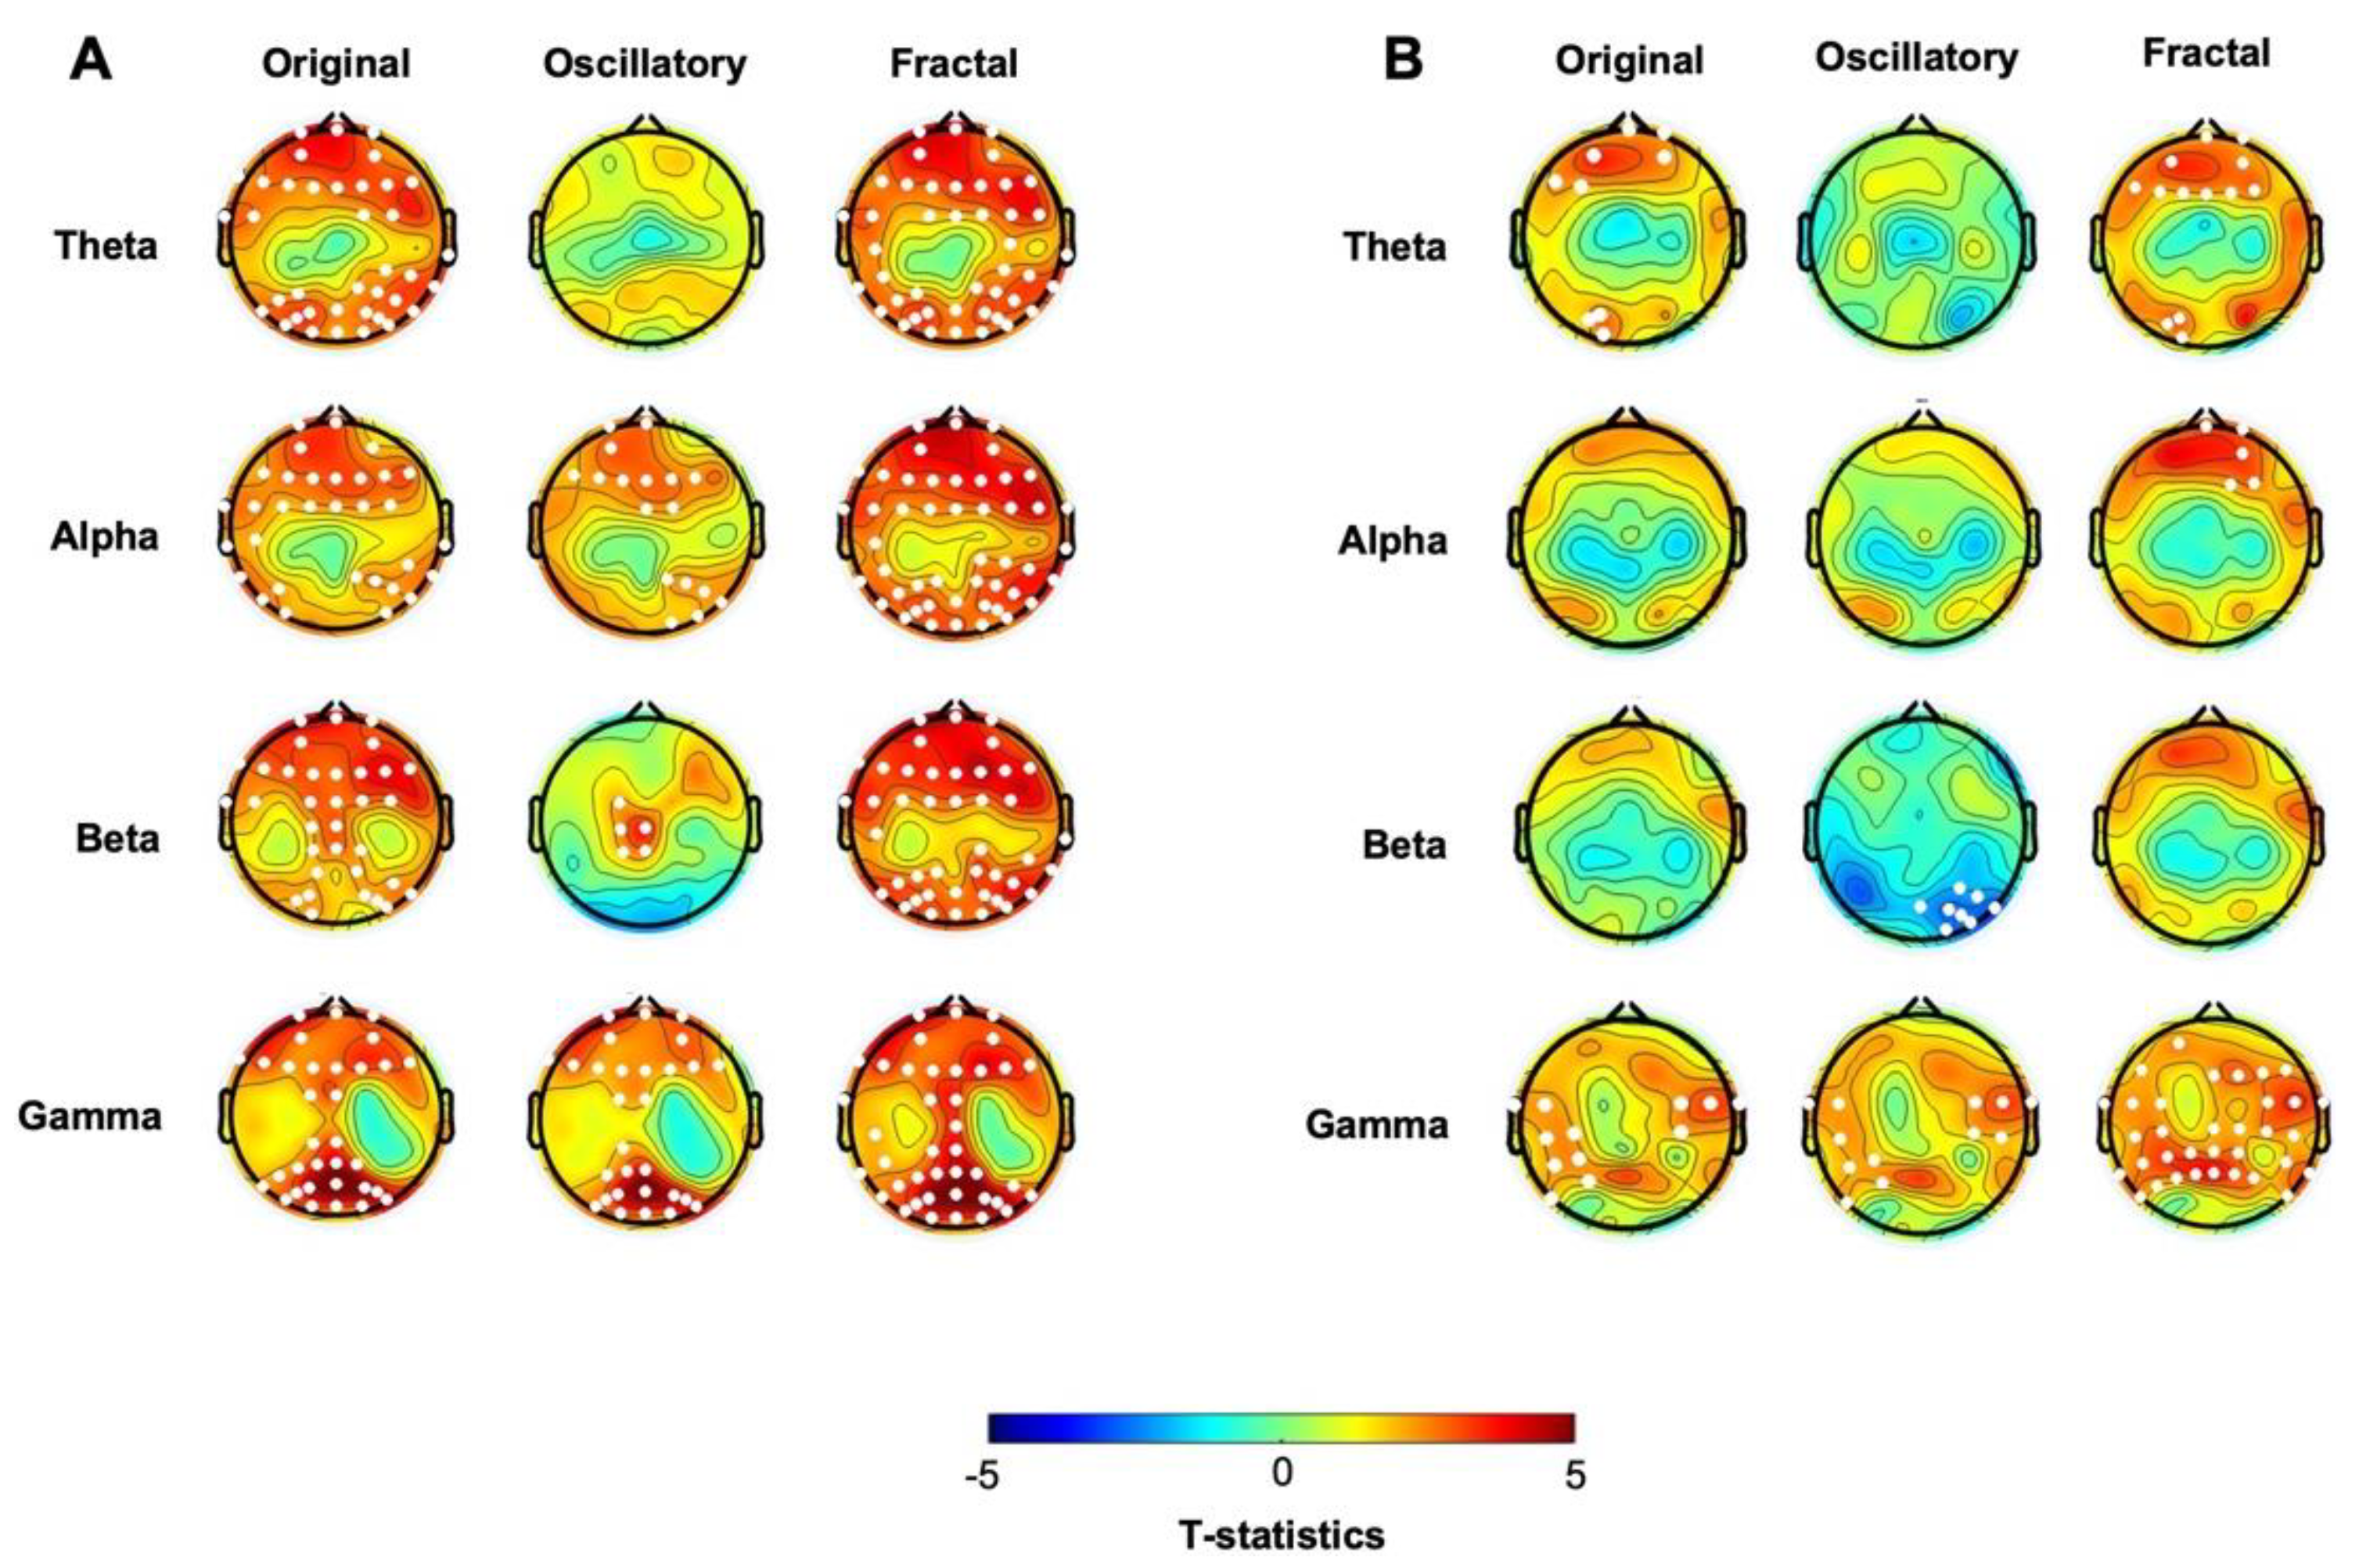
Cluster-based analyses of the original spectral activity in the CTL group confirmed that significant post-pre task increases occurred in all frequency ranges (Figure 5A, first column). Specifically, we found increased activity in: i) theta band: in two clusters of electrodes over frontal (Cluster t = 59.375, p = 0.003) and occipital areas (Cluster t = 50.32, p = 0.003); ii) alpha band: in two clusters over the frontal (Cluster t = 64.04, p = 0.003) and right parietal areas (Cluster t = 19.44, p = 0.017); iii) beta band: in a cluster of electrodes extending from the prefrontal to the occipital areas (Cluster t = 95.83, p = 0.0005); and iv) gamma band: in two clusters over frontal (Cluster t = 45.63, p = 0.0006) and occipital areas (Cluster t = -65.73, p = 0.0004). The same comparison in the hBDI group displayed a different pattern with increases that affected only the theta and gamma ranges (Figure 5B, first column). Indeed, following the task, increased oscillatory was present for theta in a cluster of electrodes over the frontal region (Cluster t=15.30, p=0.019) and a smaller one over the occipital region (Cluster t=7.70, p=0.050) and for gamma in two clusters over the centro-parietal areas (right: Cluster t= 11.22, p = 0.023; left: Cluster t=18.076, p=0.010).
Post-pre task comparison of the pure oscillatory component (Figure 5A, second column) showed that, following task practice, the CTL group exhibited increased alpha activity in two clusters of electrodes, one over the frontal area (Cluster t= 28.38, p = 0.015) and the other one over the right parieto-occipital region (Cluster t= 13.50, p = 0.034). Increased power was also found in the beta range over the central region (Cluster t=13.20, p = 0.026) and in the gamma range in two clusters of electrodes, one over the frontal area (Cluster t=39.73, p= 0.0006) and the other one over the occipital region (Cluster t= 49.28, p = 0.0006). The same analyses performed in the hBDI group (Figure 5B, second column) revealed a different pattern of changes. In fact, following the task, beta power decreased in a cluster of electrodes over the right parieto-occipital region (Cluster t=-20.87, p=0.003) and gamma power increased in two clusters of electrodes over the fronto-centro-temporal areas (left: Cluster t=15.68, p=0.014; right: Cluster t=12.92, p=0.018).
For the fractal component, compared to pre-task EEG, CTL post-task recordings demonstrated a general power increase for all frequency ranges in almost all electrodes (Figure 5A, third column). Namely, increases were found in a big cluster involving most of the electrodes for theta (Cluster t= 130.57, p= 0.00001), alpha (Cluster t=148.82, p= 0.00001), and gamma (Cluster t=142.28, p= 0.00001), with beta power increasing in both a frontal (Cluster t=72.91, p= 0.0024) and an occipital (Cluster t=66.98, p= 0.0026) cluster.
A significant post-pre difference in the PLE was found for all electrodes (Cluster t=267.79, p<0.0001). Post-task increases of the fractal component were less evident in the hBDI group (Figure 5B, third column) and did not involve the beta range. Theta increases were present in two small clusters of electrodes, one over the frontal area (Cluster t= 24.88, p= 0.00001) and another one over the left occipital area (Cluster t=8.32; p=0.042); Alpha power increased in a small right frontal cluster (Cluster t=14.56, p= 0.026) and gamma over the left centro-parietal area (Cluster t=14.74, p= 0.014) and the right fronto-central (Cluster t=11.40, p= 0.024) region. As for the CTL group, PLE increased significantly for all electrodes (Cluster t=218.57, p<0.0001).
In summary, the separate comparisons of the post-task and pre-task recordings in each group (Table 3) confirmed that practice in a probabilistic learning task induced a different pattern of EEG changes in both the CTL and hBDI groups, even though the two groups performed the task with similar accuracy. These last analyses highlighted that post-task changes involved increases in all frequency ranges for the CTL group but not for the hBDI group. Indeed, beta power increase was found only in CTL, while the hBDI displayed either no changes or even some power decrements of the pure oscillatory component.

3.4 Phase-Amplitude Coupling Is Greater in hBDI Only at Baseline

Lastly, we analyzed group differences for theta-beta and theta-gamma PAC in the post-task recordings. Non-parametric permutation analyses demonstrated that, differently from the pre-task recordings, there was no group difference for both theta-beta and theta-gamma MI in the post-task recordings (Figure 3B). Thus, in line with the results of post-task original and oscillatory components, these results suggest that task activity had differential effects on MI of the two groups, despite similar performance rates. Indeed, separate group analyses (Figure 6) revealed that, in the post-task compared to the pre-task recordings, theta-beta MI of the CTL group increased in electrodes over a right fronto-central region (Cluster T= 22.63, p=0.0018, SD: 0.0004, CI: 0.0008) and the left central area (Cluster T= 11.63, p=0.014, SD: 0.0012, CI: 0.0023) (Figure 6A, first line). Theta-gamma PAC increased in most electrodes (Cluster T=114.74, p=0.00001, SD: 0.0012, CI: 0.0023) (Figure 6B, first line). The same comparisons in the hBDI group did not show any significant change for theta-beta PAC (Figure 6A, bottom line), while theta-gamma MI increased over an extended area on both hemispheres without involvement of the mid-frontal electrodes (Cluster T=80.56, p=0.0005, SD: 0.0002, CI: 0.0004) (Figure 6B, bottom line). These findings suggest that post-task changes involved substantial and extensive increases of both theta-beta and theta-gamma PAC in the CTL group, while no changes were noted in the hBDI group for theta-beta PAC.

4. Discussion

In this study, we analyzed EEG recorded during the resting state before and after the performance of a learning task in a large cohort of young college students who were tested for depression and anxiety. As summarized in Table 2, we found that, compared to CTL, subjects with high BDI scores showed greater power in the high-frequency range, beta and gamma, mostly over fronto-parietal regions. However, after performing a learning task with similar accuracy, such differences either disappeared or diminished (see Table 2 and Table 3). Specifically, post-task EEG changes showed substantial increases in all frequency ranges (with a notable increase in beta) for the CTL group, but not for the hBDI group. Further analyses focused on the pure oscillatory and fractal components as well as on theta-beta and theta-gamma PAC revealed additional differences between the two groups, both before and after the learning task. In the following paragraphs, we will first discuss the characteristics of our study population and then explore the potential implications and meanings of the EEG differences (in terms of oscillatory and fractal components) observed between the CTL and hBDI groups at baseline and their changes following the learning task. We finally comment on our findings about theta-beta and theta-gamma PAC at baseline and following the task.

4.1 Over-Sensitive Behavioral Inhibition System Is Linked To Depression And Anxiety

The demographic characteristics of the hBDI group were similar to those reported in the 2021 NSDUH Annual National Report at https://www.samhsa.gov/data/report/2021-nsduh-annual-national-report. In fact, compared to CTL, our depressed cohort had more women than men and had higher levels of trait anxiety, sensitivity to punishment, and withdrawal from aversive or unfamiliar stimuli. BAS displayed a weak negative correlation with trait anxiety scores, but not with BDI scores. The association of anxiety with depression and the correlations between clinical tests suggest that all these psychological constructs are linked [42,43,44,45]. These findings are in line with the Gray’s reinforcement sensitivity theory about the role of personality in the genesis of mood and anxiety disorders [46,47,48]. Indeed, increased behavioral inhibition sensitivity may be a risk factor for affective disorders, with higher BIS scores linked to elevated levels of trait anxiety and depression [49]. In agreement with previous accounts [50,51], depression may be associated with an overactive inhibitory system and a hypoactive activation system, while anxiety may be more related to heightened inhibitory sensitivity and avoidance behavior [46]. The results of our logistic regression model showing that BIS accurately identified 70% of individuals with high BDI scores further strengthens the value of BIS as a good predictor of an ongoing depressive status.

4.2 Depression Is Characterized By Greater Beta Power During Resting State EEG Before the Task

In line with previous reports [52], the group with depressive symptoms displayed greater beta oscillatory activity compared to CTL over the fronto-parietal regions in the resting state EEG recorded before the task. Frontal beta activity has been associated with top-down control of attention-related mechanisms and emotional processing [53,54]. Studies in normal and depressed subjects have reported that beta power over frontal areas increases with attention and working memory[55,56], stress [55,57], and anxiety [58] and decreases with inattention [59]. Executive dysfunction and attentional deficits, such as impaired concentration and decision-making abilities, are indeed common in depression [60,61,62,63]. The role of beta in executive functioning is also supported by analyses of phase synchronization [53,64] and theta-beta ratio (an index reflecting attentional control, top-down inhibition, and cognitive processing [64,65]).
What is the meaning of greater frontal beta power in depression? As shown by MRI studies [66,67], the frontal areas may be particularly active in depressed subjects to maintain a normal level of performance during working memory tasks. Accordingly, the frontal enhancement of beta oscillations in the hBDI group could be interpreted in the frame of compensatory mechanisms to increase the efficiency of attentional control and maintain cognitive and emotional functioning. On the other hand, it may reflect hyperarousal linked to anxiety and stress [68]. While plausible, these conclusions remain, at least for the moment, hypotheses to be tested in ad-hoc studies, as the database we used did not include cognitive functioning assessment.
The observed beta power increase could also be linked to power decrements in the lower frequency ranges, such as the lower alpha oscillatory activity we found over the right frontal and left temporal areas. Decreased frontal alpha activity is a well-documented finding in depression [3,69]. Frontal alpha asymmetry in depressive disorders was first described in 1983 [70], with the left frontal area displaying higher alpha band power than the right one [69,70,71,72,73]. Although some publications have now questioned it, frontal alpha asymmetry has been mainly linked to emotional dysregulation and other factors such as motivation and positive affect (for a review, see: [3,74]), with reduced right frontal alpha reflecting negative emotional states and withdrawal [3,69,75].
Another interesting finding is that increased beta power over the frontal area and the reduced alpha power in hBDI compared to controls were present only for the mixed and pure periodic component of the signal but not for the fractal component. Previously discarded as “1/f noise”, the scale-free dynamics is thought to be generated by mechanisms that differ from those ruling periodic oscillatory activity and has been hypothesized to reflect neural complexity [39,76,77]. Thus, the sole increase of the oscillatory component we observed in the hBDI group indicates that such changes likely reflect localized brain functions, such as heightened cognitive or emotional processing, that rely on a specific, state-dependent, rhythmic activity.

4.3 Gamma Power at Rest Is Greater In Depression

Subjects in the hBDI group also displayed greater parieto-occipital gamma power, a finding that could further support the association between depression and altered attentional processes. Lately proposed as a putative biomarker of depression, studies on the role of gamma oscillatory activity in depression have yielded mixed results, with some of them reporting reductions and others increases in gamma activity [78]. These discrepant results may stem from differences in pharmacological treatments: serotonergic drugs (e.g., fluoxetine) lower gamma activity, while noradrenergic drugs (e.g., reboxetine) increase it [78,79,80]. In this line, other investigation have suggested that the combination of increased cortical levels of glutamate and reduced GABAergic activity is a biomarker of trait vulnerability to depression rather than a correlate of mood alterations [81,82], although such excitatory and inhibitory imbalances have been often associated with depression [7,81,82,83,84]. The link between increased glutamatergic activity and high-frequency oscillatory activity has been further confirmed by a model showing that slowing down glutamate decay increases both beta and gamma oscillatory activity [6]. Therefore, our results of increased high-frequency oscillatory activity could reflect altered glutamatergic signaling [85].
To be noted is that the power increase in the gamma range in the hBDI group also involved the fractal component, suggesting a different or disrupted dynamic complexity in the hBDI group. Moreover, our finding of a flatter broad-band power-law decay (PLE) over the parieto-occipital areas in hBDI parallels previous findings of reduced slope in individuals with trait anxiety [86]. Similar results have also been reported during cognitive performance [87,88] as well as in aging and dementia [89], further supporting the association among depression, altered cognitive processes, and abnormal power-law scaling. As a steeper broadband spectral slope suggests more efficient information processing [90] , the flatter slope observed in our hBDI sample may be interpreted as a biomarker of increased neural noise and dysregulated brain function. While additional studies are needed to confirm our interpretations, these findings underscore the importance of examining both periodic and aperiodic components in brain activity to get a comprehensive picture of the neural alterations that occur in and can predict depression.

4.4 Phase-Amplitude Coupling is Greater in hBDI Only before the Task

We found increased theta-beta PAC over the parietal region and theta-gamma coupling over the right occipital area in our hBDI subjects. From a behavioral point of view, increased PAC, particularly between theta and gamma oscillations, has been linked to various cognitive processes, such as working memory, attention, and cognitive flexibility, abnormalities often found in depression. Previous studies on depression have reported conflicting results about PAC, some showing increased coupling [91,92] as in our case and others decreased coupling in different frequency ranges [93,94]. Such contrasting results might be due to differences in study designs and conditions tested, patient sample characteristics, specific brain regions examined, and other factors including time of testing. For example, intracranial recordings in epileptic patients showed that low/middle to high-frequency PAC was increased in clinically depressed subjects with epilepsy compared to subjects with epilepsy only, with greater PAC values found in the evening/night than during the daytime [91]. Also, a study of untreated patients at their first depressive episode found greater resting theta-gamma PAC in depressed patients compared to controls [92]. In that case, recordings were performed at rest and during an auditory test with alternating baseline and stimulation periods.
An important finding of the present work was that, after the task, the hBDI group showed some increase only in the theta-gamma PAC while the control group displayed a substantial increase of both theta-beta and theta-gamma PAC. As a result, the group difference found at baseline for both theta-beta and theta-gamma PAC basically vanished following the learning task. While from a behavioral point of view it may underlie cognitive aspects, low-high frequency PAC may be, at the system level, a measure of information processing and facilitation within and between cortical networks [95] that depends on a proper balance of excitatory and inhibition mechanisms at the cellular level [96,97,98,99,100,101]. Consequently, PAC plays an important role in long- and short-term potentiation processes, as shown also by studies in animal models of depression [96]. Thus, the lack of substantial PAC increase in hBDI group after the task may be expression of decreased plasticity, a finding previously described in depression [11]. In turn, altered plasticity may be linked to brain energy dysregulation that has been reported in this disease [5,102,103,104] as discussed at the end of next section.

4.5 Oscillatory Activity Increases After Task Practice in CTL but Not in hBDI

The analyses of the EEG recordings after the task revealed a different pattern of changes in the two groups, despite almost identical performance scores in the task. In general, the post-task resting state EEG of the CTL group was characterized by broadband power increases in alpha, beta, and gamma ranges of both the pure oscillatory and fractal components and in theta range for the fractal component only. These changes of the oscillatory component are in line with our previous findings that after practicing learning tasks, the resting state EEG of healthy subjects displays local increases of power mostly in beta and theta ranges [24] and also in gamma [105], that occur mostly over the areas previously engaged in the task. Conversely, in the present hBDI group, we found a decrement of beta power in a few electrodes over the parieto-occipital area and a modest increase of gamma power involving fewer electrodes than the CTL group. The greater baseline oscillatory activity of the hBDI group may impede further growth because the power may have reached saturation levels. In previous work, we suggested that power increases found after task performance may represent the electrical signature of metabolic processes related to short and long-term potentiation induced by learning and practice [23,24,105]. We thus speculate that the lack of substantial EEG changes following task practice in the hBDI group together with our findings on theta-beta PAC (see previous section) may reflect a defective engagement of plasticity-related processes that include excitatory/inhibition balance and energy regulation. This conclusion is supported by three sets of considerations: 1. plasticity-related processes, excitatory/inhibition balance and energy regulation are impaired in depression [102,106]; 2. the changes in beta may signal lactate availability needed to produce fast energy resources for brain activity [22,23] and the changes in gamma may be related to mitochondrial activity [107]; 3. there is direct evidence of mitochondrial dysfunction and increased lactate levels in the brain of depressed patients [19,20,21] and that lactate increases are coupled with mitochondrial dysfunction [15,16,17,18]. Indeed, we acknowledge the need of targeted studies to prove our hypothesis that practice-related beta and gamma power changes can be biomarker of energy dysregulation in depression. Such investigations would be rather important, especially in the light of recent studies proposing to use lactate as an antidepressant drug [106].

4.5. Limitations

The present study has several limitations. A good number of them are related to the dataset we chose because of its great advantage of EEG recordings before and after a task in subjects with high and low BDI scores. However, the dataset we chose provided only clinical scores of BDI, STAI, BIS, and BAS. Such scores were by and large intercorrelated; individuals of the hBDI groups also displayed greater trait anxiety compared to CTL making it very difficult to disentangle the contribution of anxiety to EEG abnormalities without additional clinical measures. Most importantly, the dataset did not offer a comprehensive assessment and testing of aspects related to cognition and plasticity mechanisms that may be part of depression. Despite the clear group differences of EEG-derived measures, we did not find significant correlations between them and the clinical scores, suggesting that the observed spectral and connectivity differences might be explained by other psychological and cognitive factors. Among them, attentional and working memory abnormalities, stress, and sleep quality are important factors for plasticity and often accompany depression. The lack of this type of information severely curtails the interpretation of our EEG findings, especially as biomarkers of specific factors associated to depression. Another feature of this investigation is that subjects were all college students within a narrow age range. This likely decreased data variability but made it critical to validate the present results for other age ranges and populations with stressors other than those related to specific life experiences. Among the limitations of this study, there is the lack of information about previous antidepressant treatments and depression episodes. As discussed in the previous paragraphs, these factors may influence brain inhibition/excitatory balance and thus EEG results.

5. Conclusions

This is the first study demonstrating that in depressed subjects, a period of practice in a learning task does not induce the same increases observed in healthy individuals of higher frequency oscillatory activity recorded during resting state EEG. This deficit likely reflects alterations of plasticity-related mechanisms and brain energetic metabolism. However, only future EEG studies coupled with techniques specifically exploring brain metabolism, such as MRS, will provide a comprehensive picture of the dysfunction underlying depression and its symptoms. These studies, in turn, will help fostering the development of novel and targeted therapies based on pharmacological and non-pharmacological approaches.

Supplementary Materials

The following supporting information can be downloaded at the website of this paper posted on Preprints.org, Figure S1: Topographic maps of the resting state EEG of the hBDI and CLT groups before the task; Figure S2: Topographic maps of high and low gamma frequency in the baseline pre-task recordings: Figure S3: Topographic maps of the resting state EEG of the hBDI and CLT groups after the task; Figure S4 Topographic maps of high and low gamma frequency in the post-task recordings.

Author Contributions

Conceptualization, ET, ACi, MFG; methodology, ET, ACi; validation, ET; formal analysis, ET, ACi, AS, AL, ACa; data curation, ET, ACi, AS, AL, ACa; writing—original draft preparation, ET, MFG; writing—review and editing, ET, GU, AQ, MFG; visualization, ET, ACi, AS; software: ET, ACi, supervision, ET, MFG, AQ; project administration, ET, AQ, MFG; funding acquisition, AQ, MFG. All authors have read and agreed to the published version of the manuscript.

Funding

This research was funded by the U.S. Department of Defense, grant number DOD W81XWH-19-1-0810 (AQ, MFG).

Institutional Review Board Statement

The present study did not require ethical approval because involves analyses on previously collected de-identified data. Data were obtained from the OpenNeuro database (https://openneuro.org). As reported by Cavanagh and colleagues [30,31], their original data collection was conducted in accordance with the Declaration of Helsinki; their project and the consent forms were approved by their local IRB. Each participant provided written informed consent before entering their study.

Data Availability Statement

The data used in this project were obtained from the OpenNeuro database (https://openneuro.org). OpenNeuro is a data-sharing platform supported by the National Institute of Health (NIH), the National Science Foundation (NSF), and other funding agencies. The original raw EEG recordings, and clinical and demographic data can be downloaded at https://openneuro.org/datasets/ds003478/versions/1.1.0. The behavioral performance at the probabilistic learning tasks can be obtained by contacting Dr. James F. Cavanagh, as indicated on OpenNeuro. The custom MATLAB-based code used to perform our data analyses can be provided upon reasonable request to a corresponding author.

Acknowledgments

We thank Dr. James F. Cavanagh and their team for making the data publicly available through OpenNeuro.

Conflicts of Interest

The authors declare no conflicts of interest. The funders had no role in the analyses and interpretation of data, the writing of the manuscript, or the decision to publish the results.

References

  1. Grineski, S.E.; Morales, D.X.; Collins, T.W.; Nadybal, S.; Trego, S. Anxiety and Depression among US College Students Engaging in Undergraduate Research during the COVID-19 Pandemic. Journal of American College Health 2024, 72, 20–30. [Google Scholar] [CrossRef] [PubMed]
  2. Agyapong-Opoku, G.; Agyapong, B.; Obuobi-Donkor, G.; Eboreime, E. Depression and Anxiety among Undergraduate Health Science Students: A Scoping Review of the Literature. Behav Sci (Basel) 2023, 13, 1002. [Google Scholar] [CrossRef] [PubMed]
  3. Thibodeau, R.; Jorgensen, R.S.; Kim, S. Depression, Anxiety, and Resting Frontal EEG Asymmetry: A Meta-Analytic Review. J Abnorm Psychol 2006, 115, 715–729. [Google Scholar] [CrossRef] [PubMed]
  4. Li, Z.; Ruan, M.; Chen, J.; Fang, Y. Major Depressive Disorder: Advances in Neuroscience Research and Translational Applications. Neurosci Bull 2021, 37, 863–880. [Google Scholar] [CrossRef] [PubMed]
  5. Gu, X.; Ke, S.; Wang, Q.; Zhuang, T.; Xia, C.; Xu, Y.; Yang, L.; Zhou, M. Energy Metabolism in Major Depressive Disorder: Recent Advances from Omics Technologies and Imaging. Biomed Pharmacother 2021, 141, 111869. [Google Scholar] [CrossRef] [PubMed]
  6. Ramirez-Mahaluf, J.P.; Roxin, A.; Mayberg, H.S.; Compte, A. A Computational Model of Major Depression: The Role of Glutamate Dysfunction on Cingulo-Frontal Network Dynamics. Cerebral Cortex 2017, 27, 660–679. [Google Scholar] [CrossRef] [PubMed]
  7. Hu, Y.-T.; Tan, Z.-L.; Hirjak, D.; Northoff, G. Brain-Wide Changes in Excitation-Inhibition Balance of Major Depressive Disorder: A Systematic Review of Topographic Patterns of GABA- and Glutamatergic Alterations. Mol Psychiatry 2023, 28, 3257–3266. [Google Scholar] [CrossRef]
  8. Sarawagi, A.; Soni, N.D.; Patel, A.B. Glutamate and GABA Homeostasis and Neurometabolism in Major Depressive Disorder. Front. Psychiatry 2021, 12, 637863. [Google Scholar] [CrossRef] [PubMed]
  9. Narayan, G.A.; Hill, K.R.; Wengler, K.; He, X.; Wang, J.; Yang, J.; Parsey, R.V.; DeLorenzo, C. Does the Change in Glutamate to GABA Ratio Correlate with Change in Depression Severity? A Randomized, Double-Blind Clinical Trial. Mol Psychiatry 2022, 27, 3833–3841. [Google Scholar] [CrossRef]
  10. Fuchs, E.; Czéh, B.; Kole, M.H.P.; Michaelis, T.; Lucassen, P.J. Alterations of Neuroplasticity in Depression: The Hippocampus and Beyond. European Neuropsychopharmacology 2004, 14, S481–S490. [Google Scholar] [CrossRef] [PubMed]
  11. Liu, W.; Ge, T.; Leng, Y.; Pan, Z.; Fan, J.; Yang, W.; Cui, R. The Role of Neural Plasticity in Depression: From Hippocampus to Prefrontal Cortex. Neural Plasticity 2017, 2017, 6871089. [Google Scholar] [CrossRef] [PubMed]
  12. Liu, B.; Liu, J.; Wang, M.; Zhang, Y.; Li, L. From Serotonin to Neuroplasticity: Evolvement of Theories for Major Depressive Disorder. Front. Cell. Neurosci. 2017, 11, 305. [Google Scholar] [CrossRef] [PubMed]
  13. Drevets, W. Functional Anatomical Correlates of Antidepressant Drug Treatment Assessed Using PET Measures of Regional Glucose Metabolism. European Neuropsychopharmacology 2002, 12, 527–544. [Google Scholar] [CrossRef] [PubMed]
  14. Pizzagalli, D.A. Frontocingulate Dysfunction in Depression: Toward Biomarkers of Treatment Response. Neuropsychopharmacol 2011, 36, 183–206. [Google Scholar] [CrossRef] [PubMed]
  15. Tobe, E. Mitochondrial Dysfunction, Oxidative Stress, and Major Depressive Disorder. NDT 2013, 567. [Google Scholar] [CrossRef] [PubMed]
  16. Scaglia, F. The Role of Mitochondrial Dysfunction in Psychiatric Disease. Dev Disabil Res Revs 2010, 16, 136–143. [Google Scholar] [CrossRef] [PubMed]
  17. Stork, C.; Renshaw, P.F. Mitochondrial Dysfunction in Bipolar Disorder: Evidence from Magnetic Resonance Spectroscopy Research. Mol Psychiatry 2005, 10, 900–919. [Google Scholar] [CrossRef]
  18. Raza, H.; John, A.; Howarth, F.C. Increased Oxidative Stress and Mitochondrial Dysfunction in Zucker Diabetic Rat Liver and Brain. Cell Physiol Biochem 2015, 35, 1241–1251. [Google Scholar] [CrossRef] [PubMed]
  19. Bradley, K.A.L.; Mao, X.; Case, J.A.C.; Kang, G.; Shungu, D.C.; Gabbay, V. Increased Ventricular Cerebrospinal Fluid Lactate in Depressed Adolescents. Eur. psychiatr. 2016, 32, 1–8. [Google Scholar] [CrossRef] [PubMed]
  20. Shungu, D.C.; Weiduschat, N.; Murrough, J.W.; Mao, X.; Pillemer, S.; Dyke, J.P.; Medow, M.S.; Natelson, B.H.; Stewart, J.M.; Mathew, S.J. Increased Ventricular Lactate in Chronic Fatigue Syndrome. III. Relationships to Cortical Glutathione and Clinical Symptoms Implicate Oxidative Stress in Disorder Pathophysiology. NMR in Biomedicine 2012, 25, 1073–1087. [Google Scholar] [CrossRef]
  21. Ernst, J.; Hock, A.; Henning, A.; Seifritz, E.; Boeker, H.; Grimm, S. Increased Pregenual Anterior Cingulate Glucose and Lactate Concentrations in Major Depressive Disorder. Mol Psychiatry 2017, 22, 113–119. [Google Scholar] [CrossRef] [PubMed]
  22. Grønli, J.; Rempe, M.J.; Clegern, W.C.; Schmidt, M.; Wisor, J.P. Beta EEG Reflects Sensory Processing in Active Wakefulness and Homeostatic Sleep Drive in Quiet Wakefulness. J Sleep Res 2016, 25, 257–268. [Google Scholar] [CrossRef] [PubMed]
  23. Ghilardi, M.F.; Tatti, E.; Quartarone, A. Beta Power and Movement-Related Beta Modulation as Hallmarks of Energy for Plasticity Induction: Implications for Parkinson’s Disease. Parkinsonism & Related Disorders 2021, 88, 136–139. [Google Scholar] [CrossRef]
  24. Nelson, A.B.; Ricci, S.; Tatti, E.; Panday, P.; Girau, E.; Lin, J.; Thomson, B.O.; Chen, H.; Marshall, W.; Tononi, G.; et al. Neural Fatigue Due to Intensive Learning Is Reversed by a Nap but Not by Quiet Waking. Sleep 2021, 44, zsaa143. [Google Scholar] [CrossRef] [PubMed]
  25. Tatti, E.; Ricci, S.; Nelson, A.B.; Mathew, D.; Chen, H.; Quartarone, A.; Cirelli, C.; Tononi, G.; Ghilardi, M.F. Prior Practice Affects Movement-Related Beta Modulation and Quiet Wake Restores It to Baseline. Frontiers in Systems Neuroscience 2020, 14. [Google Scholar] [CrossRef] [PubMed]
  26. Nelson, A.B.; Moisello, C.; Lin, J.; Panday, P.; Ricci, S.; Canessa, A.; Di Rocco, A.; Quartarone, A.; Frazzitta, G.; Isaias, I.U.; et al. Beta Oscillatory Changes and Retention of Motor Skills during Practice in Healthy Subjects and in Patients with Parkinson’s Disease. Front Hum Neurosci 2017, 11, 104. [Google Scholar] [CrossRef] [PubMed]
  27. Hang, L.; Lim, K.-L. Chapter 13 - Energy Regulation and Parkinson’s Disease. In Genetics, Neurology, Behavior, and Diet in Parkinson’s Disease; Martin, C.R., Preedy, V.R., Eds.; Academic Press, 2020; pp. 205–220 ISBN 978-0-12-815950-7.
  28. Chahine, L.M.; Zhu, X.; Ehrenkranz, R.; Chen, H.; Glynn, N.W.; Rosano, C. Changes in Self-Reported Energy Levels in Prodromal Parkinson’s Disease. Mov Disord 2021, 36, 1276–1277. [Google Scholar] [CrossRef] [PubMed]
  29. Kempster, P.A.; Perju-Dumbrava, L. The Thermodynamic Consequences of Parkinson’s Disease. Front. Neurol. 2021, 12. [Google Scholar] [CrossRef]
  30. Cavanagh, J.F.; Bismark, A.W.; Frank, M.J.; Allen, J.J.B. Multiple Dissociations Between Comorbid Depression and Anxiety on Reward and Punishment Processing: Evidence From Computationally Informed EEG. Comput Psychiatr 2019, 3, 1–17. [Google Scholar] [CrossRef] [PubMed]
  31. Cavanagh, J.F.; Bismark, A.; Frank, M.J.; Allen, J.J. Larger Error Signals in Major Depression Are Associated with Better Avoidance Learning. Front. Psychol. 2011, 2. [Google Scholar] [CrossRef] [PubMed]
  32. Beck, A.T.; Ward, C.H.; Mendelson, M.; Mock, J.; Erbaugh, J. An Inventory for Measuring Depression. Arch Gen Psychiatry 1961, 4, 561–571. [Google Scholar] [CrossRef] [PubMed]
  33. Spielberger, C.D. State-Trait Anxiety Inventory for Adults. 1983.
  34. Carver, C.S.; White, T.L. Behavioral Inhibition, Behavioral Activation, and Affective Responses to Impending Reward and Punishment: The BIS/BAS Scales. Journal of Personality and Social Psychology 1994, 67, 319–333. [Google Scholar] [CrossRef]
  35. Frank, M.J.; Seeberger, L.C.; O’reilly, R.C. By Carrot or by Stick: Cognitive Reinforcement Learning in Parkinsonism. Science 2004, 306, 1940–1943. [Google Scholar] [CrossRef] [PubMed]
  36. Delorme, A.; Makeig, S. EEGLAB: An Open Source Toolbox for Analysis of Single-Trial EEG Dynamics Including Independent Component Analysis. J Neurosci Methods 2004, 134, 9–21. [Google Scholar] [CrossRef] [PubMed]
  37. Pion-Tonachini, L.; Kreutz-Delgado, K.; Makeig, S. ICLabel: An Automated Electroencephalographic Independent Component Classifier, Dataset, and Website. Neuroimage 2019, 198, 181–197. [Google Scholar] [CrossRef] [PubMed]
  38. Oostenveld, R.; Fries, P.; Maris, E.; Schoffelen, J.-M. FieldTrip: Open Source Software for Advanced Analysis of MEG, EEG, and Invasive Electrophysiological Data. Comput Intell Neurosci 2011, 2011, 156869. [Google Scholar] [CrossRef] [PubMed]
  39. Wen, H.; Liu, Z. Separating Fractal and Oscillatory Components in the Power Spectrum of Neurophysiological Signal. Brain Topogr 2016, 29, 13–26. [Google Scholar] [CrossRef] [PubMed]
  40. Tort, A.B.L.; Komorowski, R.; Eichenbaum, H.; Kopell, N. Measuring Phase-Amplitude Coupling between Neuronal Oscillations of Different Frequencies. J Neurophysiol 2010, 104, 1195–1210. [Google Scholar] [CrossRef] [PubMed]
  41. Maris, E.; Oostenveld, R. Nonparametric Statistical Testing of EEG- and MEG-Data. J Neurosci Methods 2007, 164, 177–190. [Google Scholar] [CrossRef] [PubMed]
  42. Zhou, Y.; Cao, Z.; Yang, M.; Xi, X.; Guo, Y.; Fang, M.; Cheng, L.; Du, Y. Comorbid Generalized Anxiety Disorder and Its Association with Quality of Life in Patients with Major Depressive Disorder. Sci Rep 2017, 7, 40511. [Google Scholar] [CrossRef] [PubMed]
  43. Kessler, R.C.; Sampson, N.A.; Berglund, P.; Gruber, M.J.; Al-Hamzawi, A.; Andrade, L.; Bunting, B.; Demyttenaere, K.; Florescu, S.; de Girolamo, G.; et al. Anxious and Non-Anxious Major Depressive Disorder in the World Health Organization World Mental Health Surveys. Epidemiol Psychiatr Sci 2015, 24, 210–226. [Google Scholar] [CrossRef] [PubMed]
  44. Hopwood, M. Anxiety Symptoms in Patients with Major Depressive Disorder: Commentary on Prevalence and Clinical Implications. Neurol Ther 2023, 12, 5–12. [Google Scholar] [CrossRef] [PubMed]
  45. Choi, K.W.; Kim, Y.-K.; Jeon, H.J. Comorbid Anxiety and Depression: Clinical and Conceptual Consideration and Transdiagnostic Treatment. In Anxiety Disorders: Rethinking and Understanding Recent Discoveries; Kim, Y.-K., Ed.; Springer: Singapore, 2020; pp. 219–235. ISBN 978-981-329-705-0. [Google Scholar]
  46. Takahashi, Y.; Yamagata, S.; Ritchie, S.J.; Barker, E.D.; Ando, J. Etiological Pathways of Depressive and Anxiety Symptoms Linked to Personality Traits: A Genetically-Informative Longitudinal Study. Journal of Affective Disorders 2021, 291, 261–269. [Google Scholar] [CrossRef] [PubMed]
  47. Masuyama, A.; Kubo, T.; Shinkawa, H.; Sugawara, D. The Roles of Trait and Process Resilience in Relation of BIS/BAS and Depressive Symptoms among Adolescents. PeerJ 2022, 10, e13687. [Google Scholar] [CrossRef] [PubMed]
  48. Toyoshima, K.; Masuya, J.; Ono, M.; Honyashiki, M.; Hashimoto, S.; Kusumi, I.; Inoue, T. Effects of the Interaction between Affective Temperaments and BIS/BAS on Depressive Symptoms in Individuals with Major Depressive Disorder. Int J Environ Res Public Health 2022, 19, 15841. [Google Scholar] [CrossRef] [PubMed]
  49. Sun, J.; Luo, Y.; Chang, H.; Zhang, R.; Liu, R.; Jiang, Y.; Xi, H. The Mediating Role of Cognitive Emotion Regulation in BIS/BAS Sensitivities, Depression, and Anxiety Among Community-Dwelling Older Adults in China. Psychology Research and Behavior Management 2020, 13, 939. [Google Scholar] [CrossRef] [PubMed]
  50. Kasch, K.L.; Rottenberg, J.; Arnow, B.A.; Gotlib, I.H. Behavioral Activation and Inhibition Systems and the Severity and Course of Depression. Journal of Abnormal Psychology 2002, 111, 589–597. [Google Scholar] [CrossRef] [PubMed]
  51. Quilty, L.C.; Mackew, L.; Bagby, R.M. Distinct Profiles of Behavioral Inhibition and Activation System Sensitivity in Unipolar vs. Bipolar Mood Disorders. Psychiatry Research 2014, 219, 228–231. [Google Scholar] [CrossRef] [PubMed]
  52. Fingelkurts, A.A.; Fingelkurts, A.A. Altered Structure of Dynamic Electroencephalogram Oscillatory Pattern in Major Depression. Biological Psychiatry 2015, 77, 1050–1060. [Google Scholar] [CrossRef] [PubMed]
  53. Li, Y.; Kang, C.; Wei, Z.; Qu, X.; Liu, T.; Zhou, Y.; Hu, Y. Beta Oscillations in Major Depression – Signalling a New Cortical Circuit for Central Executive Function. Sci Rep 2017, 7, 18021. [Google Scholar] [CrossRef] [PubMed]
  54. Kavanaugh, B.C.; Fukuda, A.M.; Gemelli, Z.T.; Thorpe, R.; Tirrell, E.; Vigne, M.; Jones, S.R.; Carpenter, L.L. Pre-Treatment Frontal Beta Events Are Associated with Executive Dysfunction Improvement after Repetitive Transcranial Magnetic Stimulation for Depression: A Preliminary Report. Journal of Psychiatric Research 2023, 168, 71–81. [Google Scholar] [CrossRef] [PubMed]
  55. Palacios-García, I.; Silva, J.; Villena-González, M.; Campos-Arteaga, G.; Artigas-Vergara, C.; Luarte, N.; Rodríguez, E.; Bosman, C.A. Increase in Beta Power Reflects Attentional Top-Down Modulation After Psychosocial Stress Induction. Front Hum Neurosci 2021, 15, 630813. [Google Scholar] [CrossRef] [PubMed]
  56. Spitzer, B.; Haegens, S. Beyond the Status Quo: A Role for Beta Oscillations in Endogenous Content (Re)Activation. eNeuro 2017, 4. [Google Scholar] [CrossRef] [PubMed]
  57. Ehrhardt, N.M.; Fietz, J.; Kopf-Beck, J.; Kappelmann, N.; Brem, A.-K. Separating EEG Correlates of Stress: Cognitive Effort, Time Pressure, and Social-Evaluative Threat. European Journal of Neuroscience 2022, 55, 2464–2473. [Google Scholar] [CrossRef] [PubMed]
  58. Sporn, S.; Hein, T.; Herrojo Ruiz, M. Alterations in the Amplitude and Burst Rate of Beta Oscillations Impair Reward-Dependent Motor Learning in Anxiety. eLife 9 e50654. [CrossRef]
  59. Roh, S.-C.; Park, E.-J.; Shim, M.; Lee, S.-H. EEG Beta and Low Gamma Power Correlates with Inattention in Patients with Major Depressive Disorder. J Affect Disord 2016, 204, 124–130. [Google Scholar] [CrossRef] [PubMed]
  60. Gohier, B.; Ferracci, L.; Surguladze, S.A.; Lawrence, E.; El Hage, W.; Kefi, M.Z.; Allain, P.; Garre, J.-B.; Le Gall, D. Cognitive Inhibition and Working Memory in Unipolar Depression. J Affect Disord 2009, 116, 100–105. [Google Scholar] [CrossRef] [PubMed]
  61. Snyder, H.R. Major Depressive Disorder Is Associated with Broad Impairments on Neuropsychological Measures of Executive Function: A Meta-Analysis and Review. Psychological Bulletin 2013, 139, 81–132. [Google Scholar] [CrossRef] [PubMed]
  62. Stordal, K.I.; Lundervold, A.J.; Egeland, J.; Mykletun, A.; Asbjørnsen, A.; Landrø, N.I.; Roness, A.; Rund, B.R.; Sundet, K.; Oedegaard, K.J.; et al. Impairment across Executive Functions in Recurrent Major Depression. Nordic Journal of Psychiatry 2004, 58, 41–47. [Google Scholar] [CrossRef]
  63. Cotrena, C.; Branco, L.D.; Shansis, F.M.; Fonseca, R.P. Executive Function Impairments in Depression and Bipolar Disorder: Association with Functional Impairment and Quality of Life. Journal of Affective Disorders 2016, 190, 744–753. [Google Scholar] [CrossRef] [PubMed]
  64. Clark, D.L.; Brown, E.C.; Ramasubbu, R.; Kiss, Z.H.T. Intrinsic Local Beta Oscillations in the Subgenual Cingulate Relate to Depressive Symptoms in Treatment-Resistant Depression. Biol Psychiatry 2016, 80, e93–e94. [Google Scholar] [CrossRef] [PubMed]
  65. Morillas-Romero, A.; Tortella-Feliu, M.; Bornas, X.; Putman, P. Spontaneous EEG Theta/Beta Ratio and Delta–Beta Coupling in Relation to Attentional Network Functioning and Self-Reported Attentional Control. Cogn Affect Behav Neurosci 2015, 15, 598–606. [Google Scholar] [CrossRef] [PubMed]
  66. Harvey, P.-O.; Fossati, P.; Pochon, J.-B.; Levy, R.; Lebastard, G.; Lehéricy, S.; Allilaire, J.-F.; Dubois, B. Cognitive Control and Brain Resources in Major Depression: An fMRI Study Using the n-Back Task. Neuroimage 2005, 26, 860–869. [Google Scholar] [CrossRef] [PubMed]
  67. Rose, E.J.; Simonotto, E.; Ebmeier, K.P. Limbic Over-Activity in Depression during Preserved Performance on the n-Back Task. Neuroimage 2006, 29, 203–215. [Google Scholar] [CrossRef] [PubMed]
  68. Hein, T.P.; Herrojo Ruiz, M. State Anxiety Alters the Neural Oscillatory Correlates of Predictions and Prediction Errors during Reward-Based Learning. NeuroImage 2022, 249, 118895. [Google Scholar] [CrossRef] [PubMed]
  69. Davidson, R.J.; Pizzagalli, D.; Nitschke, J.B.; Putnam, K. Depression: Perspectives from Affective Neuroscience. Annu Rev Psychol 2002, 53, 545–574. [Google Scholar] [CrossRef] [PubMed]
  70. Schaffer, C.E.; Davidson, R.J.; Saron, C. Frontal and Parietal Electroencephalogram Asymmetry in Depressed and Nondepressed Subjects. Biol Psychiatry 1983, 18, 753–762. [Google Scholar] [PubMed]
  71. van der Vinne, N.; Vollebregt, M.A.; van Putten, M.J.A.M.; Arns, M. Stability of Frontal Alpha Asymmetry in Depressed Patients during Antidepressant Treatment. NeuroImage: Clinical 2019, 24, 102056. [Google Scholar] [CrossRef] [PubMed]
  72. Allen, J.J.B.; Cohen, M.X. Deconstructing the “Resting” State: Exploring the Temporal Dynamics of Frontal Alpha Asymmetry as an Endophenotype for Depression. Front. Hum. Neurosci. 2010, 4. [Google Scholar] [CrossRef]
  73. Davidson, R.J. Anterior Cerebral Asymmetry and the Nature of Emotion. Brain and Cognition 1992, 20, 125–151. [Google Scholar] [CrossRef]
  74. Reznik, S.J.; Allen, J.J.B. Frontal Asymmetry as a Mediator and Moderator of Emotion: An Updated Review. Psychophysiology 2018, 55. [Google Scholar] [CrossRef] [PubMed]
  75. Davidson, R.J.; Ekman, P.; Saron, C.D.; Senulis, J.A.; Friesen, W.V. Approach-Withdrawal and Cerebral Asymmetry: Emotional Expression and Brain Physiology: I. Journal of Personality and Social Psychology 1990, 58, 330–341. [Google Scholar] [CrossRef] [PubMed]
  76. Werner, G. Fractals in the Nervous System: Conceptual Implications for Theoretical Neuroscience. Front Physiol 2010, 1, 15. [Google Scholar] [CrossRef] [PubMed]
  77. Stam, C.J. Nonlinear Dynamical Analysis of EEG and MEG: Review of an Emerging Field. Clinical Neurophysiology 2005, 116, 2266–2301. [Google Scholar] [CrossRef] [PubMed]
  78. Fitzgerald, P.J.; Watson, B.O. Gamma Oscillations as a Biomarker for Major Depression: An Emerging Topic. Transl Psychiatry 2018, 8, 177. [Google Scholar] [CrossRef] [PubMed]
  79. Cape, E.G.; Jones, B.E. Differential Modulation of High-Frequency Gamma-Electroencephalogram Activity and Sleep-Wake State by Noradrenaline and Serotonin Microinjections into the Region of Cholinergic Basalis Neurons. J Neurosci 1998, 18, 2653–2666. [Google Scholar] [CrossRef] [PubMed]
  80. Hajós, M.; Hoffmann, W.E.; Robinson, D.D.; Yu, J.H.; Hajós-Korcsok, É. Norepinephrine but Not Serotonin Reuptake Inhibitors Enhance Theta and Gamma Activity of the Septo-Hippocampal System. Neuropsychopharmacol 2003, 28, 857–864. [Google Scholar] [CrossRef] [PubMed]
  81. Bhagwagar, Z.; Wylezinska, M.; Jezzard, P.; Evans, J.; Ashworth, F.; Sule, A.; Matthews, P.M.; Cowen, P.J. Reduction in Occipital Cortex Gamma-Aminobutyric Acid Concentrations in Medication-Free Recovered Unipolar Depressed and Bipolar Subjects. Biol Psychiatry 2007, 61, 806–812. [Google Scholar] [CrossRef] [PubMed]
  82. Sanacora, G.; Gueorguieva, R.; Epperson, C.N.; Wu, Y.-T.; Appel, M.; Rothman, D.L.; Krystal, J.H.; Mason, G.F. Subtype-Specific Alterations of Gamma-Aminobutyric Acid and Glutamate in Patients with Major Depression. Arch Gen Psychiatry 2004, 61, 705–713. [Google Scholar] [CrossRef] [PubMed]
  83. Sanacora, G.; Treccani, G.; Popoli, M. Towards a Glutamate Hypothesis of Depression. Neuropharmacology 2012, 62, 63–77. [Google Scholar] [CrossRef] [PubMed]
  84. Hashimoto, K.; Sawa, A.; Iyo, M. Increased Levels of Glutamate in Brains from Patients with Mood Disorders. Biol Psychiatry 2007, 62, 1310–1316. [Google Scholar] [CrossRef] [PubMed]
  85. Lally, N.; Mullins, P.G.; Roberts, M.V.; Price, D.; Gruber, T.; Haenschel, C. Glutamatergic Correlates of Gamma-Band Oscillatory Activity during Cognition: A Concurrent ER-MRS and EEG Study. NeuroImage 2014, 85, 823–833. [Google Scholar] [CrossRef] [PubMed]
  86. Tolkunov, D.; Rubin, D.; Mujica-Parodi, L. Power Spectrum Scale Invariance Quantifies Limbic Dysregulation in Trait Anxious Adults Using fMRI: Adapting Methods Optimized for Characterizing Autonomic Dysregulation to Neural Dynamic Time Series. Neuroimage 2010, 50, 72–80. [Google Scholar] [CrossRef] [PubMed]
  87. Ciuciu, P.; Varoquaux, G.; Abry, P.; Sadaghiani, S.; Kleinschmidt, A. Scale-Free and Multifractal Time Dynamics of fMRI Signals during Rest and Task. Front Physiol 2012, 3, 186. [Google Scholar] [CrossRef] [PubMed]
  88. He, B.J. Scale-Free Properties of the Functional Magnetic Resonance Imaging Signal during Rest and Task. J Neurosci 2011, 31, 13786–13795. [Google Scholar] [CrossRef] [PubMed]
  89. Smits, F.M.; Porcaro, C.; Cottone, C.; Cancelli, A.; Rossini, P.M.; Tecchio, F. Electroencephalographic Fractal Dimension in Healthy Ageing and Alzheimer’s Disease. PLOS ONE 2016, 11, e0149587. [Google Scholar] [CrossRef] [PubMed]
  90. He, B.J. Scale-Free Brain Activity: Past, Present, and Future. Trends Cogn Sci 2014, 18, 480–487. [Google Scholar] [CrossRef] [PubMed]
  91. Young, J.J.; Chan, A.H.W.; Jette, N.; Bender, H.A.; Saad, A.E.; Saez, I.; Panov, F.; Ghatan, S.; Yoo, J.Y.; Singh, A.; et al. Elevated Phase Amplitude Coupling as a Depression Biomarker in Epilepsy. Epilepsy & Behavior 2024, 152, 109659. [Google Scholar] [CrossRef]
  92. Zhang, W.; Liu, W.; Liu, S.; Su, F.; Kang, X.; Ke, Y.; Ming, D. Altered Fronto-Central Theta-Gamma Coupling in Major Depressive Disorder during Auditory Steady-State Responses. Clinical Neurophysiology 2023, 146, 65–76. [Google Scholar] [CrossRef] [PubMed]
  93. Liu, X.; Liu, S.; Li, M.; Su, F.; Chen, S.; Ke, Y.; Ming, D. Altered Gamma Oscillations and Beta–Gamma Coupling in Drug-Naive First-Episode Major Depressive Disorder: Association with Sleep and Cognitive Disturbance. Journal of Affective Disorders 2022, 316, 99–108. [Google Scholar] [CrossRef] [PubMed]
  94. Noda, Y.; Zomorrodi, R.; Saeki, T.; Rajji, T.K.; Blumberger, D.M.; Daskalakis, Z.J.; Nakamura, M. Resting-State EEG Gamma Power and Theta–Gamma Coupling Enhancement Following High-Frequency Left Dorsolateral Prefrontal rTMS in Patients with Depression. Clinical Neurophysiology 2017, 128, 424–432. [Google Scholar] [CrossRef] [PubMed]
  95. Van Der Meij, R.; Kahana, M.; Maris, E. Phase–Amplitude Coupling in Human Electrocorticography Is Spatially Distributed and Phase Diverse. J. Neurosci. 2012, 32, 111–123. [Google Scholar] [CrossRef] [PubMed]
  96. Zheng, C.; Zhang, T. Synaptic Plasticity-Related Neural Oscillations on Hippocampus–Prefrontal Cortex Pathway in Depression. Neuroscience 2015, 292, 170–180. [Google Scholar] [CrossRef] [PubMed]
  97. Huerta, P.T.; Lisman, J.E. Bidirectional Synaptic Plasticity Induced by a Single Burst during Cholinergic Theta Oscillation in CA1 in Vitro. Neuron 1995, 15, 1053–1063. [Google Scholar] [CrossRef] [PubMed]
  98. Large, E.W.; Kolen, J.F. Resonance and the Perception of Musical Meter. Connection Science 1994, 6, 177–208. [Google Scholar] [CrossRef]
  99. Lakatos, P.; Shah, A.S.; Knuth, K.H.; Ulbert, I.; Karmos, G.; Schroeder, C.E. An Oscillatory Hierarchy Controlling Neuronal Excitability and Stimulus Processing in the Auditory Cortex. Journal of Neurophysiology 2005, 94, 1904–1911. [Google Scholar] [CrossRef]
  100. Lakatos, P.; Karmos, G.; Mehta, A.D.; Ulbert, I.; Schroeder, C.E. Entrainment of Neuronal Oscillations as a Mechanism of Attentional Selection. Science 2008, 320, 110–113. [Google Scholar] [CrossRef]
  101. Fries, P.; Nikolić, D.; Singer, W. The Gamma Cycle. Trends in Neurosciences 2007, 30, 309–316. [Google Scholar] [CrossRef] [PubMed]
  102. Głombik, K.; Detka, J.; Kurek, A.; Budziszewska, B. Impaired Brain Energy Metabolism: Involvement in Depression and Hypothyroidism. Front. Neurosci. 2020, 14. [Google Scholar] [CrossRef] [PubMed]
  103. Østergaard, L.; Jørgensen, M.B.; Knudsen, G.M. Low on Energy? An Energy Supply-Demand Perspective on Stress and Depression. Neuroscience & Biobehavioral Reviews 2018, 94, 248–270. [Google Scholar] [CrossRef]
  104. Shaffer, C.; Westlin, C.; Quigley, K.S.; Whitfield-Gabrieli, S.; Barrett, L.F. Allostasis, Action, and Affect in Depression: Insights from the Theory of Constructed Emotion. Annu Rev Clin Psychol 2022, 18, 553–580. [Google Scholar] [CrossRef] [PubMed]
  105. Ricci, S.; Tatti, E.; Nelson, A.B.; Panday, P.; Chen, H.; Tononi, G.; Cirelli, C.; Ghilardi, M.F. Extended Visual Sequence Learning Leaves a Local Trace in the Spontaneous EEG. Frontiers in Neuroscience 2021, 15. [Google Scholar] [CrossRef] [PubMed]
  106. Cai, Y.; Guo, H.; Han, T.; Wang, H. Lactate: A Prospective Target for Therapeutic Intervention in Psychiatric Disease. Neural Regeneration Research 2024, 19, 1473–1479. [Google Scholar] [CrossRef] [PubMed]
  107. Bas-Orth, C.; Schneider, J.; Lewen, A.; McQueen, J.; Hasenpusch-Theil, K.; Theil, T.; Hardingham, G.E.; Bading, H.; Kann, O. The Mitochondrial Calcium Uniporter Is Crucial for the Generation of Fast Cortical Network Rhythms. J Cereb Blood Flow Metab 2020, 40, 2225–2239. [Google Scholar] [CrossRef] [PubMed]
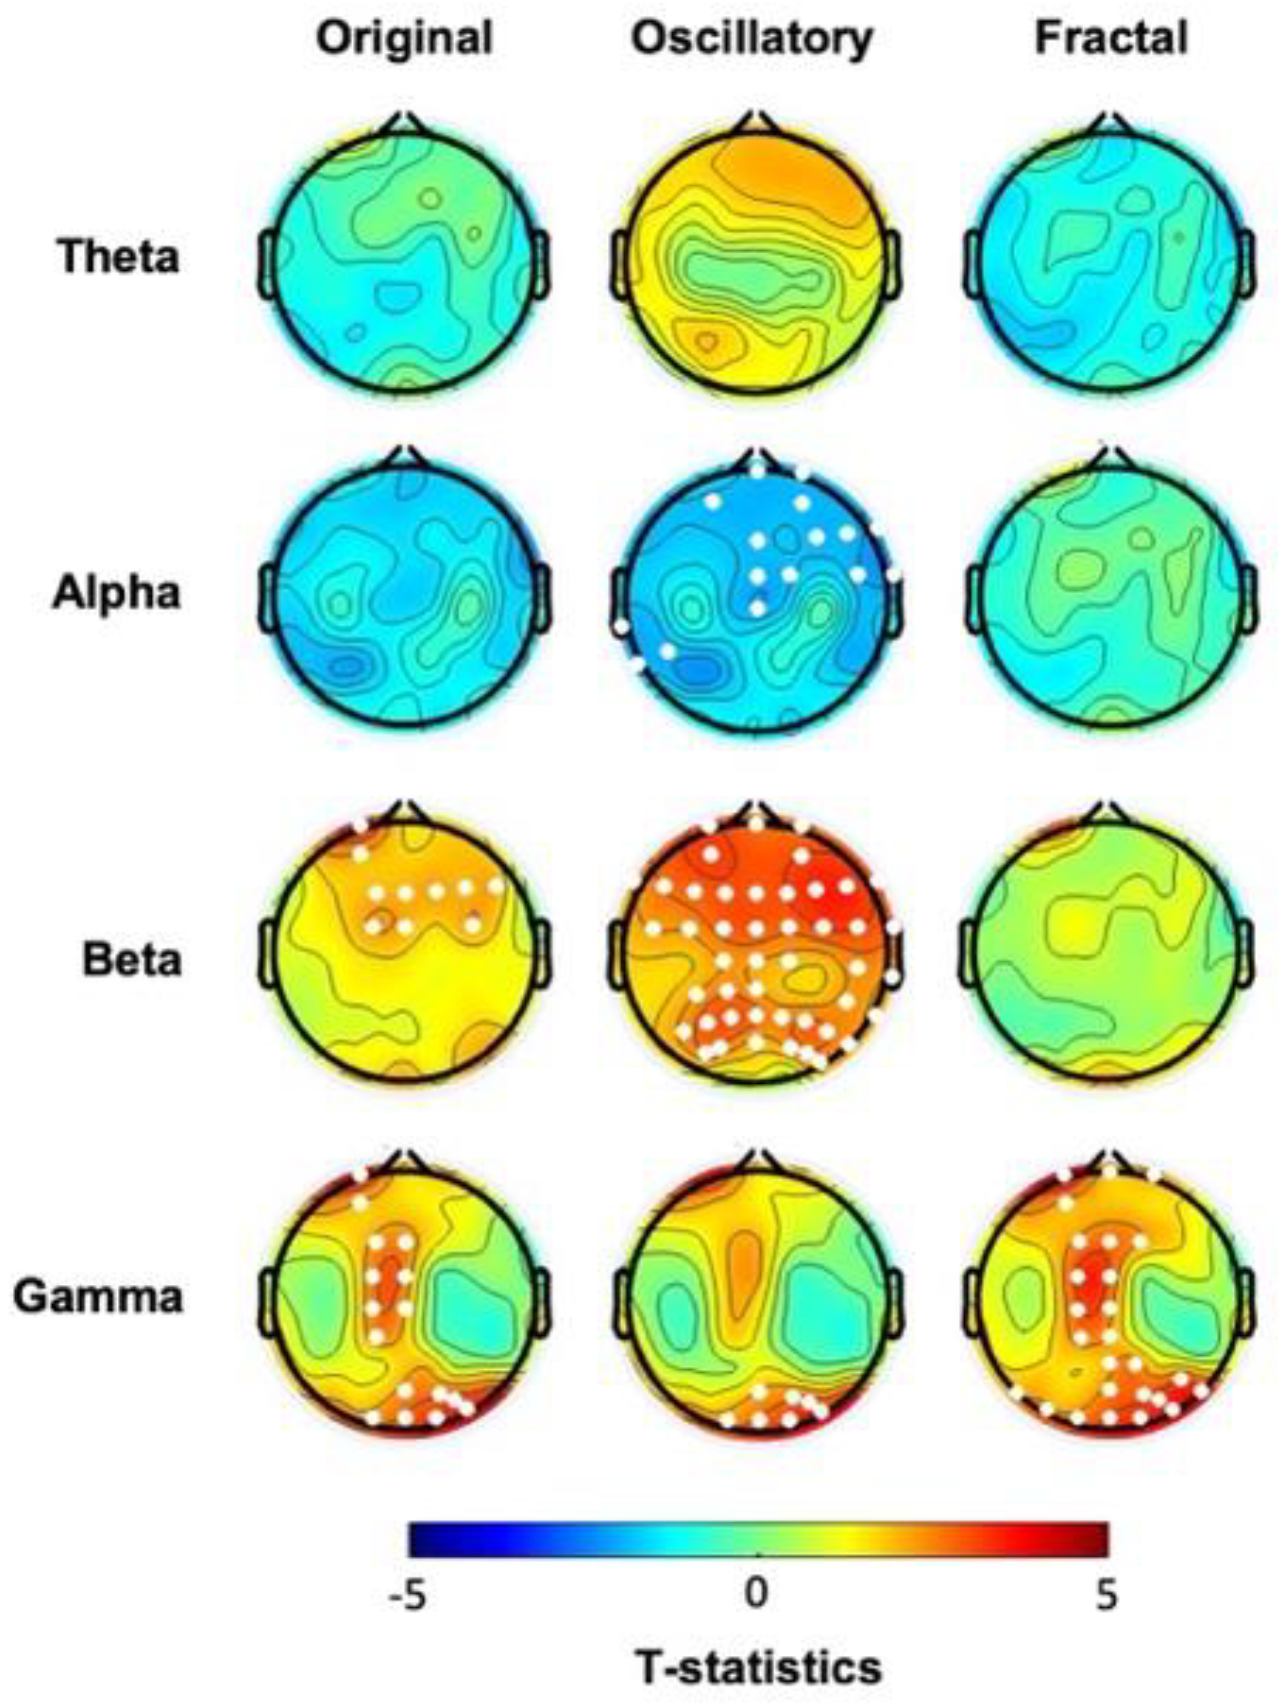
Figure 1. T-maps of group comparisons (hBDI vs. CLT) before the task, at baseline, for the original, oscillatory, and fractal components for each frequency band. White dots indicate electrodes with significant group differences after cluster correction for multiple comparisons.
Preprints 113447 g001
Figure 2. EEG Power-Law Exponent (PLE) for the hBDI group (orange) and CTL group (green) before (A) and after the task (B), with individual data points, box plots, and density plots to visualize data distribution. Topographic plots depict the t-values of cluster-based permutation statistics (right). Electrodes within significant clusters are represented as white dots.
Preprints 113447 g002
Figure 3. Group differences (hBDI vs. CTL) for theta-beta (A) and theta-gamma (B) PAC. Topographic plots depict the results of cluster-based permutation T-statistics. PRE, in the top line, represents the group comparison at baseline, before task performance. POST (bottom line) refers to group comparison after the task execution. White dots represent electrodes within significant clusters.
Preprints 113447 g003
Figure 4. T-maps of group comparisons (hBDI vs. CLT) in the post-task resting state EEG for the original, oscillatory, and fractal components. White dots indicate electrodes with significant group differences after cluster correction with multiple comparisons.
Preprints 113447 g004
Figure 5. T-maps of comparison (post-task vs. pre-task EEG) for the CTL (A) and hBDI (B) groups. Results for original, oscillatory, and fractal components are presented for each frequency band. White dots indicate electrodes with significant group differences after cluster correction for multiple comparisons.
Preprints 113447 g005
Figure 6. Post-task/pre-task differences for theta-beta (A) and theta-gamma (B) PAC in the CTL (first line) and hBDI (bottom line) groups. Topographic plots depict the results of cluster-based permutation T-statistics. White dots represent electrodes within significant clusters.
Preprints 113447 g006
Table 1. Mean of age and scores of neuropsychological tests of the control (CTL) and depressed (hBDI) groups. In parentheses we report the standard deviation (SD). The values of U Mann-Whitney tests comparing the two groups are reported with p-values. Significant group differences are reported in bold. (BDI: Beck Depression Inventory; TAI: Trait Anxiety Inventory; BIS: Behavioral Inhibition System; BAS: Behavioral Activation System; BAS-tot: BAS total score; BAS-rew: BAS reward score; BAS-fun: BAS fun-seeking score; BAS drv: BAS drive).
CTL
mean (SD)
hBDI
mean (SD)
U
p-value
Age (yrs) 18.97 (1.22) 18.74 (1.14) 1.30 0.25
BDI 1.73 (1.65) 22.22 (4.9) 85.90 < 0.001
TAI 31.05 (5.49) 55.76 (7.08) 83.49 < 0.001
BIS 19.44 (3.05) 22.72 (3.07) 26.38 < 0.001
BAStot 40.45 (4.94) 39.17 (5.68) 1.07 0.30
BASrew 17.67 (1.71) 17.13 (2.15) 1.52 0.22
BASfun 11.88 (2.17) 11.52 (2.93) 0.07 0.79
BASdrv 10.89 (2.15) 10.52 (2.79) 0.03 0.86
Table 2. Summary of group differences (hBDI>CLT) of the original (ORIG), pure oscillatory (OSCIL), fractal (FRACT) activity for theta (4-8 Hz), alpha (8.5-13 Hz), beta (13.5-25.5 Hz), and gamma (30-90 Hz) before (Pre-task) and after (Post-task). In red, we report results where the hBDI group exhibited significantly greater activity than CTL. In blue, we report results where CTL displayed significantly activity. “None” refers to no significant group differences. R= right; L= left.
Pre-task: hBDI>CTL Post-task: hBDI>CTL
Theta ORIG:  none
OSCIL:  none
FRACT:  none
ORIG:centro-parietal
OSCIL:  none
FRACT:  none
Alpha ORIG:  none
OSCIL: R frontal & L temporal
FRACT:  none
ORIG:frontal
OSCIL:from frontal to L parietal
FRACT:  none
Beta ORIG:frontal
OSCIL:fronto-parietal
FRACT:  none
ORIG:frontal
OSCIL:fronto-parietal
FRACT:  none
Gamma ORIG:  central midline & occipital
OSCIL: R parieto-occipital
FRACT:  midline & parieto-occipital
ORIG:  central midline & occipital
OSCIL:  R parieto-occipital
FRACT:  none
Table 3. Summary of the differences between post-task and pre-task for the original (ORIG), pure oscillatory (OSCIL), fractal (FRACT) EEG activity in the CTL and the hBDI groups for theta (4-8 Hz), alpha (8.5-13 Hz), beta (13.5-25.5 Hz), and gamma (30-90 Hz). In red, we report results where post-task values were significantly greater than pre-task. In blue, we report results where pre-task values were greater than post-task. “None” refers to no significant differences between the two time points.
CTL: post-task>pre-task hBDI: post-task>pre-task
Theta ORIG:frontal & occipital
OSCIL:  none
FRACT:  most all electrodes
ORIG:frontal & occipital
OSCIL:  none
FRACT:frontal & occipital
Alpha ORIG:frontal & R parietal
OSCIL:frontal & R occipital
FRACT:  most all electrodes
ORIG:  none
OSCIL:  none
FRACT:  frontal
Beta ORIG:from frontal to occipital
OSCIL:central
FRACT:  frontal & occipital
ORIG:  none
OSCIL:R parieto-occipital
FRACT:  none
Gamma ORIG:frontal & occipital
OSCIL:  frontal & occipital
FRACT:  most all electrodes
ORIG:L & R centro-parietal
OSCIL:  fronto-centro-parietal
FRACT:  L centro-parietal & R fronto-central
Disclaimer/Publisher’s Note: The statements, opinions and data contained in all publications are solely those of the individual author(s) and contributor(s) and not of MDPI and/or the editor(s). MDPI and/or the editor(s) disclaim responsibility for any injury to people or property resulting from any ideas, methods, instructions or products referred to in the content.
Copyright: This open access article is published under a Creative Commons CC BY 4.0 license, which permit the free download, distribution, and reuse, provided that the author and preprint are cited in any reuse.
Prerpints.org logo

Preprints.org is a free preprint server supported by MDPI in Basel, Switzerland.

Subscribe

© 2024 MDPI (Basel, Switzerland) unless otherwise stated