1. Introduction
The demand for renewable energy sources has led to significant advancements in photovoltaic (PV) technology. Solar cells, a critical component of PV systems, require rigorous quality control to ensure efficiency and longevity [
1,
2]. Defect detection in solar cells is a crucial step in the manufacturing process, as defects can severely impact the performance and reliability of solar panels [
3]. Traditional inspection methods are often manual and prone to errors [
4], underscoring the need for automated, accurate, and efficient detection techniques [
5].
Object detection models based on deep learning have shown great promise in various applications, including defect detection in industrial settings. These models are capable of identifying and localizing objects within an image, a critical task for automating quality control processes. Among these models, the You Only Look Once (YOLO) framework, introduced by Redmon et al. in 2016 [
6], has revolutionized object detection with its innovative approach and impressive performance. The original YOLOv1 model [
7] introduced a paradigm shift in object detection by utilizing a single neural network to predict bounding boxes and class probabilities directly from full images in one evaluation. This approach contrasts sharply with traditional methods [
8] that typically involve a two-stage process: generating region proposals and then classifying these regions. By consolidating these steps into a single pass, YOLOv1 achieved significantly faster processing speeds [
9], making it well-suited for real-time applications.
Subsequent versions of YOLO have introduced numerous improvements. YOLOv2 and YOLOv3 enhanced detection accuracy and speed by incorporating features like batch normalization, anchor boxes, and multi-scale predictions [
10,
11]. YOLOv4 and YOLOv5 further improved the architecture by optimizing the backbone networks and introducing advanced data augmentation techniques [
12]. YOLOv6 and YOLOv7 focused on refining the network structure and reducing computational costs, making these models even more suitable for real-time applications. YOLOv8 and the latest YOLOv9 have pushed the boundaries of performance [
13] with advanced attention mechanisms and further architectural enhancements.
Electroluminescence (EL) imaging has become a pivotal technique in the inspection of solar cells [
14,
15,
16], providing high-resolution images that reveal defects such as cracks, dislocations, and other anomalies. The literature has seen a growing adoption of EL imaging in conjunction with various deep learning algorithms for defect detection. Early approaches utilized convolutional neural networks (CNNs) to classify and localize defects within EL images. For instance, transfer learning techniques with pre-trained CNNs like VGG and ResNet have been employed to enhance defect detection performance [
17]. More recent studies have explored advanced architectures, such as Faster R-CNN, SSD, and RetinaNet, which offer improved accuracy and speed in detecting and classifying defects in EL images [
18]. These methods have significantly advanced the field, yet challenges remain in achieving real-time detection and handling diverse defect types, which our proposed YOLOv10 model aims to address.
Recent research has demonstrated the effectiveness of using deep learning techniques for defect detection in solar cells. For example, [
19] applied a combination of CNNs and data augmentation techniques to improve the detection accuracy of micro-cracks in EL images, achieving significant improvements over traditional methods. Similarly, [
20] used a hybrid model combining Faster R-CNN with an attention mechanism to enhance the detection of fine-grained defects in solar cells. Despite these advancements, many models still struggle with real-time processing requirements and maintaining high accuracy across varied defect types, highlighting the need for further innovation in this domain.
Building on these advancements, recent studies have explored the integration of more sophisticated techniques to address the challenges in defect detection. For instance, [
21] introduced a multi-scale feature fusion approach in their deep learning model to better capture defects of varying sizes and shapes in EL images. This method improved detection rates for smaller, less prominent defects that are typically missed by standard models. Additionally, [
22,
23] developed a novel ensemble model that combines the strengths of multiple neural network architectures, resulting in a robust system capable of detecting a wider range of defect types with higher precision. These studies underscore the ongoing efforts to enhance model performance, yet they also reveal persistent gaps, particularly in achieving real-time processing and generalizability across diverse defect scenarios.
This paper introduces YOLOv10, a novel architecture designed specifically for defect detection in solar cells, marking the first use of YOLOv10 for EL PV defect detection. The YOLOv10 model integrates two core modules: the Compact Inverted Block (CIB) and the Partial Self-Attention (PSA) module. These enhancements balance the trade-off between computational efficiency and detection accuracy. The CIB module utilizes depthwise separable convolutions to reduce computational complexity while maintaining robust feature extraction capabilities. The PSA module incorporates multi-head self-attention mechanisms to capture long-range dependencies and refine feature representations. Our research leverages the EL Solar Cells dataset, comprising 10,500 images annotated with 12 distinct defect classes. This diverse dataset ensures a comprehensive evaluation of our model’s performance in real-world scenarios. Training the YOLOv10 model on the high-performance Viking cluster at the University of York, we achieved a mean Average Precision (mAP@0.5) of 98.5%, demonstrating the model’s exceptional accuracy and efficiency.
2. Methodology
2.1. Yolov10 Model Architecture
The YOLOv10 architecture is composed of several core modules that work in conjunction to process and predict object locations and classes from input images. These core modules include the Compact Inverted Block (CIB) and the Partial Self-Attention (PSA) module [
24]. The architecture can be broken down into the following key stages.
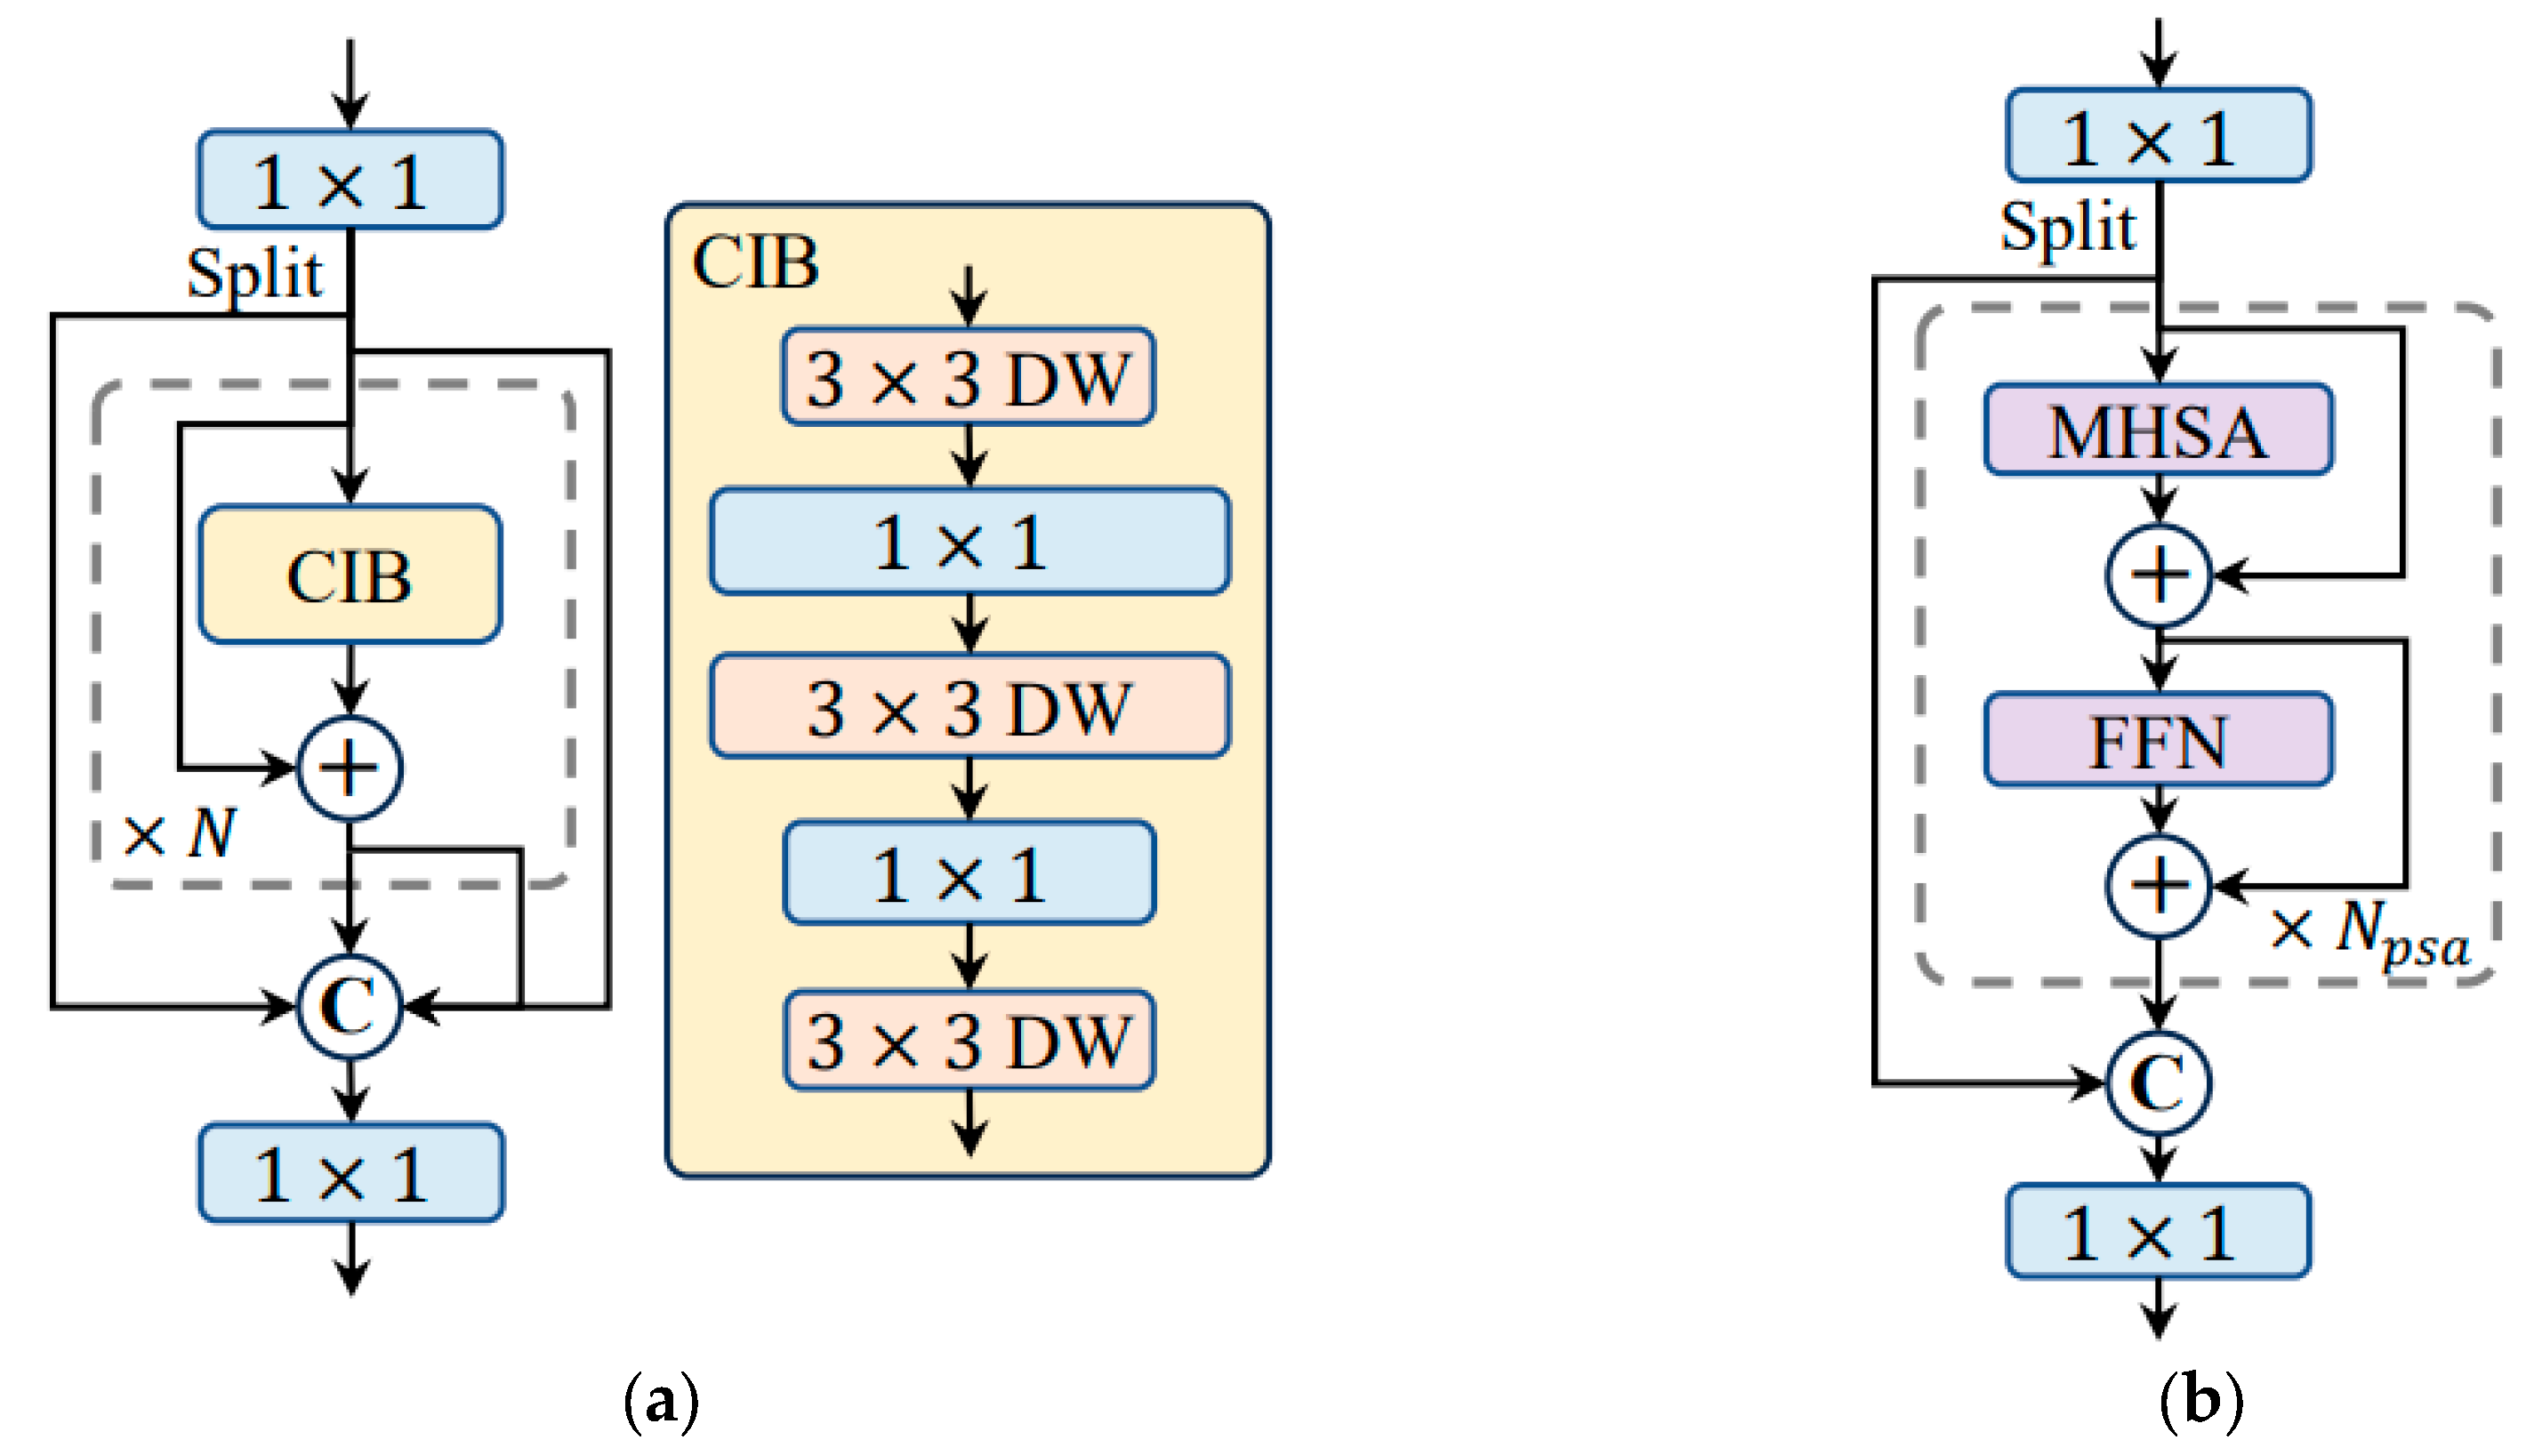
Initially, the input image is processed through a series of 1×1 convolutions to adjust the channel dimensions. This is followed by a “split” operation, which partitions the feature map for parallel processing through multiple branches. As depicted in
Figure 1(a), the Compact Inverted Block (CIB) is a crucial component that performs depthwise separable convolutions to reduce computational complexity while maintaining feature extraction capability. The CIB structure consists of alternating 3×3 depthwise (DW) convolutions [
25] and 1×1 pointwise convolutions, as shown in (1).
These operations are repeated N times with residual connections to facilitate gradient flow and preserve spatial information.
Illustrated in
Figure 1(b), the Partial Self-Attention (PSA) module integrates self-attention mechanisms to capture long-range dependencies and enhance feature representations. The module comprises Multi-Head Self-Attention (MHSA) and Feed-Forward Network (FFN) layers, as detailed in (2).
Each MHSA layer calculates attention scores across the entire spatial dimensions [
26], followed by the FFN to refine the features. Residual connections are utilized within the PSA module to maintain gradient flow and enable efficient training.
The outputs from the CIB and PSA modules are concatenated (denoted by in the figure) to aggregate the extracted features. A final 1×1 convolution is applied to adjust the output dimensions before passing the features to the prediction layers.
In more detail, the depthwise separable convolution in the CIB can be mathematically expressed as:
where and represent the depthwise and pointwise convolution filters, respectively, is the input feature map, is the output feature map, and denotes the activation function
The MHSA operation in the PSA module can be described by (4), where each attention head is computed as (5), and the attention function is presented by (6).
with
representing the query, key, and value matrices, and
being the learned project matrices.
The FFN in the PSA module is a two-layer MLP with a ReLU activation, as shown in (5), where
are the weights, and
are the biases of the two linear transformations.
In summary, the YOLOv10 architecture combines the efficiency of the CIB and the powerful feature representation capabilities of the PSA module. By leveraging depthwise separable convolutions and multi-head self-attention mechanisms, YOLOv10 achieves high accuracy in object detection tasks with reduced computational overhead. The modular design allows for flexibility and scalability, making YOLOv10 a robust solution for real-time object detection applications.
2.2. EL Solar Cells Dataset
In this study, we utilized the EL Solar Cells dataset, which comprises a comprehensive collection of solar cell images annotated with various defect types. The dataset was sourced from a manufacturing facility at Hebei University of Technology and Beihang University [
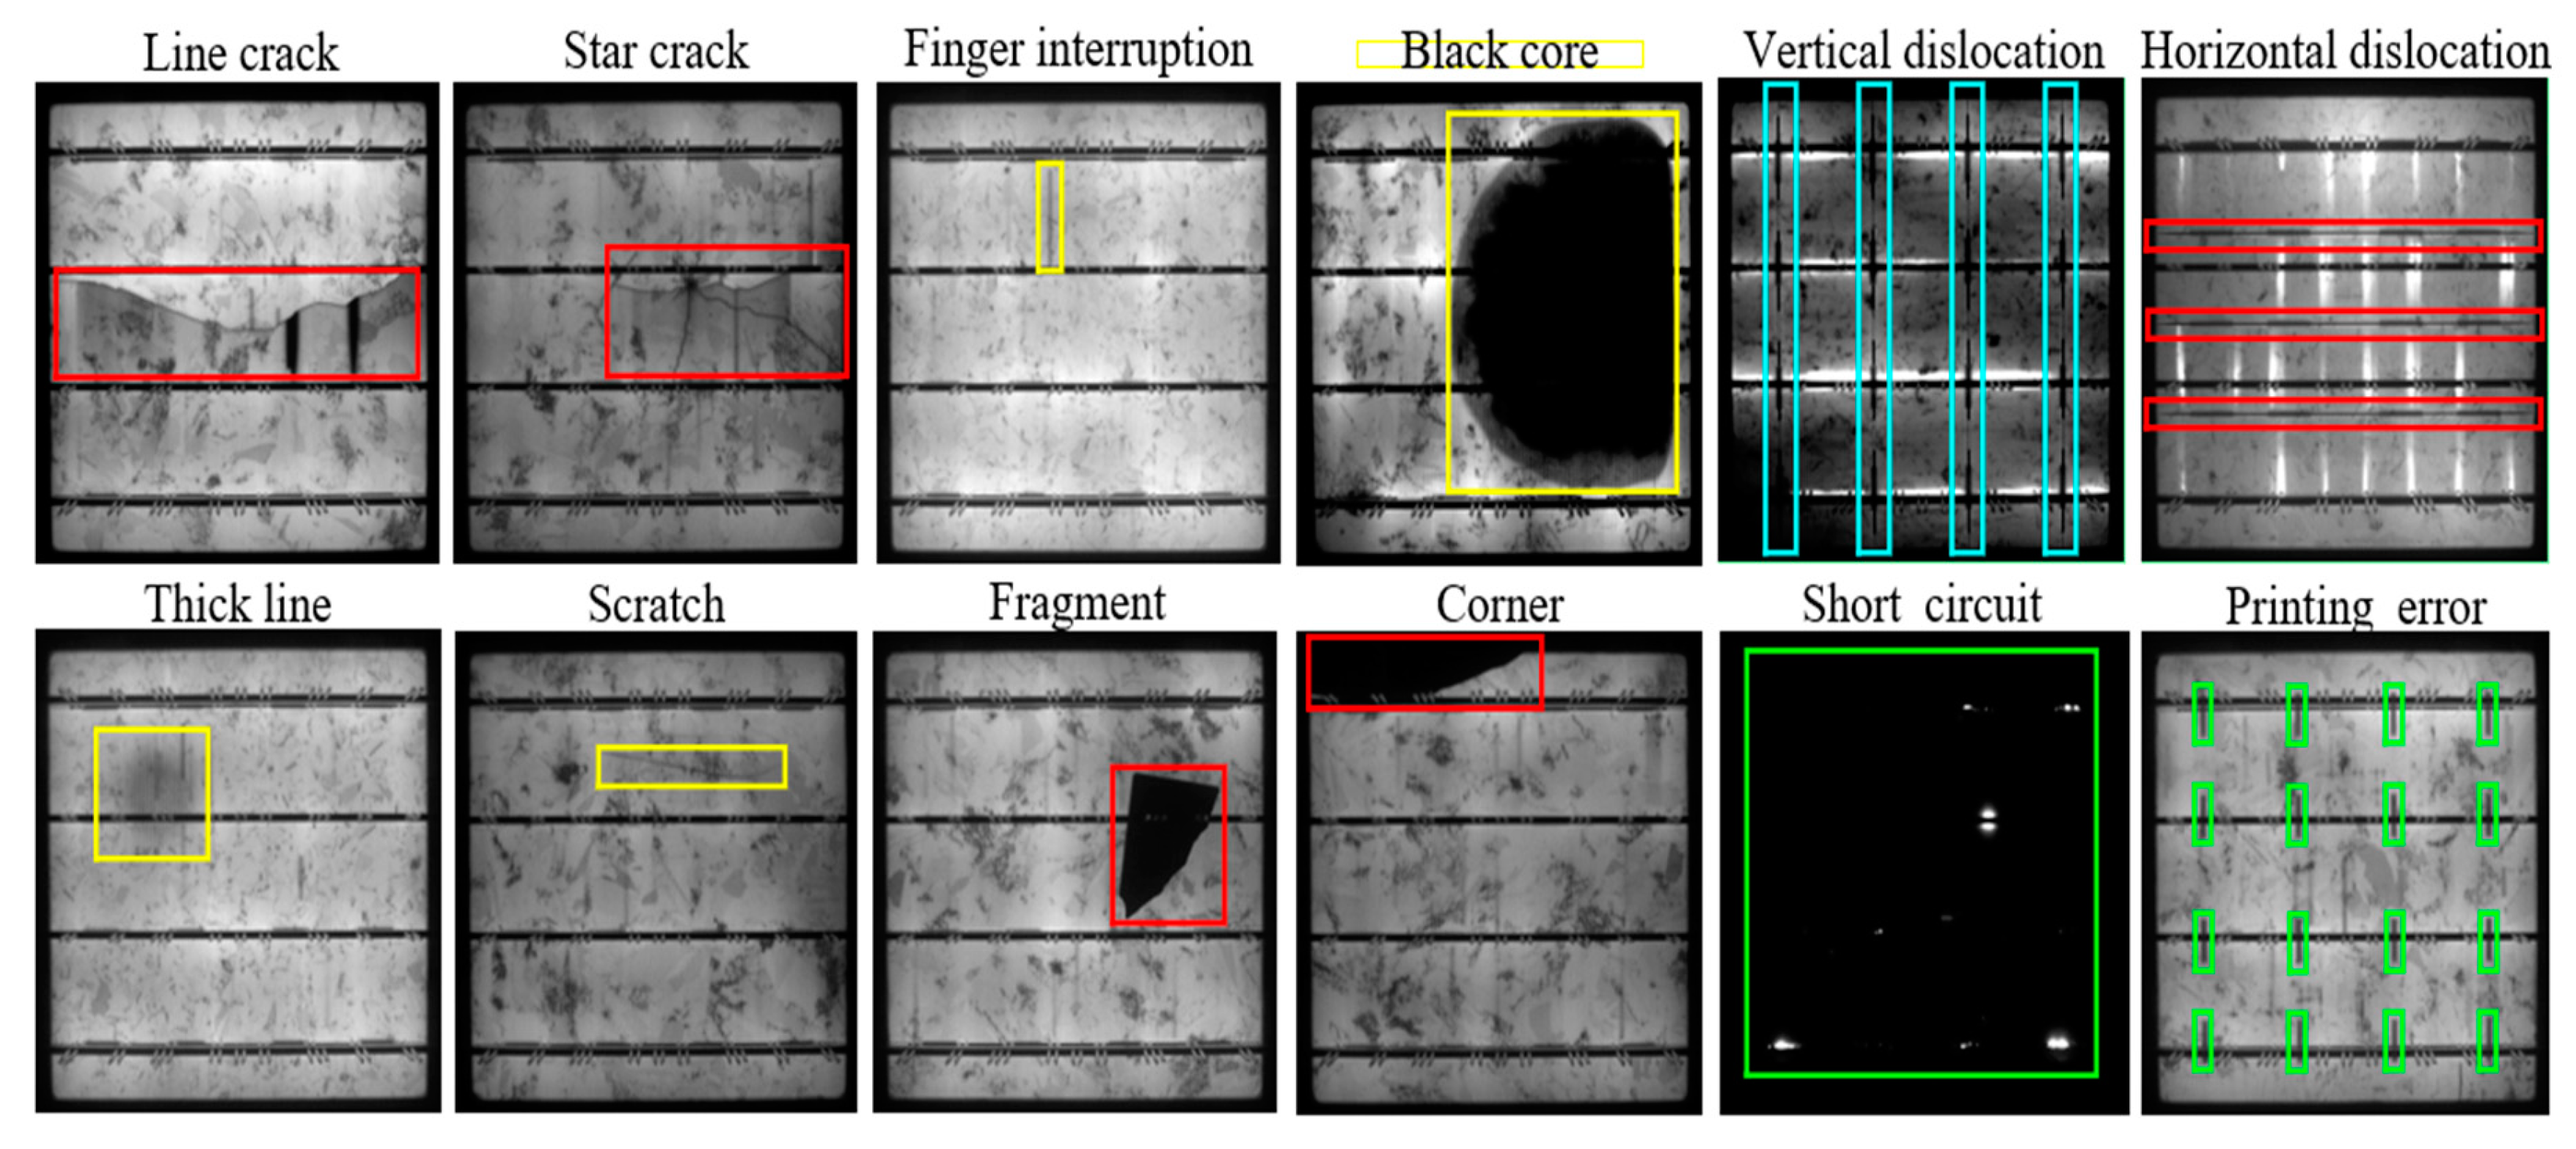
27], ensuring a diverse and representative sample of real-world defects encountered in solar cell production. The dataset includes a total of 12 distinct classes of defects, each with 875 solar cell samples, resulting in an overall dataset size of 10,500 samples. The identified defect classes are Line crack, Star crack, Finger interruption, Black core, Vertical dislocation, Horizontal dislocation, Thick line, Scratch, Fragment, Corner, Short circuit, and Printing error.
Each defect class represents specific anomalies that can occur during the manufacturing process, and these are visually illustrated in
Figure 2. The figure provides examples of each defect class, with coloured bounding boxes highlighting the defects. Specifically:
Line crack: Characterized by a long, narrow crack that traverses the solar cell.
Star crack: A crack pattern that radiates outward in a star-like formation.
Finger interruption: Discontinuities in the finger lines of the solar cell.
Black core: A large, dark area indicating a severe defect.
Vertical dislocation: Misalignment occurring along the vertical axis.
Horizontal dislocation: Misalignment occurring along the horizontal axis.
Thick line: An abnormally thick line on the solar cell surface.
Scratch: Linear abrasions on the cell surface.
Fragment: Portions of the solar cell that have broken off.
Corner: Damage occurring at the corners of the solar cell.
Short circuit: Indications of electrical short circuits.
Printing error: Defects resulting from errors in the printing process.
These defect classes were meticulously annotated to facilitate accurate training and evaluation of object detection models. The examples in
Figure 2 show the diversity and complexity of the defect types, underscoring the challenges in automated defect detection in solar cells. This dataset serves as a robust foundation for developing and testing our YOLOv10 model, aiming to advance the state of automated defect detection in photovoltaic manufacturing.
2.3. Yolov10 Model Training and Validation
The YOLOv10 model was trained and validated using a comprehensive set of parameters detailed in
Table 1. The training process was conducted on the Viking cluster, a high-performance computing facility at the University of York. This facility is equipped with state-of-the-art GPUs, including 48 A40 units and 12 H100 units, providing substantial computational power. It is worth noting that YOLOv10 in this paper referred to the Yolov10x model, which contains advanced feature extraction layers, enhanced detection heads, and optimized anchor box configurations.
The model training involved 750 epochs, with a batch size of 32 samples per update. A learning rate of 0.001 was used to control the step size during optimization, and a weight decay of 0.0005 was applied as a regularization technique to prevent overfitting. The optimizer employed for training was a combination of Stochastic Gradient Descent (SGD) and Adam, which facilitated efficient and effective updates to the neural network’s parameters.
The input image size was set to 640x640 pixels, and the loss function used was a combination of Cross-Entropy and Bounding Box Loss, which measures the difference between the predicted outputs and the ground truth. A confidence threshold of 0.25 was established to determine the validity of a detection, and a validation split of 20% was applied to the dataset to evaluate the model’s performance.
Additionally, the training process incorporated anchor boxes with predefined sizes of [10, 13], [16, 30], and [33, 23], which are essential for detecting objects of various scales. Non-Max Suppression (NMS) with a threshold of 0.45 was used to select the best bounding box for each object, thereby eliminating redundant detections. The backbone architecture used for feature extraction was CSPDarknet53 [
28,
29], known for its efficiency and accuracy. To enhance the dataset’s variability and improve the model’s robustness, various data augmentation techniques, such as random flip, rotation, and scaling, were employed. Leveraging the Viking cluster’s advanced computational capabilities, the training phase was completed in approximately 27 minutes, demonstrating the efficiency and effectiveness of the training process on such a powerful resource. This swift completion time underscores the benefits of utilizing high-performance computing facilities for complex model training tasks.
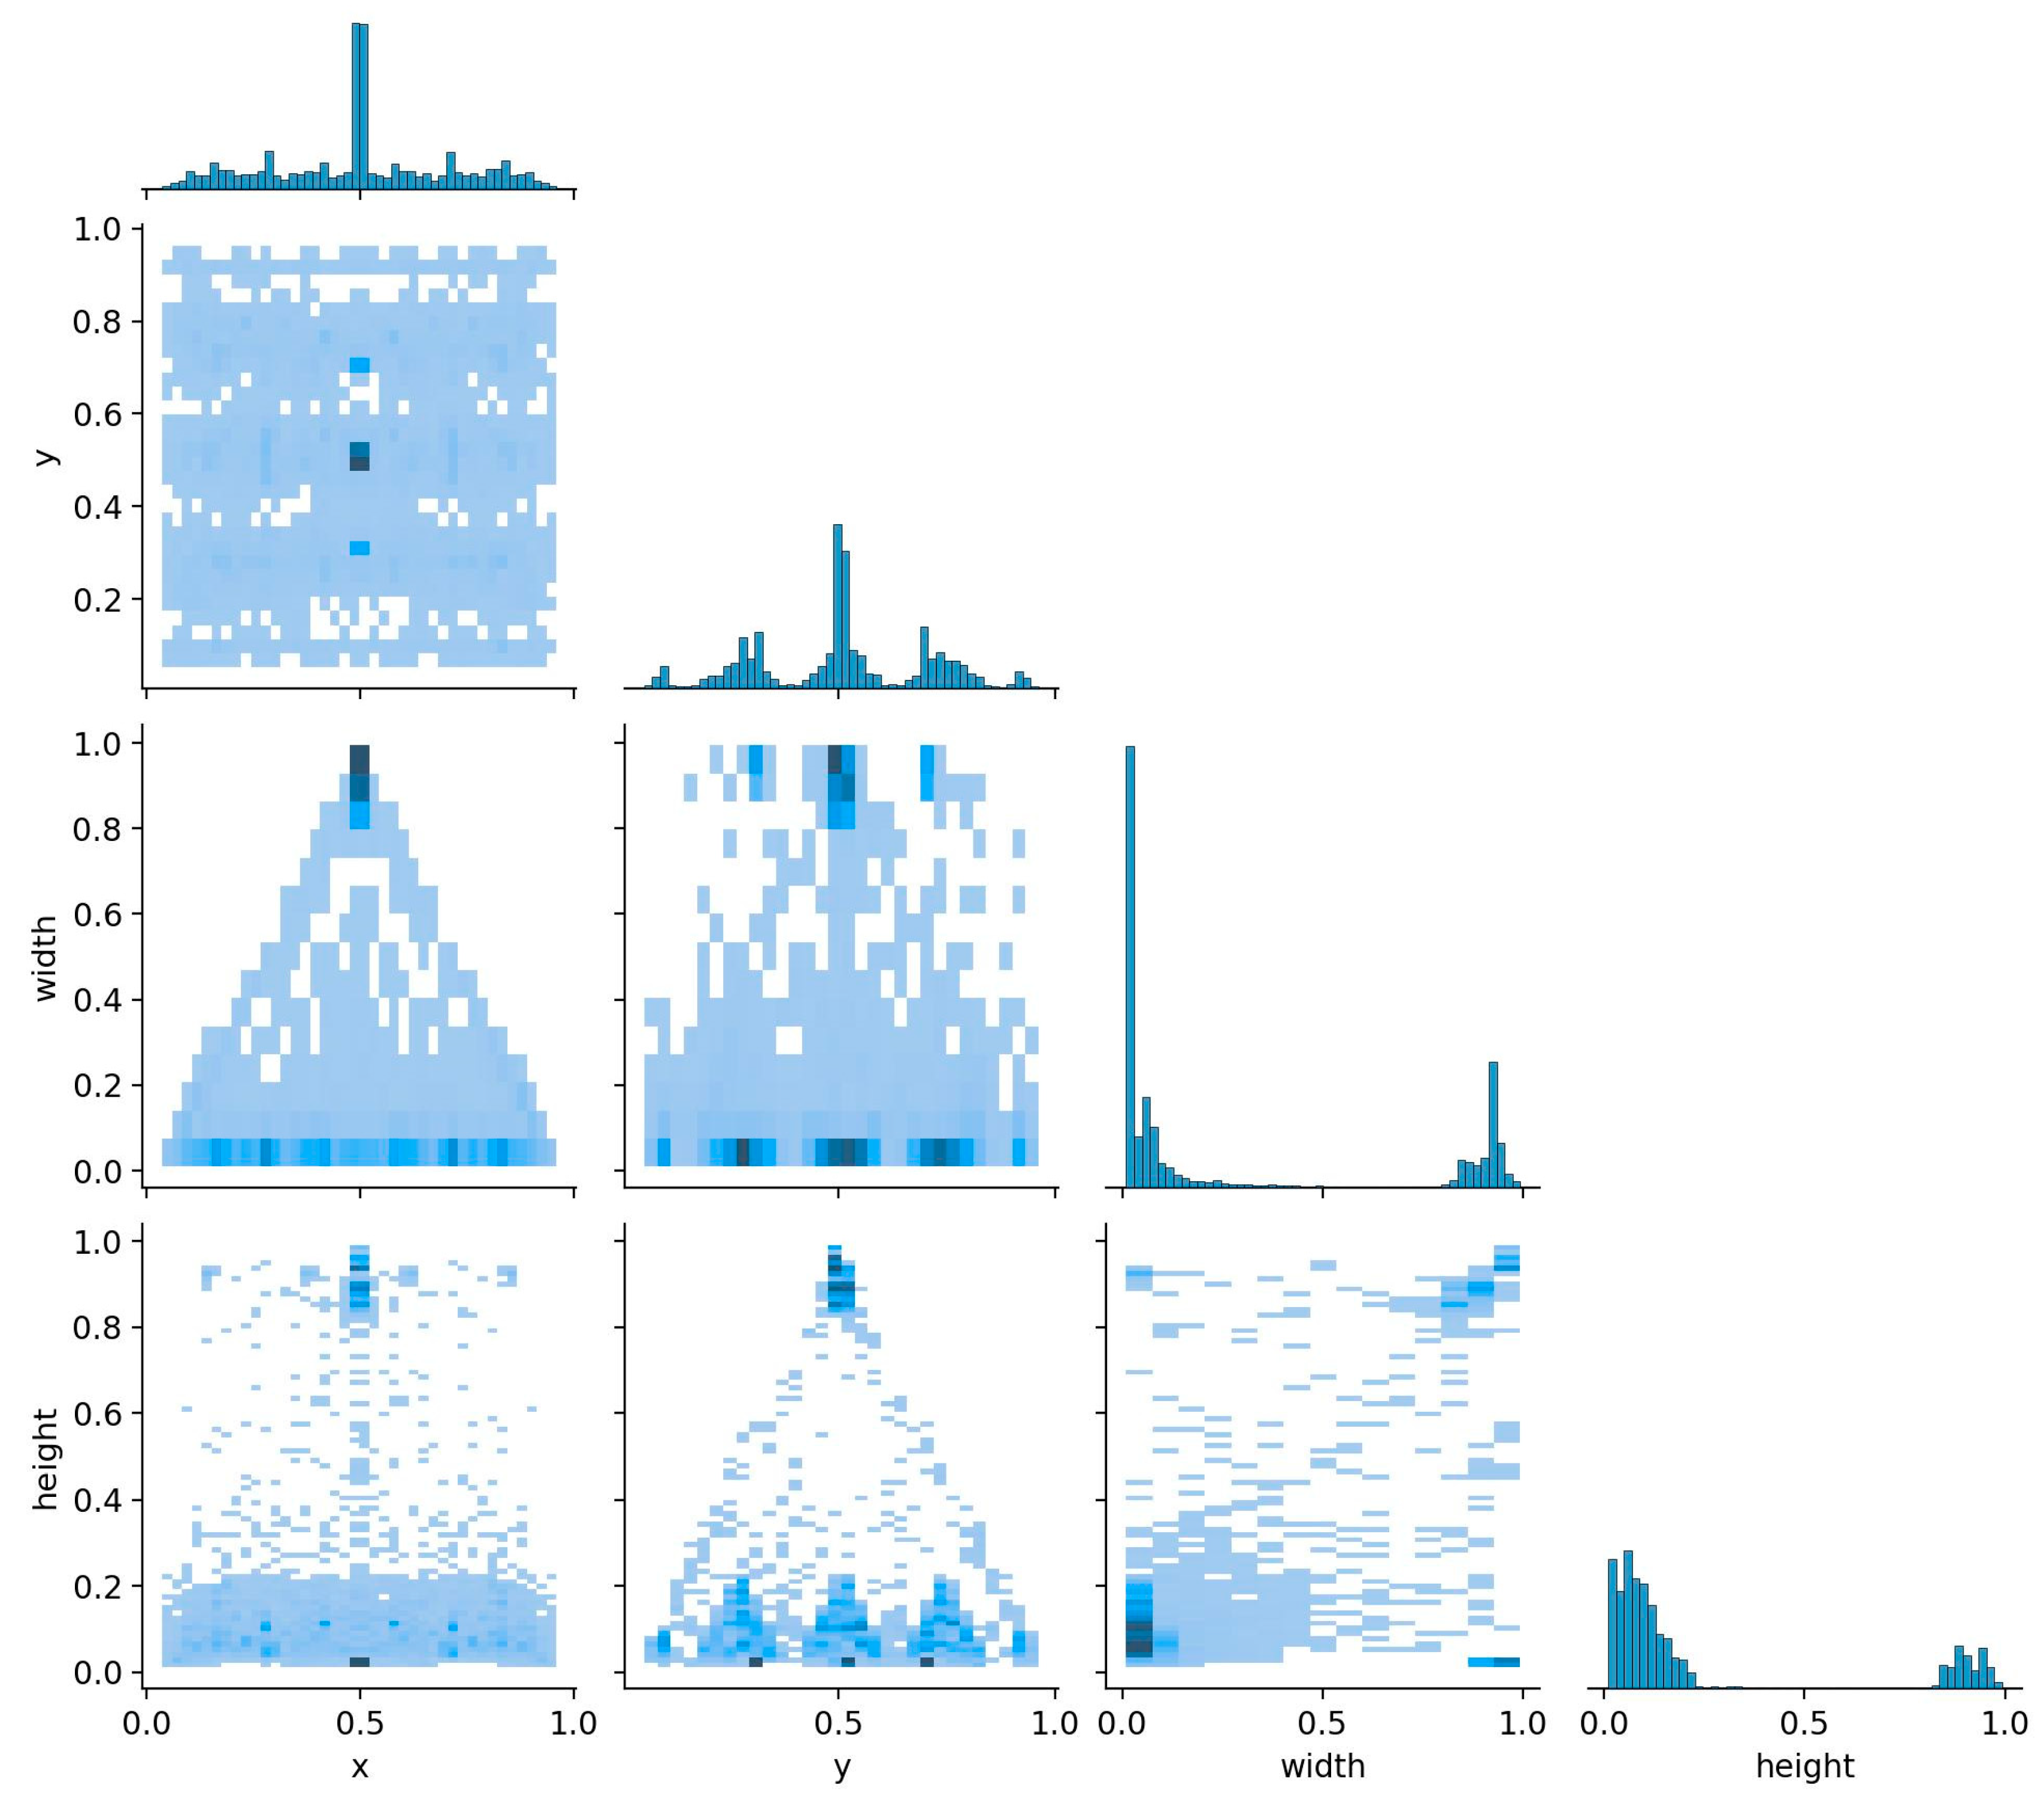
Figure 3 presents a pair plot of the bounding box coordinates (x, y) and dimensions (width, height) from the training dataset. The diagonal histograms reveal that the bounding box coordinates (x and y) are uniformly distributed across the image, indicating a diverse placement of objects. The width and height histograms show that most objects are of similar size, with a slight concentration of smaller dimensions, as indicated by the peaks near the lower end of the scales. The scatter plots provide further insights:
x vs. y: There is a uniform distribution, confirming that objects are well-distributed across both axes.
width vs. x and width vs. y: These plots show a triangular distribution, suggesting that larger widths are less common and more evenly spread out across different positions.
height vs. x and height vs. y: Similarly, these plots show a triangular distribution, indicating that larger heights are also less common and distributed across different positions.
width vs. height: The scatter plot shows a concentration of smaller dimensions, with fewer larger objects, indicating a prevalence of small-sized objects in the dataset.
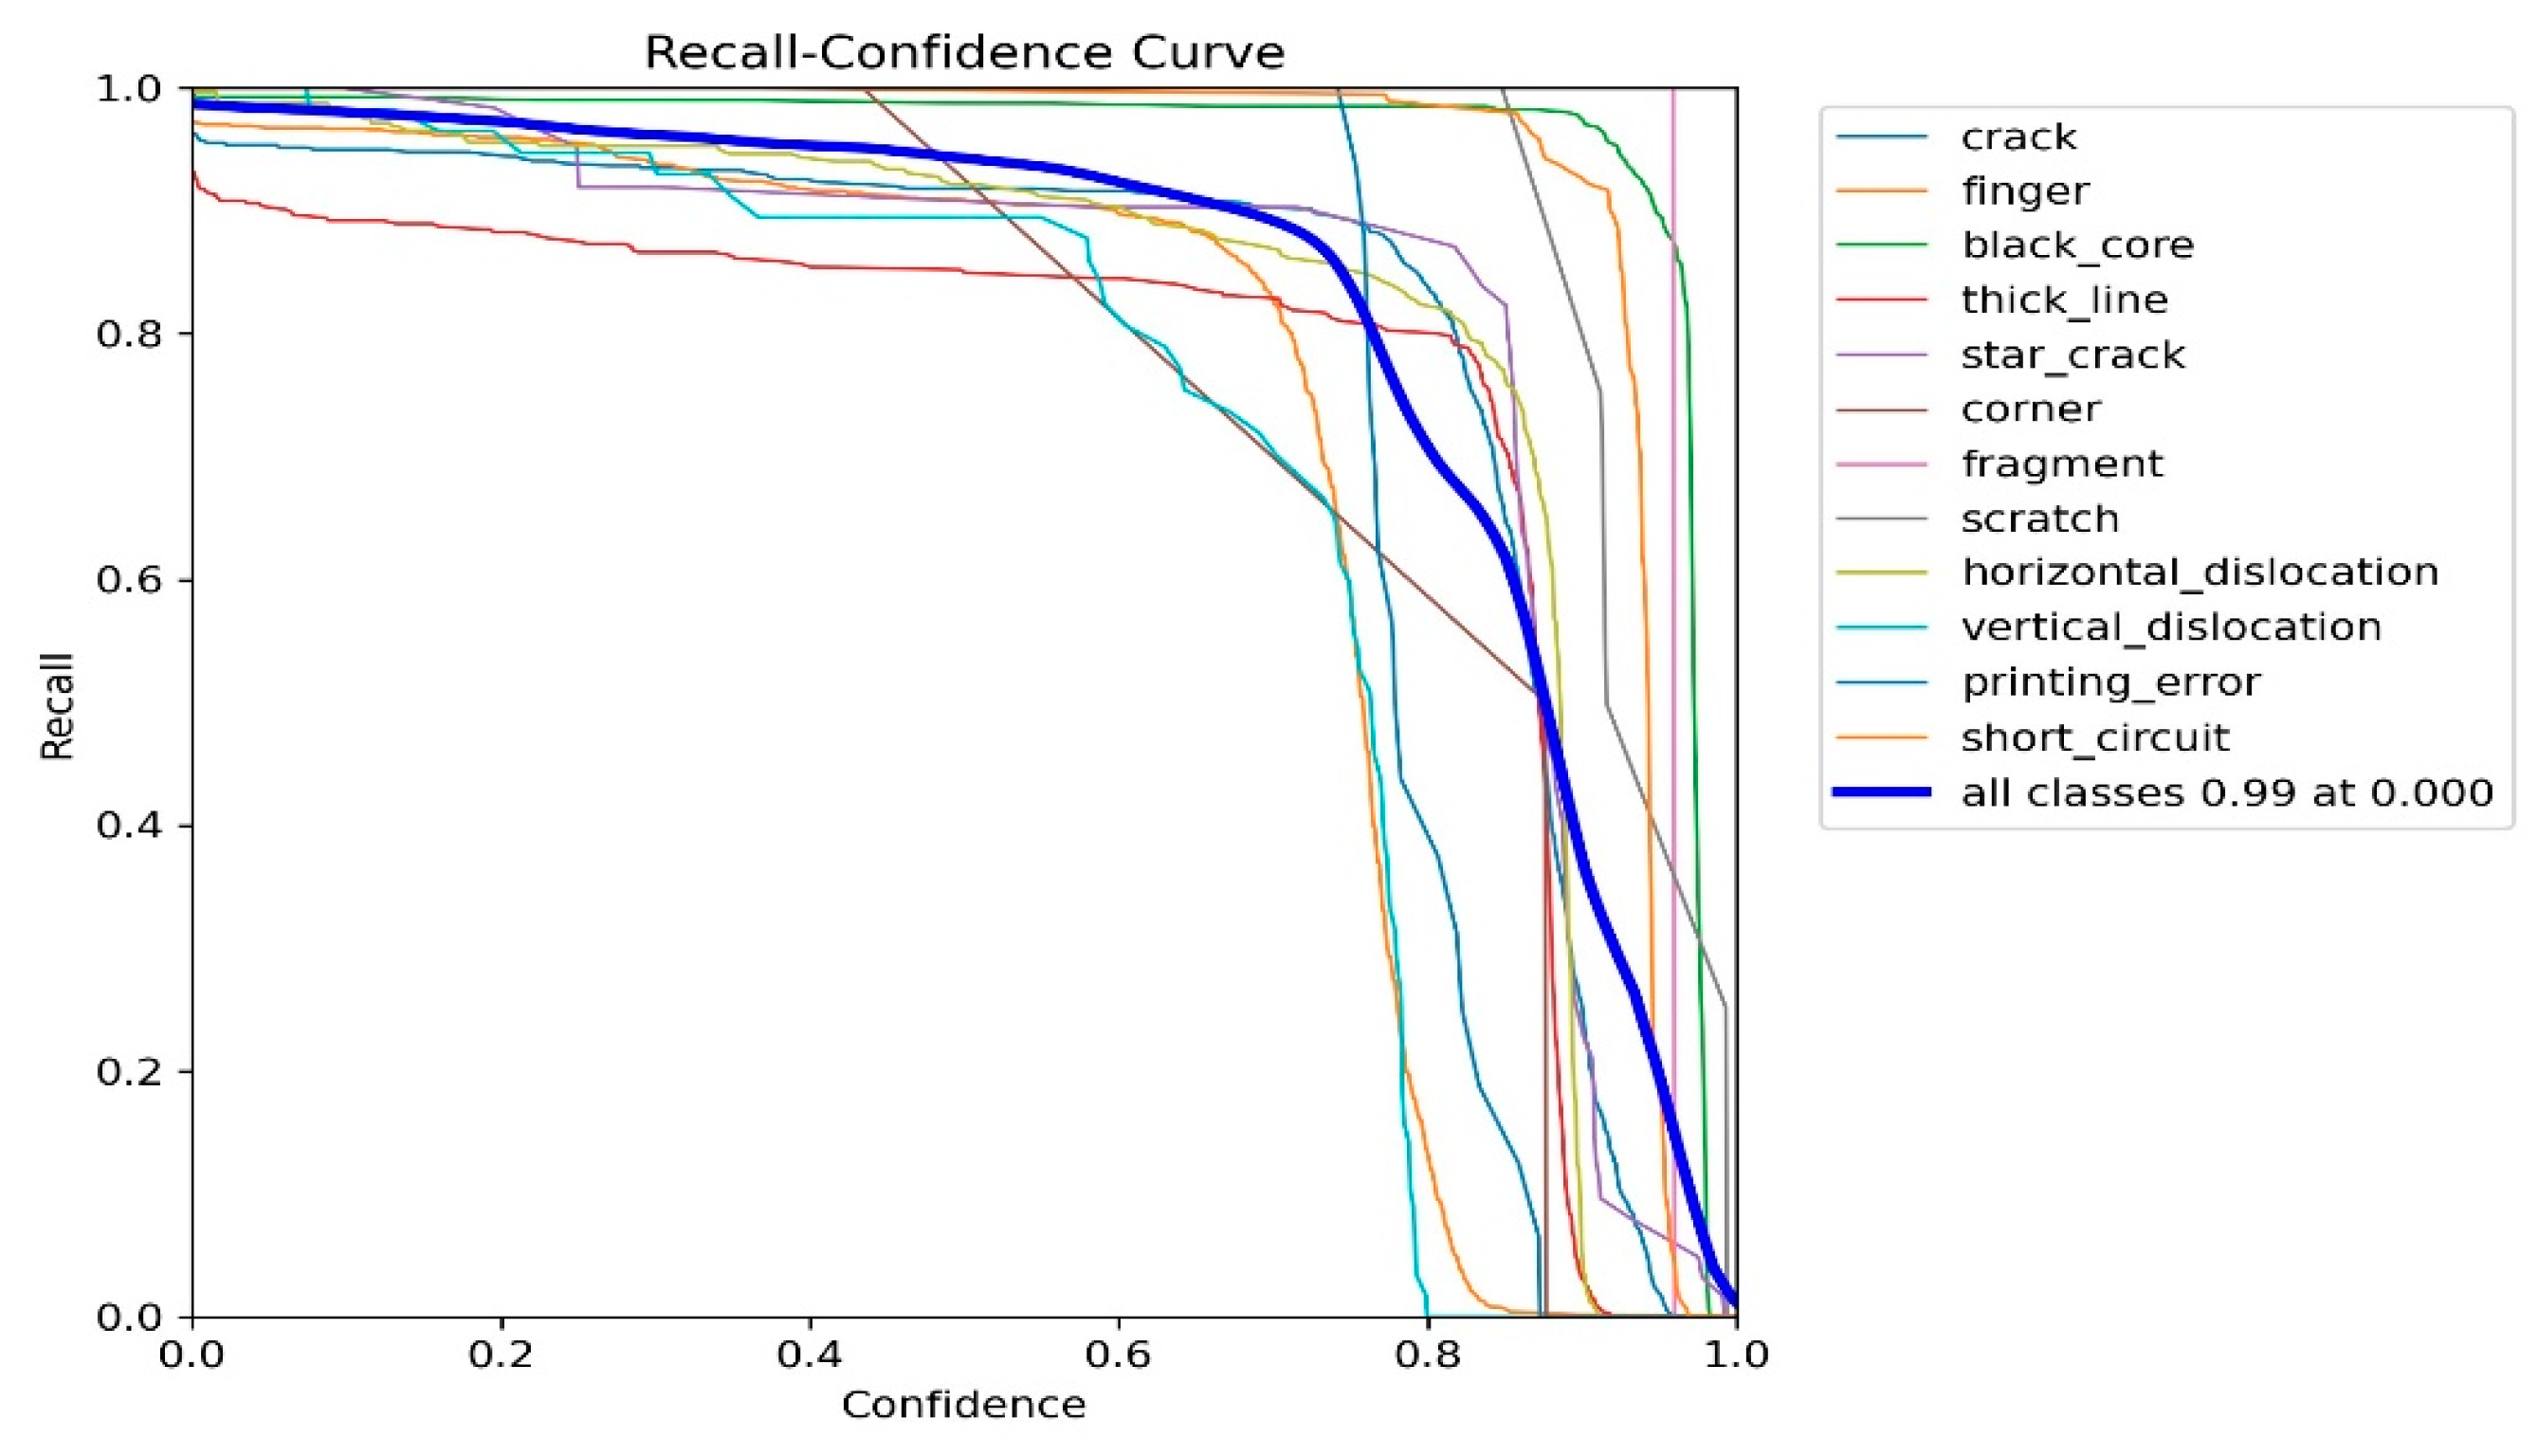
Figure 4 displays the Recall-Confidence Curve [
30] for the YOLOv10 model across different defect classes in the EL Solar Cells dataset. This curve illustrates the relationship between recall and the confidence threshold for each class, providing insights into the model’s performance. The figure shows that for most defect classes, recall remains high (>0.9) at lower confidence thresholds (0.0-0.2), indicating that the model effectively detects most defects even with low confidence scores. Notably, the black core class demonstrates the most consistent high recall across all confidence levels, suggesting that these defects are relatively easier to detect with high certainty.
The short circuit class maintains a high recall up to a confidence threshold of around 0.7 but then drops sharply, indicating that while the model detects these defects well, it is less confident in its predictions. In contrast, the star crack and vertical dislocation classes show a notable decline in recall as the confidence threshold increases, highlighting that these defect types are more challenging for the model to detect with high confidence.
The bold blue line represents the aggregate performance across all classes, showing a high recall (0.99) at a very low confidence threshold (0.0). As the confidence threshold increases, the overall recall declines, stabilizing around 0.6 at a confidence level of 0.8.
Overall, the Recall-Confidence Curve in
Figure 4 provides a comprehensive view of the model’s detection capabilities across different defect types. It highlights the model’s strong performance in detecting certain defects like black core and short circuit with high confidence while also identifying areas for improvement in detecting more subtle defects like star crack and vertical dislocation. This analysis is crucial for understanding the strengths and limitations of the YOLOv10 model in practical applications.
2.4. Evaluation Metrics
The performance of the Yolov10 network develop in this work for defect object detection in solar cells was quantitatively evaluated using standard evaluation metrics: accuracy, precision, recall, and the F1-score [
31]. These metrics provide insight into the model’s prediction capabilities and are defined by the relationships between true positive (TP), true negative (TN), false positive (FP), and false negative (FN) predictions. The network accuracy calculated using (8) measures the proportion of true results (both TP and TN) among the total number of cases examined. It reflects the overall correctness of the model but does not distinguish between the types of errors. In addition, the Yolov10 network precision assesses the model’s exactness by indicating the quality of the positive (defect) predictions made [
32], this can be calculated using (9). A higher precision relates to a lower false positive rate, crucial for minimizing the risk of passing defective cells.
Recall, expressed as (10), also known as sensitivity, evaluates the model’s completeness, representing its ability to detect all actual defects. A higher recall value ensures that fewer defects go unnoticed. In addition, using (11), we calculated the network F1-Score, which is the harmonic mean of precision and recall. It serves as a single metric that combines both Precision and Recall into one, balancing their contributions. The F1-Score is particularly useful when seeking a balance between precision and recall performance, especially in cases where there is an uneven class distribution, as is often the case in defect detection tasks.
3. Results
3.1. Detection Results on EL Solar Cells Dataset
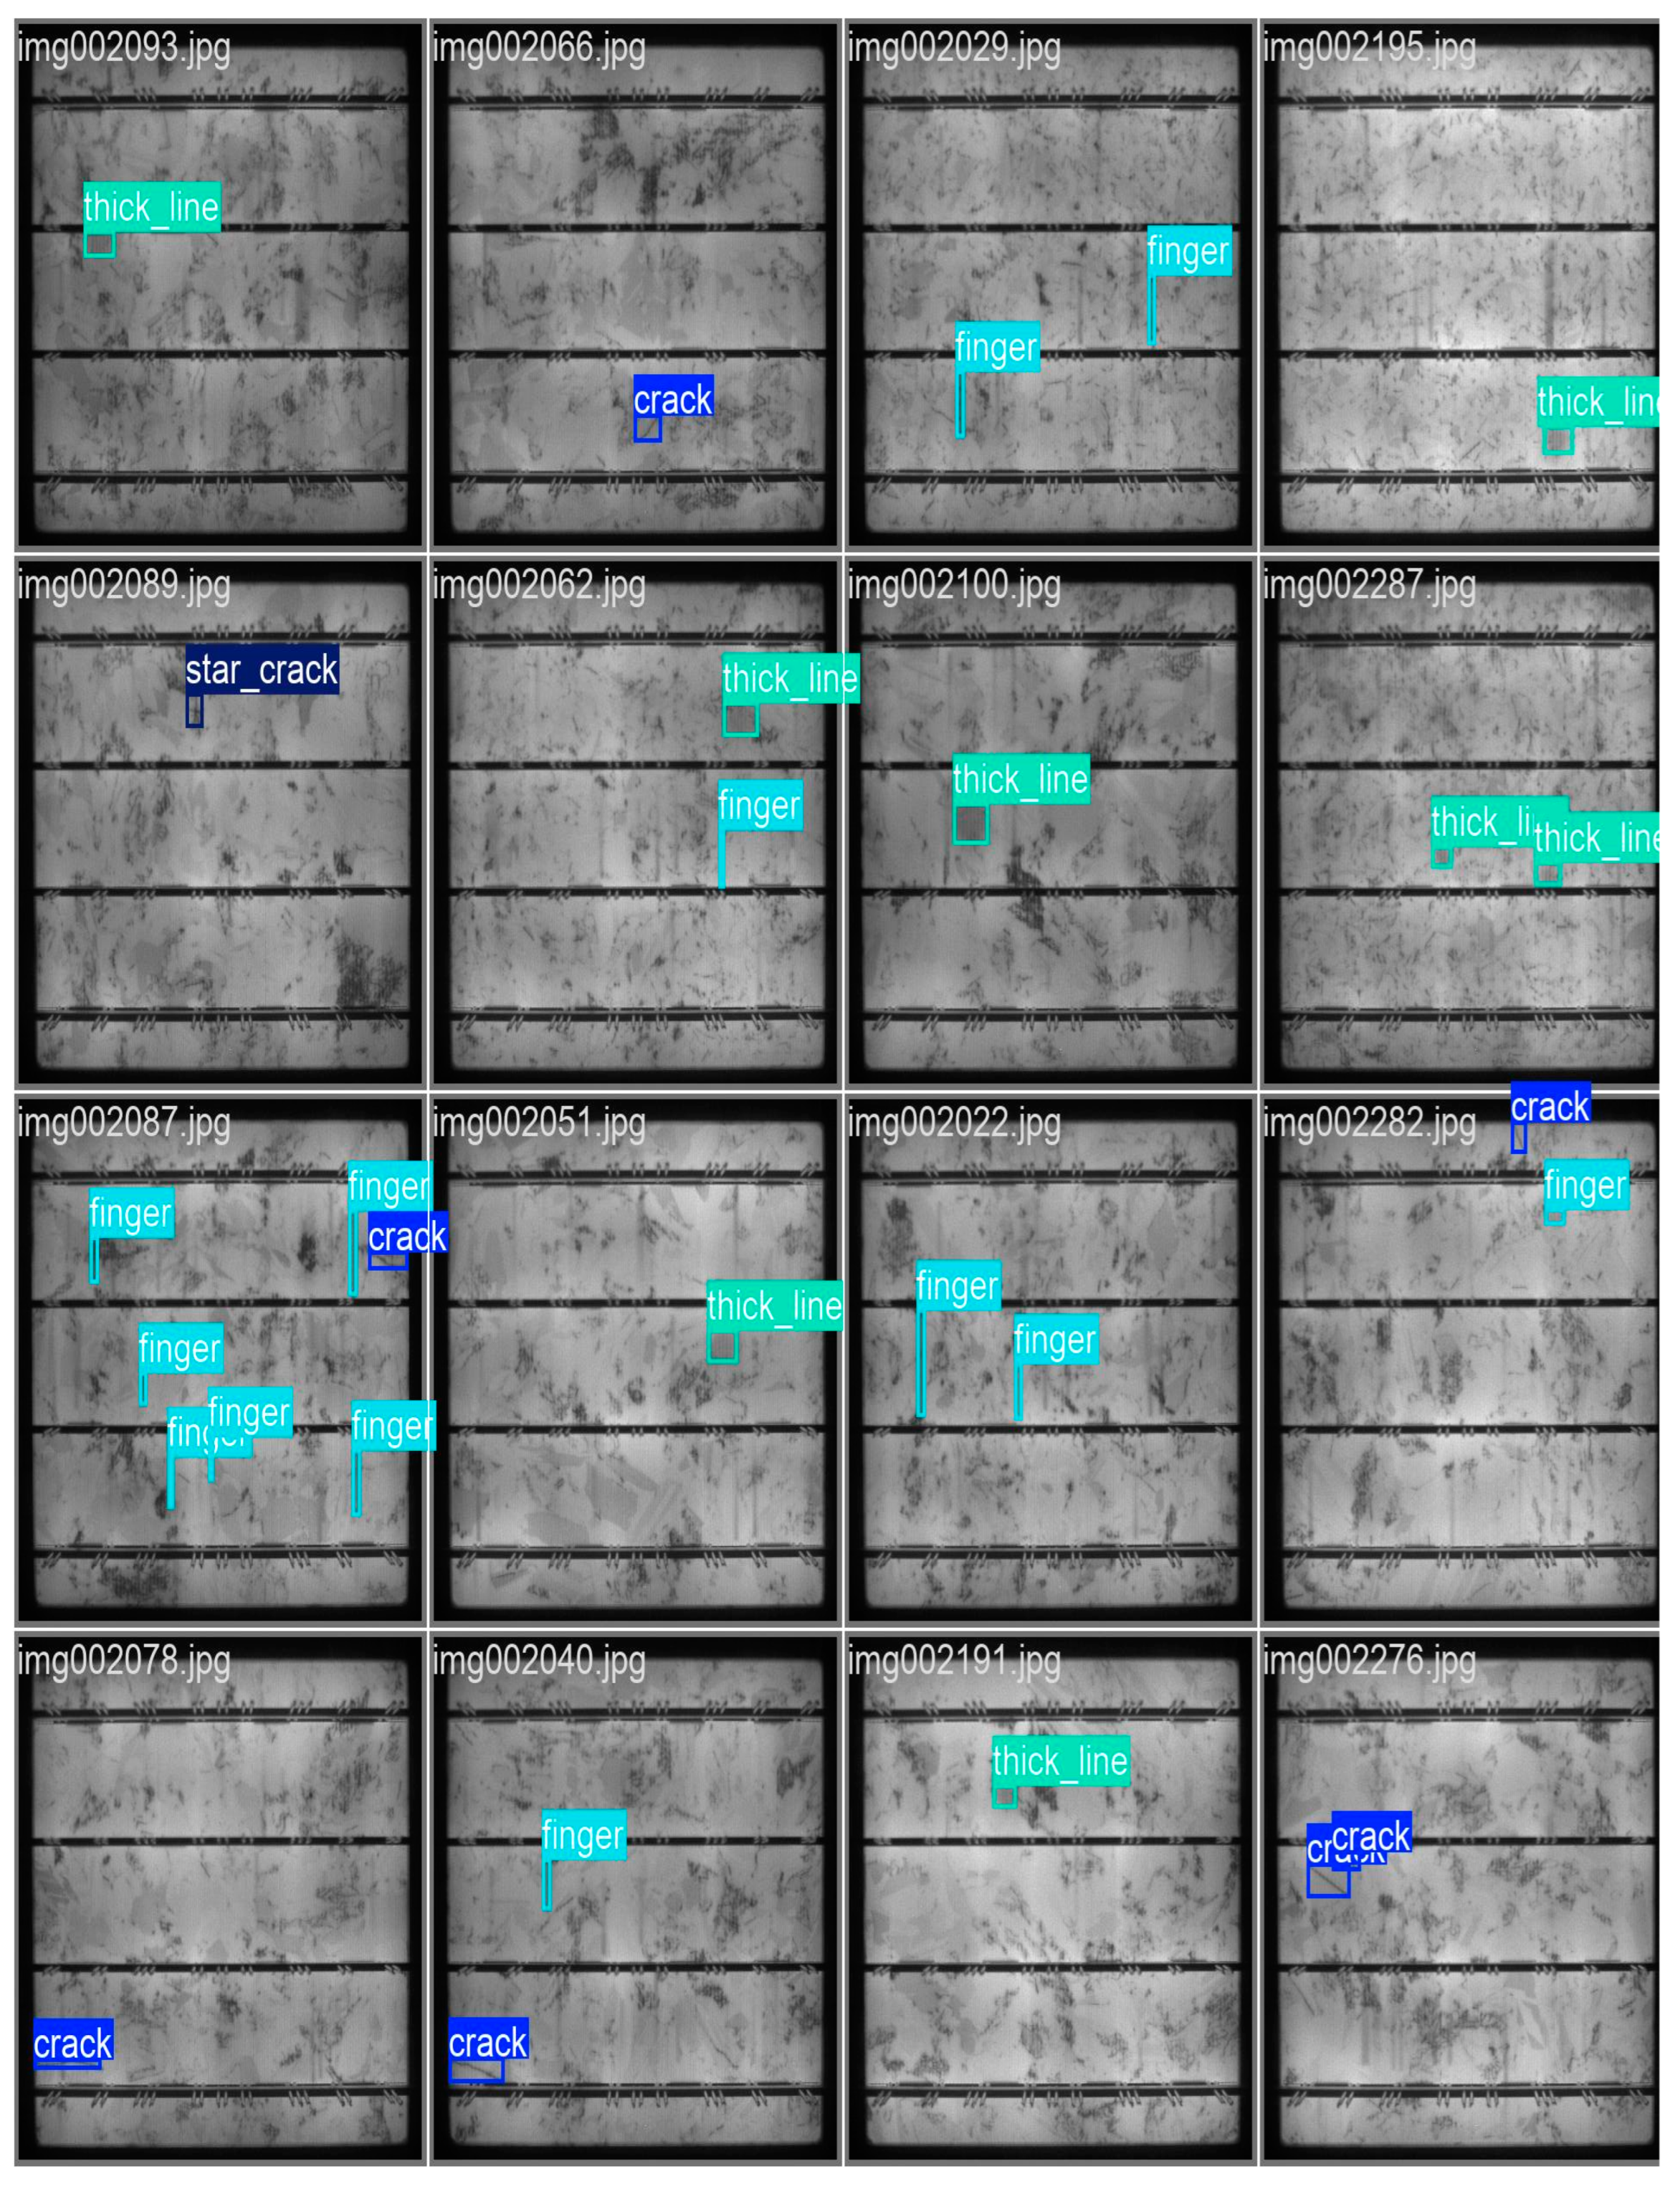
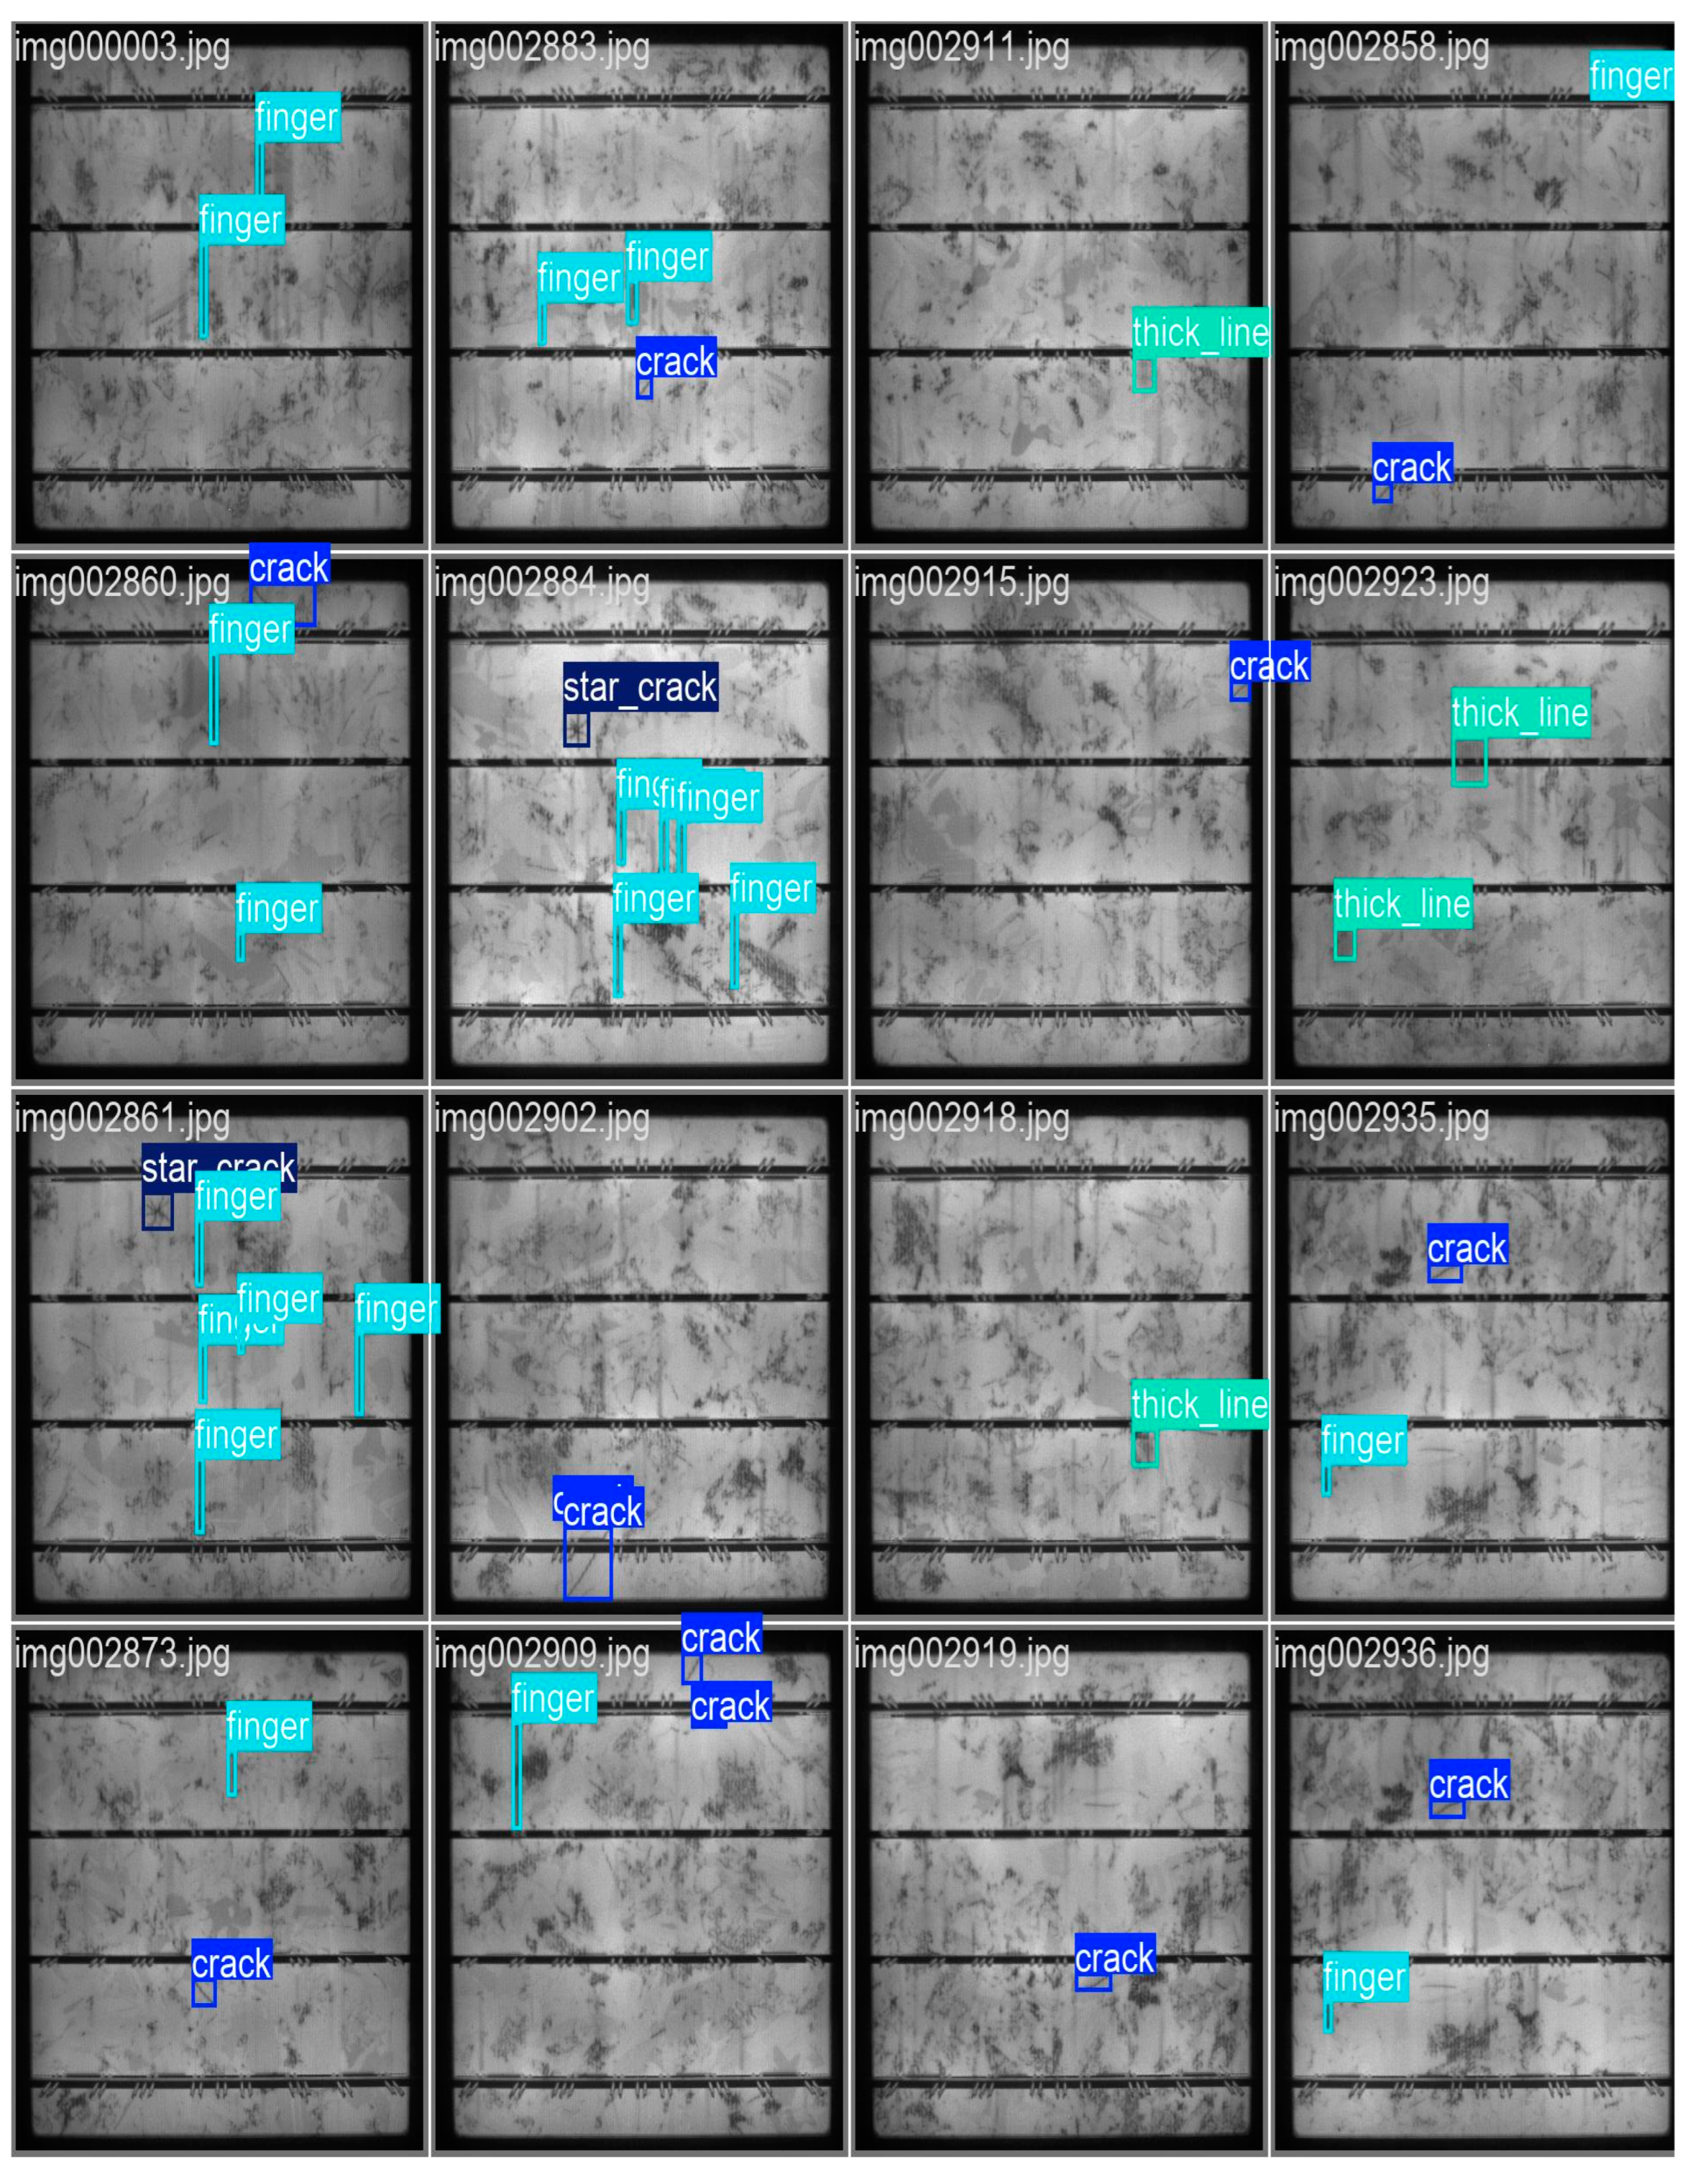
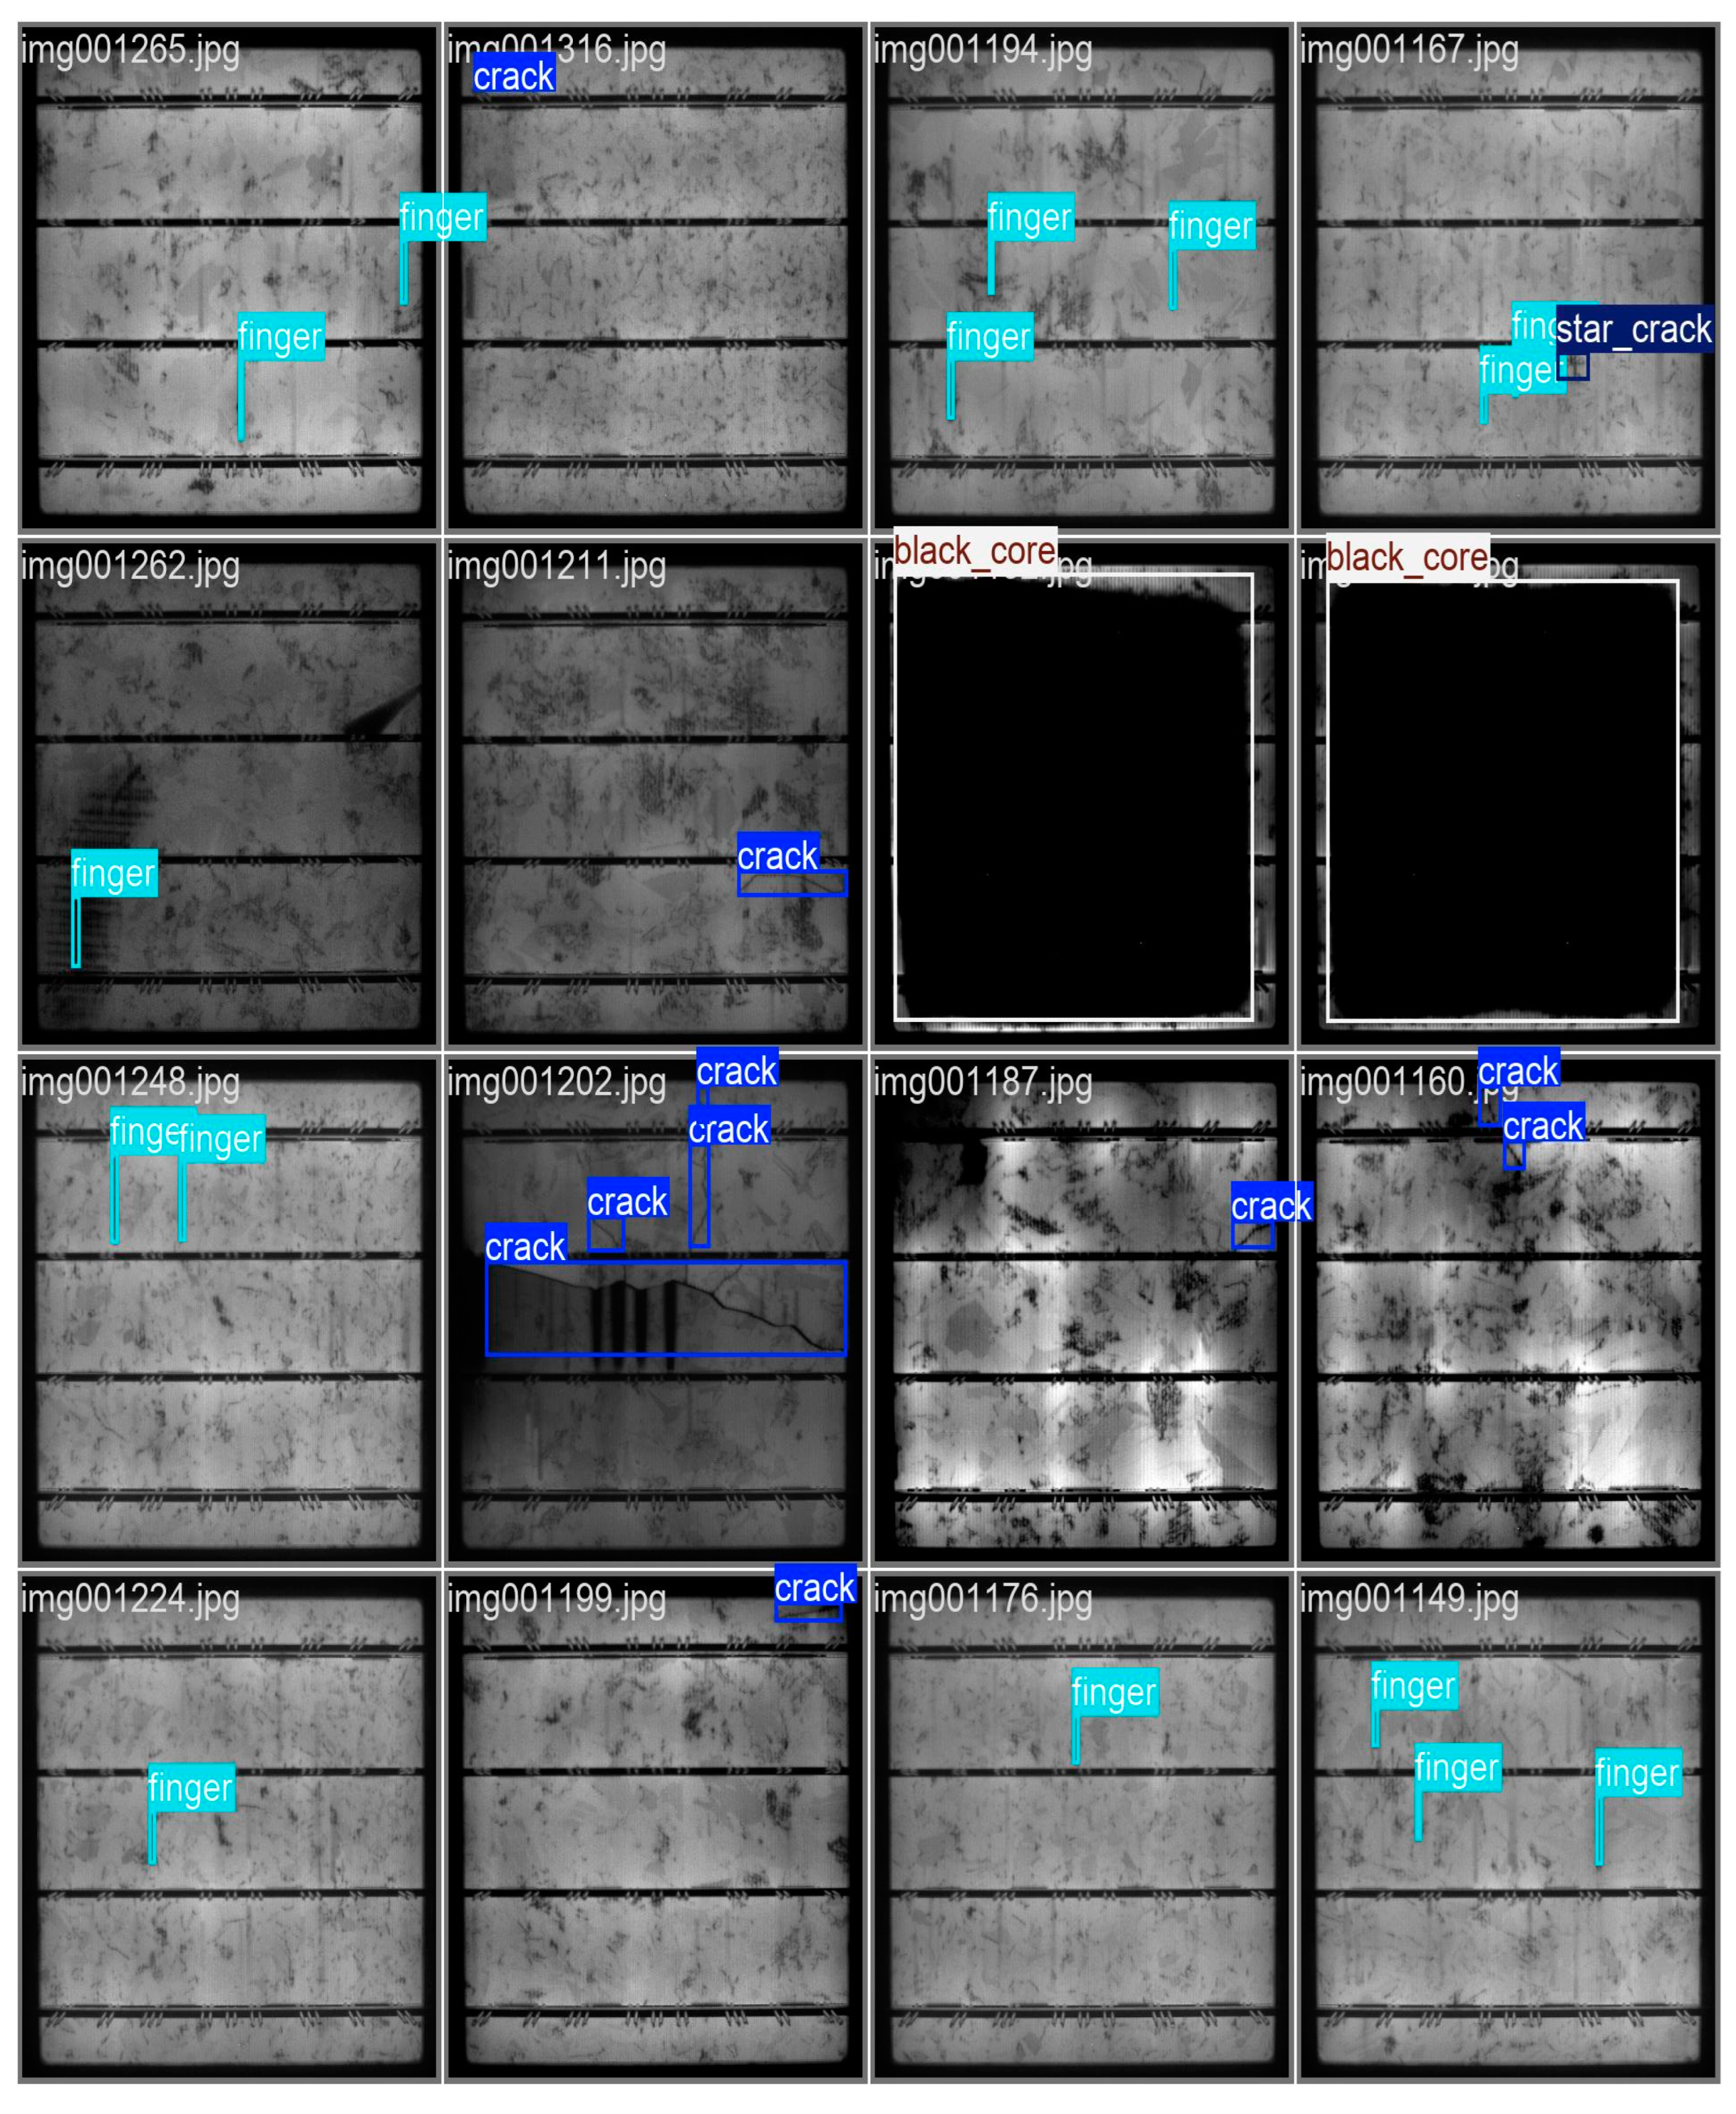
Figure 5 presents a series of detection results from the YOLOv10 model on the EL Solar Cells dataset. This figure showcases various defect types identified by the model, including cracks, finger interruptions, star cracks, and black core defects. Each image is annotated with bounding boxes and labels indicating the detected defect types, allowing for a detailed analysis of the model’s performance. The detection results demonstrate the model’s ability to accurately localize and classify multiple defect types across different samples (some more results are available in
Appendix A and
Appendix B). Key observations from
Figure 5 include:
Crack Detection: The model consistently detects cracks, as shown by the blue bounding boxes labeled “crack”. The bounding boxes accurately encompass the crack regions, indicating the model’s proficiency in identifying this defect type. The presence of multiple cracks within a single image, such as in img001202.jpg, further highlights the model’s capability to handle complex defect patterns.
Finger Interruption: The cyan bounding boxes labeled “finger” indicate the detection of finger interruptions. The model successfully identifies and localizes these interruptions across various images, such as img001265.jpg and img001194.jpg. The precision of the bounding boxes suggests the model’s effectiveness in recognizing subtle defects that might impact the solar cell’s performance.
Star Crack: The star crack defect is detected and labeled in image img001167.jpg. The model’s ability to correctly identify this defect type, despite its intricate pattern, underscores the robustness of the YOLOv10 architecture in handling diverse defect morphologies.
Black Core: The black core defect, characterized by a large, dark area, is detected in images img001211.jpg and img001204.jpg. The accuracy of the bounding boxes around the black core areas illustrates the model’s strength in identifying significant and easily recognizable defects.
Table 2 provides detailed performance metrics for each defect class, highlighting the model’s robustness across various defect types. Each defect class contains 500 samples, ensuring a balanced evaluation. The model achieves high true positive rates and low false positive rates across most classes. Specifically, classes like black core, corner, fragment, and scratch achieve perfect accuracy, precision, recall, and F1-score, all at 100%, demonstrating the model’s exceptional ability to detect these defects. Even for more challenging defect types such as thick line and star crack, the model maintains high performance with accuracy rates of 87% and 92%, respectively. The high precision values, such as 99% for short circuit and 96% for finger interruptions, indicate the model’s reliability in identifying defects with minimal false alarms.
3.2. Confusion Matrix and Precision-Recall Curve Analysis
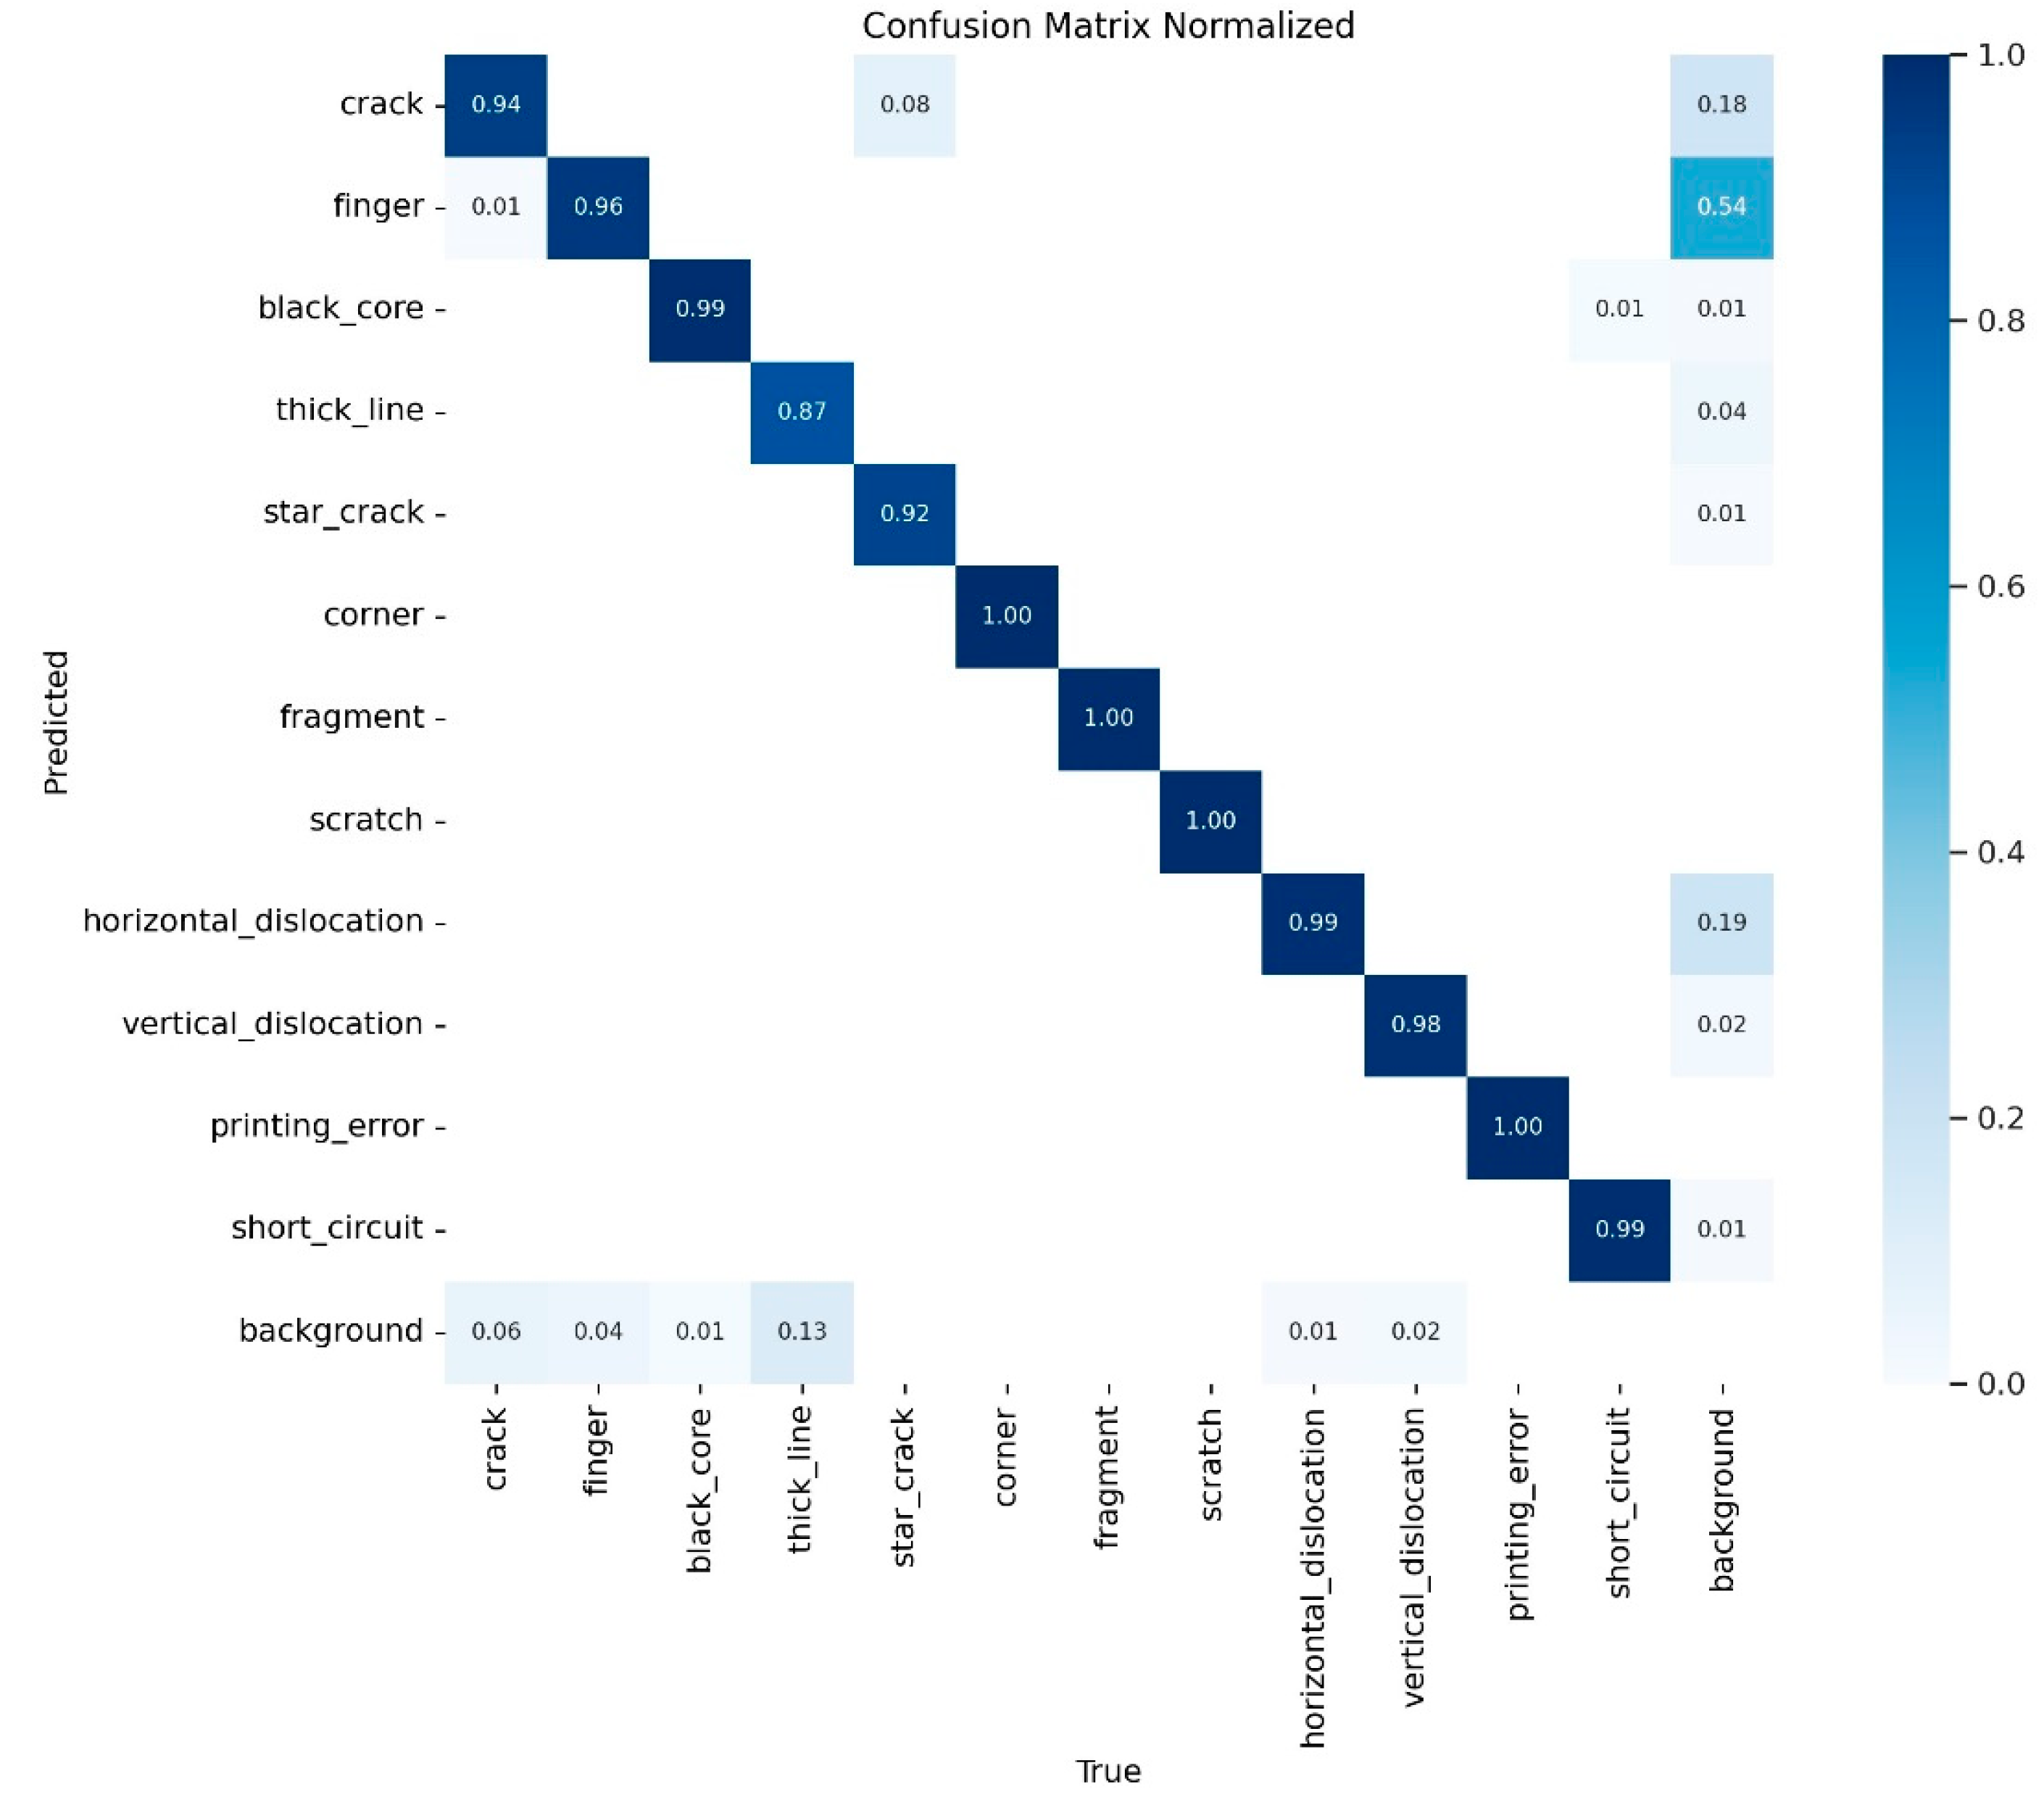
Figure 6 presents the normalized confusion matrix for the YOLOv10 model, illustrating the performance across all defect classes in the EL Solar Cells dataset. This matrix provides a detailed view of the model’s classification accuracy by showing the proportion of correct and incorrect predictions for each class. The diagonal elements of the matrix represent the correctly predicted instances for each class, with values close to 1 indicating high accuracy. Notable observations from the confusion matrix include:
Crack Detection: The model shows a high accuracy of 0.94 for the “crack” class, indicating robust performance in detecting cracks with minimal misclassification.
Finger Interruption: The “finger” class also exhibits high accuracy with a value of 0.96, demonstrating the model’s effectiveness in identifying finger interruptions.
Black Core: The model achieves near-perfect accuracy for the “black core” class at 0.99, underscoring its proficiency in detecting this prominent defect type.
Thick Line and Star Crack: The “thick line” and “star crack” classes show accuracies of 0.87 and 0.92, respectively, indicating reliable detection with some room for improvement.
Other Defects: Classes such as “corner,” “fragment,” “scratch,” “horizontal dislocation,” “vertical dislocation,” “printing error,” and “short circuit” all achieve perfect accuracies of 1.00, highlighting the model’s exceptional performance in these categories.
The off-diagonal elements represent misclassifications, with lower values indicating fewer errors. For instance, there is a small amount of misclassification between the “crack” and “background” classes (0.06), suggesting that some cracks are incorrectly classified as background, though this is minimal.
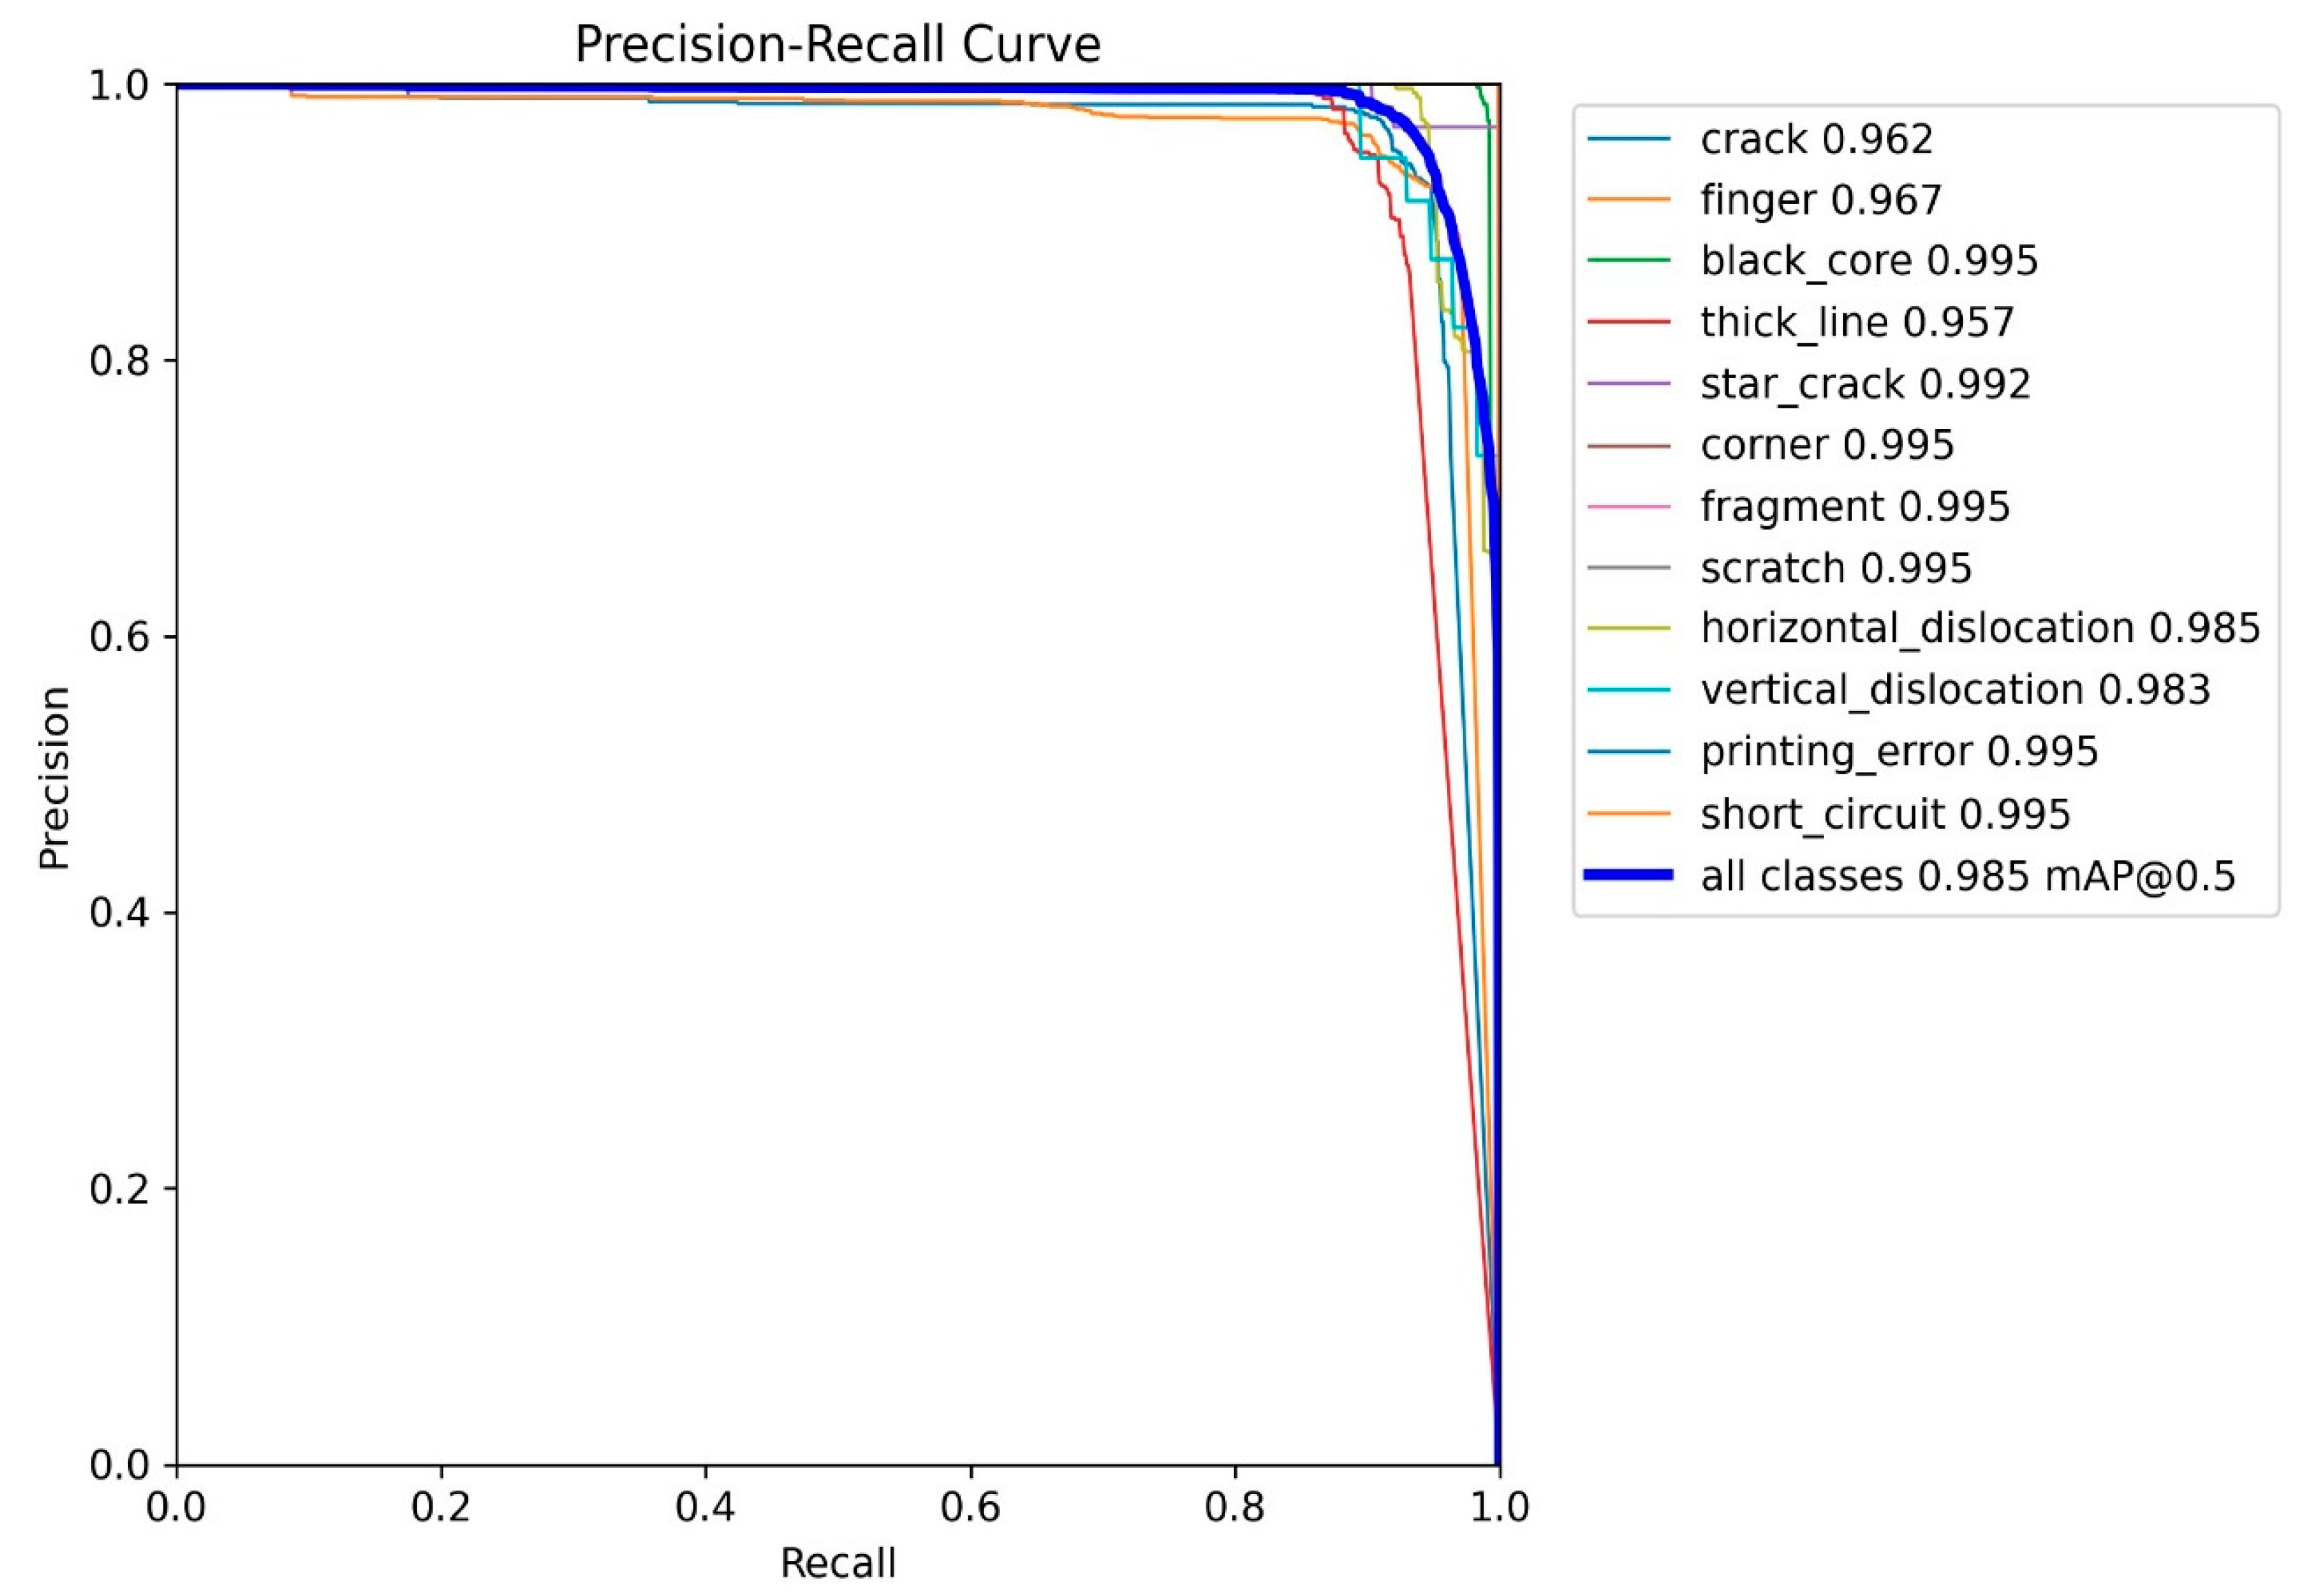
Figure 7 presents the Precision-Recall Curve for the YOLOv10 model, further evaluating its performance across all defect classes in the EL Solar Cells dataset. The curve illustrates the trade-off between precision and recall for each class, providing a comprehensive view of the model’s detection capabilities. Notable observations from the Precision-Recall Curve include:
High Precision and Recall for Most Classes: Classes such as “black core,” “corner,” “fragment,” “scratch,” “printing error,” and “short circuit” exhibit near-perfect precision and recall values (0.995), indicating excellent detection performance with minimal false positives and false negatives.
Crack and Finger Interruption: The precision and recall values for “crack” and “finger” are slightly lower, at 0.962 and 0.967 respectively, which aligns with the confusion matrix results, confirming the model’s robustness in detecting these defects with high confidence.
Thick Line: The “thick line” class shows the lowest precision at 0.957, suggesting that this defect type poses the greatest challenge for the model, consistent with the accuracy observed in the confusion matrix.
Overall Performance: The overall mean Average Precision (mAP@0.5) across all classes is 0.985, reflecting the model’s high effectiveness in detecting a wide range of defects in the unseen EL solar cells dataset.
3.3. Comparitive Analysis
This section provides a comparative analysis of recent deep learning models applied to defect detection in solar cells using EL imaging, summarized in
Table 3. The analysis highlights the key models, datasets, accuracy, and notable comments from each study, comparing them to the current study’s results.
The study by [
33] achieved 87.38% accuracy using Faster R-CNN with attention mechanisms on a custom dataset of 3629 images, demonstrating enhanced detection of fine-grained defects, although real-time processing was not achieved. The research by [
34] improved detection rates to a range of 72.53% to 100% using the Bidirectional Attention Feature Pyramid Network, which also utilized a custom dataset of 3629 images. Despite the improved detection rates for varied defect sizes, real-time processing remained challenging. In the work by [
35], ensemble models using ResNet152-Xception were applied to mixed datasets comprising 2223 images, achieving an accuracy of 92.13%. This approach demonstrated robust detection across multiple defect types, albeit with high computational costs. Additionally, the study by [
36] addressed data imbalance issues using deep learning combined with feature fusion techniques on a public dataset of over 45,000 images, resulting in accuracies ranging from 92.1% to 98.4%. This method was effective in handling data imbalance and achieving high precision in multi-class defect detection.
In comparison, our YOLOv10 model demonstrated superior performance with a 98.5% accuracy on a larger dataset of 10,500 images, marking the first application of YOLOv10 for EL PV defect detection. This comparison reveals significant improvements in accuracy and processing capabilities, showcasing the advancements made by YOLOv10 in addressing the limitations of previous models. The exceptional performance of YOLOv10 in real-time defect detection makes it a substantial contribution to the field, offering a highly efficient and accurate solution for quality control in solar cell manufacturing. Therefore,
Table 3 encapsulates the progress in the field, indicating that while earlier models made strides in defect detection accuracy and handling diverse defect types, they often struggled with real-time processing and maintaining high accuracy across varied defect scenarios. YOLOv10’s design, incorporating the CIB and PSA modules, effectively balances computational efficiency with detection accuracy.
4. Conclusions
This study introduced the YOLOv10 model for defect detection in solar cells using EL imaging, achieving a notable accuracy of 98.5% on a dataset of 10,500 images. The YOLOv10 model’s innovative integration of CIB and PSA modules contributed to its superior performance, balancing computational efficiency with detection accuracy. The confusion matrix analysis demonstrated high classification accuracy across all 12 defect classes, with several classes achieving near-perfect detection rates. For instance, black core, corner, fragment, scratch, and short circuit defects were detected with 100% accuracy. Even more challenging defect types, such as thick line and star crack, were accurately detected with rates of 87% and 92%, respectively. The precision-recall curve analysis further validated the model’s robustness, showing high precision and recall values across most classes, with an overall mean Average Precision (mAP@0.5) of 98.5%. The exceptional performance of YOLOv10 in real-time defect detection makes it a significant advancement in the field, offering an efficient and accurate solution for quality control in photovoltaic manufacturing.
Future research can build on these results by further refining the YOLOv10 architecture to reduce computational load without compromising accuracy. Expanding the dataset to include more diverse and larger datasets will improve the model’s generalizability and robustness. Applying transfer learning techniques to adapt YOLOv10 for other types of industrial defect detection can broaden its utility across different manufacturing sectors. Developing seamless integration with Internet of Things (IoT) frameworks can facilitate real-time monitoring and automated quality control in large-scale solar cell production lines. Exploring advanced image preprocessing and augmentation techniques can further enhance the model’s performance by providing better-quality input data. Finally, conducting extensive testing and validation in real-world manufacturing environments will provide insights into the practical challenges and necessary adjustments for deploying the YOLOv10 model on a commercial scale.
In summary, this study sets a new benchmark for defect detection in solar cells, showcasing the potential of YOLOv10 to revolutionize quality control processes in photovoltaic manufacturing. The promising results and identified future work directions pave the way for continued advancements and broader applications of deep learning in industrial defect detection.
Author Contributions
Conceptualization, L.A., Y.S. and M.D.; methodology, L.A. and Y.S.; software, L.A.; validation, L.A., Y.S. and M.D.; formal analysis, M.D.; data curation, L.A.; writing—original draft preparation, L.A.; writing—review and editing, Y.S. and M.D.; supervision, M.D.; All authors have read and agreed to the published version of the manuscript.
Funding
This research received no external funding.
Data Availability Statement
Data will be available on responsible request to the corresponding author, M.D, Mahmoud.dhimish@york.ac.uk. The original contributions presented in the study are included in the article/supplementary material, further inquiries can be directed to the corresponding author/s.
Conflicts of Interest
The authors declare no conflicts of interest.
References
- Kim, J.; Rabelo, M.; Padi, S.P.; Yousuf, H.; Cho, E.C.; Yi, J. A review of the degradation of photovoltaic modules for life expectancy. Energies 2021, 14, 4278. [Google Scholar] [CrossRef]
- Abubakar, A.; Almeida, C.F.M.; Gemignani, M. Review of artificial intelligence-based failure detection and diagnosis methods for solar photovoltaic systems. Machines 2021, 9, 328. [Google Scholar] [CrossRef]
- Jumaboev, S.; Jurakuziev, D.; Lee, M. Photovoltaics plant fault detection using deep learning techniques. Remote Sens. 2022, 14, 3728. [Google Scholar] [CrossRef]
- Hwang, M.H.; Kim, Y.G.; Lee, H.S.; Kim, Y.D.; Cha, H.R. A study on the improvement of efficiency by detection solar module faults in deteriorated photovoltaic power plants. Appl. Sci. 2021, 11, 727. [Google Scholar] [CrossRef]
- Hussain, M.; Khanam, R. In-Depth Review of YOLOv1 to YOLOv10 Variants for Enhanced Photovoltaic Defect Detection. Solar 2024, 4, 351–386. [Google Scholar] [CrossRef]
- Redmon, J.; Divvala, S.; Girshick, R.; Farhadi, A. You only look once: Unified, real-time object detection. In Proceedings of the IEEE Conference on Computer Vision and Pattern Recognition, Las Vegas, NV, USA, 27–30 June 2016; pp. 779–788. [Google Scholar]
- Terven, J.; Córdova-Esparza, D.M.; Romero-González, J.A. A comprehensive review of YOLO architectures in computer vision: From YOLOv1 to YOLOv8 and YOLO-NAS. Mach. Learn. Knowl. Extr. 2023, 5, 1680–1716. [Google Scholar] [CrossRef]
- Hussain, M. YOLOv1 to v8: Unveiling each variant–a comprehensive review of YOLO. IEEE Access 2024, 12, 42816–42833. [Google Scholar] [CrossRef]
- Ahmad, T.; Ma, Y.; Yahya, M.; Ahmad, B.; Nazir, S.; Haq, A.U. Object detection through modified YOLO neural network. Sci. Program. 2020, 2020, 8403262. [Google Scholar] [CrossRef]
- Redmon, J.; Farhadi, A. YOLOv3: An incremental improvement. arXiv 2018, arXiv:1804.02767. [Google Scholar]
- Sujee, R.; Shanthosh, D.; Sudharsun, L. Fabric defect detection using YOLOv2 and YOLO v3 tiny. In Computational Intelligence in Data Science; Third IFIP TC 12 International Conference, ICCIDS 2020, Chennai, India, 20–22 February 2020; Revised Selected Papers; Springer International Publishing: Cham, Switzerland, 2020; pp. 196–204. [Google Scholar]
- Nepal, U.; Eslamiat, H. Comparing YOLOv3, YOLOv4 and YOLOv5 for autonomous landing spot detection in faulty UAVs. Sensors 2022, 22, 464. [Google Scholar] [CrossRef]
- Sapkota, R.; Meng, Z.; Ahmed, D.; Churuvija, M.; Du, X.; Ma, Z.; Karkee, M. Comprehensive performance evaluation of YOLOv10, YOLOv9 and YOLOv8 on detecting and counting fruitlet in complex orchard environments. arXiv 2024, arXiv:2407.12040. [Google Scholar]
- Dhimish, M.; Hu, Y. Rapid testing on the effect of cracks on solar cells output power performance and thermal operation. Sci. Rep. 2022, 12, 12168. [Google Scholar] [CrossRef]
- Dhimish, M.; Mather, P. Ultrafast high-resolution solar cell cracks detection process. IEEE Trans. Ind. Inform. 2019, 16, 4769–4777. [Google Scholar] [CrossRef]
- Rai, M.; Wong, L.H.; Etgar, L. Effect of perovskite thickness on electroluminescence and solar cell conversion efficiency. J. Phys. Chem. Lett. 2020, 11, 8189–8194. [Google Scholar] [CrossRef]
- Bartler, A.; Mauch, L.; Yang, B.; Reuter, M.; Stoicescu, L. Automated detection of solar cell defects with deep learning. In Proceedings of the 2018 26th European Signal Processing Conference (EUSIPCO), Rome, Italy, 3–7 September 2018; pp. 2035–2039. [Google Scholar]
- Ou, J.; Wang, J.; Xue, J.; Wang, J.; Zhou, X.; She, L.; Fan, Y. Infrared image target detection of substation electrical equipment using an improved faster R-CNN. IEEE Trans. Power Deliv. 2022, 38, 387–396. [Google Scholar] [CrossRef]
- Hassan, S.; Dhimish, M. A Survey of CNN-Based Approaches for Crack Detection in Solar PV Modules: Current Trends and Future Directions. Solar 2023, 3, 663–683. [Google Scholar] [CrossRef]
- Chen, A.; Li, X.; Jing, H.; Hong, C.; Li, M. Anomaly detection algorithm for photovoltaic cells based on lightweight Multi-Channel spatial attention mechanism. Energies 2023, 16, 1619. [Google Scholar] [CrossRef]
- Yang, J.; Li, S.; Wang, Z.; Dong, H.; Wang, J.; Tang, S. Using deep learning to detect defects in manufacturing: A comprehensive survey and current challenges. Mater. 2020, 13, 5755. [Google Scholar] [CrossRef]
- Monkam, P.; Qi, S.; Xu, M.; Li, H.; Han, F.; Teng, Y.; Qian, W. Ensemble learning of multiple-view 3D-CNNs model for micro-nodules identification in CT images. IEEE Access 2018, 7, 5564–5576. [Google Scholar] [CrossRef]
- Zhang, B.; Qi, S.; Monkam, P.; Li, C.; Yang, F.; Yao, Y.D.; Qian, W. Ensemble learners of multiple deep CNNs for pulmonary nodules classification using CT images. IEEE Access 2019, 7, 110358–110371. [Google Scholar] [CrossRef]
- Wang, A.; Chen, H.; Liu, L.; Chen, K.; Lin, Z.; Han, J.; Ding, G. YOLOv10: Real-time end-to-end object detection. arXiv 2024, arXiv:2405.14458. [Google Scholar]
- Sapkota, R.; Qureshi, R.; Calero, M.F.; Hussain, M.; Badjugar, C.; Nepal, U.; Karkee, M. YOLOv10 to its genesis: A decadal and comprehensive review of the You Only Look Once series. arXiv 2024, arXiv:2406.19407. [Google Scholar]
- Tan, H.; Liu, X.; Yin, B.; Li, X. MHSA-Net: Multihead self-attention network for occluded person re-identification. IEEE Trans. Neural Netw. Learn. Syst. 2022, 34, 8210–8224. [Google Scholar] [CrossRef]
- Su, B.; Zhou, Z.; Chen, H. PVEL-AD: A Large-Scale Open-World Dataset for Photovoltaic Cell Anomaly Detection. IEEE Transactions on Industrial Informatics 2023, 19, 404–413. [Google Scholar] [CrossRef]
- Mahasin, M.; Dewi, I.A. Comparison of CSPDarkNet53, CSPResNeXt-50, and EfficientNet-B0 backbones on YOLO v4 as object detector. Int. J. Eng. Sci. Inf. Technol. 2022, 2, 64–72. [Google Scholar] [CrossRef]
- Gouider, C.; Seddik, H. YOLOv4 enhancement with efficient channel recalibration approach in CSPdarknet53. In Proceedings of the 2022 IEEE Information Technologies & Smart Industrial Systems (ITSIS), Hammamet, Tunisia, 22–24 July 2022; pp. 1–6. [Google Scholar]
- Liu, B. YOLO-M: An Efficient YOLO Variant with MobileOne Backbone for Real-Time License Plate Detection. In Proceedings of the 2024 5th International Seminar on Artificial Intelligence, Networking and Information Technology (AINIT), Beijing, China, 1–3 March 2024; pp. 2251–2257. [Google Scholar]
- Yacouby, R.; Axman, D. Probabilistic extension of precision, recall, and f1 score for more thorough evaluation of classification models. In Proceedings of the First Workshop on Evaluation and Comparison of NLP Systems, Barcelona, Spain, 12 November 2020; pp. 79–91. [Google Scholar]
- Tian, Y.; Deng, N.; Xu, J.; Wen, Z. A fine-grained dataset for sewage outfalls objective detection in natural environments. Sci. Data 2024, 11, 724. [Google Scholar] [CrossRef]
- Su, B.; Chen, H.; Chen, P.; Bian, G.; Liu, K.; Liu, W. Deep Learning-Based Solar-Cell Manufacturing Defect Detection with Complementary Attention Network. IEEE Transactions on Industrial Informatics 2020, 17, 4084–4095. [Google Scholar] [CrossRef]
- Su, B.; Chen, H.; Zhou, Z. BAF-Detector: An Efficient CNN-Based Detector for Photovoltaic Cell Defect Detection. IEEE Transactions on Industrial Electronics 2022, 69, 3161–3171. [Google Scholar] [CrossRef]
- Wang, J.; Bi, L.; Sun, P.; Jiao, X.; Ma, X.; Lei, X.; Luo, Y. Deep-learning-based automatic detection of photovoltaic cell defects in electroluminescence images. Sensors 2023, 23, 297. [Google Scholar] [CrossRef]
- Parikh, H.R.; Buratti, Y.; Spataru, S.; Villebro, F.; Reis Benatto, G.A.D.; Poulsen, P.B.; Hameiri, Z. Solar cell cracks and finger failure detection using statistical parameters of electroluminescence images and machine learning. Appl. Sci. 2020, 10, 8834. [Google Scholar] [CrossRef]
|
Disclaimer/Publisher’s Note: The statements, opinions and data contained in all publications are solely those of the individual author(s) and contributor(s) and not of MDPI and/or the editor(s). MDPI and/or the editor(s) disclaim responsibility for any injury to people or property resulting from any ideas, methods, instructions or products referred to in the content. |
© 2024 by the authors. Licensee MDPI, Basel, Switzerland. This article is an open access article distributed under the terms and conditions of the Creative Commons Attribution (CC BY) license (http://creativecommons.org/licenses/by/4.0/).
