Submitted:
29 July 2024
Posted:
30 July 2024
You are already at the latest version
Abstract
Keywords:
1. Introduction
2. Materials and Methods
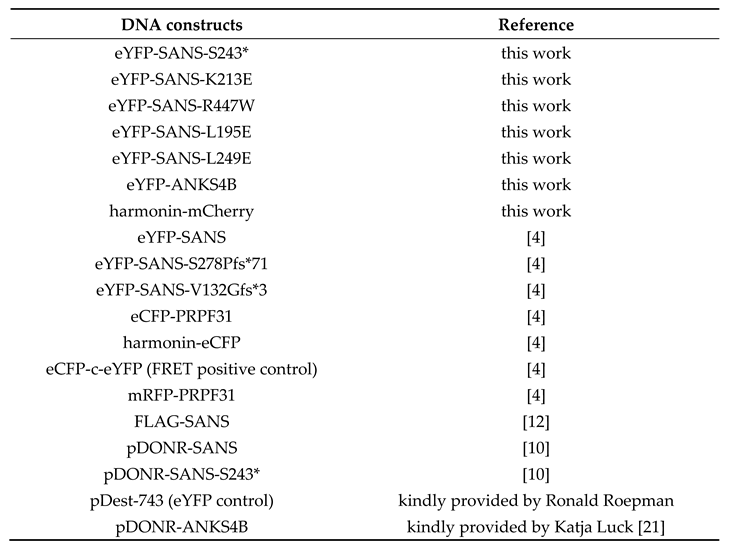
2.1. DNA Constructs
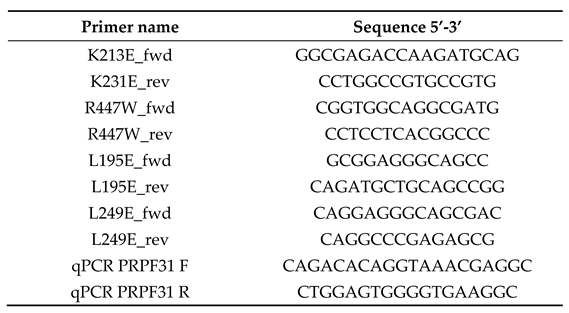
2.2. PCR Primers
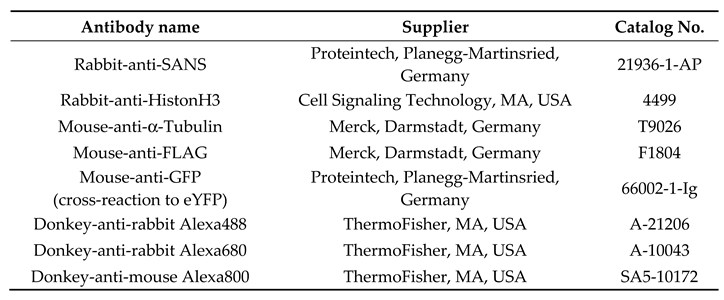
2.3. Antibodies
2.4. Cloning
2.5. Cell Lines and Culture
2.5. Immunocytochemistry
2.6. Fluorescence (co-)Localization Observation
2.7. Fluorescence Microscopy
2.8. In Silico Prediction
2.9. CellProfiler Based Nuclear/Cytoplasmic Ratio Quantification
2.10. CellFractionation Assay
2.11. Fluorescence Resonance Energy Transfer (FRET) Acceptor Photobleaching Assay
2.12. SANS Nuclear Interactome Analysis
2.13. Statistics
3. Results
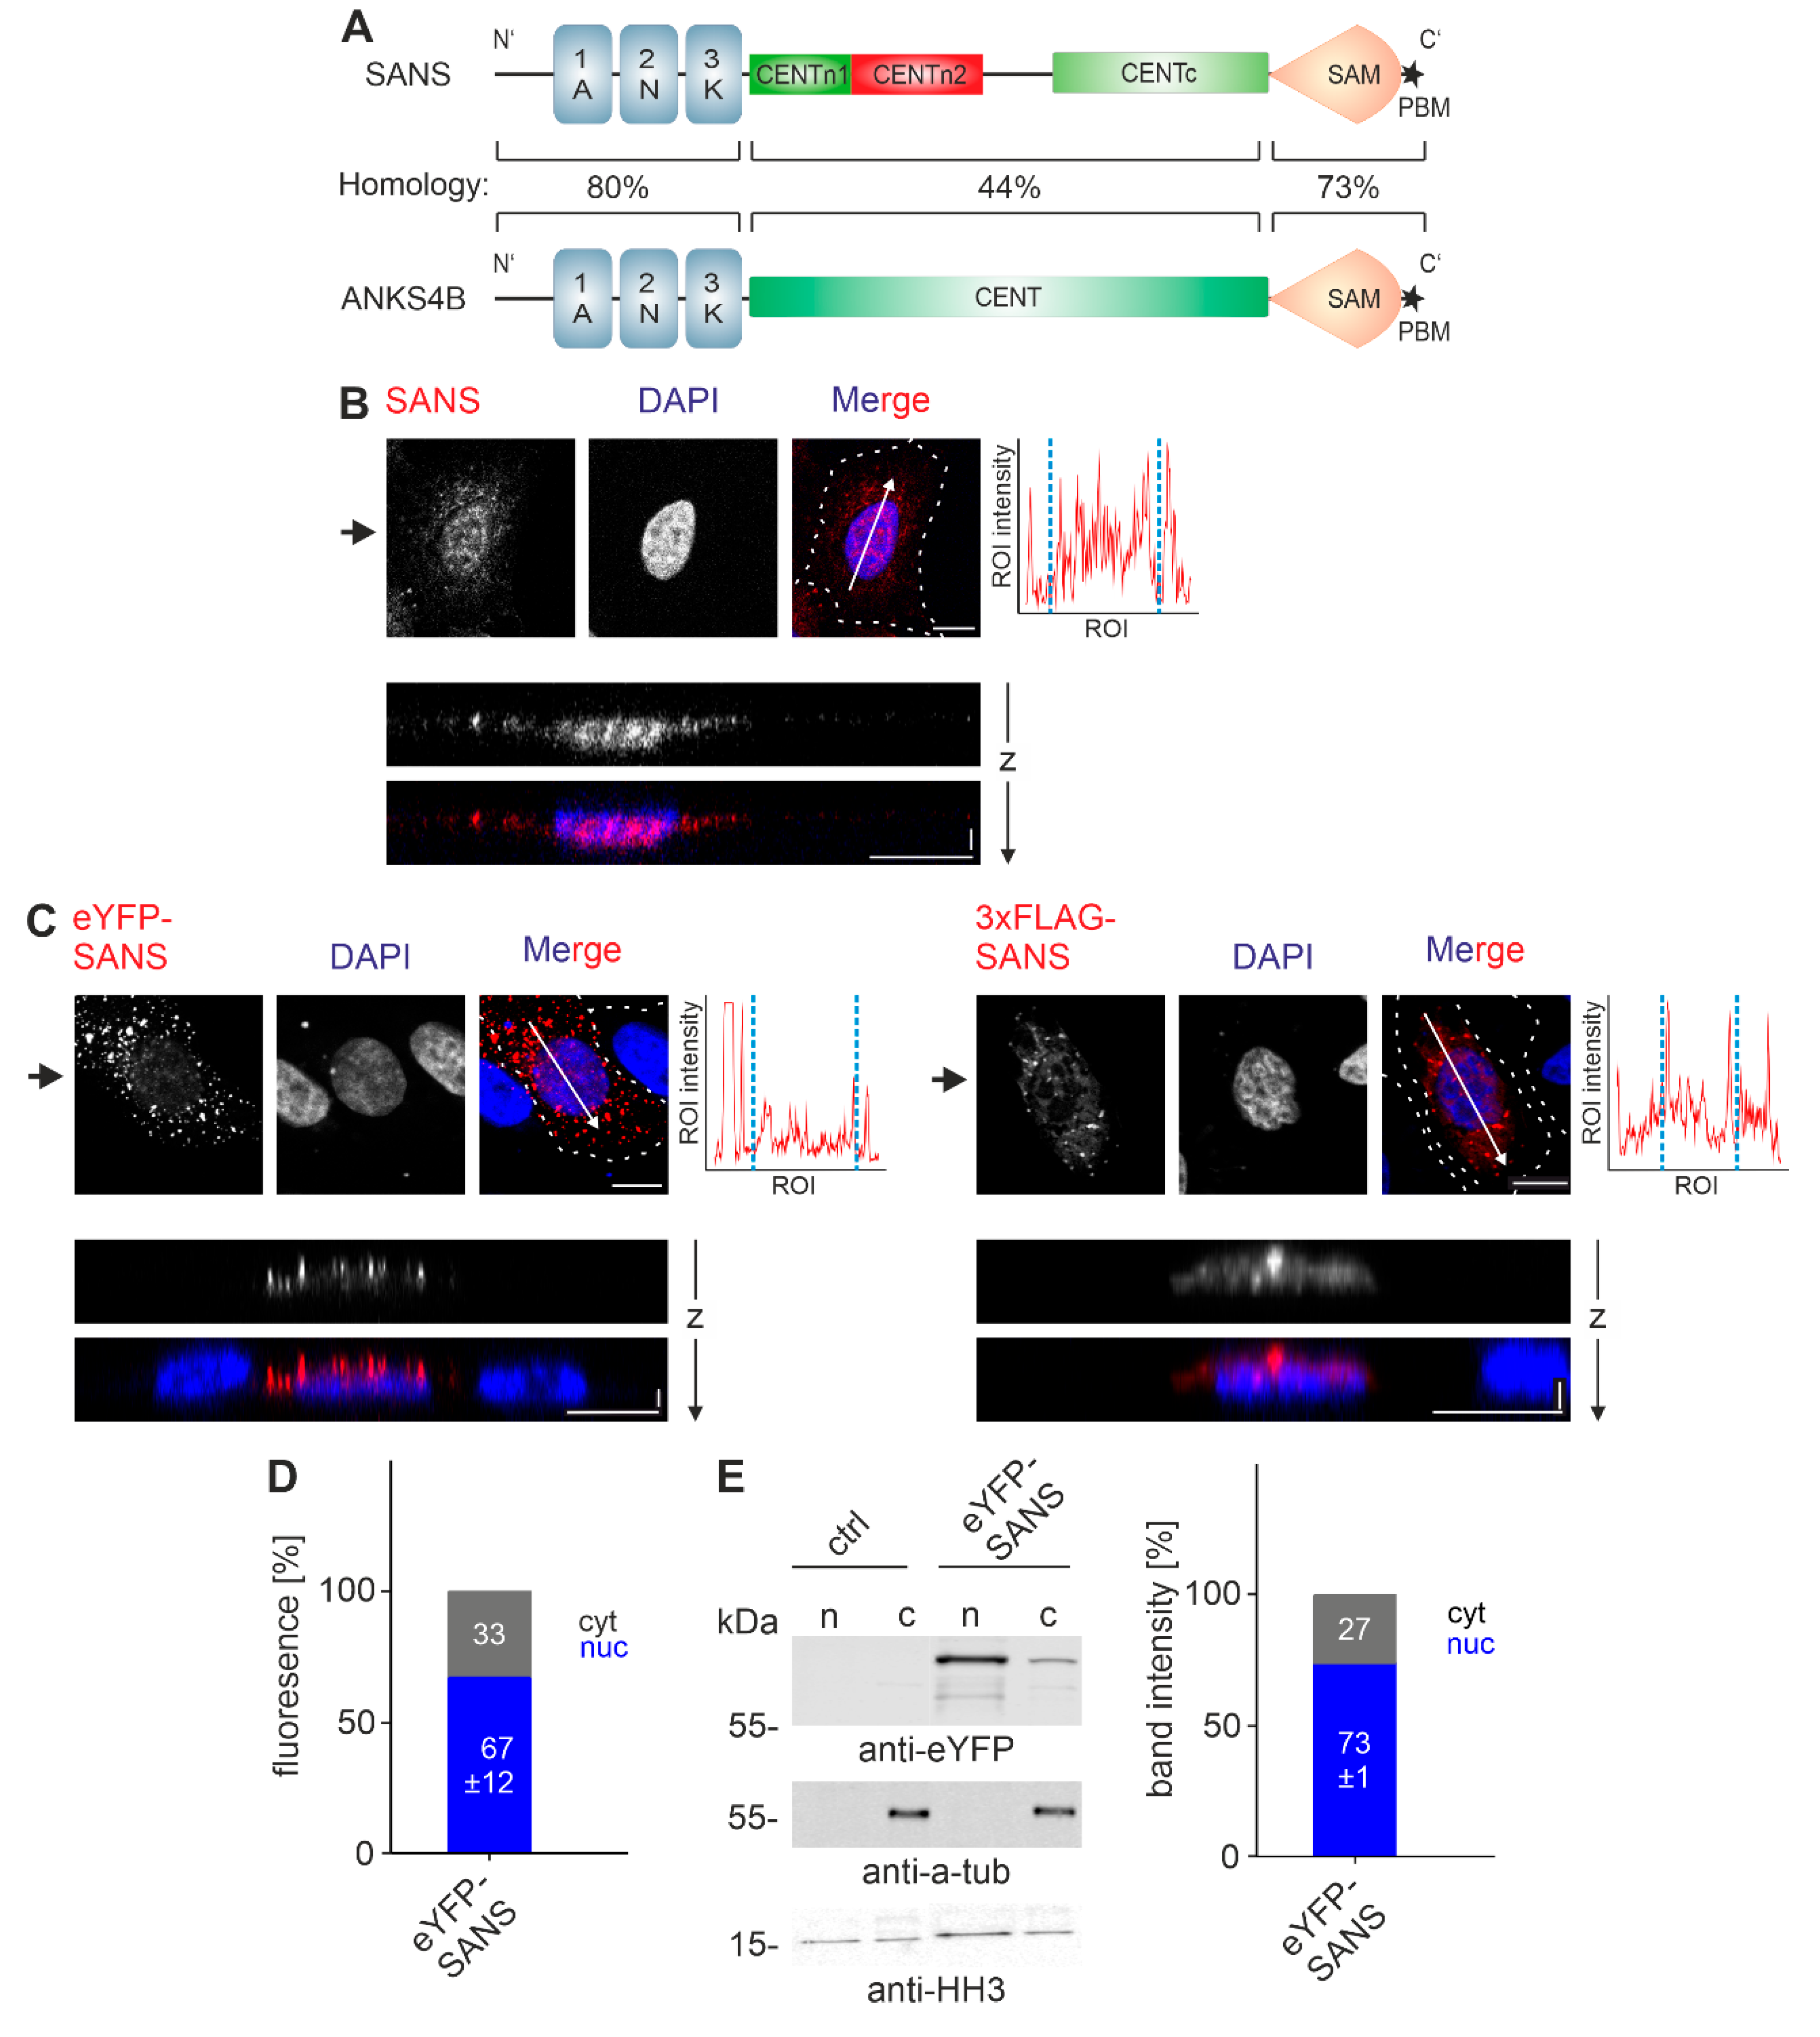
3.1. Subcellular Localization of SANS
3.2. Identification of Karyopherins in the Nuclear Interactome of SANS
3.3. In Silico Prediction and Evolutionary Conservation of Nuclear Localization Sequences (NLSs) and Nuclear Export Sequences (NESs) in SANS
3.4. Analysis of the Nuclear Localization Efficiency of Predicted NLS in SANS in the Cell
3.5. Analysis of the Nuclear Export Efficiency of Predicted NES in SANS in the Cell
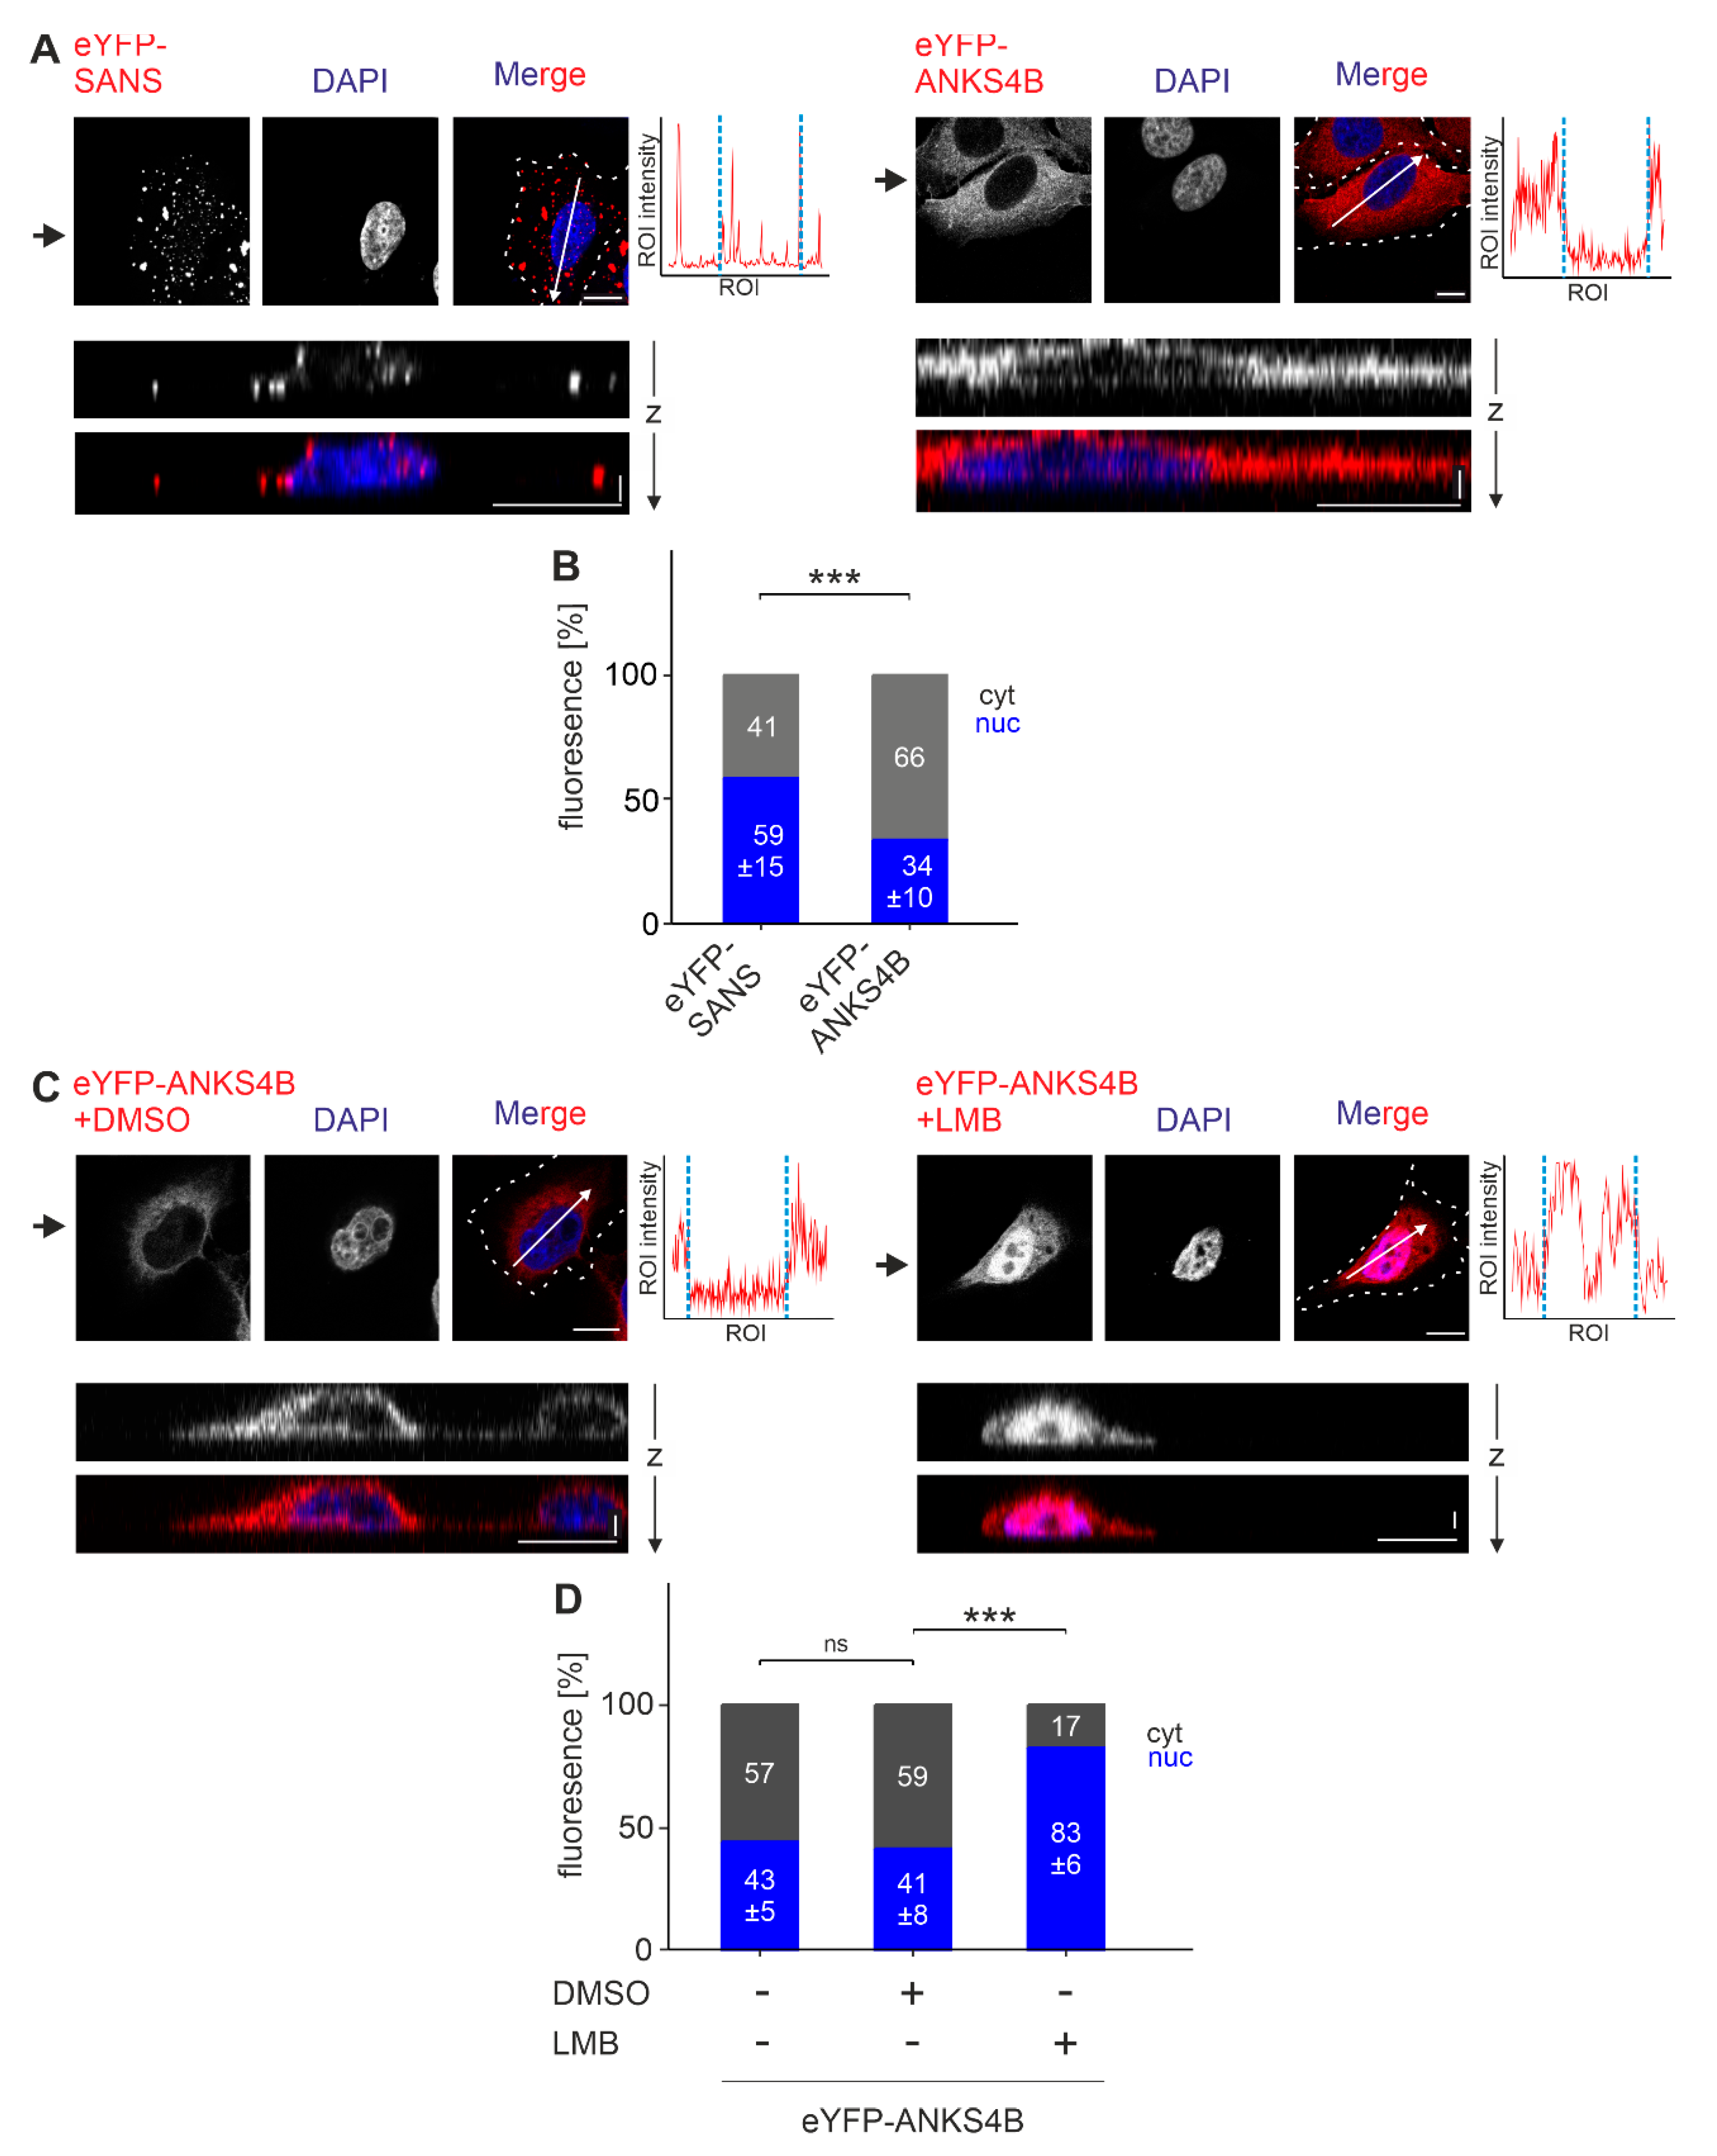
3.6. SANS and Its Paralogue ANKS4B Are Localized to Different Subcellular Sites
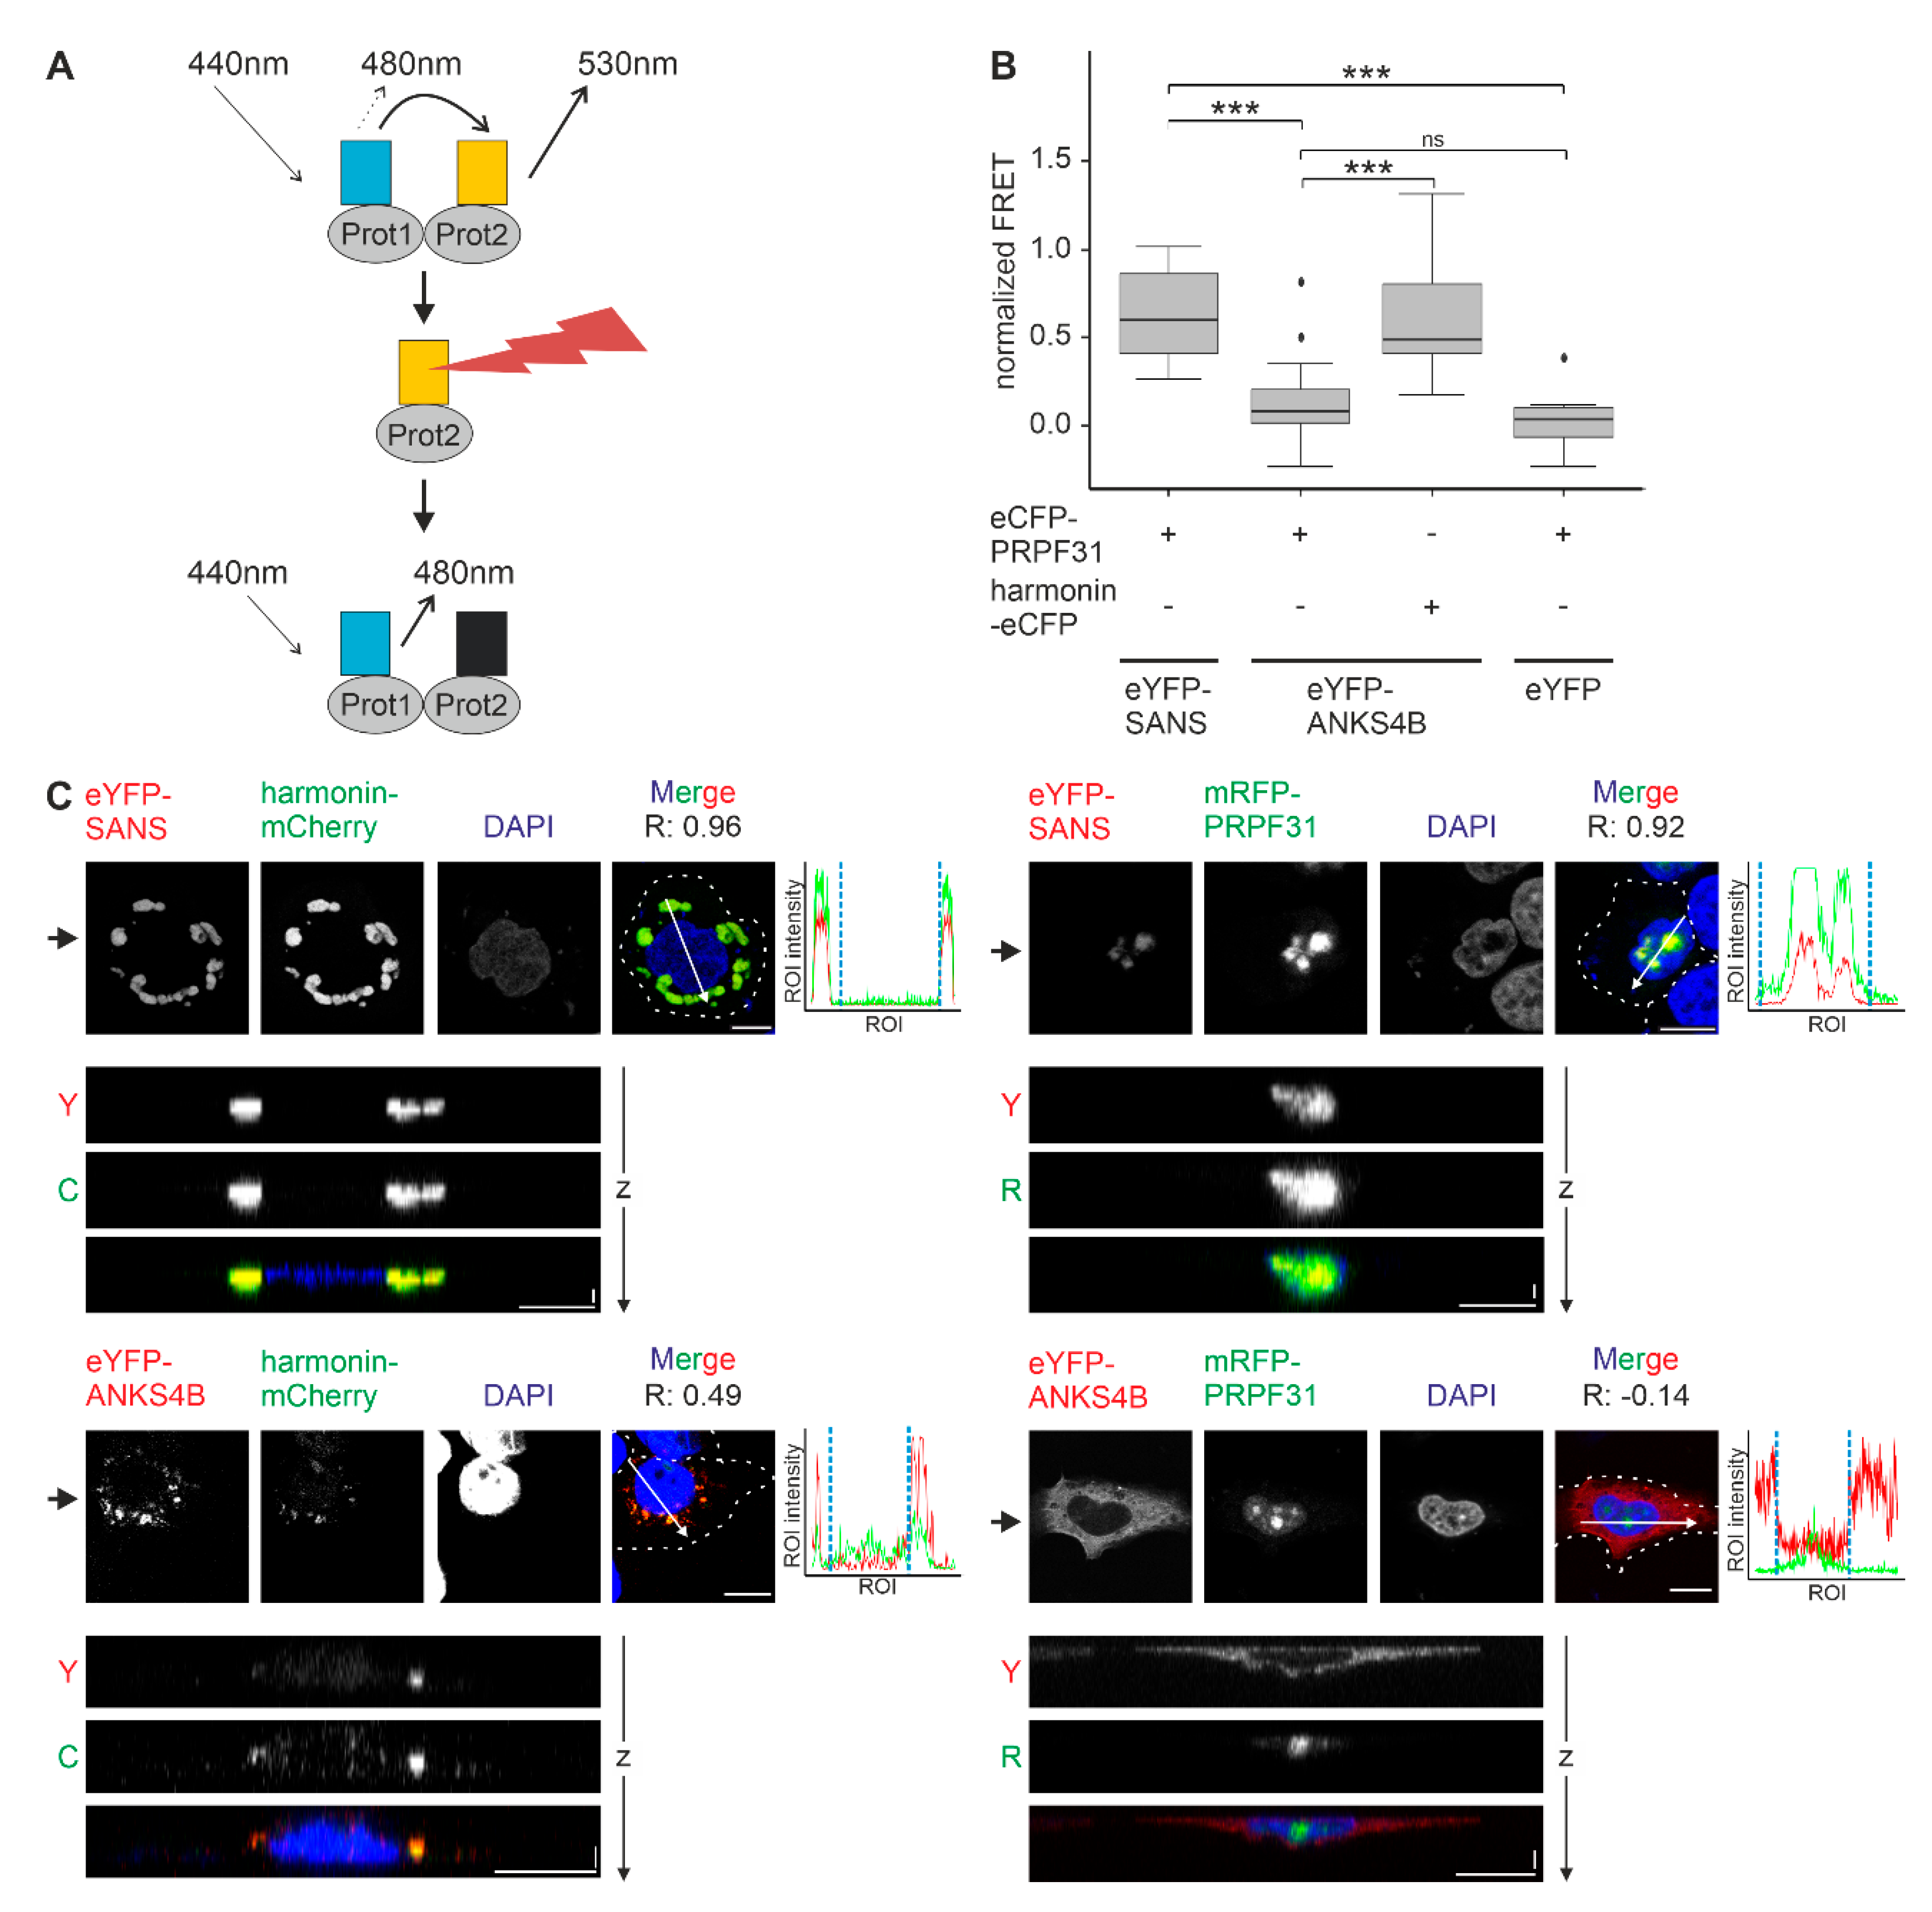
3.7. SANS and Its Paralog ANKS4B Differentially Interact with PRPF31
4. Discussion
5. Conclusions
Supplementary Materials
Author Contributions
Funding
Data Availability Statement
Acknowledgments
Conflicts of Interest
References
- Weil, D.; El-Amraoui, A.; Masmoudi, S.; Mustapha, M.; Kikkawa, Y.; Laine, S.; Delmaghani, S.; Adato, A.; Nadifi, S.; Zina, Z. Ben; et al. Usher Syndrome Type I G (USH1G) Is Caused by Mutations in the Gene Encoding SANS, a Protein That Associates with the USH1C Protein, Harmonin. Hum Mol Genet 2003, 12, 463–471. [Google Scholar] [CrossRef] [PubMed]
- Fuster-Garcia, C.; Garcia-Bohorquez, B.; Rodriguez-Munoz, A.; Aller, E.; Jaijo, T.; Millan, J.M.; Garcia-Garcia, G. Usher Syndrome: Genetics of a Human Ciliopathy. Int J Mol Sci 2021, 22. [Google Scholar] [CrossRef] [PubMed]
- Delmaghani, S.; El-Amraoui, A. The Genetic and Phenotypic Landscapes of Usher Syndrome: From Disease Mechanisms to a New Classification. Hum Genet 2022, 141, 709–735. [Google Scholar] [CrossRef] [PubMed]
- Fritze, J.S.; Stiehler, F.F.; Wolfrum, U. Pathogenic Variants in USH1G/SANS Alter Protein Interaction with Pre-RNA Processing Factors PRPF6 and PRPF31 of the Spliceosome. Int J Mol Sci 2023, 24. [Google Scholar] [CrossRef] [PubMed]
- Adato, A.; Lefevre, G.; Delprat, B.; Michel, V.; Michalski, N.; Chardenoux, S.; Weil, D.; El-Amraoui, A.; Petit, C. Usherin, the Defective Protein in Usher Syndrome Type IIA, Is Likely to Be a Component of Interstereocilia Ankle Links in the Inner Ear Sensory Cells. Hum Mol Genet 2005, 14, 3921–3932. [Google Scholar] [CrossRef] [PubMed]
- Maerker, T.; van Wijk, E.; Overlack, N.; Kersten, F.F.J.; Mcgee, J.; Goldmann, T.; Sehn, E.; Roepman, R.; Walsh, E.J.; Kremer, H.; et al. A Novel Usher Protein Network at the Periciliary Reloading Point between Molecular Transport Machineries in Vertebrate Photoreceptor Cells. Hum Mol Genet 2008, 17, 71–86. [Google Scholar] [CrossRef] [PubMed]
- Overlack, N.; Kilic, D.; Bauss, K.; Marker, T.; Kremer, H.; van Wijk, E.; Wolfrum, U.; Bauß, K.; Märker, T.; Kremer, H.; et al. Direct Interaction of the Usher Syndrome 1G Protein SANS and Myomegalin in the Retina. Biochim Biophys Acta 2011, 1813, 1883–1892. [Google Scholar] [CrossRef] [PubMed]
- Papal, S.; Cortese, M.; Legendre, K.; Sorusch, N.; Dragavon, J.; Sahly, I.; Shorte, S.; Wolfrum, U.; Petit, C.; El-Amraoui, A. The Giant Spectrin BetaV Couples the Molecular Motors to Phototransduction and Usher Syndrome Type I Proteins along Their Trafficking Route. Hum Mol Genet 2013, 22, 3773–3788. [Google Scholar] [CrossRef] [PubMed]
- Bauss, K.; Knapp, B.; Jores, P.; Roepman, R.; Kremer, H.; Wijk, E. V; Marker, T.; Wolfrum, U. Phosphorylation of the Usher Syndrome 1G Protein SANS Controls Magi2-Mediated Endocytosis. Hum Mol Genet 2014, 23, 3923–3942. [Google Scholar] [CrossRef] [PubMed]
- Sorusch, N.; Baub, K.; Plutniok, J.; Samanta, A.; Knapp, B.; Nagel-Wolfrum, K.; Wolfrum, U. Characterization of the Ternary Usher Syndrome SANS/Ush2a/Whirlin Protein Complex. Hum Mol Genet 2017, 26, 1157–1172. [Google Scholar] [CrossRef] [PubMed]
- Sorusch, N.; Yildirim, A.; Knapp, B.; Janson, J.; Fleck, W.; Scharf, C.; Wolfrum, U. SANS (USH1G) Molecularly Links the Human Usher Syndrome Protein Network to the Intraflagellar Transport Module by Direct Binding to IFT-B Proteins. Front Cell Dev Biol 2019, 7, 216. [Google Scholar] [CrossRef] [PubMed]
- Yildirim, A.; Mozaffari-Jovin, S.; Wallisch, A.K.; Schäfer, J.; Ludwig, S.E.J.; Urlaub, H.; Lührmann, R.; Wolfrum, U. SANS (USH1G) Regulates Pre-MRNA Splicing by Mediating the Intra-Nuclear Transfer of Tri-SnRNP Complexes. Nucleic Acids Res 2021, 49, 5845–5866. [Google Scholar] [CrossRef] [PubMed]
- Caberlotto, E.; Michel, V.; Foucher, I.; Bahloul, A.; Goodyear, R.J.; Pepermans, E.; Michalski, N.; Perfettini, I.; Alegria-Prévot, O.; Chardenoux, S.; et al. Usher Type 1G Protein sans Is a Critical Component of the Tip-Link Complex, a Structure Controlling Actin Polymerization in Stereocilia. Proc Natl Acad Sci U S A 2011, 108, 5825–5830. [Google Scholar] [CrossRef] [PubMed]
- He, Y.; Li, J.; Zhang, M. Myosin VII, USH1C, and ANKS4B or USH1G Together Form Condensed Molecular Assembly via Liquid-Liquid Phase Separation. Cell Rep 2019, 29, 974–986.e4. [Google Scholar] [CrossRef] [PubMed]
- Yan, J.; Pan, L.; Chen, X.; Wu, L.; Zhang, M. The Structure of the Harmonin/sans Complex Reveals an Unexpected Interaction Mode of the Two Usher Syndrome Proteins. Proc Natl Acad Sci U S A 2010, 107, 4040–4045. [Google Scholar] [CrossRef] [PubMed]
- Li, J.; He, Y.; Lu, Q.; Zhang, M. Mechanistic Basis of Organization of the Harmonin/USH1C-Mediated Brush Border Microvilli Tip-Link Complex. Dev Cell 2016, 36, 179–189. [Google Scholar] [CrossRef] [PubMed]
- Crawley, S.W.; Weck, M.L.; Grega-Larson, N.E.; Shifrin, D.A.; Tyska, M.J. ANKS4B Is Essential for Intermicrovillar Adhesion Complex Formation. Dev Cell 2016, 36, 190–200. [Google Scholar] [CrossRef] [PubMed]
- Graves, M.J.; Matoo, S.; Choi, M.S.; Storad, Z.A.; El Sheikh Idris, R.A.; Pickles, B.K.; Acharya, P.; Shinder, P.E.; Arvay, T.O.; Crawley, S.W. A Cryptic Sequence Targets the Adhesion Complex Scaffold ANKS4B to Apical Microvilli to Promote Enterocyte Brush Border Assembly. J Biol Chem 2020, 295, 12588–12604. [Google Scholar] [CrossRef] [PubMed]
- Yang, Y.; Guo, L.; Chen, L.; Gong, B.; Jia, D.; Sun, Q. Nuclear Transport Proteins: Structure, Function, and Disease Relevance. Signal Transduct Target Ther 2023, 8. [Google Scholar] [CrossRef]
- Wing, C.E.; Fung, H.Y.J.; Chook, Y.M. Karyopherin-Mediated Nucleocytoplasmic Transport. Nat Rev Mol Cell Biol 2022, 23, 307–328. [Google Scholar] [CrossRef]
- Wiemann, S.; Pennacchio, C.; Hu, Y.; Hunter, P.; Harbers, M.; Amiet, A.; Bethel, G.; Busse, M.; Carninci, P.; Diekhans, M.; et al. The ORFeome Collaboration: A Genome-Scale Human ORF-Clone Resource. Nat Methods 2016, 13, 191–192. [Google Scholar] [CrossRef]
- Schindelin, J.; Rueden, C.T.; Hiner, M.C.; Eliceiri, K.W. The ImageJ Ecosystem: An Open Platform for Biomedical Image Analysis. Mol Reprod Dev 2015, 82, 518–529. [Google Scholar] [CrossRef] [PubMed]
- Ba, A.N.N.; Pogoutse, A.; Provart, N.; Moses, A.M. NLStradamus: A Simple Hidden Markov Model for Nuclear Localization Signal Prediction. BMC Bioinformatics 2009, 10. [Google Scholar] [CrossRef]
- Xu, D.; Marquis, K.; Pei, J.; Fu, S.C.; Caʇatay, T.; Grishin, N. V.; Chook, Y.M. LocNES: A Computational Tool for Locating Classical NESs in CRM1 Cargo Proteins. Bioinformatics 2015, 31, 1357–1365. [Google Scholar] [CrossRef] [PubMed]
- Stirling, D.R.; Swain-Bowden, M.J.; Lucas, A.M.; Carpenter, A.E.; Cimini, B.A.; Goodman, A. CellProfiler 4: Improvements in Speed, Utility and Usability. BMC Bioinformatics 2021, 22. [Google Scholar] [CrossRef] [PubMed]
- Positteam Download RStudio - Posit Available online:. Available online: https://posit.co/downloads/ (accessed on 24 July 2023).
- Zhou, Y.; Liu, F.; Xu, Q.; Yang, B.; Li, X.; Jiang, S.; Hu, L.; Zhang, X.; Zhu, L.; Li, Q.; et al. Inhibiting Importin 4-Mediated Nuclear Import of CEBPD Enhances Chemosensitivity by Repression of PRKDC-Driven DNA Damage Repair in Cervical Cancer. Oncogene 2020, 39, 5633–5648. [Google Scholar] [CrossRef] [PubMed]
- Levin, A.; Neufeldt, C.J.; Pang, D.; Wilson, K.; Loewen-Dobler, D.; Joyce, M.A.; Wozniak, R.W.; Tyrrell, D.L.J. Functional Characterization of Nuclear Localization and Export Signals in Hepatitis C Virus Proteins and Their Role in the Membranous Web. PLoS One 2014, 9. [Google Scholar] [CrossRef] [PubMed]
- Pemberton, L.F.; Paschal, B.M. Mechanisms of Receptor-Mediated Nuclear Import and Nuclear Export. Traffic 2005, 6, 187–198. [Google Scholar] [CrossRef] [PubMed]
- Shoubridge, C.; Tan, M.; Fullston, T.; Cloosterman, D.; Coman, D.; McGillivray, G.; Mancini, G.; Kleefstra, T.; Gécz, J. Mutations in the Nuclear Localization Sequence of the Aristaless Related Homeobox; Sequestration of Mutant ARX with IPO13 Disrupts Normal Subcellular Distribution of the Transcription Factor and Retards Cell Division. Pathogenetics 2010, 3. [Google Scholar] [CrossRef]
- Jans, D.A.; Martin, A.J.; Wagstaff, K.M. Inhibitors of Nuclear Transport. Curr Opin Cell Biol 2019, 58, 50–60. [Google Scholar] [CrossRef] [PubMed]
- Karpova, T.S.; Baumann, C.T.; He, L.; Wu, X.; Grammer, A.; Lipsky, P.; Hager, G.L.; McNally, J.G. Fluorescence Resonance Energy Transfer from Cyan to Yellow Fluorescent Protein Detected by Acceptor Photobleaching Using Confocal Microscopy and a Single Laser. J Microsc 2003, 209, 56–70. [Google Scholar] [CrossRef] [PubMed]
- Lou, M.; Pang, C.W.M.; Gerken, A.E.; Brock, T.G. Multiple Nuclear Localization Sequences Allow Modulation of 5-Lipoxygenase Nuclear Import. Traffic 2004, 5, 847–854. [Google Scholar] [CrossRef]
- Ferrer, M.; Rodríguez, J.A.; Spierings, E.A.; de Winter, J.P.; Giaccone, G.; Kruyt, F.A.E. Identification of Multiple Nuclear Export Sequences in Fanconi Anemia Group A Protein That Contribute to CRM1-Dependent Nuclear Export. Hum Mol Genet 2005, 14, 1271–1281. [Google Scholar] [CrossRef] [PubMed]
- Smith, K.M.; Di Antonio, V.; Bellucci, L.; Thomas, D.R.; Caporuscio, F.; Ciccarese, F.; Ghassabian, H.; Wagstaff, K.M.; Forwood, J.K.; Jans, D.A.; et al. Contribution of the Residue at Position 4 within Classical Nuclear Localization Signals to Modulating Interaction with Importins and Nuclear Targeting. Biochim Biophys Acta Mol Cell Res 2018, 1865, 1114–1129. [Google Scholar] [CrossRef] [PubMed]
- De Ganck, A.; Hubert, T.; Van Impe, K.; Geelen, D.; Vandekerckhove, J.; De Corte, V.; Gettemans, J. A Monopartite Nuclear Localization Sequence Regulates Nuclear Targeting of the Actin Binding Protein Myopodin. FEBS Lett 2005, 579, 6673–6680. [Google Scholar] [CrossRef] [PubMed]
- Kopp, M.; Rotan, O.; Papadopoulos, C.; Schulze, N.; Meyer, H.; Epple, M. Delivery of the Autofluorescent Protein R-Phycoerythrin by Calcium Phosphate Nanoparticles into Four Different Eukaryotic Cell Lines (HeLa, HEK293T, MG-63, MC3T3): Highly Efficient, but Leading to Endolysosomal Proteolysis in HeLa and MC3T3 Cells. PLoS One 2017, 12. [Google Scholar] [CrossRef] [PubMed]
- Napolitano, G.; Esposito, A.; Choi, H.; Matarese, M.; Benedetti, V.; Di Malta, C.; Monfregola, J.; Medina, D.L.; Lippincott-Schwartz, J.; Ballabio, A. MTOR-Dependent Phosphorylation Controls TFEB Nuclear Export. Nat Commun 2018, 9. [Google Scholar] [CrossRef] [PubMed]
- Kumagai, A.; Dunphy, W.G. Binding of 14-3-3 Proteins and Nuclear Export Control the Intracellular Localization of the Mitotic Inducer Cdc25. Genes Dev 1999, 13, 1067–1072. [Google Scholar] [CrossRef] [PubMed]
- Eberhard, D.A.; Karns, L.R.; VandenBerg, S.R.; Creutz, C.E. Control of the Nuclear-Cytoplasmic Partitioning of Annexin II by a Nuclear Export Signal and by P11 Binding. J Cell Sci 2001, 114, 3155–3166. [Google Scholar] [CrossRef] [PubMed]
- Macara, I.G. Transport into and out of the Nucleus. Microbiol Mol Biol Rev 2001, 65, 570–594. [Google Scholar] [CrossRef]
- Tessier, T.M.; Macneil, K.M.; Mymryk, J.S. Piggybacking on Classical Import and Other Non-Classical Mechanisms of Nuclear Import Appear Highly Prevalent within the Human Proteome. Biology (Basel) 2020, 9, 1–20. [Google Scholar] [CrossRef] [PubMed]
- Fung, H.Y.J.; Fu, S.C.; Chook, Y.M. Nuclear Export Receptor CRM1 Recognizes Diverse Conformations in Nuclear Export Signals. Elife 2017, 6. [Google Scholar] [CrossRef] [PubMed]
- Timney, B.L.; Raveh, B.; Mironska, R.; Trivedi, J.M.; Kim, S.J.; Russel, D.; Wente, S.R.; Sali, A.; Rout, M.P. Simple Rules for Passive Diffusion through the Nuclear Pore Complex. J Cell Biol 2016, 215. [Google Scholar] [CrossRef]
- Bourgeois, B.; Hutten, S.; Gottschalk, B.; Hofweber, M.; Richter, G.; Sternat, J.; Abou-Ajram, C.; Göbl, C.; Leitinger, G.; Graier, W.F.; et al. Nonclassical Nuclear Localization Signals Mediate Nuclear Import of CIRBP. Proc Natl Acad Sci U S A 2020, 117, 8503–8514. [Google Scholar] [CrossRef] [PubMed]
- Sakiyama, H.; Wynn, R.M.; Lee, W.R.; Fukasawa, M.; Mizuguchi, H.; Gardner, K.H.; Repa, J.J.; Uyeda, K. Regulation of Nuclear Import/Export of Carbohydrate Response Element-Binding Protein (ChREBP): Interaction of Anα-Helix of ChREBP with the 14-3-3 Proteins and Regulation by Phosphorylation. Journal of Biological Chemistry 2008, 283, 24899–24908. [Google Scholar] [CrossRef] [PubMed]
- Wang, L.; Liu, X.; Gusev, E.; Wang, C.; Fagotto, F. Regulation of the Phosphorylation and Nuclear Import and Export of β-Catenin by APC and Its Cancer-Related Truncated Form. J Cell Sci 2014, 127, 1647–1659. [Google Scholar] [CrossRef] [PubMed]
- Nardozzi, J.D.; Lott, K.; Cingolani, G. Phosphorylation Meets Nuclear Import: A Review. Cell Commun Signal 2010, 8. [Google Scholar] [CrossRef] [PubMed]
- Fokkema, I.F.A.C.; Taschner, P.E.M.; Schaafsma, G.C.P.; Celli, J.; Laros, J.F.J.; den Dunnen, J.T. LOVD v.2.0: The next Generation in Gene Variant Databases. Hum Mutat 2011, 32, 557–563. [Google Scholar] [CrossRef] [PubMed]

| Gene | Protein | Export/Import | NLS/NES Recognition |
|---|---|---|---|
| KPNB1 | Importin-β | Protein importer | classic NLS [20] non classic NLS [20] |
| IPO4 | Importin-4 | Protein importer | classic NLS [27] non classic NLS [20] |
| IPO5 | Importin-5 | Protein importer | classic NLS [28] non classic NLS [20] |
| IPO7 | Importin-7 | Protein importer | classic NLS [29] non classic NLS [20] |
| IPO8 | Importin-8 | Protein importer | classic NLS [29] non classic NLS [20] |
| IPO9 | Importin-9 | Protein importer | non classic NLS [20] |
| IPO11 | Importin-11 | Protein importer | non classic NLS [20] |
| IPO13 | Importin-13 | Protein importer | classic NLS [30] non classic NLS [30] |
| XPO1 | CRM1/Exportin-1 | Protein exporter | NES |
| XPO5 | Exportin-5 | dsRNA exporter | - |
| XPOT | Exportin-T | amino-acylated tRNAs export | - |
| NLS/NES | Sequence | Score | CRM1-class | NLS/NES Mutations |
|---|---|---|---|---|
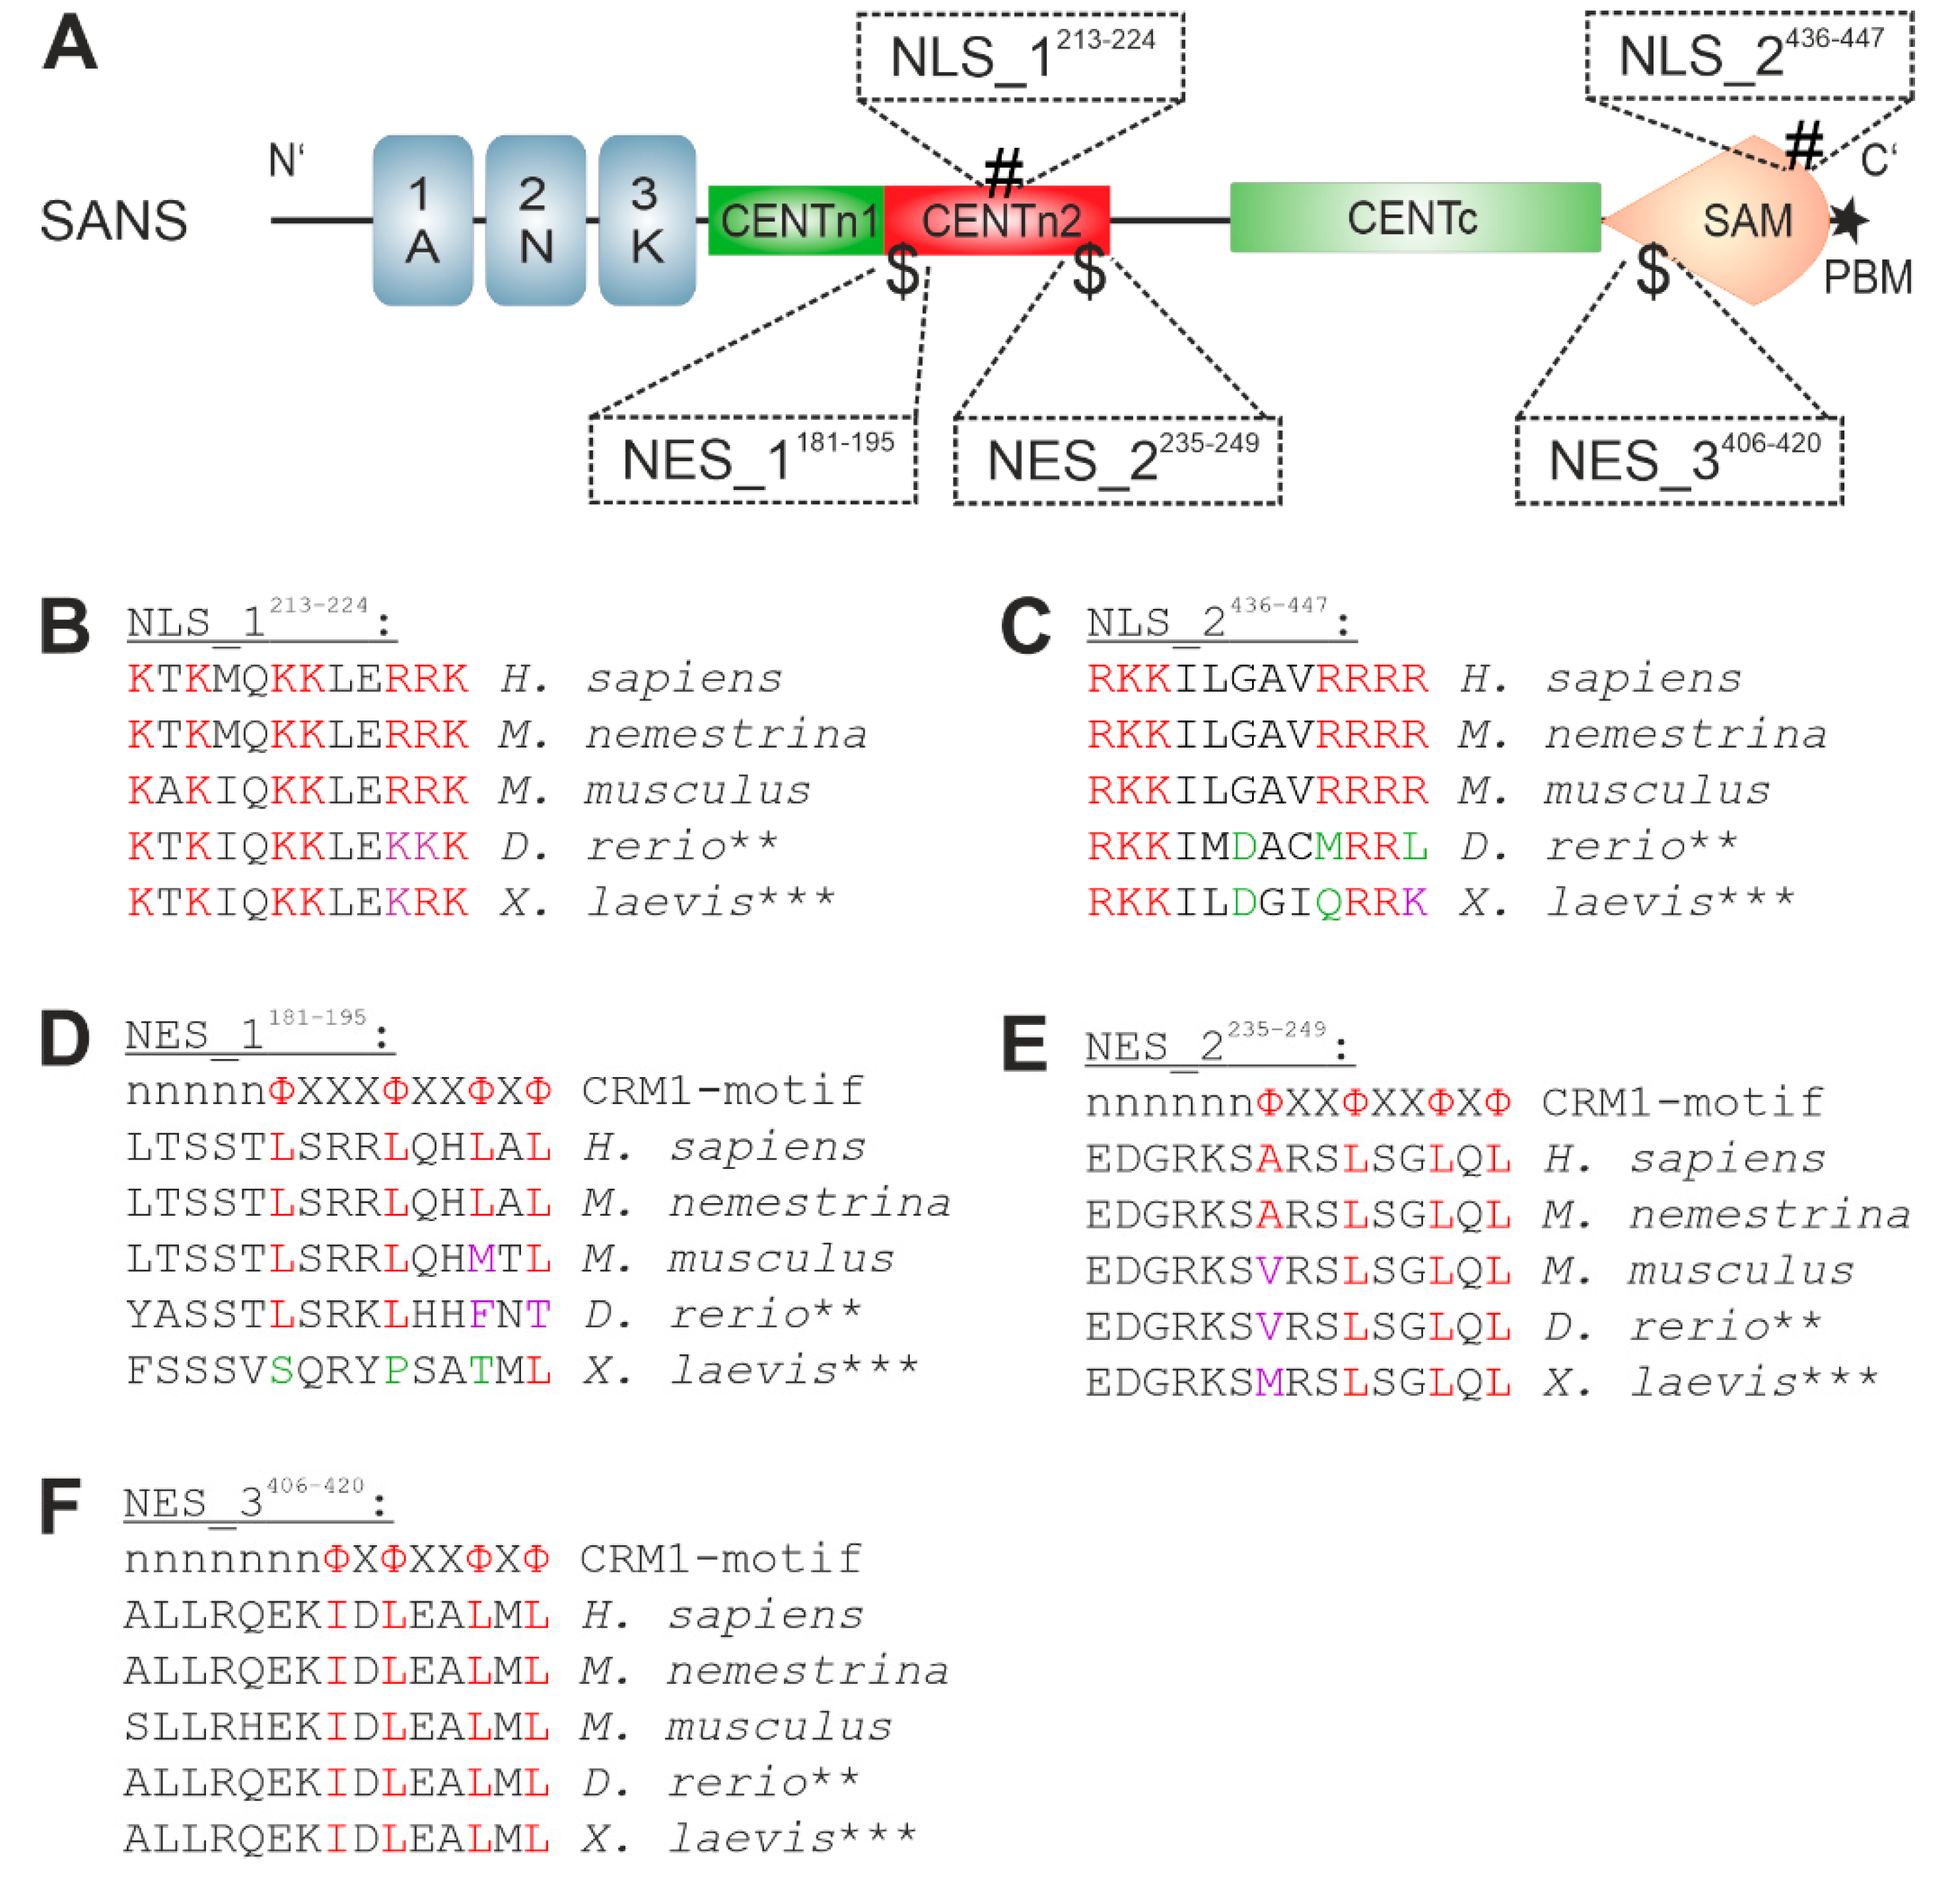
| NLS_1213-224 | 213-KTKMQKKLERRK-224 | 0.733 | - | K213E: ETKMQKKLERRK |
| NLS_2436-447 | 436-RKKILGAVRRRR-447 | 0.679 | - | R447W: RKKILGAVRRRW |
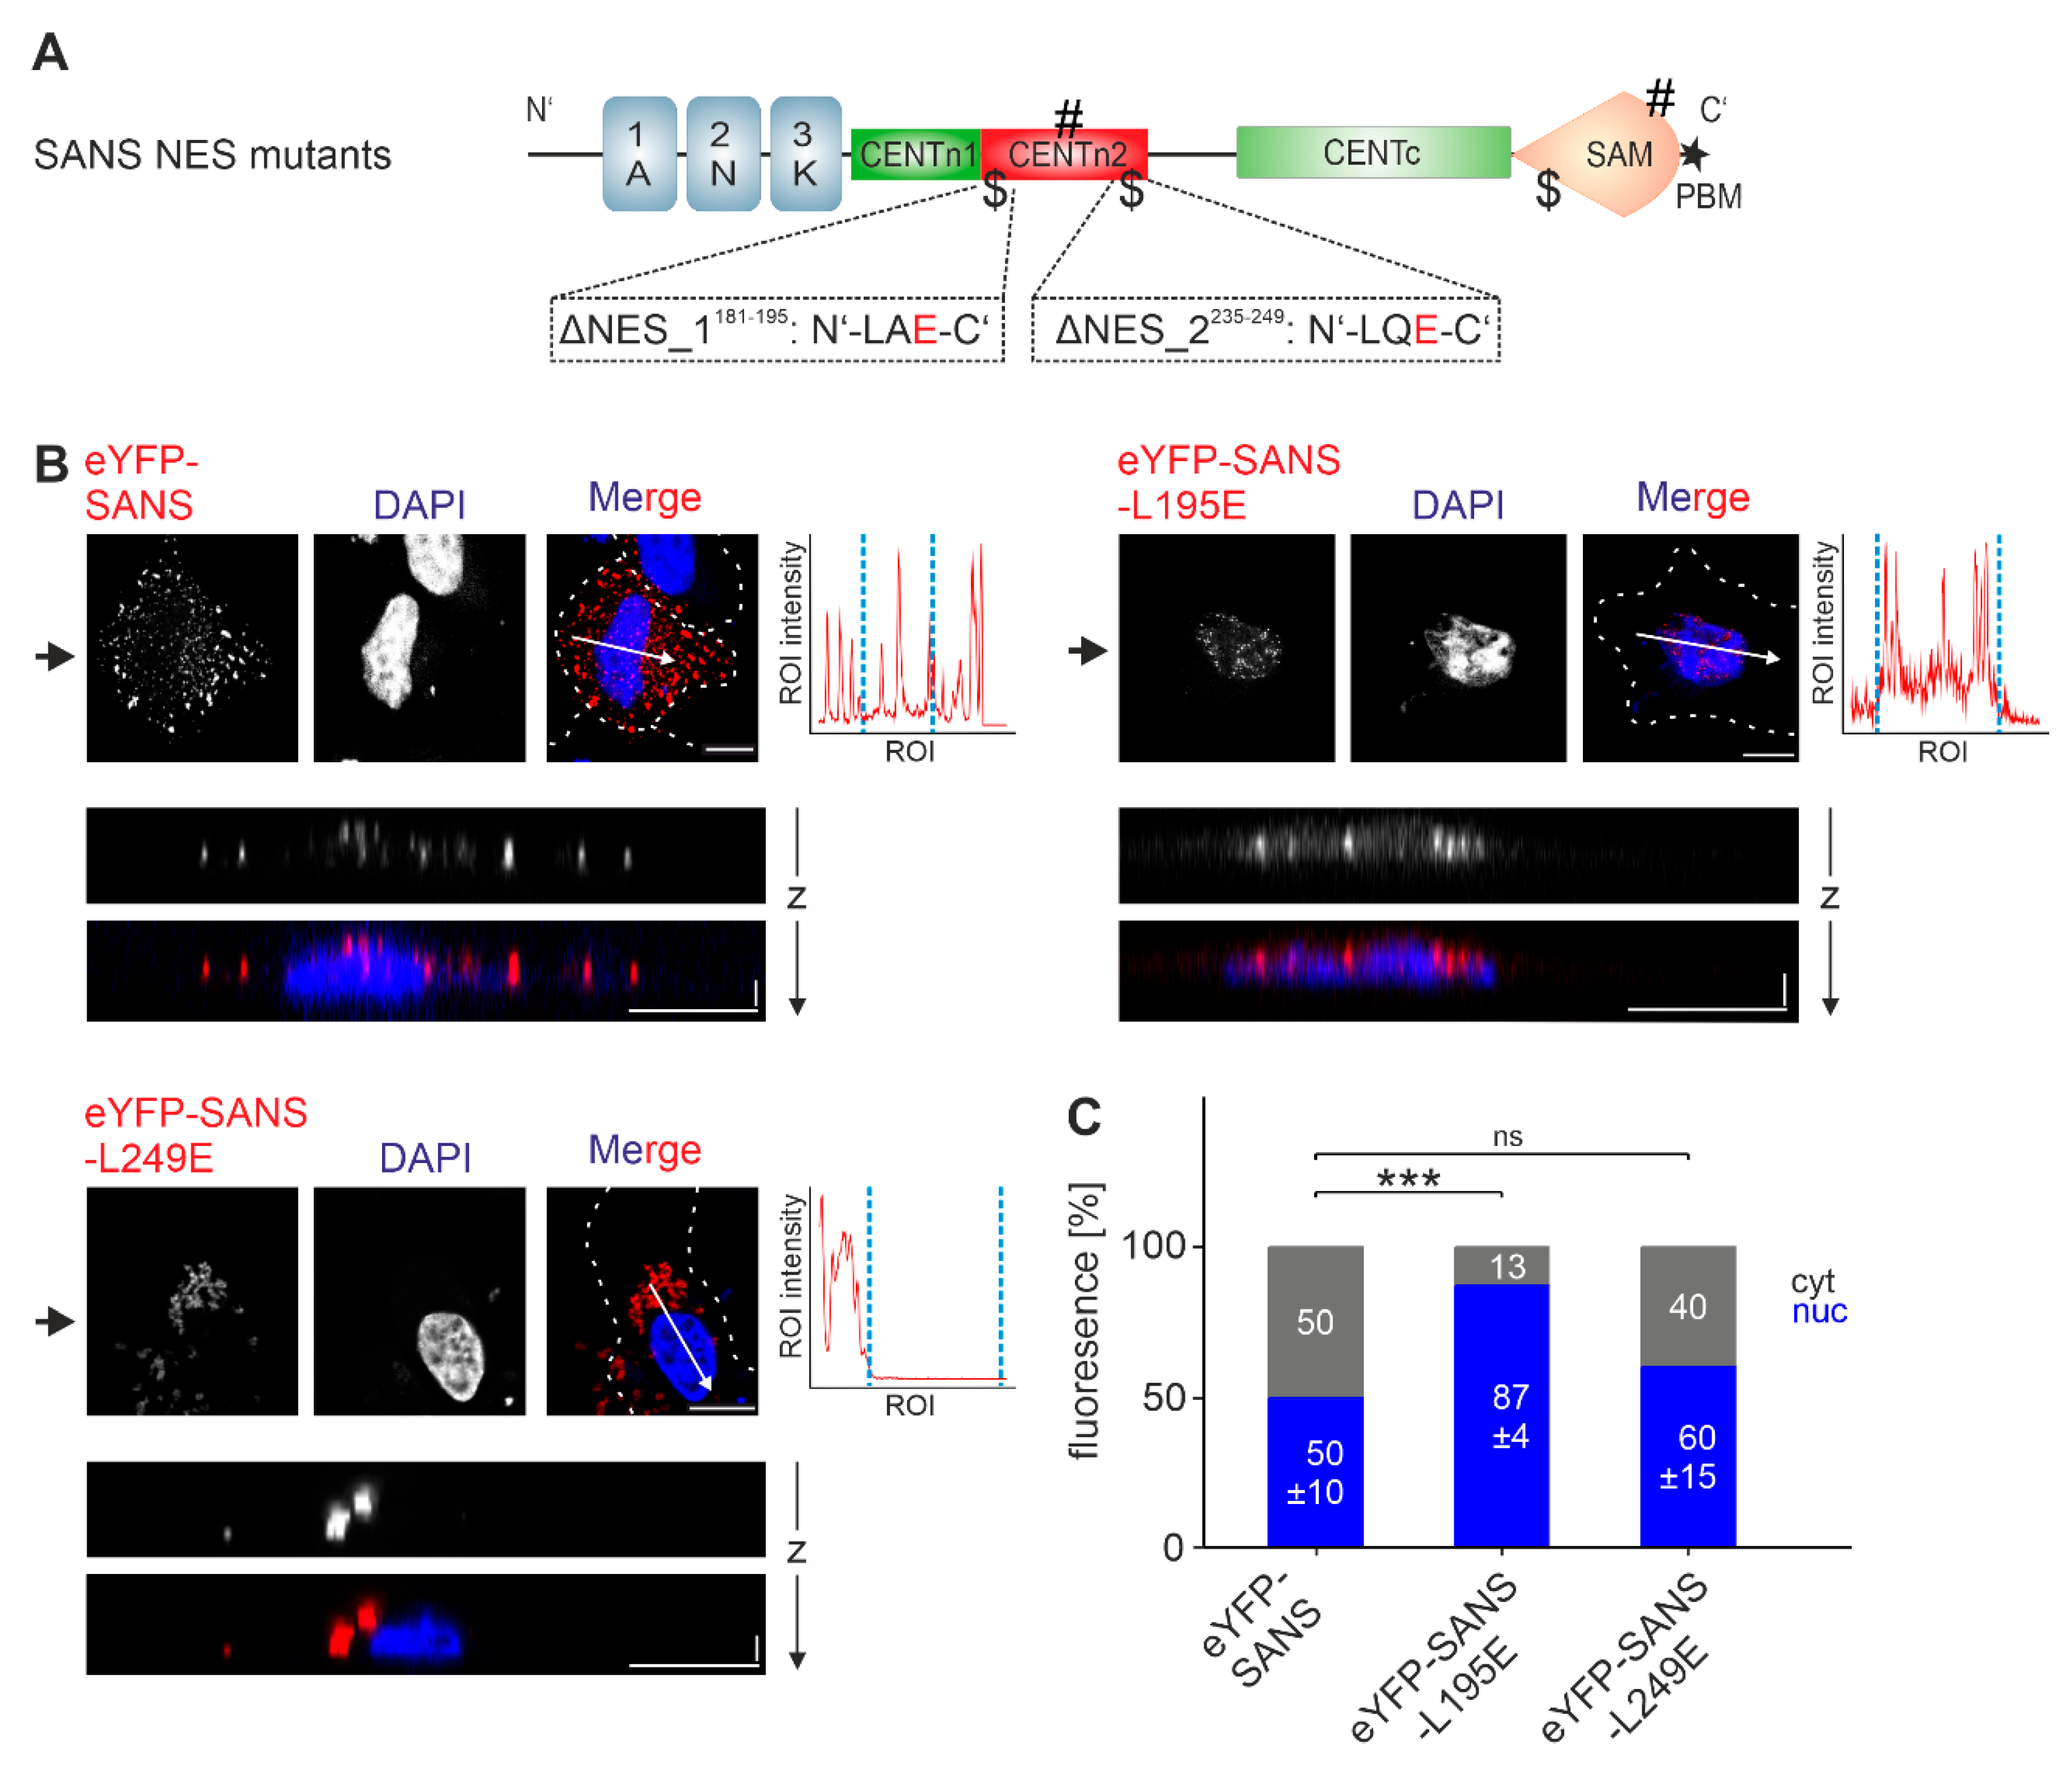
| NES_1181-195 | 181-LTSSTLSRRLQHLAL-195 | 0.262 | 1a | L195E: LTSSTLSRRLQHLAE |
| NES_2235-249 | 235-EDGRKSARSLSGLQL-249 | 0.250 | 1b | L249E: EDGRKSARSLSGLQE |
| NES_3406-420 | 406-ALLRQEKIDLEALML-420 | 0.462 | 2 | n.a. |
| NLS/NES | Sequence | Score | CRM1-Class |
|---|---|---|---|
| NES_1336-350 | 336-VEWEEDVVDATPLEV-350 | 0.191 | 1c |
| NES_2338-352 | 338-WEEDVVDATPLEVFL-352 | 0.199 | 1c |
| NES_3339-353 | 339-EEDVVDATPLEVFLL-353 | 0.205 | 1b |
| NES_4346-360 | 346-TPLEVFLLSQHLEEF-360 | 0.181 | 2 |
| NES_5349-363 | 349-EVFLLSQHLEEFLPI-363 | 0.104 | 3 |
| NES_6362-376 | 362-PIFKREQIDLEALLL-376 | 0.251 | 2 |
Disclaimer/Publisher’s Note: The statements, opinions and data contained in all publications are solely those of the individual author(s) and contributor(s) and not of MDPI and/or the editor(s). MDPI and/or the editor(s) disclaim responsibility for any injury to people or property resulting from any ideas, methods, instructions or products referred to in the content. |
© 2024 by the authors. Licensee MDPI, Basel, Switzerland. This article is an open access article distributed under the terms and conditions of the Creative Commons Attribution (CC BY) license (http://creativecommons.org/licenses/by/4.0/).


