Submitted:
29 July 2024
Posted:
30 July 2024
You are already at the latest version
Abstract

Keywords:
1. Introduction
2. Derivation of the Basic Relations
2.1. Law of Corresponding States for Phonon Softening Systems
2.2. Dependence of the Reduced Transformation Heat and Entropy on the Transformation Temperature
2.3. Derivation of General Relation for the Composition Dependence of the Transformation Temperature
3. Comparison with Experimental Data
4. Conclusions
- -
- It is shown that the application of the law of corresponding states for martensitic transformations of shape memory alloys with phonon softening requires the introduction of a new dimensionless phonon softening parameter, which is proportional to .
- -
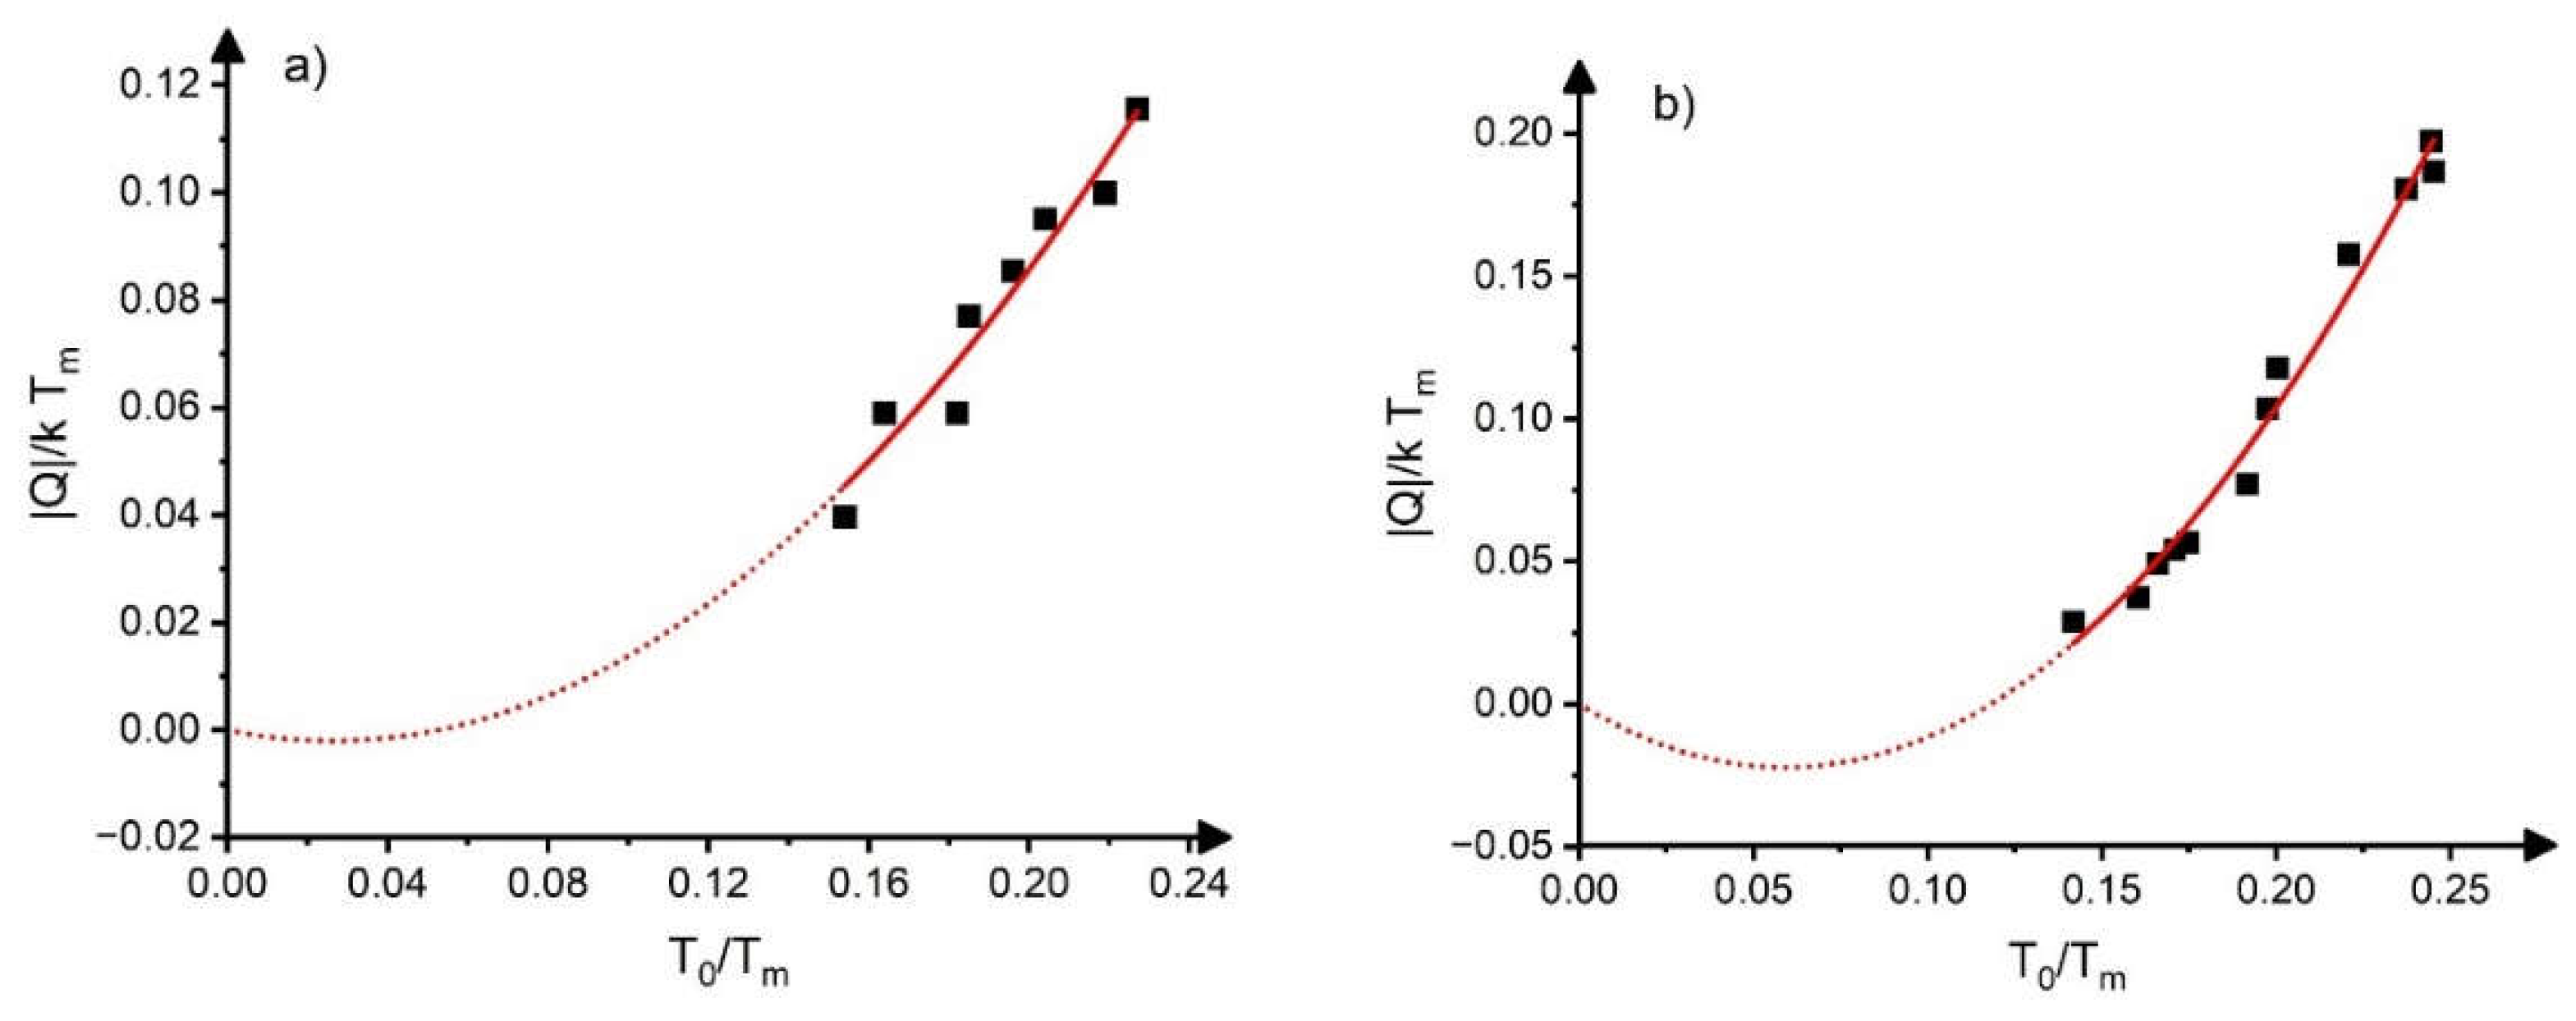
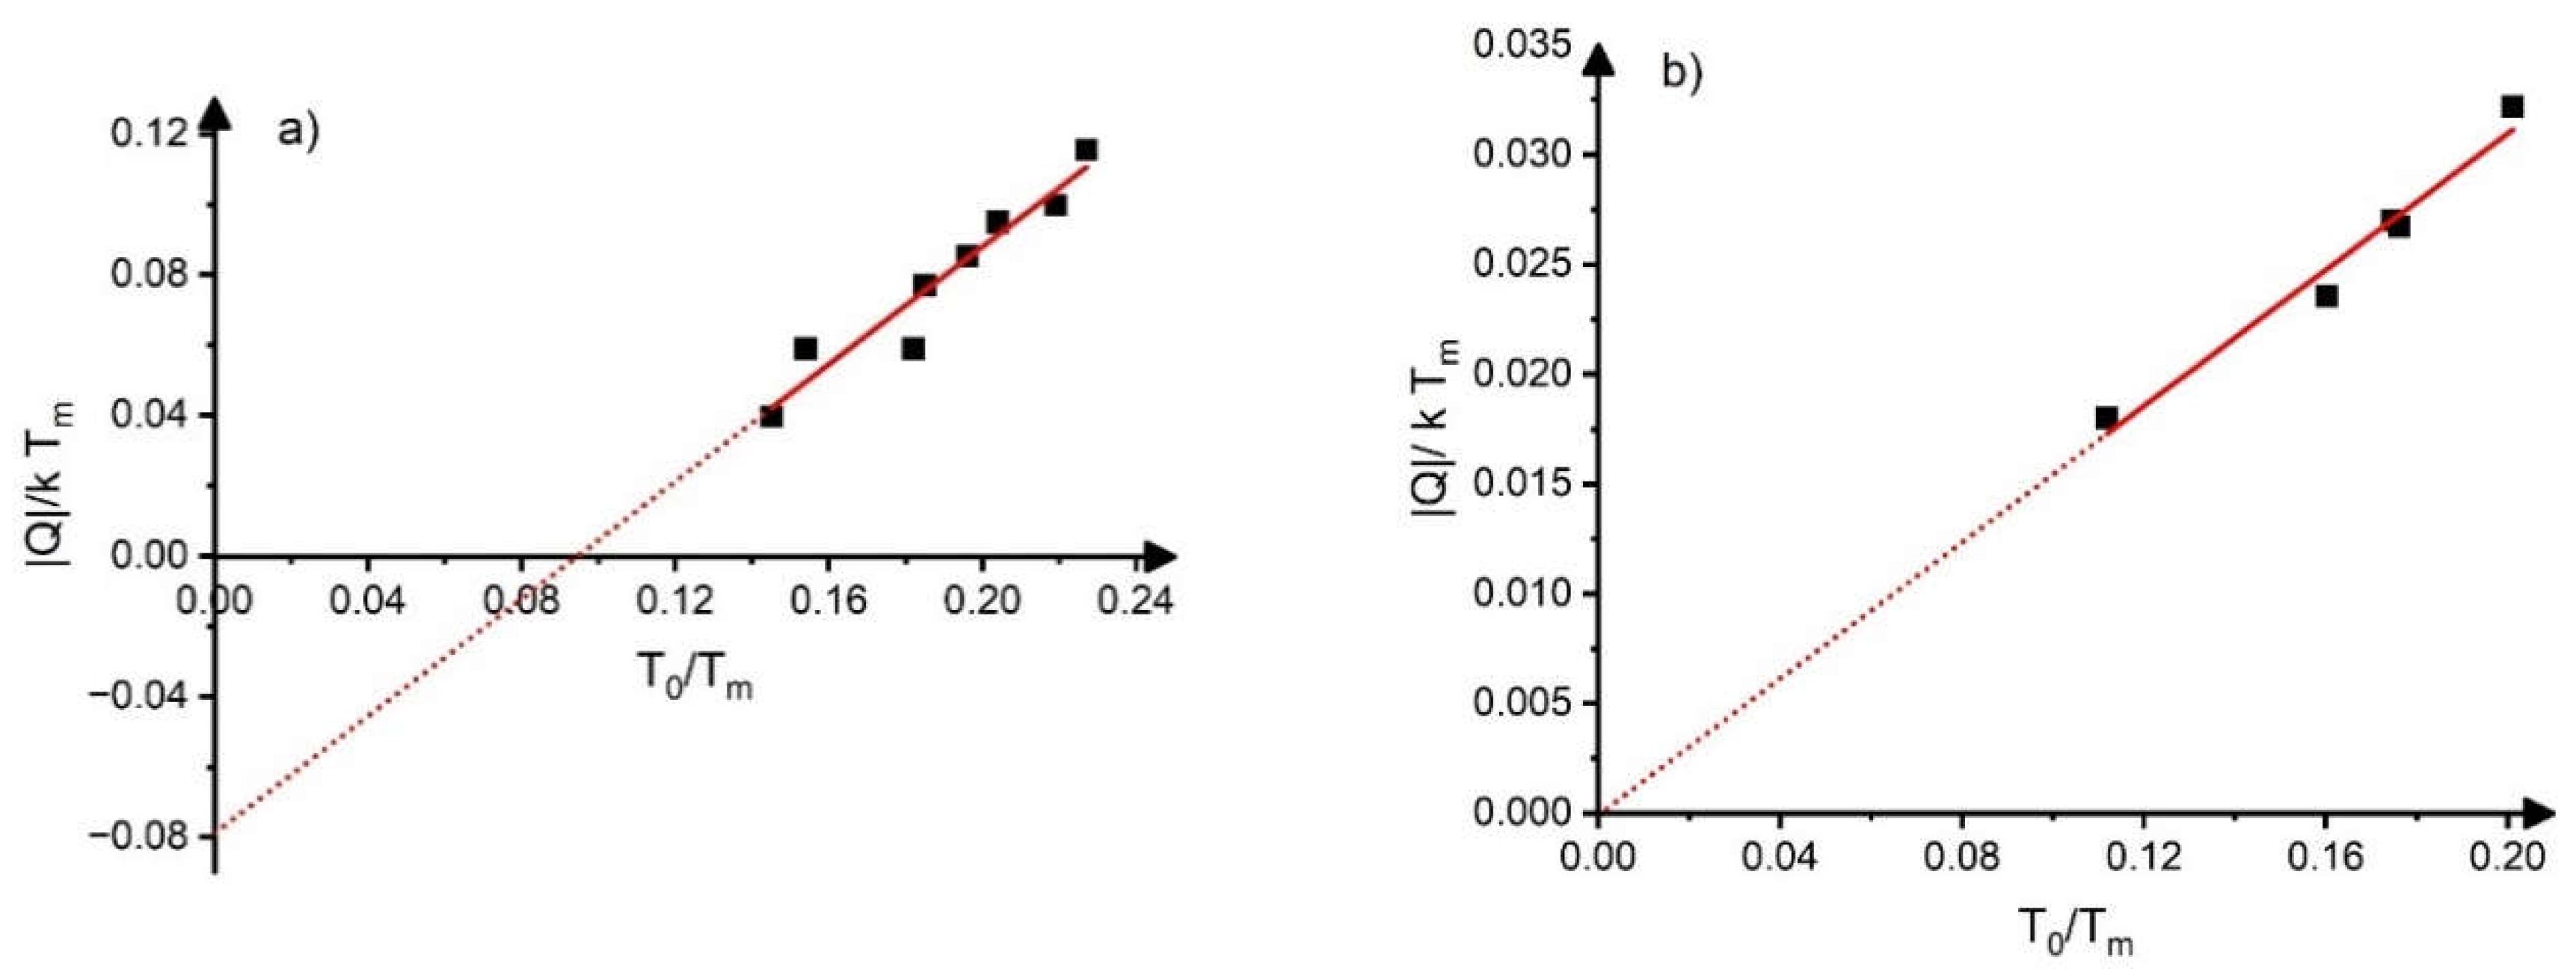
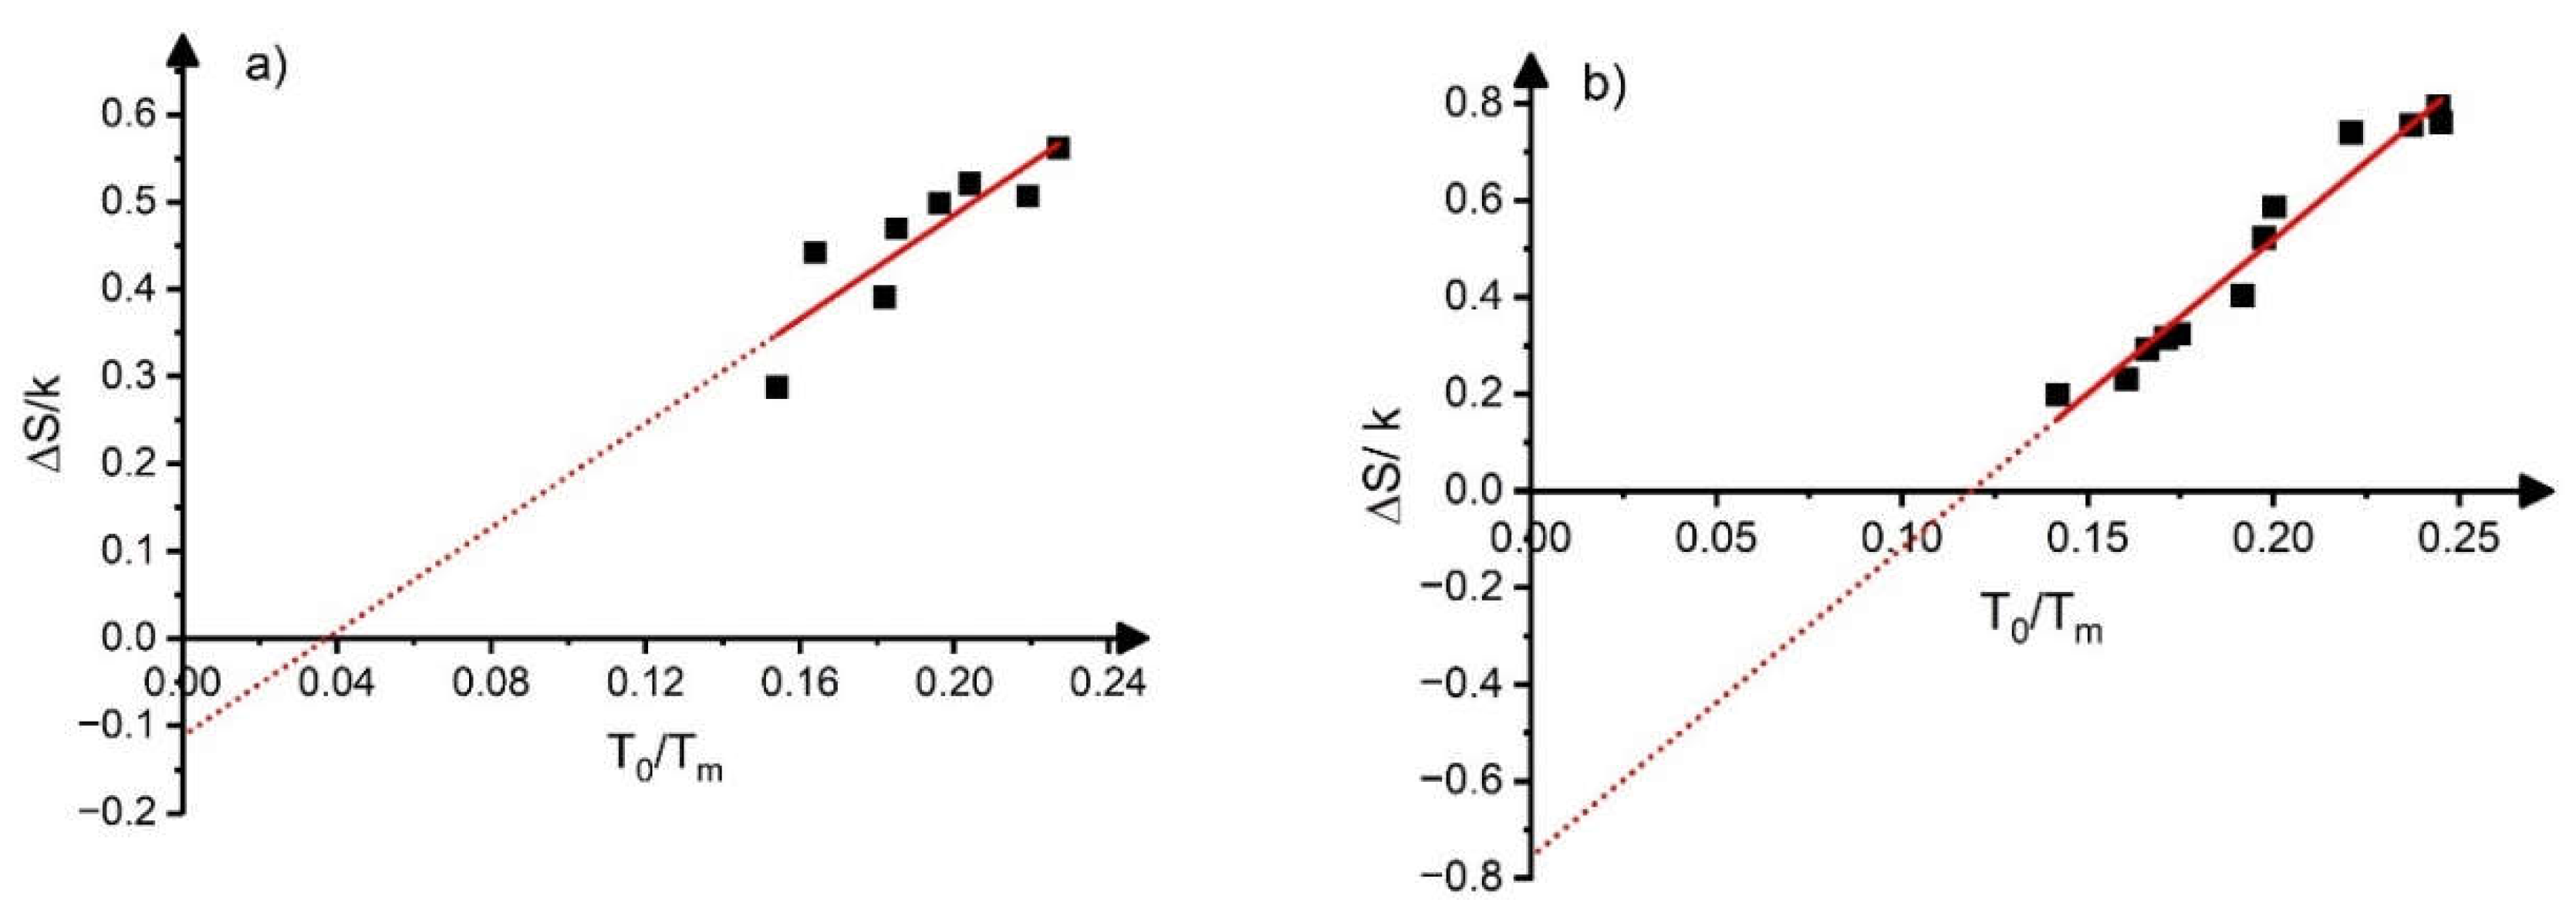
- Both the dimensionless heat and entropy of transformation, ( and ) are universal functions of to, and the composition dependence of them are determined by the composition dependence of to (or To, since the composition dependence of Tm can be neglected).
- -
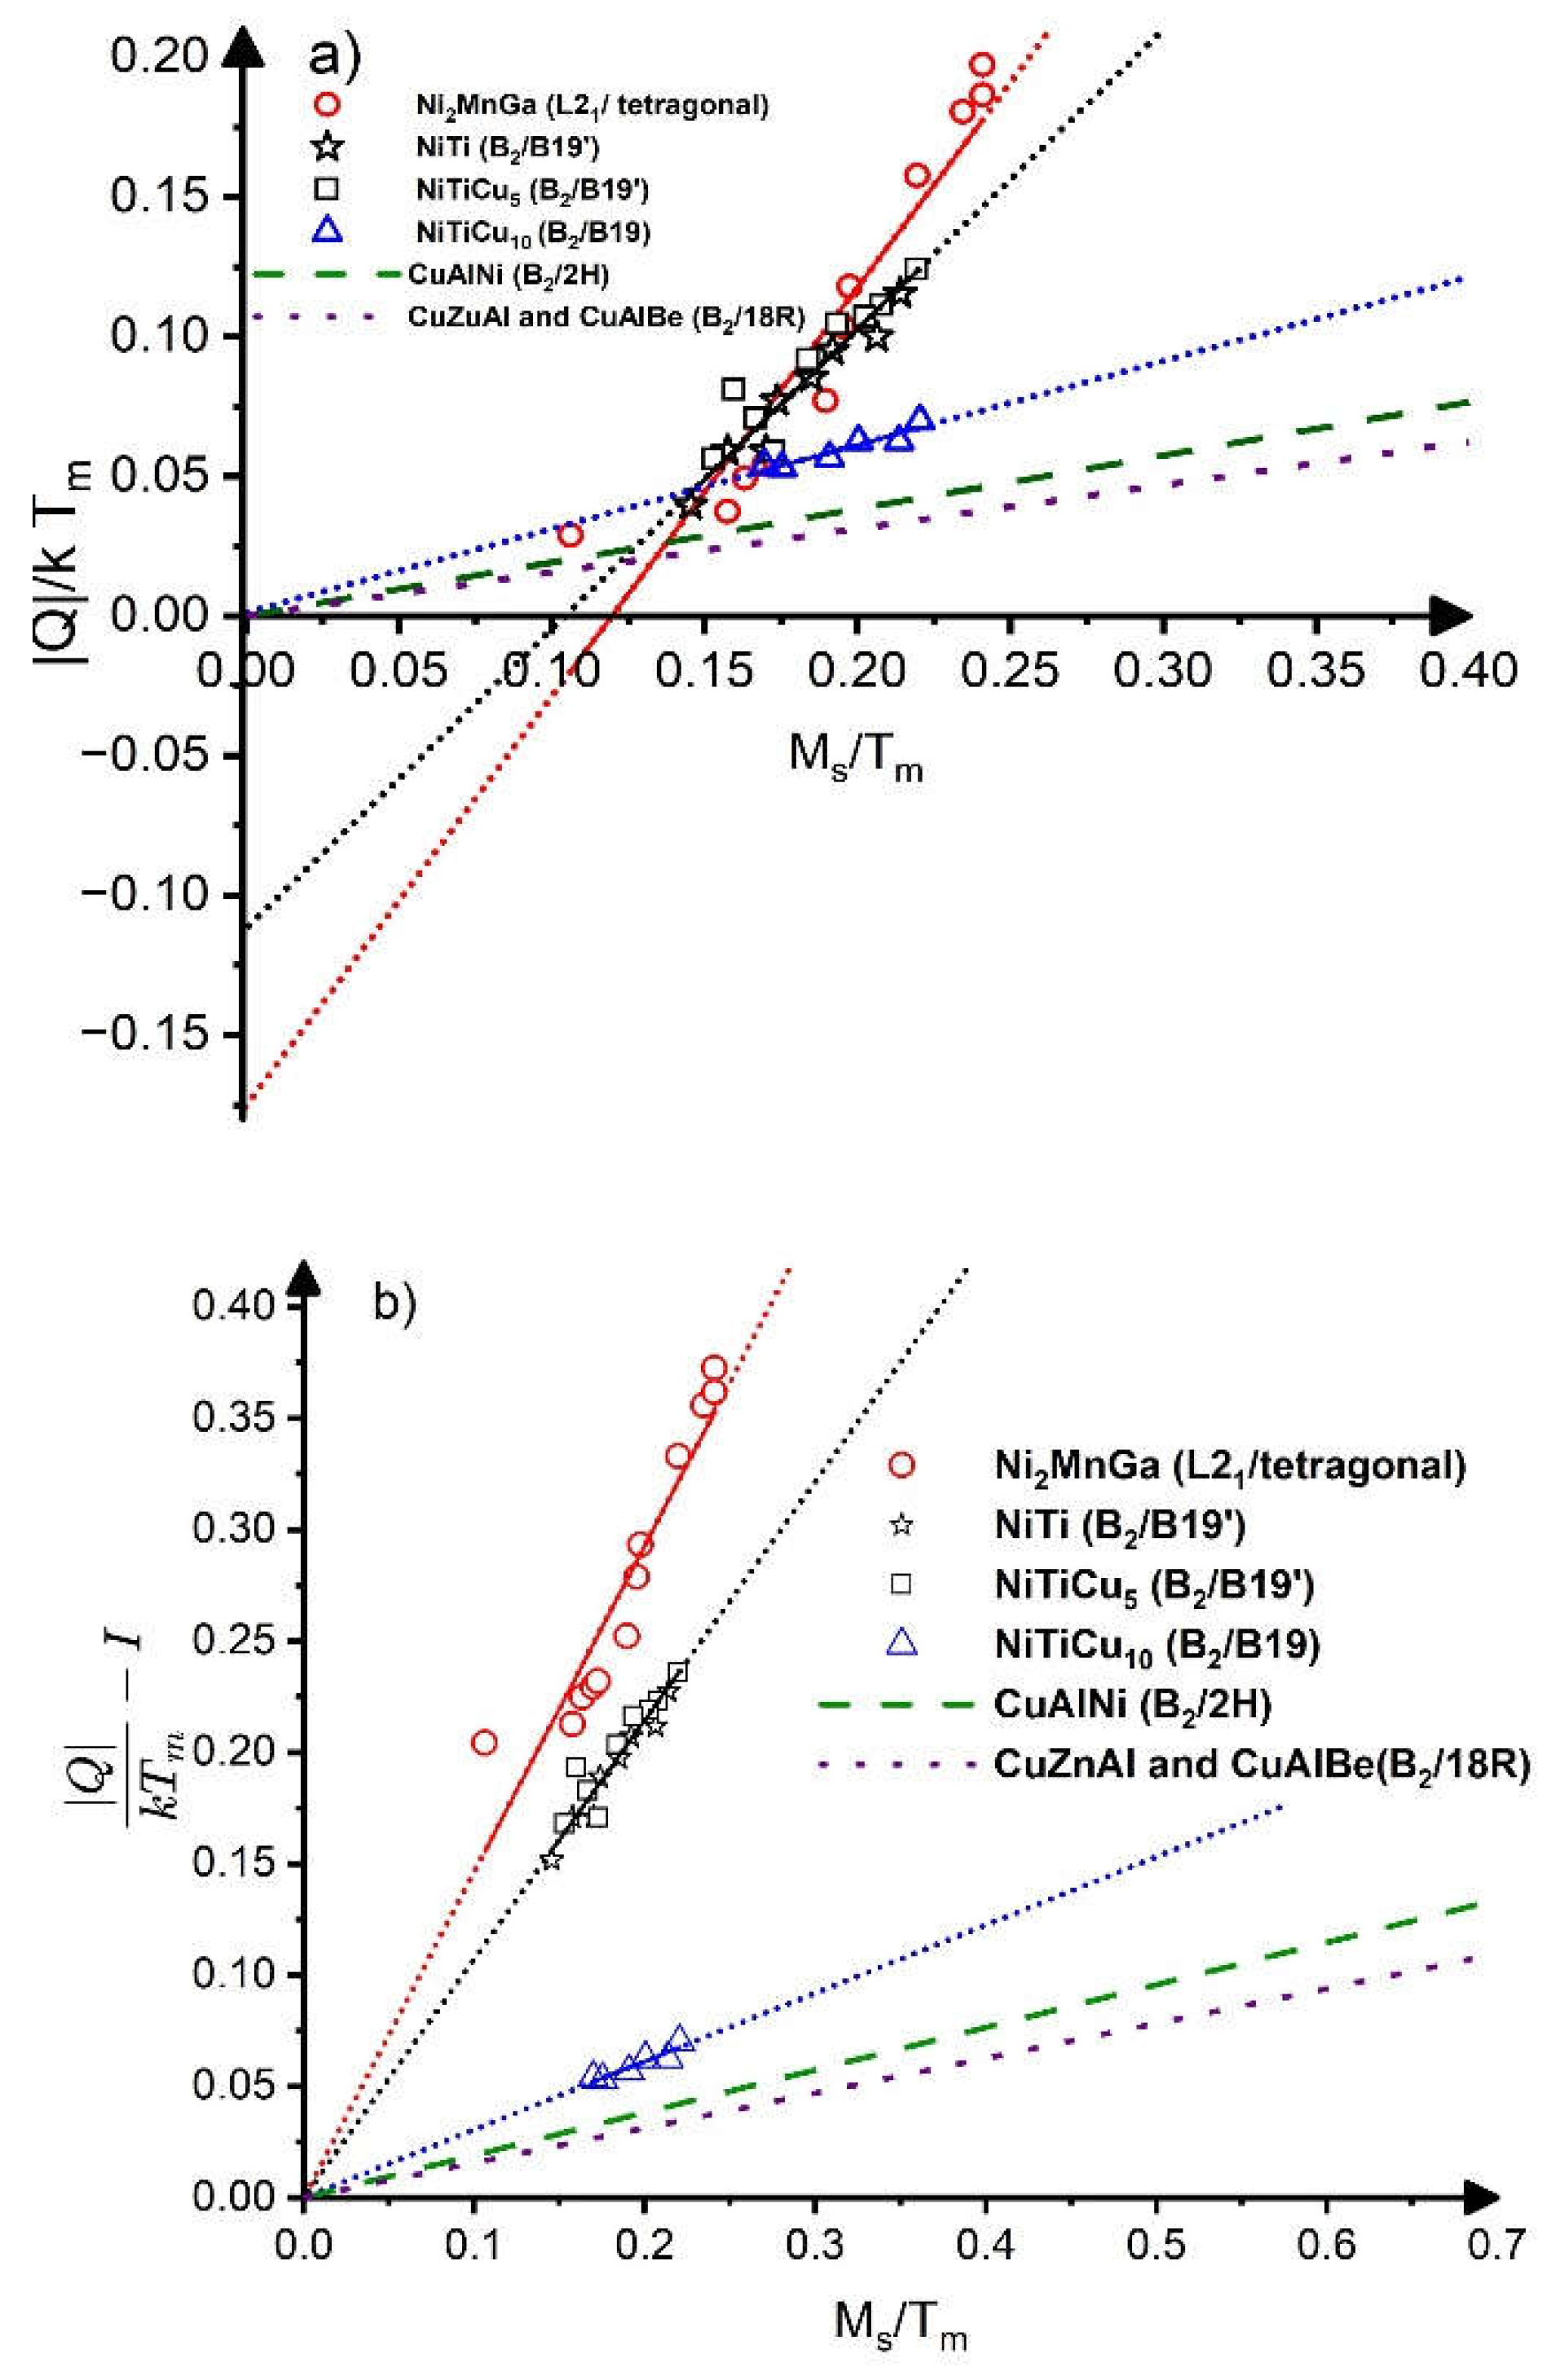
- The slopes of the linearized h versus to plots were different for SMAs with different symmetry changes during martensitic transformation forming sub-classes.
- -
- Within a given sub-class the normalized parameters like the c’ elastic constant or the anisotropy constant () are the same constants at ,
- -
- From the above property of A the generalized Ren-Otsuka relation is obtained with generalized α and β parameters ( as well as , respectively, where these are different from zero only for parameters showing phonon softening).
- -
- It is shown that is the same constant within a given sub-class.
- -
- The obtained linear relation between and To rationalizes the observed empirical linear relations between the heat of transformation measured by DSC (QA→M) and the martensite start temperature, Ms.
Author Contributions
Funding
Institutional Review Board Statement
Informed Consent Statement
Data Availability Statement
Conflicts of Interest
Appendix A The Slope and Intercept of Versus to Plots
| Alloy | slope of versus to | intercept of versus to | slope of se versus to | intercept of se versus to | |||
| NiTi | 0.83±0.10 | -0.08±0.02 | 3.0±0.7 | -0.11±0.13 | 0.50 | 0.23 | 0.20 |
| Ni2MnGa | 1.78±0.10 | -0.25±0.02 | 6.4±0.5 | -1.1±0.1 | 0.20 | 0,15 | 0.21 |

References
- X. Ren, K. Otsuka, (2000) Why does the Martensitic Transformation temperature strongly depends on composition, Mat. Sci. Forum, 327-328:429-432. [CrossRef]
- LI. Manosa, M. Jorado, A. Planes, J. Zaretsky, T. Lograsso, C. Stassis (1994) Elastic constants of bcc Cu–Al–Ni alloys, Phys. Rev. 49B:9969-72. [CrossRef]
- Planes, LI. Manosa, D. Rios-Jara, J. Ortin, (1992) Martensitic transformation of Cu-based shape-memory alloys: Elastic anisotropy and entropy change, Phys. Rev. 45B:7633-39. [CrossRef]
- J. Frenzel, A Wieczorek, J, Opahle, R. Dantz, G. Eggeler, (2015) On the effect of alloy composition on martensite start temperatures and latent heats in Ni–Ti-based shape memory alloys, Acta Mater 90:213-23. [CrossRef]
- K. Otsuka, X. Ren, (2005) Physical metallurgy of Ti–Ni-based shape memory alloys, Prog. Mater. Sci. 50:511-678. [CrossRef]
- T. Chakraborty, J. Rogal, R. Drautz, (2016) Unraveling the composition dependence of the martensitic transformation temperature: A first-principles study of Ti-Ta alloys, Phys. Rev. B 94:224104-1-9. [CrossRef]
- Ch. Li, H. Luo, Q. Hu, R. Yang, B. Johansson, L. Vitos, (2010) First-principles investigation of the composition dependent properties of Ni2+xMn1−xGa shape-memory alloys, Phys. Rev. B82: 024201-1-9. [CrossRef]
- N. Resnina, S. Belyayev, A. Sibirev, I. Ponikariva, A. Ivanov, R. Bikhaev, T. Rebrov, M. Starodubova, S. Berezovskaya, M. Kalitskaya, A. Bazlov, V. Andreev, V. Kalganov, (2023) The influence of the chemical composition of the Ti-Hf-Zr-Ni-Cu-Co shape memory alloys on the structure and the martensitic transformations, J. of Alloys and Comp. 968:172040-1-14. [CrossRef]
- S. Vedamanickam, P. Vageeswaran, B. Jacob, (2023) Theoretical analysis and design of Ti-based shape memory alloys correlating composition and electronic properties to transformation temperatures for high temperature applications, MaT. Sci. & Eng. B296:116681-1-14. [CrossRef]
- Z. Wu, J.W. Lawson, O. Benafan, (2023) Origin of the asymmetry in martensitic phase transitions in off-stoichiometric NiTi near equiatomic compositions, Phys. Rev. 108:L140103. [CrossRef]
- J.M. Lu, Q.M. Hu, R. Yang, (2008) First-principles investigations of point defect behaviour and elastic properties of Ti-Ni Alloys, Mater.Res. Soc. Simp. Proc. 1128:U09-03. [CrossRef]
- J.M. Lu, Q.M. Hu, R. Yang, (2008) Composition-dependent elastic properties and electronic structures of off-stoichiometric TiNi from first-principles calculations, Acta Mater. 56:4913-20. [CrossRef]
- X. Lin, X.Q. Tu, B.Q. Liu, J. M. Song, W. Luo, Y. Lei, G.A. Sun, B. Chen, Q.M. Hu, (2017) Composition-dependent elastic properties in TiNi-Nb from first principle calculations, J of All. and Comp. 706:260-266. [CrossRef]
- X. Ren, K. Taniwaki, K. Otsuka, T. Suzuki, K. Tanaka, Yu.I. Chumljakov, T. Ueki, (1999) Elastic constants of Ti50Ni30Cu20 alloy prior to martensitic transformation, Phil. Mag. A79:31-41. [CrossRef]
- V.V. Khovailo, K. Oikawa, T. Abe, T. Takagi, (2003) Entropy change at the martensitic transformation in ferromagnetic shape memory alloys Ni2+ xMn1− xGa, J. of Appl. Phys. 93:8483-8485. [CrossRef]
- V.V. Khovailo, V.D. Buchelnikov, R. Kainuma, V.V. Koledov, M. Ohtsuka, V.G. Shvarov, T. Takagi, S.V. Taskaev, A.N. Vasiljev, (2005) Phase transitions in Ni2+xMn1-xGa with a high Ni excess Phys. Rev. B72 (2005):224408-1-10. [CrossRef]
- H. Hosoda. K. Enami, A. Kamio, K, Inoune, (1996) Alloys design of PdTi-based shape memory alloys based on defect structures and site preference of ternary elements, J of Intelligent Materials Systems and Structures 7:312-320. [CrossRef]
- X. Ren, K. Otsuka, (1998) The role of softening in elastic constants c44 in martensitic transformations, Scripta Mater., 38: 1669-75. [CrossRef]
- D.L. Beke, G. Erdélyi, F.J. Kedves, (1981) The law of corresponding states for metals, J. Phys. Chem. Solids, 42:163-170. [CrossRef]
- J.A. Krumhansl, (1992) Landau models for structural phase transitions: Are soft modes needed? Sol. Stat. Comm. 84:251-254. [CrossRef]
- J. Frenzel, E.P. George, A. Dlouhy, C.H. Somsen, M.F.-X. Wagner, G. Eggeler (2010) Influence of Ni on martensitic phase transformations in NiTi shape memory alloys, Acta Mat. 58:3444–3458. [CrossRef]
- C.M. Focken: Dimensional Methods and Their Applications, Erward Arnold, and Co. London, 1953.
- D.L. Beke, (1989) Theoretical background of empirical laws for diffusion, Defect and Diffusion Forum Vols. 66-69:127-156. [CrossRef]
- D.L. Beke, “Tracer Diffusion in Homogeneous and Heterogeneous Alloys” in “Diffusion in Solids. Unsolved Problems” (ed. G. E Murch), Trans.Tec. Publ. Ltd. Zurich (1992) p. 31-53.
- D. LeClaire: Diffusion in Body-Centered Cubic Metals, ed. by J. A. Wheeler, Jr. and F. R. Winslow, Am. Soc. Met., Metals Park, Ohio, (1965), 3.
- Herzig, Ch., Köhler, U., (1987) Anomalous Self-Diffusion in BCC IVB Metals and Alloys, Materials Science Forum 15-18:301-322. [CrossRef]
- J.M. Sanchez, D. de Fontaine, (1975) Model for Anomalous Self-Diffusion in Group-IVB Transition Metals Phys. Rev. Letters., 35:227-230. [CrossRef]
- X. Ren, N. Miura, J. Zhang, K. Otsuka, K. Tanaka, M. Koiwa, T. Suzuki. Yu.I. Chumljakov, M. Asahi, (2001) A comparative study of elastic constants of Ti–Ni-based alloys prior to martensitic transformationMat. Sci. and Eng. A312:196-206. [CrossRef]
- D.L. Beke, L. Daróczi, N.M. Samy, L.Z. Tóth, M.K. Bolgár, (2020) On the thermodynamic analysis of martensite stabilization treatments, Acta Mater. 200:490-501. [CrossRef]
- K. Niitsu, Y. Kimura, X. Xu, R. Ksinuma, (2015) Composition dependences of entropy change and transformation temperatures in Ni-rich Ti–Ni system, Shap. Mem. Superelasticity 1:124-131. [CrossRef]
- WS. Ko, S. B. Maisel, B. Grabowski, J. B. Jeon, J. Neugebauer, (2017) Atomic scale processes of phase transformations in nanocrystalline NiTi shape-memory alloys, Acta Materialia 123:90-101. [CrossRef]
- P. Sedlák, M. Janovská, L. Bodnárová, O. Heczko, H. Seiner, (2020) Softening of Shear Elastic Coefficients in Shape Memory Alloys Near the Martensitic Transition: A Study by Laser-Based Resonant Ultrasound Spectroscopy, Metals, 10:1383-1-13. [CrossRef]
- Mercier, K.N. Melton, G, Gremaud, J. Hagi, (1980) Single-crystal elastic constants of the equiatomic NiTi alloy near the martensitic transformation, J. appl. Phys., 51:1833-34. [CrossRef]
- C-M. Li, H-B. Luo, Q-M. Hu, R. Yang, B. Johansson, L. Vitos, (2011) Site preference and elastic properties of Fe-, Co-, and Cu-doped NiMnGa shape memory alloys from first principles, Phys. Rev. B84:024206-1-10. [CrossRef]
- P. Sedlák, M. Janovská, P. Bodnarová, O. Heczko, (2020) Softening of shear elastic coefficients in shape memory alloys near the martensitic transition: A study by laser-based resonant ultrasound spectroscopyMaterials, Mat. 10:1383-1-13. [CrossRef]
- P. Zhao, L. Dai, L. Cullen, M. Wuttig, (2007) Magnetic and Elastic Properties of Ni49.0 Mn23.5 Ga27.5 Premartensite, Metallurgical and Materials Transactions 38A:745-751. [CrossRef]
- W. Arneodo, M. Ahlers, (1974) The martensitic transformation in β Cu-Zn, Acta Met. 22:1475-1480. [CrossRef]
- M. Ahlers, (1986), Martensite and equilibrium phases in Cu-Zn and Cu-Zn-Al alloys, Progress in Mat. Sci. 30:135-186. [CrossRef]
- Planes, R. Romero, M. Ahlers, (1990) The martensitic transition temperature in ternary Cu-Zn-Al alloys. Influence of the L21 structure, Acta Met. Mat. 38:757-763. [CrossRef]
- G.Guenin, M. Morin, P.T. Gobin, W. Dejonghe, L. Delaey, (1977) Elastic constant measurements in β Cu-Zn-Al near the martensitic transformation temperature, Scripta Mat. 11:1071-1075. [CrossRef]
- V, Recarte, J.I. Perez-Lanadazábal, M,I, Nó, J. San Juan, (2004) Study by resonant ultrasound spectroscopy of the elastic constants of the β phase in Cu-Al-Ni shape memory alloys, Mat. Sci. Eng. A 70:488-491. [CrossRef]
- B. Verlinder, L. Delaey, (1988) On the elastic constants and Ms-temperatures in β-Hume-Rothery alloys, Acta Met. 36:1771-1779. [CrossRef]
- T. Castan. A. PLanes, (1988) Elastic constants of bcc shape-memory binary alloys: Effect of the configurational ordering, Phys. Rev B 38:7959-7965. [CrossRef]
- Y.A. Chang, L. Himmel, (1966) Temperature dependence of the elastic constants of Cu, Ag, and Au above room temperature, J. of Appl Phys. 37:3567–3572. [CrossRef]
- B. Verlinder, L. Delaey, (1988) Beta-Phase stability and martensitic nucleation in hume-rothery alloys, Metallurgical Trans. 19A:207-216. [CrossRef]


| sub-class/alloy |
|
|
|
A | |||||
|
B2/B19’ binary Ni50+xTi50-x [4,5,14,21,28,30,32] |
0.12 | 8.0 | 8.7 | 0.5 | 18 | 2.0 | -2.9 | ||
|
B2/B19’ Ti45-xNi45+xCu5 (0≤x≤+1.2at%) [4] |
0.12 | 5.3 | 4.9 | 0.56 |
- | - | - | - | |
| B2/B19 Ti50-xNi40+xCu10 (0≤x≤+1.2at%) [4,28] |
0.09 | 4.2 |
3.8 |
0.37 | 9.6 |
28 |
2.4 | -5.3 | |
|
L21/tetragonal* Ni2+xMnxGa [7,15,16,32,33,34,35,36] |
0.03 | 59 | 60 | 0.20 |
9.4 | 80 | 8.4 | -3.1 | |
|
B2/18R |
CuAlBe [2,3] | 0.03 | 5.2 | 4.9 | 0.15 | 5.3 | 71.4 | 13.7 | -1.0 |
|
CuZn [5,14,37,38,40,42] |
0.04 | 4.8 |
2.7 | 0.16 | - | - | 11 | -0.8 | |
| CuZnAl [2,3,37,38,39,40] | 0.04 | 3.9 | 12 | 0.16 | 5.2 | 70.5 | 13.6 | -1.0 | |
| B2/2H Cu68Al28Ni4 [2,3,35,41] |
0.04 | 4.8 | 3.9 | 0.19 | 5.7 | 116 | 19 | -2.85 | |
| sub-class/alloy | Tm (K) | c’ (Gpa) |
(GPa) |
||||||||
|
B2/B19’ binary Ni50+xTi50-x [4,5,14,21,28,30,32] |
1583 | 0.23 | 14.4 | 28.6 | 2.5 | 5.4 | -4 | - 6.3 | -55 | ||
|
B2/B19’ Ti45-xNi50+xCu5 (-2≤x≤+2) [4] |
1583 | 0.26 | - | - | - | - | - | - | -45 | -4.3 | |
| B2/B19 Ti50-xNi40+xCu10 (0≤x≤+1.2at%) [4,14,27,28] |
1550 | 0.22 |
14.5 |
34.53 |
3.9 | -1.4 | - | - | -62 | -2.0 | |
|
L21/tetragonal Ni2+xMnxGa [7,15,16,32,33,34,35,36] |
1403 | 0.15 | 12.8 | 107 | 3.1 | ~0 | -15* | 1.9 | 115 | ||
|
B2/18R |
CuAlBe [2,3] | 1353 | 0.20 | 7.0 | 95 | 0.46 | -0.52 | 10 | -10.8 | -53 | |
|
Cu1-xZnx (0.38≤x≤0.50) [5,14,37,3840] |
1048 | 0.22 | 9.0 | 82 | 0.34 | -0.46 | 6.5** | ~0 | -6.1 | -17 | |
|
CuZnAl [2,3,37,38,39,40] |
1210 | 0.17 | 6.2 | 86 | 0.52 | -0.48 | 3.5 | -6.1 | -75 | ||
| B2/2H Cu68Al28Ni4 [2,3,35,41] |
1353 | 0.18 | 7.4 |
140 | 0.65 |
-2.2 | 4.5 |
|
-7.4 | -29 | |
| sub-class/alloy | |||||||
|
ÍB2/B19’ binary Ni50+xTi50-x |
2.9 | 14 | -0.35 |
-0.45 | -7642 | -9973 | |
|
L21/ tetragonal Ni2+xMnxGa |
3.1 | -15 | -0.32 | -0.13 | 6788 |
2666 | |
|
B2/18R |
CuAlBe | 0.62 | 10 | -1.6 | -1.1 | -21823 | -14612 |
|
CuZn |
0.34 | 6.5 | -2.9 | -0.94 | -8552 | -6393 | |
| CuZnAl |
0.52 | 3.5 | -1.9 | -1.7 | -8144 | -7381 | |
| B2/2H Cu68Al28Ni4 |
0.65 | 4.5 | -1.5 | -1.6 | -9370 | -10012 | |
Disclaimer/Publisher’s Note: The statements, opinions and data contained in all publications are solely those of the individual author(s) and contributor(s) and not of MDPI and/or the editor(s). MDPI and/or the editor(s) disclaim responsibility for any injury to people or property resulting from any ideas, methods, instructions or products referred to in the content. |
© 2024 by the authors. Licensee MDPI, Basel, Switzerland. This article is an open access article distributed under the terms and conditions of the Creative Commons Attribution (CC BY) license (http://creativecommons.org/licenses/by/4.0/).


