Preprint
Article

Characterizing the Planktonic and Sedimentary Communities of Bacteria, Archaea and Eukaryotes in an Urban Glaciotectonic Cave

Altmetrics

Downloads

133

Views

58

Comments

0

A peer-reviewed article of this preprint also exists.

Submitted:

29 July 2024

Posted:

30 July 2024

You are already at the latest version

Alerts
Abstract
The terrestrial subsurface harbors unique microbial communities that play important biogeochemical roles and allows studying a yet unknown fraction of the Earth’s biodiversity. The Saint-Leonard cave in Montreal city (Canada) is of glaciotectonic origin. Its speleogenesis traces back to the withdrawal of the Laurentide Ice Sheet, 13 000 years ago, during which the moving glacier dislocated the sedimentary rock layers. Our study is the first to investigate the microbial communities of the cave. By using amplicon sequencing, we analyzed the taxonomic diversity and composition of bacterial, archaeal and eukaryotes communities living in the groundwater (0.1µm- and 0.2µm-filtered water), in the sediments and in surface soils. We identified a microbial biodiversity typical of cave ecosystems. Communities were mainly shaped by habitat type and harbored taxa associated with a wide variety of lifestyles and of metabolic capacities. Although we found evidence of a geochemical connection between the above soils and the cave’s galleries, our results suggest that the community assembly dynamics are driven by habitat selection rather than dispersal. Furthermore, we found that the cave’s groundwater, in addition to being generally richer in microbial taxa than sediments, contained a considerable diversity of ultra-small bacteria and archaea.
Keywords: 
Subject: Biology and Life Sciences  -   Ecology, Evolution, Behavior and Systematics

1. Introduction

The Earth’s terrestrial subsurface harbors an important microbial diversity whose community structures, metabolic pathways, and ecological functions reflect the peculiarities of their environment [1,2,3]. Bacteria, archaea, microeukaryotes and viruses striving in the deep continental biosphere could account for up to one fifth of the planet’s microbial biomass, weighting around 1016 to 1017 g C [4]. The subsurface comprises a still largely unexplored array of habitats supporting microbes – e.g., aquifers [5], bedrock [6], caves [7], abandoned mines [8,9] and petroleum reservoirs [10] – in which extreme conditions often prevails [11], like total darkness, low-nutrient input levels, variable water availability and humidity, high or low temperatures, and/or anoxic conditions. Despite the challenges associated with sampling belowground like limited accessibility and potential contamination by heavy equipment [2,12], the study of subterranean microbiology has emerged by the turn of the century as a promising field [13]. The continental subsurface provides opportunities for extreme environment adaptation exploration [14], including their repercussion on biotic interactions. One example of these adaptations are the ultra-small prokaryotes, who generally strive in aquifers since smaller sizes are linked to a response strategy to harsh environmental conditions [15,16]. Ultra-small bacteria and archaea belonging to CPR and DPANN superphyla have been detected in groundwater [17]. These ultra-small microorganisms have a volume of ≤ 0.1µm3 (diameter from <0.05 to 0.40 µm), a streamlined genome (0.58 à 3.2 Mbp) and show a loss of facultative and essential metabolic pathways. Consequently, they often form symbiotic associations with other prokaryotes [15,18], an interkingdom symbiosis has even been described [19]. The study of subsurface microorganisms has also led to the discovery of metabolisms capable of bioremediation [20,21,22]. Furthermore, research on these peculiar microbial communities supports a better understanding of global biogeochemical cycles [2,23], early forms of life on earth [24] and the rise of multicellularity [25]. The subsurface also provides opportunities to make hypotheses about characteristics of life elsewhere in the universe [26,27].
A component of subsurface ecosystems are caves, which are especially interesting habitats to investigate. As natural cavities in rocky environments, they constitute unique passages, or « windows », for the scientists to access the underground world and its inhabitants [28]. Barton and Jurado [29] hypothesized that due to the poor nutrient state of their environment and the often-limited metabolic capacities of species, underground microbial community dynamics might be driven by mutualistic associations rather than the exclusion of competitors. As demonstrated by Anantharaman et al. [30] in an aquifer ecosystem, syntrophic interactions are essential to subterranean microbial community functioning since few microorganisms can perform all redox reactions of a given pathway. Nonetheless, some cave microorganisms produce antimicrobials, and their genomes host antimicrobial resistance genes [31]. These bioactive secondary metabolites mediate microbe interactions, acting as weapons in interference competition but also as signaling molecules and as food source [32,33,34]. Actinobacteriota, which abound in cave environments, comprise taxa naturally producing antimicrobial metabolites, some of which are used in medicine [35].
In addition, caves often provide diverse interrelated ecological compartments – notably water and sediments – calling for particular taxonomic and functional associations. Most caves are oligotrophic and static environments [7,36], yet molecular phylogenetic techniques have shown that these caves can be home to unique taxa and assemblages of prokaryotic and eukaryotic microorganisms [37,38,39]. Bacteria is the most abundant domain found in cave ecosystems, and the lineages found in oligotrophic caves span the entire domain [29], with Actinobacteriota and Proteobacteria phyla generally dominating [40,41,42]. Archaea are mainly represented by members of Crenarchaeota [38,43,44]. As for the eukaryotes, fungi – especially the Ascomycota phylum [45] – as well as organisms from the Alveolata clade and the TSAR supergroup [46] generally contribute to the microbial community structure of the different ecological compartments of caves.
If the extreme abiotic conditions shape the biotic communities of caves, the microbes can in turn impact their environment by various destructive and constructive processes [13,47], for instance the dissolution of carbonate rock by secretion of sulfuric acid [48] and the formation of speleothems – secondary mineral deposits – such as moonmilk [49], pool fingers [50], and coralloids [51]. Owing to the myriads of metabolisms sustained by caves microorganisms, microbial communities are critical participants in global geochemical cycles of key elements, namely carbon, nitrogen, sulfur [41,52], iron [53,54], manganese [44,55] and phosphorus [56]. Caves are predominantly formed in a karst, a geologic environment or landscape of extensive groundwater flow system where speleogenesis occurs through the dissolution of soluble rock, mainly carbonates such as limestone [57,58]. But the formation of caves can also naturally result from several other geological and chemical processes [59], among which the mechanical action of glacier movement on sedimentary rock [60]. Such glaciotectonic caves have so far only been detected in the province of Quebec, Canada [61]. The Saint-Leonard cave is located on the island of Montreal (Quebec province, Canada). Its glaciotectonic origin traces back to around 13 000 years ago, during the withdrawal of the Laurentide Ice Sheet. This non-karstic cave was mechanically formed by the dislocation of the 460 M year-old sedimentary rock composing the Rosemont Member of the Montreal Formation (Trenton Group, Ordovician) in the St. Lawrence Lowlands physiographic region [61]. The subhorizontal clayey limestones interstratified with thin calcareous shales were subjected to pressure, thrust, and friction from the moving continental glacier, thus resulting in the opening of preexisting fractures and the interbed sliding of strata along shales, with the upper layers displacing further than the lower ones [60,62].
The unusual glaciotectonic speleogenesis of the Saint-Leonard cave, combined with its urban setting, make it a unique environment of the planet’s subsurface that has yet to be biologically explored. By using amplicon sequencing of the 16S/18S rRNA genes for the Bacteria, Archaea and Eukaryote domains, this metataxonomic study aims to analyze the microbial communities’ structure present in the water column and sediments of the cave, as well as their links to surface microbial communities potentially seeping inside the cave. As a first exploratory inquiry of bacterial, archaeal and eukaryotic life of Saint-Leonard’s underground galleries, our main objective was to characterize and compare the taxonomic diversity and composition of aquatic and sedimentary communities, as well as those from the surface soils, for each of the three domains. A special attention was given to ultra-small prokaryotic taxa living in the cave’s water since they have been shown to compose a substantial part of groundwater communities.

2. Materials and Methods

2.1. Study Site Description

The entrance of the Saint-Leonard cave is located in the municipal Pie-XII Park, in Montreal, Quebec, Canada (45.588234 N 73.607872 W). The cave was discovered in 1812 but only 35 meters of corridor were then known to exist, until excavation work in 2017 revealed 370 meters of new galleries [61]. The cave is partially open to the public, who can book guided visits to explore the historic portion only. Overall, the galleries of the cave extend over 400 meters long with a ceiling 3 to 5 meters deep belowground from which tree roots hang at some places. The corridors’ width is between 0.5 to 4 meters and their height can reach up to 7 meters at some points. Two galleries compose the cave : Radiesthesia Gallery has a partly dry floor consisting mainly of rocky debris, while Echo Gallery is entirely aquatic and needs to be navigated by kayak [62]. The depth of the water table inside the Echo Gallery’s corridors fluctuates with local and seasonal hydrological events like snow melting and rainfall and can be more than 4 meters high [60]. Sediments have deposited on the bottom floor and also on numerous edges of the walls due to the oscillation of the water level [60]. Water residence time is short [63]. Air and water temperature varies seasonally from 5 to 12 °C [62].

2.2. Sampling and Water Filtration

For amplicon sequencing analyses, sampling of water (W) and sediments (S) inside the cave was performed in October 2021, in the two galleries (Radiesthesia and Echo) closed to the public (Figure 1a). Seven water samples (2 from the Radiesthesia and 5 from the Echo) were collected in sterile polypropylene bottles (Nalgene, Rochester, NY, USA) and four sediment samples (3 from the Radiesthesia and 1 from the Echo) were collected in 50 mL sterile Falcon tubes. Samples were kept at 4°C during transportation to the laboratory. Upon arrival, water was immediately filtered, and sediments were frozen at - 80°C. Each 500 mL water sample was separated in two size fractions. First the water was filtered through a 0.2 µm (W2) polyethersulfone filter (Sartorius, Midisart, Germany) with a vacuum pump. Filtrate was collected in a sterile Erlenmeyer, then filtered a second time, through a 0.1 µm filter (W1). Filters were kept frozen at -80°C until DNA extraction.
Eight surface soil samples (SS) were collected in the parks surrounding the entrance to the cave, all potential water seepage sources for the groundwater in the cave (Figure 1b). One surface water puddle (SW) close to the soil sample SS8 was also collected in a 50 mL sterile Falcon tube. The soil samples were stored at -80°C upon arrival to the lab, and the water sample was filtered as described above.

2.3. Water Geochemical and Physicochemical Analyses

Subsamples of the water collected inside the cave were used for physicochemical analysis. For dissolved organic and inorganic carbon (DOC/DIC), water was filtered through a 0.45 µm polyethersulfone filter (Sarstedt, Numbrecht, Germany) and stored in gas-free glass bottles, which were kept at 4°C until analyses. Water was filtered through a 0.22 µm filter for ammonia/ammoniac (NHX), and through a 0.45 µm filter for nitrate (NO3-) and nitrite (NO2-), and collected in plastic scintillation bottles, which were frozen at -20°C. All further analysis were conducted at the GRIL (Interuniversity Research Group in Limnology) – UQAM (Université du Québec à Montréal) analytical laboratory. DOC and DIC concentrations (mg/L) were measured with an Aurora 1030W TOC Analyzer (OI Analytical, College Station, TX, USA) using a persulfate oxidation method. An OI Analytical Flow Solution 3100 continuous flow analyzer was used to measure inorganic nitrogen concentrations (mg/L). Ammonia/ammonium was quantified using a chloramine reaction with salicylate to form indophenol blue dye (EPA Method 350.1). Nitrate and nitrite were quantified using an alkaline persulfate digestion method, coupled with a cadmium reactor, following a standard protocol [64]. pH and temperature were measured on site with a YSI multiparameter probe (model 10102030, Yellow Springs, OH, USA).

2.4. Sediment Characteristics

Subsamples of the surface soil and cave sediment samples were dried for 72 hours at 22°C under a laminar flow hood, then finely powdered with a mortar and pestle. All physicochemical analysis were conducted at the GEOTOP laboratory (UQAM). Total carbon (Ctot), organic carbon (Corg), inorganic carbon (Cinorg) and total nitrogen contents (Ntot) were measured with a Carlo Erba NC2500 elemental analyzer (Thermo Fisher Scientific, MA, USA). Prior to organic carbon measurements, samples were fumigated with hydrochloric acid for 24 hours to eliminate inorganic carbon. Carbon-13 (13C) and nitrogen-15 (15N) isotope content was measured by stable isotope ratio mass spectrometry with a Micromass Isoprime 100 spectrometer, coupled to a Vario MicroCube elemental analyser (Elementar, Lyon, France) in continuous flow mode. To measure pH, sediment powder was suspended in ultra-pure double-deionized water (Milli-Q) in a 1:4 ratio and mixed continuously for 30 minutes. pH values were obtained with a combined glass electrode (accuTupH and Accumet XL600; Thermo Fisher Scientific Inc.).

2.5. DNA Extraction

DNA was extracted from water filters (0.2 and 0.1 µm) with the DNeasy PowerWater Kit (Qiagen, Hilden, Germany) following the manufacturer’s protocol. DNA was eluted in 100 µL 10 mM Tris HCl (pH 8.5) and stored at -80°C. One negative control was prepared for each filter size by filtering 500 mL of autoclaved ultra-pure water and using it with the kit in the same conditions as the cave water samples. For surface soil and cave sediment samples, DNA was extracted with the DNeasy PowerSoil Kit (Qiagen) following the manufacturer’s protocol, eluted in 100 µL 10 mM Tris HCl (pH 8.5), then stored at -80°C. One negative control was prepared using sterile ultra-pure water with the kit.

2.6. PCR, Library Preparation and Sequencing

Polymerase chain reaction (PCR), library preparation and sequencing of 16S and 18S rRNA genes were performed at The Center of Excellence in Research on Orphan Diseases – Fondation Courtois (CERMO-FC, UQAM). PCR amplification was carried out using the Phusion Hot Start II DNA Polymerase (2 U/µL) (ThermoFisher). For Bacteria, the V3-V4 hypervariable region of the 16S rRNA gene was targeted using the B341F (5′– CCTACGGGAGGCAGCAG–3′) [65] and B785R (5′–GACTACCGGGGTATCTAATCC–3′) [66] primer pair. For Archaea, the V3-V4-V5 region of the 16S rRNA gene was targeted using the A340F (5′–CCCTACGGGCYCCASCAG–3′) [67] and A915R (5′-GTGCTCCCCCGCCAATTCCT–3′) [68] primer pair. For Eukaryotes, primer pair E960F (5′–GGCTTAATTTGACTCAACRCG–3′) [69] and NSR1438R (5′–GGGCATCACAGACCTGTTAT–3′) [70] was used to target the V5-V7 region of the 18S rRNA gene. We did not carry out PCR amplification for the water 0.1 µm samples for the Eukaryote domain. PCR was carried out following these conditions: denaturation at 98°C for 30 s; annealing for 30 s at 57°C for Bacteria, 67°C for Archaea and 55°C for Eukaryotes; and extension occurred at 72°C for 1 min. Final extension occurred at 72°C for 10 min, after 35 amplification cycles for Bacteria and Archaea and 33 cycles for Eukaryotes. PCR products were normalized and purified, and libraries were submitted to a quality control. Sequencing was performed on an Illumina MiSeq 2300 using the MiSeq Reagent Kit v3 (600 cycles; Illumina, San Diego, CA, UQA). For each domain, a PCR negative control was sequenced. Raw sequences were deposited on the National Center for Biotechnology Information platform (NCBI) under the BioProject ID PRJNA1139756.

2.7. Sequence Analysis

Amplicon sequences variants (ASV) were generated from raw sequences using DADA2 (v.1.24) [71] in R (v.4.2.2) [72]. Primers were removed and forward and reverse reads were truncated at positions 275 and 225 (Bacteria) and at positions 260 and 260 (Eukaryotes). For Archaea sequences, because of the low quality of the reverse reads, the forward and reverse reads could not overlap, and only the forward reads were kept and truncated at position 275. Sequences were then consolidated and denoised, and chimeras were removed to obtain an ASV table for each domain. The cave water sample #7 filtered with a 0.1 µm filter did not yield enough sequences for further analyses, for all 3 domains.
Taxonomic annotations of ASV were made using the SILVA SSU database (v.138.1) for the Bacteria [73]. For the Archaea, we used a personal database to further classify ASV from Bathyarchaeota phylum (based on Zhou et al. [74]) and Woesearchaeota phylum (based on Liu et al. [75]). For the Eukaryotes, we used the PR2 database (v.4.14.0) [76]. To decontaminate the ASV communities of each type of sample (water filtered at 0.2 and 0.1 µm, soils and sediments), we used the decontam package [77] with the kit blank control samples and the negative PCR controls. Finally, ASV tables were normalized using the median depth sequencing method [78].

2.8. Statistical Analysis

All statistical analysis were carried out using R (v.4.2.2) [72] unless otherwise stated. All statistical analysis described below were conducted for each of the three domains separately, and statistical significance level was set to 0.05. Shannon diversity indices, as well as richness (Chao1) and evenness diversities were calculated to compare alpha diversity between the different habitats (water filtered at 0.1 µm, water filtered at 0.2 µm, sediments, and surface soils). Kruskall-Wallis and Dunn tests were performed for all three domains using the dunnTest function of the FSA package [79].
To analyze beta diversity, we first visualized community compositional variation between samples by performing a Principal Coordinates Analysis (PCoA) on a Bray-Curtis dissimilarity matrix computed with the PAST4 software [80]. To test if community composition differed between habitat types, a PERMANOVA [81] was performed with the adonis2 function of the vegan package (nperm = 999) [82]. We used analysis of molecular variance (amova) to further distinguish which sample group differences significantly explained the PERMANOVA results. We used homogeneity of molecular variance (homova) to test compositional homogeneity between 2 sample groups. Both these tests were run in mothur (v.1.47) [83] using the amova and homova functions. Correlation between the Bray-Curtis dissimilarity matrices and environmental matrices were tested with a distance-based redundancy analysis (db-RDA), on a Hellinger transformed ASV matrix, using the capscale function of the vegan package in R. The significance of explanatory variables was assessed with the anova function with 200 permutations. The contributions of each significant variable were determined with the varpart function in vegan.
We constructed barplots showing the relative abundance of phyla and genera in each sample and we ran a Linear Discriminant Analysis Effect Size (LEfSe) to reveal which genera were the most likely to explain compositional difference between habitat types, using the lefse function in mothur. To estimate the proportion of surface soil and water microbial communities (sources) contributing to the formation of the sediment and water microbial communities in the cave (sinks), we used fast expectation-maximization microbial source tracking (FEAST) [84].

3. Results

3.1. Water, Sediment and Soil Characteristics

Groundwater samples had homogeneous environmental conditions regarding DIC, DOC, and inorganic nitrogen concentrations (ammonia, ammonium, nitrite and nitrate) (Table 1). We measured an average DOC concentration of 1.64 mg/L and an average DIC concentration of 46 mg/L. The water pH was close to neutral with an average of 7.54.
Cave sediment samples showed variation in inorganic and organic carbon, which were both low, as well as total nitrogen content (Table 2). pH was slightly basic with an average of 8.1. δ13C values ranged from -26.3 to -24.7 ‰, and δ15N values were only measured for samples S2 (7 ‰) and S4 (3.8 ‰). Apart from sample SS1 which was acidic, the surface soils had a pH varying from 7.1 to 7.8 and were characterized by a high content in organic carbon constituting most of the carbon pool. Total nitrogen concentrations were on average 6 times higher than in the cave sediments. δ13C values ranged from -28.1 to -24.4 ‰, and δ15N values ranged from 0.5 to 4 ‰.

3.2. Alpha-Diversity of the Microbial Communities

Bacterial Shannon indices did not significantly differ between the four different habitats (cave water 0.2 µm, water 0.1 µm, cave sediments, and surface soils) (Supplemental Material Figure S1 and Table S1). ASV richness was significantly different between cave sediments and water 0.2 µm (S>W2), and between water 0.2 and 0.1 µm (W1>W2). Evenness was significantly different between cave sediments and surface soils (SS>S), surface soils and water 0.1 µm (SS>W1), and between water 0.2 and 0.1 µm (W2>W1).
Archaeal Shannon indices were significantly different between surface soils and both cave water samples (W1>SS, W2>SS), as well as between the sediments and both water samples (W1>S, W2>S) (Supplemental Material Figure S2 and Table S2). The same was observed for ASV richness except that sediment richness was not significantly different from water 0.1 µm (W1>SS, W2>SS, W2>S). Evenness was significantly different between surface soils and water 0.1 µm (W1>SS), sediments and water 0.1 µm (W1>S), and between water 0.1 and 0.2 µm (W1>W2).
Eukaryote Shannon indices were significantly different between sediments and water 0.2 µm (W2>S) (Supplemental Material Figure S3 and Table S3). The same was observed for ASV richness (W2>S). No significant differences were observed for evenness.

3.3. Taxonomic Composition of the Microbial Communities

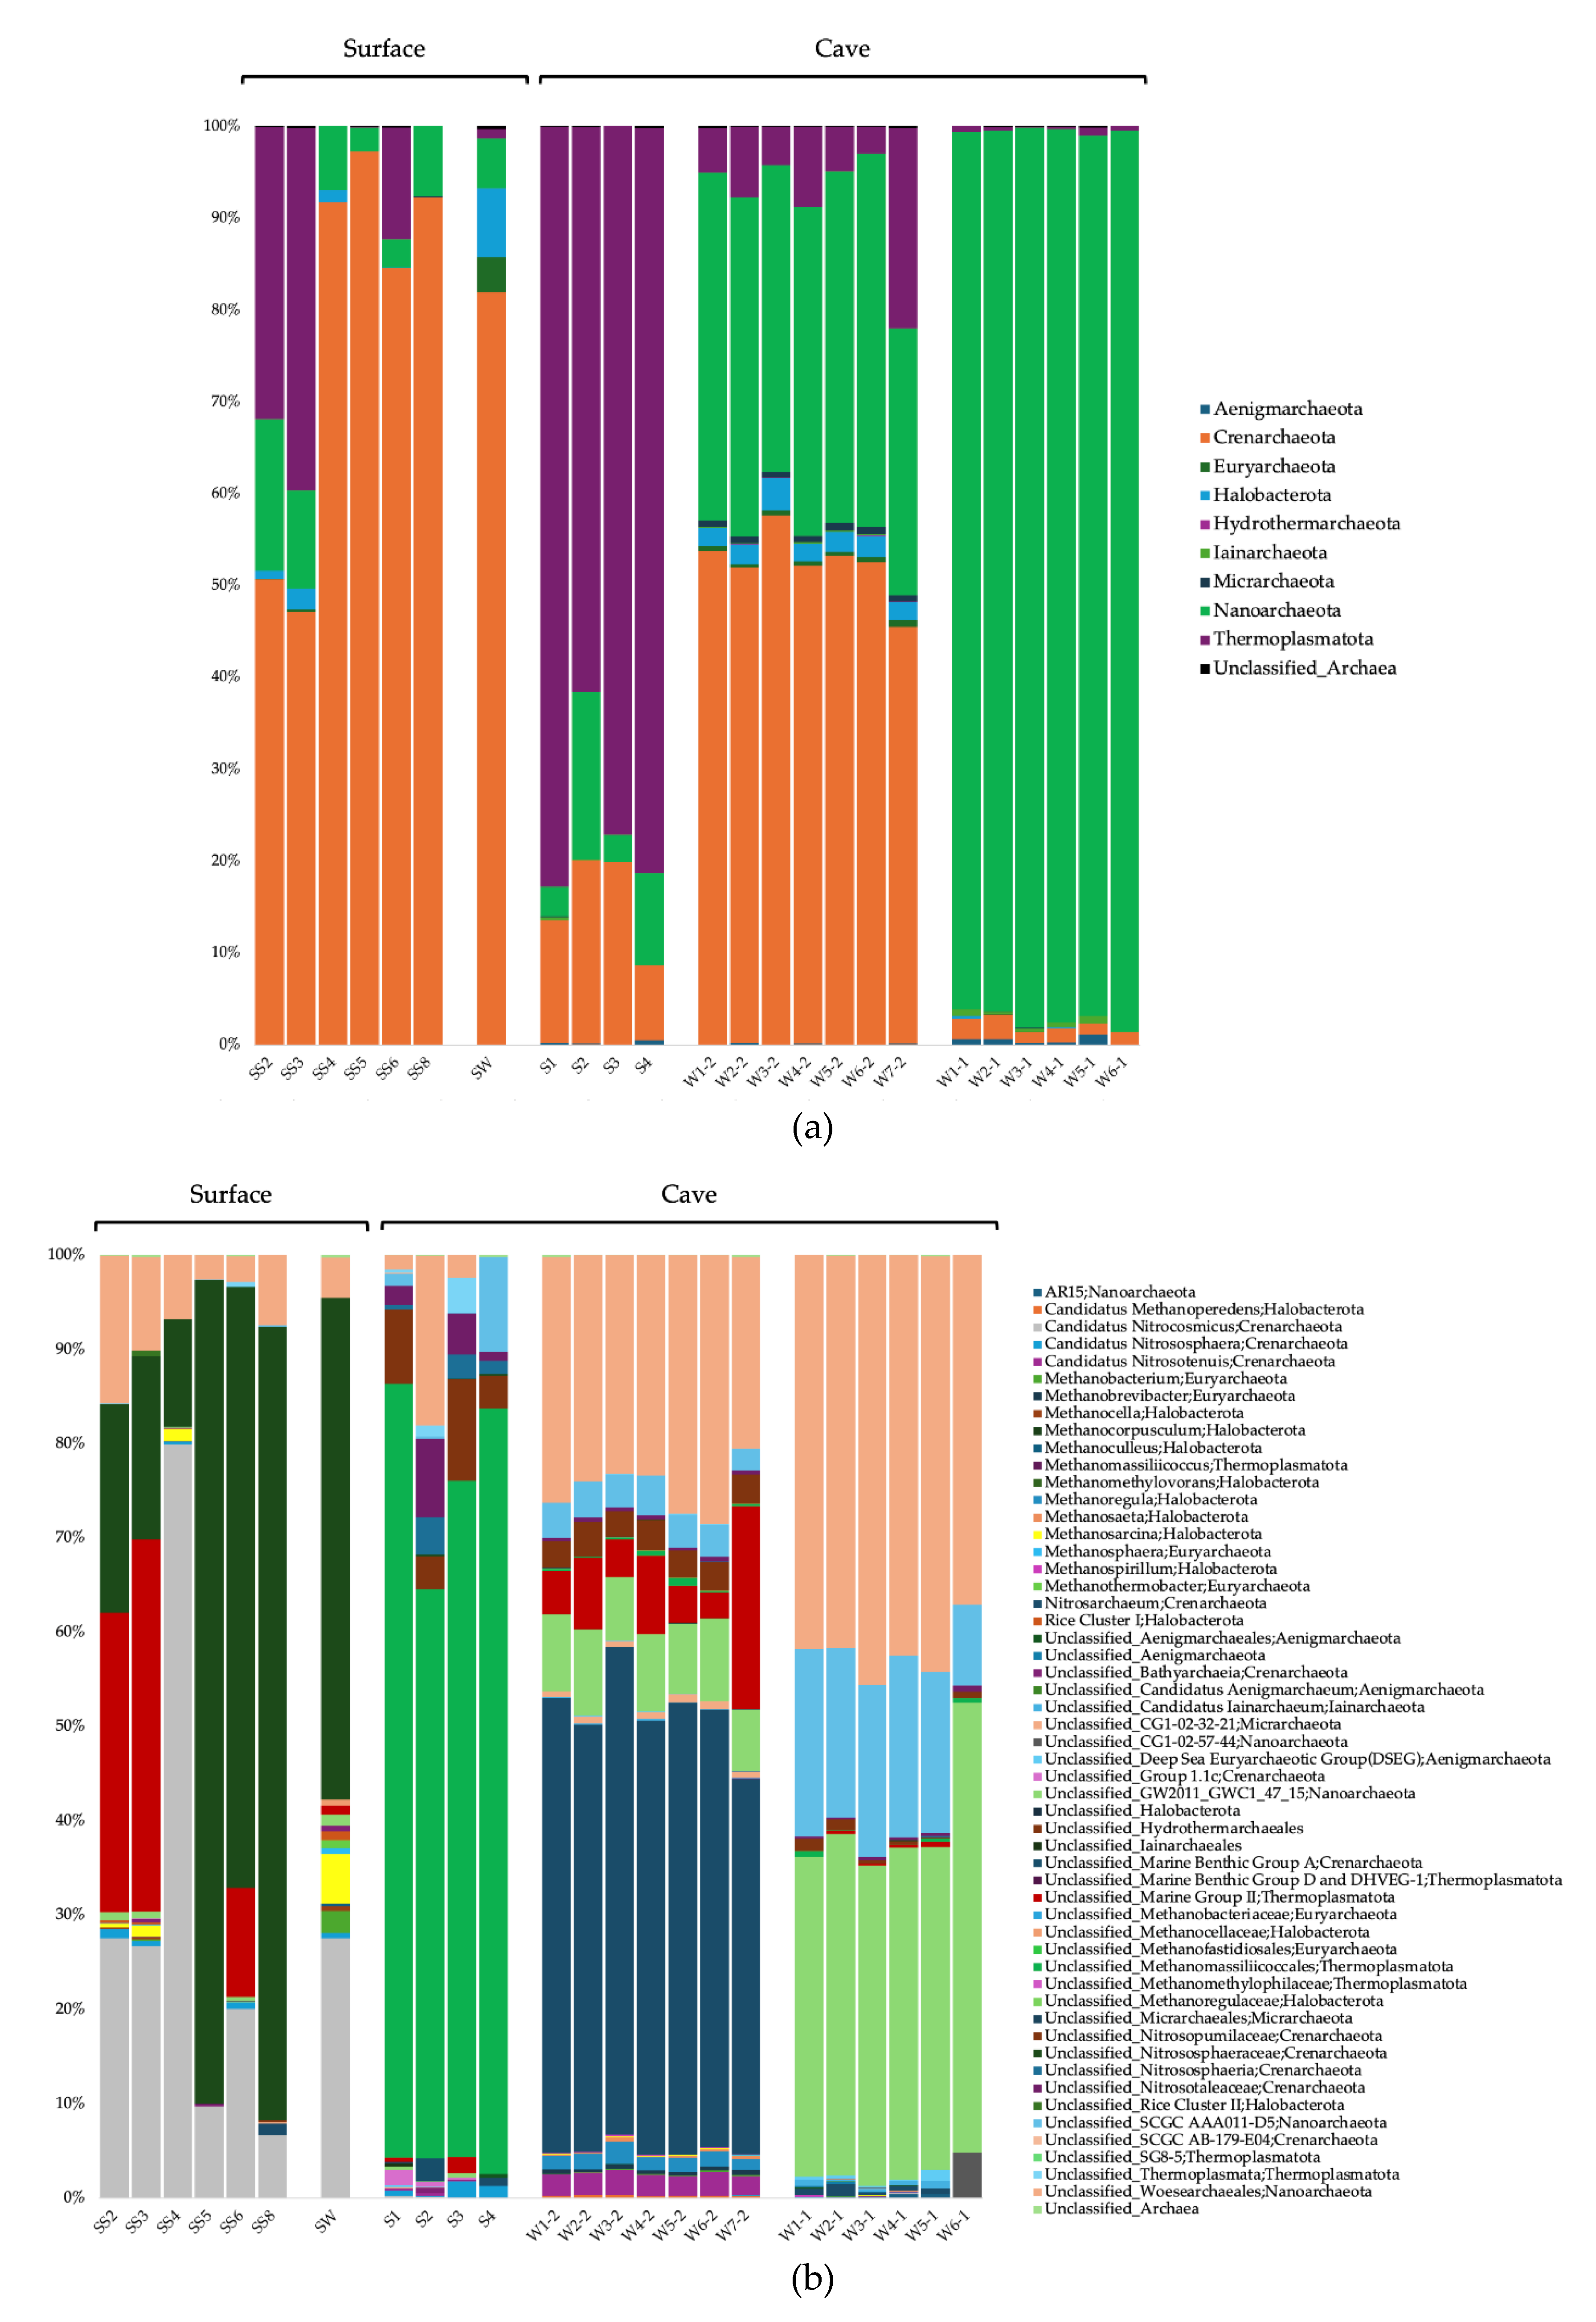
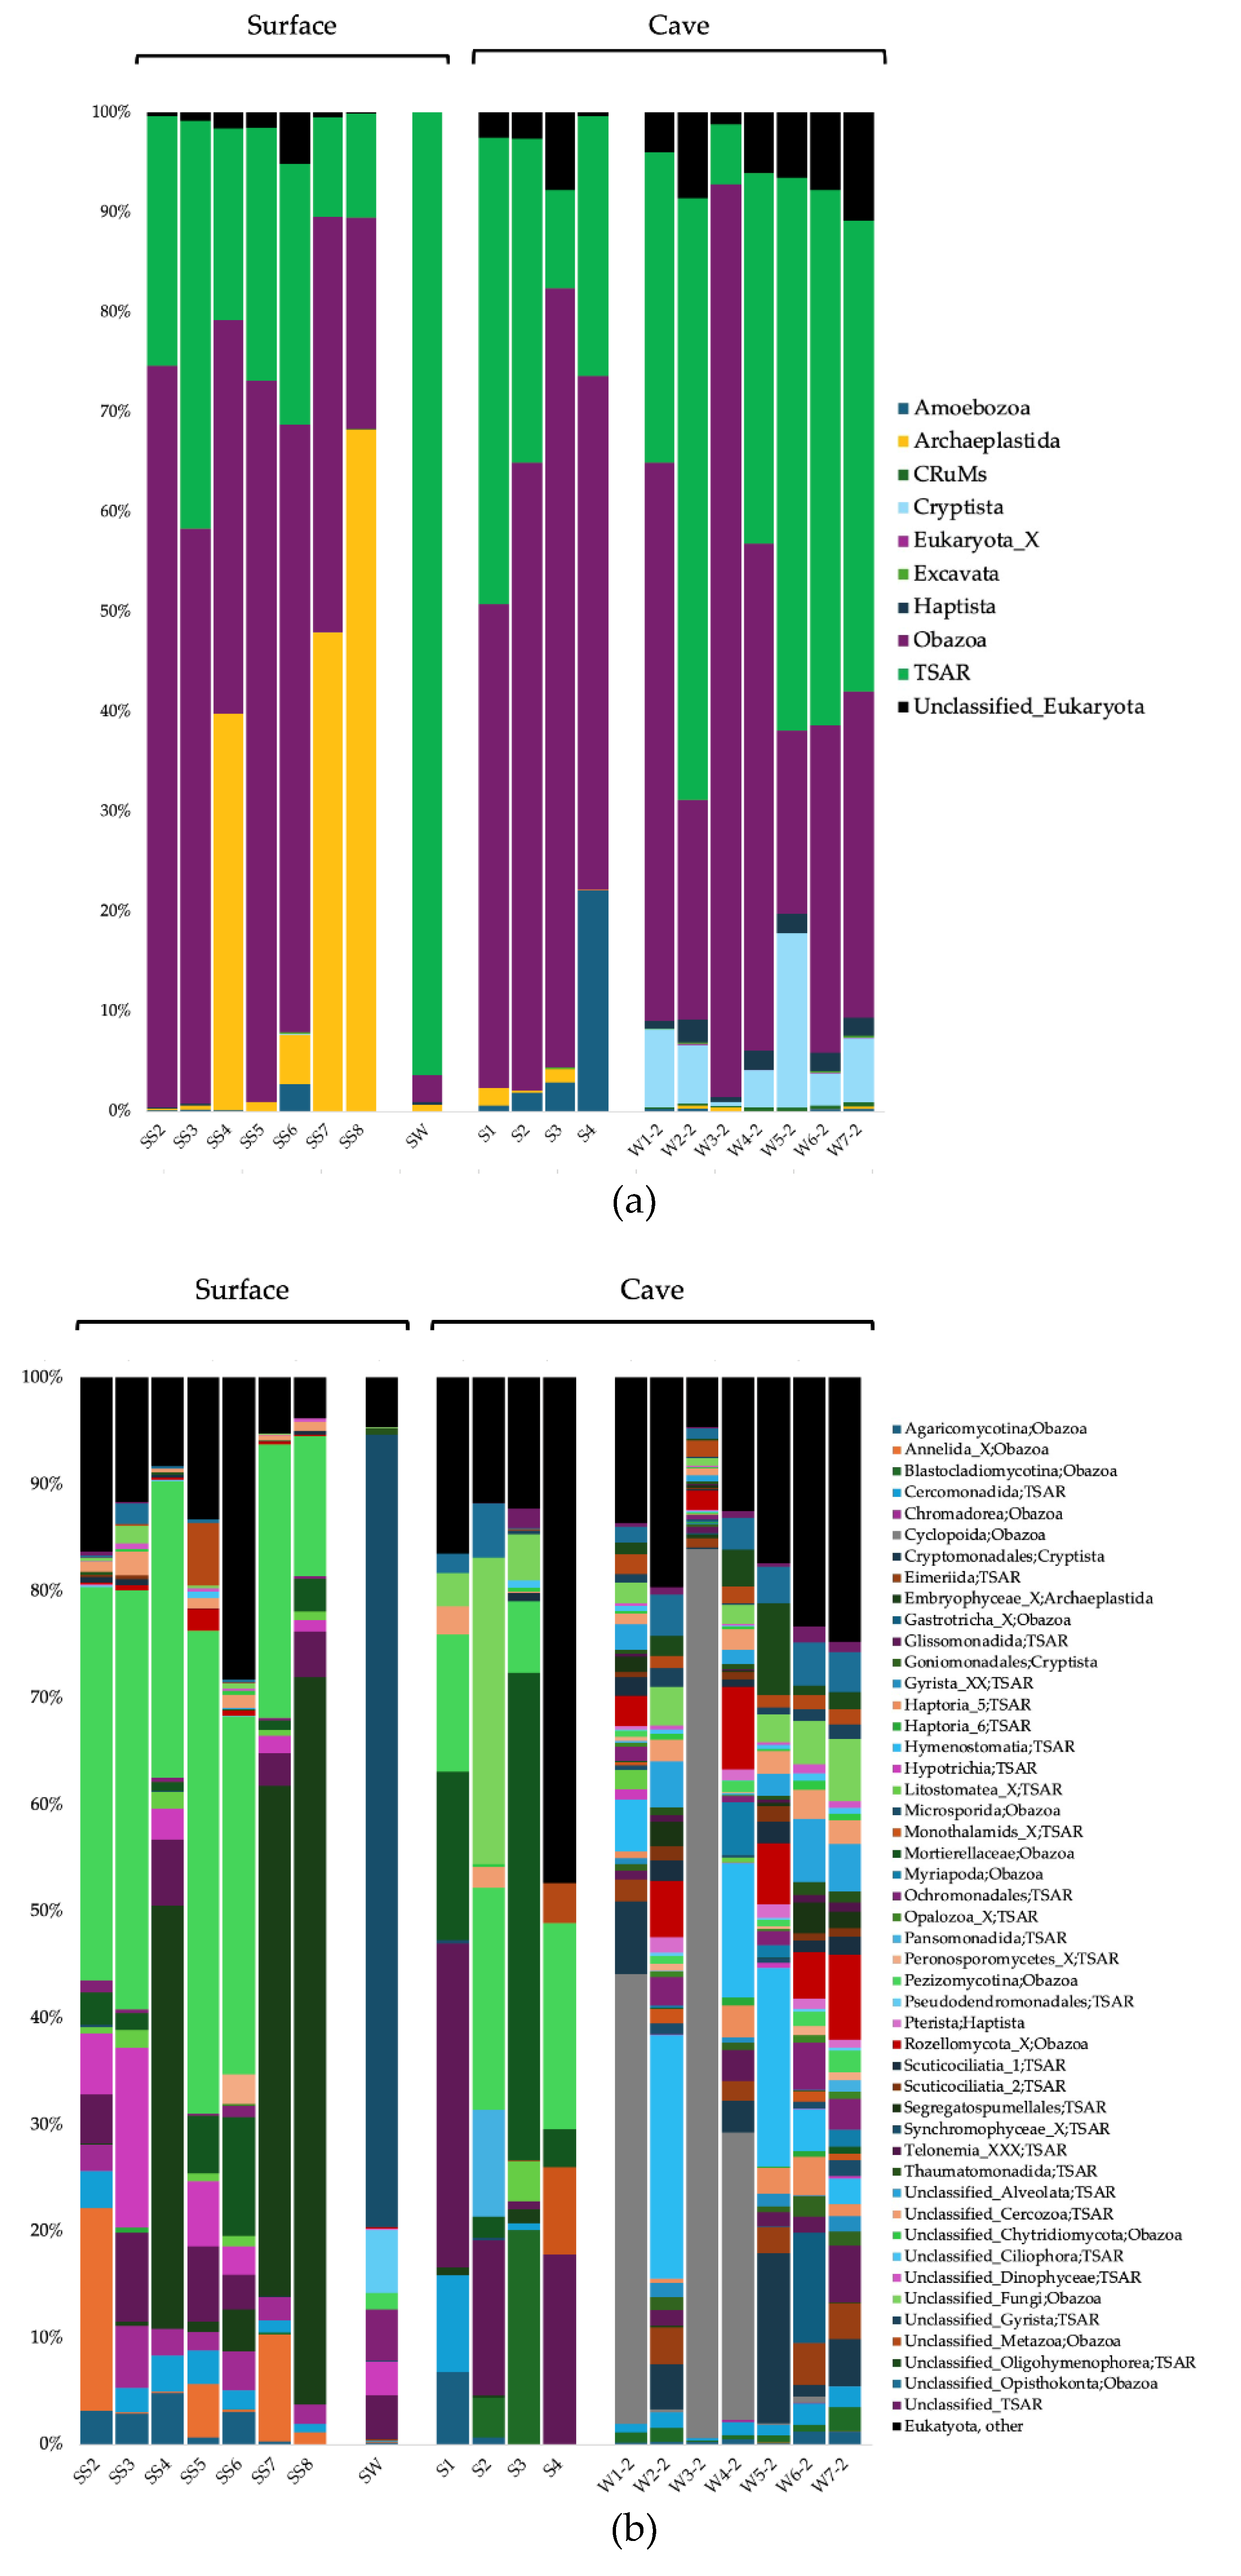
The surface soils were composed in majority of Actinobacteriota and Proteobacteria for the Bacteria domain, Crenarchaeota, Thermoplasmatota, and Nanoarchaeota for the Archaea domain, and Obazoa, TSAR and Archaeplastida for the Eukaryote domain (Figure 2a, Figure 3a, and Figure 4a). The cave sediments were dominated by Proteobacteria, Actinobacteriota, Gemmatimonadota, and Acidobacteria at the phylum level for the Bacteria. At the genus level, the main bacterial taxa were Rhodoferax, Nitrospira, unclassified (unc.) TRA3-20, unc. Burkhloderiales, unc. wb1-P19, and unc. Gemmatimonadaceae (Figure 2b). The Archaea were dominated by the Thermoplasmatota and Crenarchaeota at the phylum level, and unc. Methanomassiliicoccales, unc. Nitrosopumilaceae, unc. Nitrosotaleaceae, unc. Nitrososphaeria, and SCGC AAA011-D5 Nanoarchaeia at the genus level (Figure 3b). The Eukaryote were dominated by the Obazoa and TSAR at the phylum level, and Glissomonadida, unc. Mortierellaceae, Pezizomycotina, unc. Fungi, Pansomonadida, Blastocladiomycotina, Chelicerata, and Lobosa at the sub-phylum level (Figure 4b).
The 0.2 µm cave water was composed in majority of Proteobacteria, Bacteroidota, and Actinobacteriota at the phylum level for the Bacteria. At the genus level, the main bacterial taxa were Limnohabitans, Prevotella_9, Nitrospira, Methylotenera, and hgcI clade. The Archaea were dominated by the Crenarchaeota and Nanoarchaeota at the phyum level, and Nitrosarchaeum, unc. Woesearchaeales, GW2011_GWC1_47_15 Nanoarchaeota, and unc. Marine Group II Thermoplasmata at the genus level. The Eukaryote were dominated by the Obazoa, TSAR, and Cryptista at the phylum level, and Cyclopoida, Cryptomonadales, Hymenostomatia, Rozellomycota, Gastrotricha, and Glissomonadida at the sub-phylum level.
The 0.1 µm cave water was composed in majority of Patescibacteria, Proteobacteria, and Bdellovibrionota at the phylum level for the Bacteria. At the genus level, the main bacterial taxa were unc. Saccharimonadales, 0319-6G20 Oligoflexia, Silvanigrella, Shewanella, and Bdellovibrio. The Archaea were dominated by the Nanoarchaeota at the phylum level, and unc. Woesearchaeales, GW2011_GWC1_47_15 Nanoarchaeota, and SCGC AAA011-D5 Nanoarchaeia at the genus level.

3.4. Beta-Diversity

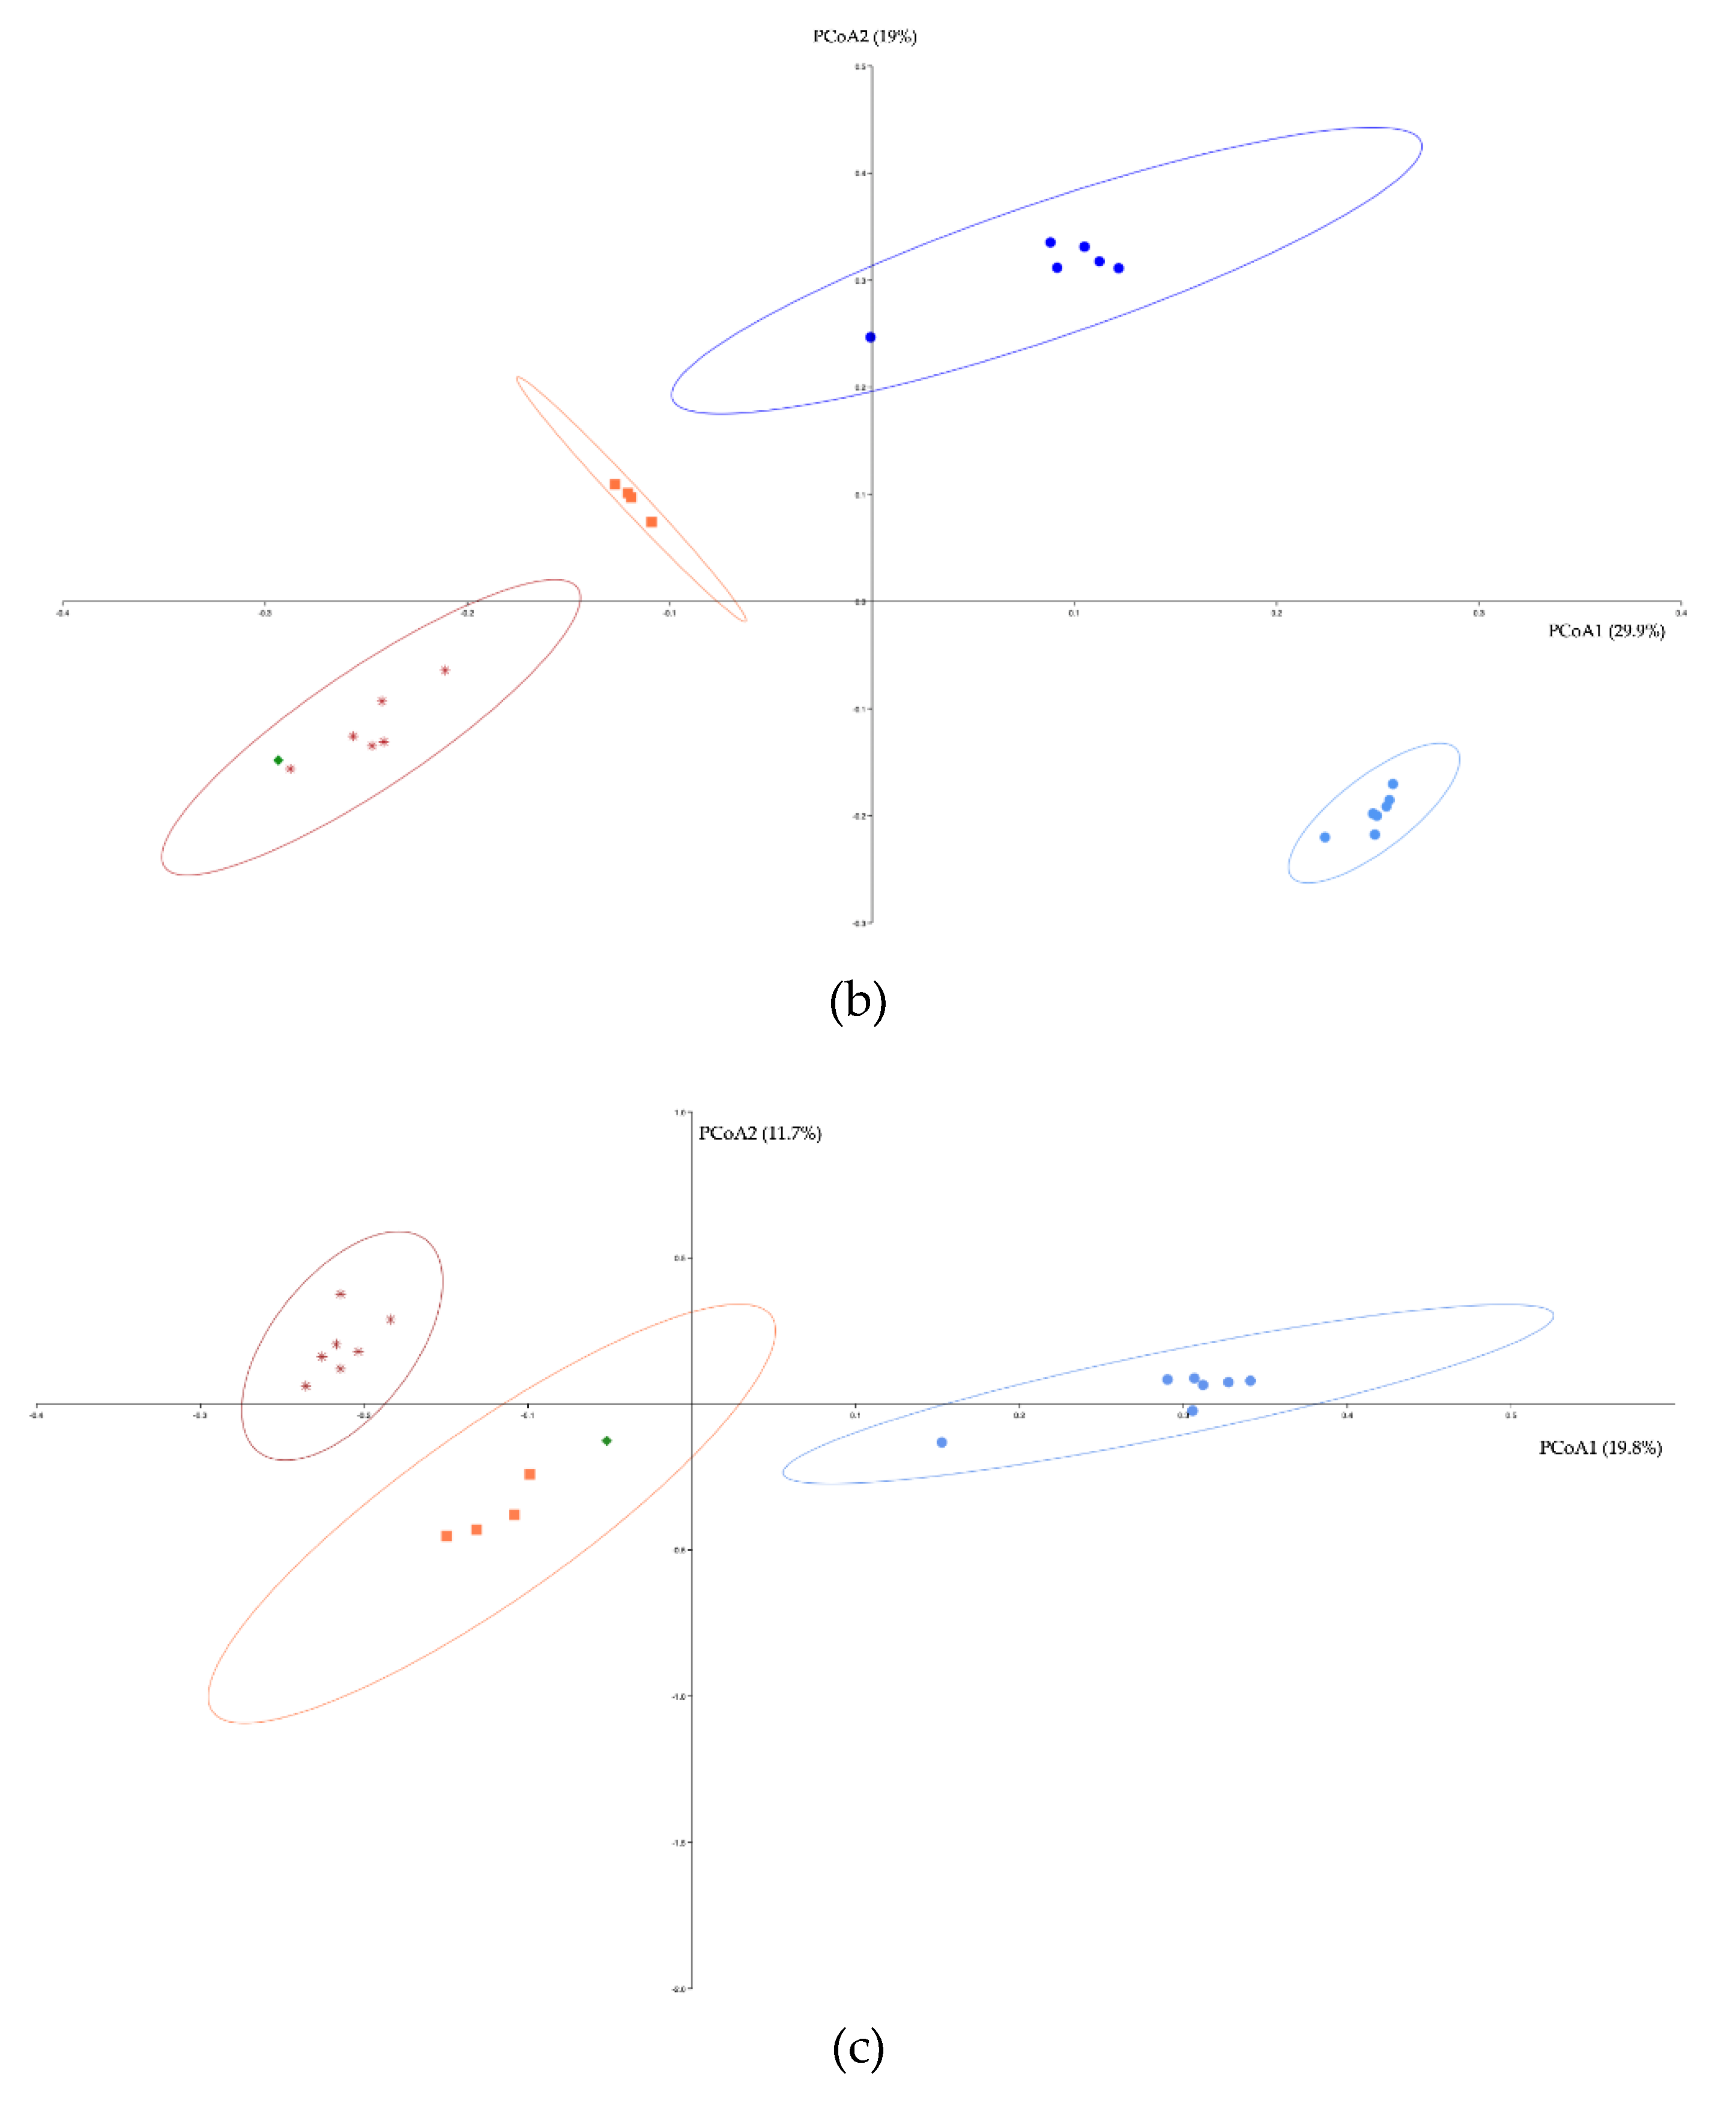
Ordinations of bacterial, archaeal and eukaryotes communities showed clusters of samples based on habitat type (surface soils, surface water, cave sediments, cave water 0.2 and 0.1 µm) (Figure 5a, 5b, and 5c). For the Bacteria, the cave sediment samples clustered closer to the surface soils and water samples than the cave water samples. The cave 0.2 µm water samples were the most dissimilar compared to the other sample clusters. For the Archaea, the cave 0.2 µm water samples were also the most dissimilar compared to the other sample clusters. For the Eukaryote, all three sample groups (surface sediments, cave sediment and 0.2 µm water) were all clustered distinctively.
PERMANOVA analysis effectively confirmed the compositional difference in the communities of Bacteria, Archaea, and Eukaryotes between the three habitat types (Supplemental Material Table S4). Habitat type explained 51.3% of the community variance for the Bacteria, 63.3% for the Archaea, and 39.4% for the Eukaryotes. Amova analyses comparing each habitat communities 1 to 1 confirmed that all communities were significantly different between each other, for each domain (Supplemental Material Tables S5, S6, and S7). Homova analyses comparing the cave 0.2 and 0.1 µm water communities showed that, for the Bacteria, the 0.1 µm community had a significantly larger amount of variation compared to the 0.2 µm community (Supplemental Material Table S8). The same was observed for the Archaea.

3.5. Beta-Diversity and Correlation with Environmental Parameters

The surface soils and sediments were analyzed separately from the water since the measured environmental variables (pH, Ctot, Corg, Cinorg, Ntot, and δ13C) were different from those measured in the cave water samples (DIC, DOC, NHx, NO3-). The 0.2 µm water community was analyzed separately from the 0.1 µm since the measured values were the same for both communities belonging to the same sample.
The surface soil and cave sediments were significantly correlated with pH and total nitrogen for the Bacteria domain (Table 3) explaining 2.1 and 6% of the community variance, and with pH for the Archaea and Eukaryotes explaining 4.5 and 3.9% of the community variance. The 0.2 µm water community was significantly correlated with DOC for the Bacteria explaining 3.4% of the community variance, DIC and NO3- for the Archaea explaining 8.2 and 7.3% of the community variance, and there was no significant correlation for the Eukaryotes, nor any domain for the 0.1 µm communities. For the Bacteria, the db-RDA graph showed that the surface soils were correlated with a higher total nitrogen content, while a higher pH was associated with the cave sediments (Supplemental Material Figure S4a). The graphs for the Archaea and Eukaryotes also showed that the cave sediments were correlated with a higher pH (Supplemental Material Figures S4b and S4c).

3.6. Discriminative Microbial Taxa between Sample Groups

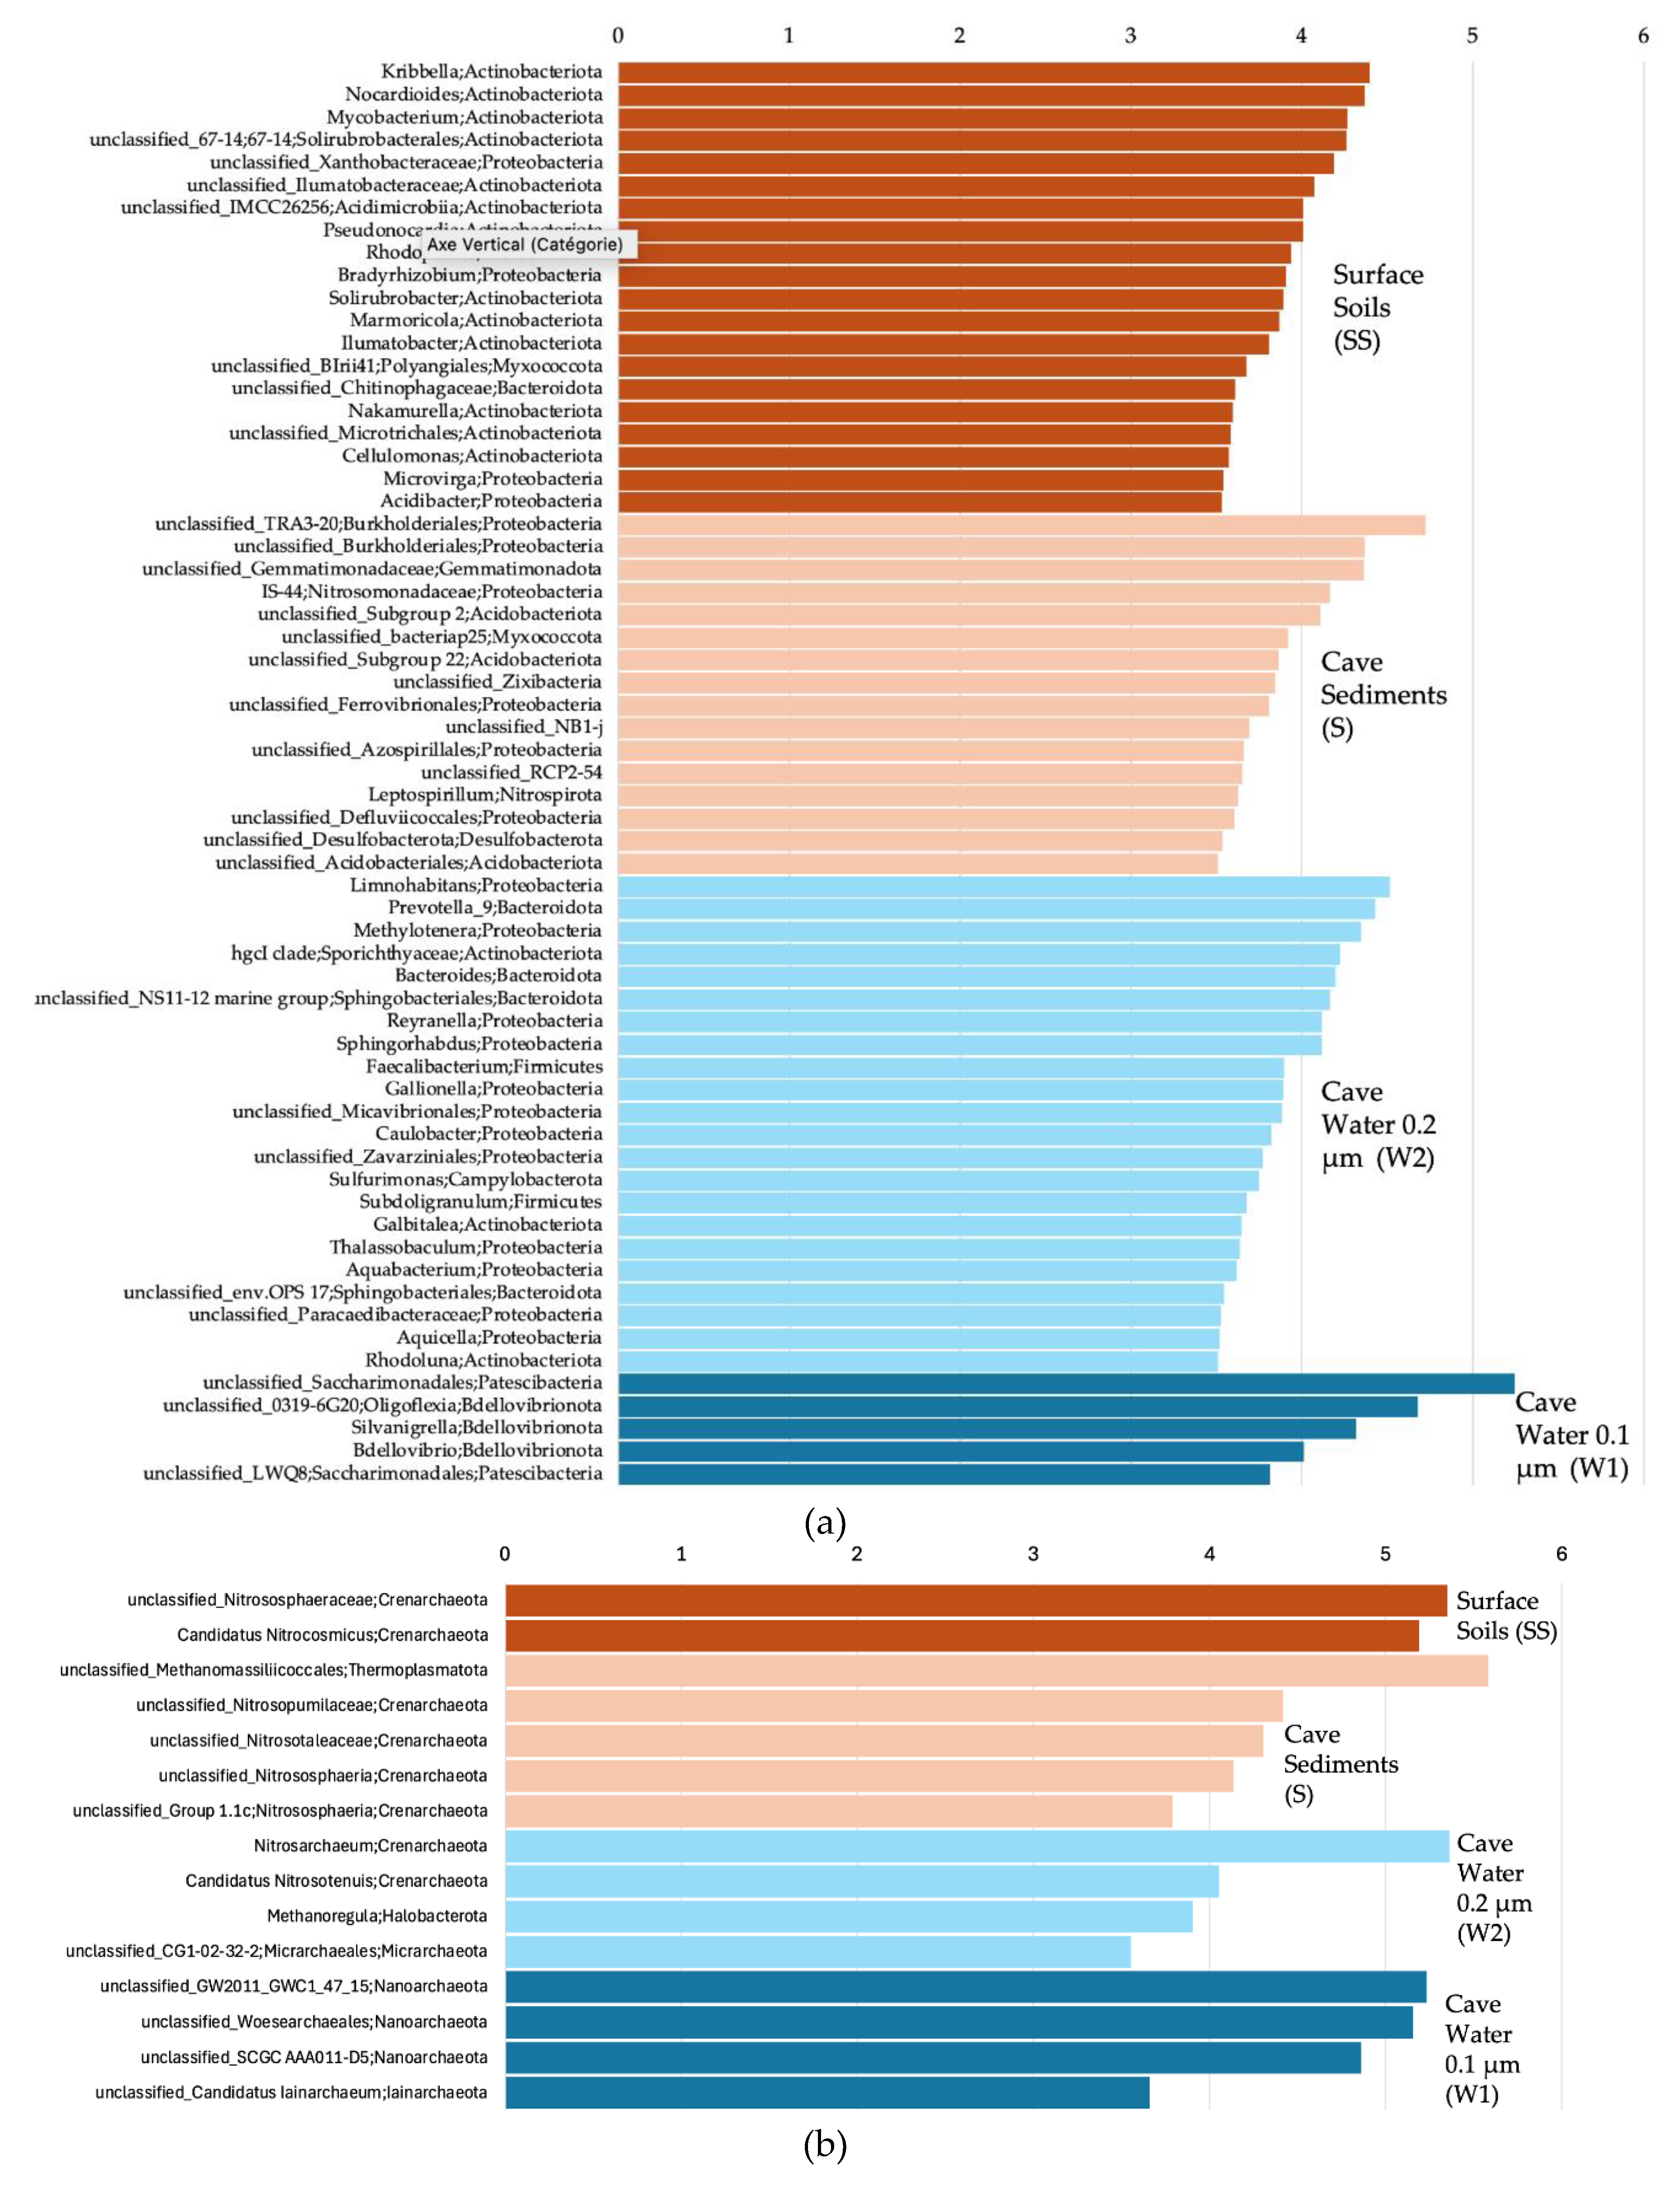
For the Bacteria, at the genus level, when comparing all 4 sample groups (surface soils, cave sediments, and cave water 0.2 and 0.1 µm) together, we observed using a LEfSe analysis that Kribbella, Nocardioides, Mycobacterium, 67-14 Solirubrobacterales, and unc. Xanthobacteraceae were among the genera that were significantly more prevalent in the surface soils (Figure 6a). TRA3-20 Burkholderiales, unc. Burkholderiales, unc. Gemmatimonadaceae, IS-44 Nitrosomonadaceae, and Subgroup 2 Acidobacteriae were significantly associated with cave sediments. Limnohabitans, Prevotella 9, Methylotenera, hgcI clade Sporichthyaceae, and Bacteroides were significantly associated with 0.2 µm cave water. Unc. Saccharimonadales, 0319-6G20 Oligoflexia, Silvanigrella, Bdellovibrio, and LWQ8 Saccharimonadales were significantly associated with 0.1 µm cave water.
For the Archaea, unc. Nitrososphaeraceae and cand. Nitrosocosmicus were significantly more prevalent in the surface soils (Figure 6b). Unc. Methanomassiliicoccales, unc. Nitrosopumilaceae, unc. Nitrosotaleaceae, unc. Nitrososphaeria, and Group 1.1c Nitrososphaeria were significantly associated with cave sediments. Nitrosarchaeum, cand. Nitrosotenuis, Methanoregula, and CG1-02-32-21 Micrarchaeales were significantly associated with 0.2 µm cave water. GW2011_GWC1_47_15 Nanoarchaeota, unc. Woesearchaeales, SCGC AAA011-D5 Nanoarchaeota, and cand. Iainarchaeum were significantly associated with 0.1 µm cave water.
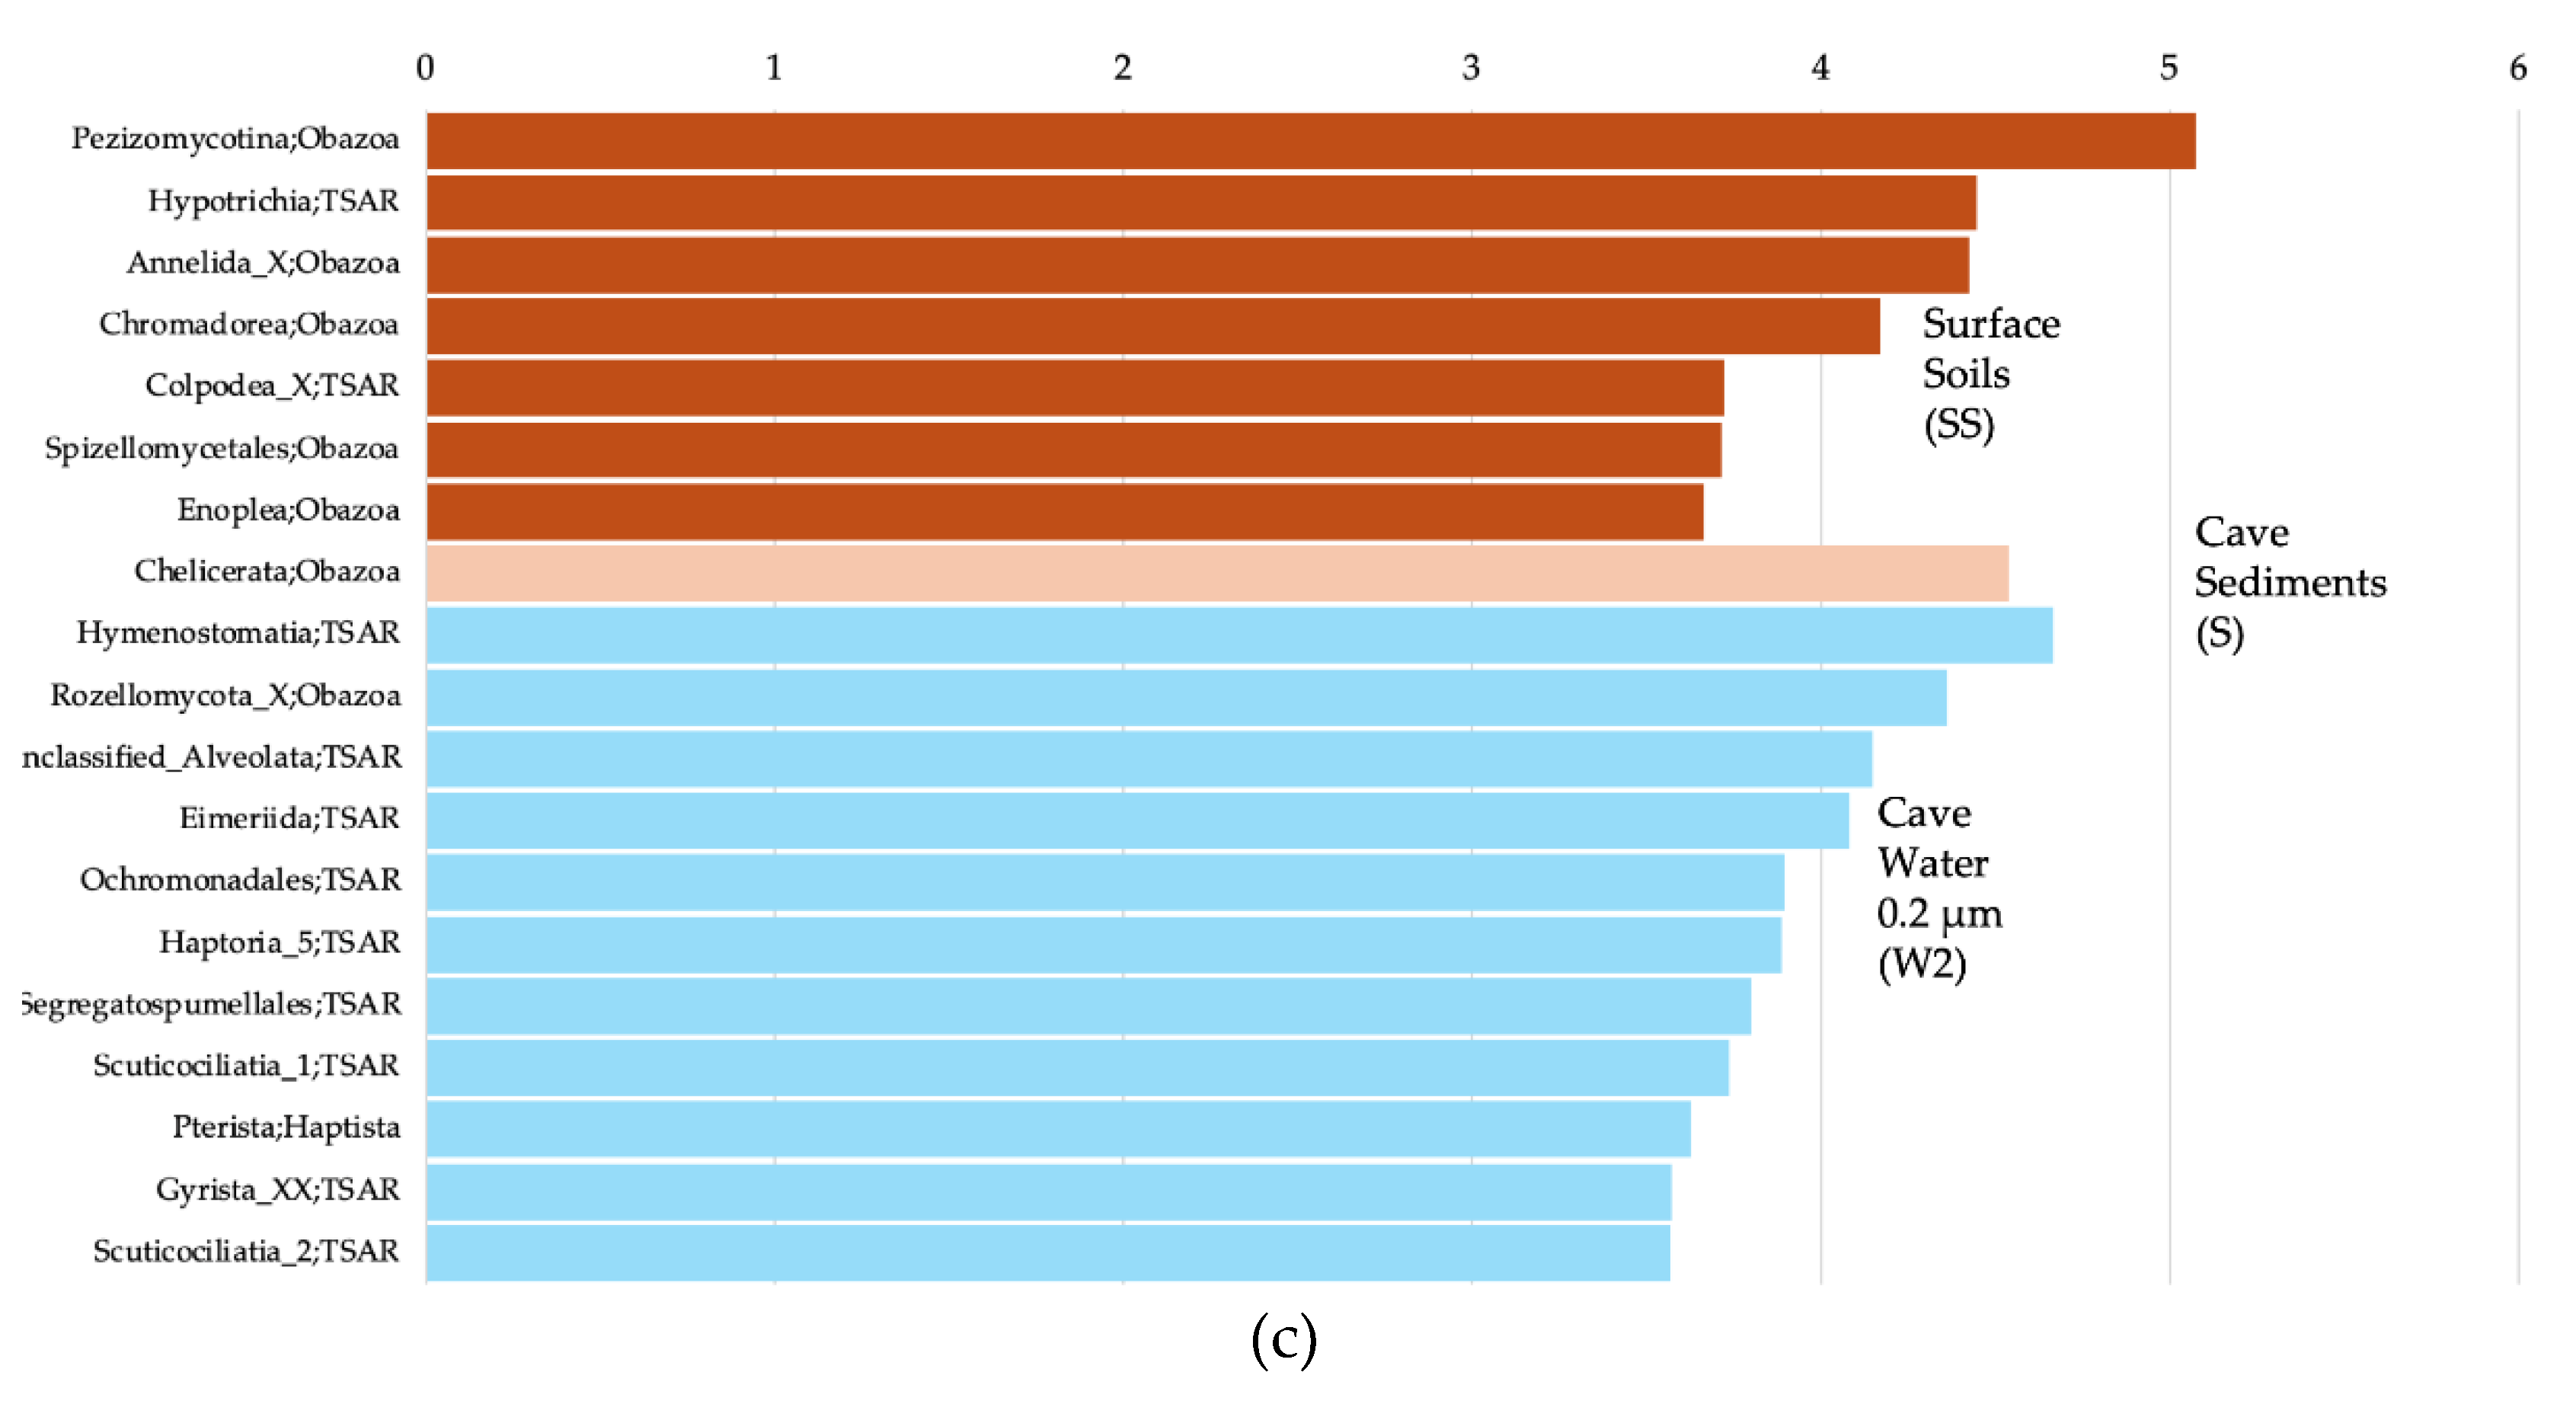
For the Eukaryotes, Pezizomycotina, Hypotrichia, Annelida, Chromadorea, and Colpodea were among the significantly more prevalent groups in the surface soils (Figure 6c). Chelicerata was significantly associated with cave sediments. Hymenostomatia, Rozellomycota, unc. Alveolata, Eimeriida, and Ochromonadales were significantly associated with 0.2 µm cave water.

3.7. Microbial Source Tracking

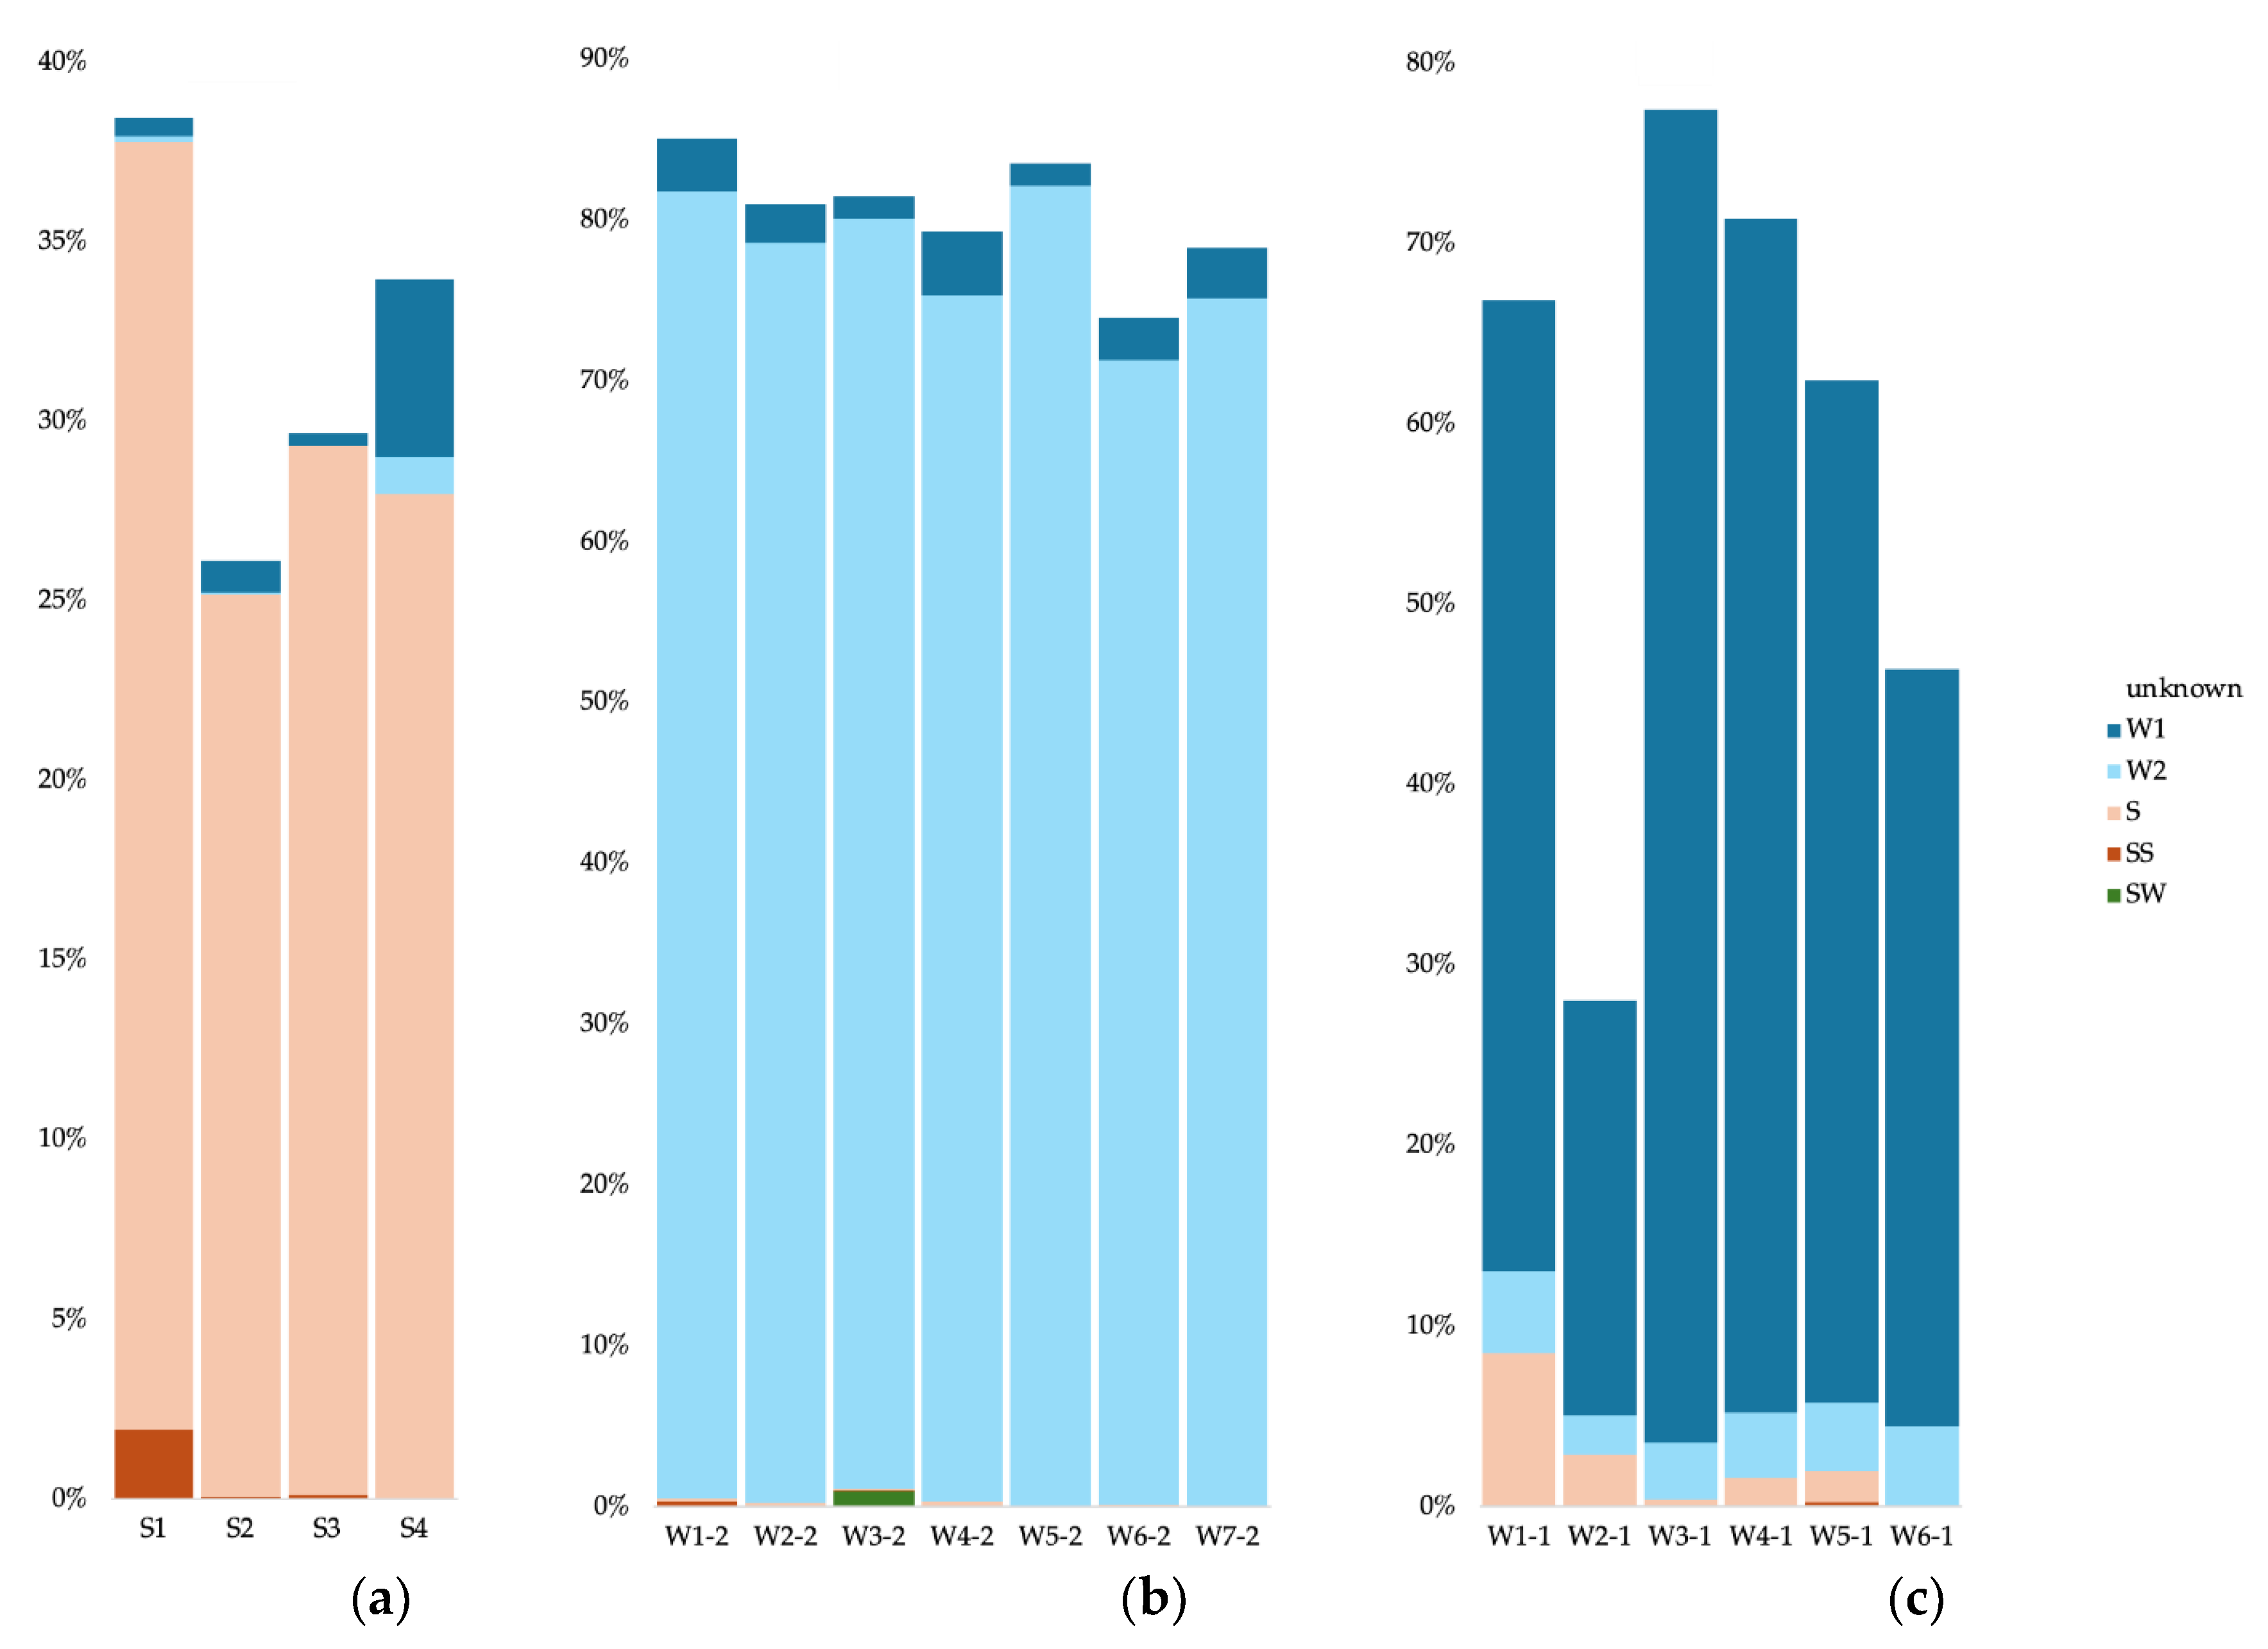
For the cave sediment communities, we used as potential source communities all surface soil samples, the surface water, the other sediment samples, and all cave water samples (0.2 and 0.1 µm). For the cave water 0.2 µm communities, we used as potential sources communities from all surface soil samples, the surface water, all cave sediment samples, and all cave water samples apart from the analyzed sample. We did the same for the 0.1 µm communities. To simplify data visualization and analysis, we merged as single sources all surface soil samples, all sediment samples, all 0.2 µm water samples, and all 0.1 µm water samples. For the Bacteria in cave sediments, most of the community originated from the other sediment communities (between 25 and 35%) (Figure 7a). For the S1 sample (Radiesthesia gallery), 1.9% also stemmed from the surface soils. Apart from the S4 sample, the water samples contributed less than 1% of the sediment communities. The source of the cave water 0.2 µm communities was in majority other 0.2 µm communities (more than 75%), and some from the 0.1 µm communities (between 1.4 and 4%) (Figure 7b). The W3 sample had a low contribution from the surface water (0.96%). The source of the cave water 0.1 µm communities was in majority other 0.1 µm communities (between 23 and 73%) (Figure 7c). Apart from sample W6, the sediment communities also contributed (between 0.36 and 8.4%), as well as the 0.2 µm communities (between 2.1 and 4.5%).
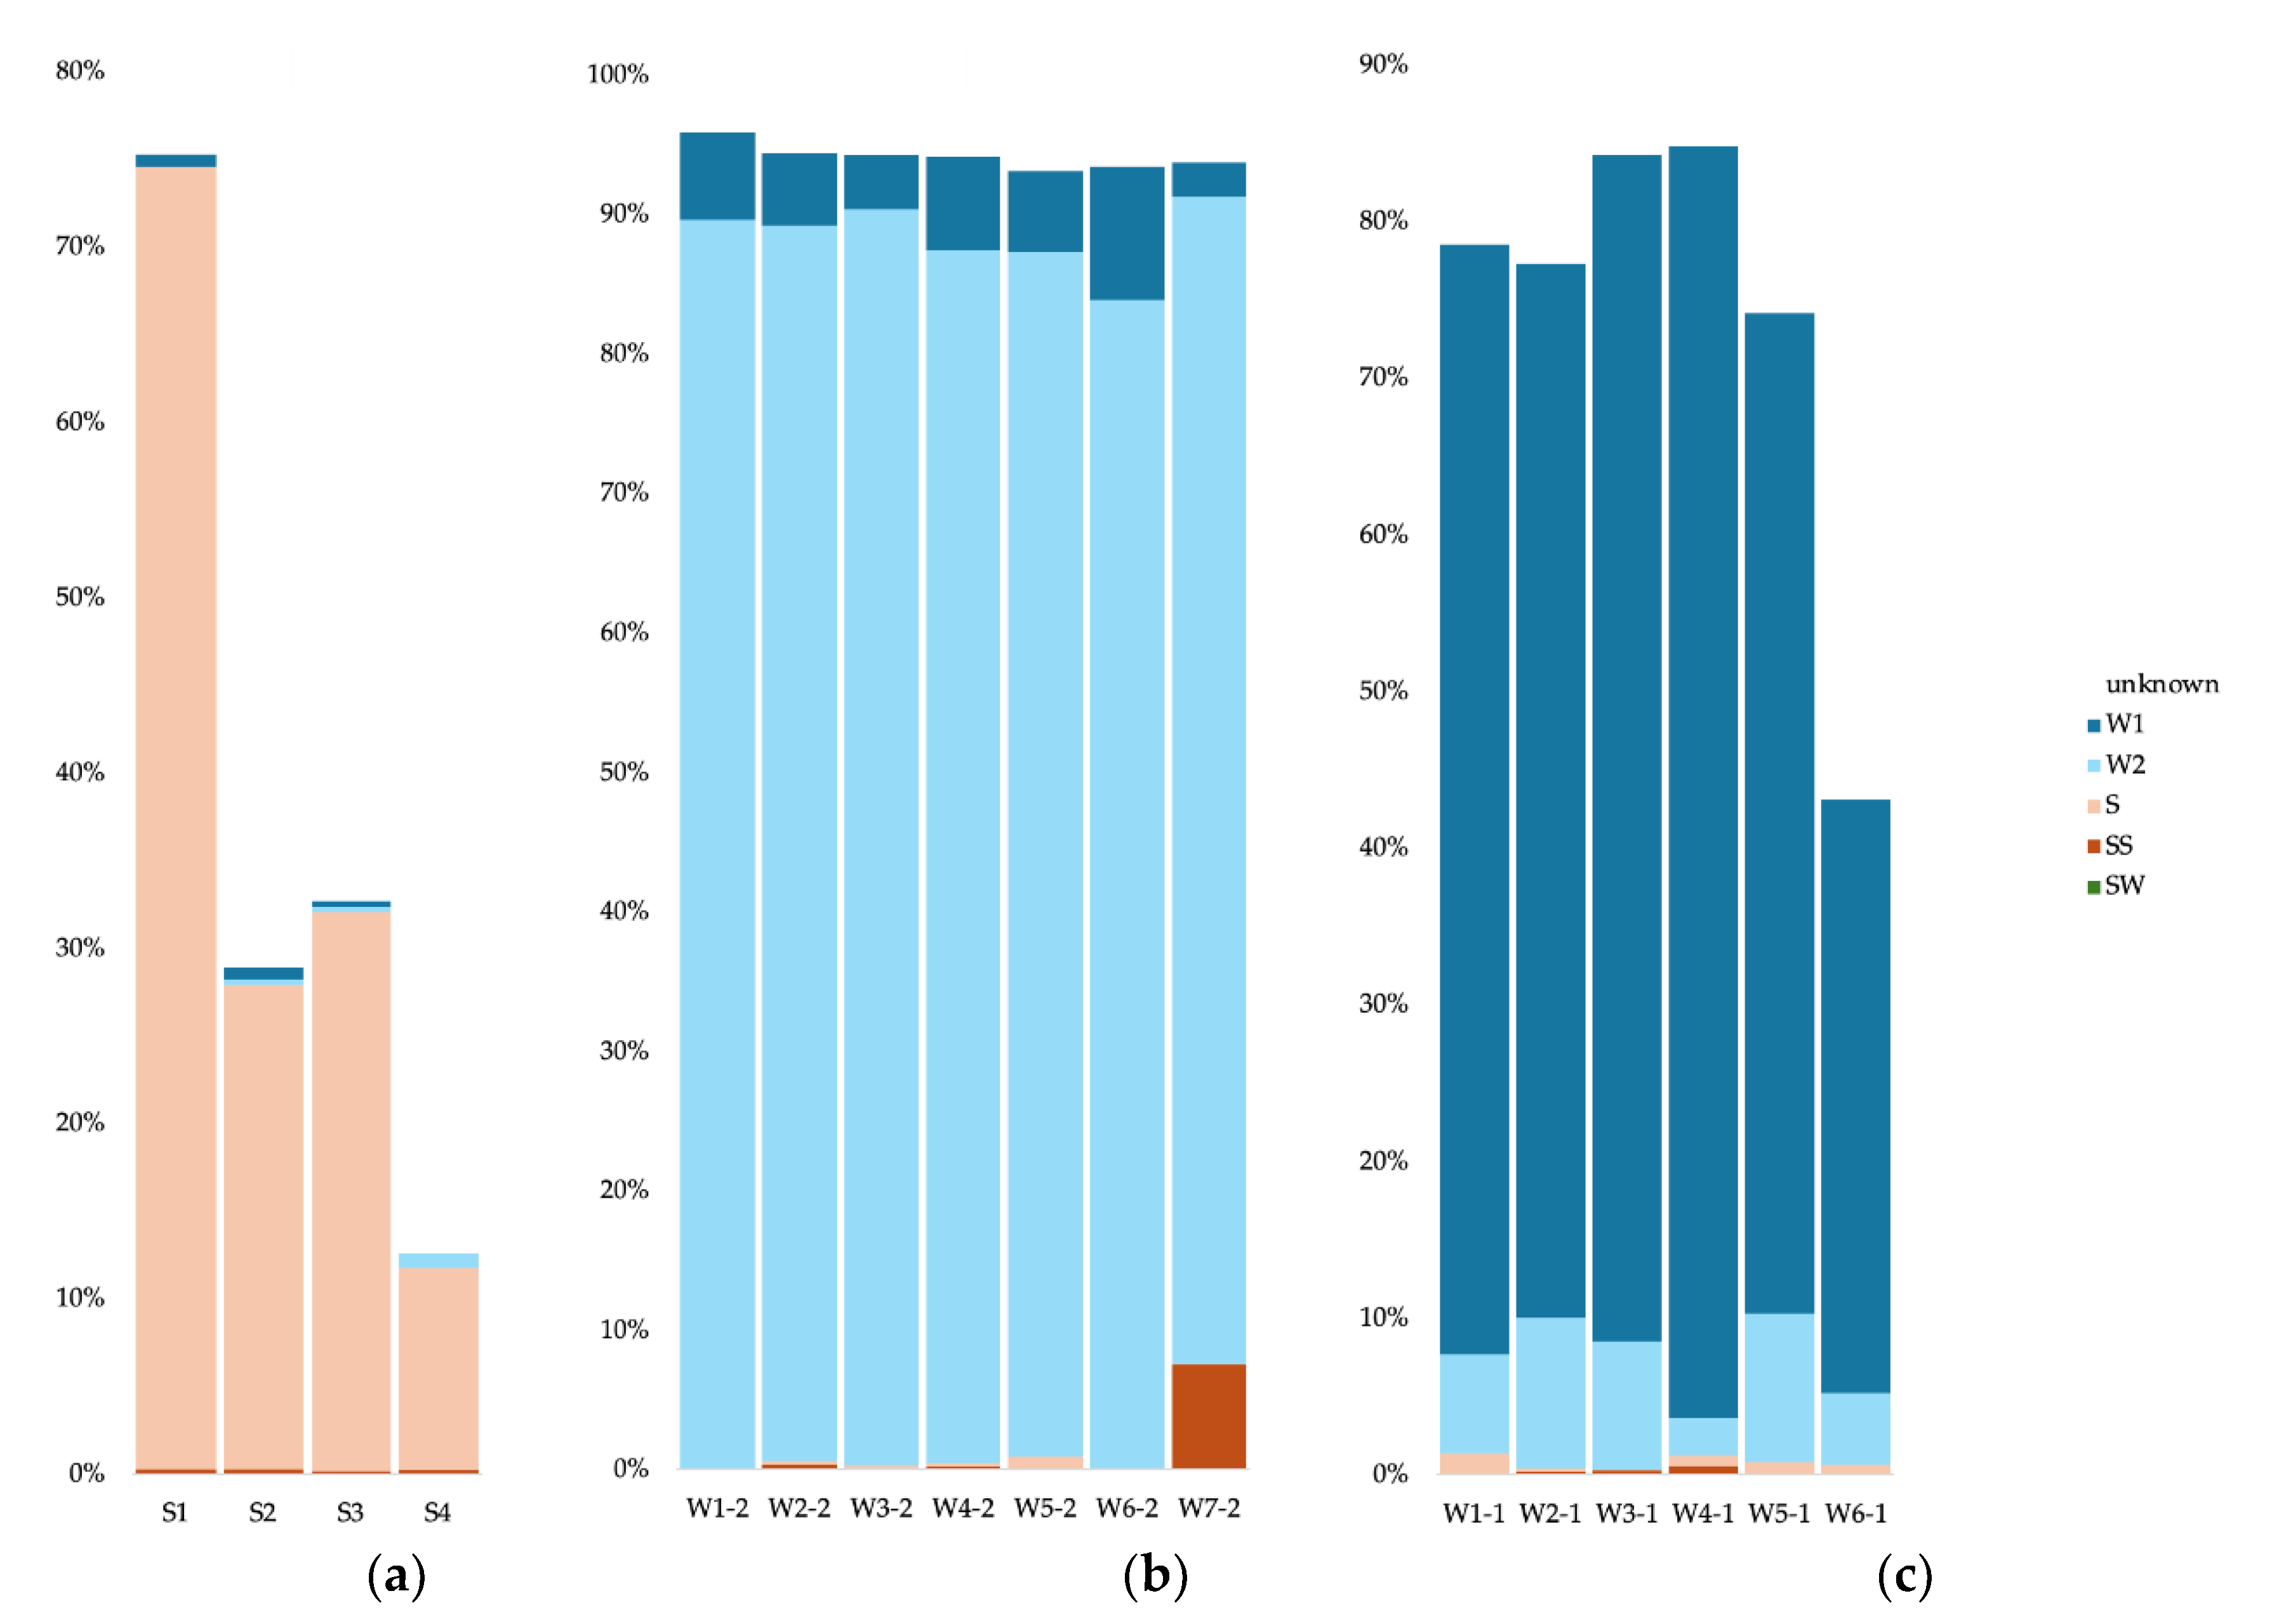
For the Archaea in cave sediments, most of the community originated from the other sediment communities (between 11 and 74%) (Figure 8a). The water samples contributed less than 1% of the sediment communities. The source of the cave water 0.2 µm communities was in majority other 0.2 µm communities (more than 83%), and some from the 0.1 µm communities (between 2.5 and 9.5%) (Figure 8b). The W7 sample had contribution from the surface soils (7.49%). The source of the cave water 0.1 µm communities was in majority other 0.1 µm communities (between 38 and 81%) (Figure 8c). The sediment communities also contributed (less than 1%), as well as the 0.2 µm communities (between 2.4 and 9.7%).
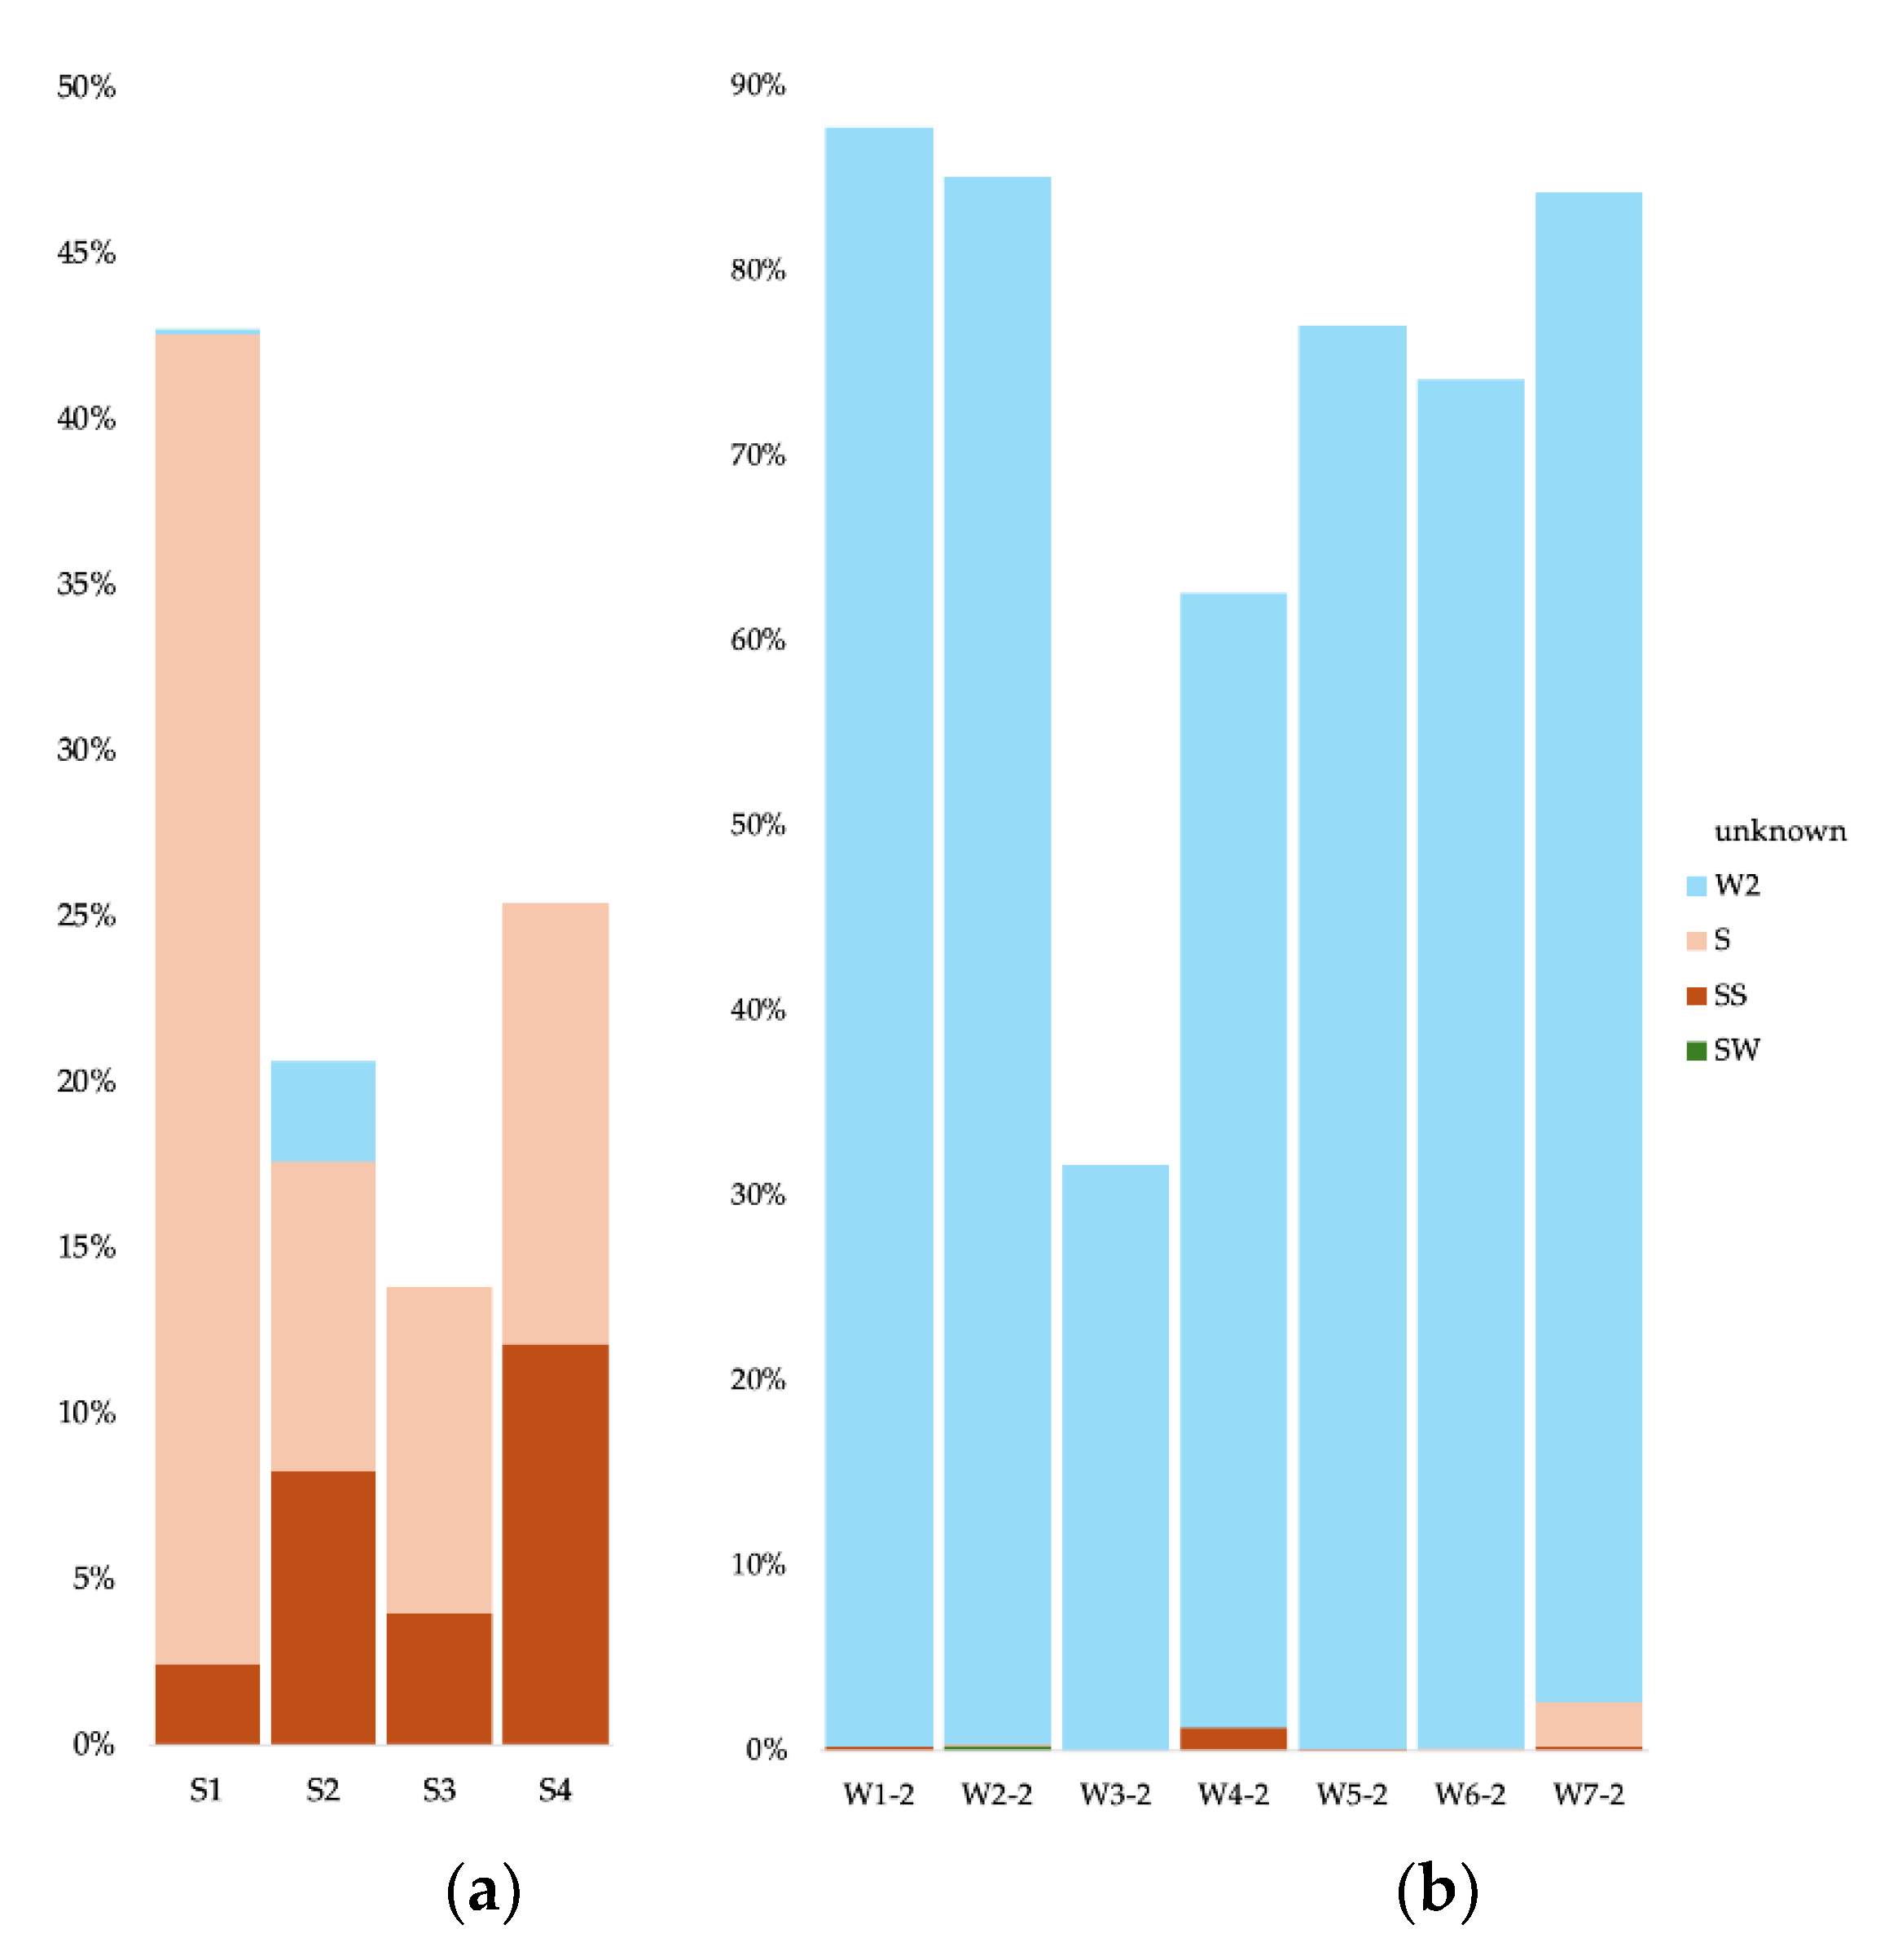
For the Eukaryote in cave sediments, part of the community originated from the other sediment communities (between 9.3 and 41?1%) (Figure 9a). Between 2.4 and 12.1% of the sediment communities stemmed from the surface soils communities. The source of the cave water 0.2 µm communities was in majority other 0.2 µm communities (between 31.7 and 87.6%) (Figure 9b).

4. Discussion

4.1. Environmental Properties and Geochemical Connectivity of the Saint-Leonard Cave

Like in most documented caves, the Saint-Leonard groundwater can be classified as oligotrophic based on its measured mean DOC value of 1.6 mg/L [85]. This value is just under the Canadian mean DOC value for wells (1.8 mg/L) [86] and below global mean DOC values for groundwater (3.8 mg/L) [87]. However, DIC concentration (46 mg/L) was slightly higher than the global average for groundwater (30-43 mg/L) [88]. Furthermore, based on the mean value of total inorganic nitrogen content in the water (2.44 mg/L), Saint-Leonard cave’s groundwater could be considered eutrophic [89] or hypereutrophic [90]. The high concentration of nitrate could be explained by the urban setting of Saint-Leonard cave, combined with its low depth. This phenomenon has indeed been observed in three urban caves in the cities of Częstochowa and Kraków in Poland [91].
However, trophic classifications based on nitrogen availability for photosynthetic primary producers in lake ecosystems are not suitable for underground aquatic environments, devoid of any light source. The high concentrations of DIC could potentially sustain chemosynthesis-based autotrophy. Although chemoautotroph-driven communities have been found in a few caves [92,93,94,95], subterranean microbial communities are often dominated by heterotrophs that rely on the supply of allochthonous sources of carbon imported by percolating water [31,36,38,85,96].
The DOC found in the Saint-Leonard cave’s groundwater most probably traces its origins to the surface soils. Indeed, the δ13C measures for both the surface soils and the cave sediments displayed similar values suggesting that the carbon found in the cave sediments originates from the surface soils. The δ13C range (between -27.9 and -24.4 ‰) matches that of C3 plants [97], which are found in temperate soil regions such as the Quebec province in Canada. The δ15N measures in surface soils (0.5 to 4 ‰) showed typical values associated with C3 plants [98]. The higher δ15N values for cave sediments (3.8 to 7 ‰) could potentially be attributed to the leaching of fertilizers or to a wastewater discharge [99], a hypothesis that would be supported by the high nitrate concentration in the groundwater. Overall, these results demonstrate that the above and belowground are geochemically connected.

4.2. Potential Biological Links between Surface Soils and the Cave Sediments and Water

Microbial source tracking indicated that the surface soil eukaryotes communities contributed in a small capacity to the cave sediment communities. Apart from one sediment bacterial community and one 0.2 µm water archaeal community that showed a light contribution from the surface soils, bacterial and archaeal cave communities stemmed very little from the surface communities. Therefore, although there is strong evidence of a direct link between surface and cave water attested by hydrogeological data [60] as well as this study’s isotopic data showing a clear link between surface and cave organic matter, the environmental differences between both habitats are likely too strong to allow most surface communities seeping into the cave to survive [100].
We observed that bacterial community evenness was higher in surface soils than cave sediments and water 0.1 µm, while in eukaryotes communities, richness was higher in water 0.2 µm than surface soils. Our results show that, despite their distinct environmental conditions, the surface soils and the cave’s interior habitat generally differ only little in terms of bacterial and eukaryote alpha-diversity indices. As for the Archaea, both cave water size fractions had Shannon and ASV richness indices significantly higher than in the surface soils. This suggests that Archaea thrive more or are better adapted to the conditions found in the cave’s groundwater than those found in the surface soils.
Our beta diversity analyses revealed that habitat type explained more than half of the community compositional variance for the Bacteria and Archaea, and 1/3 of the variance for the Eukaryotes. Surface soils, cave sediments and groundwater all harbored distinct assemblages, suggesting an important environmental filtering process in the assembly of microbial communities likely related to the differences in abiotic conditions. Results from the db-RDA analyses suggested pH differences between both surface soils and cave sediments were a main driver for their distinct community compositions. Despite their distinctiveness, the taxonomic composition of these two habitats were more similar to each other than to those of groundwater for the Bacteria and Archaea domains, which was to be expected given their overall similar physical characteristics.
The bacterial genera that were more prevalent in the surface soils were typical soil and rhizosphere heterotrophs, notably Kribbella, Nocardioides, and Mycobacterium which all belong to the Actinobacteriota phylum predominant in soil [101]. Most species of those genera are mesophilic with an optimum growth around 30°C and have a pH range from 5-9 often with an optimum at 7 [102,103,104,105,106,107,108].
The Crenarchaeota was by far the most dominant phylum in the surface soils for the Archaea. Their prevalence was expected as those archaea are typically abundant in soils [109,110], although they are also commonly found in caves [42,43] as well as in aquifers [111]. Phylogeny of this archaeal group is in constant evolution, and mesophilic taxa have been reclassified in another phylum, Thaumarchaeota [112], and contain many obligate chemolithotrophs taxa that can oxidize ammonia in aerobic conditions [113,114,115]. Two Crenarchaeota (Thaumarchaeota) taxa of the Nitrososphaeraceae family, cand. Nitrosocosmicus and unc. Nitrososphaeraceae were associated with surface soil communities. Nitrososphaeraceae is composed of aerobic chemolithoautotrophic archaea that can oxidize ammonia and fix CO2 [116] and that are abundant in soils of karst ecosystems [117,118]. Nitrosocosmicus is also an ammonia-oxidizing archaeal genus [119,120] containing strains that have been isolated in near-neutral pH soils [121,122] as well as in municipal wastewater treatment plants [120].
Like in many cave habitats, eukaryotes communities in surface soils were largely composed of Obazoa and TSAR clades, both highly diversified groups. The Obazoa clade encompasses the Opishtokonta clade mainly composed of Metazoa and Fungi [123]. Metazoa includes a plethora of eukaryote microbes like annelids, copepods, gastrotrichs, nematodes, and rotifers [124] that can be found in soils as well as in caves. TSAR is a supergroup that includes Stramenopiles, Alveolates and Rhizaria (SAR) [125], as well as their sister clade Telonemia [126], composed of protists with extremely diverse morphologies, metabolisms and ecologies – including photosynthetic organisms, mixotrophs, heterotrophs, parasites and bacterivores [127]. Pezizomycotina, a subdivision of the Ascomycota phylum (fungi), was one of the most distinct eukaryote taxa in surface communities of the Pie-IX Park soils. Ascomycota is globally the most dominant phylum of fungal soil communities [128], and Pezizomycotina fungi are highly diverse in neutral pH temperate soils [129] like those of the Pie-XII Park. Those fungi can be bacterivores, saprophytes, endophytes, parasites and can form mycorrhizal associations as well as mutualistic associations with bacteria [130]. While Pezizomycotina is a typical fungus inhabiting caves [45], it was more strongly associated with soils in our study. Hypotrichia and Colpodea, both protist taxa from the Ciliophora phylum (TSAR), were also predominant in surface soils compared to the cave’s habitat. Hypotrichs and colpodeans are an important part of global soil biodiversity [131,132]. Unsurprisingly, the taxa Annelida (phylum) and Chromadorea (class of Nematoda phylum) were also prevalent in soils; segmented and round worms play an important ecological role in urban parks and natural areas [133].
Overall, the slightly more alkaline pH in the cave sediments as well as the differences in nutrients and energy resources (absence of sunlight) could explain why the dominant soil genera were not as abundant inside the cave.

4.3. Sediment and Water Microbial Communities Inside the Saint-Leonard Cave

The only difference in bacterial alpha diversity indices between the cave sediments and both water size communities was that the sediments harbored a higher number of ASVs compared to the 0.2 µm water. Furthermore, richness was higher in 0.1 µm water than in 0.2 µm water, but evenness was higher in 0.2 µm than the 0.1 µm fraction. Overall, the pattern we observed in the distribution of bacterial taxa within communities of the cave’s interior habitats is that relatively rich communities have a low evenness, and vice versa. Saint-Leonard’s groundwater effectively contained few abundant bacterial taxa and many rare taxa – especially within the 0.1. µm fraction – a pattern frequently observed in groundwater microbiomes [134,135]. These rare taxa often play an essential role in ecosystem functioning, in biogeochemical cycles, and more generally in functional diversity [136].
Archaeal communities showed a higher Shannon index in both water size fractions than in sediments, higher richness in 0.2 µm water than in sediments, and higher evenness in 0.1 µm water than in both 0.2 µm water and sediments. These results showed that archaeal communities were generally more diverse in groundwater than in the sediments of the Saint-Leonard cave. Moreover, the high evenness of the ultra-small groundwater communities indicated a more evenly distributed taxonomic composition that could be due to smaller differences in competitive ability [137] and a bigger importance of interspecific than intraspecific interactions in community function [138].
In terms of beta diversity, our analyses showed that the different habitats (including the two size fractions of water) inside the Saint-Leonard cave harbored very taxonomically distinct bacterial, archaeal and eukaryotes communities. Specifically, prokaryotes communities living in the same type of ecological compartment were much more similar to one another than to communities from other compartments. Furthermore, we observed that ultra-small prokaryotic communities showed a larger amount of compositional variation than the communities represented in the 0.2 µm water fraction which supported more homogeneous communities with similar alpha diversity and taxonomic compositions. In a study on eight karstic caves, Zhu et al. [139] also observed the influence of habitat type on compositional turnover. The correlation between shared habitat and community similarity could be explained by selection, a deterministic process which drives the assemblage of communities by favoring taxa which are better adapted to local abiotic and biotic conditions [140,141]. However, ecological stochastic processes can sometimes play a more important role in assembling prokaryotes and eukaryotes communities [100]. A number of studies have shown the importance of habitat and of diverse environmental factors as selecting forces acting on microbial communities [142,143,144], notably in aquifers [145]. In belowground aquatic environments, hydrogeology is one of the key factors determining which ecological process dominates community assembly [134]. Compositional homogeneity and stability of the 0.2µm size fraction of aquatic prokaryotes communities could potentially be explained by the homogeneity in physicochemical conditions of the cave’s groundwater – hinting to the process of homogeneous selection driven by an environment with spatially uniform conditions [146,147]. Homogeneous selection is in fact a dominant process in certain aquatic [148] and sedimentary [149] ecosystems.
Our microbial source tracking analyses suggested some exchange between communities from the different cave compartments. Contributions from the 0.2 µm size fraction groundwater communities to the 0.1 µm size fraction communities and vice versa ranged from 1 to 10% for the Bacteria and Archaea. Nonetheless, a major part of the community, for each domain, and for each compartment seems to have originated from the other areas of the same compartment, supporting our assumption that local abiotic conditions - selection - likely shape the assembly and evolution of the microbial communities.
Unsurprisingly, Proteobacteria was the most dominant bacterial phylum in the Saint-Leonard groundwater and sediments – apart from the ultra-small bacterial phyla being relatively more abundant in the 0.1 µm size fraction of water. Proteobacteria is a ubiquitous phylum and one of the most abundant in caves where it is found in every ecological compartment [41,139]. Members of this phylum possess a large metabolic diversity and can catabolize a vast array of organic compounds [42]. Acidobacteria and Gemmatimonadota, two other phyla often found dominating cave sediments [41,150,151] also accounted for a good proportion of the bacteria and contributed to habitat distinctive taxa. Differences in bacterial community composition for the cave sediments were explained by a higher proportion TRA3-20 Burkholderiales, unc. Burkholderiales, and IS-44 Nitrosomonadaceae (Proteobacteria), as well as unc. Subgroup 2 Acidobacteriae (Acidobacteriota) and unc. Gemmatimonadaceae (Gemmatimonadota). TRA3-20 is an uncultured bacterium associated with agricultural soils [152], and also found in lake sediments [153], and plant litter from the city of Montreal [154]. This bacterium was identified as a potential keystone taxon involved in carbon mineralization and is likely to also be a major player in carbon cycling in the Saint-Leonard sediments. Unc. Methanomassiliicoccales (Archaea), consisting of strictly anaerobic dihydrogen-dependent methanogens [155], were also strong drivers of the compositional difference in the cave sediments. They are part of the Thermoplasmatota, ubiquitous archaea typically abundant in cave compartment, especially sediments [156], and probably involved in carbon mineralization in the sediments as well. Many bacteria and archaea genera associated with the cave sediments belong to ammonia-oxidizing groups (Nitrosomonadaceae, unc. Nitrosopumilaceae, unc. Nitrosotaleaceae, unc. Nitrososphaeria), highlighting nitrogen cycling activities within the cave, possibly due to the links with surface urban soils. For eukaryotes communities inside the Saint-Leonard cave, the Chelicerata (Obazoa) subphylum, a clade of arthropods, explained the difference in the sediment communities. It might possibly be attributable to the presence of troglomorphic spiders, an important component of hypogean animal faunal communities [157]. Acari and Collembola have been shown to be microbivores attracted to microbial cells in Slovakian caves [158]. The same food web pattern can probably be occurring in the Saint-Leonard cave sediments.
Differences in community composition for the 0.2 µm size fraction groundwater communities were explained by two Proteobacteria genera, Limnohabitans and Methylotenera, as well as two genera from the Bacteroidota phylum, Prevotella 9 and Bacteroides, and hgcI clade Sporichthyaceae (Actinobacteriota phylum). Bacteroidota, which made up substantial proportion of the cave’s water bacterial communities, is a ubiquitous phylum [159] and have been found to dominate groundwater assemblages [160]. Actinobacteriota also accounted for a relatively large portion of the cave’s water and sediments communities, corroborating previous studies [40,41,42]. Interestingly, members of this phylum residing in caves are considered a promising source of novel antibiotics for humans [161,162]. Prevotella 9 and Bacteroides are both associated with the human gut and feces, and are probably a sign of wastewater or sewage seeping into the cave waters [163,164]. Limnohabitans and hgcI are common freshwater heterotrophic bacteria [165,166,167]. Furthermore, the hgcI Sporichthyaceae are predicted to have the ability to use inorganic nutrients and nitrogen-rich organic compounds [168,169], all of which were high in the Saint-Leonard cave groundwater and significantly correlated with bacterial community composition. Methylotenera is a methylotroph able to use methane-derived carbon in eutrophic lakes [170]. The presence of these C1-utilizing bacteria is likely linked to the detection of methane-producer Methanoregula. The CG1-02-32-21 Micrarchaeales from the phylum Micrarchaeota (DPANN superphylum) which is found in all types of environments including groundwater [171], was part of the drivers of the 0.2 µm size fraction archaeal groundwater community and is a potential complex organic carbon utilizer [172]. For eukaryotes communities, another Obazoa taxa, Rozellomycota, a basal or sister clade of fungi, drove the distinctiveness of 0.2 µm water communities. These organisms are parasites of amoebae, but also algae and small invertebrates [173]. Along Rozellomycota, many TSAR taxa were also associated with the 0.2 µm water, among which are Hymenostomatia, unc. Alveolata, Eimeriida, and Ochromonadales. Being highly diverse, explain the TSAR supergroup is typically strongly present in microbial eukaryotes communities in caves ecosystems [46]. It has been proposed that sediments might be serving as a refuge habitat for cysts-forming protists, and act as « seed banks » to recolonize groundwater [174].
In the 0.1 µm size fraction groundwater, two ultra-small bacterial phyla dominated the communities: Patescibacteria and Bdellovibrionota. Differences in community composition were explained by a higher proportion of unc. Saccharimonadales and LWQ8 Saccharimonadales (Patescibacteria) and of 0319-6G20 Oligoflexia, Silvanigrella, Bdellovibri (Bdellovibrionota). Patescibacteria, which includes a large part of the candidate phyla radiation (CPR), is a superphylum of ultra-small bacteria found in high numbers in groundwater habitats [134,175]. Members of Patescibacteria adapted to this environment have a streamlined genome that show a reduction of many non-essential metabolic functions, which suggests the necessity of engaging in symbiotic or syntrophic interactions to acquire nutrients – notably via pili [16,176]. In Patescibacteria, horizontal gene transfer seems to be an important mechanism of genome adaptation in subsurface aquatic environment [177]. Bdellovibrionota bacteria are pleiomorphs and some have an ultra-small size [178]. Groundwater is a choice habitat for Bdellovibrionota [179]. These predatory bacteria are obligate bacterivores [180,181]. Therefore, these microorganisms have a direct impact on the structure of bacterial communities – they add an extra layer of complexity to the microbial loop and to the recycling process of organic matter and nutrients [182]. Nanoarchaeota, another characteristic archaeal phylum of groundwater microbial communities [183], formed an important part of the caves’ groundwater microbiome, especially in the 0.1 µm size fraction where it largely dominated the communities, and harbored distinctive taxa such as GW2011_GWC1_47_15 Nanoarchaeota, unc. Woesearchaeales, and SCGC AAA011-D5 Nanoarchaeia. Nanoarchaeota is also part of the DPANN radiation and possess all typical characteristics of ultra-small prokaryotes [184,185]. Apart from groundwater, these archaea are also found in extreme environment like hydrothermal vents sediments, hypersaline sediments [186], and acidic hot springs [187]. Archaea of this phylum are obligate ectoparasites of other archaea [188]. These findings suggest the existence of complex symbiotic and trophic interactions which most probably impact the community structure of aquatic communities in the Saint-Leonard cave.

5. Conclusions

This exploratory study is the first to investigate microbial communities residing inside Saint-Leonard cave – one of the extremely rare urban glaciotectonic cave in the world. Inhabiting its groundwater and sediments, we detected a microbial biodiversity typical of cave ecosystems, with habitat-distinctive bacterial, archaeal and eukaryotes communities. Taxa that we detected were associated with a wide variety of lifestyles and of metabolic capacities. While we found evidence that the organic matter and nutrients originated from the surface soil above the cave, our results suggest that habitat selection, rather than dispersal between habitat type, was probably driving the community assembly. Our study has revealed that the cave’s groundwater is generally richer in microbial taxa than sediments. Moreover, it harbors a considerable proportion of ultra-small bacteria and archaea from diverse prokaryote phyla such as Bdellovibrionota, Patescibacteria, Woesearchaeota and Nanoarchaeota. Interestingly, the observation that 0.1µm-filtered (and other) samples harbored a noticeable fraction of unclassified bacteria and archaea reflects the fact that these groundwater communities, notably the ultra-small prokaryotes, need to be better studied, characterized and considered when assessing the taxonomic microbiomes of natural environments. Our results also open the door to a functional study of the cave’s microbiomes to unveil key metabolisms that would link together the taxonomic structure of communities, the microbial functions and the physicochemical characteristics of the cave’s habitats.
Urban underground biodiversity is an important study avenue for microbial ecology. In cities, soil is excavated for the construction of many types of infrastructures (residential and commercial buildings, transport, municipal services’ systems) and the subsurface is often contaminated with a plethora of pollutants. Moreover, considering the dependence of subsurface environments to terrestrial ecosystems, climate change will inevitably have repercussions on groundwater habitats – especially shallow and urban aquifers – by means of increasing temperatures and altering the hydrological cycle, thus modifying groundwater table depth, nutrient and contaminants inputs, and microorganisms’ migration and selective pressures. While prospecting for novel chemical compounds or metabolic pathways is an exciting and promising part of subsurface microbiology, understanding the fundamental dynamics of microbial assemblages in the urban underground is the first step towards promoting the conservation of communities’ integrity and ecological functions, and the protection of the biogeological legacy of the retreating ice mass marking the end of the last glaciation period.

Supplementary Materials

The following supporting information can be downloaded at the website of this paper posted on Preprints.org, Figure S1: Alpha-diversity indices for the Bacteria domain, based on (a) the Shannon indices, (b) ASV richness, and (c) evenness; Figure S2: Alpha-diversity indices for the Archaea domain, based on (a) the Shannon indices, (b) ASV richness, and (c) evenness; Figure S3: Alpha-diversity indices for the Eukaryote domain, based on (a) the Shannon indices, (b) ASV richness, and (c) evenness; Figure S4: db-RDA graphs based on a Bray-Curtis dissimilarity matrix for the surface soils/cave sediment communities, for (a) the Bacteria, (b) the Archaea, and (c) the Eukaryotes, and environmental variables measured in each sample; Table S1: Comparison of alpha-diversity indices using Kruskal-Wallis tests and multiple comparisons, based on Shannon indices, ASV richness, and evenness, for the Bacteria domain; Table S2: Comparison of alpha-diversity indices using Kruskal-Wallis tests and multiple comparisons, based on Shannon indices, ASV richness, and evenness, for the Archaea domain; Table S3: Comparison of alpha-diversity indices using Kruskal-Wallis tests and multiple comparisons, based on Shannon indices, ASV richness, and evenness, for the Eukaryote domain; Table S4: PERMANOVA analyses based on a Bray-Curtis dissimilarity matrix using habitat (surface soils, cave sediment, and cave water 0.1 and 0.2 µm) as an environmental variable, for the Bacteria and Archaea domains. The variables were surface soils, cave sediment, and cave water 0.2 µm for the Eukaryote domain; Table S5: AMOVA analyses based on a Bray-Curtis dissimilarity matrix using habitat (surface soils, cave sediment, and cave water 0.1 and 0.2 µm) as an environmental variable, for the Bacteria; Table S6: AMOVA analyses based on a Bray-Curtis dissimilarity matrix using habitat (surface soils, cave sediment, and cave water 0.1 and 0.2 µm) as an environmental variable, for the Archaea; Table S7: AMOVA analyses based on a Bray-Curtis dissimilarity matrix using habitat (surface soils, cave sediment, and cave water 0.2 µm) as an environmental variable, for the Eukaryote; Table S8: HOMOVA analyses based on a Bray-Curtis dissimilarity matrix comparing cave water 0.2 (W2) and 0.1 (W1) µm samples, for the Bacteria and Archaea domains.

Author Contributions

Conceptualization, J.L. and C.S.L.; sampling, D.C.; methodology, J.L. and C.S.L.; software, J.L. and C.S.L.; validation, C.S.L.; formal analysis, J.L.; investigation, J.L. and D.C.; resources, C.S.L.; data curation, J.L. and C.S.L.; writing—original draft preparation, J.L.; writing—review and editing, C.S.L. and D.C.; visualization, J.L..; supervision, C.S.L.; project administration, C.S.L.; funding acquisition, C.S.L. All authors have read and agreed to the published version of the manuscript.

Funding

This research was funded by a Canada Research Chair (CRC) in Aquatic Environmental Genomics, and a Natural Sciences and Engineering Research Council (NSERC) discovery grant [RGPIN-2019-06670], all awarded to C.S.L.

Data Availability Statement

The original raw sequences analyzed in the study are openly available at the National Center for Biotechnology Information (NCBI) under the BioProject ID PRJNA1139756.

Acknowledgments

We thank the Interuniversity Research Group in Limnology (GRIL) and their funders, the Fonds de recherche—nature et technologie (FRQNT, Québec). We also want to thank Geneviève Bourret, research professional at the genomics platform of CERMO-FC, Katherine Velghe, research professional at the GRIL analytical laboratory, and Dr. Jean-François Hélie and laboratory technician Agnieszka Adamowicz at the GEOTOP laboratory.

Conflicts of Interest

The authors declare no conflicts of interest. The funders had no role in the design of the study; in the collection, analyses, or interpretation of data; in the writing of the manuscript; or in the decision to publish the results.

References

  1. Martin-Pozas, T.; Gonzalez-Pimentel, J.L.; Jurado, V.; Cuezva, S.; Dominguez-Moñino, I.; Fernandez-Cortes, A.; Cañaveras, J.C.; Sanchez-Moral, S.; Saiz-Jimenez, C. Microbial Activity in Subterranean Ecosystems: Recent Advances. Appl. Sci. 2020, 10, 8130. [Google Scholar] [CrossRef]
  2. Escudero, C.; Oggerin, M.; Amils, R. The Deep Continental Subsurface: The Dark Biosphere. Int. Microbiol. 2018, 21, 3–14. [Google Scholar] [CrossRef] [PubMed]
  3. Krumholz, L.R. Microbial Communities in the Deep Subsurface. Hydrogeol. J. 2000, 8, 4–10. [Google Scholar] [CrossRef]
  4. McMahon, S.; Parnell, J. Weighing the Deep Continental Biosphere. FEMS Microbiol. Ecol. 2014, 87, 113–120. [Google Scholar] [CrossRef] [PubMed]
  5. Griebler, C.; Lueders, T. Microbial Biodiversity in Groundwater Ecosystems. Freshw. Biol. 2009, 54, 649–677. [Google Scholar] [CrossRef]
  6. Lazar, C.S.; Lehmann, R.; Stoll, W.; Rosenberger, J.; Totsche, K.U.; Küsel, K. The Endolithic Bacterial Diversity of Shallow Bedrock Ecosystems. Sci. Total Environ. 2019, 679, 35–44. [Google Scholar] [CrossRef] [PubMed]
  7. Hershey, O.S.; Barton, H.A. The Microbial Diversity of Caves. In Cave Ecology; Moldovan, O.T., Kováč, Ľ., Halse, S., Eds.; Ecological Studies; Springer International Publishing: Cham, 2018; Vol. 235, pp. 69–90; ISBN 978-3-319-98850-4. [Google Scholar]
  8. Sprocati, A.R.; Alisi, C.; Segre, L.; Tasso, F.; Galletti, M.; Cremisini, C. Investigating Heavy Metal Resistance, Bioaccumulation and Metabolic Profile of a Metallophile Microbial Consortium Native to an Abandoned Mine. Sci. Total Environ. 2006, 366, 649–658. [Google Scholar] [CrossRef] [PubMed]
  9. Lhoste, E.; Comte, F.; Brown, K.; Delisle, A.; Jaclin, D.; Ponsin, V.; Rosabal, M.; Lazar, C.S. Bacterial, Archaeal, and Eukaryote Diversity in Planktonic and Sessile Communities Inside an Abandoned and Flooded Iron Mine (Quebec, Canada). Appl. Microbiol. 2023, 3, 45–63. [Google Scholar] [CrossRef]
  10. Röling, W.F.M.; Head, I.M.; Larter, S.R. The Microbiology of Hydrocarbon Degradation in Subsurface Petroleum Reservoirs: Perspectives and Prospects. Res. Microbiol. 2003, 154, 321–328. [Google Scholar] [CrossRef] [PubMed]
  11. Engel, A.S. Microbial Diversity of Cave Ecosystems. In Geomicrobiology: Molecular and Environmental Perspective; Barton, L.L., Mandl, M., Loy, A., Eds.; Springer Netherlands: Dordrecht, 2010; pp. 219–238; ISBN 978-90-481-9203-8. [Google Scholar]
  12. Kieft, T.L. Sampling the Deep Sub-Surface Using Drilling and Coring Techniques. In Handbook of Hydrocarbon and Lipid Microbiology; Timmis, K.N., Ed.; Springer Berlin Heidelberg: Berlin, Heidelberg, 2010; pp. 3427–3441; ISBN 978-3-540-77584-3. [Google Scholar]
  13. Barton, H.A.; Northup, D.E. Geomicrobiology in Cave Environments: Past, Current and Future Perspectives. J. Cave Karst Stud. 2007, 69, 163–178. [Google Scholar]
  14. Dong, H.; Yu, B. Geomicrobiological Processes in Extreme Environments: A Review. Episodes 2007, 30, 202–216. [Google Scholar] [CrossRef] [PubMed]
  15. Ghuneim, L.-A.J.; Jones, D.L.; Golyshin, P.N.; Golyshina, O.V. Nano-Sized and Filterable Bacteria and Archaea: Biodiversity and Function. Front. Microbiol. 2018, 9, 1971. [Google Scholar] [CrossRef] [PubMed]
  16. Luef, B.; Frischkorn, K.R.; Wrighton, K.C.; Holman, H.-Y.N.; Birarda, G.; Thomas, B.C.; Singh, A.; Williams, K.H.; Siegerist, C.E.; Tringe, S.G.; et al. Diverse Uncultivated Ultra-Small Bacterial Cells in Groundwater. Nat. Commun. 2015, 6, 6372. [Google Scholar] [CrossRef]
  17. He, C.; Keren, R.; Whittaker, M.L.; Farag, I.F.; Doudna, J.A.; Cate, J.H.D.; Banfield, J.F. Genome-Resolved Metagenomics Reveals Site-Specific Diversity of Episymbiotic CPR Bacteria and DPANN Archaea in Groundwater Ecosystems. Nat. Microbiol. 2021, 6, 354–365. [Google Scholar] [CrossRef] [PubMed]
  18. Duda, V.I.; Suzina, N.E.; Polivtseva, V.N.; Boronin, A.M. Ultramicrobacteria: Formation of the Concept and Contribution of Ultramicrobacteria to Biology. Microbiology 2012, 81, 379–390. [Google Scholar] [CrossRef]
  19. Kuroda, K.; Yamamoto, K.; Nakai, R.; Hirakata, Y.; Kubota, K.; Nobu, M.K.; Narihiro, T. Symbiosis between Candidatus Patescibacteria and Archaea Discovered in Wastewater-Treating Bioreactors. mBio 2022, 13, e01711–22. [Google Scholar] [CrossRef] [PubMed]
  20. Dey, S. Indigenous Microbial Populations of Abandoned Mining Sites and Their Role in Natural Attenuation. Arch. Microbiol. 2022, 204, 251. [Google Scholar] [CrossRef] [PubMed]
  21. Newsome, L.; Falagán, C. The Microbiology of Metal Mine Waste: Bioremediation Applications and Implications for Planetary Health. GeoHealth 2021, 5, e2020GH000380. [Google Scholar] [CrossRef] [PubMed]
  22. Meckenstock, R.U.; Elsner, M.; Griebler, C.; Lueders, T.; Stumpp, C.; Aamand, J.; Agathos, S.N.; Albrechtsen, H.-J.; Bastiaens, L.; Bjerg, P.L.; et al. Biodegradation: Updating the Concepts of Control for Microbial Cleanup in Contaminated Aquifers. Environ. Sci. Technol. 2015, 49, 7073–7081. [Google Scholar] [CrossRef] [PubMed]
  23. Thullner, M.; Regnier, P. Microbial Controls on the Biogeochemical Dynamics in the Subsurface. Rev. Mineral. Geochem. 2019, 85, 265–302. [Google Scholar] [CrossRef]
  24. Trevors, J.T.; Bej, A.K.; Van Elsas, J.D. Hypothesized Microenvironments for the Origin of Microbial Life on Earth. In Genesis - In The Beginning; Seckbach, J., Ed.; Cellular Origin, Life in Extreme Habitats and Astrobiology; Springer Netherlands: Dordrecht, 2012; Vol. 22, pp. 775–795; ISBN 978-94-007-2940-7. [Google Scholar]
  25. Mizuno, K.; Maree, M.; Nagamura, T.; Koga, A.; Hirayama, S.; Furukawa, S.; Tanaka, K.; Morikawa, K. Novel Multicellular Prokaryote Discovered next to an Underground Stream. eLife 2022, 11, e71920. [Google Scholar] [CrossRef] [PubMed]
  26. Warren-Rhodes, K.A.; Lee, K.C.; Archer, S.D.J.; Cabrol, N.; Ng-Boyle, L.; Wettergreen, D.; Zacny, K.; Pointing, S.B. ; NASA Life in the Atacama Project Team Corrigendum: Subsurface Microbial Habitats in an Extreme Desert Mars-Analog Environment. Front. Microbiol. 2019, 10, 2129. [Google Scholar] [CrossRef]
  27. Chapelle, F.H.; O’Neill, K.; Bradley, P.M.; Methé, B.A.; Ciufo, S.A.; Knobel, L.L.; Lovley, D.R. A Hydrogen-Based Subsurface Microbial Community Dominated by Methanogens. Nature 2002, 415, 312–315. [Google Scholar] [CrossRef] [PubMed]
  28. Lee, N.M.; Meisinger, D.B.; Aubrecht, R.; Kovacik, L.; Saiz-Jimenez, C.; Baskar, S.; Baskar, R.; Liebl, W.; Porter, M.L.; Engel, A.S. Caves and Karst Environments. In Life at extremes: environments, organisms and strategies for survival; Bell, E.M., Ed.; CABI: UK, 2012; pp. 320–344; ISBN 978-1-84593-814-7. [Google Scholar]
  29. Barton, H.A.; Jurado, V. What’s Up Down There? Microbial Diversity in Caves. Microbe 2007, 2, 132–138. [Google Scholar]
  30. Anantharaman, K.; Brown, C.T.; Hug, L.A.; Sharon, I.; Castelle, C.J.; Probst, A.J.; Thomas, B.C.; Singh, A.; Wilkins, M.J.; Karaoz, U.; et al. Thousands of Microbial Genomes Shed Light on Interconnected Biogeochemical Processes in an Aquifer System. Nat. Commun. 2016, 7, 13219. [Google Scholar] [CrossRef] [PubMed]
  31. Turrini, P.; Tescari, M.; Visaggio, D.; Pirolo, M.; Lugli, G.A.; Ventura, M.; Frangipani, E.; Visca, P. The Microbial Community of a Biofilm Lining the Wall of a Pristine Cave in Western New Guinea. Microbiol. Res. 2020, 241, 126584. [Google Scholar] [CrossRef] [PubMed]
  32. Schlatter, D.C.; Kinkel, L.L. Antibiotics: Conflict and Communication in Microbial Communities. Microbe Mag. 2014, 9, 282–288. [Google Scholar] [CrossRef]
  33. Davies, J. Are Antibiotics Naturally Antibiotics? J. Ind. Microbiol. Biotechnol. 2006, 33, 496–499. [Google Scholar] [CrossRef]
  34. Dantas, G.; Sommer, M.O.A.; Oluwasegun, R.D.; Church, G.M. Bacteria Subsisting on Antibiotics. Science 2008, 320, 100–103. [Google Scholar] [CrossRef] [PubMed]
  35. Barka, E.A.; Vatsa, P.; Sanchez, L.; Gaveau-Vaillant, N.; Jacquard, C.; Klenk, H.-P.; Clément, C.; Ouhdouch, Y.; Van Wezel, G.P. Taxonomy, Physiology, and Natural Products of Actinobacteria. Microbiol. Mol. Biol. Rev. 2016, 80, 1–43. [Google Scholar] [CrossRef] [PubMed]
  36. Kováč, Ľ. Caves as Oligotrophic Ecosystems. In Cave Ecology; Moldovan, O.T., Kováč, Ľ., Halse, S., Eds.; Ecological Studies; Springer International Publishing: Cham, 2018; Vol. 235, pp. 297–307; ISBN 978-3-319-98850-4. [Google Scholar]
  37. Barton, H.A.; Taylor, M.R.; Pace, N.R. Molecular Phylogenetic Analysis of a Bacterial Community in an Oligotrophic Cave Environment. Geomicrobiol. J. 2004, 21, 11–20. [Google Scholar] [CrossRef]
  38. Chelius, M.K.; Moore, J.C. Molecular Phylogenetic Analysis of Archaea and Bacteria in Wind Cave, South Dakota. Geomicrobiol. J. 2004, 21, 123–134. [Google Scholar] [CrossRef]
  39. E. Northup, Kathleen H. Lavoie, D. Geomicrobiology of Caves: A Review. Geomicrobiol. J. 2001, 18, 199–222. [Google Scholar] [CrossRef]
  40. Wiseschart, A.; Mhuantong, W.; Tangphatsornruang, S.; Chantasingh, D.; Pootanakit, K. Shotgun Metagenomic Sequencing from Manao-Pee Cave, Thailand, Reveals Insight into the Microbial Community Structure and Its Metabolic Potential. BMC Microbiol. 2019, 19, 144. [Google Scholar] [CrossRef] [PubMed]
  41. De Mandal, S.; Chatterjee, R.; Kumar, N.S. Dominant Bacterial Phyla in Caves and Their Predicted Functional Roles in C and N Cycle. BMC Microbiol. 2017, 17, 90. [Google Scholar] [CrossRef] [PubMed]
  42. Tomczyk-Żak, K.; Zielenkiewicz, U. Microbial Diversity in Caves. Geomicrobiol. J. 2016, 33, 20–38. [Google Scholar] [CrossRef]
  43. Gonzalez, J.M.; Portillo, M.C.; Saiz-Jimenez, C. Metabolically Active Crenarchaeota in Altamira Cave. Naturwissenschaften 2006, 93, 42–45. [Google Scholar] [CrossRef] [PubMed]
  44. Northup, D.E.; Barns, S.M.; Yu, L.E.; Spilde, M.N.; Schelble, R.T.; Dano, K.E.; Crossey, L.J.; Connolly, C.A.; Boston, P.J.; Natvig, D.O.; et al. Diverse Microbial Communities Inhabiting Ferromanganese Deposits in Lechuguilla and Spider Caves. Environ. Microbiol. 2003, 5, 1071–1086. [Google Scholar] [CrossRef] [PubMed]
  45. Vanderwolf, K.; Malloch, D.; McAlpine, D.; Forbes, G. A World Review of Fungi, Yeasts, and Slime Molds in Caves. Int. J. Speleol. 2013, 42, 77–96. [Google Scholar] [CrossRef]
  46. Cahoon, A.B.; VanGundy, R.D. Alveolates (Dinoflagellates, Ciliates and Apicomplexans) and Rhizarians Are the Most Common Microbial Eukaryotes in Temperate Appalachian Karst Caves. Environ. Microbiol. Rep. 2022, 14, 538–548. [Google Scholar] [CrossRef] [PubMed]
  47. Jones, B. Microbes in Caves: Agents of Calcite Corrosion and Precipitation. Geol. Soc. Lond. Spec. Publ. 2010, 336, 7–30. [Google Scholar] [CrossRef]
  48. Engel, A.S.; Stern, L.A.; Bennett, P.C. Microbial Contributions to Cave Formation: New Insights into Sulfuric Acid Speleogenesis. Geology 2004, 32, 369. [Google Scholar] [CrossRef]
  49. Maciejewska, M.; Adam, D.; Naômé, A.; Martinet, L.; Tenconi, E.; Całusińska, M.; Delfosse, P.; Hanikenne, M.; Baurain, D.; Compère, P.; et al. Assessment of the Potential Role of Streptomyces in Cave Moonmilk Formation. Front. Microbiol. 2017, 8, 1181. [Google Scholar] [CrossRef] [PubMed]
  50. Melim, Kristen M. Shinglman, Pen, L. Evidence for Microbial Involvement in Pool Finger Precipitation, Hidden Cave, New Mexico. Geomicrobiol. J. 2001, 18, 311–329. [CrossRef]
  51. Banks, E.D.; Taylor, N.M.; Gulley, J.; Lubbers, B.R.; Giarrizzo, J.G.; Bullen, H.A.; Hoehler, T.M.; Barton, H.A. Bacterial Calcium Carbonate Precipitation in Cave Environments: A Function of Calcium Homeostasis. Geomicrobiol. J. 2010, 27, 444–454. [Google Scholar] [CrossRef]
  52. Zhu, H.-Z.; Zhang, Z.-F.; Zhou, N.; Jiang, C.-Y.; Wang, B.-J.; Cai, L.; Wang, H.-M.; Liu, S.-J. Bacteria and Metabolic Potential in Karst Caves Revealed by Intensive Bacterial Cultivation and Genome Assembly. Appl. Environ. Microbiol. 2021, 87, e02440–20. [Google Scholar] [CrossRef] [PubMed]
  53. Parker, C.W.; Auler, A.S.; Senko, J.; Sasowsky, I.D.; Piló, L.B.; Smith, M.; Barton, H. Microbial Iron Cycling and Biospeleogenesis: Cave Development in the Carajás Formation, Brazil. Presented at the 2013 ICS Proceedings - Biospeleology, Geomicrobiology and Ecology, 2013.
  54. Fru, E.C.; Piccinelli, P.; Fortin, D. Insights into the Global Microbial Community Structure Associated with Iron Oxyhydroxide Minerals Deposited in the Aerobic Biogeosphere. Geomicrobiol. J. 2012, 29, 587–610. [Google Scholar] [CrossRef]
  55. Carmichael, S.K.; Bräuer, S.L. 7. Microbial Diversity and Manganese Cycling: A Review of Manganese-Oxidizing Microbial Cave Communities. In Microbial Life of Cave Systems; Summers Engel, A., Ed.; De Gruyter, 2015; pp. 137–160 ISBN 978-3-11-033499-9.
  56. Paula, C.C.P.D.; Sirová, D.; Sarmento, H.; Fernandes, C.C.; Kishi, L.T.; Bichuette, M.E.; Seleghim, M.H.R. First Report of Halobacteria Dominance in a Tropical Cave Microbiome. bioRxiv 2021. [Google Scholar] [CrossRef]
  57. Palmer, A.N. Origin and Morphology of Limestone Caves. Geol. Soc. Am. Bull. 1991, 103, 1–21. [Google Scholar] [CrossRef]
  58. Klimchouk, A. The Karst Paradigm: Changes, Trends and Perspectives. Acta Carsologica 2015, 44, 289–313. [Google Scholar] [CrossRef]
  59. White, W.B.; Culver, D.C. Cave, Definition Of. In Encyclopedia of Caves; Elsevier, 2012; pp. 103–107 ISBN 978-0-12-383832-2.
  60. Schroeder, J.; Beaupré, M.; Cloutier, M. Ice-Push Caves in Platform Limestones of the Montréal Area. Can. J. Earth Sci. 1986, 23, 1842–1851. [Google Scholar] [CrossRef]
  61. Schroeder, J.; Beaupré, M.; Caron, D. Glacitectonic Caves in the St. Lawrence Lowlands of Québec. In Landscapes and Landforms of Eastern Canada; Slaymaker, O., Catto, N., Eds.; World Geomorphological Landscapes; Springer International Publishing: Cham, 2020; pp. 509–523; ISBN 978-3-030-35135-9. [Google Scholar]
  62. Beaupré, M.; Caron, D. Cavernes Du Québec, Guide de Spéléologie; Éditions Michel Quintin: Montréal, 2021. [Google Scholar]
  63. Jean-François Hélie (Université du Québec à Montréal, Montréal, Québec, Canada). Personal Communication, 2022.
  64. Patton, C.J.; Kryskalla, J.R. Methods of Analysis by the U.S. Geological Survey National Water Quality Laboratory-Evaluation of Alkaline Persulfate Digestion as an Alternative to Kjeldahl Digestion for Determination of Total and Dissolved Nitrogen and Phosphorus in Water. Water-Resour. Investig. Rep. 03-4174 2003. [CrossRef]
  65. Muyzer, G.; De Waal, E.C.; Uitterlinden, A.G. Profiling of Complex Microbial Populations by Denaturing Gradient Gel Electrophoresis Analysis of Polymerase Chain Reaction-Amplified Genes Coding for 16S rRNA. Appl. Environ. Microbiol. 1993, 59, 695–700. [Google Scholar] [CrossRef] [PubMed]
  66. Klindworth, A.; Pruesse, E.; Schweer, T.; Peplies, J.; Quast, C.; Horn, M.; Glöckner, F.O. Evaluation of General 16S Ribosomal RNA Gene PCR Primers for Classical and Next-Generation Sequencing-Based Diversity Studies. Nucleic Acids Res. 2013, 41, e1. [Google Scholar] [CrossRef] [PubMed]
  67. Gantner, S.; Andersson, A.F.; Alonso-Sáez, L.; Bertilsson, S. Novel Primers for 16S rRNA-Based Archaeal Community Analyses in Environmental Samples. J. Microbiol. Methods 2011, 84, 12–18. [Google Scholar] [CrossRef] [PubMed]
  68. Stahl, D.A.; Amann, R. Development and Application of Nucleic Acid Probes in Bacterial Systematics. In Nucleic Acid Techniques in Bacterial Systematics; Stackebrandt, E., Goodfellow, M., Eds.; John Wiley & Sons Ltd.: Chichester, 1991; pp. 205–248. [Google Scholar]
  69. Van De Peer, Y. The European Small Subunit Ribosomal RNA Database. Nucleic Acids Res. 2000, 28, 175–176. [Google Scholar] [CrossRef] [PubMed]
  70. Gast, R.J.; Dennett, M.R.; Caron, D.A. Characterization of Protistan Assemblages in the Ross Sea, Antarctica, by Denaturing Gradient Gel Electrophoresis. Appl. Environ. Microbiol. 2004, 70. [Google Scholar] [CrossRef] [PubMed]
  71. Callahan, B.J.; McMurdie, P.J.; Rosen, M.J.; Han, A.W.; Johnson, A.J.A.; Holmes, S.P. DADA2: High-Resolution Sample Inference from Illumina Amplicon Data. Nat. Methods 2016, 13, 581–583. [Google Scholar] [CrossRef] [PubMed]
  72. R Core Team. R: A Language and Environment for Statistical Computing, R Foundation for Statistical Computing, 2022.
  73. Quast, C.; Pruesse, E.; Yilmaz, P.; Gerken, J.; Schweer, T.; Yarza, P.; Peplies, J.; Glöckner, F.O. The SILVA Ribosomal RNA Gene Database Project: Improved Data Processing and Web-Based Tools. Nucleic Acids Res. 2013, 41, D590–D596. [Google Scholar] [CrossRef] [PubMed]
  74. Zhou, Z.; Pan, J.; Wang, F.; Gu, J.-D.; Li, M. Bathyarchaeota: Globally Distributed Metabolic Generalists in Anoxic Environments. FEMS Microbiol. Rev. 2018, 42, 639–655. [Google Scholar] [CrossRef] [PubMed]
  75. Liu, X.; Li, M.; Castelle, C.J.; Probst, A.J.; Zhou, Z.; Pan, J.; Liu, Y.; Banfield, J.F.; Gu, J.-D. Insights into the Ecology, Evolution, and Metabolism of the Widespread Woesearchaeotal Lineages. Microbiome 2018, 6, 102. [Google Scholar] [CrossRef]
  76. Vaulot, D.; Schönle, A.; Sandin, M.; Morard, R.; Mahé, F.; Fiore-Donno, A.M.; del Campo, J. Pr2database/Pr2database: PR2 Version 4.14.0, Zenodo, 2021.
  77. Davis, N.M.; Proctor, D.M.; Holmes, S.P.; Relman, D.A.; Callahan, B.J. Simple Statistical Identification and Removal of Contaminant Sequences in Marker-Gene and Metagenomics Data. Microbiome 2018, 6, 226. [Google Scholar] [CrossRef] [PubMed]
  78. Pereira, M.B.; Wallroth, M.; Jonsson, V.; Kristiansson, E. Comparison of Normalization Methods for the Analysis of Metagenomic Gene Abundance Data. BMC Genomics 2018, 19, 274. [Google Scholar] [CrossRef] [PubMed]
  79. Ogle, D.H.; Doll, J.C.; Wheeler, A.P.; Dinno, A. FSA: Simple Fisheries Stock Assessment Methods (v.0.9.5), 2023.
  80. Hammer, O.; Harper, D.A.T.; Ryan, P.D. PAST: Paleontological Statistics Software Package for Education and Data Analysis. Palaeontol. Electron. 2001, 4. [Google Scholar]
  81. Anderson, M.J. A New Method for Non-parametric Multivariate Analysis of Variance. Austral Ecol. 2001, 26, 32–46. [Google Scholar] [CrossRef]
  82. Oksanen, J.; Simpson, G.L.; Blanchet, F.G.; Kindt, R.; Legendre, P.; Minchin, P.R.; O’Hara, R.B.; Solymos, P.; Stevens, M.H.H.; Szoecs, E.; et al. Vegan: Community Ecology Package 2022.
  83. Schloss, P.D.; Westcott, S.L.; Ryabin, T.; Hall, J.R.; Hartmann, M.; Hollister, E.B.; Lesniewski, R.A.; Oakley, B.B.; Parks, D.H.; Robinson, C.J.; et al. Introducing Mothur: Open-Source, Platform-Independent, Community-Supported Software for Describing and Comparing Microbial Communities. Appl. Environ. Microbiol. 2009, 75, 7537–7541. [Google Scholar] [CrossRef] [PubMed]
  84. Shenhav, L.; Thompson, M.; Joseph, T.A.; Briscoe, L.; Furman, O.; Bogumil, D.; Mizrahi, I.; Pe’er, I.; Halperin, E. FEAST: Fast Expectation-Maximization for Microbial Source Tracking. Nat. Methods 2019, 16, 627–632. [Google Scholar] [CrossRef]
  85. Barton, H.A. Starving Artists: Bacterial Oligotrophic Heterotrophy in Caves. In Microbial Life of Cave Systems; Summers Engel, A., Ed.; De Gruyter, 2015; pp. 79–104 ISBN 978-3-11-033499-9.
  86. Health Canada. Guidance on Natural Organic Matter in Drinking Water; Water and Air Quality Bureau, Healthy Environments and Consumer Safety Branch, Health Canada, 2020;
  87. McDonough, L.K.; Santos, I.R.; Andersen, M.S.; O’Carroll, D.M.; Rutlidge, H.; Meredith, K.; Oudone, P.; Bridgeman, J.; Gooddy, D.C.; Sorensen, J.P.R.; et al. Changes in Global Groundwater Organic Carbon Driven by Climate Change and Urbanization. Nat. Commun. 2020, 11, 1279. [Google Scholar] [CrossRef] [PubMed]
  88. Downing, J.A.; Striegl, R.G. Size, Age, Renewal, and Discharge of Groundwater Carbon. Inland Waters 2018, 8, 122–127. [Google Scholar] [CrossRef]
  89. Kratzer, C.R.; Brezonik, P.L. A Carlson-Type Trophic State Index for Nitrogen in Florida Lakes. JAWRA J. Am. Water Resour. Assoc. 1981, 17, 713–715. [Google Scholar] [CrossRef]
  90. Nürnberg, G.K. Trophic State of Clear and Colored, Soft- and Hardwater Lakes with Special Consideration of Nutrients, Anoxia, Phytoplankton and Fish. Lake Reserv. Manag. 1996, 12, 432–447. [Google Scholar] [CrossRef]
  91. Różkowski, J.; Różkowski, K.; Rahmonov, O.; Rubin, H. Nitrates and Phosphates in Cave Waters of Kraków-Częstochowa Upland, Southern Poland. Environ. Sci. Pollut. Res. 2017, 24, 25870–25880. [Google Scholar] [CrossRef] [PubMed]
  92. Chen, Y.; Wu, L.; Boden, R.; Hillebrand, A.; Kumaresan, D.; Moussard, H.; Baciu, M.; Lu, Y.; Colin Murrell, J. Life without Light: Microbial Diversity and Evidence of Sulfur- and Ammonium-Based Chemolithotrophy in Movile Cave. ISME J. 2009, 3, 1093–1104. [Google Scholar] [CrossRef] [PubMed]
  93. Ortiz, M.; Legatzki, A.; Neilson, J.W.; Fryslie, B.; Nelson, W.M.; Wing, R.A.; Soderlund, C.A.; Pryor, B.M.; Maier, R.M. Making a Living While Starving in the Dark: Metagenomic Insights into the Energy Dynamics of a Carbonate Cave. ISME J. 2014, 8, 478–491. [Google Scholar] [CrossRef] [PubMed]
  94. Macalady, J.L.; Lyon, E.H.; Koffman, B.; Albertson, L.K.; Meyer, K.; Galdenzi, S.; Mariani, S. Dominant Microbial Populations in Limestone-Corroding Stream Biofilms, Frasassi Cave System, Italy. Appl. Environ. Microbiol. 2006, 72, 5596–5609. [Google Scholar] [CrossRef] [PubMed]
  95. Engel, A.S.; Porter, M.L.; Stern, L.A.; Quinlan, S.; Bennett, P.C. Bacterial Diversity and Ecosystem Function of Filamentous Microbial Mats from Aphotic (Cave) Sulfidic Springs Dominated by Chemolithoautotrophic “Epsilonproteobacteria. ” FEMS Microbiol. Ecol. 2004, 51, 31–53. [Google Scholar] [CrossRef] [PubMed]
  96. Gibert, J.; Deharveng, L. Subterranean Ecosystems: A Truncated Functional Biodiversity. BioScience 2002, 52, 473. [Google Scholar] [CrossRef]
  97. Meyers, P.A. Organic Geochemical Proxies of Paleoceanographic, Paleolimnologic, and Paleoclimatic Processes. Org. Geochem. 1997, 27, 213–250. [Google Scholar] [CrossRef]
  98. Peterson, B.J.; Howarth, R.W. Sulfur, Carbon, and Nitrogen Isotopes Used to Trace Organic Matter Flow in the Salt-Marsh Estuaries of Sapelo Island, Georgia. Limnol. Oceanogr. 1987, 32, 1195–1213. [Google Scholar] [CrossRef]
  99. Cole, M.L.; Kroeger, K.D.; Mcclelland, J.W.; Valiela, I. Effects of Watershed Land Use on Nitrogen Concentrations and Δ15 Nitrogen in Groundwater. Biogeochemistry 2006, 77, 199–215. [Google Scholar] [CrossRef]
  100. Groult, B.; Bredin, P.; Lazar, C.S. Ecological Processes Differ in Community Assembly of Archaea, Bacteria and Eukaryotes in a Biogeographical Survey of Groundwater Habitats in the Quebec Region (Canada). Environ. Microbiol. 2022, 24, 5898–5910. [Google Scholar] [CrossRef]
  101. Kurtbӧke, D.İ. Ecology and Habitat Distribution of Actinobacteria. In Biology and Biotechnology of Actinobacteria; Wink, J., Mohammadipanah, F., Hamedi, J., Eds.; Springer International Publishing: Cham, 2017; pp. 123–149; ISBN 978-3-319-60339-1. [Google Scholar]
  102. Sun, J.-Q.; Xu, L.; Guo, Y.; Li, W.-L.; Shao, Z.-Q.; Yang, Y.-L.; Wu, X.-L. Kribbella Deserti Sp. Nov., Isolated from Rhizosphere Soil of Ammopiptanthus Mongolicus. Int. J. Syst. Evol. Microbiol. 2017, 67, 692–696. [Google Scholar] [CrossRef] [PubMed]
  103. Ozdemir-Kocak, F.; Isik, K.; Saricaoglu, S.; Saygin, H.; Inan-Bektas, K.; Cetin, D.; Guven, K.; Sahin, N. Kribbella Sindirgiensis Sp. Nov. Isolated from Soil. Arch. Microbiol. 2017, 199, 1399–1407. [Google Scholar] [CrossRef] [PubMed]
  104. Ozdemir-Kocak, F.; Saygin, H.; Saricaoglu, S.; Cetin, D.; Guven, K.; Spröer, C.; Schumann, P.; Klenk, H.-P.; Sahin, N.; Isik, K. Kribbella Soli Sp. Nov., Isolated from Soil. Antonie Van Leeuwenhoek 2017, 110, 641–649. [Google Scholar] [CrossRef] [PubMed]
  105. Park, Y.; Liu, Q.; Maeng, S.; Choi, W.J.; Chang, Y.; Im, W.-T. Nocardioides Convexus Sp. Nov. and Nocardioides Anomalus Sp. Nov., Isolated from Soil and Mineral Water. Int. J. Syst. Evol. Microbiol. 2020, 70, 6402–6407. [Google Scholar] [CrossRef] [PubMed]
  106. Meyers, P.R. Kribbella. In Bergey’s Manual of Systematics of Archaea and Bacteria; John Wiley & Sons, Ltd, 2021; pp. 1–41 ISBN 978-1-118-96060-8.
  107. Yoon, J.-H.; Park, Y.-H. The Genus Nocardioides. In The Prokaryotes: Volume 3: Archaea. Bacteria: Firmicutes, Actinomycetes; Dworkin, M., Falkow, S., Rosenberg, E., Schleifer, K.-H., Stackebrandt, E., Eds.; Springer: New York, NY, 2006; pp. 1099–1113; ISBN 978-0-387-30743-5. [Google Scholar]
  108. Walsh, C.M.; Gebert, M.J.; Delgado-Baquerizo, M.; Maestre, F.T.; Fierer, N. A Global Survey of Mycobacterial Diversity in Soil. Appl. Environ. Microbiol. 2019, 85, e01180–19. [Google Scholar] [CrossRef] [PubMed]
  109. Schleper, C.; Nicol, G.W. Ammonia-Oxidising Archaea – Physiology, Ecology and Evolution. In Advances in Microbial Physiology; Elsevier, 2010; Vol. 57, pp. 1–41 ISBN 978-0-12-381045-8.
  110. Ochsenreiter, T.; Selezi, D.; Quaiser, A.; Bonch-Osmolovskaya, L.; Schleper, C. Diversity and Abundance of Crenarchaeota in Terrestrial Habitats Studied by 16S RNA Surveys and Real Time PCR. Environ. Microbiol. 2003, 5, 787–797. [Google Scholar] [CrossRef] [PubMed]
  111. Lazar, C.S.; Stoll, W.; Lehmann, R.; Herrmann, M.; Schwab, V.F.; Akob, D.M.; Nawaz, A.; Wubet, T.; Buscot, F.; Totsche, K.-U.; et al. Archaeal Diversity and CO2 Fixers in Carbonate-/Siliciclastic-Rock Groundwater Ecosystems. Archaea 2017, 2017, 1–13. [Google Scholar] [CrossRef] [PubMed]
  112. Brochier-Armanet, C.; Boussau, B.; Gribaldo, S.; Forterre, P. Mesophilic Crenarchaeota: Proposal for a Third Archaeal Phylum, the Thaumarchaeota. Nat. Rev. Microbiol. 2008, 6, 245–252. [Google Scholar] [CrossRef]
  113. Könneke, M.; Schubert, D.M.; Brown, P.C.; Hügler, M.; Standfest, S.; Schwander, T.; Schada Von Borzyskowski, L.; Erb, T.J.; Stahl, D.A.; Berg, I.A. Ammonia-Oxidizing Archaea Use the Most Energy-Efficient Aerobic Pathway for CO2 Fixation. Proc. Natl. Acad. Sci. 2014, 111, 8239–8244. [Google Scholar] [CrossRef]
  114. Kozlowski, J.A.; Stieglmeier, M.; Schleper, C.; Klotz, M.G.; Stein, L.Y. Pathways and Key Intermediates Required for Obligate Aerobic Ammonia-Dependent Chemolithotrophy in Bacteria and Thaumarchaeota. ISME J. 2016, 10, 1836–1845. [Google Scholar] [CrossRef] [PubMed]
  115. Zhang, L.-M.; Offre, P.R.; He, J.-Z.; Verhamme, D.T.; Nicol, G.W.; Prosser, J.I. Autotrophic Ammonia Oxidation by Soil Thaumarchaea. Proc. Natl. Acad. Sci. 2010, 107, 17240–17245. [Google Scholar] [CrossRef] [PubMed]
  116. Kerou, M.; Schleper, C. Nitrososphaeraceae. In Bergey’s Manual of Systematics of Archaea and Bacteria; John Wiley & Sons, Ltd, 2016; pp. 1–2 ISBN 978-1-118-96060-8.
  117. Cheng, X.; Xiang, X.; Yun, Y.; Wang, W.; Wang, H.; Bodelier, P.L.E. Archaea and Their Interactions with Bacteria in a Karst Ecosystem. Front. Microbiol. 2023, 14, 1068595. [Google Scholar] [CrossRef] [PubMed]
  118. Wang, J.; Wang, D.; Wang, B. Soil Bacterial Diversity and Its Determinants in the Riparian Zone of the Lijiang River, China. Curr. Sci. 2019, 117, 1324–1332. [Google Scholar] [CrossRef]
  119. Wu, F.; Zhang, Y.; He, D.; Gu, J.-D.; Guo, Q.; Liu, X.; Duan, Y.; Zhao, J.; Wang, W.; Feng, H. Community Structures of Bacteria and Archaea Associated with the Biodeterioration of Sandstone Sculptures at the Beishiku Temple. Int. Biodeterior. Biodegrad. 2021, 164, 105290. [Google Scholar] [CrossRef]
  120. Sauder, L.A.; Albertsen, M.; Engel, K.; Schwarz, J.; Nielsen, P.H.; Wagner, M.; Neufeld, J.D. Cultivation and Characterization of Candidatus Nitrosocosmicus Exaquare, an Ammonia-Oxidizing Archaeon from a Municipal Wastewater Treatment System. ISME J. 2017, 11, 1142–1157. [Google Scholar] [CrossRef] [PubMed]
  121. Liu, L.; Liu, M.; Jiang, Y.; Lin, W.; Luo, J. Production and Excretion of Polyamines To Tolerate High Ammonia, a Case Study on Soil Ammonia-Oxidizing Archaeon “Candidatus Nitrosocosmicus Agrestis. ” mSystems 2021, 6. [Google Scholar] [CrossRef]
  122. Lehtovirta-Morley, L.E.; Ross, J.; Hink, L.; Weber, E.B.; Gubry-Rangin, C.; Thion, C.; Prosser, J.I.; Nicol, G.W. Isolation of “Candidatus Nitrosocosmicus Franklandus”, a Novel Ureolytic Soil Archaeal Ammonia Oxidiser with Tolerance to High Ammonia Concentration. FEMS Microbiol. Ecol. 2016, 92, fiw057. [Google Scholar] [CrossRef]
  123. Medina, M.; Collins, A.G.; Taylor, J.W.; Valentine, J.W.; Lipps, J.H.; Amaral-Zettler, L.; Sogin, M.L. Phylogeny of Opisthokonta and the Evolution of Multicellularity and Complexity in Fungi and Metazoa. Int. J. Astrobiol. 2003, 2, 203–211. [Google Scholar] [CrossRef]
  124. Bik, H.M. Microbial Metazoa Are Microbes Too. mSystems 2019, 4. [Google Scholar] [CrossRef] [PubMed]
  125. Burki, F.; Shalchian-Tabrizi, K.; Minge, M.; Skjæveland, Å.; Nikolaev, S.I.; Jakobsen, K.S.; Pawlowski, J. Phylogenomics Reshuffles the Eukaryotic Supergroups. PLoS ONE 2007, 2, e790. [Google Scholar] [CrossRef] [PubMed]
  126. Strassert, J.F.H.; Jamy, M.; Mylnikov, A.P.; Tikhonenkov, D.V.; Burki, F. New Phylogenomic Analysis of the Enigmatic Phylum Telonemia Further Resolves the Eukaryote Tree of Life. Mol. Biol. Evol. 2019, 36, 757–765. [Google Scholar] [CrossRef] [PubMed]
  127. Grattepanche, J.; Walker, L.M.; Ott, B.M.; Paim Pinto, D.L.; Delwiche, C.F.; Lane, C.E.; Katz, L.A. Microbial Diversity in the Eukaryotic SAR Clade: Illuminating the Darkness Between Morphology and Molecular Data. BioEssays 2018, 40, 1700198. [Google Scholar] [CrossRef] [PubMed]
  128. Egidi, E.; Delgado-Baquerizo, M.; Plett, J.M.; Wang, J.; Eldridge, D.J.; Bardgett, R.D.; Maestre, F.T.; Singh, B.K. A Few Ascomycota Taxa Dominate Soil Fungal Communities Worldwide. Nat. Commun. 2019, 10, 2369. [Google Scholar] [CrossRef] [PubMed]
  129. Tedersoo, L.; Bahram, M.; Põlme, S.; Kõljalg, U.; Yorou, N.S.; Wijesundera, R.; Ruiz, L.V.; Vasco-Palacios, A.M.; Thu, P.Q.; Suija, A.; et al. Global Diversity and Geography of Soil Fungi. Science 2014, 346, 1256688. [Google Scholar] [CrossRef] [PubMed]
  130. Pfister, D.H.; Healy, R. Pezizomycetes. In Encyclopedia of Mycology; Zaragoza, Ó., Casadevall, A., Eds.; Elsevier, 2021; pp. 295–309 ISBN 978-0-323-85180-0.
  131. Foissner, W.; Agatha, S.; Berger, H. Soil Ciliates (Protozoa, Ciliophora) from Namibia (Southwest Africa), with Emphasis on Two Contrasting Environments, the Etosha Region and the Namib Desert. Part I: Text and Line Drawings. Part II: Photographs. PLUS Res. Denisia 2002, 5. [Google Scholar]
  132. Li, B.; Song, Y.; Hao, T.; Wang, L.; Zheng, W.; Lyu, Z.; Chen, Y.; Pan, X. Insights into the Phylogeny of the Ciliate of Class Colpodea Based on Multigene Data. Ecol. Evol. 2022, 12, e9380. [Google Scholar] [CrossRef] [PubMed]
  133. Amossé, J.; Dózsa-Farkas, K.; Boros, G.; Rochat, G.; Sandoz, G.; Fournier, B.; Mitchell, E.A.D.; Le Bayon, R.-C. Patterns of Earthworm, Enchytraeid and Nematode Diversity and Community Structure in Urban Soils of Different Ages. Eur. J. Soil Biol. 2016, 73, 46–58. [Google Scholar] [CrossRef]
  134. Yan, L.; Herrmann, M.; Kampe, B.; Lehmann, R.; Totsche, K.U.; Küsel, K. Environmental Selection Shapes the Formation of Near-Surface Groundwater Microbiomes. Water Res. 2020, 170, 115341. [Google Scholar] [CrossRef] [PubMed]
  135. Lehosmaa, K.; Muotka, T.; Pirttilä, A.M.; Jaakola, I.; Rossi, P.M.; Jyväsjärvi, J. Bacterial Communities at a Groundwater-surface Water Ecotone: Gradual Change or Abrupt Transition Points along a Contamination Gradient? Environ. Microbiol. 2021, 23, 6694–6706. [Google Scholar] [CrossRef] [PubMed]
  136. Jousset, A.; Bienhold, C.; Chatzinotas, A.; Gallien, L.; Gobet, A.; Kurm, V.; Küsel, K.; Rillig, M.C.; Rivett, D.W.; Salles, J.F.; et al. Where Less May Be More: How the Rare Biosphere Pulls Ecosystems Strings. ISME J. 2017, 11, 853–862. [Google Scholar] [CrossRef] [PubMed]
  137. Xue, W.; Huang, L.; Yu, F.-H. Increasing Soil Configurational Heterogeneity Promotes Plant Community Evenness through Equalizing Differences in Competitive Ability. Sci. Total Environ. 2021, 750, 142308. [Google Scholar] [CrossRef] [PubMed]
  138. Hillebrand, H.; Bennett, D.M.; Cadotte, M.W. Consequences of Dominance: A Review of Evenness Effects on Local and Regional Ecosystem Processes. Ecology 2008, 89, 1510–1520. [Google Scholar] [CrossRef] [PubMed]
  139. Zhu, H.-Z.; Zhang, Z.-F.; Zhou, N.; Jiang, C.-Y.; Wang, B.-J.; Cai, L.; Liu, S.-J. Diversity, Distribution and Co-Occurrence Patterns of Bacterial Communities in a Karst Cave System. Front. Microbiol. 2019, 10, 1726. [Google Scholar] [CrossRef] [PubMed]
  140. Vellend, M. Conceptual Synthesis in Community Ecology. Q. Rev. Biol. 2010, 85, 183–206. [Google Scholar] [CrossRef] [PubMed]
  141. Nemergut, D.R.; Schmidt, S.K.; Fukami, T.; O’Neill, S.P.; Bilinski, T.M.; Stanish, L.F.; Knelman, J.E.; Darcy, J.L.; Lynch, R.C.; Wickey, P.; et al. Patterns and Processes of Microbial Community Assembly. Microbiol. Mol. Biol. Rev. 2013, 77, 342–356. [Google Scholar] [CrossRef] [PubMed]
  142. Wang, J.; Shen, J.; Wu, Y.; Tu, C.; Soininen, J.; Stegen, J.C.; He, J.; Liu, X.; Zhang, L.; Zhang, E. Phylogenetic Beta Diversity in Bacterial Assemblages across Ecosystems: Deterministic versus Stochastic Processes. ISME J. 2013, 7, 1310–1321. [Google Scholar] [CrossRef] [PubMed]
  143. Lozupone, C.A.; Hamady, M.; Kelley, S.T.; Knight, R. Quantitative and Qualitative β Diversity Measures Lead to Different Insights into Factors That Structure Microbial Communities. Appl. Environ. Microbiol. 2007, 73, 1576–1585. [Google Scholar] [CrossRef] [PubMed]
  144. Auguet, J.-C.; Barberan, A.; Casamayor, E.O. Global Ecological Patterns in Uncultured Archaea. ISME J. 2010, 4, 182–190. [Google Scholar] [CrossRef] [PubMed]
  145. Fillinger, L.; Hug, K.; Griebler, C. Selection Imposed by Local Environmental Conditions Drives Differences in Microbial Community Composition across Geographically Distinct Groundwater Aquifers. FEMS Microbiol. Ecol. 2019, 95, fiz160. [Google Scholar] [CrossRef] [PubMed]
  146. Stegen, J.C.; Lin, X.; Fredrickson, J.K.; Konopka, A.E. Estimating and Mapping Ecological Processes Influencing Microbial Community Assembly. Front. Microbiol. 2015, 6. [Google Scholar] [CrossRef] [PubMed]
  147. Dini-Andreote, F.; Stegen, J.C.; Van Elsas, J.D.; Salles, J.F. Disentangling Mechanisms That Mediate the Balance between Stochastic and Deterministic Processes in Microbial Succession. Proc. Natl. Acad. Sci. 2015, 112. [Google Scholar] [CrossRef]
  148. Allen, R.; Hoffmann, L.J.; Larcombe, M.J.; Louisson, Z.; Summerfield, T.C. Homogeneous Environmental Selection Dominates Microbial Community Assembly in the Oligotrophic South Pacific Gyre. Mol. Ecol. 2020, 29, 4680–4691. [Google Scholar] [CrossRef] [PubMed]
  149. Li, Y.; Gao, Y.; Zhang, W.; Wang, C.; Wang, P.; Niu, L.; Wu, H. Homogeneous Selection Dominates the Microbial Community Assembly in the Sediment of the Three Gorges Reservoir. Sci. Total Environ. 2019, 690, 50–60. [Google Scholar] [CrossRef] [PubMed]
  150. Barns, S.M.; Cain, E.C.; Sommerville, L.; Kuske, C.R. Acidobacteria Phylum Sequences in Uranium-Contaminated Subsurface Sediments Greatly Expand the Known Diversity within the Phylum. Appl. Environ. Microbiol. 2007, 73, 3113–3116. [Google Scholar] [CrossRef] [PubMed]
  151. Ma, L.; Huang, X.; Wang, H.; Yun, Y.; Cheng, X.; Liu, D.; Lu, X.; Qiu, X. Microbial Interactions Drive Distinct Taxonomic and Potential Metabolic Responses to Habitats in Karst Cave Ecosystem. Microbiol. Spectr. 2021, 9, e01152–21. [Google Scholar] [CrossRef] [PubMed]
  152. Bian, Q.; Wang, X.; Bao, X.; Zhu, L.; Xie, Z.; Che, Z.; Sun, B. Exogenous Substrate Quality Determines the Dominant Keystone Taxa Linked to Carbon Mineralization: Evidence from a 30-Year Experiment. Soil Biol. Biochem. 2022, 169, 108683. [Google Scholar] [CrossRef]
  153. Bar-Or, I.; Ben-Dov, E.; Kushmaro, A.; Eckert, W.; Sivan, O. Methane-Related Changes in Prokaryotes along Geochemical Profiles in Sediments of Lake Kinneret (Israel). Biogeosciences 2015, 12, 2847–2860. [Google Scholar] [CrossRef]
  154. Grenier, V.; Laur, J.; Gonzalez, E.; Pitre, F.E. Glyphosate Has a Negligible Impact on Bacterial Diversity and Dynamics during Composting. Environ. Microbiol. 2023, 25, 2897–2912. [Google Scholar] [CrossRef] [PubMed]
  155. Nkamga, V.D.; Drancourt, M. Methanomassiliicoccales. In Bergey’s Manual of Systematics of Archaea and Bacteria; John Wiley & Sons, Ltd, 2016; pp. 1–2 ISBN 978-1-118-96060-8.
  156. Ai, J.; Guo, J.; Li, Y.; Zhong, X.; Lv, Y.; Li, J.; Yang, A. The Diversity of Microbes and Prediction of Their Functions in Karst Caves under the Influence of Human Tourism Activities—a Case Study of Zhijin Cave in Southwest China. Environ. Sci. Pollut. Res. 2022, 29, 25858–25868. [Google Scholar] [CrossRef]
  157. Mammola, S.; Isaia, M. Spiders in Caves. Proc. R. Soc. B Biol. Sci. 2017, 284, 20170193. [Google Scholar] [CrossRef]
  158. Parimuchová, A.; Dušátková, L.P.; Kováč, Ľ.; Macháčková, T.; Slabý, O.; Pekár, S. The Food Web in a Subterranean Ecosystem Is Driven by Intraguild Predation. Sci. Rep. 2021, 11, 4994. [Google Scholar] [CrossRef]
  159. Thomas, F.; Hehemann, J.-H.; Rebuffet, E.; Czjzek, M.; Michel, G. Environmental and Gut Bacteroidetes: The Food Connection. Front. Microbiol. 2011, 2, 93. [Google Scholar] [CrossRef] [PubMed]
  160. Song, Y.; Mao, G.; Gao, G.; Bartlam, M.; Wang, Y. Structural and Functional Changes of Groundwater Bacterial Community During Temperature and pH Disturbances. Microb. Ecol. 2019, 78, 428–445. [Google Scholar] [CrossRef] [PubMed]
  161. Rangseekaew, P.; Pathom-aree, W. Cave Actinobacteria as Producers of Bioactive Metabolites. Front. Microbiol. 2019, 10, 387. [Google Scholar] [CrossRef] [PubMed]
  162. Montano, E.T.; Henderson, L.O. Studies of Antibiotic Production by Cave Bacteria. In Cave Microbiomes: A Novel Resource for Drug Discovery; Cheeptham, N., Ed.; SpringerBriefs in Microbiology; Springer: New York, NY, 2013; Vol. 1 ; ISBN 978-1-4614-5205-8. [Google Scholar]
  163. Bernhard, A.E.; Field, K.G. A PCR Assay To Discriminate Human and Ruminant Feces on the Basis of Host Differences in Bacteroides-Prevotella Genes Encoding 16S rRNA. Appl. Environ. Microbiol. 2000, 66, 4571–4574. [Google Scholar] [CrossRef] [PubMed]
  164. Allsop, K.; Stickler, D. j. An Assessment of Bacteroides Fragilis Group Organisms as Indicators of Human Faecal Pollution. J. Appl. Bacteriol. 1985, 58, 95–99. [Google Scholar] [CrossRef] [PubMed]
  165. Hahn, M.W.; Kasalický, V.; Jezbera, J.; Brandt, U.; Jezberová, J.; Šimek, K. Limnohabitans Curvus Gen. Nov., Sp. Nov., a Planktonic Bacterium Isolated from a Freshwater Lake. Int. J. Syst. Evol. Microbiol. 2010, 60, 1358–1365. [Google Scholar] [CrossRef] [PubMed]
  166. Jezberová, J.; Jezbera, J.; Znachor, P.; Nedoma, J.; Kasalický, V.; Šimek, K. The Limnohabitans Genus Harbors Generalistic and Opportunistic Subtypes: Evidence from Spatiotemporal Succession in a Canyon-Shaped Reservoir. Appl. Environ. Microbiol. 2017, 83, e01530–17. [Google Scholar] [CrossRef] [PubMed]
  167. Pearman, J.K.; Thomson-Laing, G.; Thomson-Laing, J.; Thompson, L.; Waters, S.; Reyes, L.; Howarth, J.D.; Vandergoes, M.J.; Wood, S.A. The Role of Environmental Processes and Geographic Distance in Regulating Local and Regionally Abundant and Rare Bacterioplankton in Lakes. Front. Microbiol. 2022, 12, 793441. [Google Scholar] [CrossRef] [PubMed]
  168. Kang, I.; Kim, S.; Islam, Md.R.; Cho, J.-C. The First Complete Genome Sequences of the acI Lineage, the Most Abundant Freshwater Actinobacteria, Obtained by Whole-Genome-Amplification of Dilution-to-Extinction Cultures. Sci. Rep. 2017, 7, 42252. [Google Scholar] [CrossRef]
  169. Chen, F.; Koh, X.P.; Tang, M.L.Y.; Gan, J.; Lau, S.C.K. Microbiological Assessment of Ecological Status in the Pearl River Estuary, China. Ecol. Indic. 2021, 130, 108084. [Google Scholar] [CrossRef]
  170. Van Grinsven, S.; Sinninghe Damsté, J.S.; Harrison, J.; Polerecky, L.; Villanueva, L. Nitrate Promotes the Transfer of Methane-derived Carbon from the Methanotroph Methylobacter Sp. to the Methylotroph Methylotenera Sp. in Eutrophic Lake Water. Limnol. Oceanogr. 2021, 66, 878–891. [Google Scholar] [CrossRef]
  171. Chen, L.-X.; Méndez-García, C.; Dombrowski, N.; Servín-Garcidueñas, L.E.; Eloe-Fadrosh, E.A.; Fang, B.-Z.; Luo, Z.-H.; Tan, S.; Zhi, X.-Y.; Hua, Z.-S.; et al. Metabolic Versatility of Small Archaea Micrarchaeota and Parvarchaeota. ISME J. 2018, 12, 756–775. [Google Scholar] [CrossRef] [PubMed]
  172. Mironov, V.; Vanteeva, A.; Merkel, A. Microbiological Activity during Co-Composting of Food and Agricultural Waste for Soil Amendment. Agronomy 2021, 11, 928. [Google Scholar] [CrossRef]
  173. Corsaro, D.; Walochnik, J.; Venditti, D.; Hauröder, B.; Michel, R. Solving an Old Enigma: Morellospora Saccamoebae Gen. Nov., Sp. Nov. (Rozellomycota), a Sphaerita-like Parasite of Free-Living Amoebae. Parasitol. Res. 2020, 119, 925–934. [Google Scholar] [CrossRef] [PubMed]
  174. Sisson, C.; Gulla-Devaney, B.; Katz, L.A.; Grattepanche, J.-D. Seed Bank and Seasonal Patterns of the Eukaryotic SAR (Stramenopila, Alveolata and Rhizaria) Clade in a New England Vernal Pool. J. Plankton Res. 2018, 40, 376–390. [Google Scholar] [CrossRef]
  175. Herrmann, M.; Wegner, C.-E.; Taubert, M.; Geesink, P.; Lehmann, K.; Yan, L.; Lehmann, R.; Totsche, K.U.; Küsel, K. Predominance of Cand. Patescibacteria in Groundwater Is Caused by Their Preferential Mobilization From Soils and Flourishing Under Oligotrophic Conditions. Front. Microbiol. 2019, 10, 1407. [Google Scholar] [CrossRef] [PubMed]
  176. Tian, R.; Ning, D.; He, Z.; Zhang, P.; Spencer, S.J.; Gao, S.; Shi, W.; Wu, L.; Zhang, Y.; Yang, Y.; et al. Small and Mighty: Adaptation of Superphylum Patescibacteria to Groundwater Environment Drives Their Genome Simplicity. Microbiome 2020, 8, 51. [Google Scholar] [CrossRef] [PubMed]
  177. Gios, E.; Mosley, O.E.; Takeuchi, N.; Handley, K.M. Genetic Exchange Shapes Ultra-Small Patescibacteria Metabolic Capacities in the Terrestrial Subsurface 2022.
  178. Nakai, R. Size Matters: Ultra-Small and Filterable Microorganisms in the Environment. Microbes Environ. 2020, 35, n. [Google Scholar] [CrossRef] [PubMed]
  179. Li, Q.-M.; Zhou, Y.-L.; Wei, Z.-F.; Wang, Y. Phylogenomic Insights into Distribution and Adaptation of Bdellovibrionota in Marine Waters. Microorganisms 2021, 9, 757. [Google Scholar] [CrossRef] [PubMed]
  180. Sockett, R.E. Predatory Lifestyle of Bdellovibrio Bacteriovorus. Annu. Rev. Microbiol. 2009, 63, 523–539. [Google Scholar] [CrossRef] [PubMed]
  181. Williams, H.N.; Chen, H. Environmental Regulation of the Distribution and Ecology of Bdellovibrio and Like Organisms. Front. Microbiol. 2020, 11, 545070. [Google Scholar] [CrossRef] [PubMed]
  182. Paix, B.; Ezzedine, J.A.; Jacquet, S. Diversity, Dynamics, and Distribution of Bdellovibrio and Like Organisms in Perialpine Lakes. Appl. Environ. Microbiol. 2019, 85, e02494–18. [Google Scholar] [CrossRef] [PubMed]
  183. Mehrshad, M.; Lopez-Fernandez, M.; Sundh, J.; Bell, E.; Simone, D.; Buck, M.; Bernier-Latmani, R.; Bertilsson, S.; Dopson, M. Energy Efficiency and Biological Interactions Define the Core Microbiome of Deep Oligotrophic Groundwater. Nat. Commun. 2021, 12, 4253. [Google Scholar] [CrossRef]
  184. Wurch, L.; Giannone, R.J.; Belisle, B.S.; Swift, C.; Utturkar, S.; Hettich, R.L.; Reysenbach, A.-L.; Podar, M. Genomics-Informed Isolation and Characterization of a Symbiotic Nanoarchaeota System from a Terrestrial Geothermal Environment. Nat. Commun. 2016, 7, 12115. [Google Scholar] [CrossRef] [PubMed]
  185. Huber, H.; Hohn, M.J.; Rachel, R.; Fuchs, T.; Wimmer, V.C.; Stetter, K.O. A New Phylum of Archaea Represented by a Nanosized Hyperthermophilic Symbiont. Nature 2002, 417, 63–67. [Google Scholar] [CrossRef] [PubMed]
  186. Casanueva, A.; Galada, N.; Baker, G.C.; Grant, W.D.; Heaphy, S.; Jones, B.; Yanhe, M.; Ventosa, A.; Blamey, J.; Cowan, D.A. Nanoarchaeal 16S rRNA Gene Sequences Are Widely Dispersed in Hyperthermophilic and Mesophilic Halophilic Environments. Extremophiles 2008, 12, 651–656. [Google Scholar] [CrossRef] [PubMed]
  187. Mardanov, A.V.; Gumerov, V.M.; Beletsky, A.V.; Ravin, N.V. Microbial Diversity in Acidic Thermal Pools in the Uzon Caldera, Kamchatka. Antonie Van Leeuwenhoek 2018, 111, 35–43. [Google Scholar] [CrossRef] [PubMed]
  188. Jarett, J.K.; Nayfach, S.; Podar, M.; Inskeep, W.; Ivanova, N.N.; Munson-McGee, J.; Schulz, F.; Young, M.; Jay, Z.J.; Beam, J.P.; et al. Single-Cell Genomics of Co-Sorted Nanoarchaeota Suggests Novel Putative Host Associations and Diversification of Proteins Involved in Symbiosis. Microbiome 2018, 6, 161. [Google Scholar] [CrossRef] [PubMed]
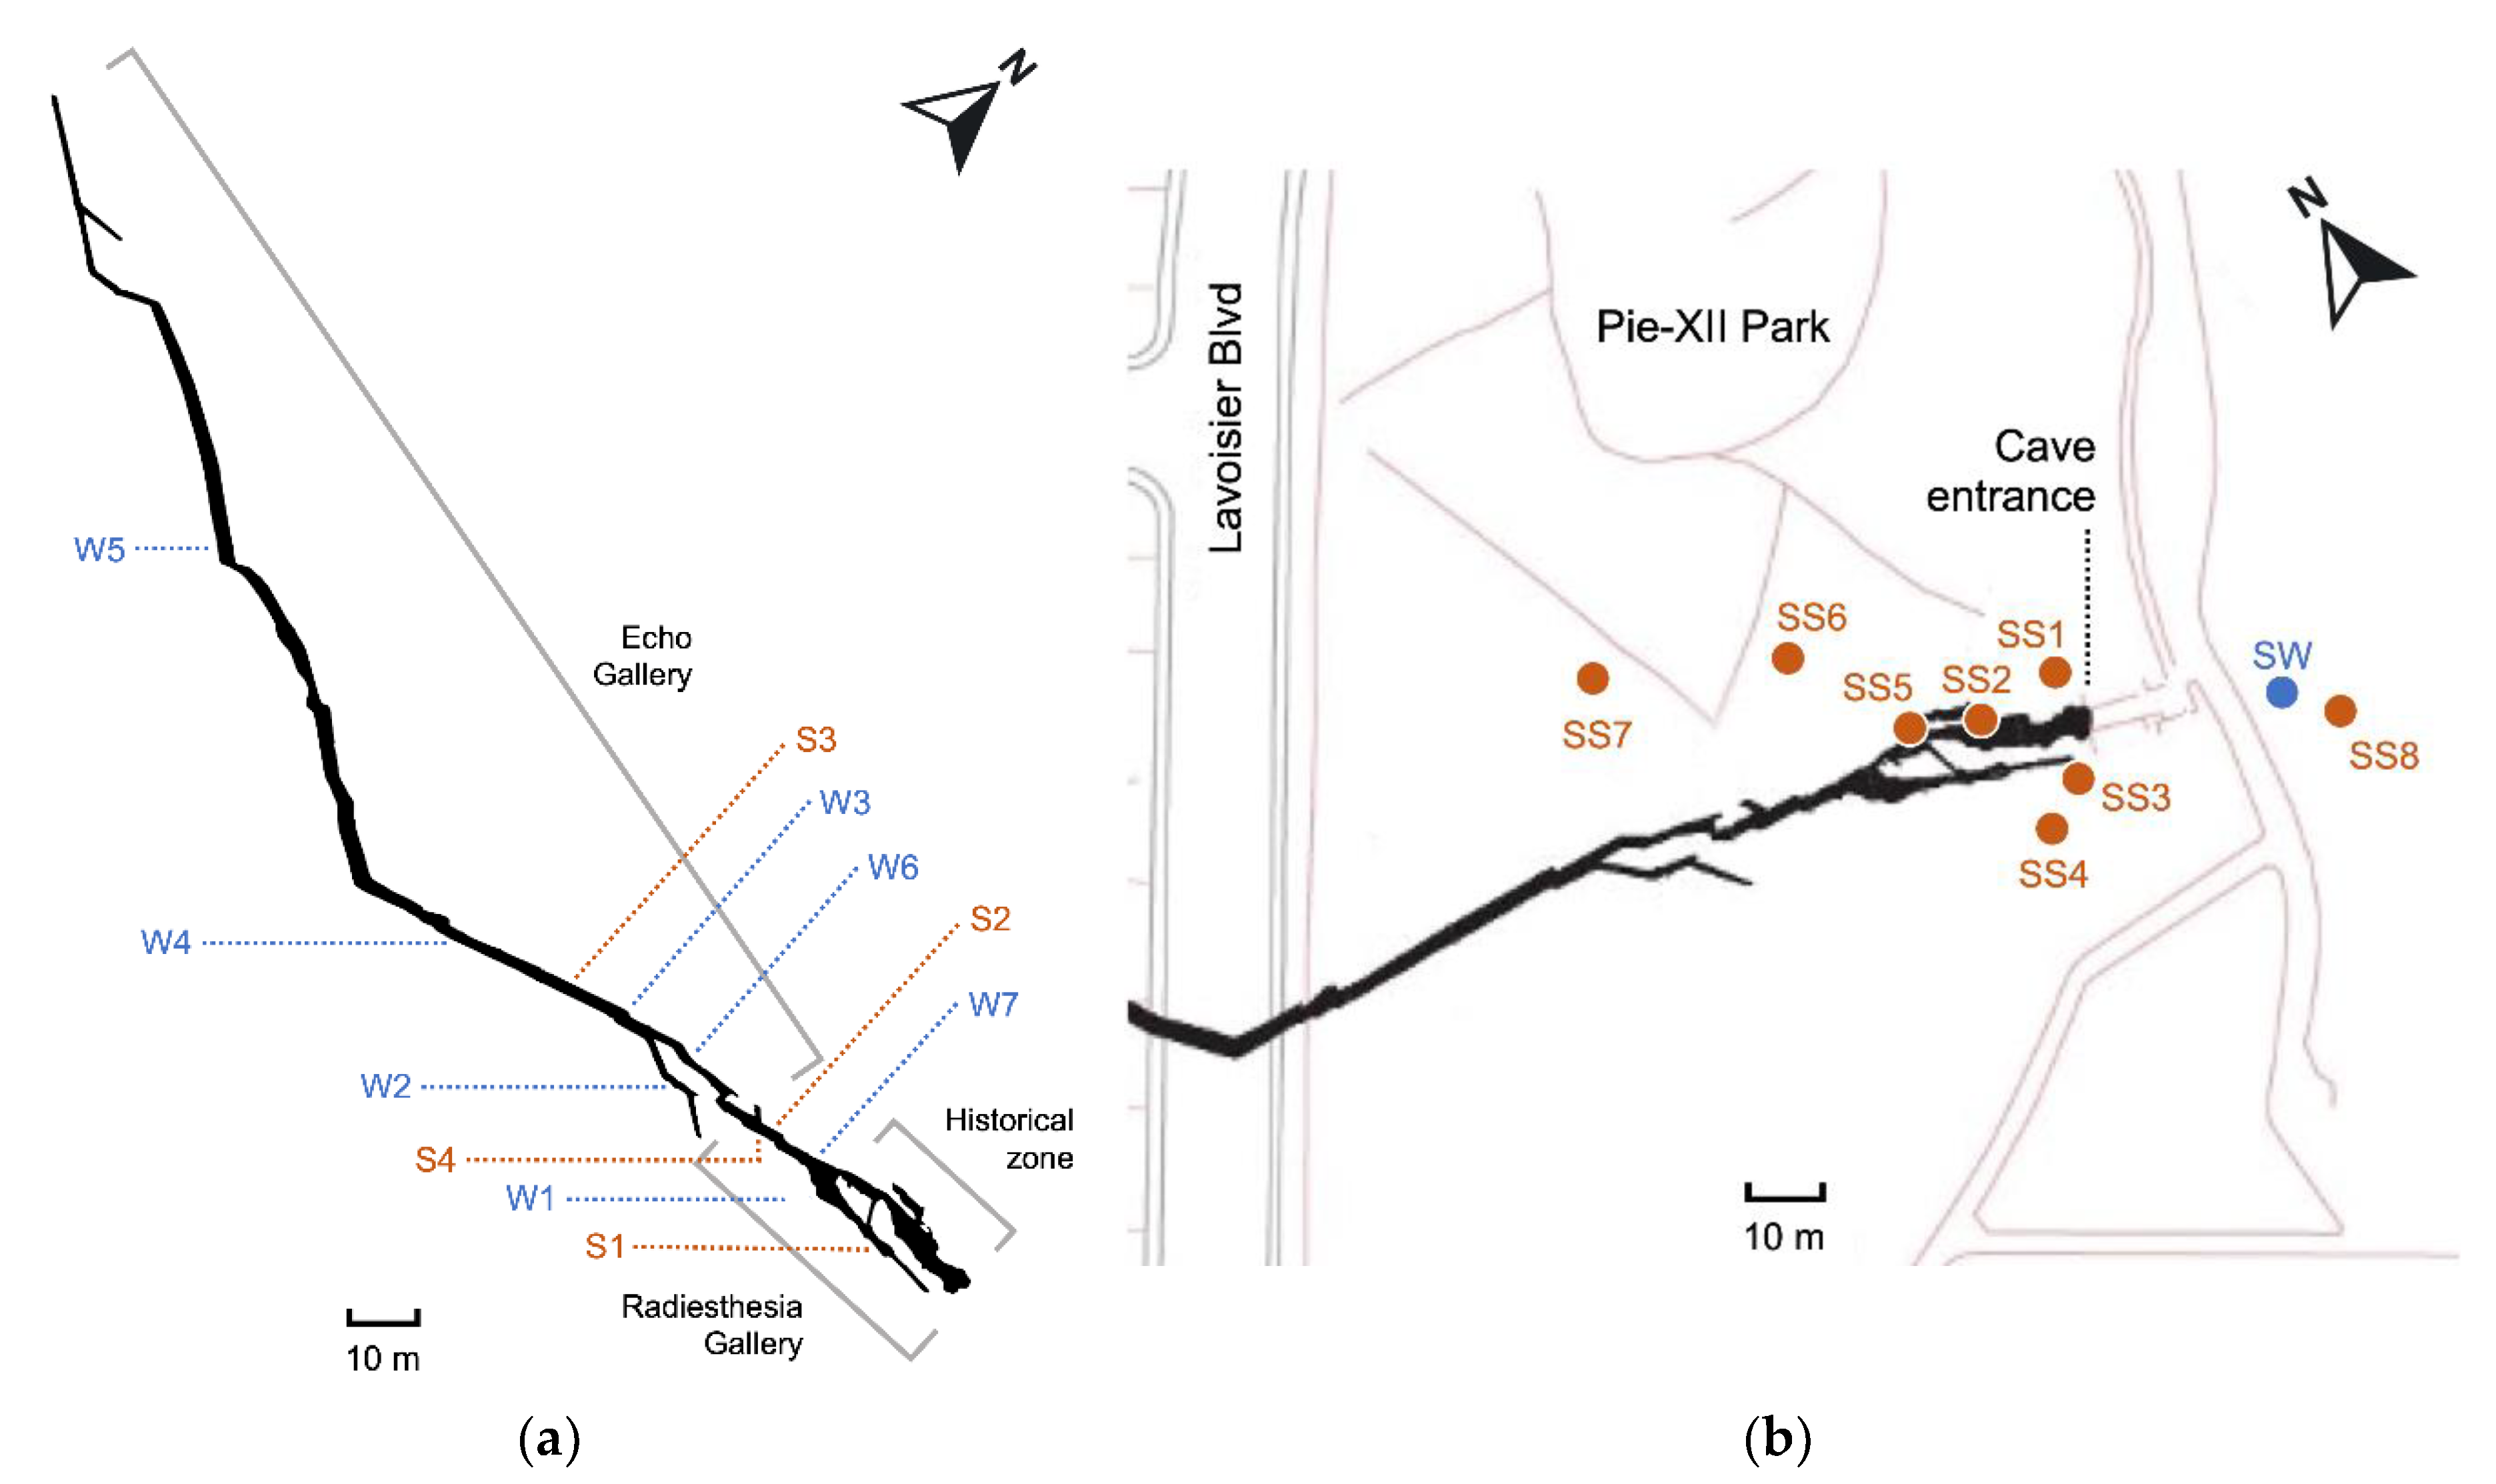
Figure 1. Location of the water (W) and sediment (S) samples inside the Saint-Leonard cave (a), and of the surface soil (SS) and surface water (SW) samples outside the cave in the Pie-XII Park (b).
Preprints 113697 g001
Figure 2. Taxonomical identification of the 16S rRNA gene sequences for the Bacteria domain, at the phylum level (a), and genus level (b). SS, surface soils; S, sediments; W#-1, water, 0.1 µm; W#-2, water 0.2 µm; SW, surface water.
Preprints 113697 g002
Figure 3. Taxonomical identification of the 16S rRNA gene sequences for the Archaea domain, at the phylum level (a), and genus level (b). SS, surface soils; S, sediments; W#-1, water, 0.1 µm; W#-2, water 0.2 µm; SW, surface water.
Preprints 113697 g003
Figure 4. Taxonomical identification of the 18S rRNA gene sequences for the Eukaryote domain, at the phylum level (a), and genus level (b). SS, surface soils; S, sediments; W#-2, water 0.2 µm; SW, surface water.
Preprints 113697 g004
Figure 5. Principal Coordinates Analysis (PCoA) ordination of bacterial (a), archaeal (b), and eukaryote (c) community composition based on a Bray-Curtis dissimilarity matrix. Percentages indicate proportion of variance explained for the first 2 axes. Ellipses show 95% confidence intervals by habitat.
Preprints 113697 g005aPreprints 113697 g005b
Figure 6. Linear discriminant analysis (LDA) score showing genera significantly higher for each habitat (log LDA score ≥ 3.5, p < 0.05), for the Bacteria (a), Archaea (b), and Eukaryotes (c).
Preprints 113697 g006aPreprints 113697 g006b
Figure 7. Microbial source tracking for the Bacteria, using FEAST, for the cave sediment communities (a), cave 0.2 µm water communities (b), and cave 0.1 µm water communities (c). SW, surface water; SS, surface soils; S, sediments; W#-2, water 0.2 µm; W#-1, water µm.
Preprints 113697 g007
Figure 8. Microbial source tracking for the Archaea, using FEAST, for the cave sediment communities (a), cave 0.2 µm water communities (b), and cave 0.1 µm water communities (c). SW, surface water; SS, surface soils; S, sediments; W#-2, water 0.2 µm; W#-1, water µm.
Preprints 113697 g008
Figure 9. Microbial source tracking for the Eukaryotes, using FEAST, for the cave sediment communities (a), and cave 0.2 µm water communities (b). SW, surface water; SS, surface soils; S, sediments; W#-2, water 0.2 µm.
Preprints 113697 g009
Table 1. Groundwater geo- and physicochemical properties. All parameters apart from pH are expressed in mg/L. DOC, dissolved organic carbon; DIC, dissolved inorganic carbon; NHx, ammonia/ammoniac.
Water samples pH DOC DIC NHx NO2- NO3-
Radiesthesia
W1 7.8 1.7 46.81 0.0715 0.01 2.43
W7 7.4 1.6 43.89 0.0235 0.01 2.42
Echo
W2 7.5 1.67 46.11 0.0325 0.01 2.43
W3 7.6 1.59 48.22 0.0275 0.01 2.44
W4 7.5 1.82 45.09 0.0275 0.01 2.42
W5 7.5 1.57 46.72 0.022 0.01 2.43
W6 7.5 1.53 45.13 0.027 0.01 2.45
Table 2. Cave sediment and external surface soil properties. All parameters apart from pH and isotopic values (‰) are expressed in mg/L. Rad, Radiesthesia; tot, total; org, organic; inorg, inorganic.
Samples pH Ctot Corg Cinorg Ntot δ13C δ15N
Surface Soil
SS1 5.8 28.05 27.88 0.17 0.95 -24.4 0.5
SS2 7.5 9.68 9.68 0 0.51 -28.1 2.0
SS3 7.1 11.18 11.18 0 0.49 -27.3 1.9
SS4 7.3 17.96 17.76 0.2 0.68 -25.9 0.6
SS5 7.5 10.64 10.09 0.55 0.88 -27.0 4.0
SS6 7.8 4.87 4.87 0 0.36 -27.9 3.9
Sediment
S1 (Rad) 7.9 0.39 0.23 0.17 0.03 -24.8 na
S2 (Rad) 8.1 1.21 1.11 0.10 0.15 -24.9 7.0
S3 (Echo) 8.1 0.96 0.17 0.79 0.03 -24.7 na
S4 (Rad) 8.3 0.36 0.18 0.18 0.05 -26.3 3.8
Table 3. db-RDA analyses based on a Bray-Curtis dissimilarity matrix for the surface soil/cave sediment communities as well as the cave water 0.2 µm communities for all 3 domains, and the cave water 0.1 µm communities for the Bacteria and Archaea domains, and environmental variables measured in each sample. tot, total; org, organic; inorg, inorganic; SoS, SumOfSqs.
BACTERIA ARCHAEA EUKARYOTE
Df SoS F Pr(>F) Df SoS F Pr(>F) Df SoS F Pr(>F)
Soil/Sediments
pH 1 0.69251 2.1159 0.003 1 1.03584 3.9466 0.008 1 0.70173 2.4631 0.012
Ctot 1 0.40209 1.2285 0.213 1 0.29826 1.1364 0.325 1 0.24526 0.8609 0.619
Corg 1 0.38685 1.1820 0.255 1 0.24336 0.9272 0.484 1 0.30758 1.0796 0.332
Cinorg 1 0.30256 0.9244 0.547 1 0.23710 0.9034 0.539 1 0.34873 1.2240 0.227
Ntot 1 0.55689 1.7015 0.031 1 0.34423 1.3115 0.253 1 0.27023 0.9485 0.536
δ13C 1 0.48418 1.4793 0.082 1 0.31459 1.1986 0.292 1 0.36436 1.2789 0.189
Residual 3 0.98189 2 0.52492 2 0.56980
Water 0.2 µm
DIC 1 0.15371 1.2129 0.086 1 0.083487 1.1955 0.035 1 0.225233 1.7533 0.142
DOC 1 0.17432 1.3756 0.014 1 0.074546 1.0675 0.286 1 0.092212 0.7178 0.688
NHx 1 0.12353 0.9748 0.508 1 0.065149 0.9329 0.668 1 0.094777 0.7378 0.658
NO3- 1 0.12813 1.0111 0.435 1 0.088699 1.2701 0.023 1 0.078628 0.6121 0.789
Residual 2 0.25345 2 0.139670 2 0.256930
Water 0.1 µm
DIC 1 0.28232 0.7755 0.8750 1 0.21246 1.1640 0.4708
DOC 1 0.32200 0.8845 0.7042 1 0.34974 1.9161 0.0875
NHx 1 0.29307 0.8050 0.7931 1 0.18416 1.0089 0.4944
NO3- 1 0.26997 0.7416 0.9722 1 0.22242 1.2185 0.3361
Residual 1 0.36405 1 0.18253
Disclaimer/Publisher’s Note: The statements, opinions and data contained in all publications are solely those of the individual author(s) and contributor(s) and not of MDPI and/or the editor(s). MDPI and/or the editor(s) disclaim responsibility for any injury to people or property resulting from any ideas, methods, instructions or products referred to in the content.
Copyright: This open access article is published under a Creative Commons CC BY 4.0 license, which permit the free download, distribution, and reuse, provided that the author and preprint are cited in any reuse.
Prerpints.org logo

Preprints.org is a free preprint server supported by MDPI in Basel, Switzerland.

Subscribe

© 2024 MDPI (Basel, Switzerland) unless otherwise stated