1. Introduction
Cancer is a complex disease characterized by the abnormal growth of cells that proliferate uncontrollably, originating in apparently normal body tissues. These cells invade adjacent structures and spread to other organs through a process known as metastasis. This metastatic behavior defines malignant neoplasms, which are among the primary causes of mortality [
1].
Most recent estimates have indicated that approximately one in five individuals will develop cancer in their lifetime. Among these, breast cancer is one of the most frequently diagnosed, accounting for nearly 2.3 million new cases globally (11.6% of the total incidence). It is also the leading cause of cancer-related deaths, with an estimated 665,684 fatalities (18.7% of all cancer mortality) [
2]. The global incidence of breast cancer is rising due to factors such as increased life expectancy, unhealthy diets, insufficient physical activity, and the harmful use of tobacco and alcohol, all of which contribute to the development of the disease [
3].
However, despite the availability of these data, the mechanism by which a cell becomes “malignant” remains unknown. Various recent hypotheses have focused on changes in mitochondria. Mitochondrial DNA (mtDNA) is a double-stranded circular molecule that is maternally inherited, making its functions and inheritance unique as a genome. mtDNA lacks the repair mechanisms that we observe in genomic DNA, in addition to having a lack of histones, which makes it susceptible to mutations. These changes can be a source of mitochondrial dysfunction and may even promote carcinogenesis. When a mutation occurs in a mitochondrion, it can possess both normal and mutated copies of the mitochondrial genome, a situation known as heteroplasmy, which allows the mutation to persist [
4]. The main functions of mitochondria are oxidative phosphorylation and ATP synthesis for energy-requiring cellular processes. Alterations in mitochondrial function lead to disease through three mechanisms: the reduction of ATP supply when mutations affect oxidative phosphorylation; the generation of reactive oxygen molecules, such as H
2O
2 and free OH radicals, which can damage DNA, proteins, or lipids; and the execution of apoptosis when mitochondria release factors that promote cell death, such as caspases, cytochrome C, and apoptosis-inducing factors [
5]. During cell division, mitochondria are unevenly distributed among daughter cells through a process called replicative segregation. Therefore, the percentage of mutant and normal mtDNA molecules varies from one person to another, or even between tissues and organs. The percentage of mutant mtDNA required to express a deleterious phenotype is called the threshold effect. These features of mtDNA segregation, coupled with the unequal transmission of mitochondria from daughter cells during cell division, provide the basis for the phenotypic diversity seen in mitochondrial diseases. mtDNA is highly polymorphic and, so, different mutations may be associated with the same phenotype, or the same mutation may be associated with different phenotypes. In addition, epigenetic factors are relevant to the expressivity of clinical manifestations. Mitochondrial transcriptional abnormalities are closely related to a variety of human diseases [
5,
6].
Recent mtDNA sequencing technologies have shown promising informative potential in the diagnosis of diseases and population analysis. mtDNA allows for the identification of inherited diseases, which are traditionally considered difficult to diagnose clinically and even more difficult to characterize comprehensively at the molecular level. However, newer sequencing approaches—particularly whole-genome sequencing (WGS)—have dramatically changed the landscape. Combined nuclear (nDNA) and mtDNA analysis enables rapid disease diagnosis for the vast majority of patients [
14]. The mitochondrial genome remains of crucial importance in the pathogenesis of many diseases when there is no clear clinical and biochemical evidence of a nuclear origin of the disease [
15]. Despite the importance of mitochondrial diseases and their considerable morbidity, exhaustive studies on their prevalence in the general population have not been carried out so far. The reasons for this are multiple: the complexity of the clinical manifestations, the need for muscle biopsies for diagnosis (mutations cannot always be detected in blood samples), the need to sequence the entire mitochondrial genome to locate mutations not detected so far, misdiagnosis of many patients as they are not cared for in specialized centers, the lack of available public information, and so on [
17].
Single nucleotide polymorphisms (SNPs) in the mitochondrial genome have been investigated in relation to breast and other types of cancer. Recent research has determined that non-synonymous single nucleotide polymorphisms (nsSNPs) contribute to susceptibility to diseases [
18,
19]. Specifically, nsSNPs related to breast cancer have been analyzed from 981 genes related to carcinogenesis expressed in breast tissue. It was deduced that 29.7% of the polymorphisms are likely to influence the development and homeostasis of breast tissues, thus contributing to the malignancy of breast cancer. However, there is a lack of sufficient data and tools to analyze these associations.
Our hypothesis is reinforced by previously obtained evidence that single nucleotide polymorphisms (SNPs) are related to (and likely have nonlinear associations with) the presence of malignant neoplastic diseases. SNPs can alter genetic sequences of key genes or regulatory regions, which may contribute to the development of these diseases [
16].
In our approach, data science methods were employed to compare the effectiveness of different data mining techniques. These techniques were used to explore and identify patterns in the position numbers of variants identified in mitochondrial deoxyribonucleic acids (mtDNA) sequences from breast cancer patients and controls. This method has been minimally explored to date and, therefore, faces the primary challenge of working with a small dataset due to the limited availability of public information for analysis.
Through applying association rule algorithms to genomic datasets, researchers have discovered patterns or combinations of polymorphisms strongly associated with cancer. These association rules can help identify specific combinations of polymorphisms that may increase cancer risk in certain populations or subgroups [
25].
The application of machine learning techniques has further facilitated sequence analysis, enabling us to refine previous results and gain a deeper understanding of various aspects of human origins and the dispersion of human populations worldwide [
16]. Genetic variation provides the raw material for evolutionary change. Extensive investigations of genetic variation patterns within populations have been conducted using association rule algorithms [
23,
24].
This research aimed to identify patterns in the mtDNA of women with breast cancer using the unsupervised learning algorithm of association rules. The objective was to develop of a model capable of identifying patterns in breast cancer mtDNA variants using data mining techniques. The specific objectives were to develop the ETL process (Extraction, Transformation, and Loading) using MySQL and Python, design and create a model for pattern recognition in mtDNA sequences, and evaluate the results of the selected model.
2. Materials and Methods
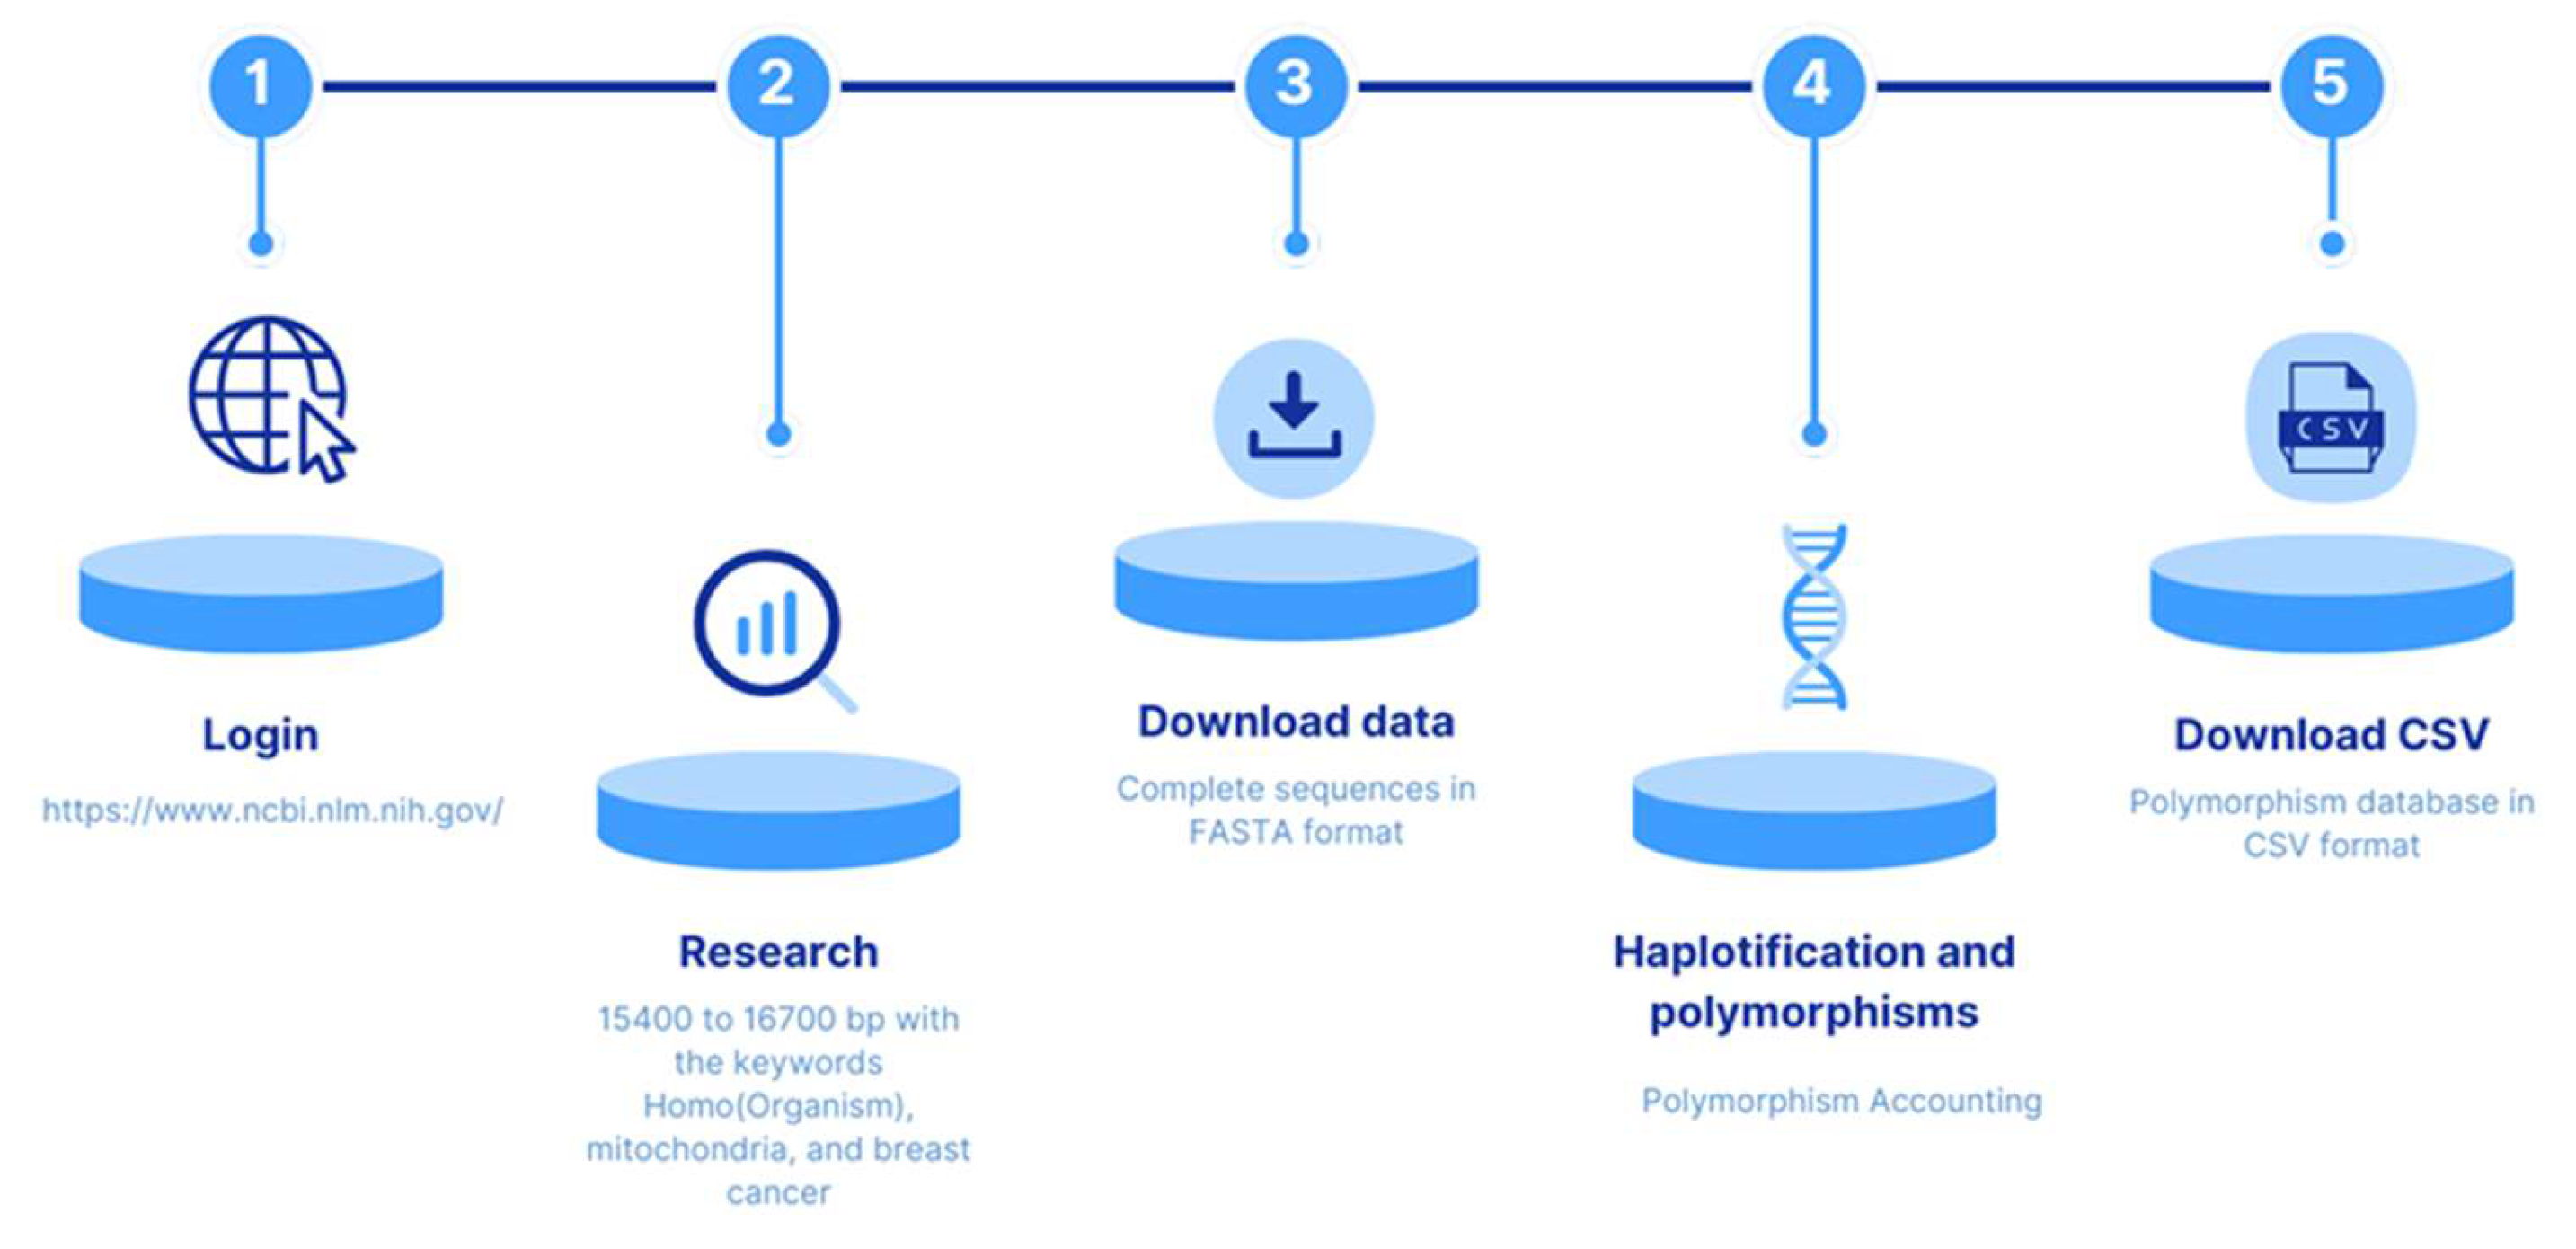
The pipeline process for data extraction and filtering is shown in
Figure 1. Data obtained from the
NCBI Genbank database of the National Center for Biotechnology Information (NCBI)
https://www.ncbi.nlm.nih.gov/nucleotide/, with the criteria defined by Vega Avalos et al. (2022) [
19], were used to design a strategy including five steps. The first involved determining the size of the sequences of interest, using the filter
SLEN, defined as between 15,400 and 16,700 nucleotides (the DNA of the complete mitochondrial chromosome has 16,569 bases). The second step involved delimitation of the organism of interest,
Homo sapiens, with the filter [
Organism] command. Third, the [
FILT] command was used to select only the truncated term
mitoch* in the file’s metadata. Fourth, the search term was defined as “
breast cancer.” Following this strategy, the search string request was entered into the database search engine as follows:
(015400[SLEN]:016700[SLEN]) AND Homo sapiens[Organism] AND mitoch*[FILT] AND “breast cancer”
A curation process of the identified candidate sequences was carried out, reviewing the metadata associated with each sequence for information related to the size of the sequence in base pairs, confirming its human mitochondrial origin and the origin of the biological sample as neoplastic tissue or healthy tissue. In addition, information on the related publication was also obtained. Sequences that did not meet these criteria and lacked any of the data were excluded from the study. Once these requirements were met, complete control sequences and sequences of patients with breast cancer were obtained and downloaded in a single file for each situation mentioned in the FASTA format.
From the files in the FASTA format, variants were processed to obtain variants with the revised Cambridge reference sequence (rCRS) https://www.ncbi.nlm.nih.gov/nuccore/251831106 and through the MITOMASTER tool https://www.mitomap.org/foswiki/bin/view/MITOMASTER/WebHome. As final products of the process, the variants in each sequence were identified and haplotyped, and the polymorphisms per sequence were counted, thus obtaining the database in .CSV format. The Phylotree database https://www.phylotree.org/ was used to consult different haplogroup classification criteria.
The variables obtained from the polymorphism database contained the following variables, before the selection of viable data for analysis (
Table 1).
SNP interpretation was carried out, taking into consideration the specifications of the International Working Group of Mitochondrial Disease Sequence Data Resource Consortium of the American College of Medical Genetics and Association of Molecular Pathology for mtDNA variants interpretation.[
20] The data were loaded into the MySQL database as shown in
Table 2, where the four types of nitrogenous bases found in the DNA molecule are represented by the letters (A) Adenine, (C) Cytosine, (G) Guanine, and (T) Thymine. In addition, the letter “d” indicates that a nitrogenous base is absent.
Once the table was created, the haplogroup and haplotype columns were removed using MySQL scripts, as they were not relevant to the analysis. For the polymorphism variables obtained from each patient, the letters representing the four types of nitrogenous bases (A, C, T, G) and the letter (d), indicating the absence of a nitrogenous base, were also eliminated (
Table 3).
Data transformation. The value of the variable “
group” was updated by assigning
0 to the records of healthy patients (control) and
1 to patients with the disease (cancer). To obtain the different position numbers where the polymorphisms occurred and the number of occurrences, and to perform the necessary operations for the initial exploratory analysis, an SQL function was created to convert the columns corresponding to the position where the alteration occurred (variant_1, variant_2, variant_3... variant_40) into rows, while discarding the null values so as not to bias the results of the analysis. This resulted in a table of three columns and 1711 records (
Table 4). The different polymorphism positions of healthy and neoplastic patients were obtained and a binary matrix of 69 rows by 363 columns was generated. The first two columns of the original table (patient_id and group) were kept and 361 columns were generated corresponding to the different position numbers where the polymorphisms were found.
Data upload. The connection to the MySQL database was established using the “mysql.connector” library in the Jupyter Notebook editor. Once the connection was established, the exploratory analysis of the data began.
Implementation of the Association Rules Algorithm
The steps to implement the algorithm began with the creation of a binary matrix using Python as the development language and the pandas library. An algorithm was then developed to traverse each row of the original table, discarding the group and age variables. Subsequently, for each patient record, the algorithm evaluated whether there was a polymorphism at the position number corresponding to the column of the new data frame.
Generation of frequent element sets: The a priori algorithm was used due to its ability to find sets of elements that occur together with a frequency greater than a given support threshold. This is because the algorithm uses the concept of a priori property, which states that any subset of a set of frequent elements must also be frequent. The support threshold is set as a minimum required value of frequency to consider a set as frequent. A minimum support threshold set at 0.5 was defined. Through employing a support threshold of 0.5 in the a priori algorithm, it was ensured that only sets of items that occur together with considerable frequency (i.e., in at least 50% of the transactions) were selected, helping to identify strong and significant association patterns in the data.
The main objective of this algorithm was to obtain frequent itemsets, starting with one-itemsets, and then generating frequent itemsets recursively with two items, three items, and so on, until frequent itemsets of all sizes had been generated. The number of transactions in this analysis was equal to the samples of each patient:
T = {1, 2, 3, 4, 5, 6, 7, 8, 9, 10…41} [1]
and the set of elements of each transaction was equal to the number of the specific position where the polymorphism was located:
I = {58, 64, 72, 73, 93, …16527} [2]
The application of the a priori algorithm yielded a total of 383 frequent itemsets in sequences from women with cancer, while 2175 frequent itemsets were identified in sequences from healthy women.
Generation of association rules. At this stage, evaluation of the rules was performed to choose a subset. Using the algorithm as previously mentioned, the a priori algorithm for the generation of rules and then the criterion for selecting the strongest rules. We used a metric “lift” greater than 1 and a confidence level greater than 0.5, which are indicators that there may be a strong and significant relationship between the antecedent and the consequent. A confidence value greater than 0.5 indicates that there is a high probability that the consecutive of association rule will occur given that the antecedent is met. As a result, a total of 5562 rules were obtained in the sequence of women with cancer and 157,140 rules in sequences of healthy women, including repeated rules where the antecedent and consequent were the same regardless of the order of occurrence. When applying association rule algorithms, it is common to obtain a large number of rules. Some of these rules can be very similar or even identical, which generates redundancy in the results. The presence of repeated rules can make it difficult to interpret the results and can lead to biased or uninformative conclusions.
Elimination of redundancy. To manage a large number of association patterns, they must be filtered, grouped, and organized. Therefore, the next step is the selection of only the most interesting rules. The elimination of repeated rules in association rule algorithms, such as the a priori algorithm, is an important step to improve the quality and usefulness of the results obtained.
In this pipeline, the drop_duplicates() command was used to remove duplicate rules based on the columns antecedent support, consequent support, support, confidence, lift, and leverage. This process helped to obtain more refined datasets and avoid redundancy in the analysis results. As a result, a significant reduction in the number of rules obtained for both datasets was achieved.
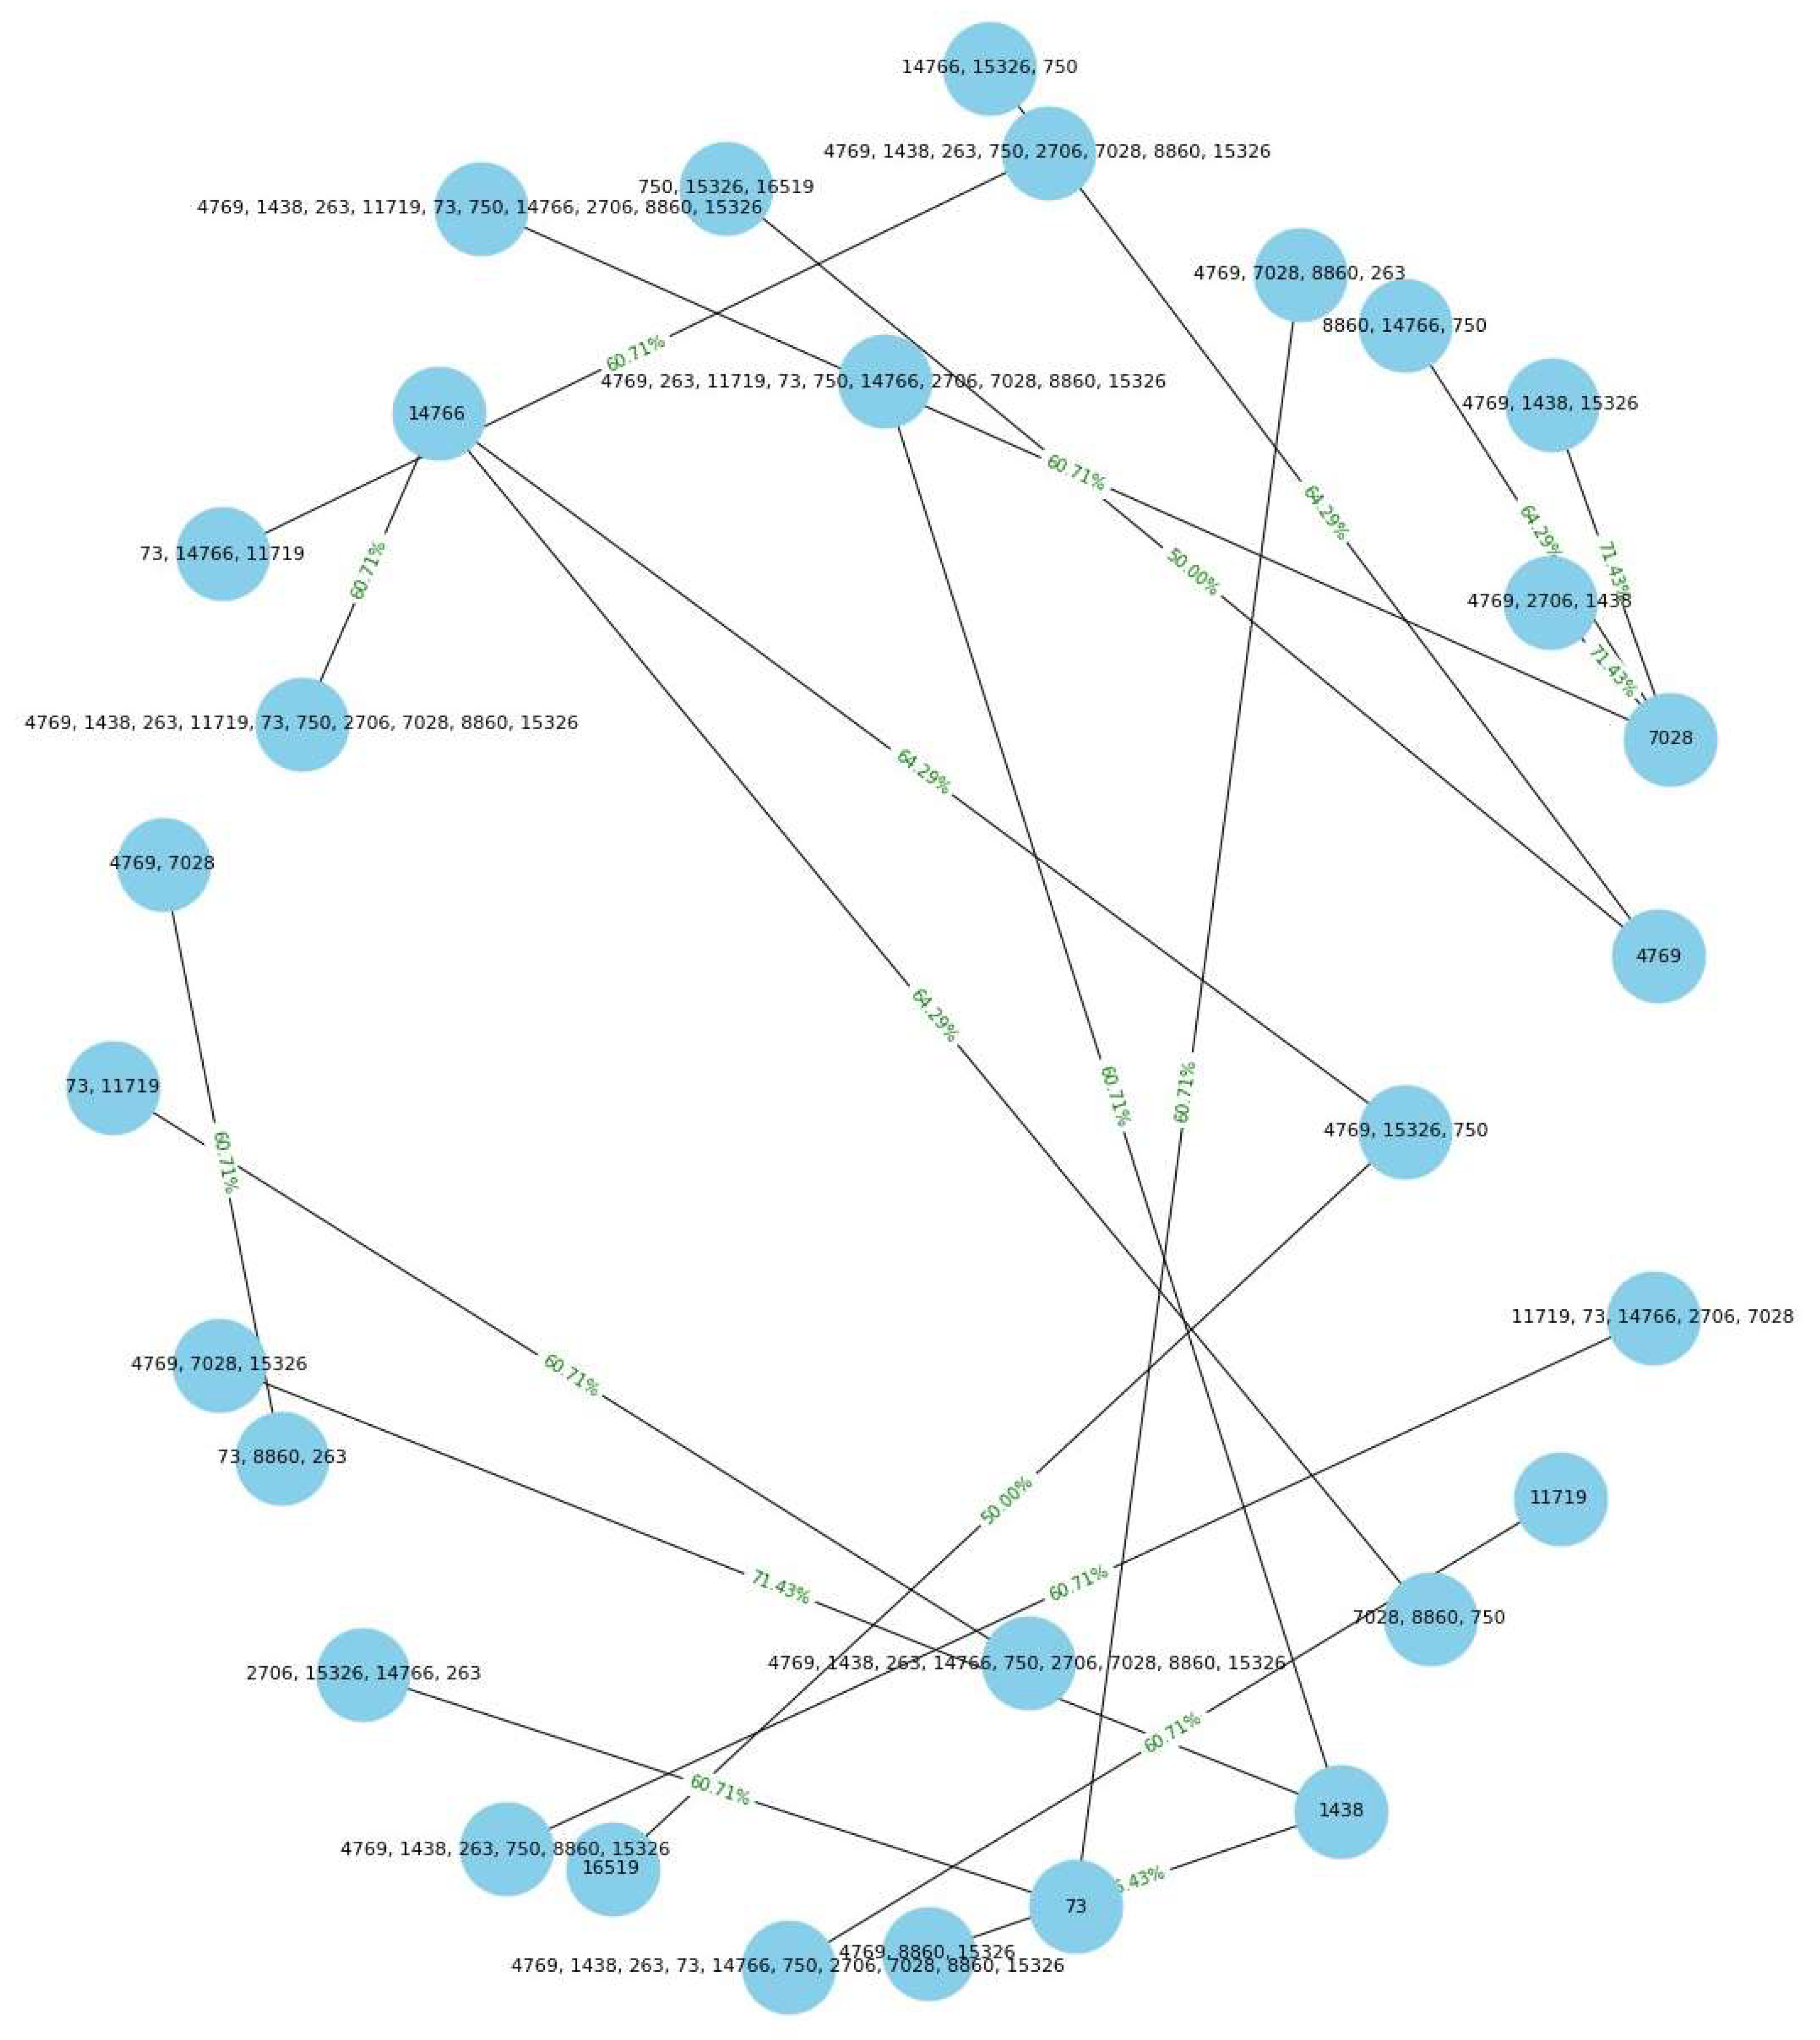
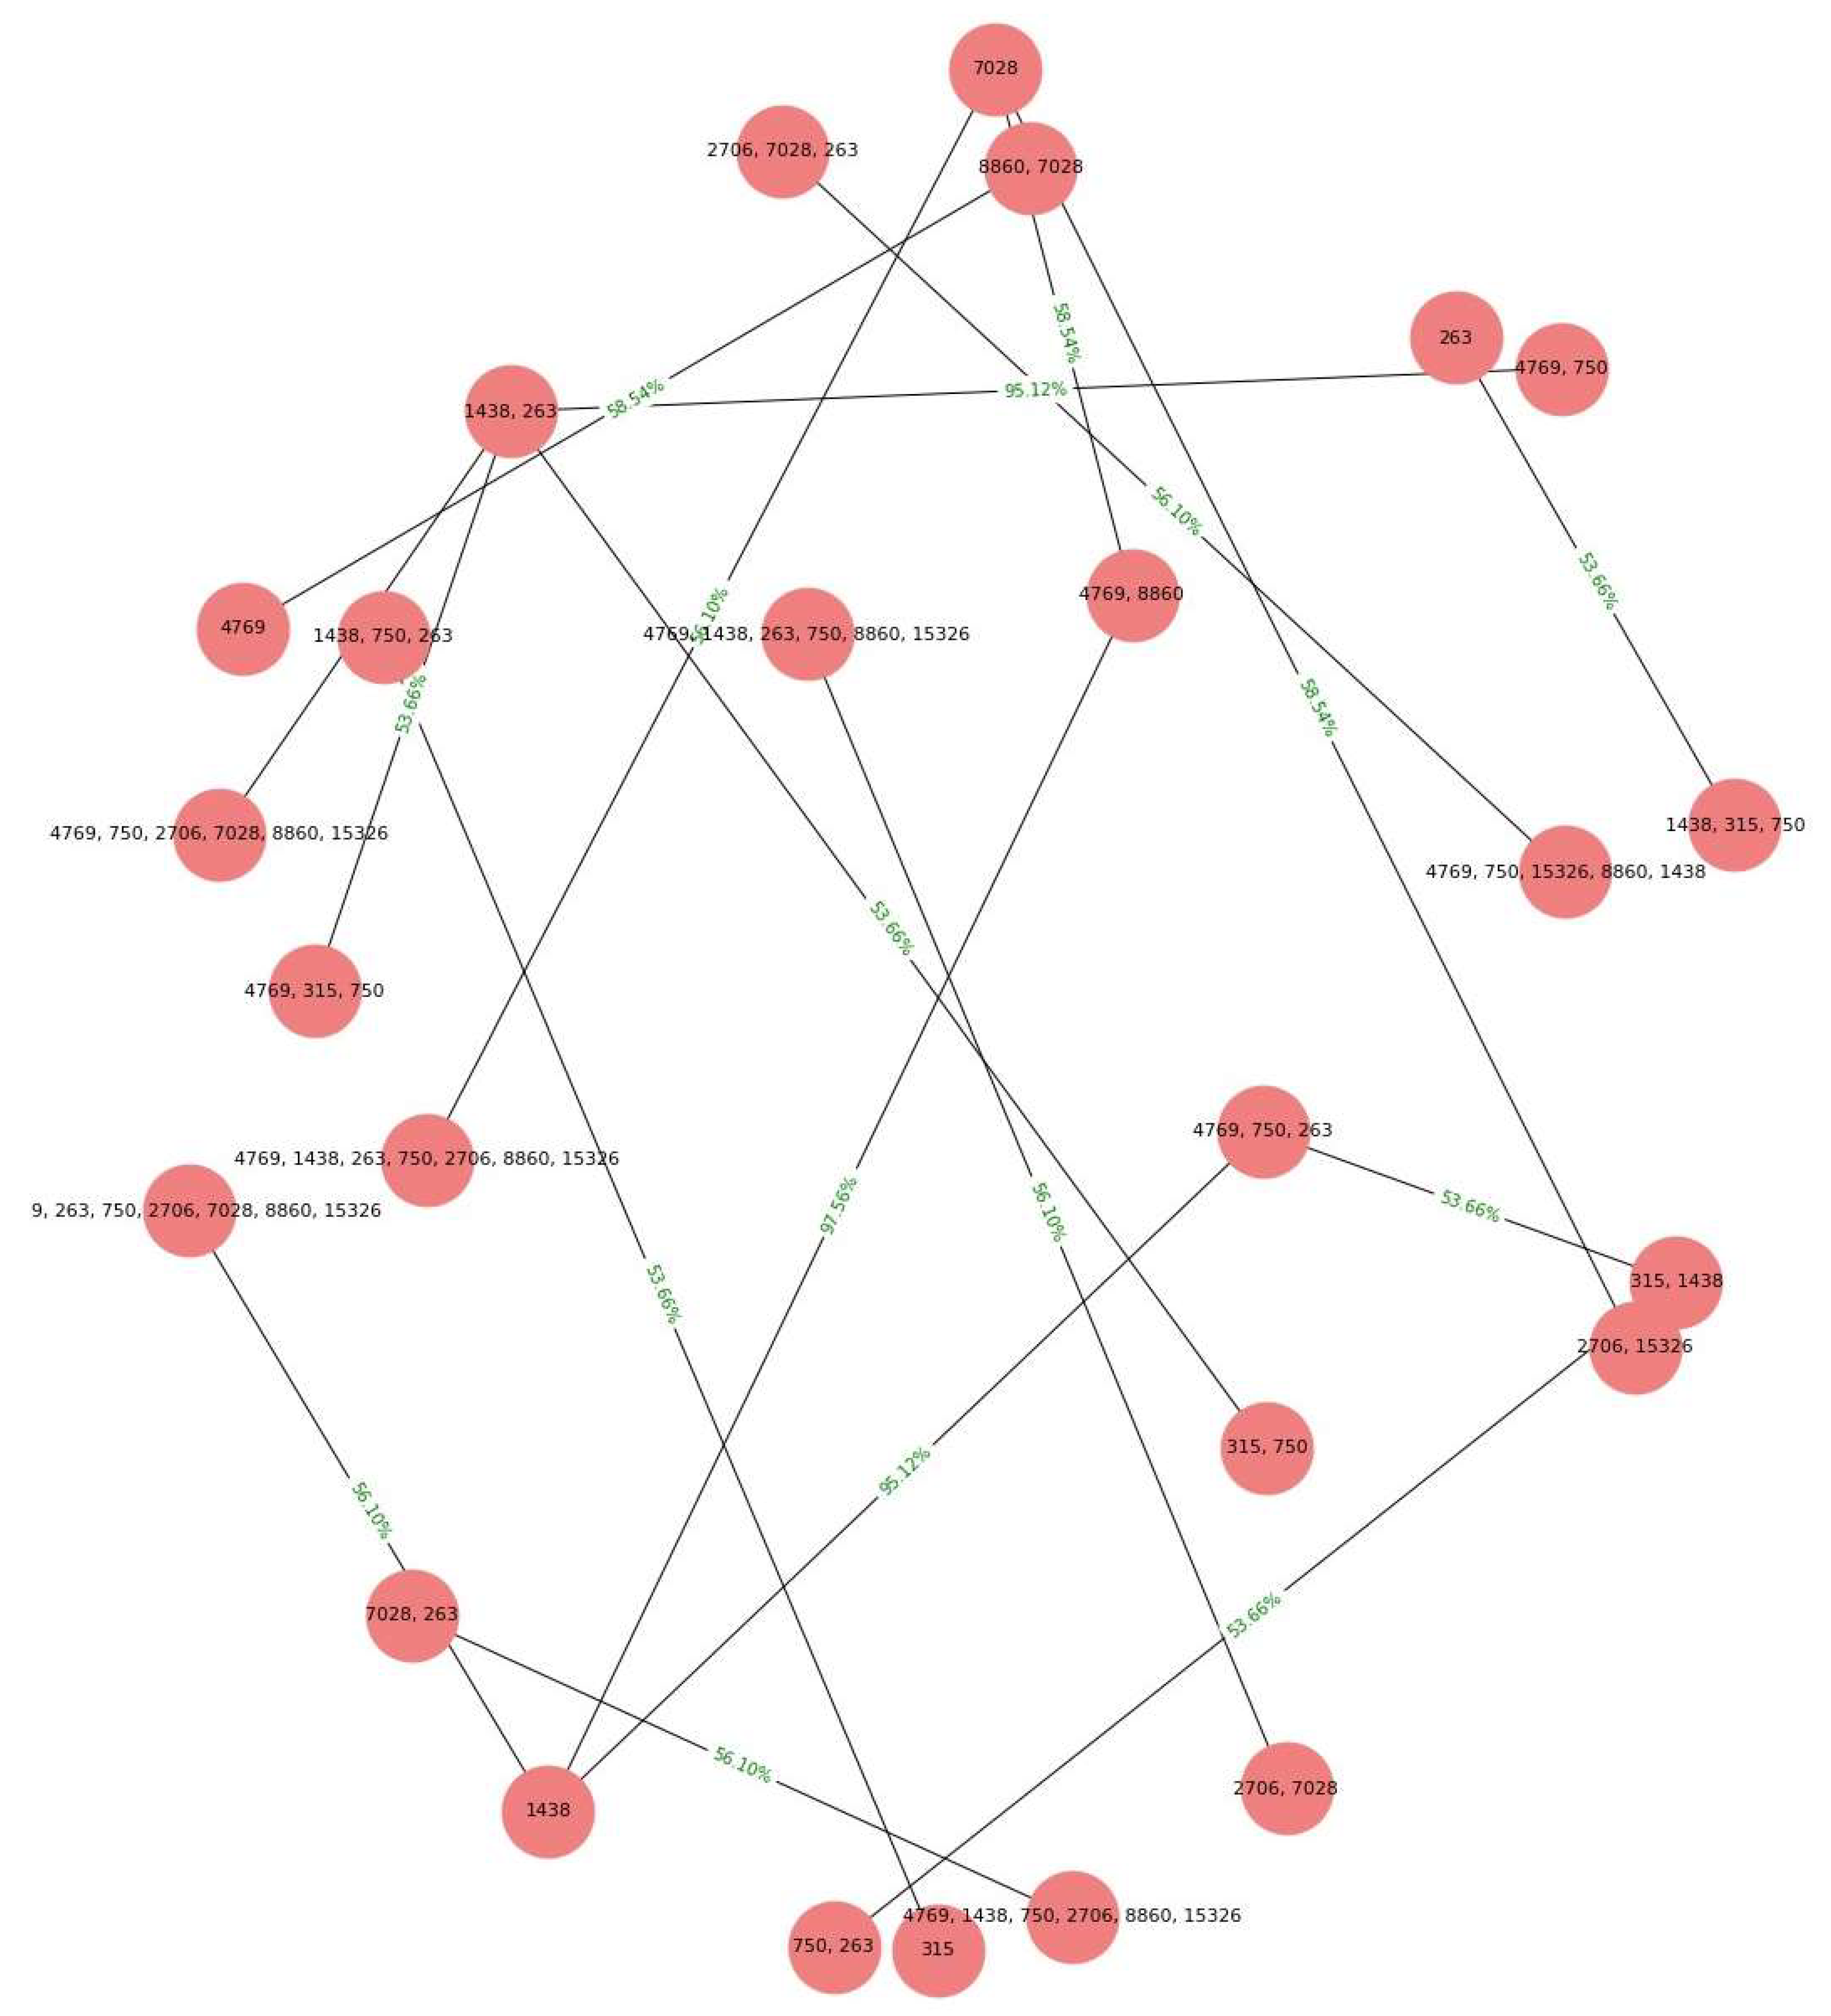
Network graphics. To generate the network graph, the following steps were followed: Nodes were created for each polymorphism number present in the resulting association rules of the item set in sequences of women with cancer. The nodes are then connected with arcs representing the association rules, where the strength and thickness of the arc were determined by the support percentage of the rule. Nodes were created for each polymorphism number present in the association rules resulting from the set of elements in sequences of women with cancer.
The nodes were then connected with arcs representing association rules, where the strength and thickness of the arc were determined by the percentage of support of the rule.
3. Results
A total of 41 samples were diagnosed with breast cancer and 28 samples were control (healthy). The origin of these samples was variable and could be identified by the haplogroup associated with them. Overall, the average age of the 69 patients in the sample was 24 years. The percentage of ages in the sample ranged from 10 to 40 years. The standard deviation from the mean was approximately 10.3 years (
Table 5).
Overall, the average age of the 69 patients in the sample was 24 years, with a standard deviation of 10.3 years (
Table 5).
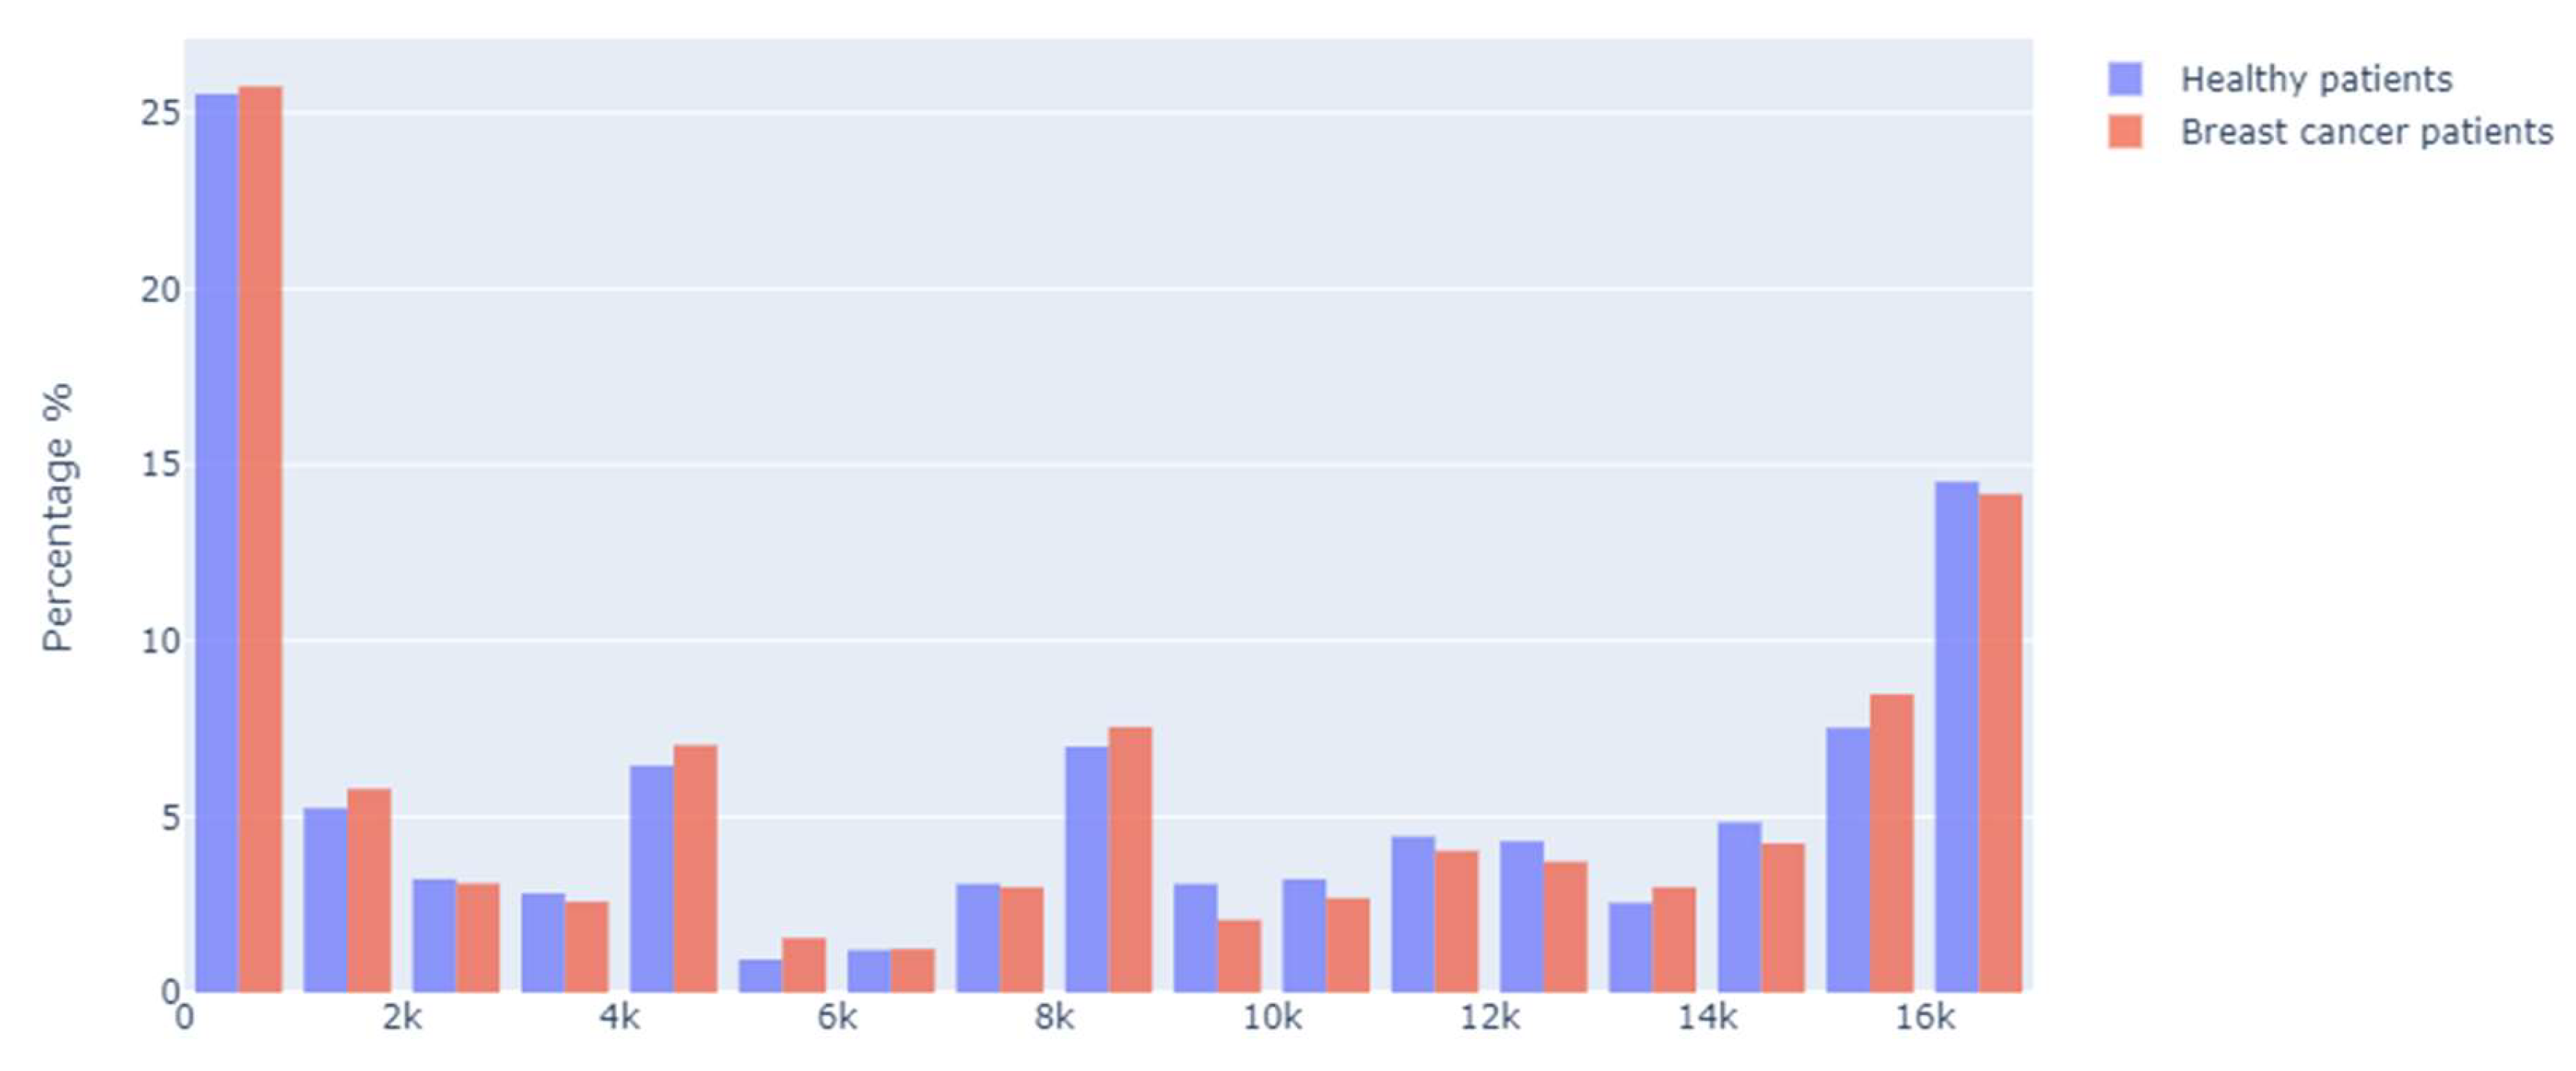
In the distribution of the sample obtained, 744 occurrences (corresponding to 43.5% of the position numbers where the polymorphism was present) belonged to healthy patients, while 967 occurrences (representing 56.5%) corresponded to patients with cancer. A comparative histogram of the percentage of positions by patient type is shown in the following graph, where the highest percentage of occurrences was found at the beginning and end of the mitochondrial structure. Initially, the highest number of occurrences was between position 0 and 999, and the final positions between numbers 16,000 and 16,999.
It is also important to note that there was a notable percentage of occurrences among the regions ranging from 4000 to 4990, 8000 to 8999, and 15,000 to 15,999 (
Figure 2).
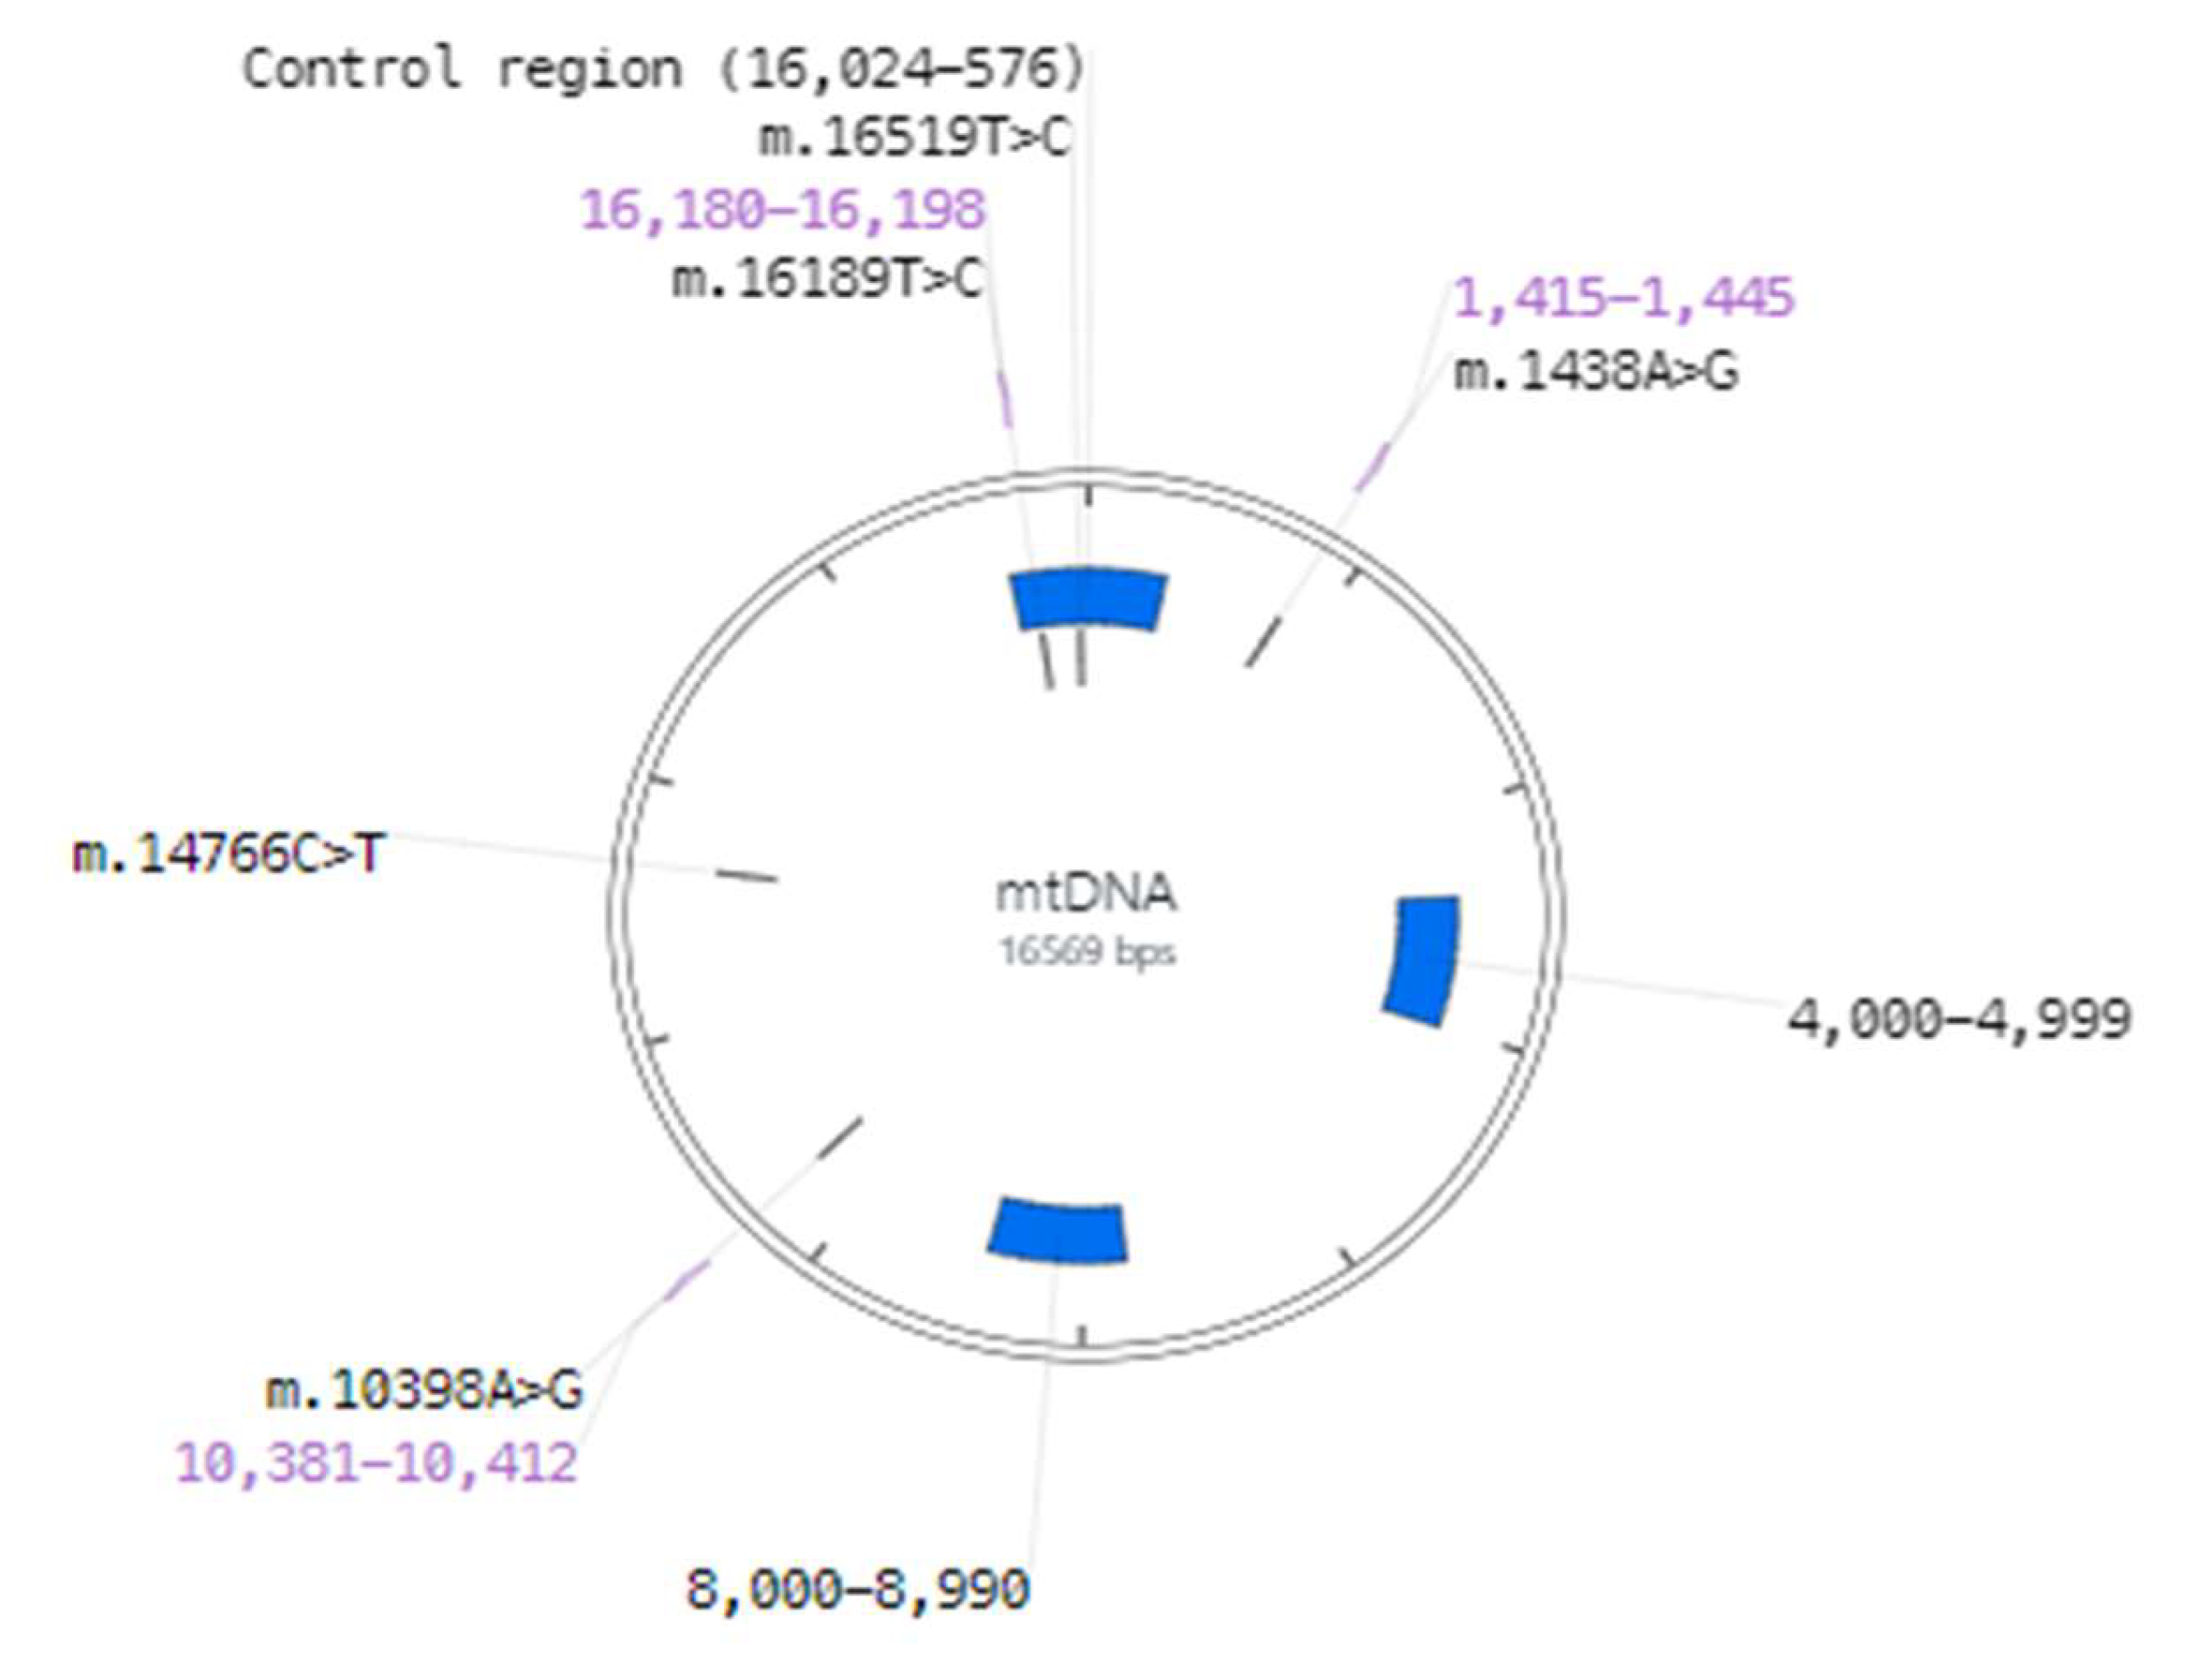
Considering that mtDNA is a circular double-stranded molecule, the segments with the highest number of alterations were identified. The segment with positions 0 to 999 corresponded to the control region (
d-loop), the main non-coding area of the mtDNA molecule, followed by the final segment in positions 16,000 to 16,999, which corresponded to transfer RNAs. Regarding the segments of positions between 4000 and 4990, we found that most of the polymorphisms belonged to transfer RNAs. Between the segment of positions between 8000 and 8990, it was possible to find some polypeptides and transfer RNAs (
Figure 3 and
Table 6).
The segments with the highest number of alterations were identified between positions 16,024 and 576 in the control region (
Figure 3).
Distances between Position Numbers Where Polymorphisms Occurred
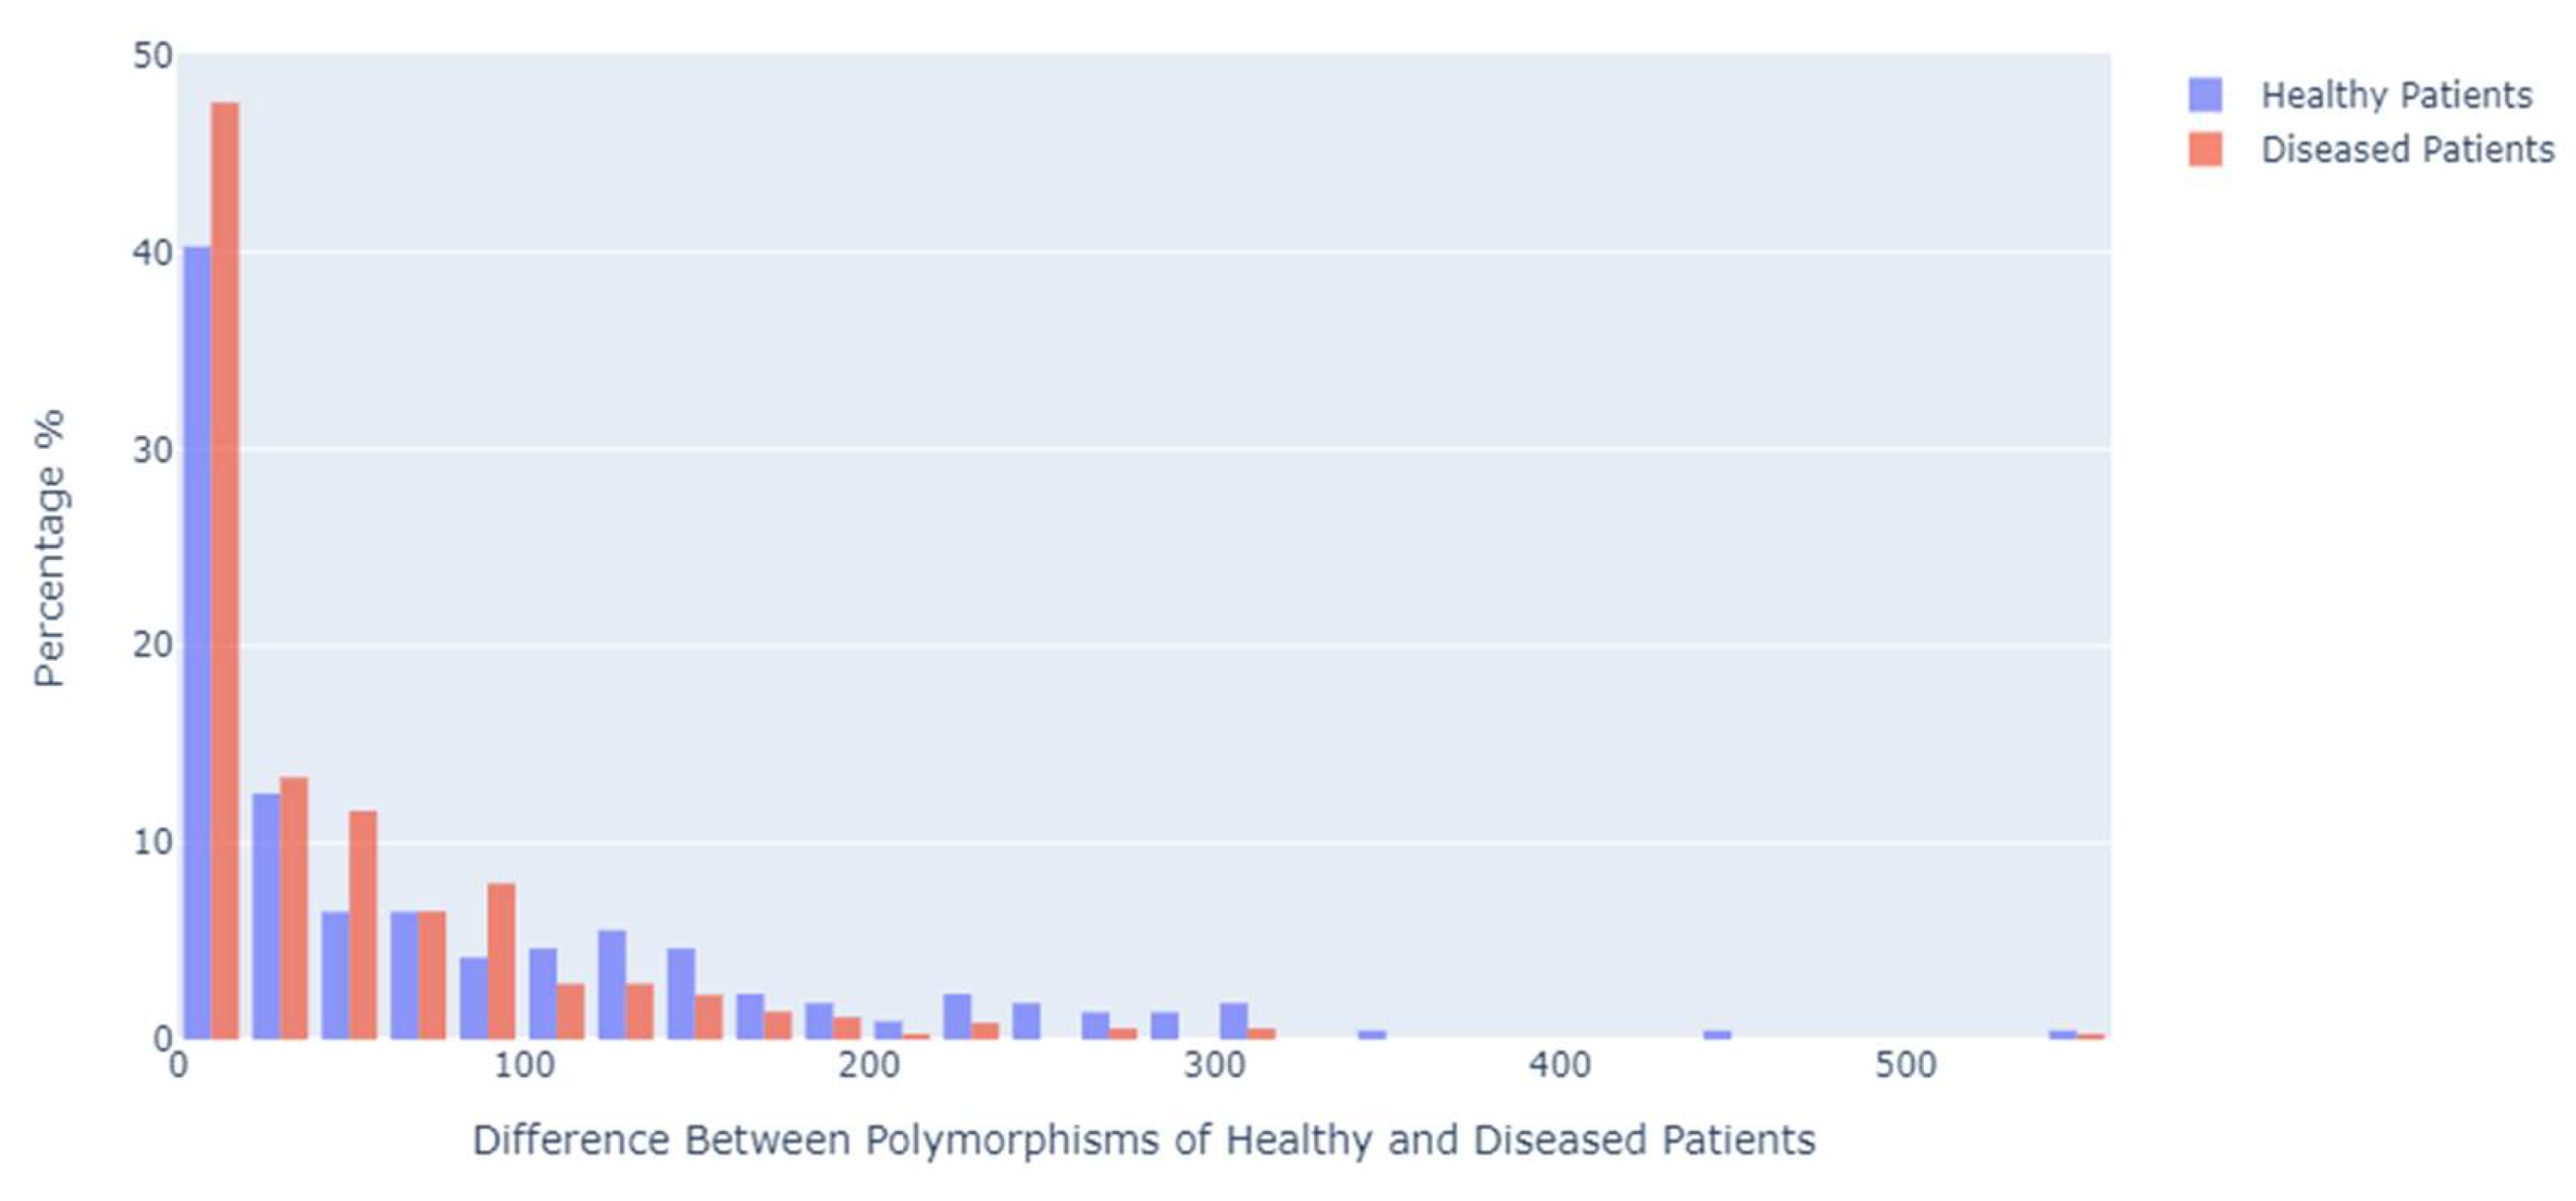
To estimate the genetic distances between the positions in which the polymorphisms occurred, a Python function was used where each different position number was traversed and subtracted from the position number that preceded it, obtaining the distance between each position. The distances between polymorphisms of patients with the disease were smaller than those of healthy or control patients. As a result, 47% of the position numbers of cancer patients had a distance between 0 and 19, while the same distance was present in 40% of healthy patients (
Figure 4).
The data were coded such that each item number was an individual item, and each patient was a transaction. Using Python as the development language and the
pandas library, an algorithm was developed to traverse each row of the original table (
Table 6), discarding the variables cancer and age. Subsequently, for each patient record, it evaluated whether there was polymorphism in the position number corresponding to the column of the new table (
Table 7), creating a list consisting of 1 when the polymorphism was present or 0 when it was absent. Once the algorithm finished going through the rows, a data frame was created, resulting in a binary matrix of 41 rows and 361 columns.
In
Table 7, we have a sample of five patients and different polymorphisms at positions 58, 64, 72, 73, 93, 93, 114, 146, 150, 151, and so on up to 16,527. The transaction corresponding to patient four in the sample could be the set of items {73, 151}, as could the transaction corresponding to patient 5.
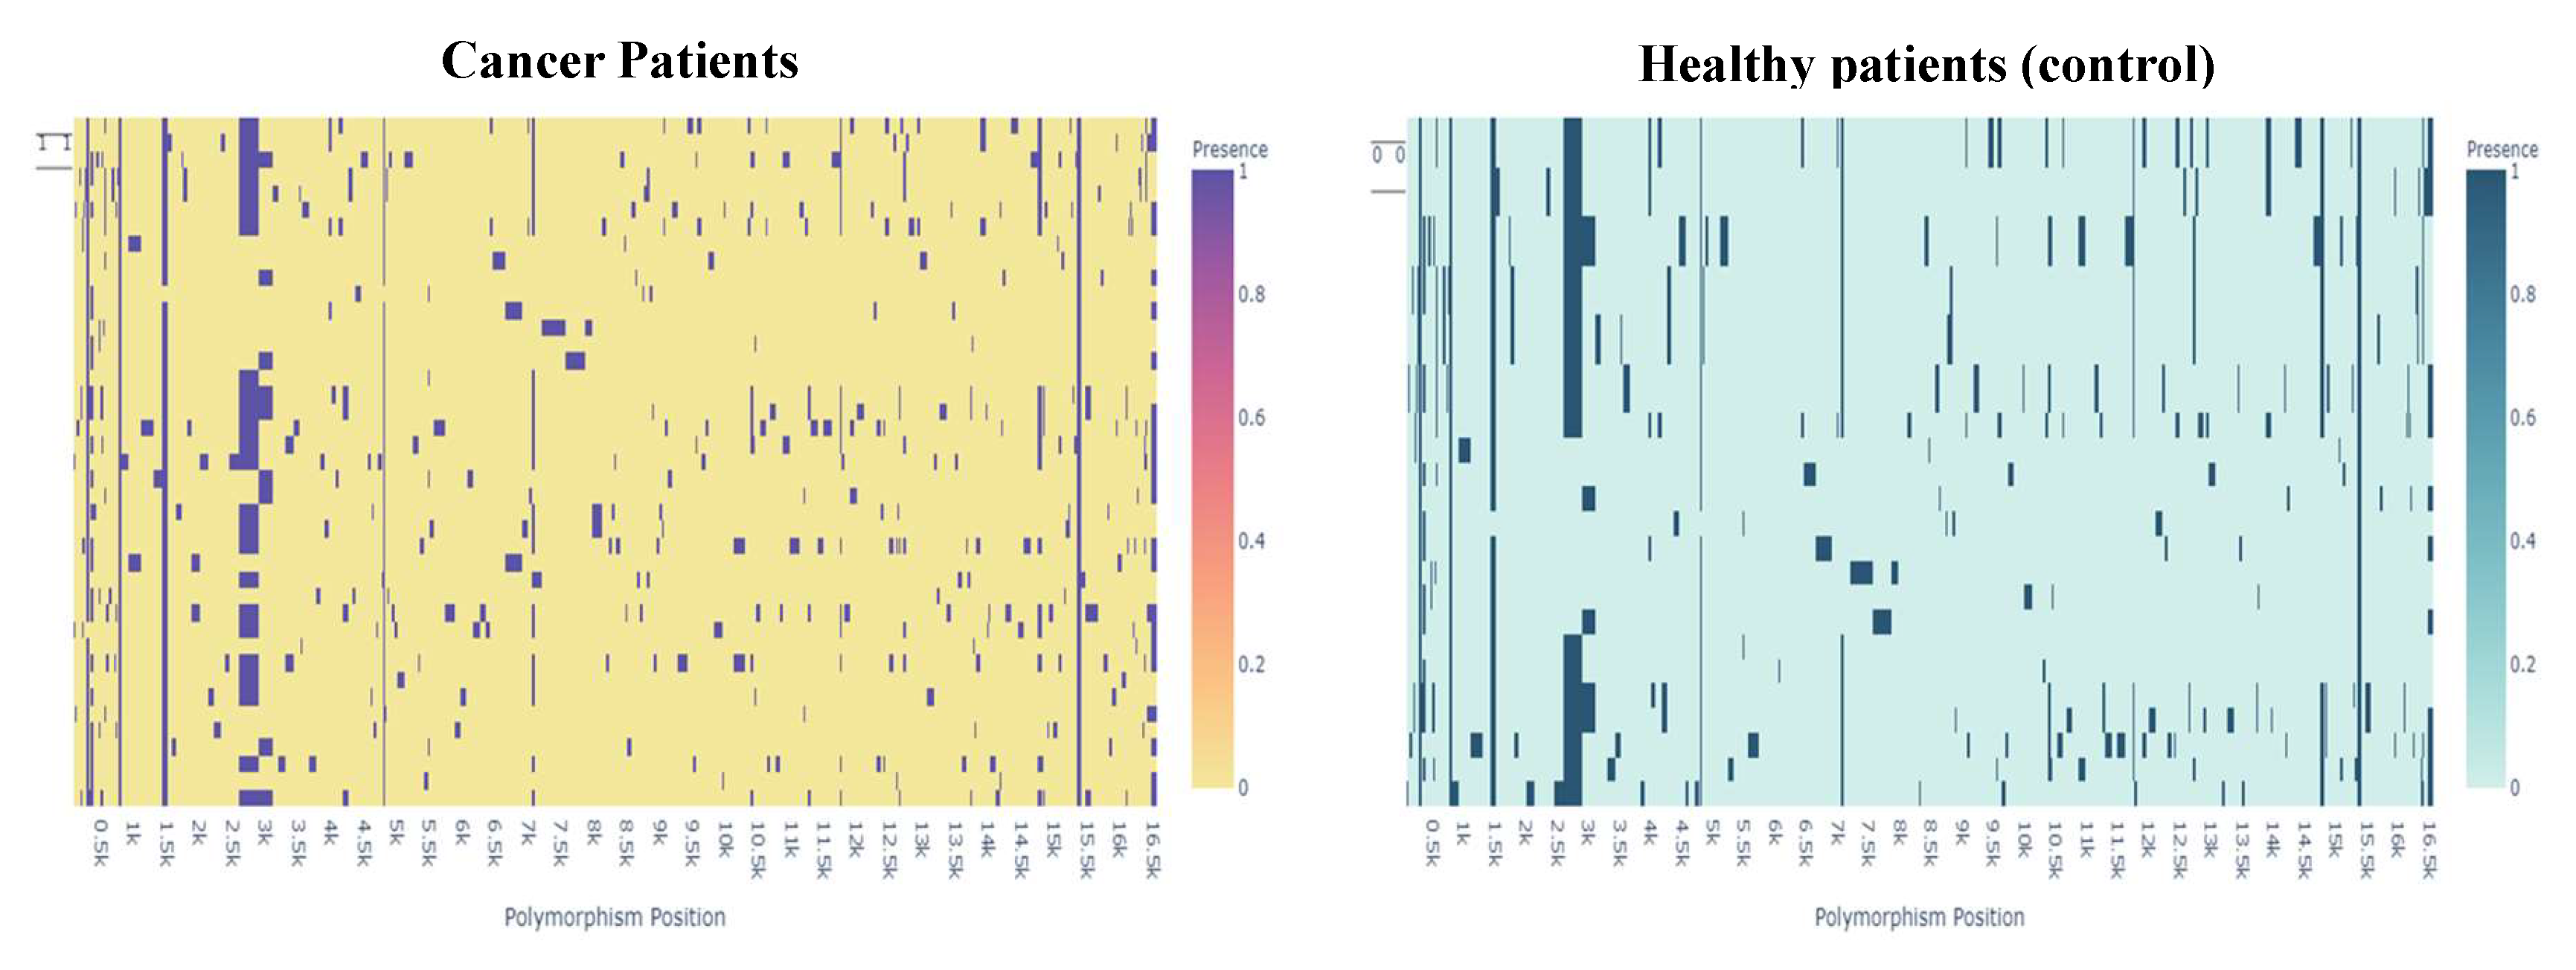
To visualize the data of the presence or absence of polymorphisms by patient type, a heat map was used for both groups (
Figure 8).
The difference in the distribution of polymorphisms may be an indicator of a relationship between polymorphisms and the presence of cancer.
As a result of the generation of association rules, a total of 5562 rules were obtained in the sequence of women with cancer and 157,140 rules in sequences of healthy women, including repeated rules where the antecedent and consequent were the same regardless of the order of occurrence.
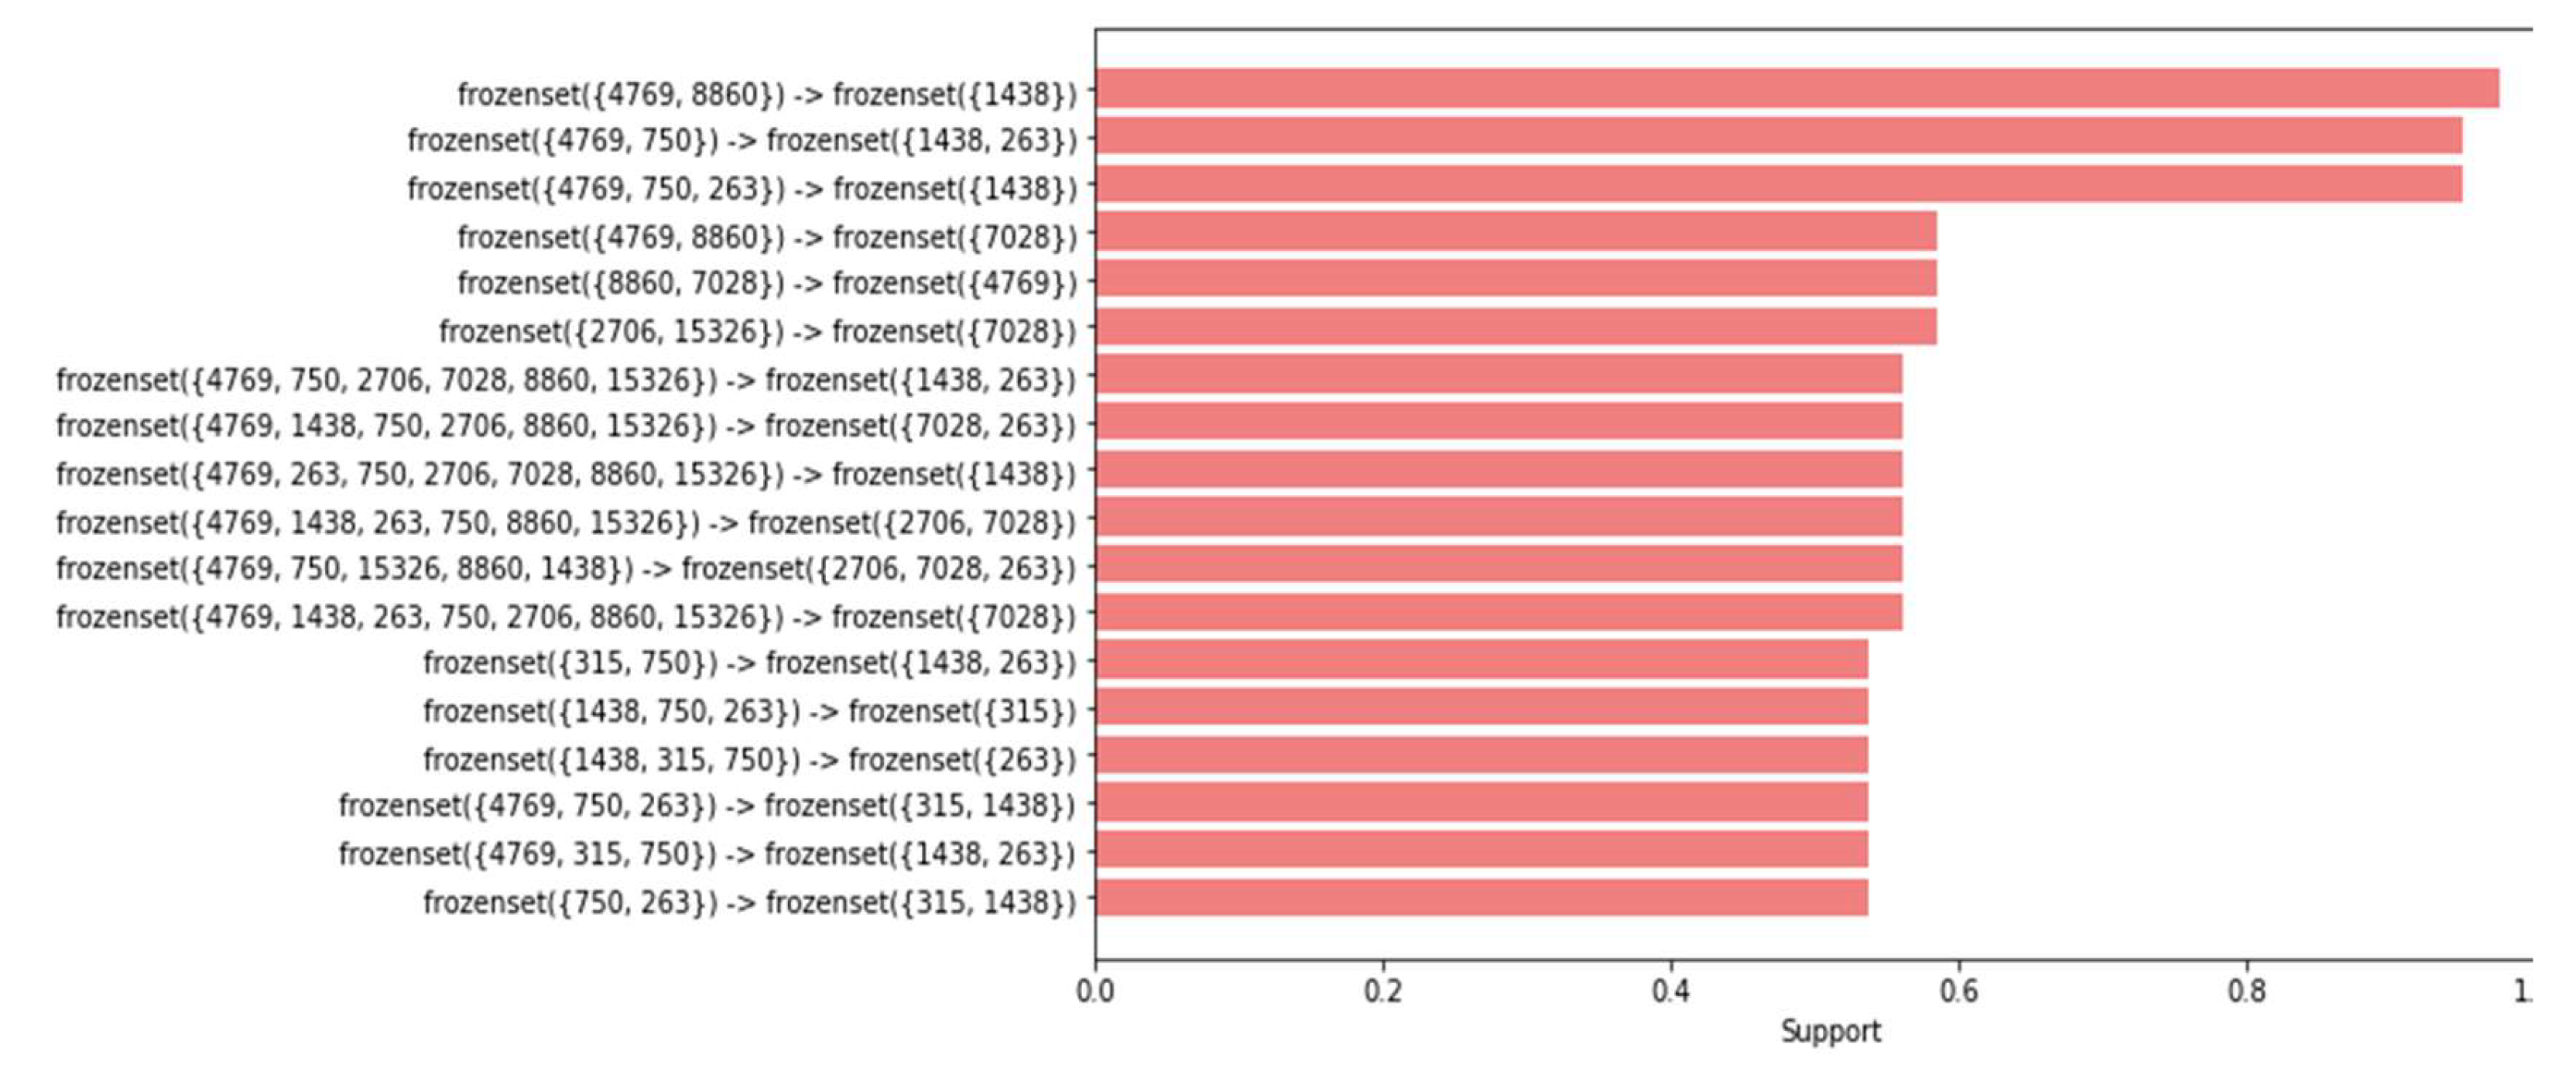
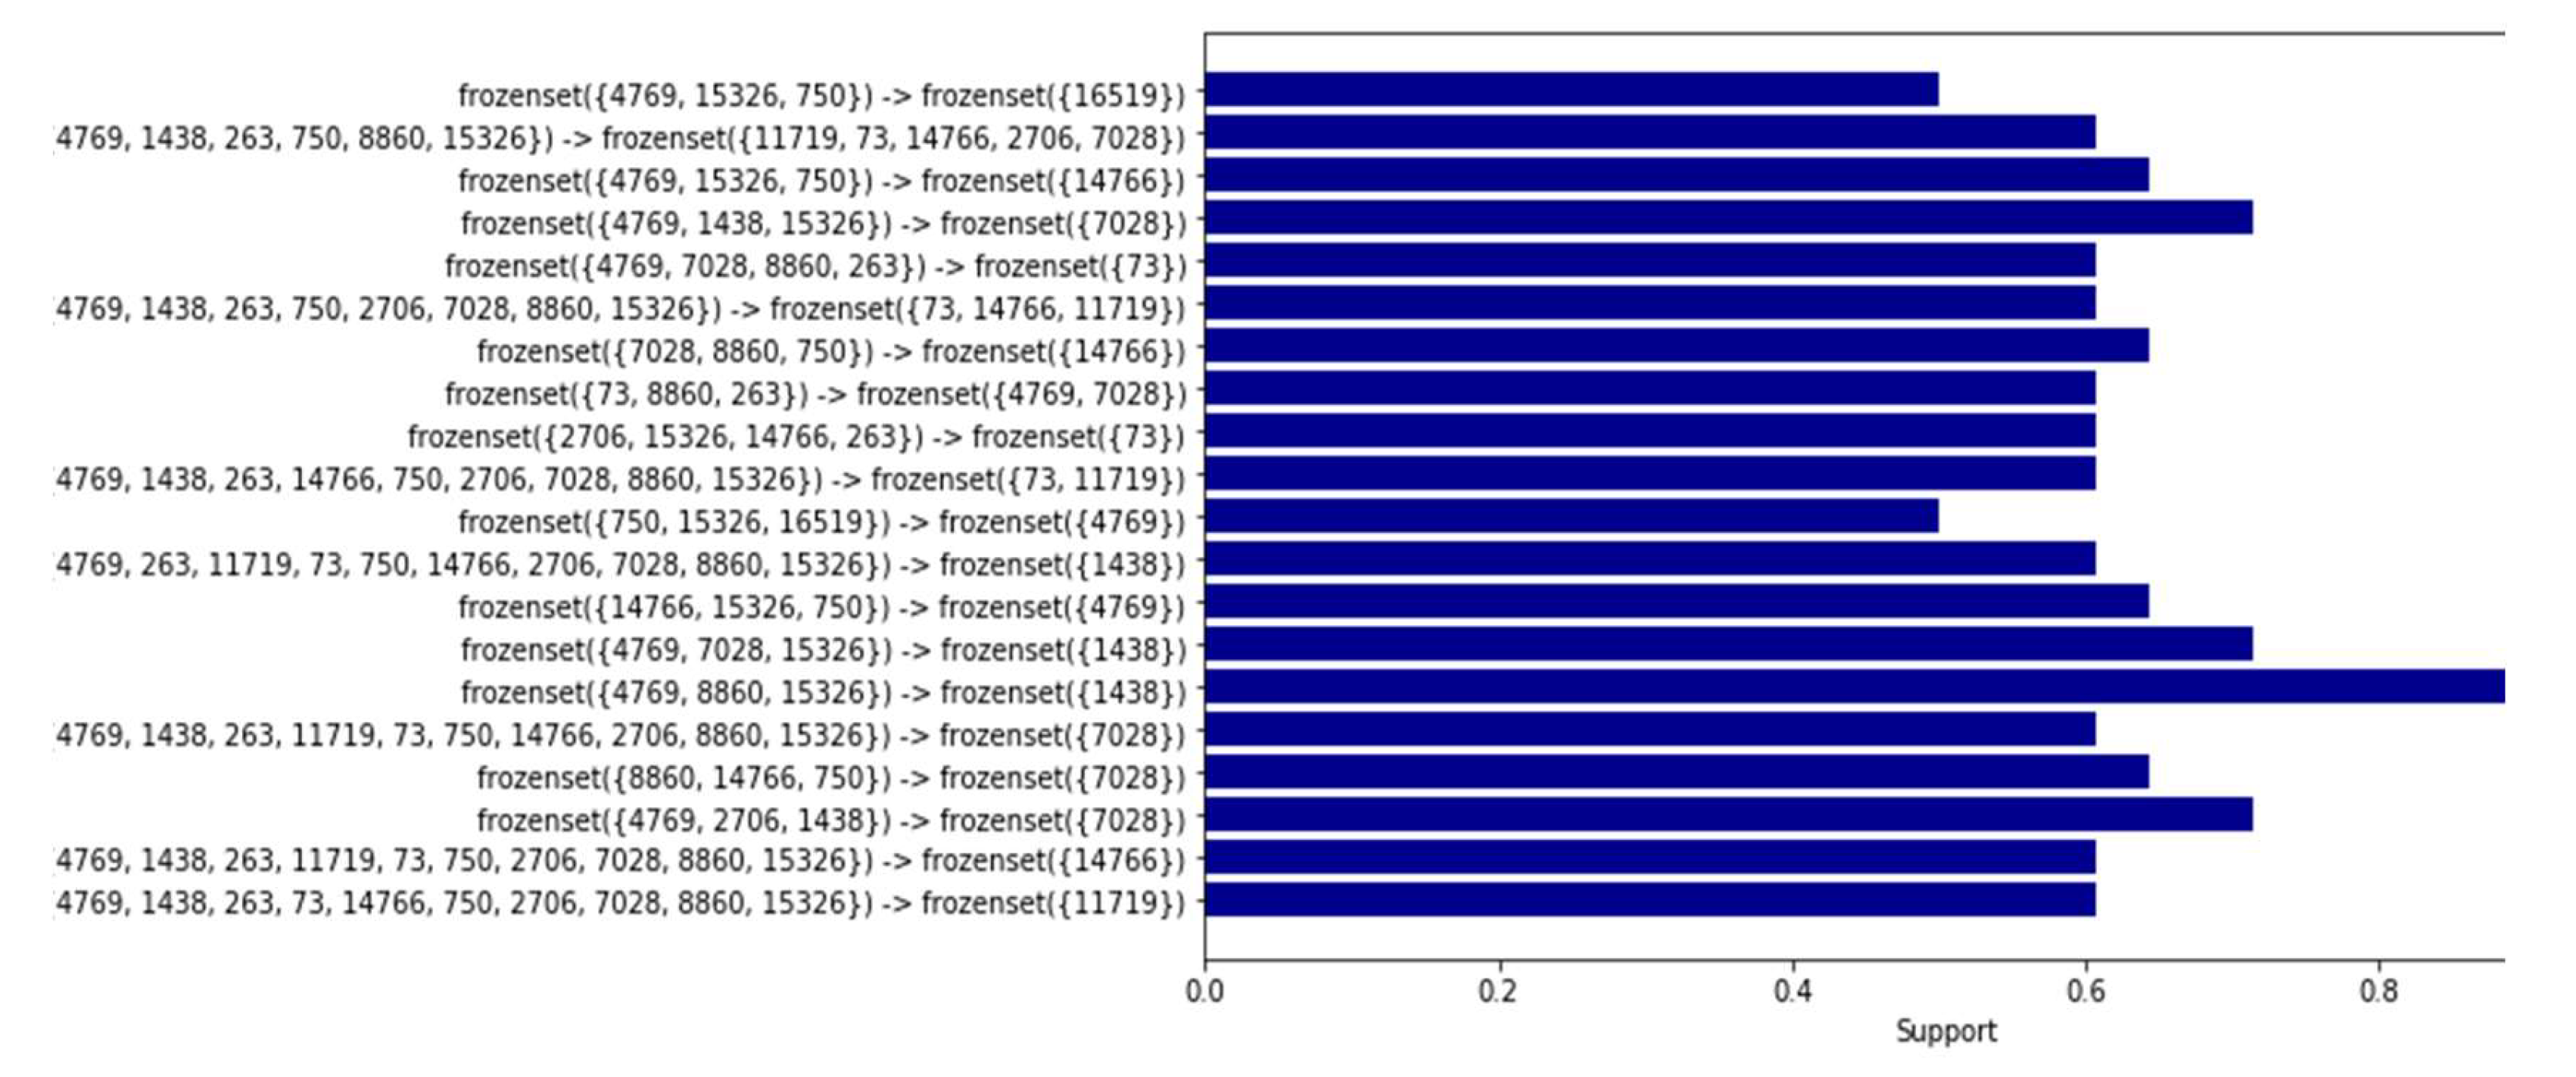
In the dataset of healthy women, the process of removing duplicates drastically reduced the number of rules from 157,140 to only 20 rules. Likewise, in the dataset of women with cancer, a reduction from 5562 to 18 rules was observed, highlighting the effectiveness of the drop_duplicates() command in simplifying the results and removing redundant information, allowing for clearer visualization and deeper analysis of the relationships between polymorphism positions associated with the disease (
Figure 6 and
Figure 7).
Display of rules. Once the association rules were obtained, we worked on visualizing the numbers of most correlated polymorphisms using bar graphs and network plots, which facilitated the interpretation and understanding of the results.
The network graph is a more complex but very powerful way of visualizing the relationships between the polymorphism numbers in the association rules. In this type of graph, each polymorphism number is represented as a node or vertex, and the association rules are represented as arcs or connections between the nodes.
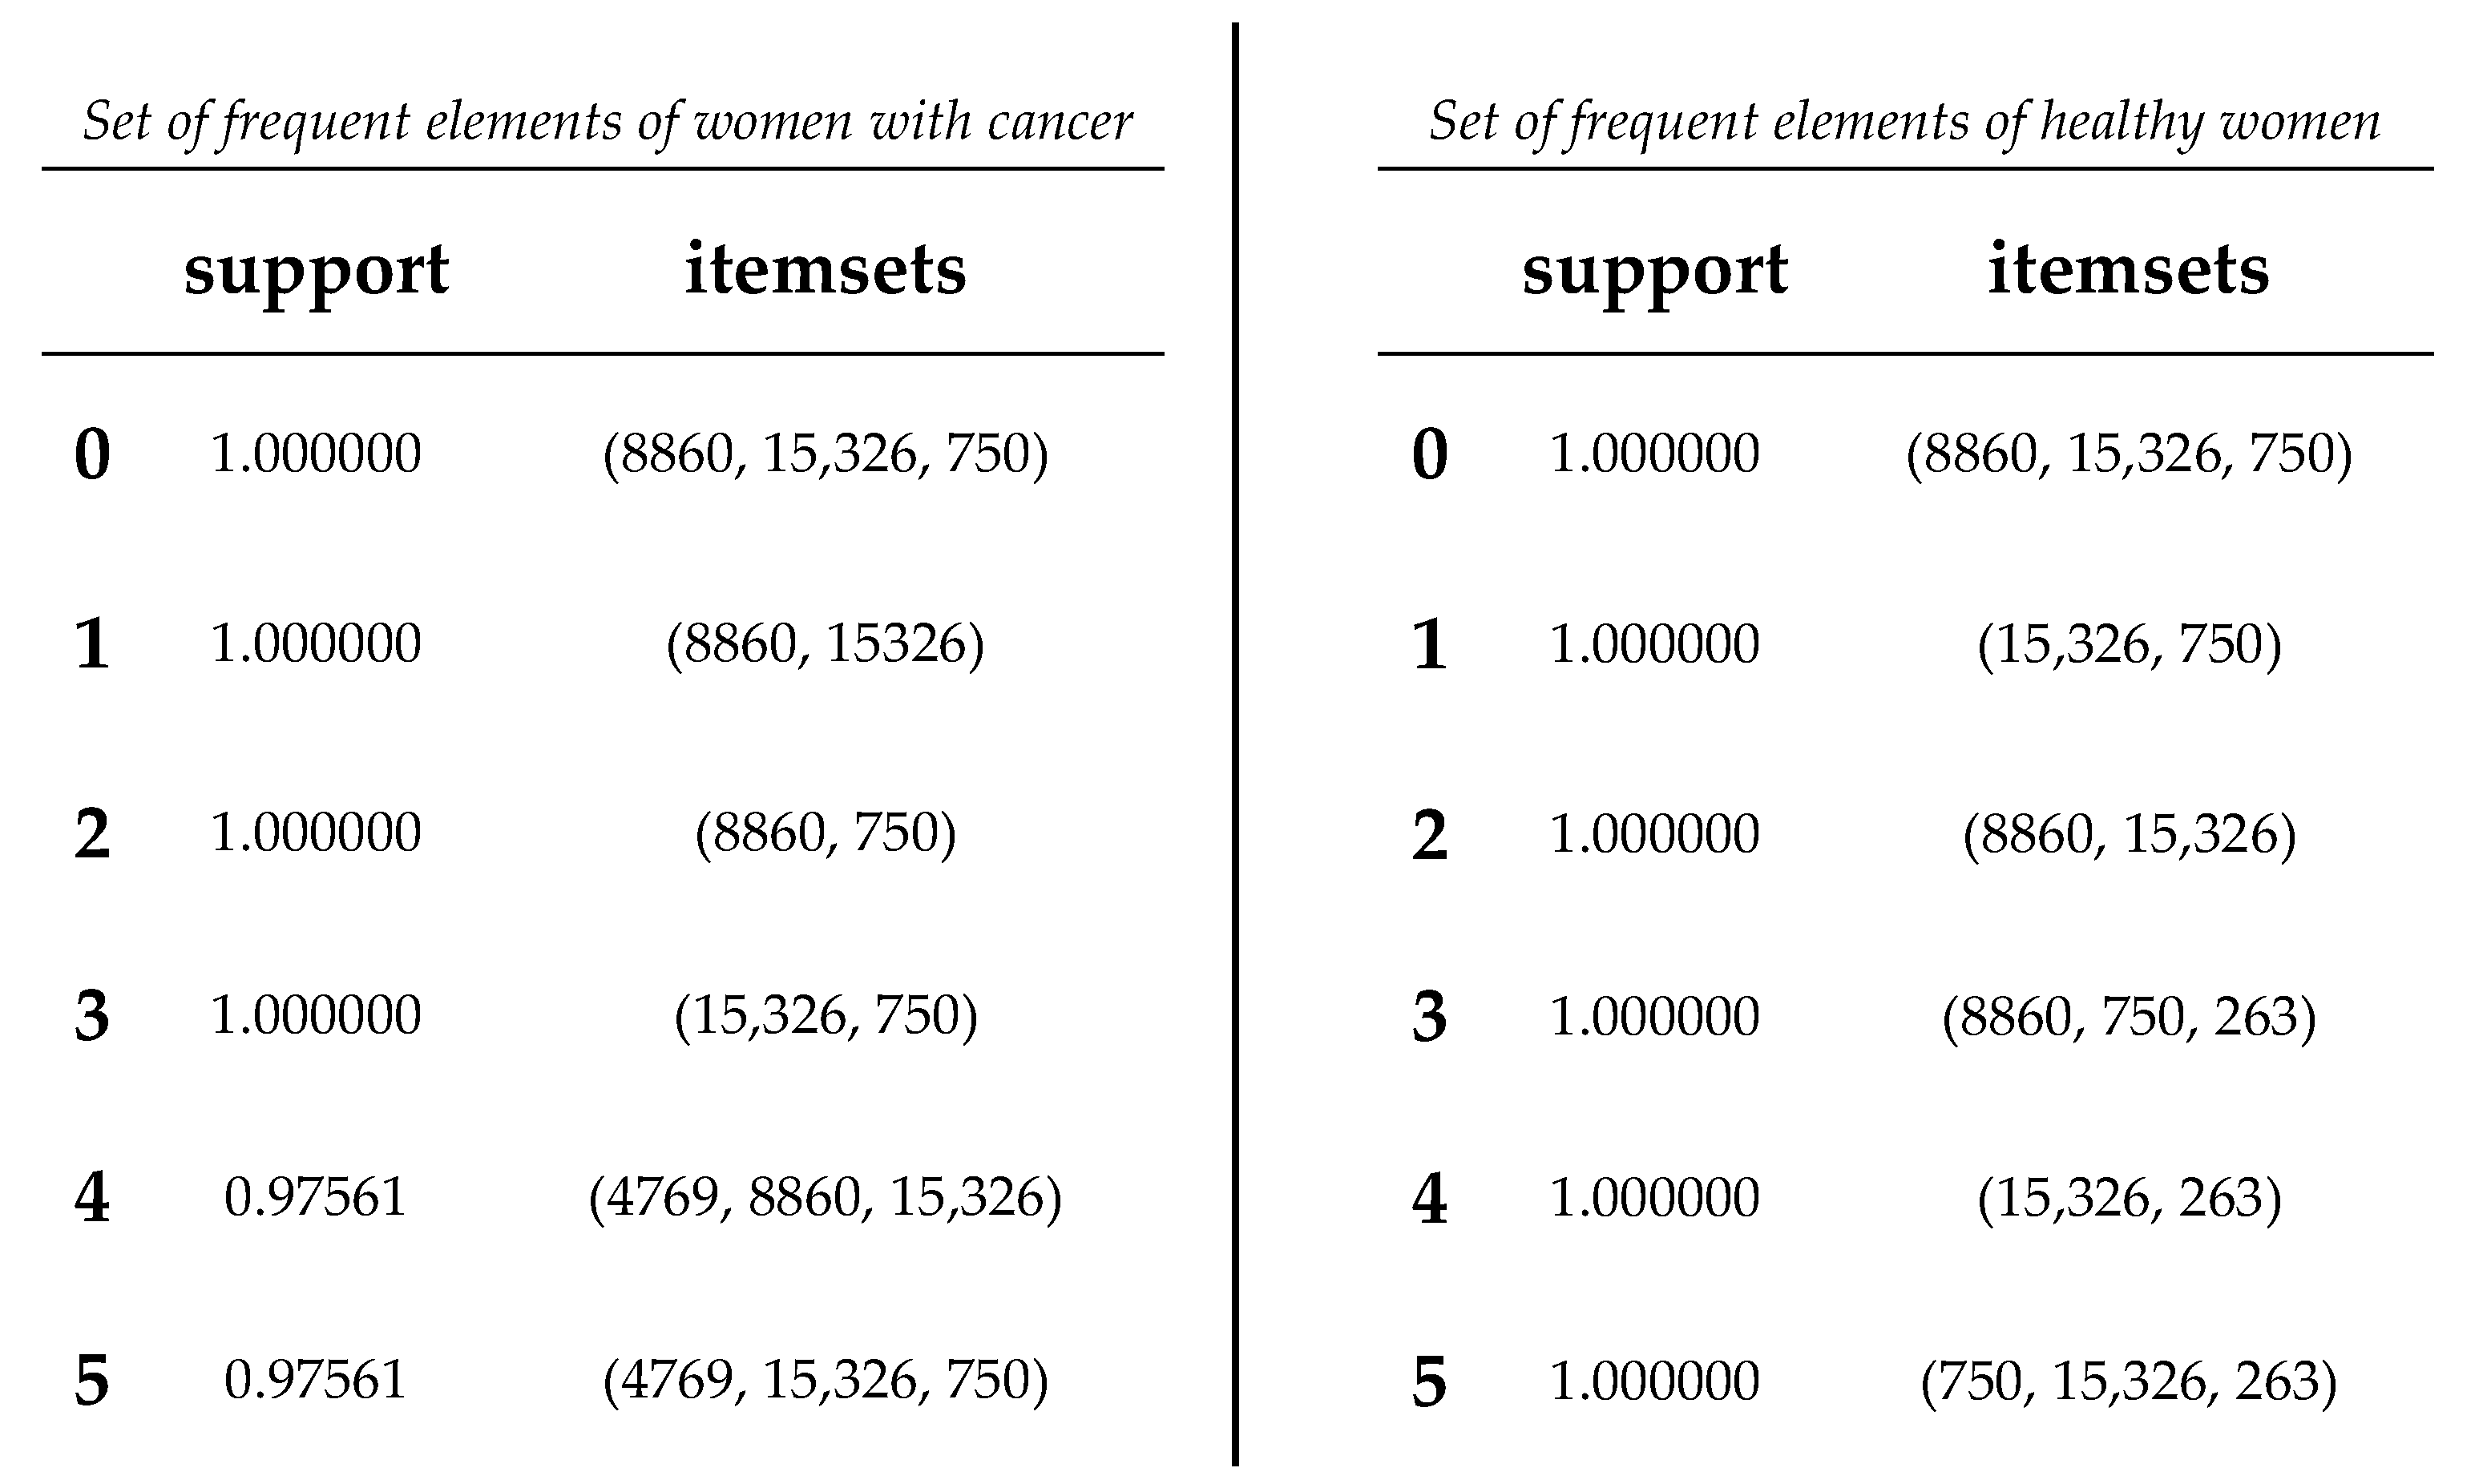
Table 11.
Frequent item set comparison of sequences from women with cancer and healthy women.
Table 11.
Frequent item set comparison of sequences from women with cancer and healthy women.
Based on the obtained results, a comparison was conducted between the association rules identified in the dataset of women with cancer and those derived from the dataset of healthy women (refer to
Figure 8 and
Figure 9). The aim was to identify association rules that exhibited significant strength in the context of women with cancer, but which did not demonstrate comparable strength in the association rules of healthy women. Notably, it was observed that one of these rules exhibited a level of support that exceeded the 0.50 threshold illustrated in Table 14. Interestingly, this particular rule did not rank among the highest-supported rules in the dataset of mitochondrial DNA polymorphisms from healthy women. Throughout the analysis, association rules were identified that showed strong support within the dataset of cancer patients. However, upon comparison with the association rules discovered in the control group of healthy patients, we found that several of these rules also exhibited equally strong support.
The Chi-square test, when analyzing the relationships between categorical variables, provides a quantitative evaluation of the association or independence between them. In the context of our study on the connections between mtDNA polymorphisms and breast cancer in women, this test could help to identify whether the resulting association rules were more than simple coincidences. Obtaining significant results through the Chi-square test supported the hypothesis that there is a substantial relationship between these polymorphisms and the disease, which could provide a basis for future research (Brase and Brase, 2017).
4. Discussion
Association rule analysis revealed interesting patterns and significant associations between polymorphisms at specific mitochondrial DNA positions. A total of 150 association rules were identified, of which 78 showed significant support and confidence. It is crucial to note that this pattern of high frequency and support was not reflected in the same way in the dataset of healthy women. This contrast highlights the possible specific relevance for cancer in women, and suggests that polymorphisms in specific positions of mitochondrial DNA may be related to cancer predisposition.
The regions with more variants in our samples of mtDNA were associated with three regions (
Figure 2): the first in the non-coding sequences of the control region, the second
loci between position 4000 and 4990 with genes MT-TI (4263–4331) coding for tRNA-Ile, MT-TM (4402–4469) coding for tRNA-Met, and MT-TQ (4400–4329r) coding for tRNA-Gln, in the flanking regions of genes MT-ND2 coding for subunit ND2 of complex I (NADH dehydrogenase) and MT-ND1 coding for subunit ND1 of complex I (NADH dehydrogenase); and the third
loci between position 8000 and 8990, with genes MT-TK (8295–8364) coding for tRNA-Lys and MT-ATP8 (8366-8572) coding for subunit ATP8 of complex V (ATP synthase), in the flanking regions of genes MT-ATP6 coding for subunit ATP6 of complex V (ATP synthase) and MT-CO2 coding for subunit COII of complex IV (cytochrome c oxidase). These regions contain the greatest number of variants of the human mitochondrial genome. Usually, the control region and the regions of the tRNA (transfer RNA) and rRNA (ribosomal RNA) coding genes are more prone to accumulating polymorphisms due to the lower selective pressure they experience compared to protein-coding genes. Furthermore, control regions in particular contain regulatory sequences important for mitochondrial DNA replication and transcription, which may make them more susceptible to genetic changes.
Specifically, the results of the Chi-square independence test revealed a significant association between the antecedent (1438, 315, 750) and the consequent (263) in the dataset. This means that the occurrence of the antecedent was significantly related to the occurrence of the consequent. This finding is of particular relevance, as the high degree of support suggests that this rule is frequent and therefore potentially indicative of recurrent patterns in the context of cancer in women.
It is relevant to note that the variant at position 315 appeared related to the incidence of breast cancer. This variant was present in 60.2% of breast cancer cases and 38.2% of controls [
19].
This finding suggests that certain relationships or patterns initially identified as specific to cancer patients were also present in the group of control or healthy patients. In other words, although these association rules were notable in the context of patients with cancer, they were not exclusive to this group and were also found in patients without the disease. This discovery could indicate that the relationships identified are not indicative of the presence or absence of breast cancer itself, but could be related to other factors or characteristics common in both cancer and healthy patients.
However, it is essential to keep in mind that these results are the product of data analysis and should be interpreted with caution. Despite the relevance of these findings, additional research is required to fully understand the extent and clinical relevance of these associations. The results of data analysis alone are not sufficient to establish cause-and-effect relationships. Validation and additional studies are necessary to confirm and fully understand the findings.
5. Conclusions
The culmination of this association rule development and analysis process gave us a deeper and richer perspective on the interconnection of variables in the dataset. Throughout this study, we carefully explored the hidden relationships and underlying patterns between elements of both datasets, revealing connections that may have otherwise gone unnoticed.
Importantly, although the association rule model offers powerful insights into the relationships between variables, its interpretation and application require in-depth contextual analysis. The identified rules do not always imply direct causality and should be considered as possible indicators of patterns that require further exploration and confirmation. The potential applications of these findings are broad, ranging from understanding genetic predisposition to cancer in women to improving diagnostic and treatment strategies. However, the need for additional validation and consideration of multiple factors should be emphasized before drawing definitive conclusions.
Some recommendations were identified to continue this research. The results obtained should be validated and replicated in subsequent studies using independent datasets. This will allow the consistency and generalizability of the identified association rules to be evaluated. Some methods that could be applied in this task are:
Cross-validation—This method involves dividing the dataset into multiple subsets (folds) to train and evaluate the model on different combinations of data. Cross-validation helps evaluate how the model generalizes to different datasets and reduces the risk of overfitting.
Statistical tests and adjustments—Use appropriate statistical tests to evaluate the significance of the associations discovered. Correction for multiple testing, such as the Bonferroni adjustment, may be necessary to control the risk of false positives.
Sensitivity analysis—An analysis to evaluate how changes in parameters and approaches affect the results. This would help us to understand the stability of the findings and their dependence on certain decisions.
Comparison with basal models—Compare the results obtained with basal or random models to verify if the association rules exceed the performance expected by chance.
The combination of these methods could determine the reliability and generalizability of the association rules identified in our research, providing a solid foundation for future research and applications in the oncogenomics field.
Working with a larger and more diverse sample size can obtain results that are more robust and representative of the general population. A larger sample size may also help to identify more subtle associations. To evaluate the clinical applicability of the identified association rules, clinical studies in real patients could be considered. This would allow us to determine whether the associations discovered have practical relevance to the diagnosis and treatment of cancer.
Multidisciplinary collaborations with experts in genetics, oncology, bioinformatics, and other related fields could enrich the analysis and interpretation of the results. Diversity of perspectives can lead to a completer and more accurate picture.
Focusing on different types of cancer and exploring how association rules may vary in different types of cancer could reveal patterns and provide more precise information for prevention and treatment. In the future, this model of association rules could serve as a basis for more detailed and specific research in related areas. As more data is obtained and we refine our methodologies, we will be able to generate even more precise and detailed insights into the interactions and relationships in our domain of study.
Ultimately, this research showed the power of data science and genomics in generating meaningful knowledge and opening new horizons in the research into cancer. We hope that these data science-based results will inspire and motivate other researchers to continue exploring and challenging the limits of what is possible in the search for a deeper understanding of complex systems in genomics and their impact on human health.

