1. Introduction
Glaucoma is a chronic fundus disease and the second leading cause of blindness globally. Experts predict that glaucoma patients worldwide will increase from 64.3 million in 2013 to 118 million in 2040 [
1,
2]. At present, there are three main methods for diagnosing glaucoma based on information technology: The first method involves measuring intraocular pressure (IOP), which tends to increase in glaucoma patients due to an imbalance between intraocular fluid production and drainage. However, a significant number of glaucoma patients exhibit minimal changes in IOP, leading to reduced diagnostic accuracy using this approach.The second method employs visual field (VF) evaluation, which necessitates sophisticated medical equipment and involves subjective diagnosis steps. Although widely used, this method presents challenges in terms of equipment requirements and subjective interpretation.The third method, image evaluation of the optic nerve head (ONH), predominantly relies on the analysis of digital fundus images (DFI) for glaucoma diagnosis and is commonly employed in clinical practice. However, these existing diagnostic methods are characterized by high costs and low efficiency, rendering them unsuitable for large-scale glaucoma screening and diagnosis.With the rapid development of information technology, auxiliary diagnosis technology is significant for large-scale glaucoma diagnosis and screening. Excellent auxiliary diagnosis methods can significantly reduce the cost of diagnosis while improving the accuracy of clinical diagnosis. The vertical cup-to-disc ratio (CDR) is a common reference standard for auxiliary diagnosis of glaucoma. The accurate segmentation of the OD and OC is crucial to the accuracy of the CDR, and it is also the basis for auxiliary diagnosis of glaucoma.
In recent years, deep learning techniques have demonstrated remarkable advancements in medical image segmentation. Compared to traditional methods, deep learning-based segmentation approaches generally outperform conventional methods in terms of accuracy and efficiency. Several researchers have made significant contributions in this field. For instance, reference [
3] proposes a general encoder-decoder network for OD and OC segmentation, incorporating a multi-scale weight shared attention (MSA) module and Densely connected depthwise separable convolution (DSC) module. Additionally, reference [
4]introduces an unsupervised domain adaptation framework, namely Input and Output Space unsupervised domain adaptation (IOSUDA), to address performance degradation in joint OD and OC segmentation. Furthermore, reference [
5] utilizes a deep learning method based on M-Net, which applies a polar coordinate transformation to convert fundus images into a polar coordinate system. Subsequently, the transformed images are processed using M-Net, a multi-label deep network that generates a probability map containing OD and OC regions.To address the issue of automatic OD center localization and long training time, Reference [
6] proposes an approach based on the fully convolutional network FC-DenseNet. However, this method has its limitations.In Reference [
7], an improved fully convolutional network (FCN) is utilized for preprocessing and simultaneous segmentation of OD and OC.Reference [
8] presents a transferable attention U-Net (TAU) model for OD and OC segmentation across different fundus image datasets. This model incorporates two discriminators and attention modules to localize and extract invariant features across datasets.Reference [
9] proposes an attention U-Net based algorithm for fundus image segmentation using transfer learning. It introduces an attention gate to focus on the target area and trains the network on the DRIONS-DB dataset followed by fine-tuning on the Drishti-GS dataset.In Reference [
10], an unsupervised model based on adversarial learning is proposed for OD and OC segmentation and glaucoma screening. The model employs an efficient segmentation and classification network, along with unsupervised domain adaptation techniques to address domain transfer challenges.
Despite these advancements, several challenges persist in OD and OC segmentation based on deep learning. First, the segmentation model structures often exhibit complexity, resulting in high computational costs and lengthy segmentation times. Maintaining a balance between segmentation accuracy and computational cost and time remains a challenge. Second, the generalization ability of the models across different datasets is limited, making it difficult to achieve consistent performance on diverse datasets. Finally, the significant model training weights pose difficulties in deployment and application on mobile terminals.
In this paper, we propose an end-to-end OD and OC segmentation network model that overcomes these challenges by achieving reduced computation and faster inference speed, facilitating mobile deployment. Our approach employs joint multi-label segmentation of OD and OC and introduces a boundary branch to enhance segmentation accuracy. Leveraging adversarial learning, we optimize the segmentation boundaries to further improve accuracy. Compared to previous methods, our network model demonstrates fewer parameters, lower computational costs, faster inference times, and state-of-the-art segmentation accuracy.
The main contributions of this work can be summarized as follows: (1) We propose an end-to-end optic disc and optic cup segmentation network with reduced computation and faster inference time. By employing a lightweight feature extraction network, we improve segmentation efficiency while maintaining segmentation accuracy. (2) Our proposed method achieves a rapid reasoning process, taking only approximately 24 milliseconds, making it suitable for mobile deployment and clinical auxiliary applications. (3) Through multi-label segmentation and adversarial learning, we optimize the boundary segmentation, thereby enhancing the segmentation accuracy of the optic disc and optic cup, as well as improving the model’s generalization ability.
The remainder of this paper is organized as follows:
Section 2 presents the segmentation method and network architecture.
Section 3 discusses the experimental details and presents the results.
Section 4 conducts ablation experiments to analyze the proposed method further.
Section 5 provides additional discussion on our proposed approach. Finally,
Section 6 summarizes the study.
2. Methods
2.1. Generating the Network
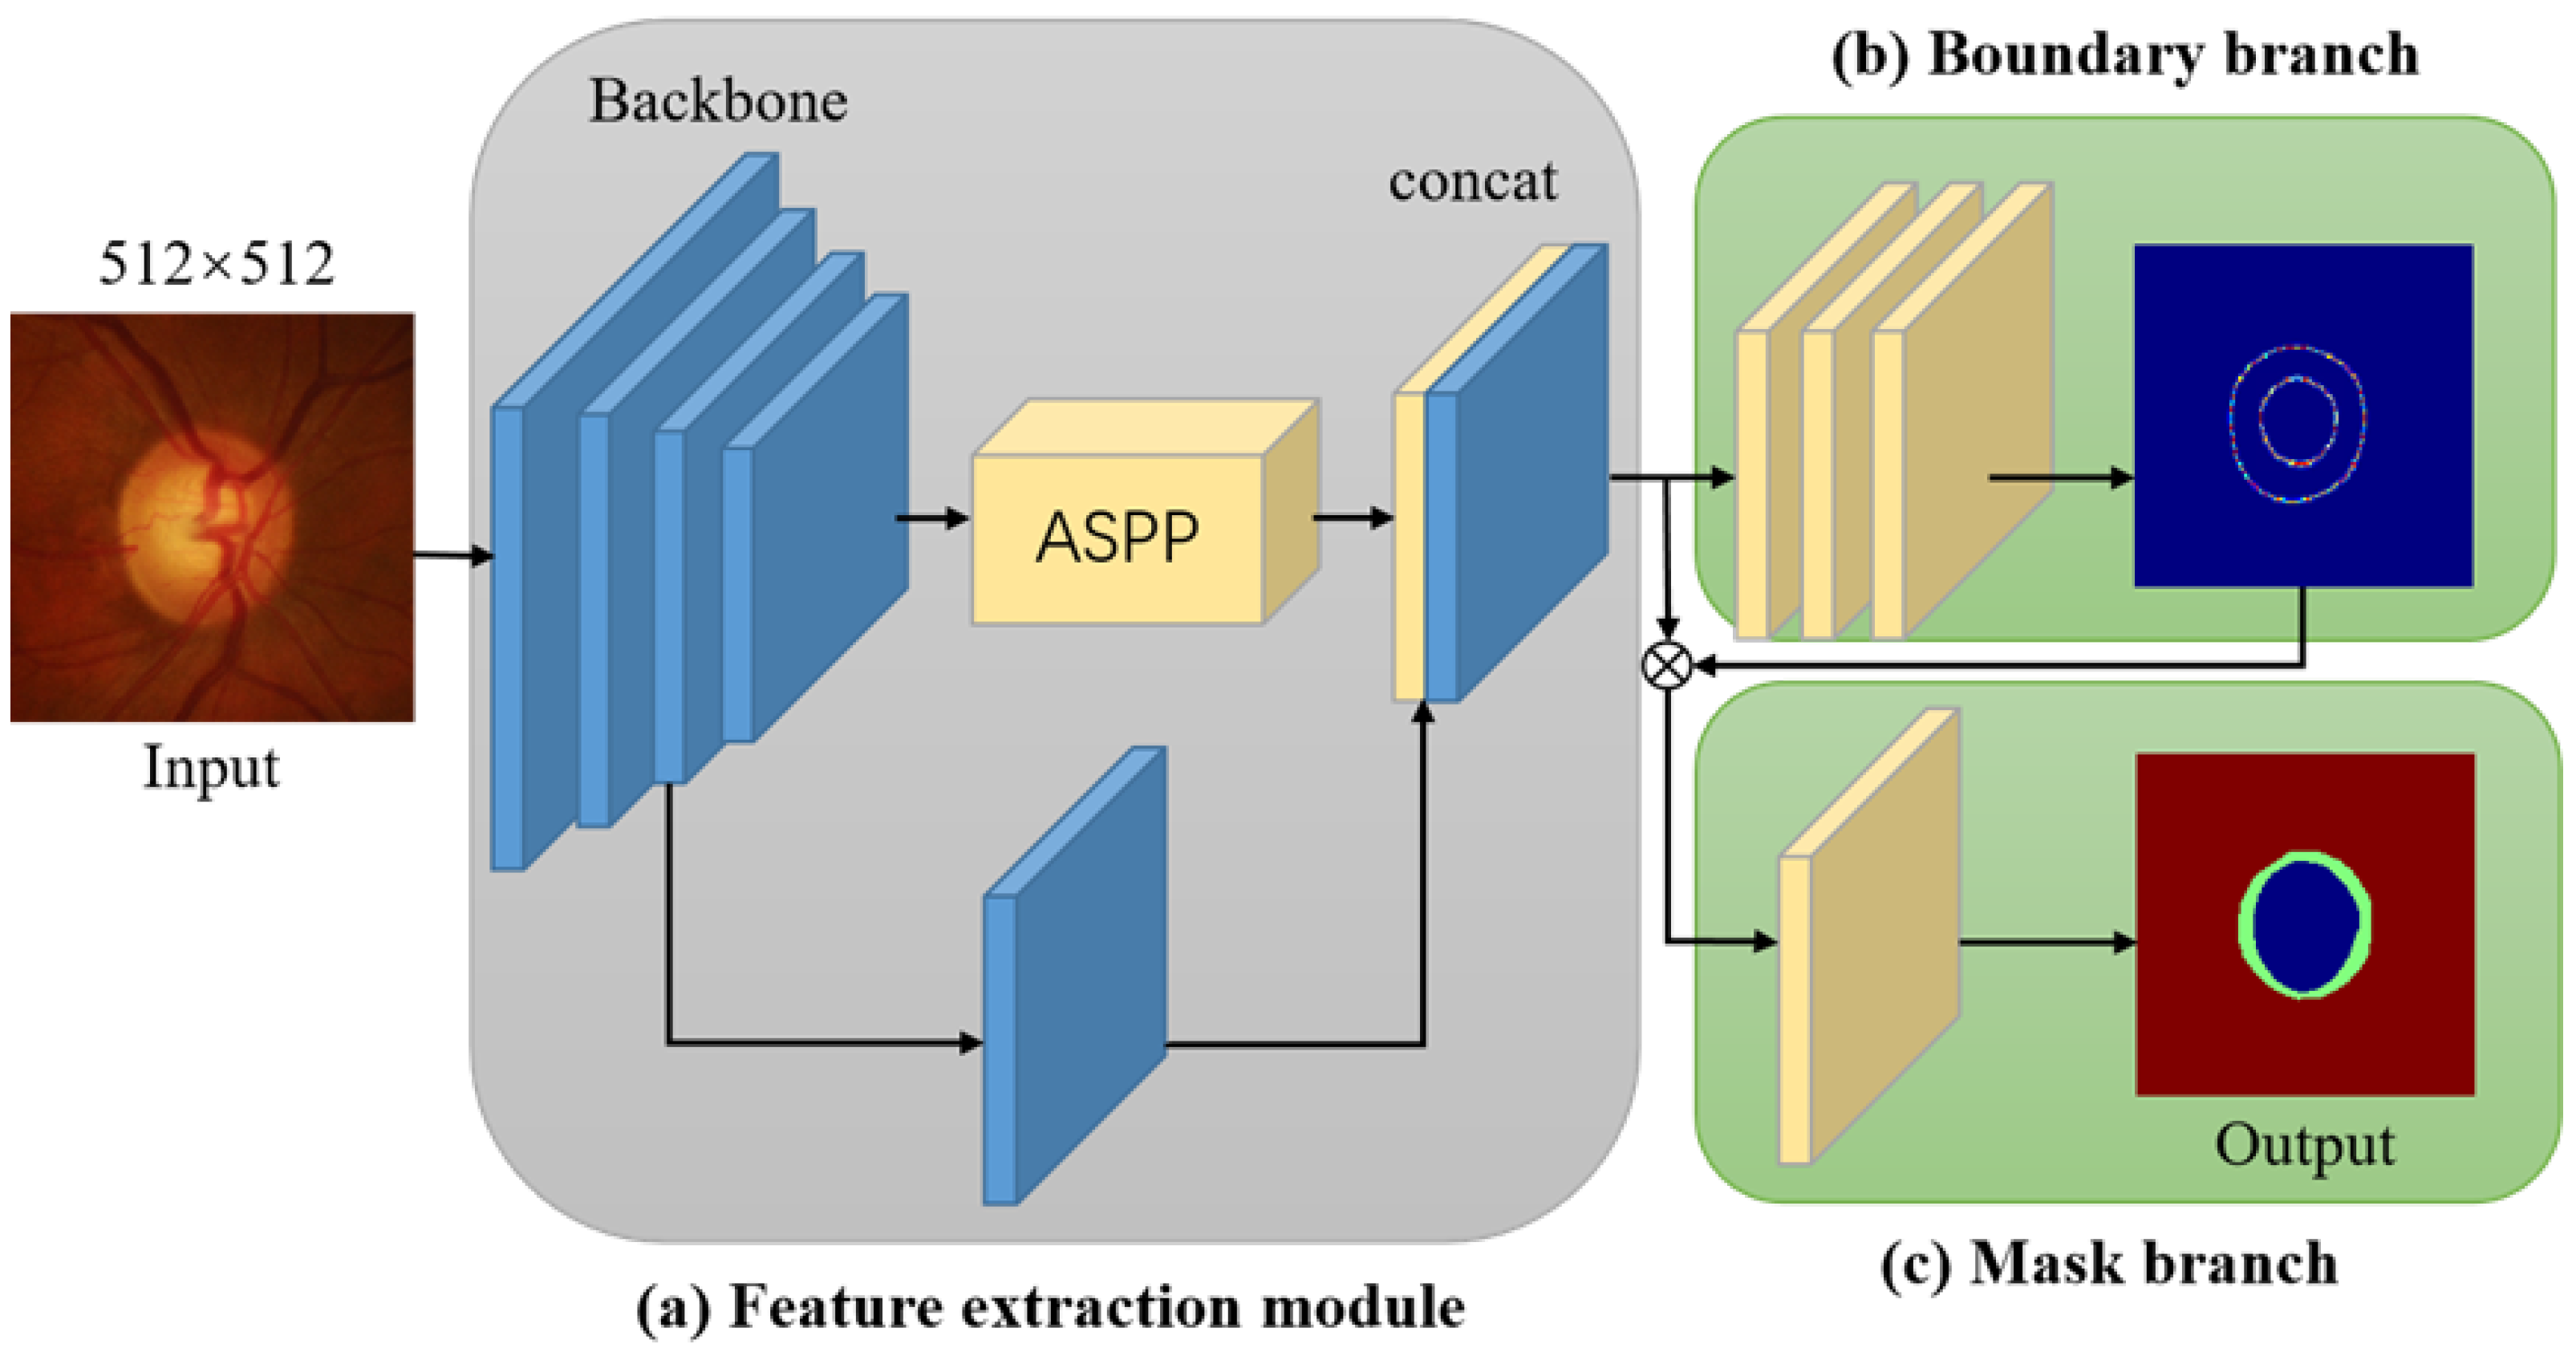
This paper proposes a lightweight segmentation network, which inherits the idea of Deeplabv3+ [
11] in its overall structure. After the feature extraction network, a spatial pyramid pooling module (Atrous Spatial Pyramid Pooling, ASPP) with atrous convolution is connected. At the same time, to integrate more feature information and fuse the shallow features of the feature extraction network with the feature map obtained by the spatial pyramid pooling module to obtain more feature information. The difference is that the feature extraction network used by the Deeplabv3+ network is the ResNet [
12] series of networks; the performance of the ResNet network in feature extraction is excellent. Still, at the same time, it is accompanied by a vast amount of computation, which goes against the goal of designing a lightweight and efficient segmentation network model. Inspired by the successful application of the MobileNet [
13,
14,
15] series of networks on the mobile side, this paper replaces the Deeplabv3+ feature extraction network ResNet with the MobileNet network, and proposes a feature extraction method based on the MobileNetv3 network.
Figure 1.
Overview of MBG-NET network architecture. (a) is the feature extraction module, (b) is the boundary branch, (c) is the mask branch.
Figure 1.
Overview of MBG-NET network architecture. (a) is the feature extraction module, (b) is the boundary branch, (c) is the mask branch.
In terms of specific operations, the MBG-Net utilizes the large version of the MobileNetv3 network as its feature extraction network. However, only the first convolutional layer and 15 inverted residual blocks from the large MobileNetv3 version are utilized. Additionally, the stride of the third-to-last inverted residual block is modified from 2 to 1. Experimental comparisons have demonstrated that this alteration is advantageous for extracting local features. To better extract contextual information, multi-scale feature fusion is performed on the extracted feature maps using the spatial pyramid pooling module with atrous convolution. Subsequently, the feature map obtained from the spatial pyramid pooling module undergoes operations such as batch normalization (BN) and rectified linear unit (ReLU) with a convolution kernel size of 1 × 1 to reduce the number of feature map channels. Afterwards, the feature map is upsampled four times, and the resulting feature map is combined with the feature map obtained from the third inverted residual block of MobileNetv3.
To improve the accuracy of OD and OC segmentation, a multi-label approach is utilized. The obtained feature maps are fed into the boundary prediction branch and mask prediction branch. Specifically, for the boundary branch, the feature map undergoes three convolution operations, where the output channels of the first two convolutions are set to 256. The final convolution operation produces a feature map with a single channel, resulting in the predicted boundaries for OD and OC. As for the mask branch, the feature map is concatenated with the predicted boundary feature map and then subjected to a convolution operation. The output feature map consists of 2 channels, corresponding to the predicted OD and OC masks. The obtained mask features are subsequently upsampled by a factor of four to obtain a mask prediction map with the same size as the input image. All the convolution operations mentioned above have a stride of 1. To optimize the boundary and mask predictions, the boundary regression loss and mask prediction loss are defined by equations (1) and (2), respectively.
For formula
1,
N represents the number of pixels,
is the natural boundary map generated by morphological closure operation and Gaussian filter, and
is the boundary prediction map predicted by the segmentation network. For Eq.
2,
is the ground-truth mask label and
is the mask prediction map predicted by the segmentation network.
The method in this paper sends the prediction mask map to the patch discriminator (PatchGAN) to deceive the patch discriminator into optimizing the parameters of the entire segmentation network so that the segmentation network can generate a more realistic prediction map. The segmentation network is optimized using the subsequent adversarial loss:
Joint Loss function: We can consider loss function that is a combination of the segmentation loss and the boundary loss as follows:
To sum up, the loss for the segmentation network consists of the boundary prediction loss, the mask prediction loss, and the adversarial loss, namely, and is set to 0.01 according to experience.
2.2. Adversarial Networks
A PatchGAN is employed as the adversarial network for MBG-Net. The concept of adversarial learning aims to achieve an optimal solution, specifically the optimal segmentation effect, through a maximization and minimization game between the Generator and the discriminator. After comparing discriminators such as ImageGAN and PixelGAN, PatchGAN is chosen as the adversarial generative network for MBG-Net. PatchGAN is capable of capturing local information in the output space, enabling the segmentation network to focus on local structural similarity within image patches. This adversarial processing ensures the geometric constraints of the segmentation masks.
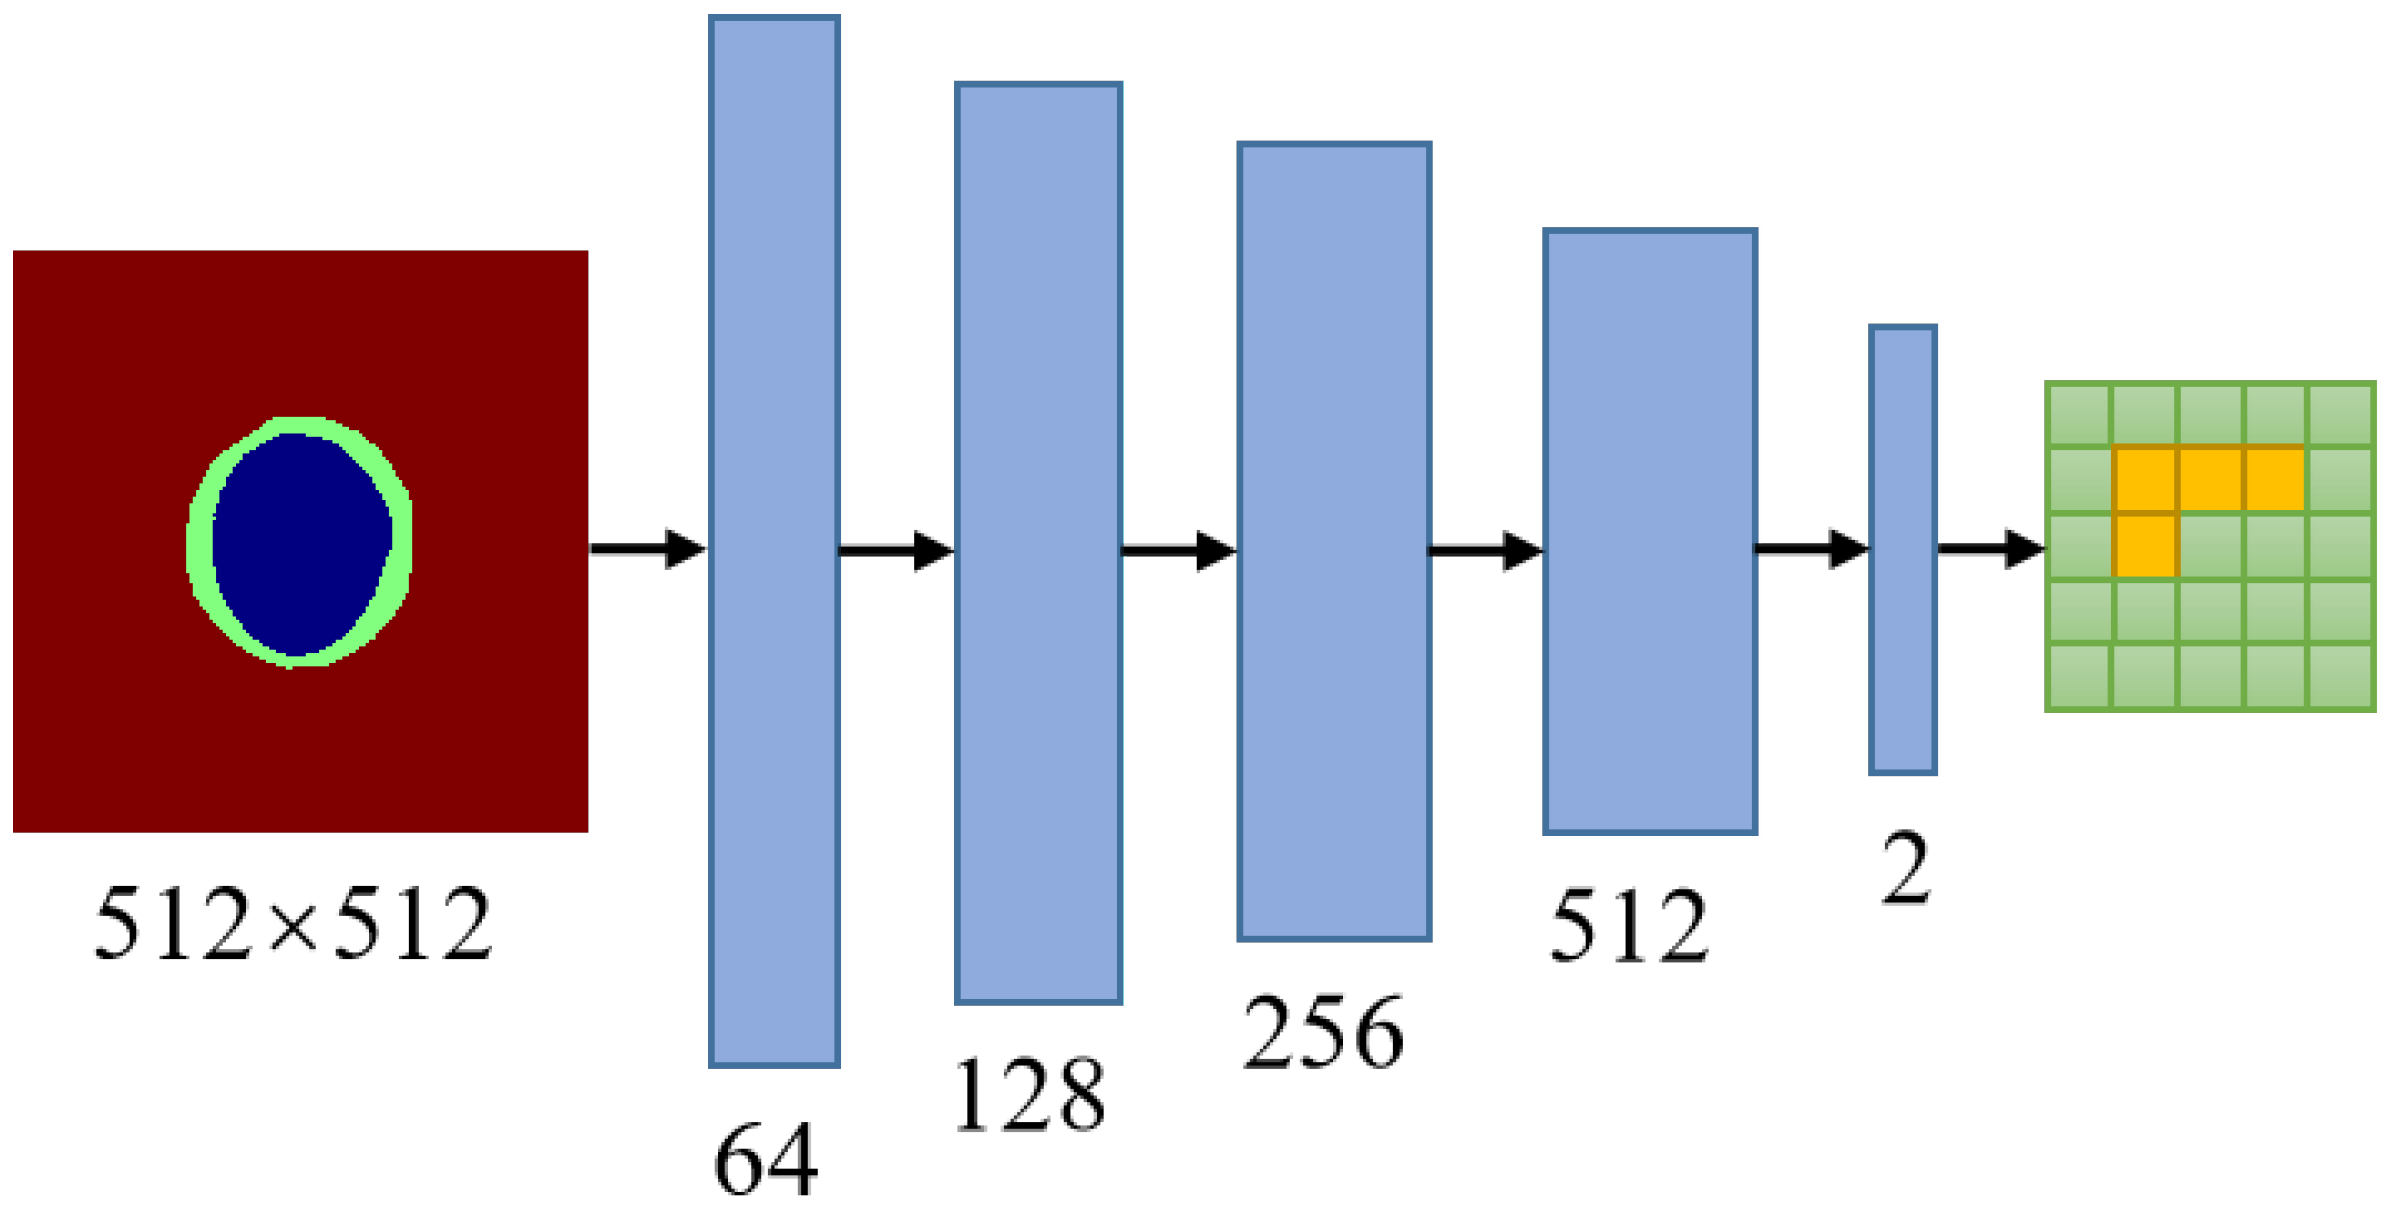
Concretely, a PatchGAN is connected after the mask branch. As illustrated in
Figure 2, the PatchGAN network consists of five convolutional layers. The convolutional kernel size is set to
with a stride of 2. The output channels of the five convolutional layers progress from shallow to deep, with sizes of 64, 128, 256, and 512, respectively. The final output channel is 2. The activation function after the last convolutional layer is the Sigmoid function, while the activation functions after the other convolutional layers are LeakyReLU with a negative slope value of 0.2.
For the parameter training of the patch discriminator network, Equation (
5) is used for optimization, which is used to distinguish whether the mask comes from the segmentation network, the Generator. During the training process, a strategy of interactive training between the Generator and the discriminator is adopted to optimize the parameters of the entire network, and a set of optimal model parameters is learned through the max-min game between the Generator and the discriminator.
For Eq.
5,
represents the mask prediction map, and
represents the manually annotated mask map.
3. Experiments and Results
3.1. Datasets
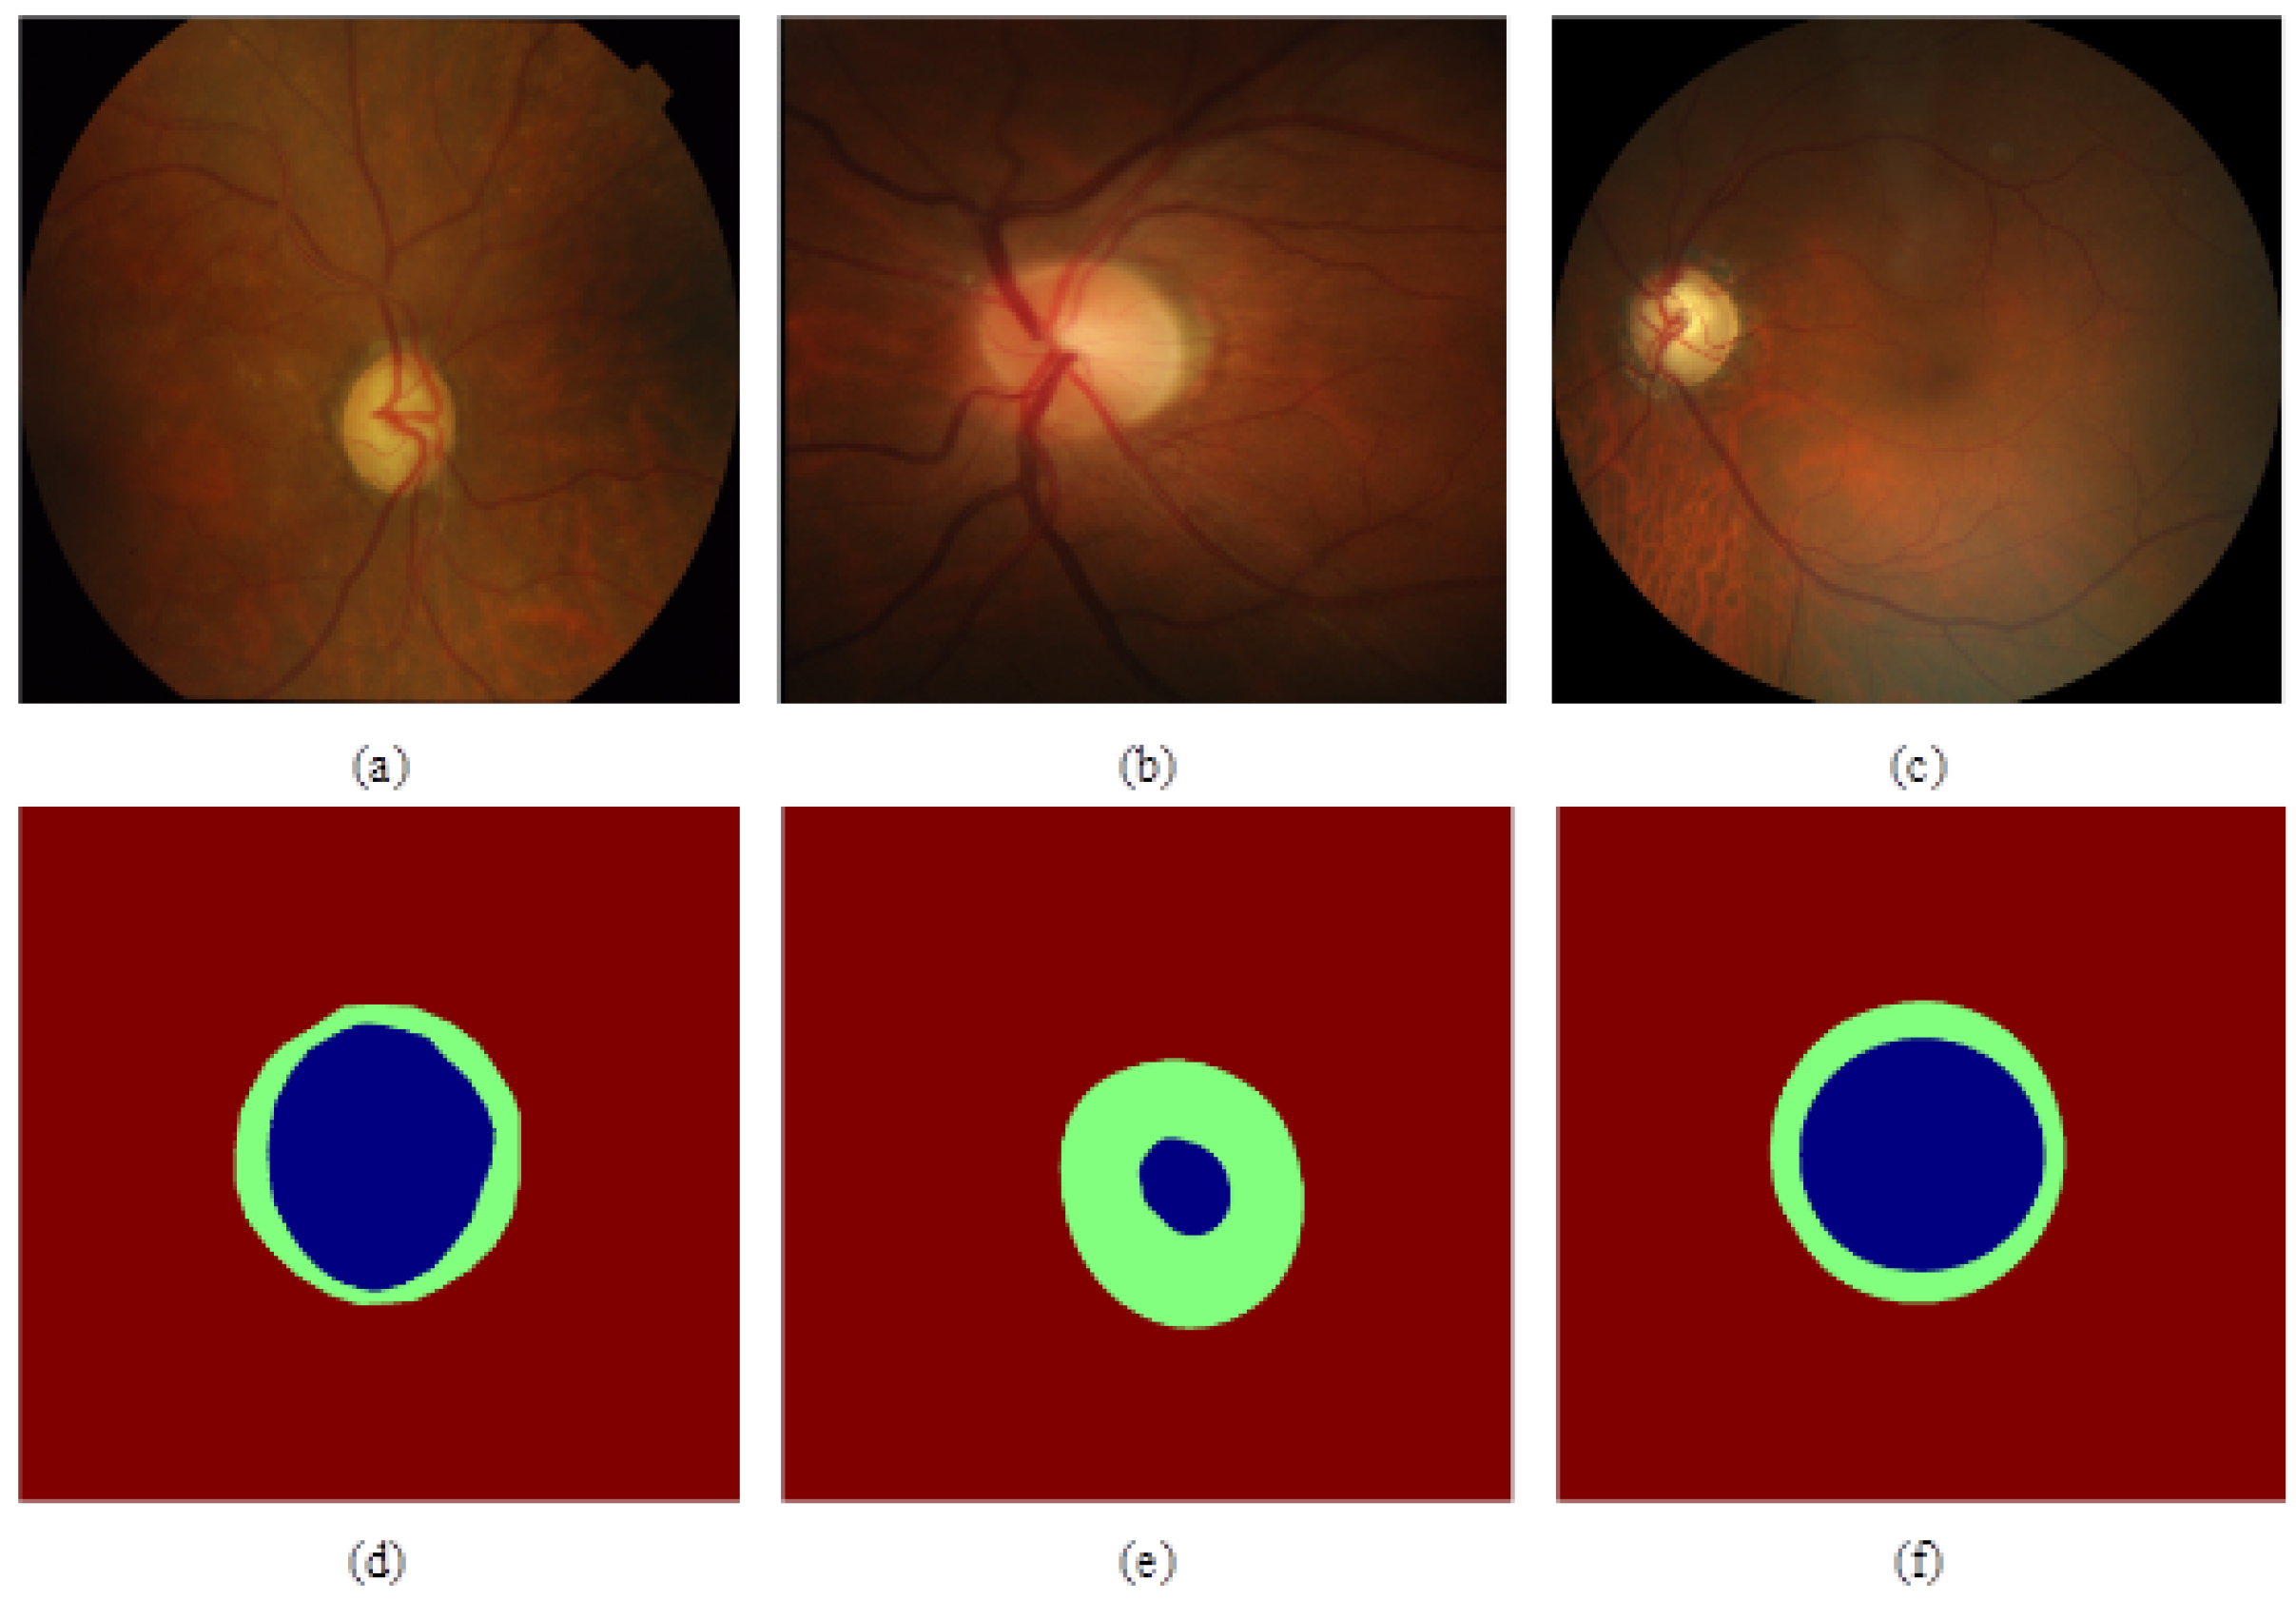
The experiment selected three public fundus datasets, Drishti-GS, RIM-ONE-r3, and REFUGE, as the experimental datasets. The Drishti-GS dataset consists of 101 fundus images, including 31 normal fundus and 70 glaucoma fundus images. The RIM-ONE-r3 dataset consists of 159 fundus images, including 85 normal fundus and 74 glaucoma fundus images. The REFUGE dataset is currently the largest open-source glaucoma fundus dataset. It consists of 1200 fundus images, including 400 training sets, 400 validation sets, and 400 test sets. The sample graphs and annotation graphs of the three datasets are shown in
Figure 3. (a) (d) is the sample map of glaucoma fundus and the corresponding annotation map of the Drishti-GS dataset, (b) (e) is the sample map of the normal eye fundus, and the corresponding annotation map of the RIM-ONE-r3 dataset, (c) (f) is the glaucoma fundus sample map and the corresponding annotation map of the REFUGE dataset. In (d) (e) (f), green represents the optic disc, and blue represents the optic cup. The experiment uses the training set in the REFUGE dataset as the experimental dataset, of which 320 images are used as training and validation sets, and 80 images are used as test sets. The specific data of the three datasets are shown in Table 1:
Table 1.
Statistics of the datasets used in evaluating our method..
Table 1.
Statistics of the datasets used in evaluating our method..
| Dataset |
Number of samples |
Image size |
Cameras |
Release year |
| Drishti-GS [16] |
50+51 |
2047×1759 |
unknown |
2014 |
| RIM-ONE-r3 [17] |
99+60 |
2144×1424 |
unknown |
2015 |
| REFUGE [18] |
320+80 |
2124×2056 |
Zeiss Visucam 500 |
2018 |
3.2. Implementation Details
The experimental model is implemented based on the PyTorch deep learning framework. First, the segmentation network is trained, and then the adversarial learning network is introduced to optimize the parameters of the entire MBG-Net. A set of optimal model parameters is obtained through alternate training. The Adam optimizer is used for training the segmentation network, and the stochastic gradient descent (SGD) algorithm is used when training the patch discriminator network. In the experiment, the pre-trained weights on the ImageNet dataset are used as the initialization weights of the feature extraction network, namely Mobilenetv3_large. The initial learning rates of the segmentation network and patch discriminator are set to 1e(-3) and 2.5e(-5) Respectively, the Momentum is set to 0.9. The experiments are trained on an NVIDIA GTX 1080Ti GPU with a batch size of 8 for 300 epochs. For the region of interest (ROI) extraction, we follow the method [
17]. Firstly, use the U-Net network to perform rough OD location, and then an area of
is crop as the input of MBG-Net centeringon OD mask. Due to the small number of fundus pictures in the used dataset, the data augmentation methods were used to increase the number and diversity of pictures, include random scaling, rotation, flipping, elastic transformation, contrast adjustment, adding noise, and random erasing. At the same time, to optimize the output, the experiments performed morphological and median filtering operations on the obtained prediction masks, that is, hole filling and the selection of the largest connected region.
3.3. Algotithm Evaluation
Dice Index (DI) is a standard evaluation index for segmentation task, and the CDR is one of the critical indicators for clinical glaucoma screening. This paper adopts DI and CDR to evaluate the segmentation performance of the MBG-Net network. The evaluation criteria are defined as follows:
The mean absolute error(MAE) is defined as the accuracy of CDR estimate, which is calculates the average error rate of all samples, as Eq.(
8) shows. lower
values represent better prediction results.
where and represent the vertical cup-to-disc ratio of the OD and OC of the ground truth and the vertical cup-to-disc ratio of the OD and OC of the predicted segmentation respectively. N represents the number of test samples. VDD and VCD are calculated by OD and OC segmentation results, respectively, and then CDR is calculated.
represent the number of pixels for true positives, false positives, and false negatives, respectively, and represent the predicted vertical cup-to-disc ratio of the OD and OC and the actual segmented label optic disc and optic cup vertical cup-to-disc ratio, respectively. Use the absolute error to evaluate the difference between the predicted and the true and a lower value represents a better prediction result.
3.4. Experimental Results
For Drishti-GS and RIM-ONE-r3 datasets ,We compare our MBG-Net with several stste-of-the-art OD and OC segmentation methods: pOSAL [
17], BEAL [
19], TD-GAN [
20], BGA-net [
21], Sevastopolsky [
22], Zilly [
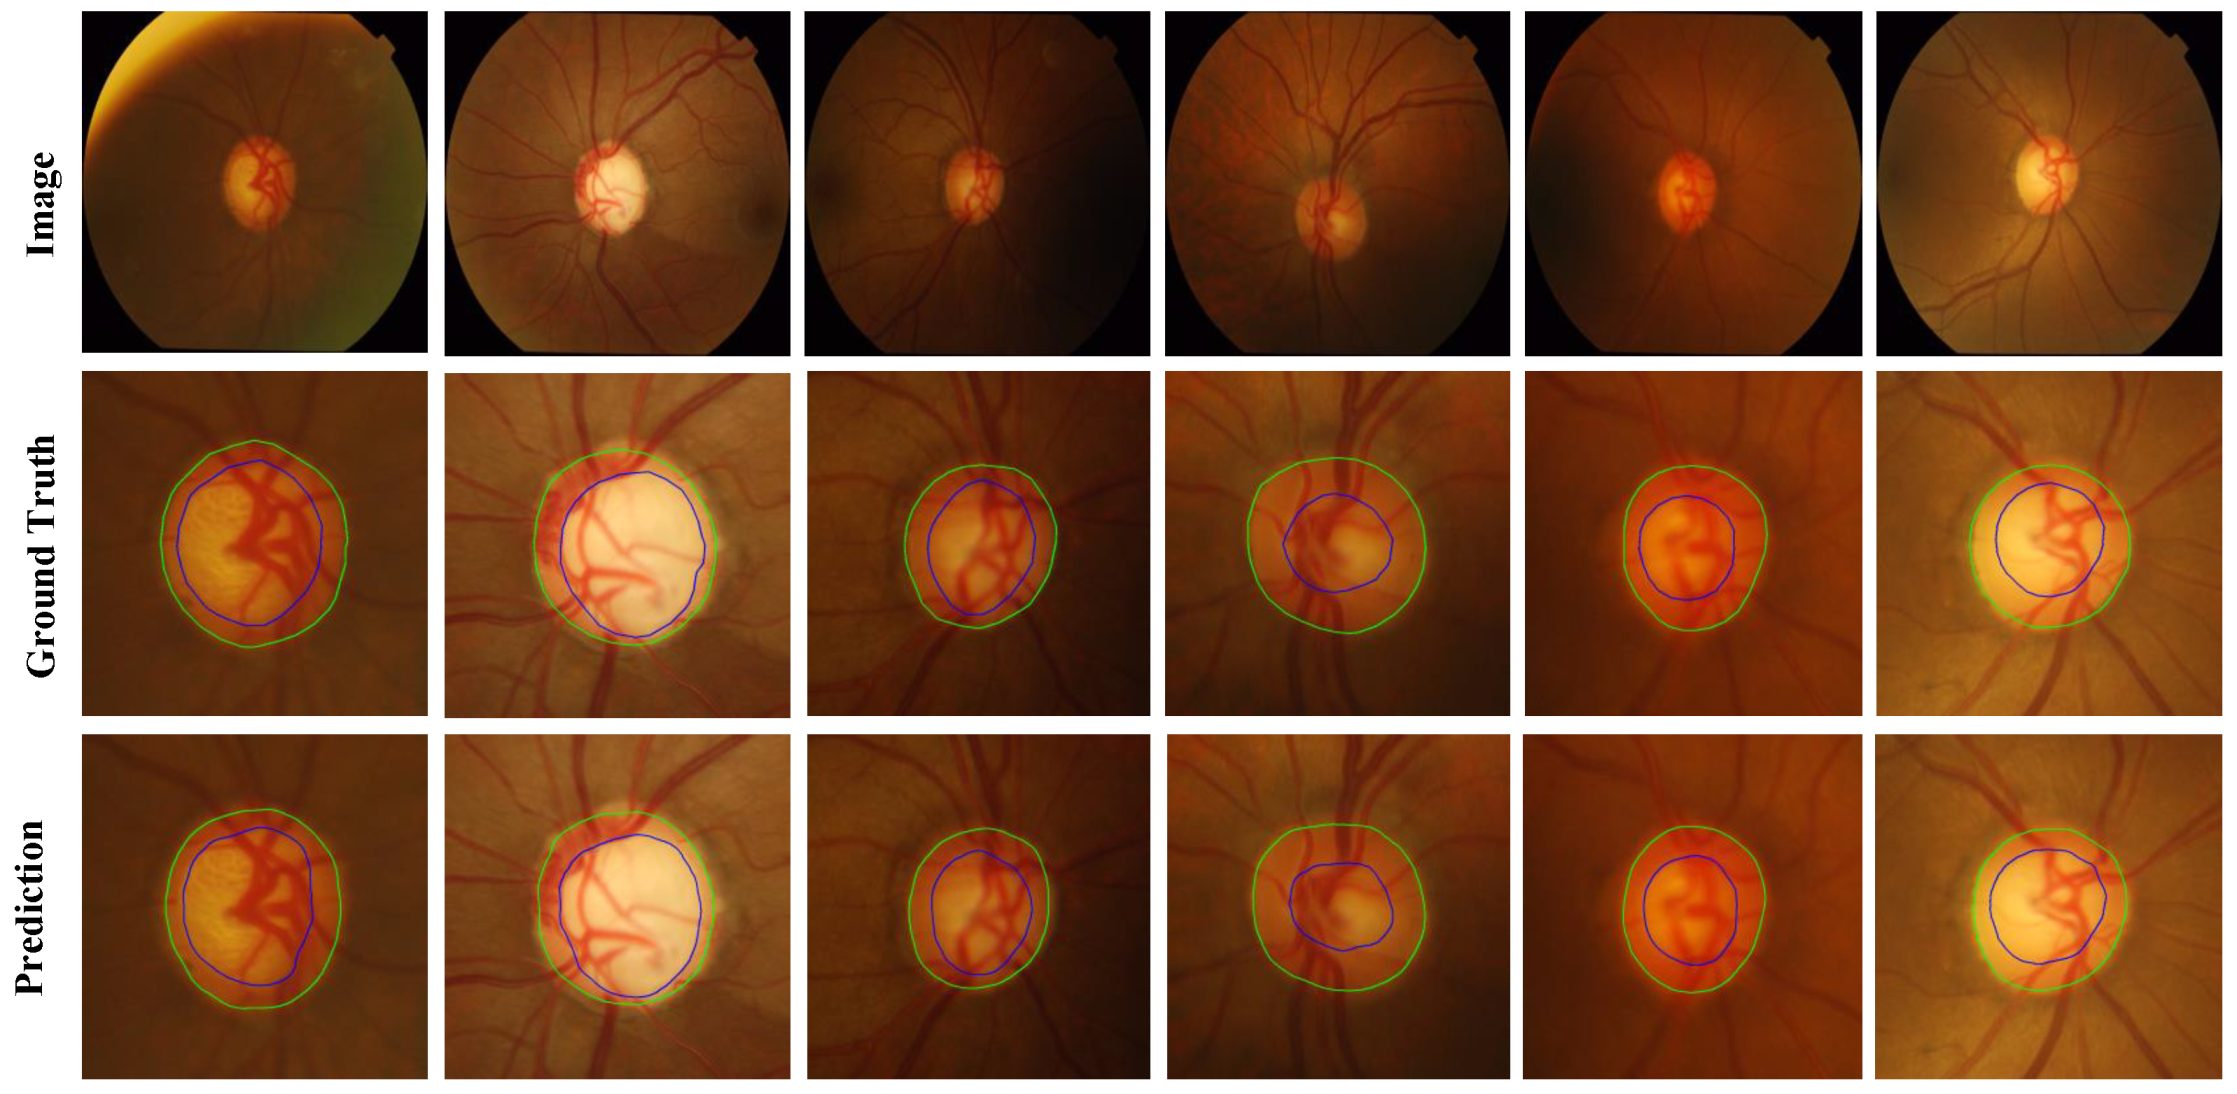
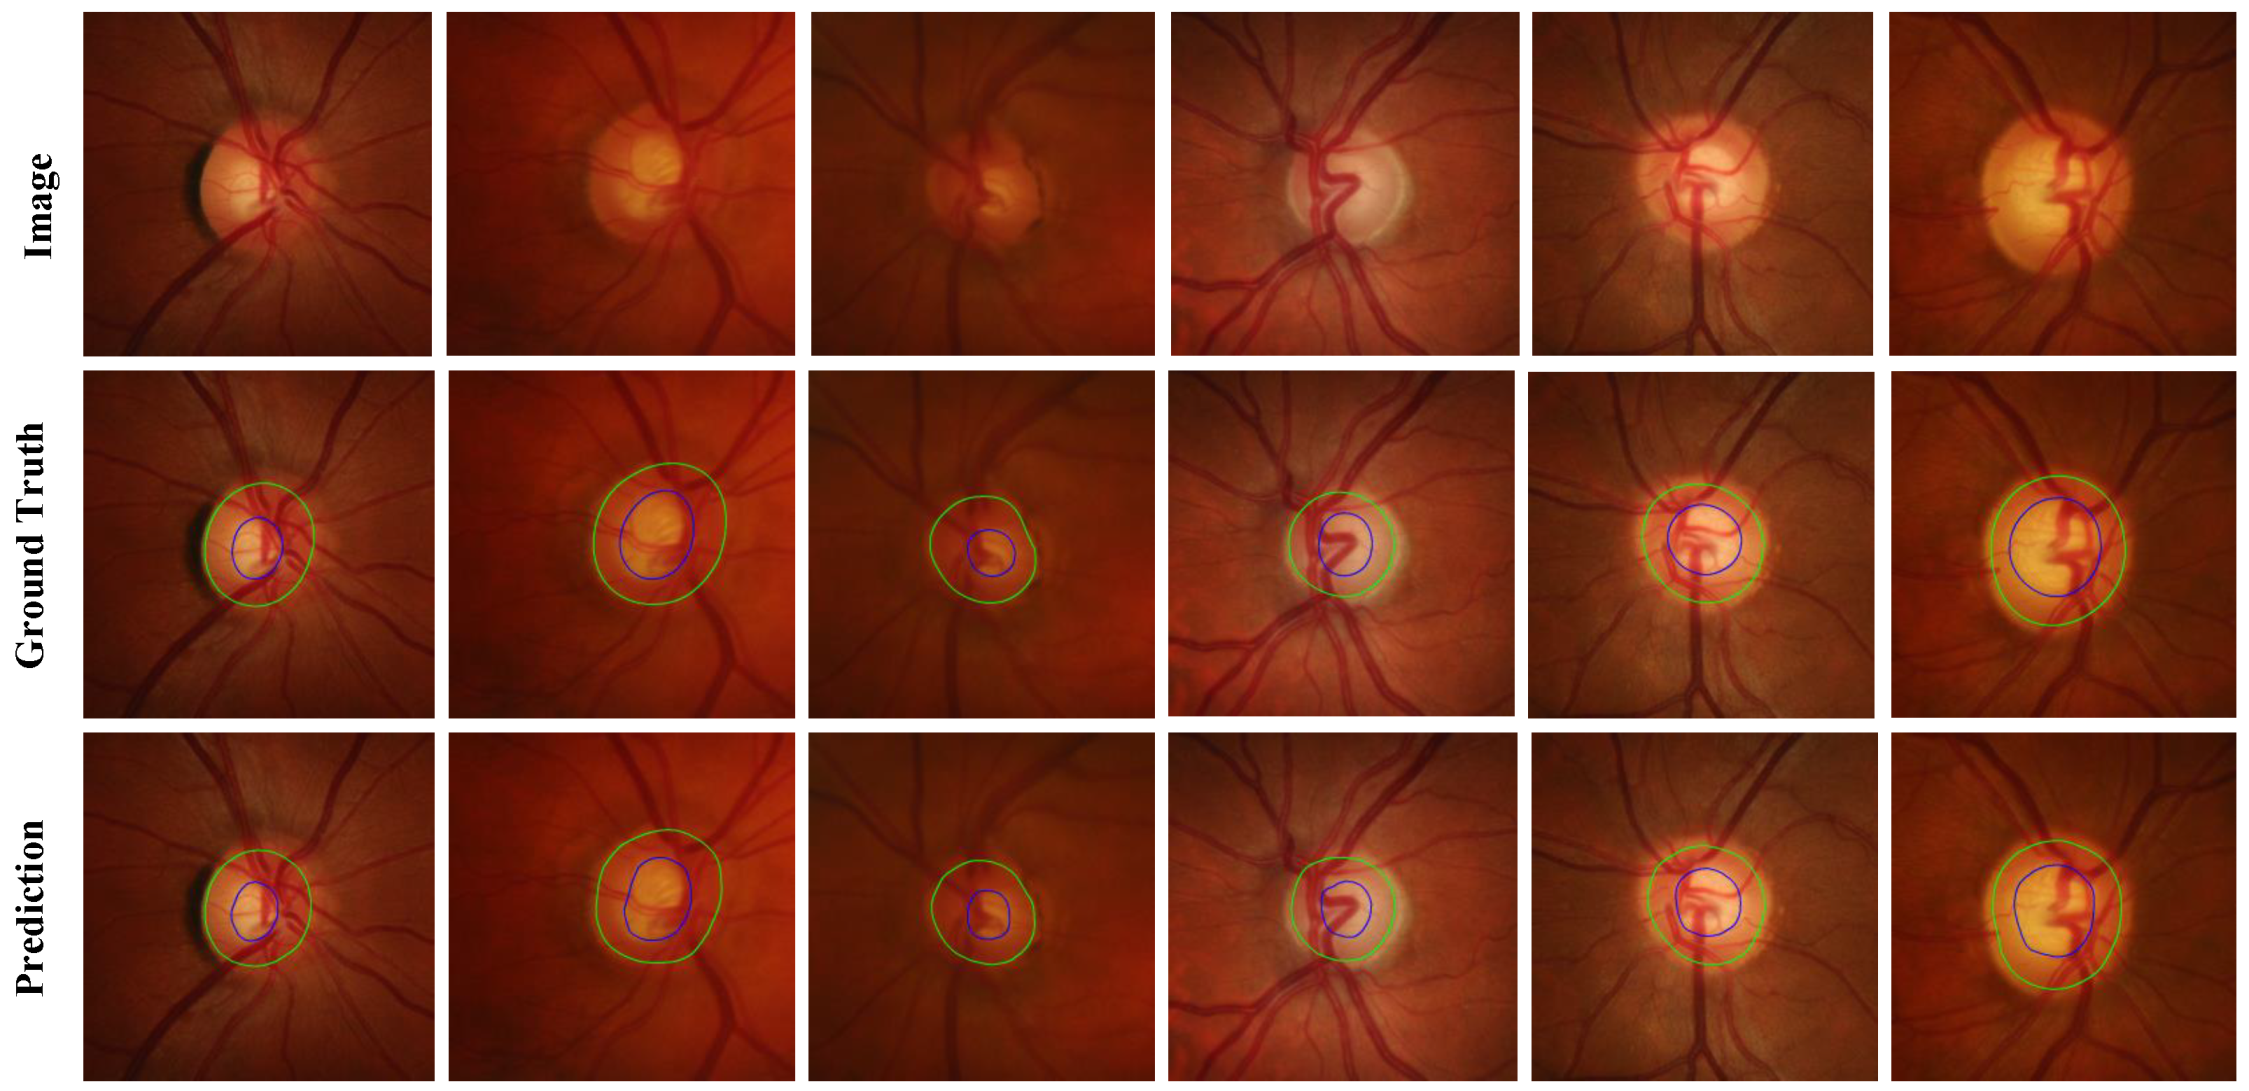
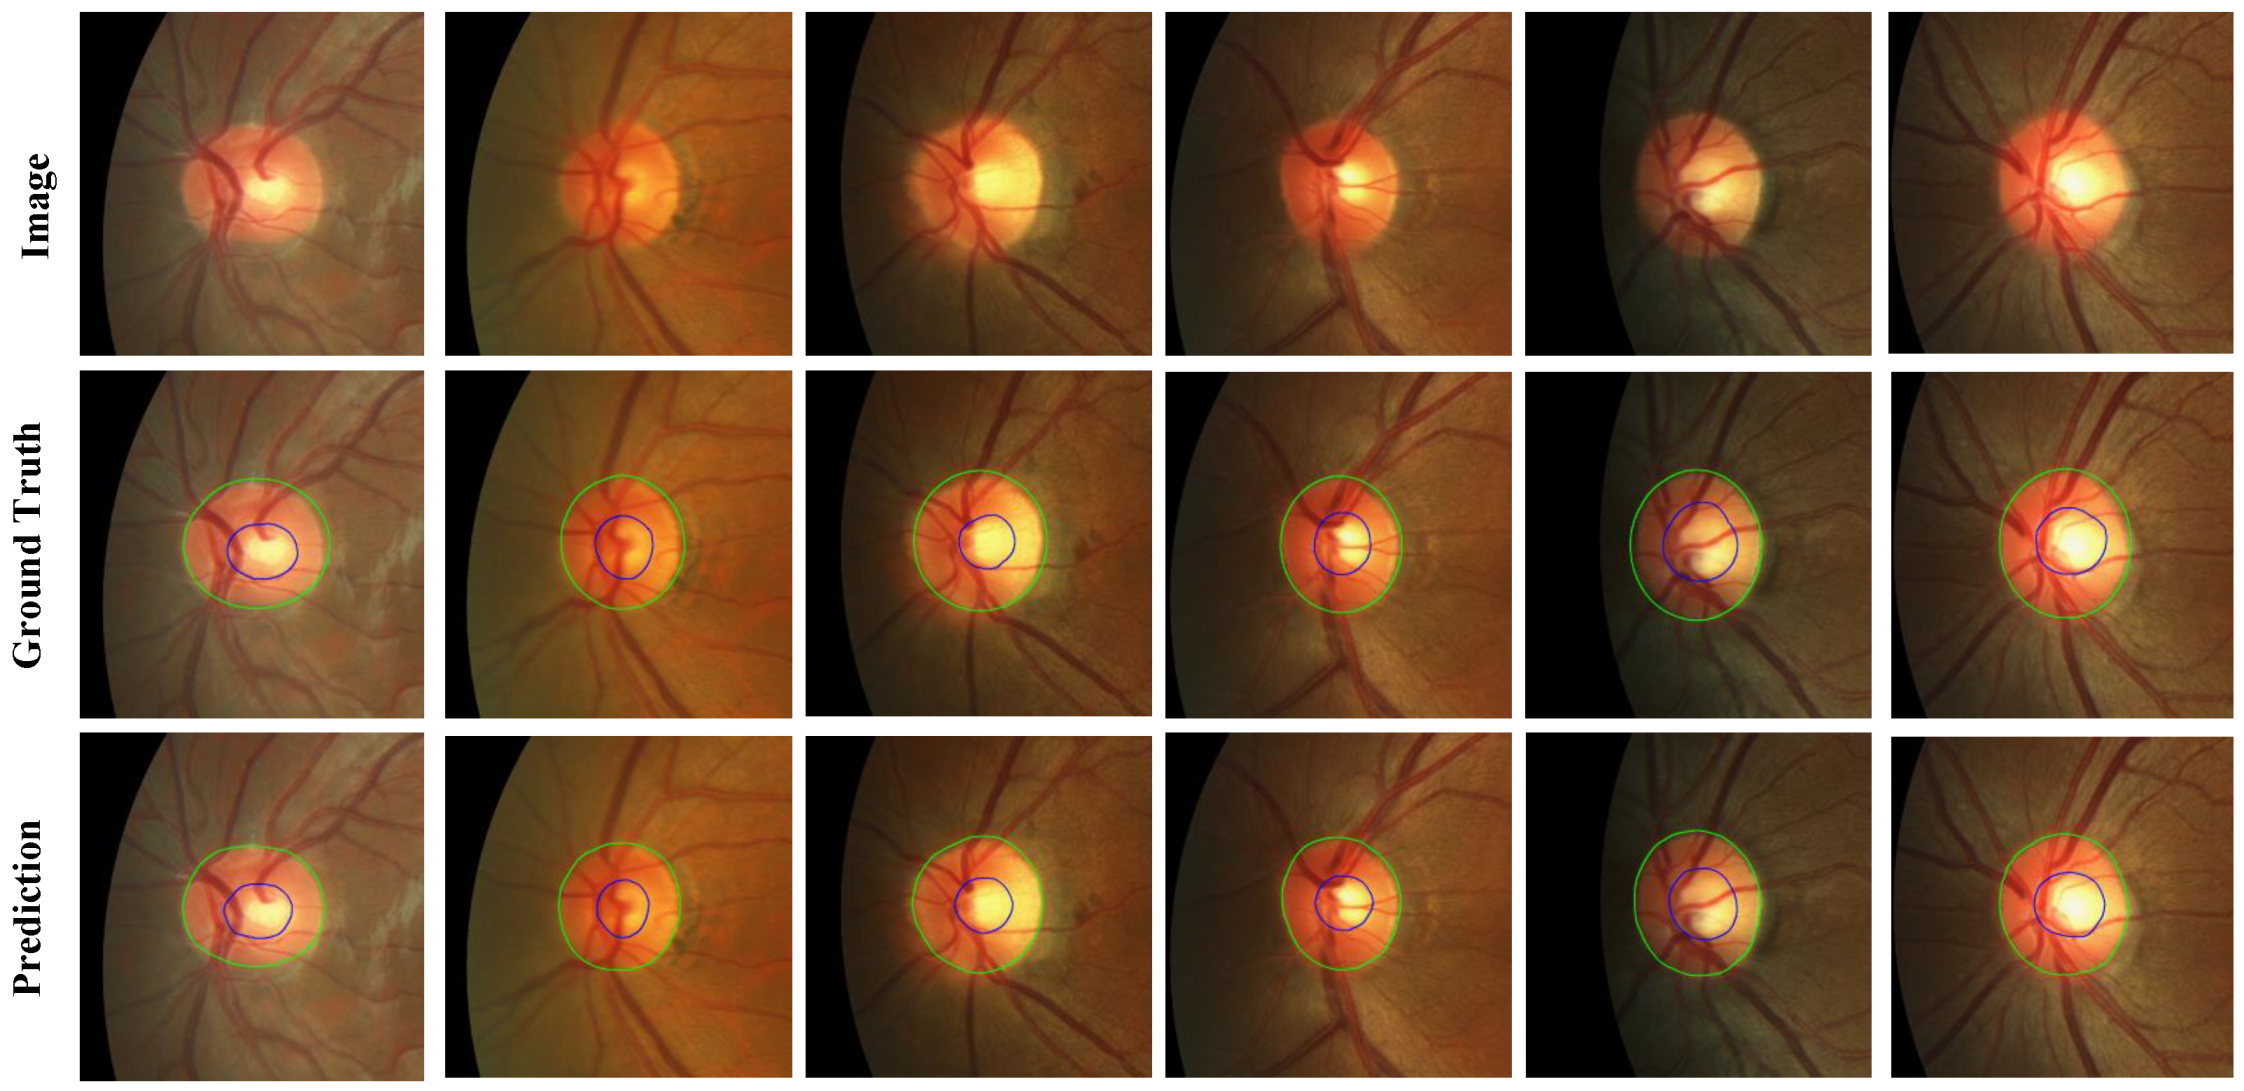
23]. The quantitative results are shown in Table 2, and the qualitative results are shown in
Figure 4 and
Figure 5.
Table 2.
Performance Comparison of Attention Blocks for Optic Disc and Optic Cup Segmentation on Drishti-GS and Rim_One_r3 datasets.(Use mIoU to select the best model)
Table 2.
Performance Comparison of Attention Blocks for Optic Disc and Optic Cup Segmentation on Drishti-GS and Rim_One_r3 datasets.(Use mIoU to select the best model)
| Methods |
Datasets |
| |
Drishti-GS |
Rim_One_r3 |
| |
|
|
|
|
|
|
| U-net [16] |
0.904 |
0.852 |
- |
0.864 |
0.797 |
- |
| M_UNet [24] |
0.95 |
0.85 |
- |
0.95 |
0.82 |
- |
| M-Net [25] |
0.967 |
0.808 |
- |
0.952 |
0.802 |
- |
| CE-Net [26] |
0.964 |
0.882 |
- |
0.953 |
0.844 |
- |
| CDED-Net [27] |
0.959 |
0.924 |
- |
0.958 |
0.862 |
- |
|
[17] |
0.965 |
0.858 |
0.082 |
0.865 |
0.787 |
0.081 |
| Gan-based [28] |
0.953 |
0.864 |
- |
0.953 |
0.825 |
- |
| BEAL |
0.961 |
0.862 |
- |
0.898 |
0.810 |
- |
| TD-GAN |
0.924 |
0.747 |
0.117 |
0.853 |
0.728 |
0.118 |
| PDD-UNET [29] |
0.963 |
0.848 |
0.105 |
0.970 |
0.876 |
0.066 |
| Ours |
0.974 |
0.900 |
0.045 |
0.966 |
0.875 |
0.043 |
For the REFUGE dataset, its training set is used as experimental data. Take 320 images as the training set and 80 as the test set. Compared with the BGA-net segmentation model with better effect in Table 2, the network model proposed in this paper improves the inference time by about 16% compared with BGA-net, and the segmentation accuracy of the OC is also improved. And the index also has a specific improvement. The quantitative results are shown in Table 3, and
Figure 6 shows the quantitative results of the REFUGE dataset.
Table 3.
Performance Comparison of Dice coefficient of OD and OC segmentation on REFUGE [31] dataset.
Table 3.
Performance Comparison of Dice coefficient of OD and OC segmentation on REFUGE [31] dataset.
| Methods |
|
|
|
inference time |
| U-net [16] |
0.927 |
0.848 |
- |
- |
|
[17] |
0.932 |
0.869 |
0.059 |
- |
| Psi-Net [18] |
0.956 |
0.851 |
- |
- |
| BEAL [32] |
0.945 |
0.860 |
- |
- |
| BGA-NET [30] |
0.951 |
0.866 |
0.040 |
29.1ms |
| ours |
0.951 |
0.869 |
0.013 |
24.3ms |
Table 4.
The necessity of ROI region extraction on REFUGE [
31] dataset.
Table 4.
The necessity of ROI region extraction on REFUGE [
31] dataset.
| Dataset |
|
|
| Original dataset |
0.920 |
0.820 |
| ROI extraction dataset |
0.962 |
0.880 |
At the same time, this paper compares the model parameters, occupied memory, calculation amount, and inference time of the network models under different feature extraction networks to prove the excellent performance and lightweight of Mobilenetv3 as a feature extraction network. The specific results are shown in Table 5:
Table 5.
The necessity of ROI region extraction on REFUGE [
31] dataset.
Table 5.
The necessity of ROI region extraction on REFUGE [
31] dataset.
| Backbone |
Total params |
Total memory |
Total MAdd |
Total Flops |
Total MemR+W |
Segmentation Time |
| efficientnetv2_m |
54.9M |
2299.8M |
158.4G |
79.3G |
3.1GB |
192.7ms |
| Xception |
52.1M |
1524.5M |
165.8G |
83.0G |
3.1GB |
170.4ms |
| Resnet50 |
38.4M |
845.3M |
138.5G |
69.3G |
1.7GB |
58.9ms |
| Mobilenetv2 |
5.5M |
651.1M |
52.9G |
26.5G |
1.2GB |
29.1ms |
| Ours |
5.3M |
495.4M |
48.8G |
24.4G |
839.0M |
24.3ms |
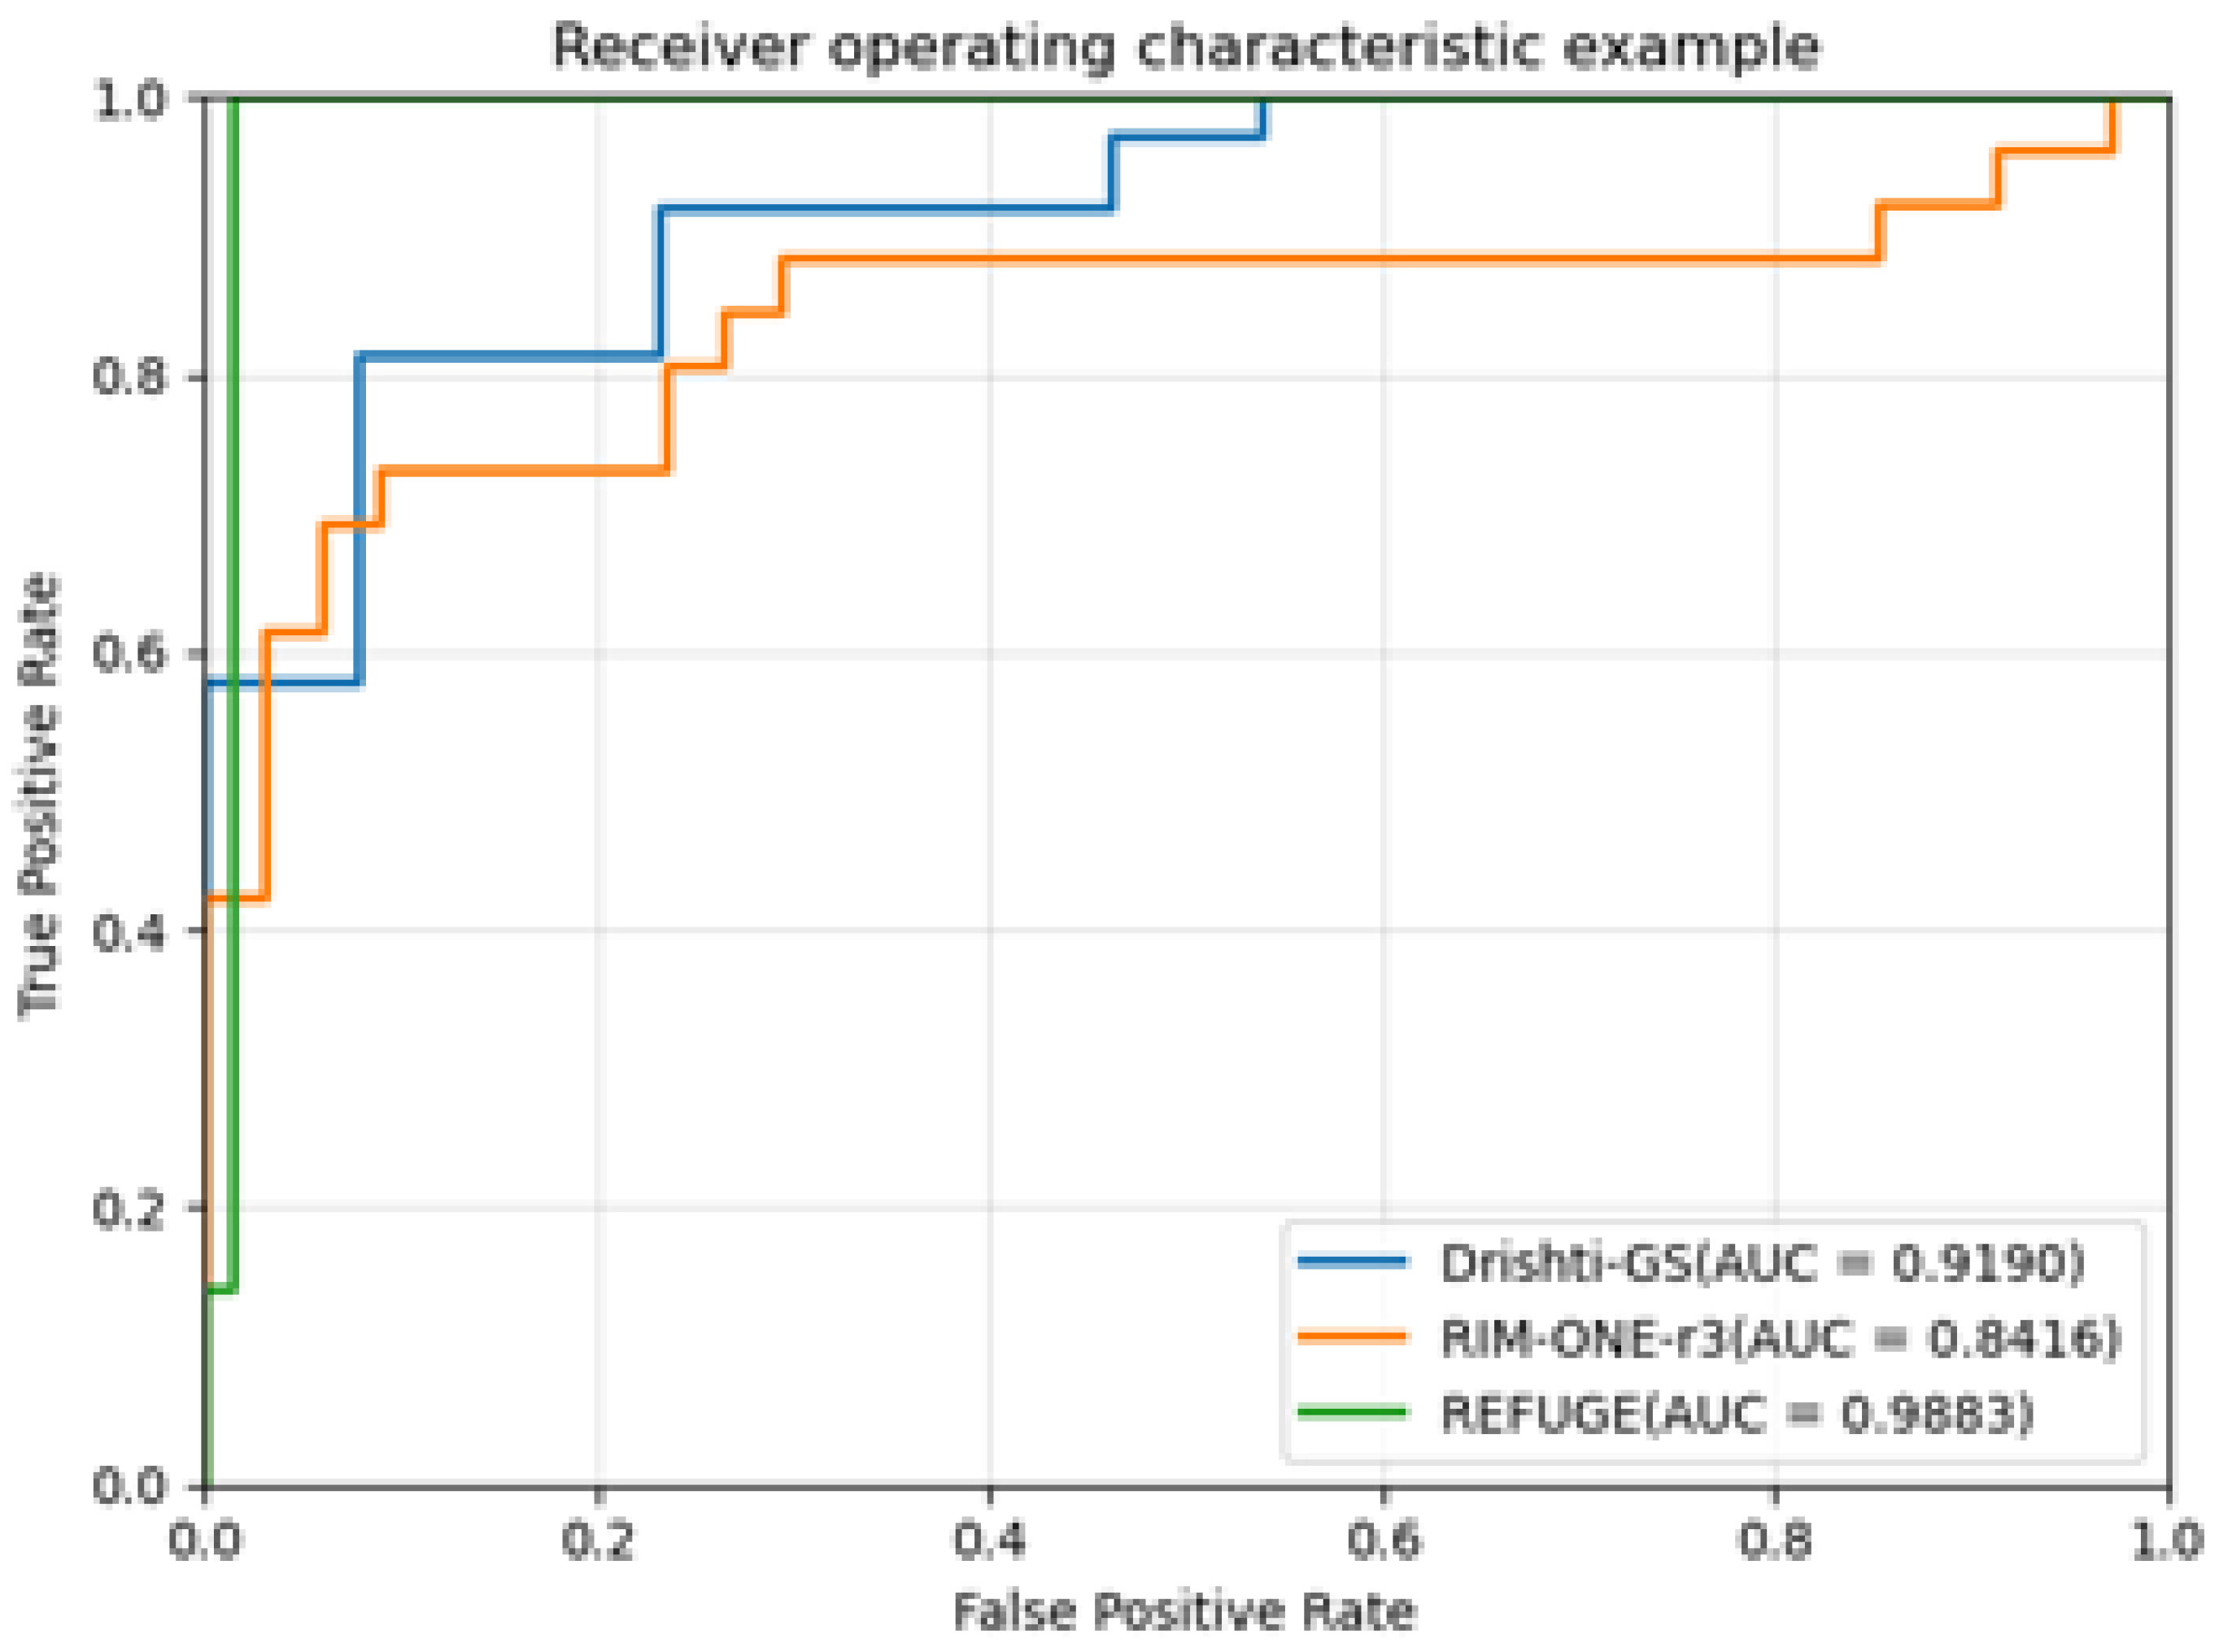
CDR is an important clinical parameter for the diagnosis of glaucoma, and it is also an essential basis for the diagnosis of glaucoma by most professional ophthalmologists. The receiver operating characteristic curve (ROC) and its corresponding area under the curve (AUC) are used to evaluate the performance of the proposed algorithm in detecting glaucoma. Generally, the higher the AUC, the better the diagnosis of the system. The higher the accuracy, the better the performance of the algorithm. This paper uses the ROC curve to evaluate the segmentation performance of BGA-Net.
Figure 7 shows the ROC curve and AUC values corresponding to Drishti-GS, RIM-ONE-r3, and REFUGE-train datasets.
3.5. Ablation Experiments
The following ablation experiments are designed to verify the effectiveness of the boundary branch and the discriminator network: (1) Baseline (feature extraction network + ASPP + mask branch). (2) Baseline + boundary branch. (3) Baseline + boundary branch + discriminator network.
Ablation experiments are performed on the RIM-ONE-r3 dataset, and the experimental results of different module combinations are shown in Table 6. Experiments show that, compared with the Baseline network, the boundary branch and the discriminator network both improve the segmentation performance of the model to varying degrees. The network structure with boundary branches added to the Baseline improves the OC segmentation accuracy by 0.3%, and decreases by 0.004. The discriminator and boundary branch components are added; that is, the network structure of MBG-Net improves the OC accuracy by 0.7% compared with the Baseline+ boundary branch, and reduces by 0.003, which proves the effectiveness of the boundary branch and the discriminator network. At the same time, the qualitative segmentation results are given in
Figure 8, green represents the OD, and blue represents the OC. Among them, column (a) is the ROI area corresponding to the fundus image, column (b) is the manual annotation map, column (c) is the predicted segmentation map corresponding to the Baseline, (d) column is the predicted segmentation map corresponding to the Baseline+Boundary branch, (e) The column is the predicted segmentation map corresponding to the Baseline + boundary branch + discriminator network (MBG-Net). Compared with columns (c) and (d), the boundary of the segmentation map in column (e) is smoother and more natural, and it is closer to the manual annotation map.
Table 6.
Ablation study on different components.
Table 6.
Ablation study on different components.
| Dataset |
|
|
|
| Baseline |
0.964 |
0.865 |
0.050 |
| Baseline+B |
0.964 |
0.868 |
0.046 |
| Baseline+B+G |
0.966 |
0.875 |
0.043 |
4. Discussion
The CDR is an essential attribute in diagnosing glaucoma, and accurate segmentation of OD and OC is crucial to the precise acquisition of the CDR. In recent years, the OD and OC segmentation method based on deep learning has achieved certain research results. However, there is still a particular gap between research work and clinical application. Most of the current segmentation networks have a large number of model parameters and a long segmentation time, which cannot meet the clinical needs of mobile deployment and real-time detection. This paper proposes a lightweight MBG-Net segmentation model for the above problems. Experiments show that the proposed method has reached the current advanced level in terms of segmentation accuracy, computational cost, model parameters, etc., indicating the application potential of the method in mobile deployment and real-time detection.
Experiments are performed on Drishti-GS, RIM-ONE-r3, and REFUGE datasets. Compared with the current state-of-the-art methods, the method proposed in this paper achieves the state-of-the-art segmentation results and the lowest absolute error with the least amount of parameters. Using the ROC curve to evaluate the model’s performance, the accuracy rates on the three datasets are 91.90, 84.16, and 98.83, respectively. In the experiment, the ROI region is extracted from the original image according to the method in the literature [16], and the extracted ROI region is used as the input of MBG-Net. To prove the necessity of ROI region extraction, the following experiments were carried out on MBG-Net: keeping the original experimental conditions unchanged, the original dataset REFUGE-train was trained and tested on MBG-Net, and the results are shown in Table 4. showed that the segmentation accuracy of the OD decreased by 4.2%, and the segmentation accuracy of the OC decreased by 6%. This experiment shows the effectiveness and necessity of ROI extraction. In addition, the inference time of this network for an image on a single NVIDIA GTX 1080Ti GPU is only 24.3ms, which shows the high efficiency and real-time performance of the MBG-Net network.
To show the segmentation effect intuitively, this paper selects part of the segmentation renderings of the three datasets. The comparison shows that the segmentation effects of this method in the three datasets reach the same level as the manual annotation images, which proves this method’s generalization ability.
5. Results
In this paper ,we proposes a lightweight network for OD and OC segmentation named MBG-Net. Aiming at the problem of the OD and OC segmentation, this paper proposes a lightweight network, MBG-Net, which combines optic disc and optic cup segmentation. The network has lower training and computational costs, faster inference time, and higher segmentation accuracy. The network uses a lightweight feature extraction network Mobilenetv3 combined with boundary auxiliary branches and adversarial learning ideas to improve segmentation efficiency while ensuring segmentation accuracy. In This paper, we conducts a large number of experiments on three common fundus datasets to verify the performance of the proposed network. At the same time, the our proposed network achieves advanced segmentation effects and low values on thein all three datasets, which provesing the proposed network’s the effectiveness of our method in the problems of in the OD and OC segmentation and glaucoma diagnosis. In the future, we will further study how to deploy web applications to the network application on the mobile terminals for to achieve real-time glaucoma-assisted detection.
6. Patents
This section is not mandatory, but may be added if there are patents resulting from the work reported in this manuscript.
Author Contributions
Methodology, Y.C.,Z.L.,J.L.and J.Z.; Validation, Y.C. and Z.L.; writing—original draft preparation, Y.C.; Visualization, Z.L.; Funding acquisition, B.Z., J.L. All authors have read and agreed to the published version of the manuscript.
Funding
This work was supported by the National Natural Science Foundation of China (project approval number: 61962023.
Institutional Review Board Statement
This study did not require ethical approval.
Informed Consent Statement
Not applicable
Data Availability Statement
All data are available in the public domain
Conflicts of Interest
The authors declare no conflict of interest.
References
- Tham, Y.C.; Li, X.; Wong, T.Y.; Quigley, H.A.; Aung, T.; Cheng, C.Y. Global prevalence of glaucoma and projections of glaucoma burden through 2040: a systematic review and meta-analysis. Ophthalmology 2014, 121, 2081–2090. [Google Scholar] [CrossRef]
- Mary, V.S.; Rajsingh, E.B.; Naik, G.R. Retinal fundus image analysis for diagnosis of glaucoma: a comprehensive survey. IEEE Access 2016. [Google Scholar]
- Zhu, Q.; Chen, X.; Meng, Q.; Song, J.; Luo, G.; Wang, M.; Shi, F.; Chen, Z.; Xiang, D.; Pan, L.; et al. GDCSeg-Net: general optic disc and cup segmentation network for multi-device fundus images. Biomedical Optics Express 2021, 12, 6529–6544. [Google Scholar] [CrossRef]
- Chen, C.; Wang, G. IOSUDA: An unsupervised domain adaptation with input and output space alignment for joint optic disc and cup segmentation. Applied Intelligence 2021, 51, 3880–3898. [Google Scholar] [CrossRef]
- Fu, H.; Cheng, J.; Xu, Y.; Wong, D.W.K.; Liu, J.; Cao, X. Joint optic disc and cup segmentation based on multi-label deep network and polar transformation. IEEE transactions on medical imaging 2018, 37, 1597–1605. [Google Scholar] [CrossRef]
- Al-Bander, B.; Williams, B.M.; Al-Nuaimy, W.; Al-Taee, M.A.; Pratt, H.; Zheng, Y. Dense fully convolutional segmentation of the optic disc and cup in colour fundus for glaucoma diagnosis. Symmetry 2018, 10, 87. [Google Scholar] [CrossRef]
- Qin, P.; Wang, L.; Lv, H. Optic disc and cup segmentation based on deep learning. In Proceedings of the 2019 IEEE 3rd Information Technology, Networking, Electronic and Automation Control Conference (ITNEC); IEEE, 2019; pp. 1835–1840. [Google Scholar]
- Zhang, Y.; Cai, X.; Zhang, Y.; Kang, H.; Ji, X.; Yuan, X. TAU: Transferable Attention U-Net for optic disc and cup segmentation. Knowledge-Based Systems 2021, 213, 106668. [Google Scholar] [CrossRef]
- Zhao, X.; Wang, S.; Zhao, J.; Wei, H.; Xiao, M.; Ta, N. Application of an attention u-net incorporating transfer learning for optic disc and cup segmentation. Signal, Image and Video Processing 2021, 15, 913–921. [Google Scholar] [CrossRef]
- Liu, B.; Pan, D.; Shuai, Z.; Song, H. ECSD-Net: A joint optic disc and cup segmentation and glaucoma classification network based on unsupervised domain adaptation. Computer Methods and Programs in Biomedicine 2022, 213, 106530. [Google Scholar] [CrossRef] [PubMed]
- Chen, L.C.; Zhu, Y.; Papandreou, G.; Schroff, F.; Adam, H. Encoder-decoder with atrous separable convolution for semantic image segmentation. In Proceedings of the Proceedings of the European conference on computer vision (ECCV); 2018; pp. 801–818. [Google Scholar]
- He, K.; Zhang, X.; Ren, S.; Sun, J. Deep residual learning for image recognition. In Proceedings of the Proceedings of the IEEE conference on computer vision and pattern recognition; 2016; pp. 770–778. [Google Scholar]
- Howard, A.G.; Zhu, M.; Chen, B.; Kalenichenko, D.; Wang, W.; Weyand, T.; Andreetto, M.; Adam, H. Mobilenets: Efficient convolutional neural networks for mobile vision applications. arXiv preprint arXiv:1704.04861 2017.
- Sandler, M.; Howard, A.; Zhu, M.; Zhmoginov, A.; Chen, L.C. Mobilenetv2: Inverted residuals and linear bottlenecks. In Proceedings of the Proceedings of the IEEE conference on computer vision and pattern recognition; 2018; pp. 4510–4520. [Google Scholar]
- Howard, A.; Sandler, M.; Chu, G.; Chen, L.C.; Chen, B.; Tan, M.; Wang, W.; Zhu, Y.; Pang, R.; Vasudevan, V.; et al. Searching for mobilenetv3. In Proceedings of the Proceedings of the IEEE/CVF international conference on computer vision, 2019. pp. 1314–1324.
- Ronneberger, O.; Fischer, P.; Brox, T. U-net: Convolutional networks for biomedical image segmentation. In Proceedings of the International Conference on Medical image computing and computer-assisted intervention. Springer; 2015; pp. 234–241. [Google Scholar]
- Wang, S.; Yu, L.; Yang, X.; Fu, C.W.; Heng, P.A. Patch-based output space adversarial learning for joint optic disc and cup segmentation. IEEE transactions on medical imaging 2019, 38, 2485–2495. [Google Scholar] [CrossRef] [PubMed]
- Murugesan, B.; Sarveswaran, K.; Shankaranarayana, S.M.; Ram, K.; Joseph, J.; Sivaprakasam, M. Psi-Net: Shape and boundary aware joint multi-task deep network for medical image segmentation. In Proceedings of the 2019 41st Annual International Conference of the IEEE Engineering in Medicine and Biology Society (EMBC); IEEE, 2019; pp. 7223–7226. [Google Scholar]
- Wang, S.; Yu, L.; Li, K.; Yang, X.; Fu, C.W.; Heng, P.A. Boundary and entropy-driven adversarial learning for fundus image segmentation. In Proceedings of the Medical Image Computing and Computer Assisted Intervention–MICCAI 2019: 22nd International Conference, Shenzhen, China, October 13–17, 2019, Proceedings, Part I 22. Springer, 2019, pp. 102–110.
- Son, J.; Park, S.J.; Jung, K.H. Towards accurate segmentation of retinal vessels and the optic disc in fundoscopic images with generative adversarial networks. Journal of digital imaging 2019, 32, 499–512. [Google Scholar] [CrossRef]
- Luo, L.; Xue, D.; Pan, F.; Feng, X. Joint optic disc and optic cup segmentation based on boundary prior and adversarial learning. International Journal of Computer Assisted Radiology and Surgery 2021, 16, 905–914. [Google Scholar] [CrossRef] [PubMed]
- Sevastopolsky, A. Optic disc and cup segmentation methods for glaucoma detection with modification of U-Net convolutional neural network. Pattern Recognition and Image Analysis 2017, 27, 618–624. [Google Scholar] [CrossRef]
- Zilly, J.; Buhmann, J.M.; Mahapatra, D. Glaucoma detection using entropy sampling and ensemble learning for automatic optic cup and disc segmentation. Computerized Medical Imaging and Graphics 2017, 55, 28–41. [Google Scholar] [CrossRef] [PubMed]
- Sevastopolsky, A. Optic disc and cup segmentation methods for glaucoma detection with modification of U-Net convolutional neural network. Pattern Recognition and Image Analysis 2017, 27, 618–624. [Google Scholar] [CrossRef]
- Fu, H.; Cheng, J.; Xu, Y.; Wong, D.W.K.; Liu, J.; Cao, X. Joint Optic Disc and Cup Segmentation Based on Multi-Label Deep Network and Polar Transformation. IEEE Transactions on Medical Imaging 2018, 37, 1597–1605. [Google Scholar] [CrossRef] [PubMed]
- Gu, Z.; Cheng, J.; Fu, H.; Zhou, K.; Hao, H.; Zhao, Y.; Zhang, T.; Gao, S.; Liu, J. Ce-net: Context encoder network for 2d medical image segmentation. IEEE transactions on medical imaging 2019, 38, 2281–2292. [Google Scholar] [CrossRef] [PubMed]
- Tabassum, M.; Khan, T.M.; Arsalan, M.; Naqvi, S.S.; Ahmed, M.; Madni, H.A.; Mirza, J. CDED-Net: Joint segmentation of optic disc and optic cup for glaucoma screening. IEEE Access 2020, 8, 102733–102747. [Google Scholar] [CrossRef]
- Son, J.; Park, S.J.; Jung, K.H. Towards accurate segmentation of retinal vessels and the optic disc in fundoscopic images with generative adversarial networks. Journal of digital imaging 2019, 32, 499–512. [Google Scholar] [CrossRef]
- Shankaranarayana, S.M.; Ram, K.; Mitra, K.; Sivaprakasam, M. Fully convolutional networks for monocular retinal depth estimation and optic disc-cup segmentation. IEEE journal of biomedical and health informatics 2019, 23, 1417–1426. [Google Scholar] [CrossRef]
- Luo, L.; Xue, D.; Pan, F.; Feng, X. Joint optic disc and optic cup segmentation based on boundary prior and adversarial learning. International Journal of Computer Assisted Radiology and Surgery 2021, 16, 905–914. [Google Scholar] [CrossRef]
- Orlando, J.I.; Fu, H.; Breda, J.B.; Keer, K.V.; Bathula, D.R.; Diaz-Pinto, A.; Fang, R.; Heng, P.A.; Kim, J.; Lee, J.H. REFUGE Challenge: A Unified Framework for Evaluating Automated Methods for Glaucoma Assessment from Fundus Photographs. Medical Image Analysis 2019. [Google Scholar] [CrossRef]
- Wang, S.; Yu, L.; Li, K.; Yang, X.; Fu, C.W.; Heng, P.A. Boundary and entropy-driven adversarial learning for fundus image segmentation. In Proceedings of the International Conference on Medical Image Computing and Computer-Assisted Intervention. Springer; 2019; pp. 102–110. [Google Scholar]
|
Disclaimer/Publisher’s Note: The statements, opinions and data contained in all publications are solely those of the individual author(s) and contributor(s) and not of MDPI and/or the editor(s). MDPI and/or the editor(s) disclaim responsibility for any injury to people or property resulting from any ideas, methods, instructions or products referred to in the content. |
© 2024 by the authors. Licensee MDPI, Basel, Switzerland. This article is an open access article distributed under the terms and conditions of the Creative Commons Attribution (CC BY) license (http://creativecommons.org/licenses/by/4.0/).
