Submitted:
30 July 2024
Posted:
31 July 2024
You are already at the latest version
Abstract

Keywords:
1. Introduction
2. Materials and Methods
2.1. Material and Test Specimens
2.2. Post-processing
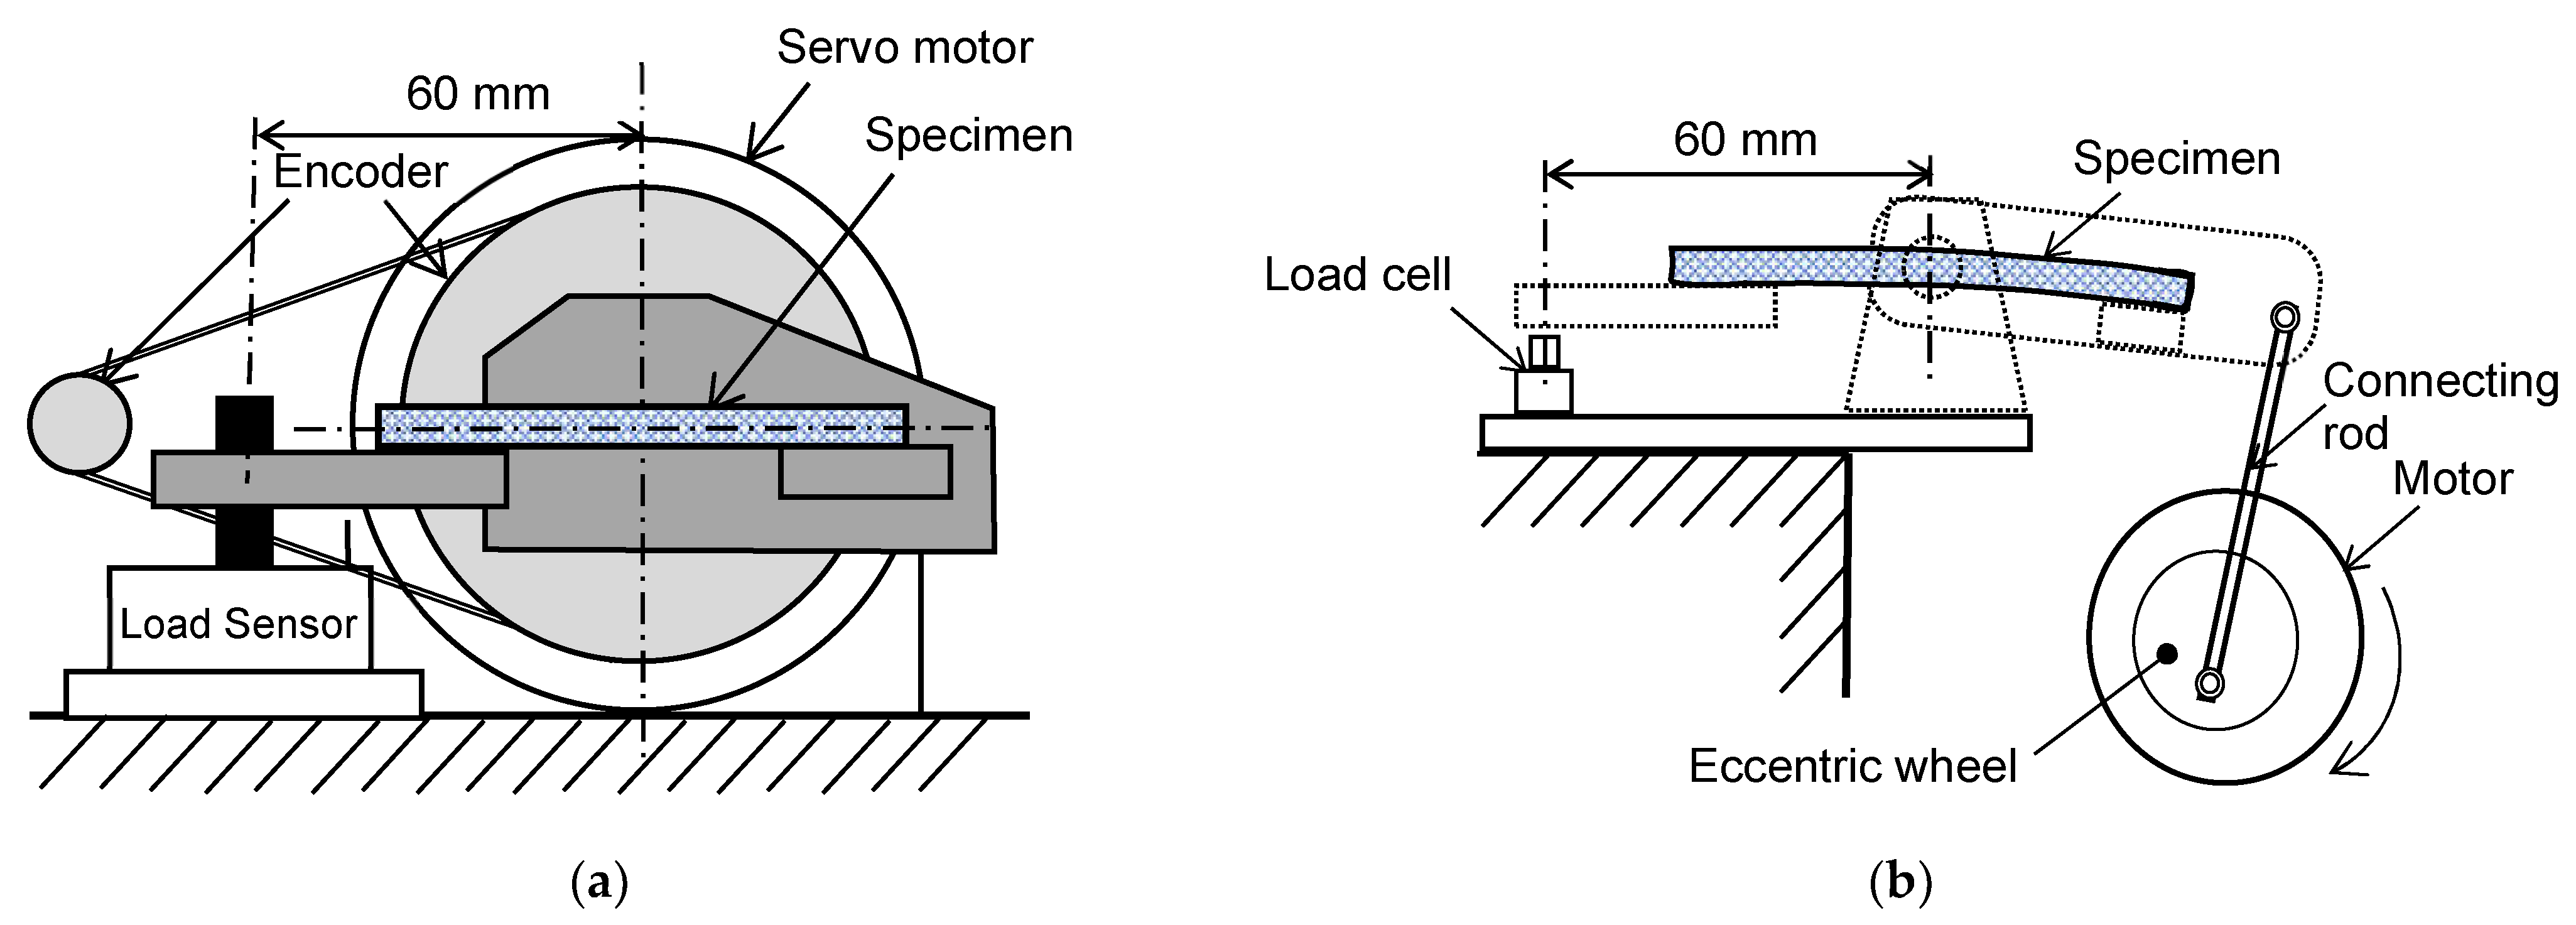
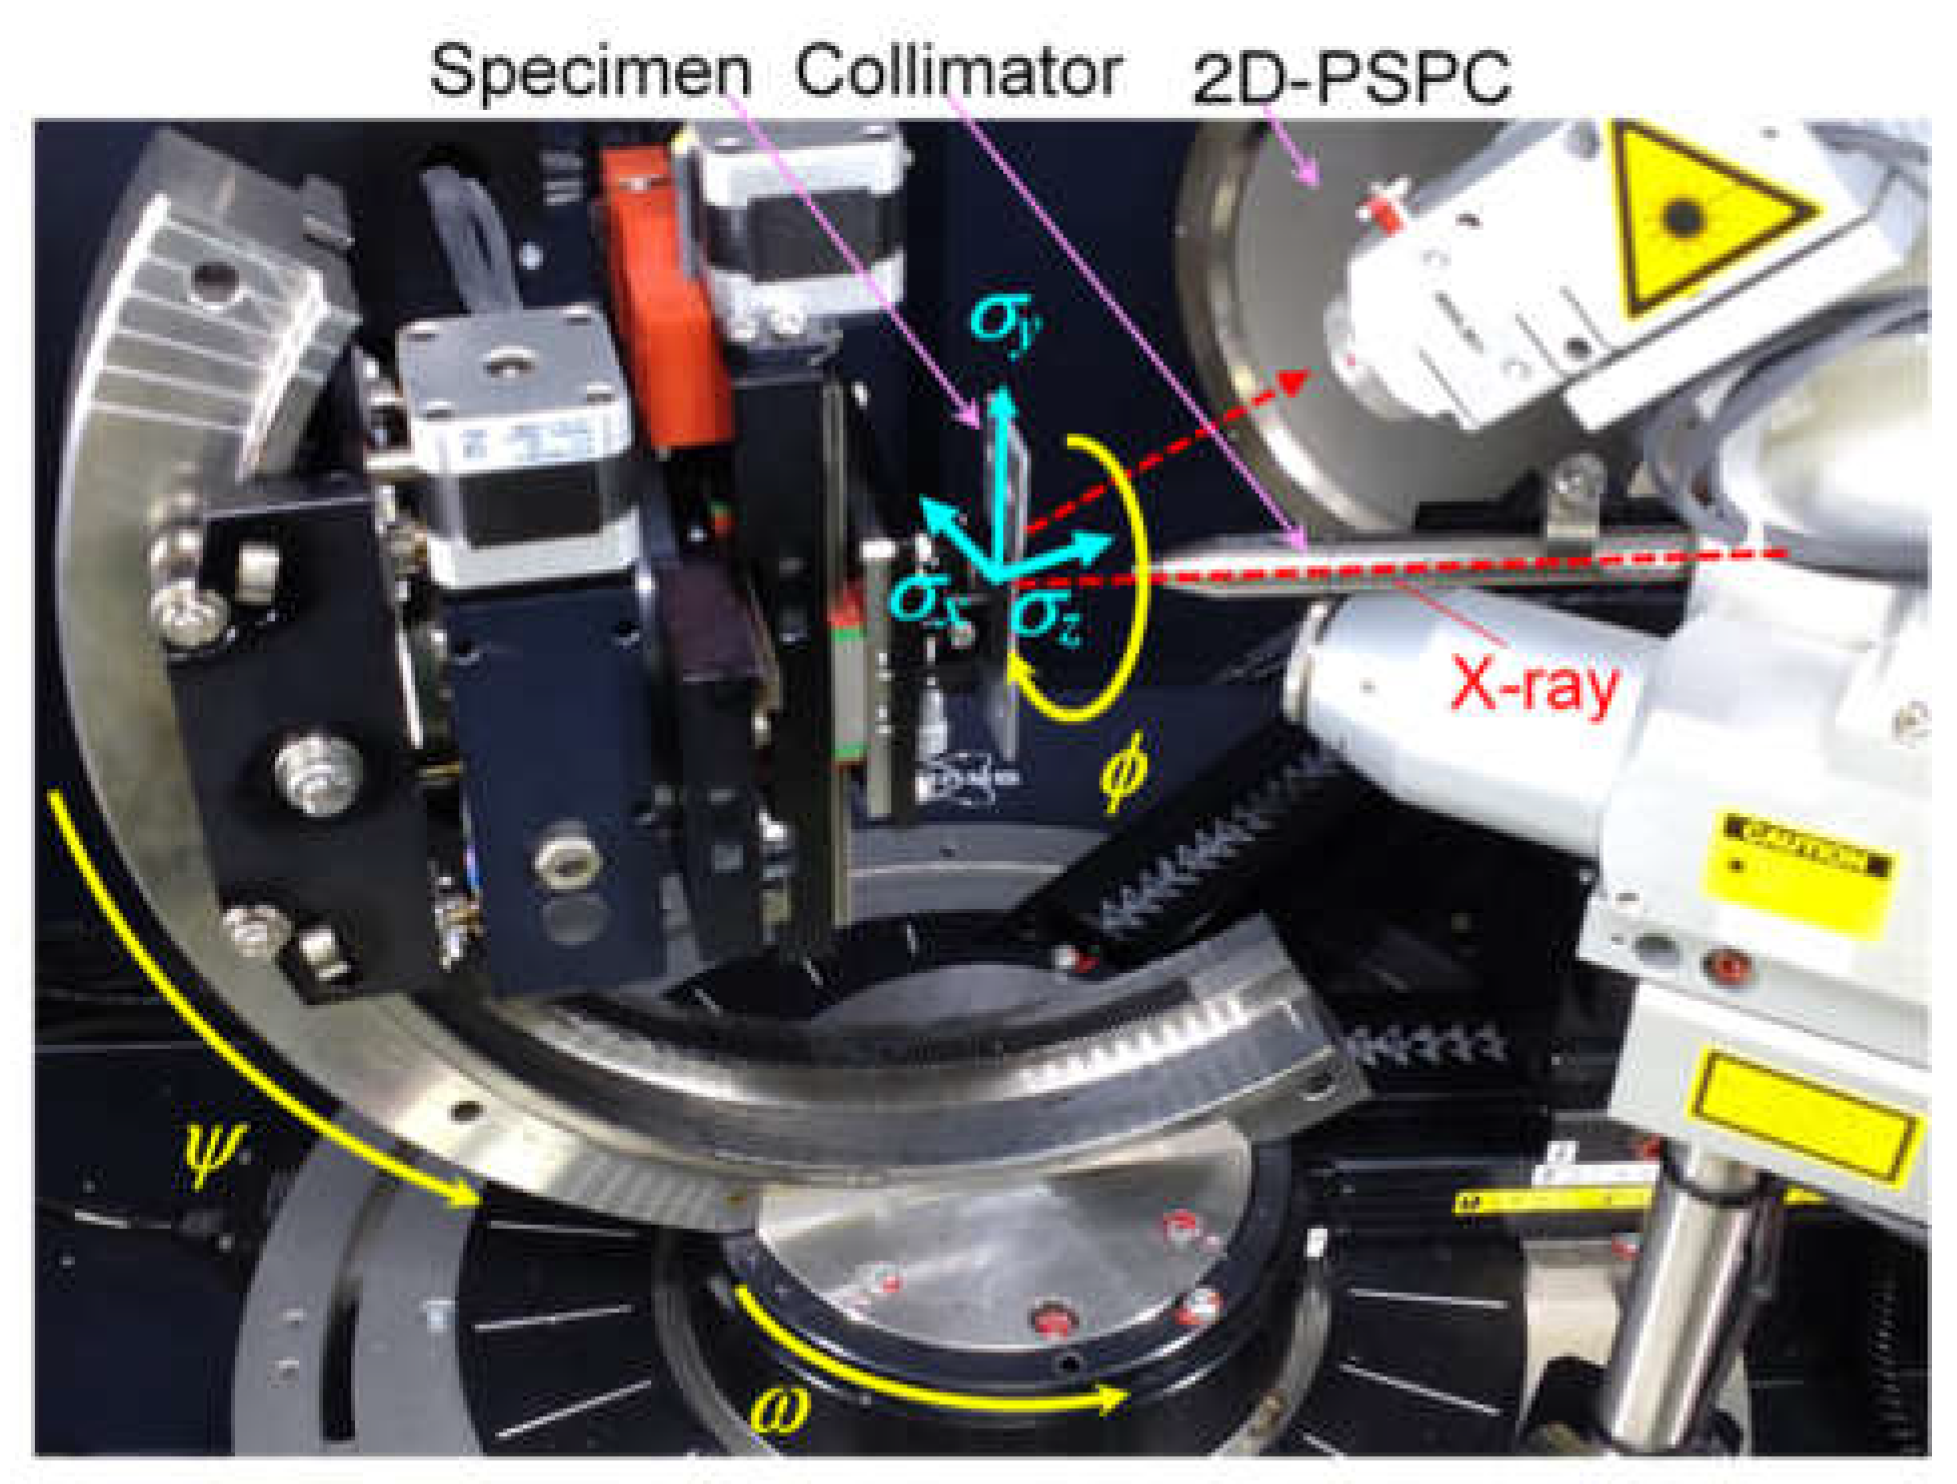
2.3. Fatigue Test and Measurement of Surface Chractersitics
3. Results
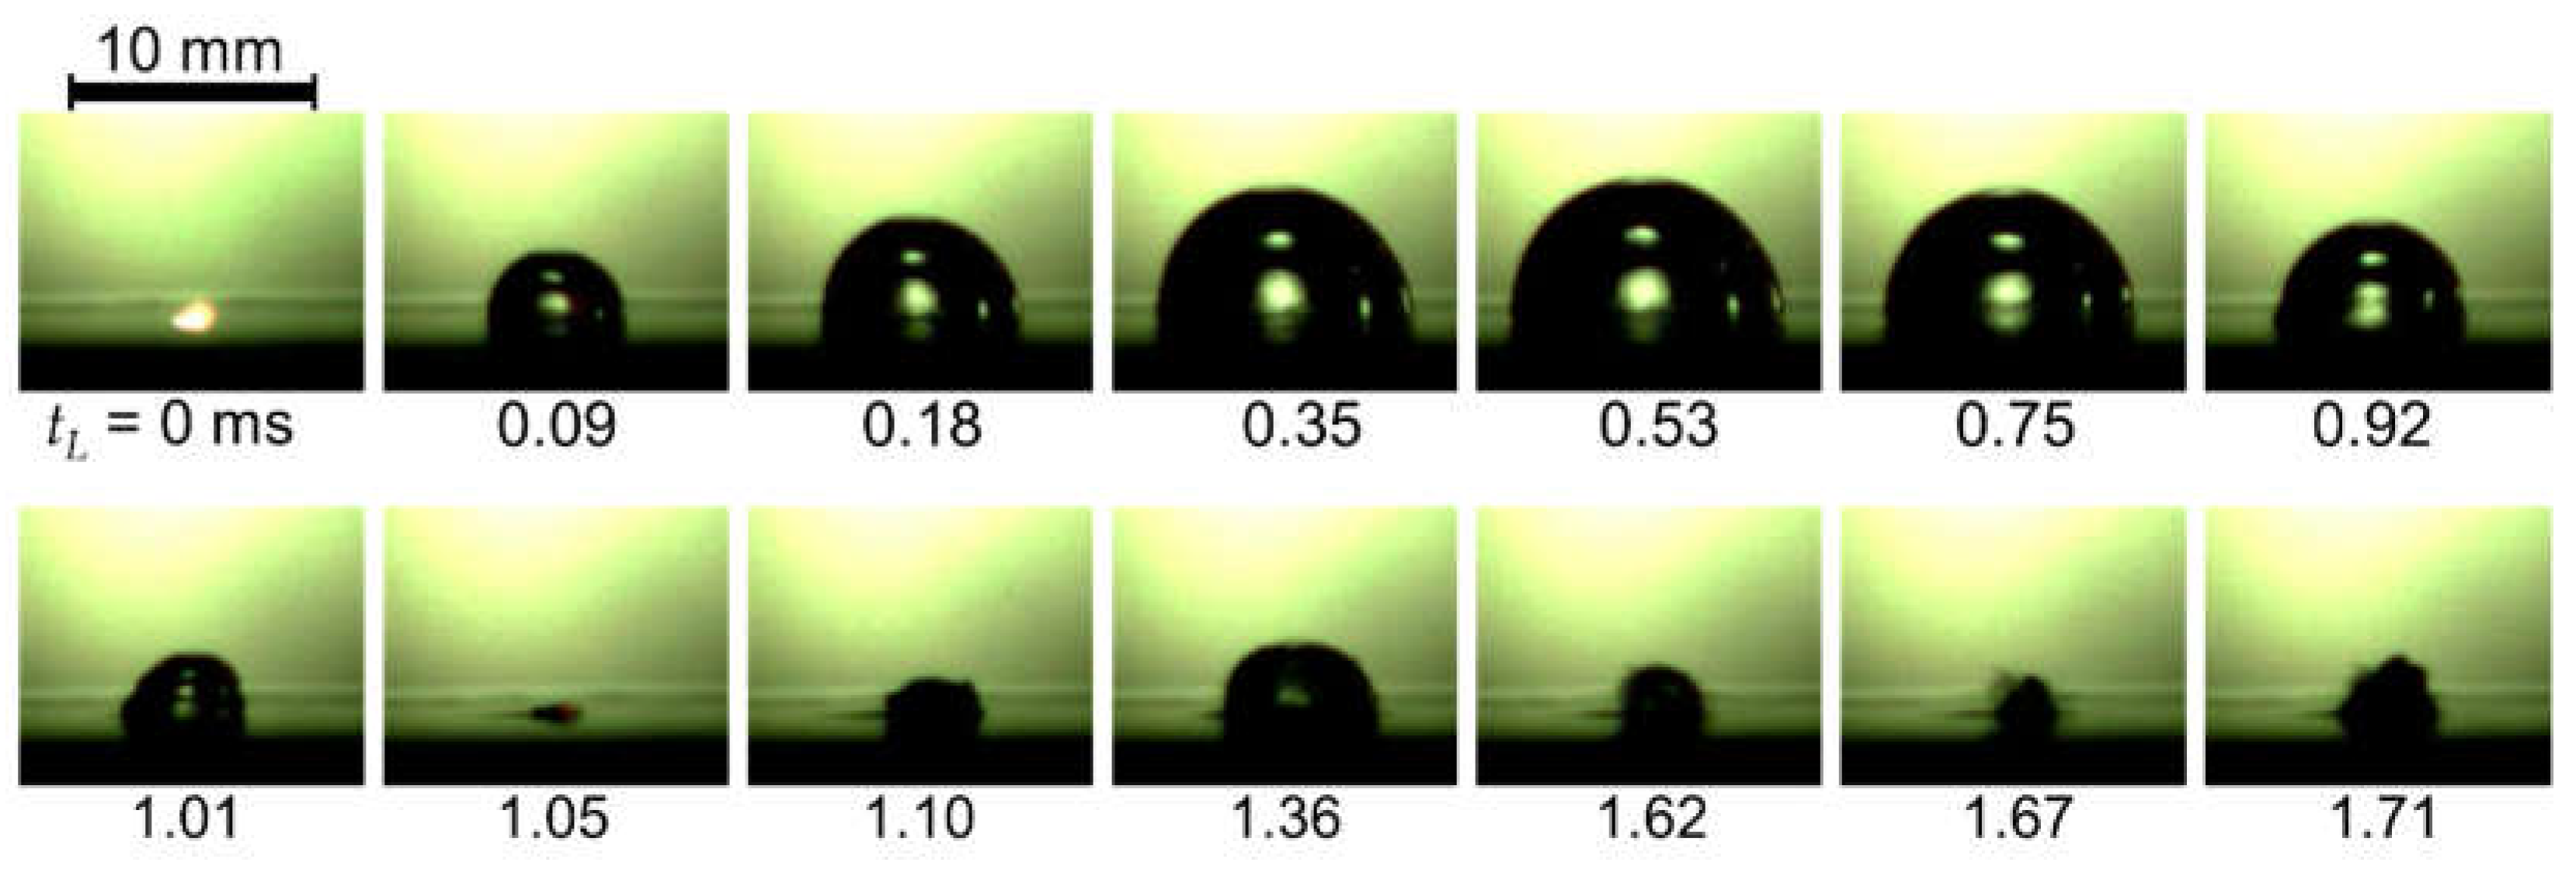
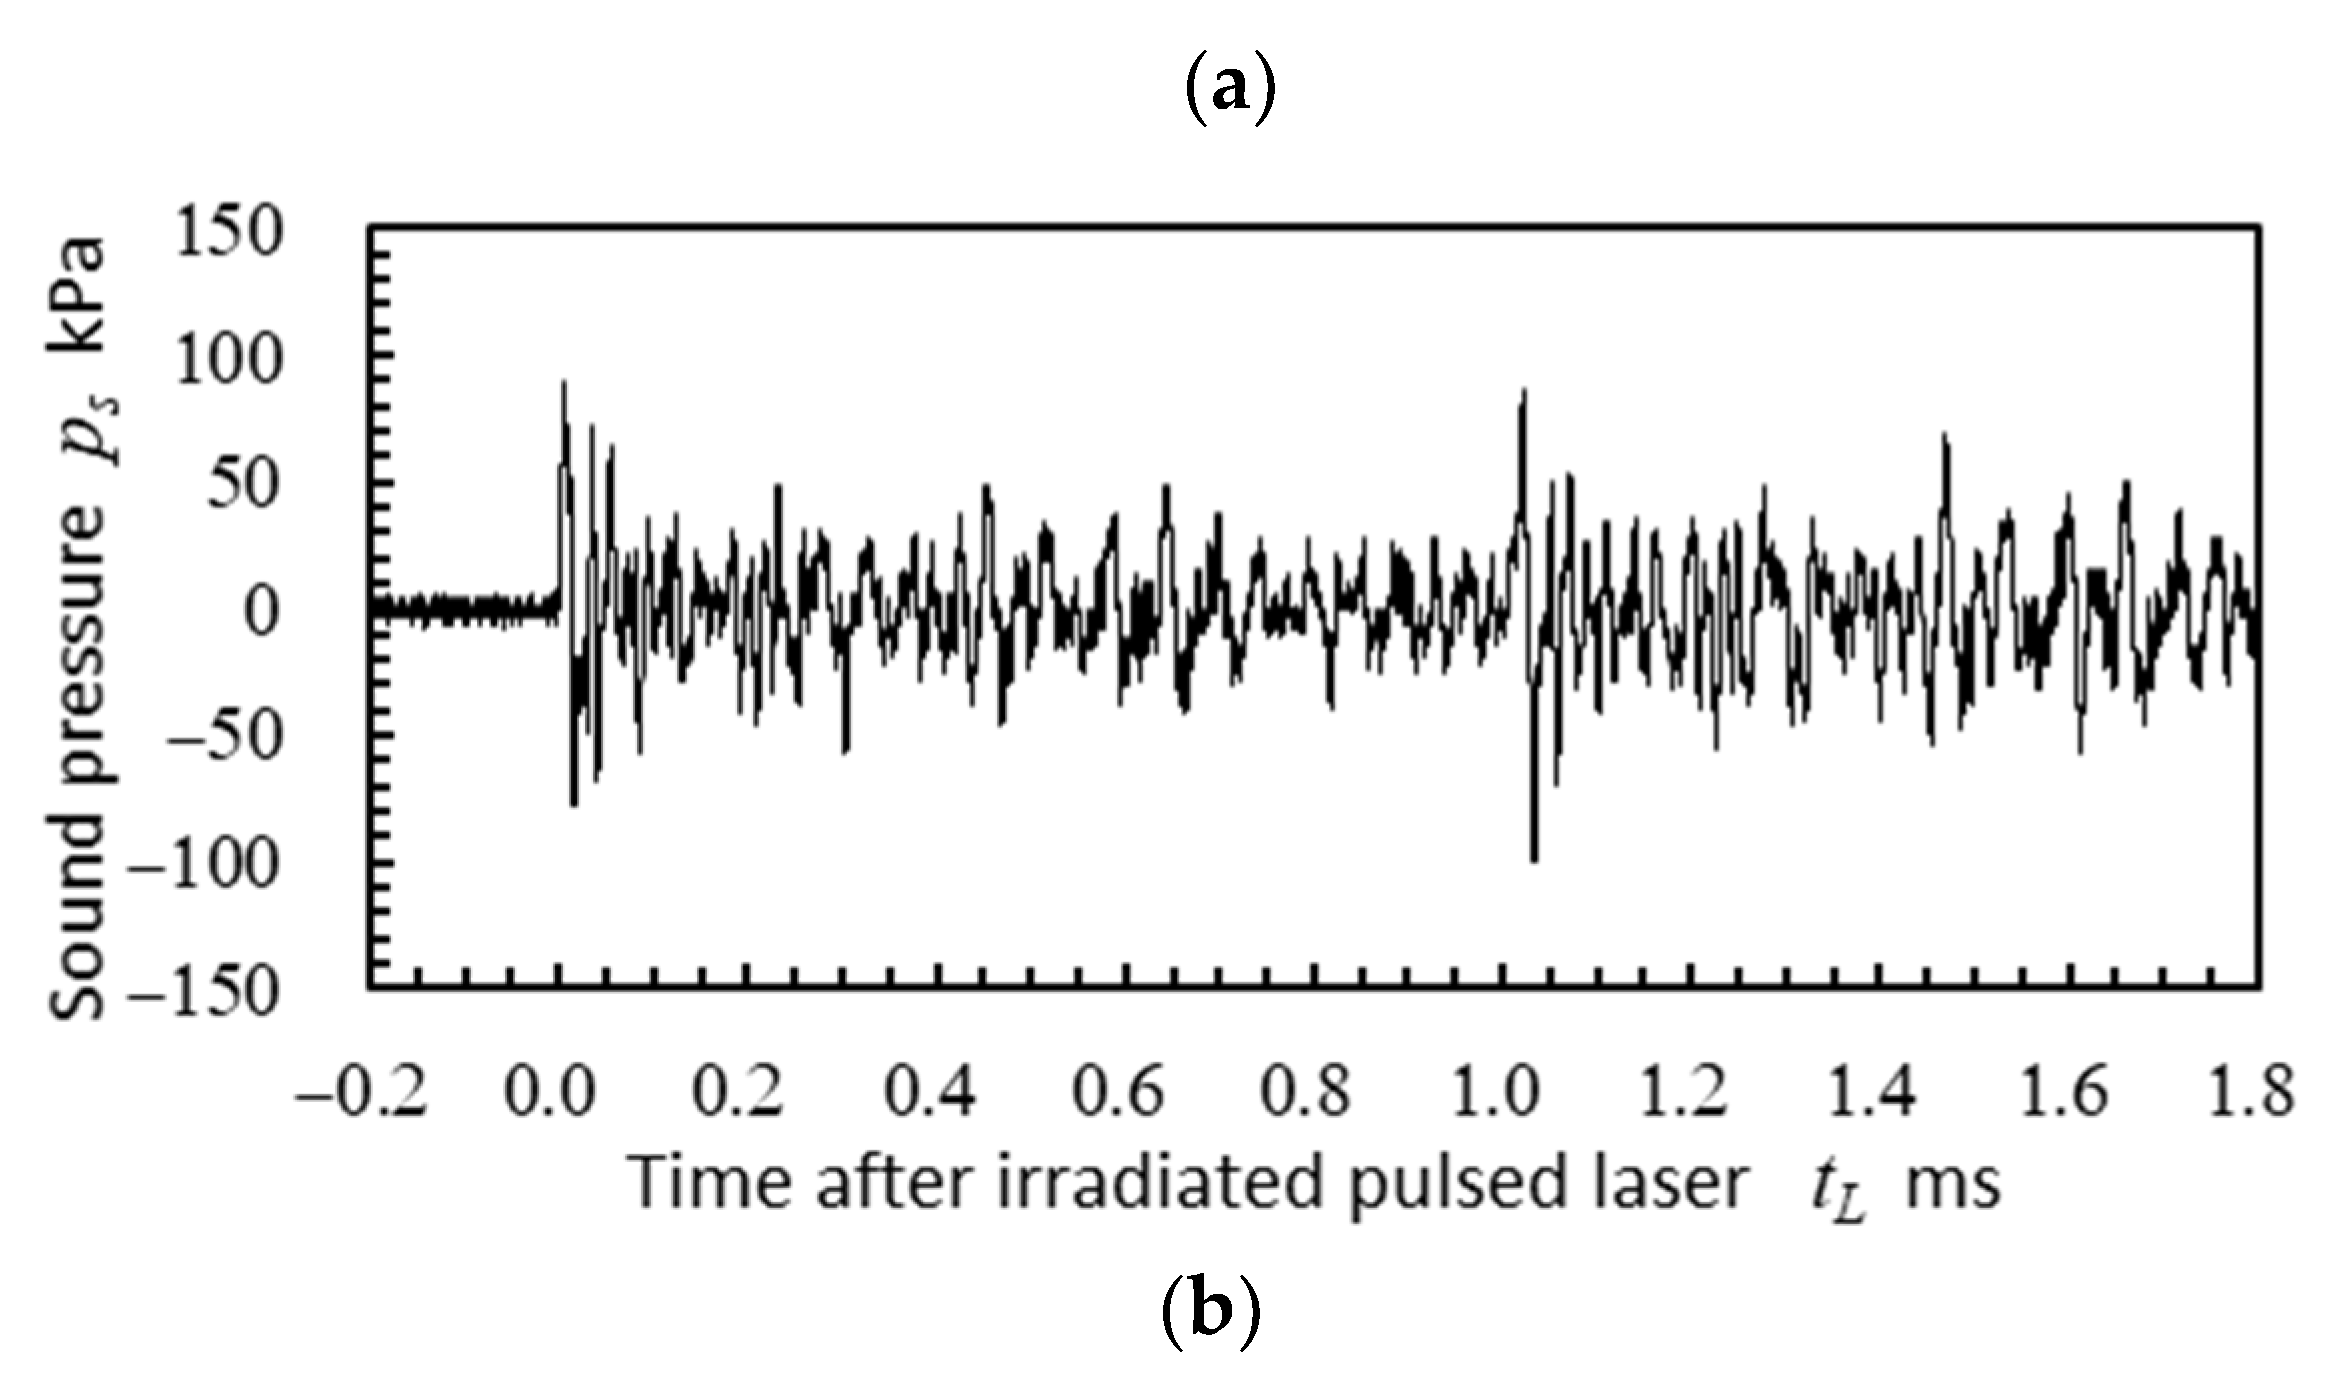
3.1. Laser Ablation (LA) and Laser Cavitation (LC) Generated by a Nd:YAG Laser and a Fiber Laser
3.2. Determination of Submerged Laser Peening (SLP) Conditions Using a Fiber Laser
3.3. Aspect of Surface Treated by Post-Processing
3.4. Effects of Post-Processing on Fatgiue Properties and Surface Properties
3.5. Estimation of Improved Fatgiue Life by Post-Processing Using Surface Roughness, Residual Stress and Hardness
4. Conclusions
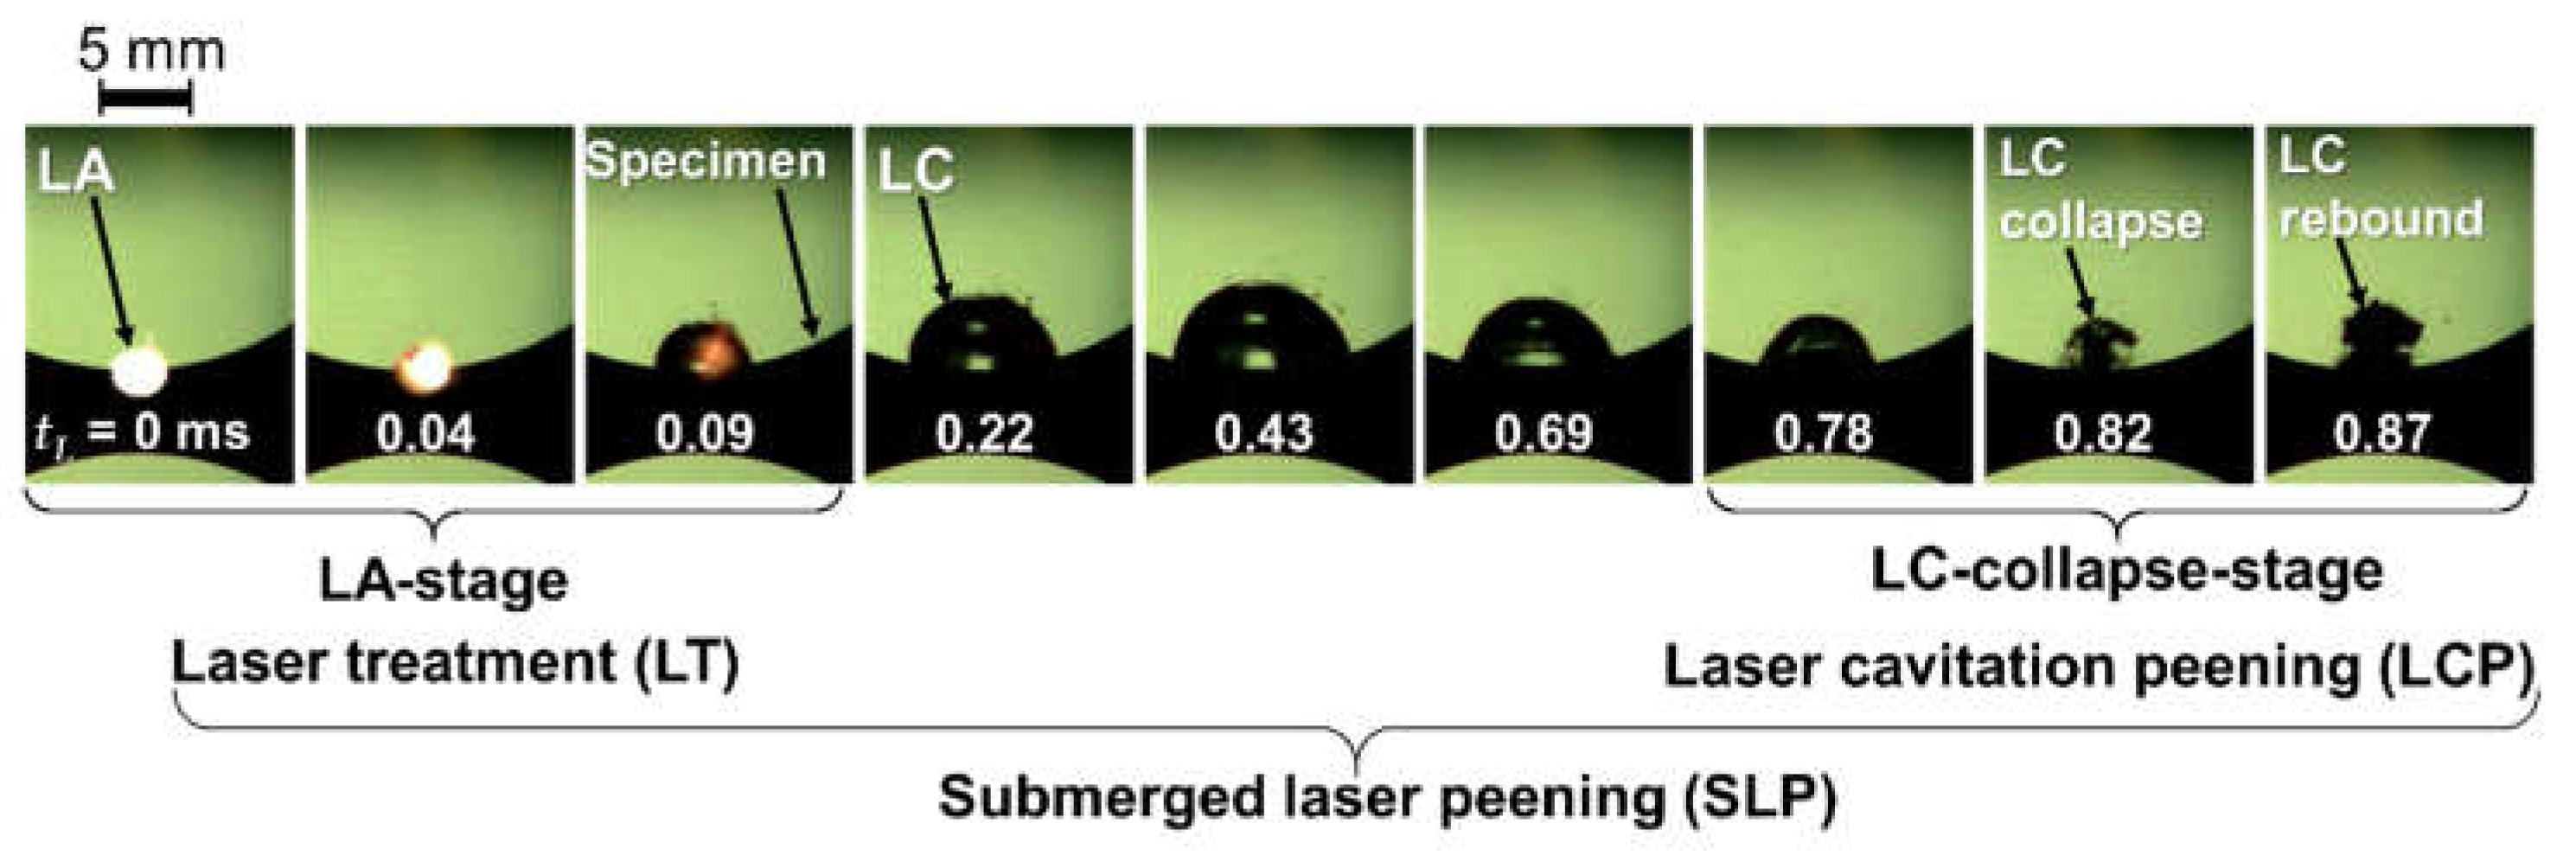
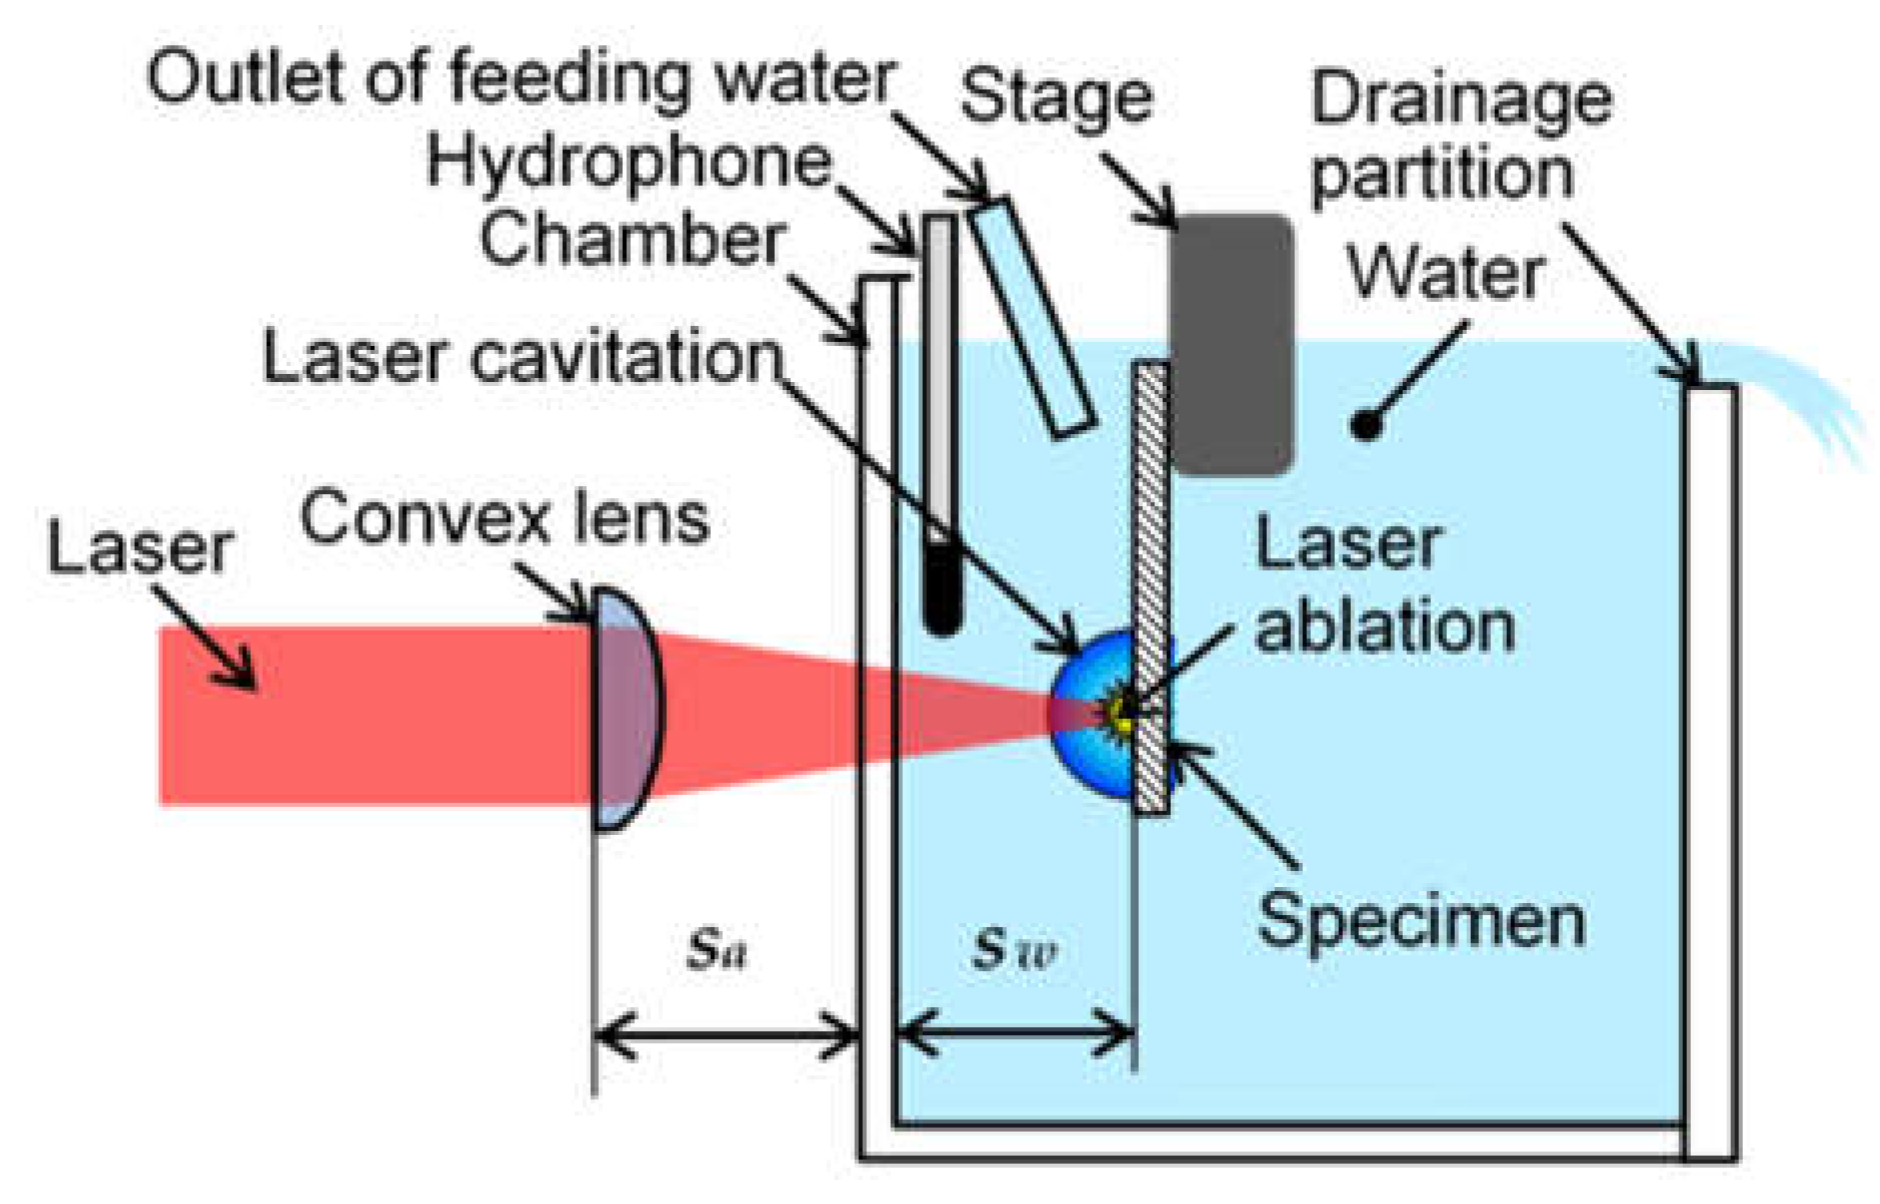
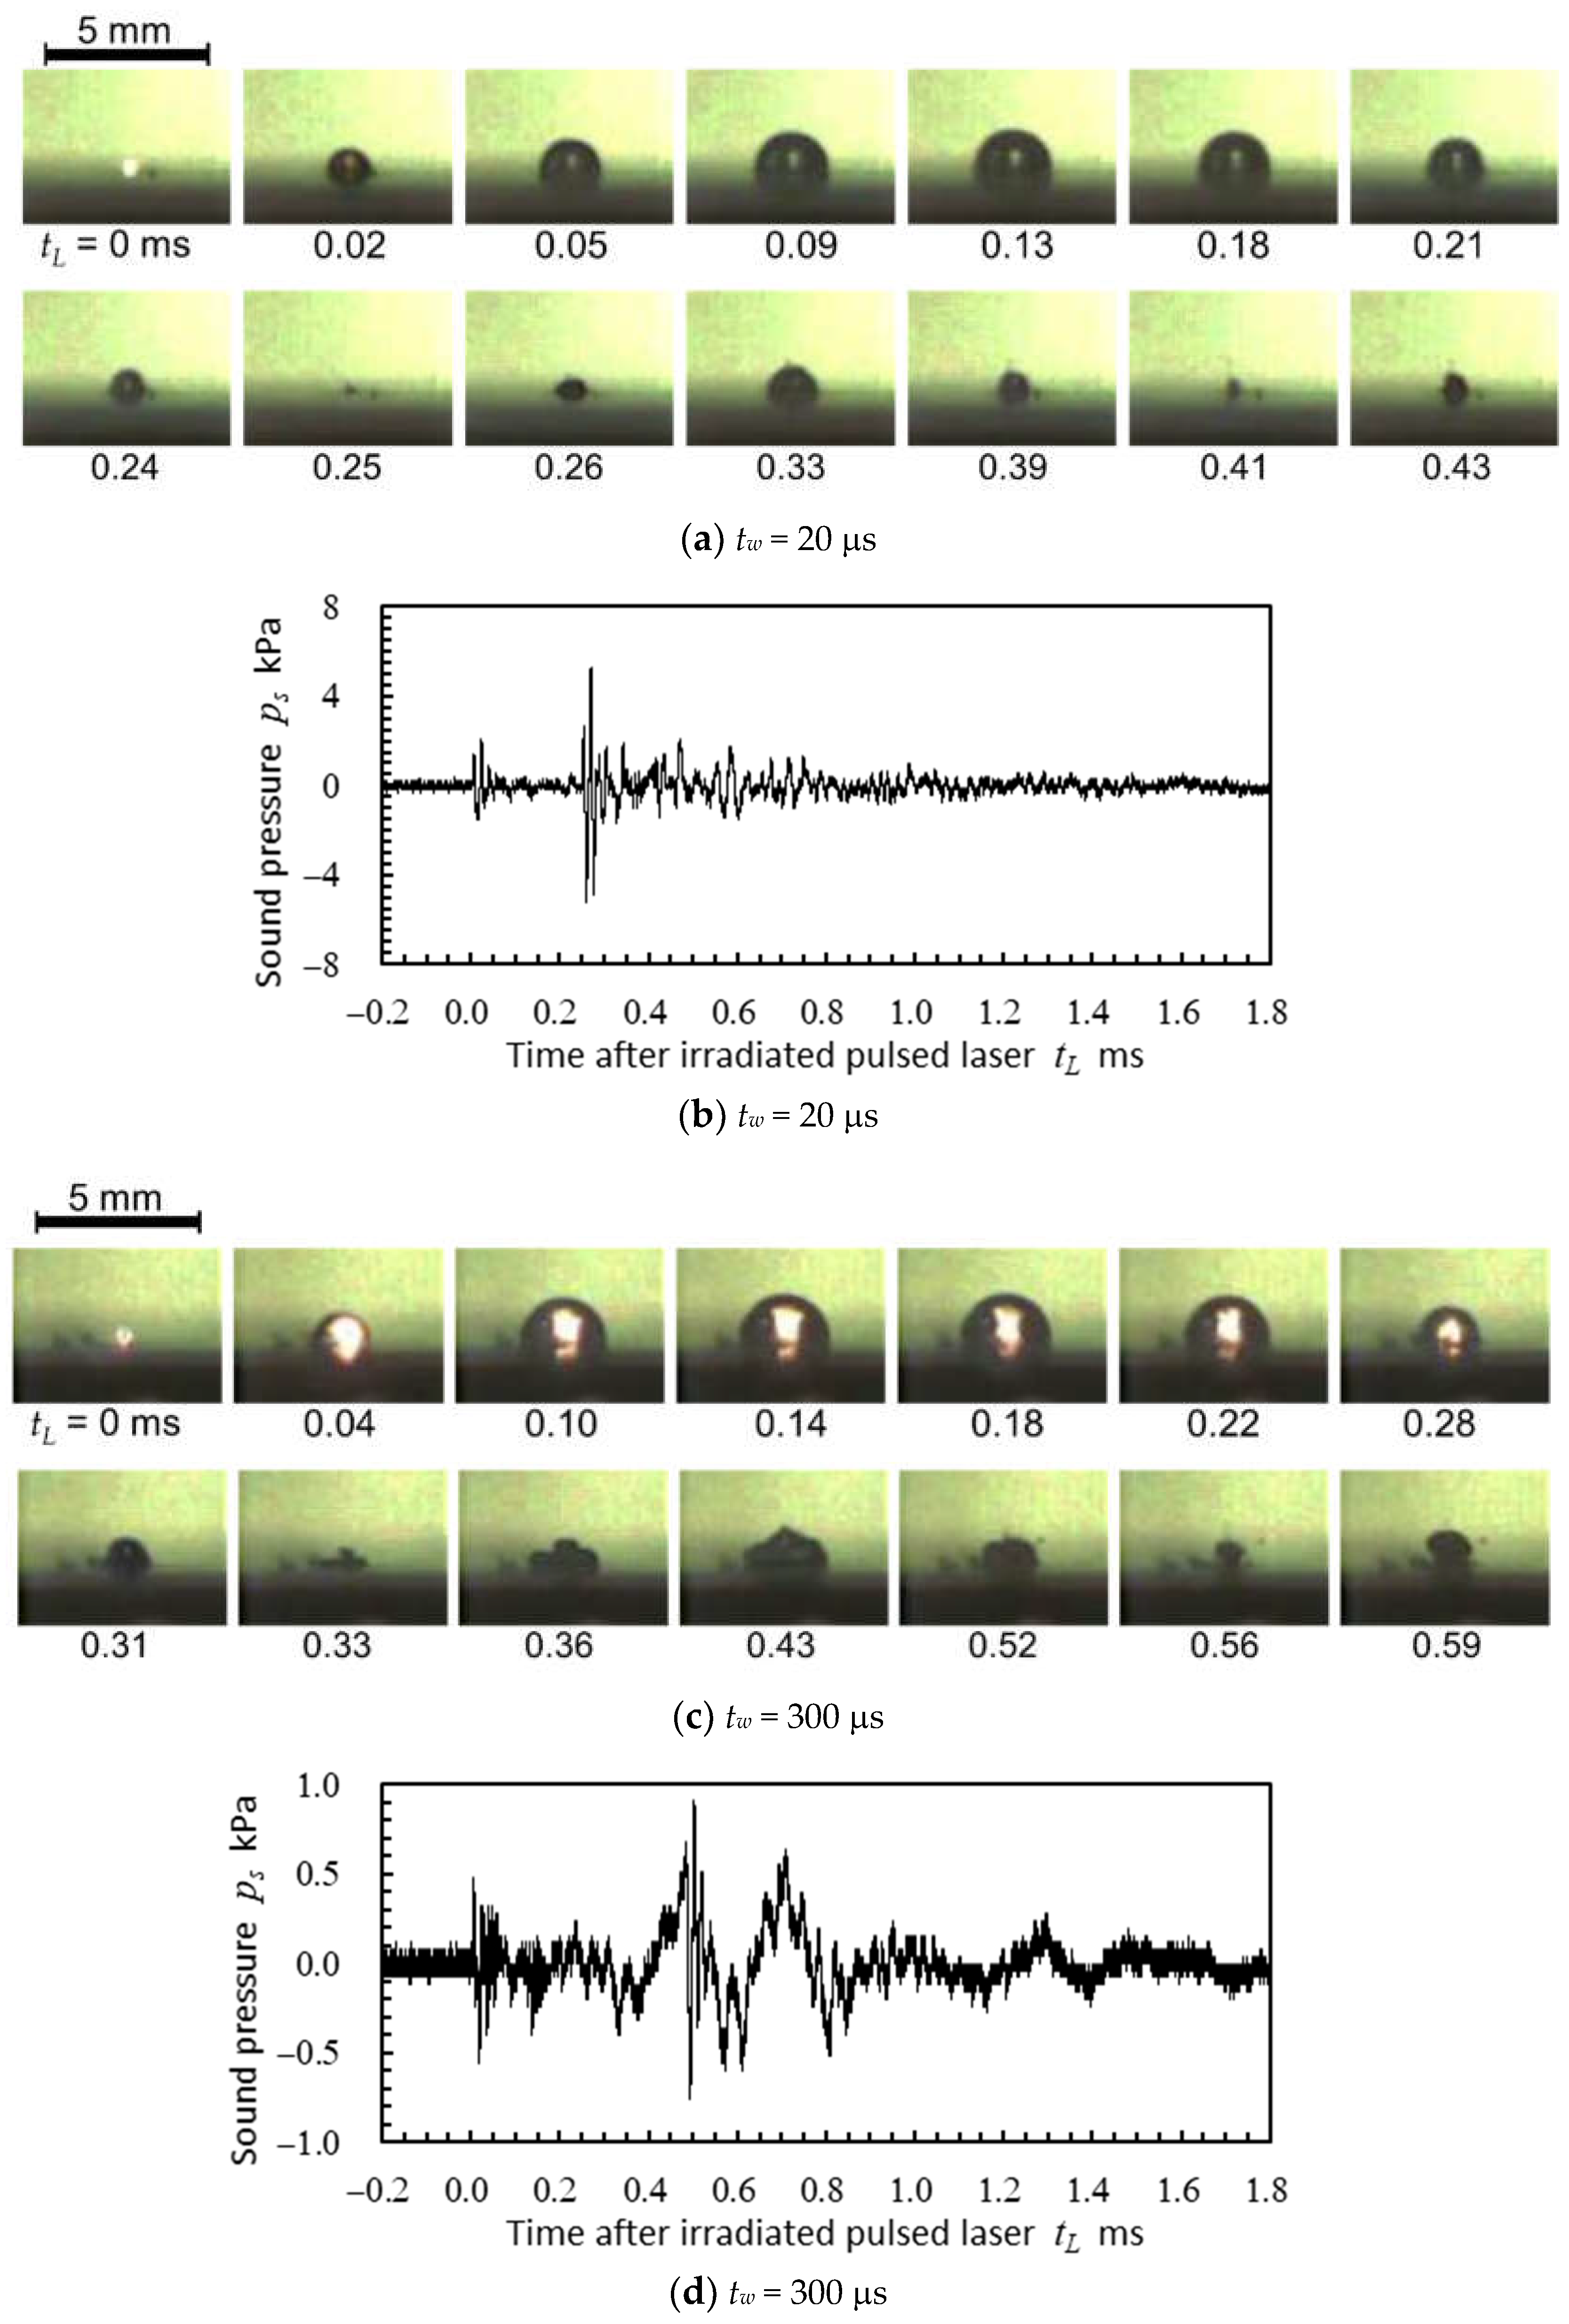
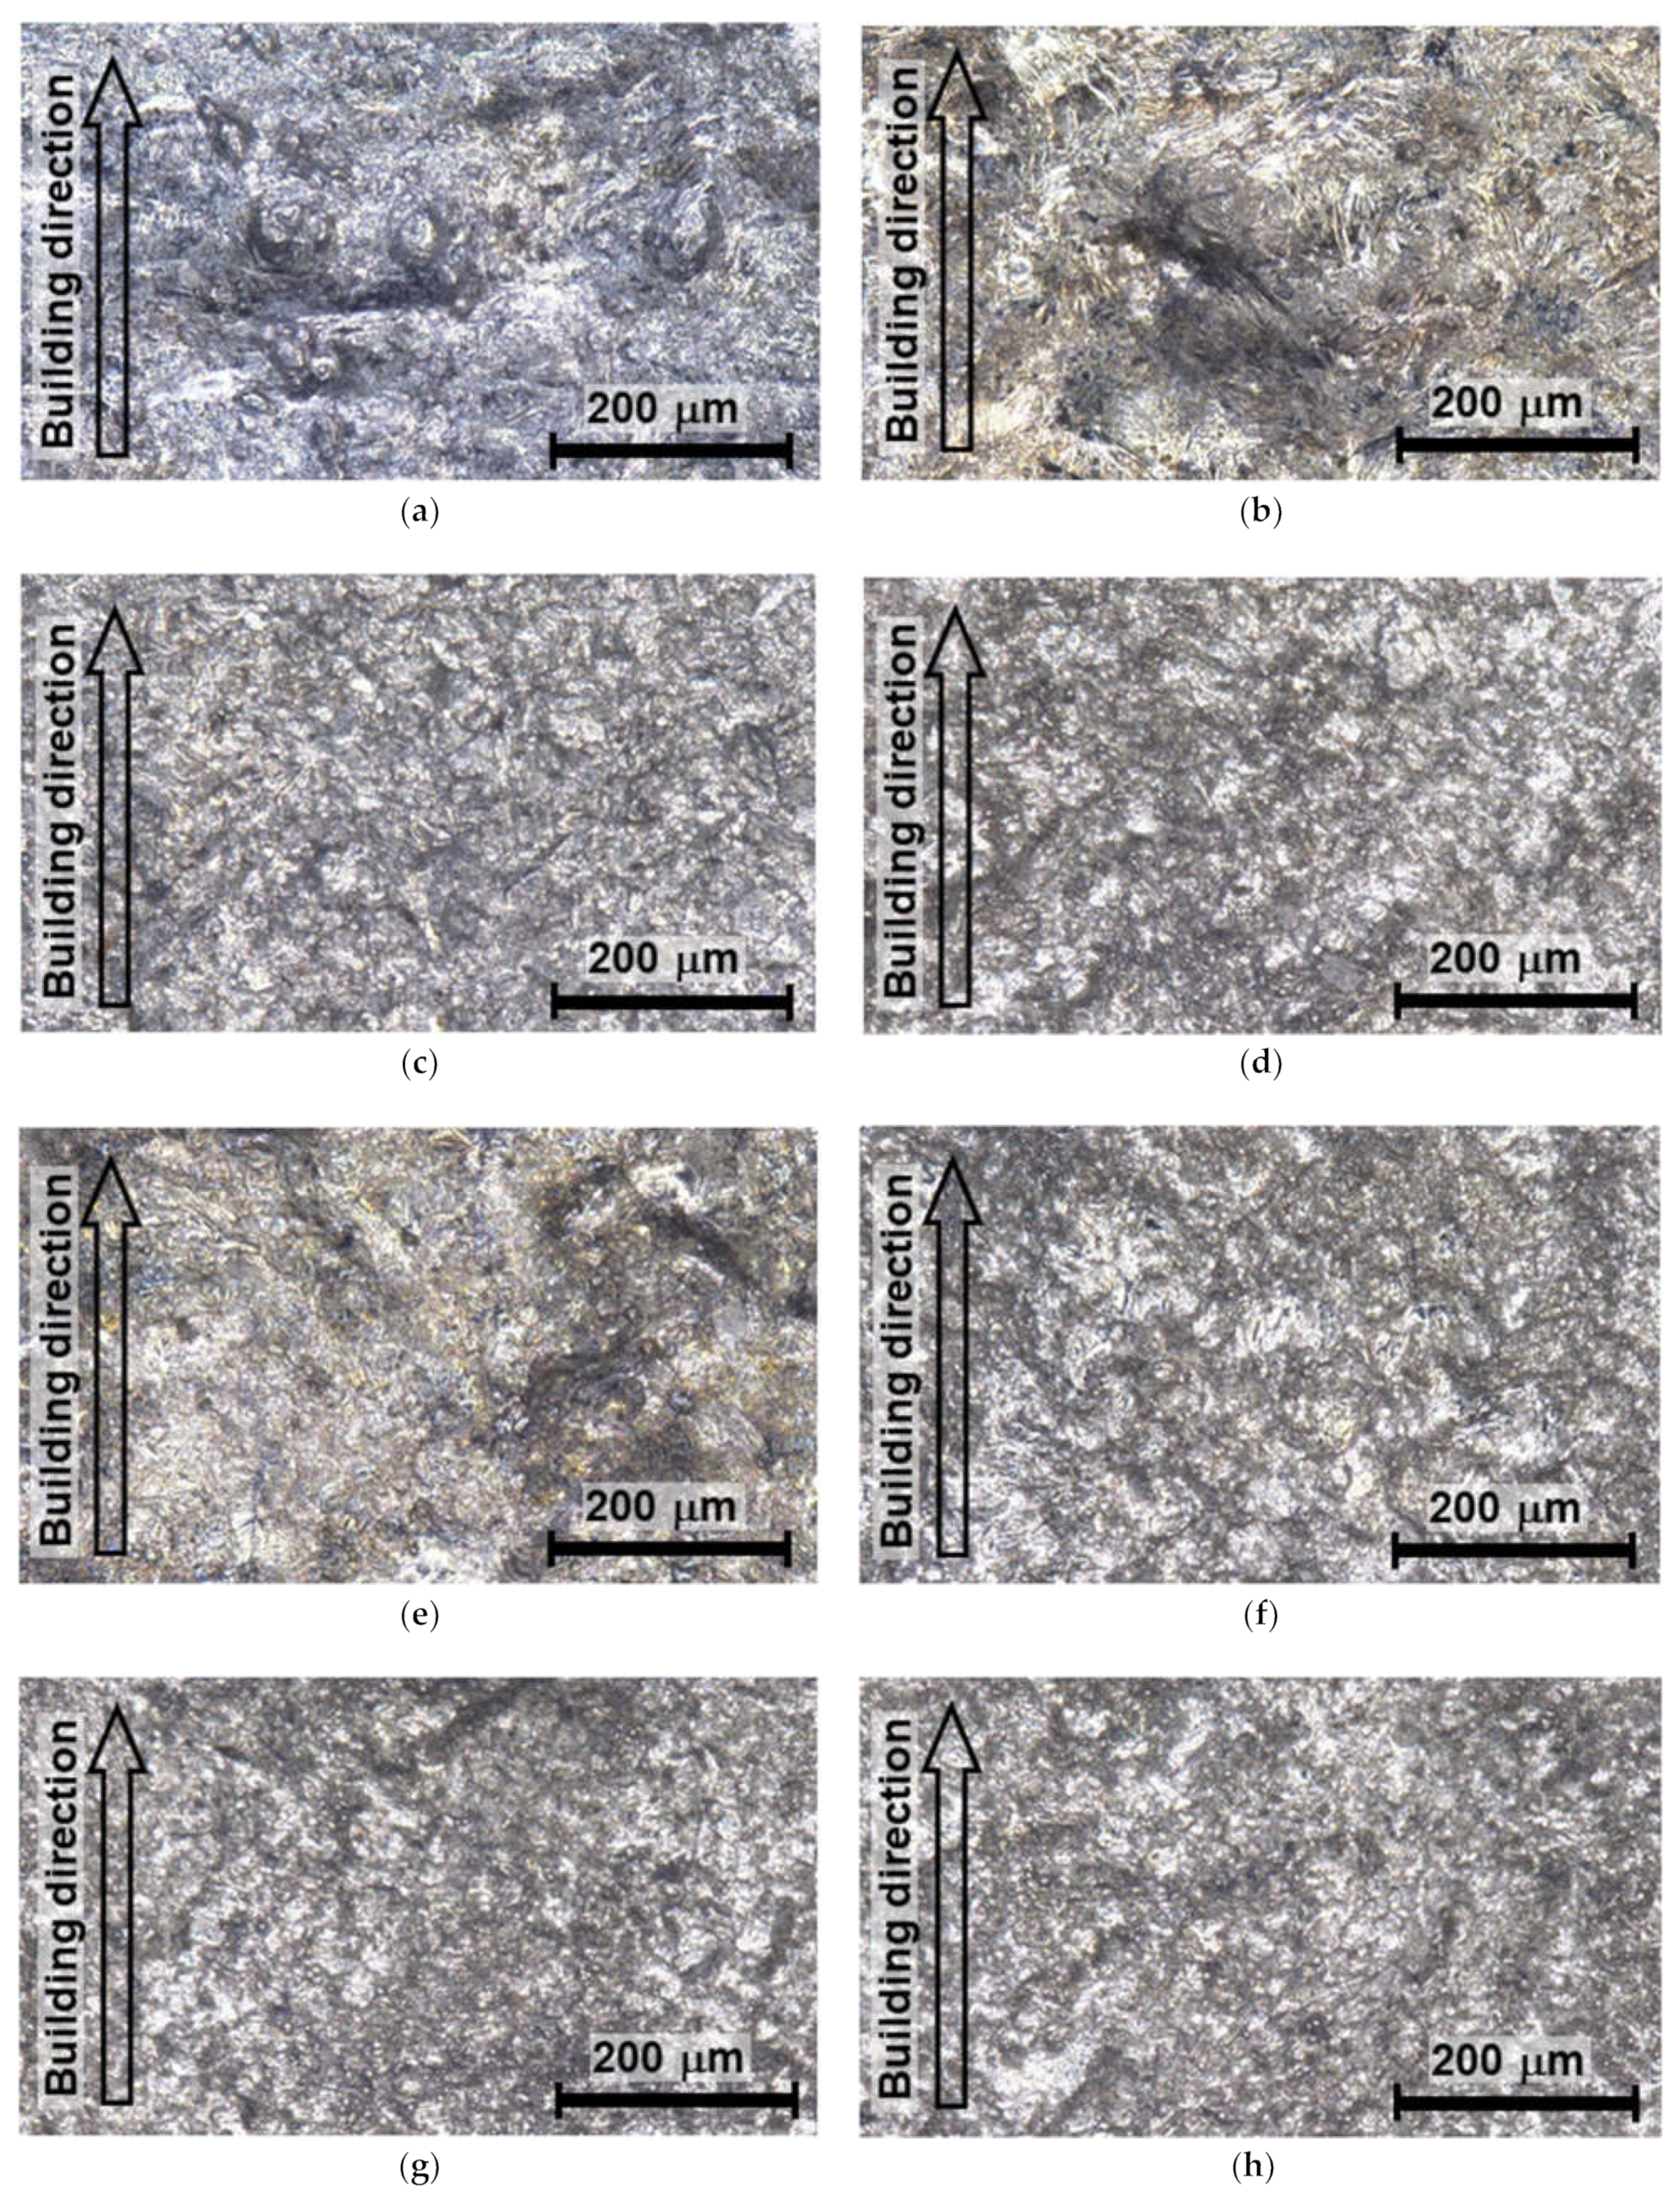
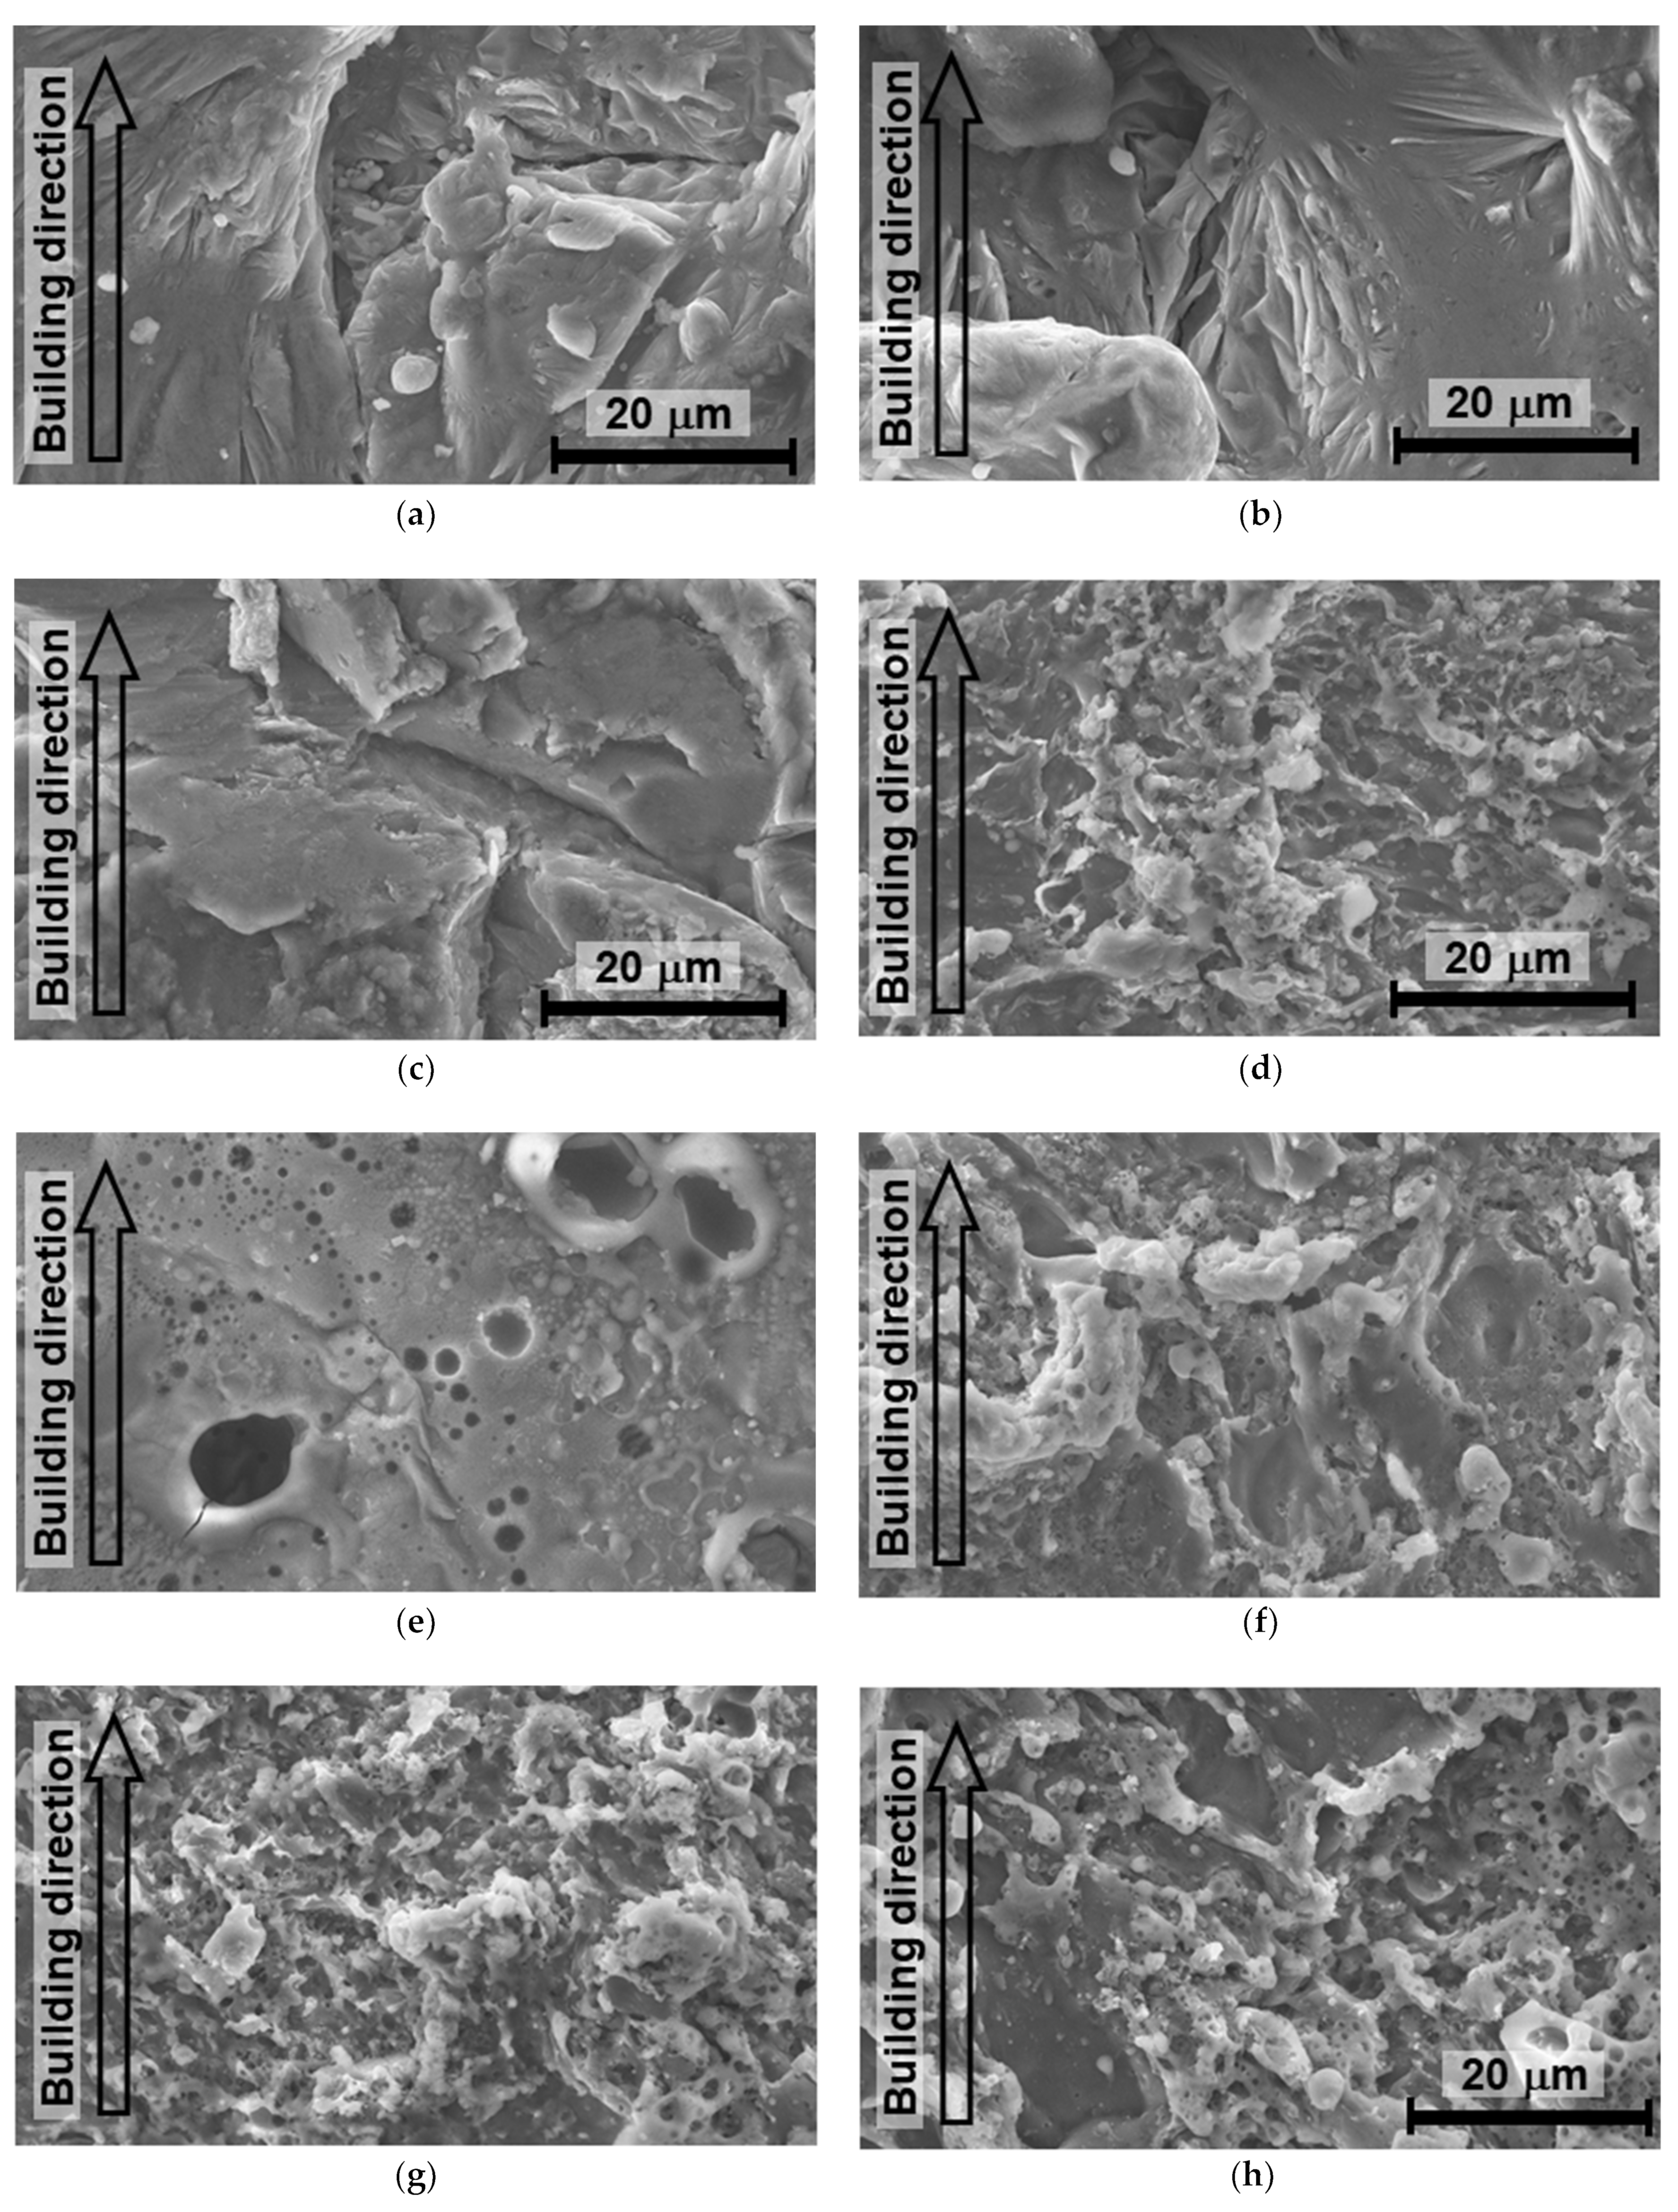
- At SLP using the fiber laser, LC was observed. The amplitude of pressure wave generated by LC collapse was 3 times larger than that of LA. At the present condition, SLP using the fiber laser smoothen the surface of as-built PBF-LS/AlSi10Mg, and the surface residual stress was tensile after SLP using the fiber laser. Thus, SLP using the fiber laser was LT rather than LCP.
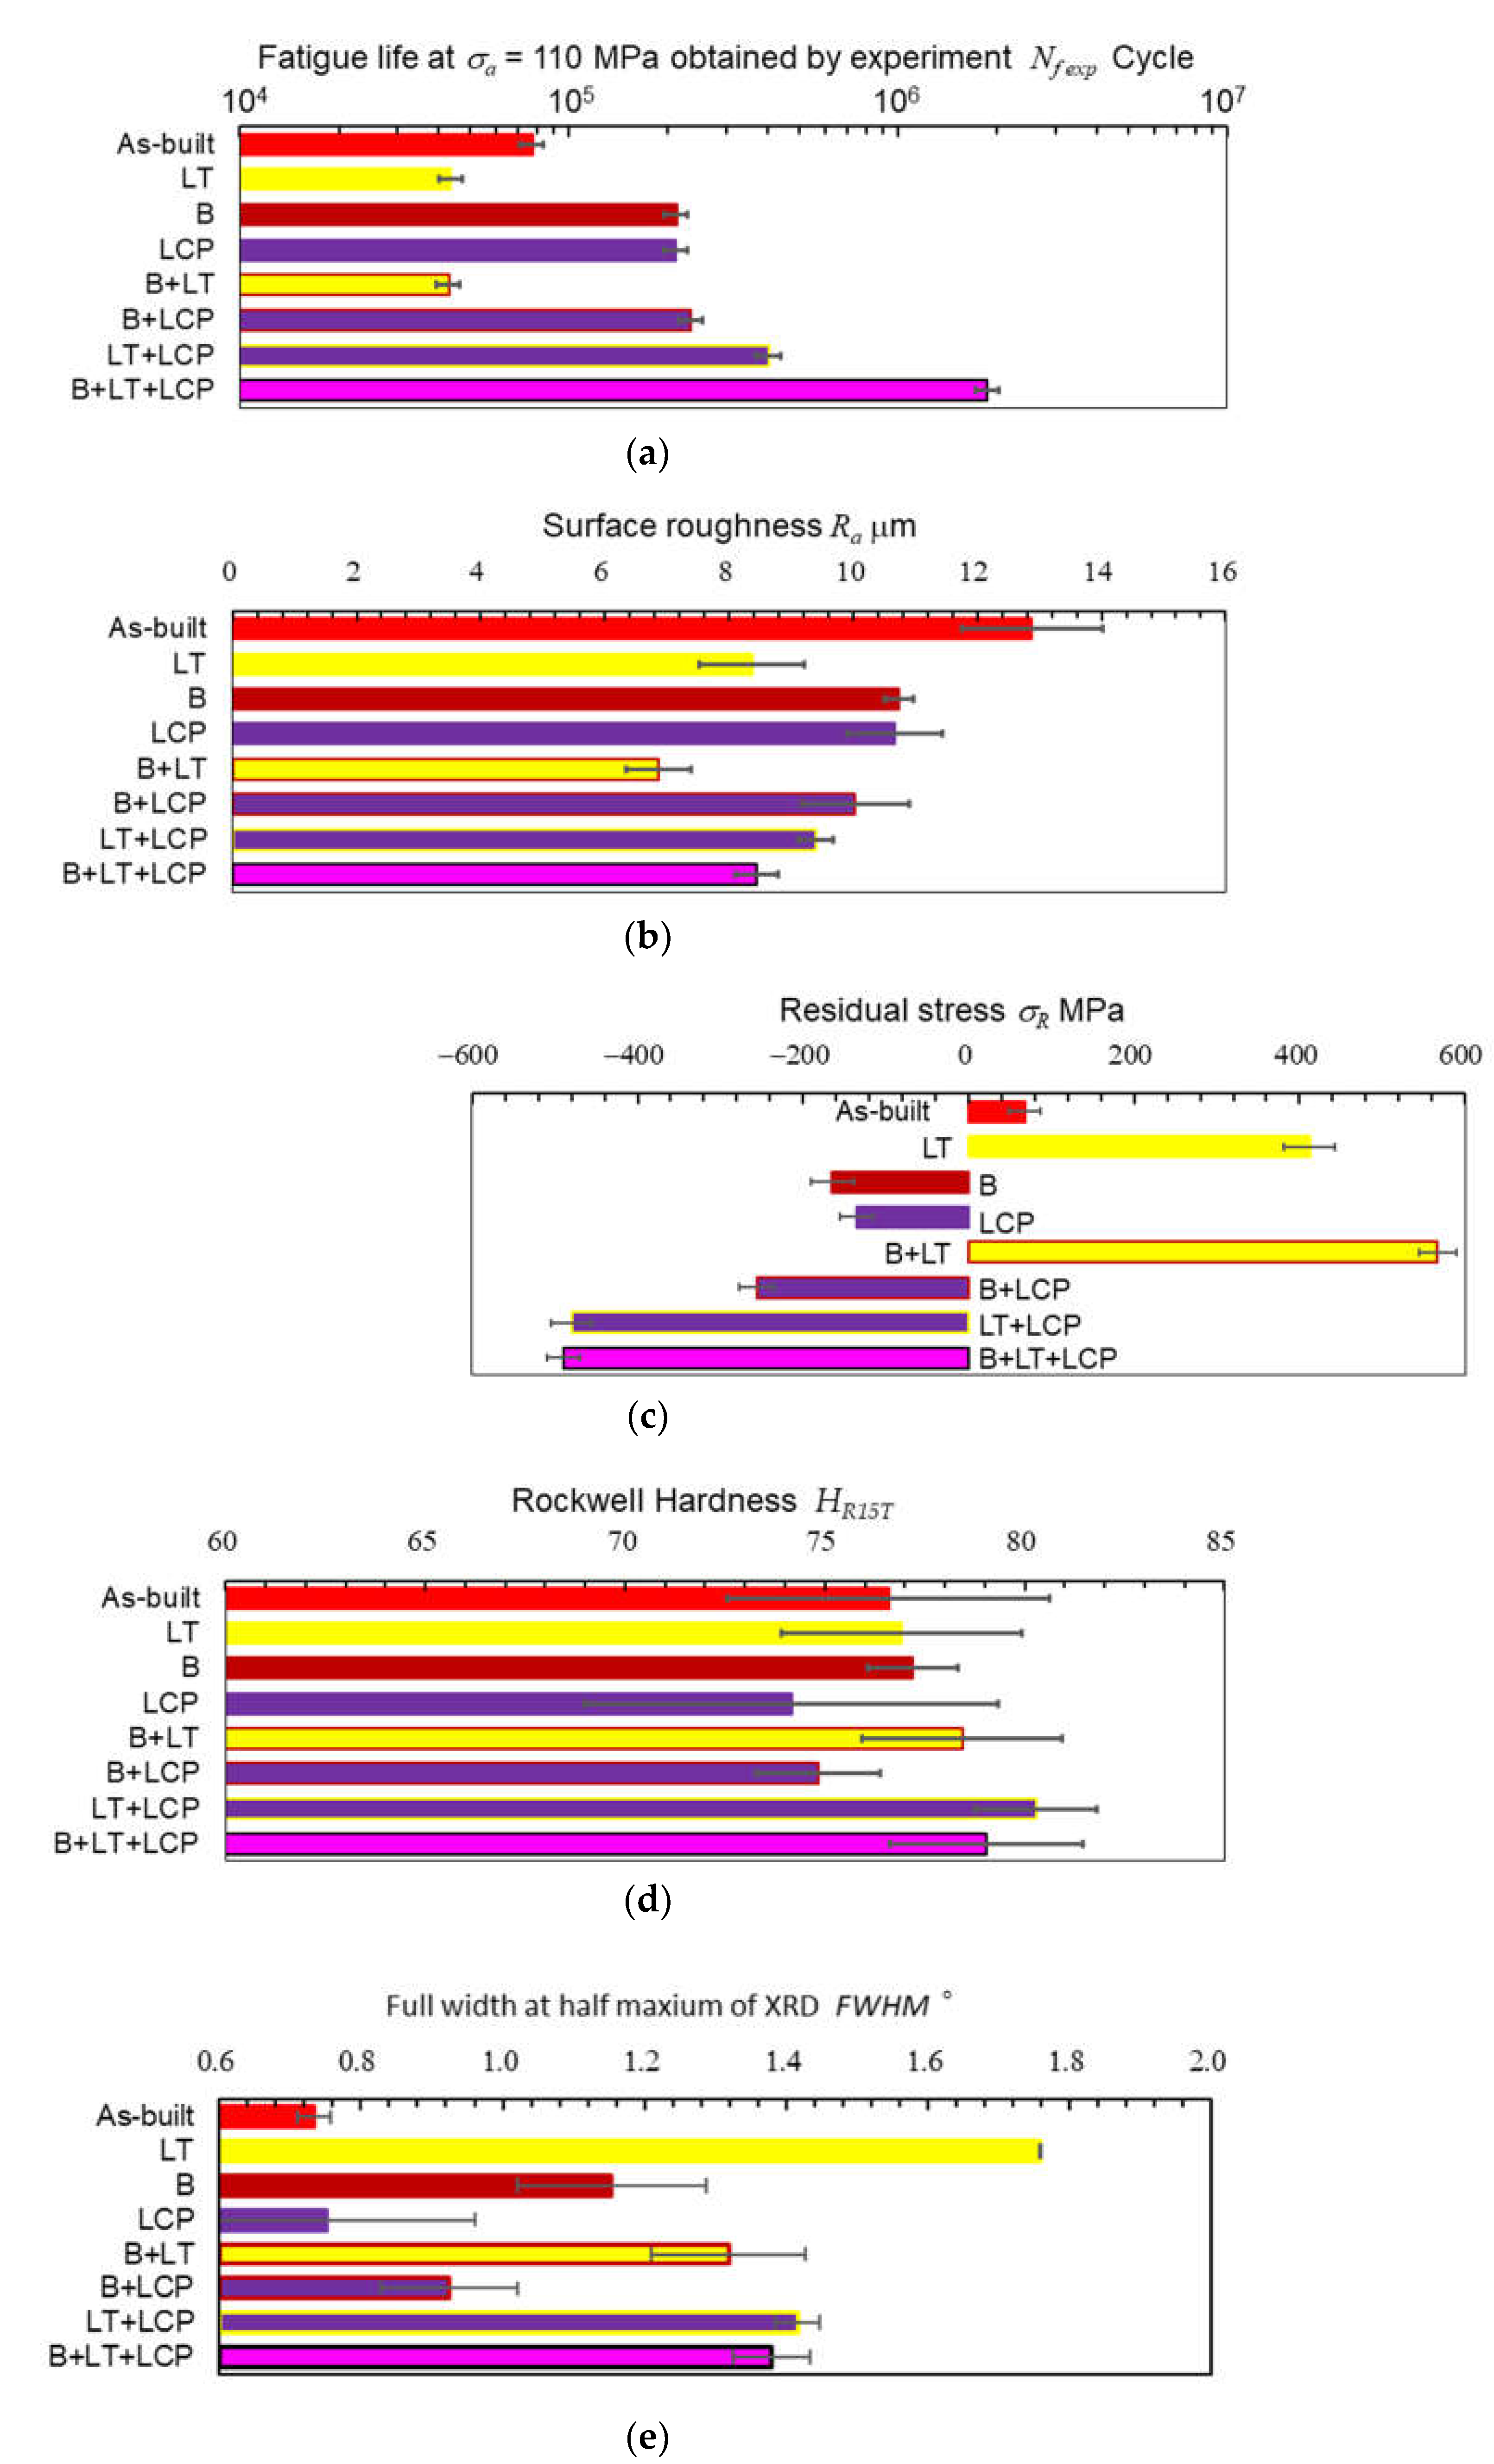
- Blasting (B) roughened the as-built surface of PBF-LS/AlSi10Mg, and enhanced the effect of following LT, as blasted surface absorbed the pulsed laser energy. LT, i.e., SLP by the fiber laser, melted the as-built surface, and quenched the surface, then introduced tensile residual stress. LCP, i.e., SLP by the Nd:YAG laser, introduced compressive residual stress into as-built surface. In the case of the fatigue life at a = 110 MPa, B + LT + LCP was best, LT + LCP was 2nd, B + LCP was 3rd, and B or LCP were 4th.
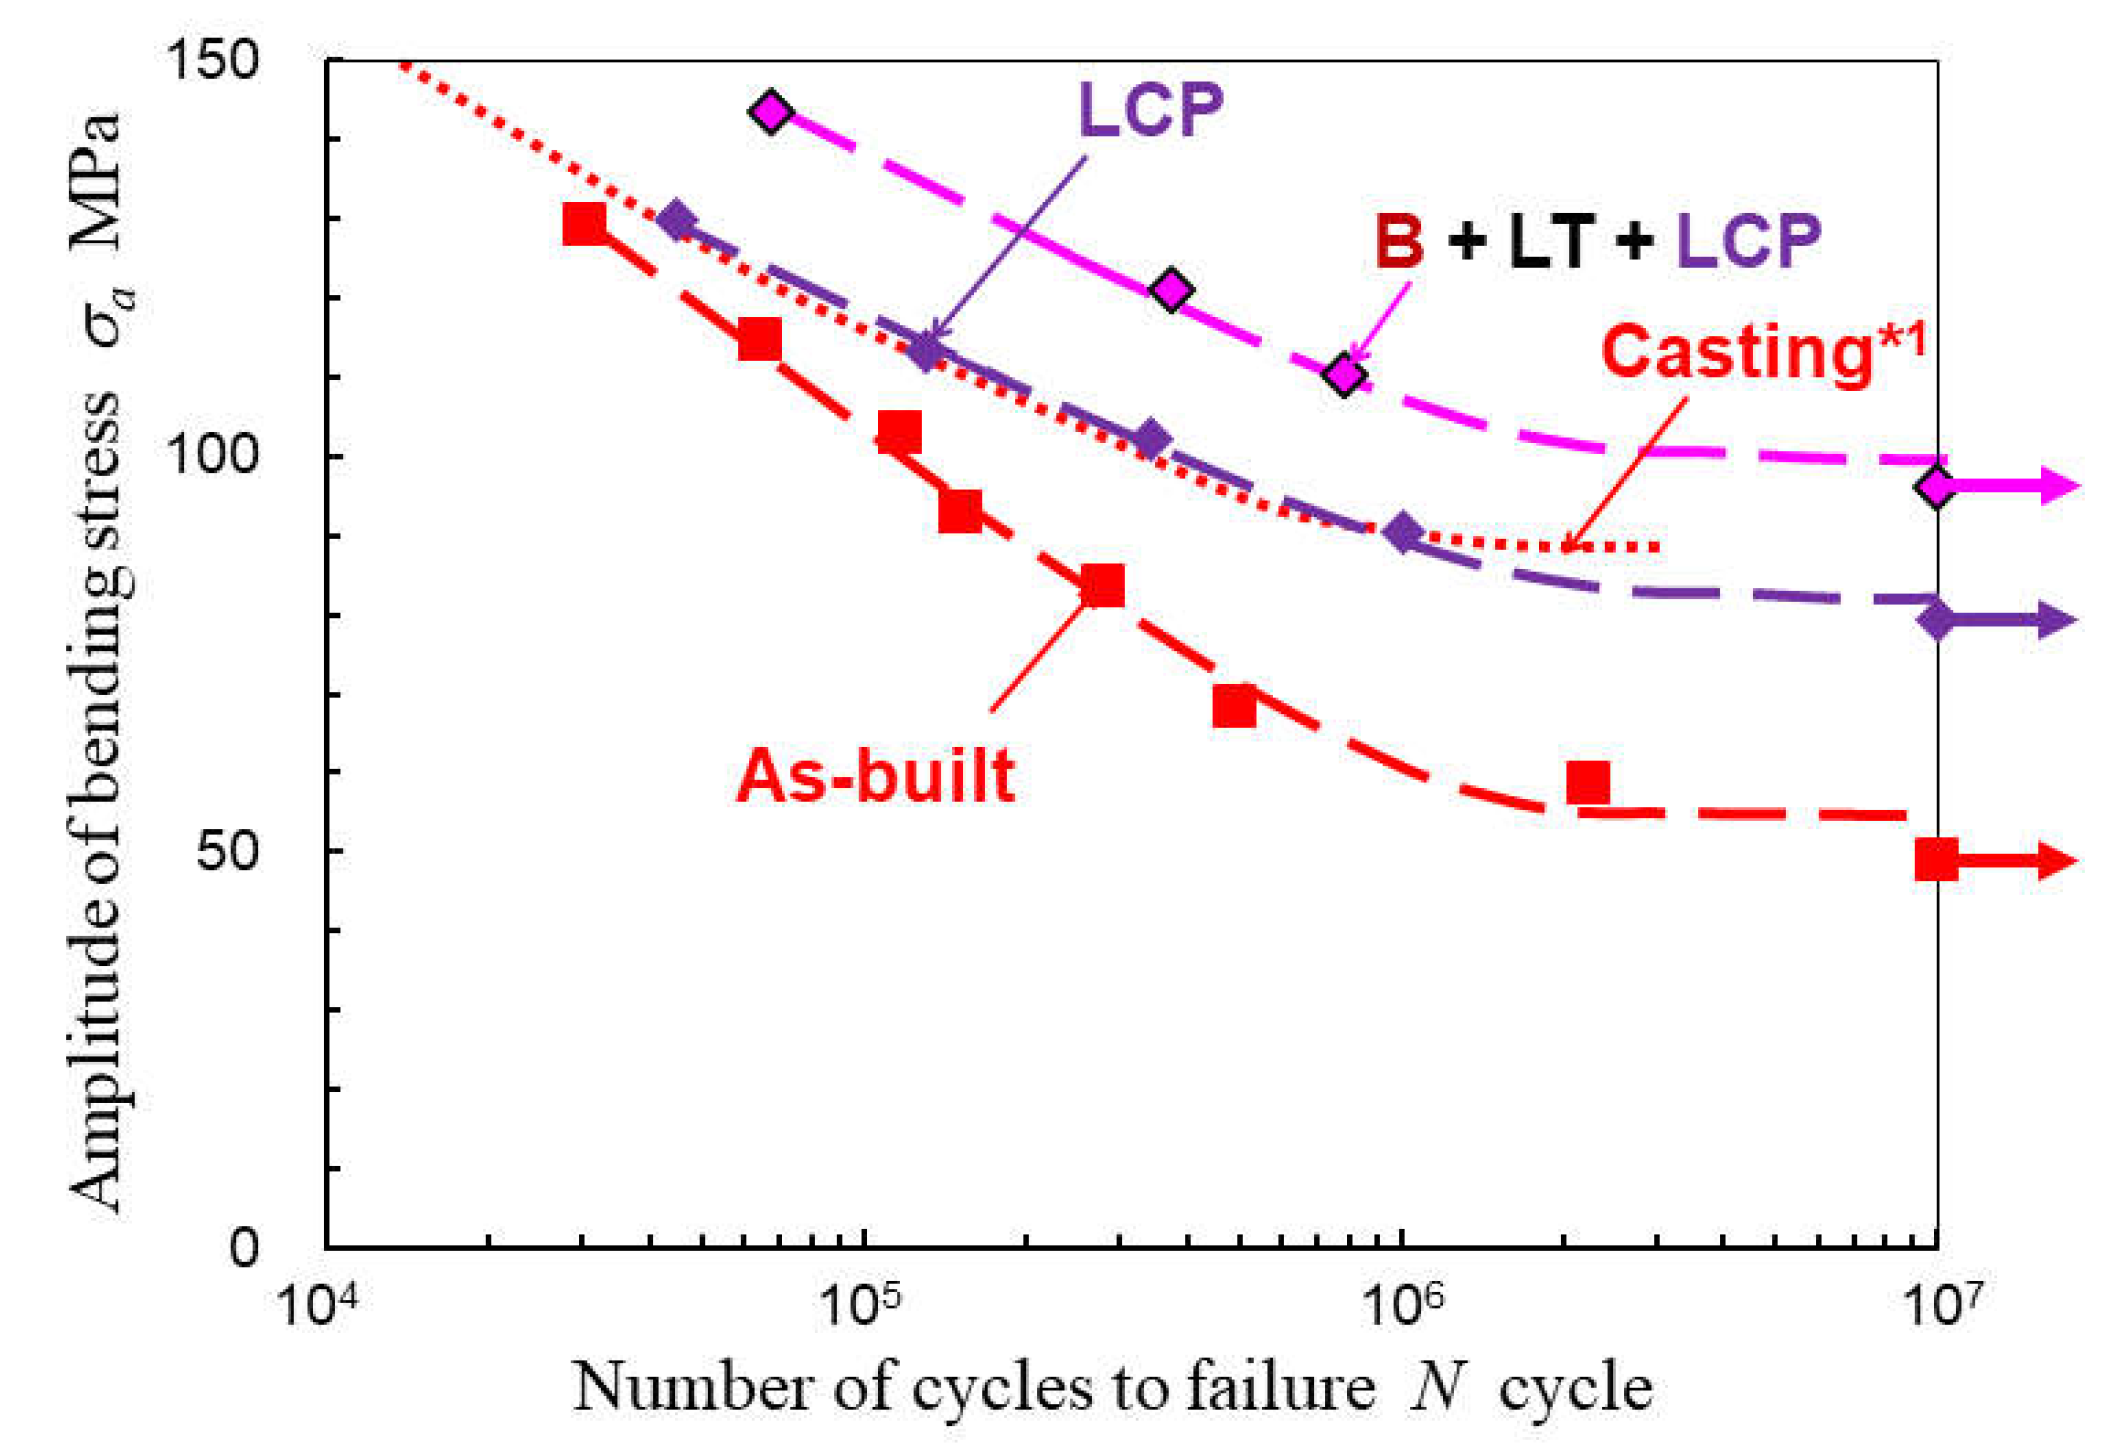
- In the case of fatigue strength of PBF-LS/AlSi10Mg at 107, B + LT + LCP was 103 ± 12 MPa, LCP was 85 ± 10 MPa, whereas as-built was 54 ± 9 MPa. Namely, B + LT + LCP improved the fatigue strength 1.9 times comparing with the as-built.
- LT + LCP introduced compressive residual stress (480 ± 24 MPa) which was larger than that of enhanced LCP only ( ± 20 MPa), although LT introduced tensile residual stress (412 ± 31 MPa).
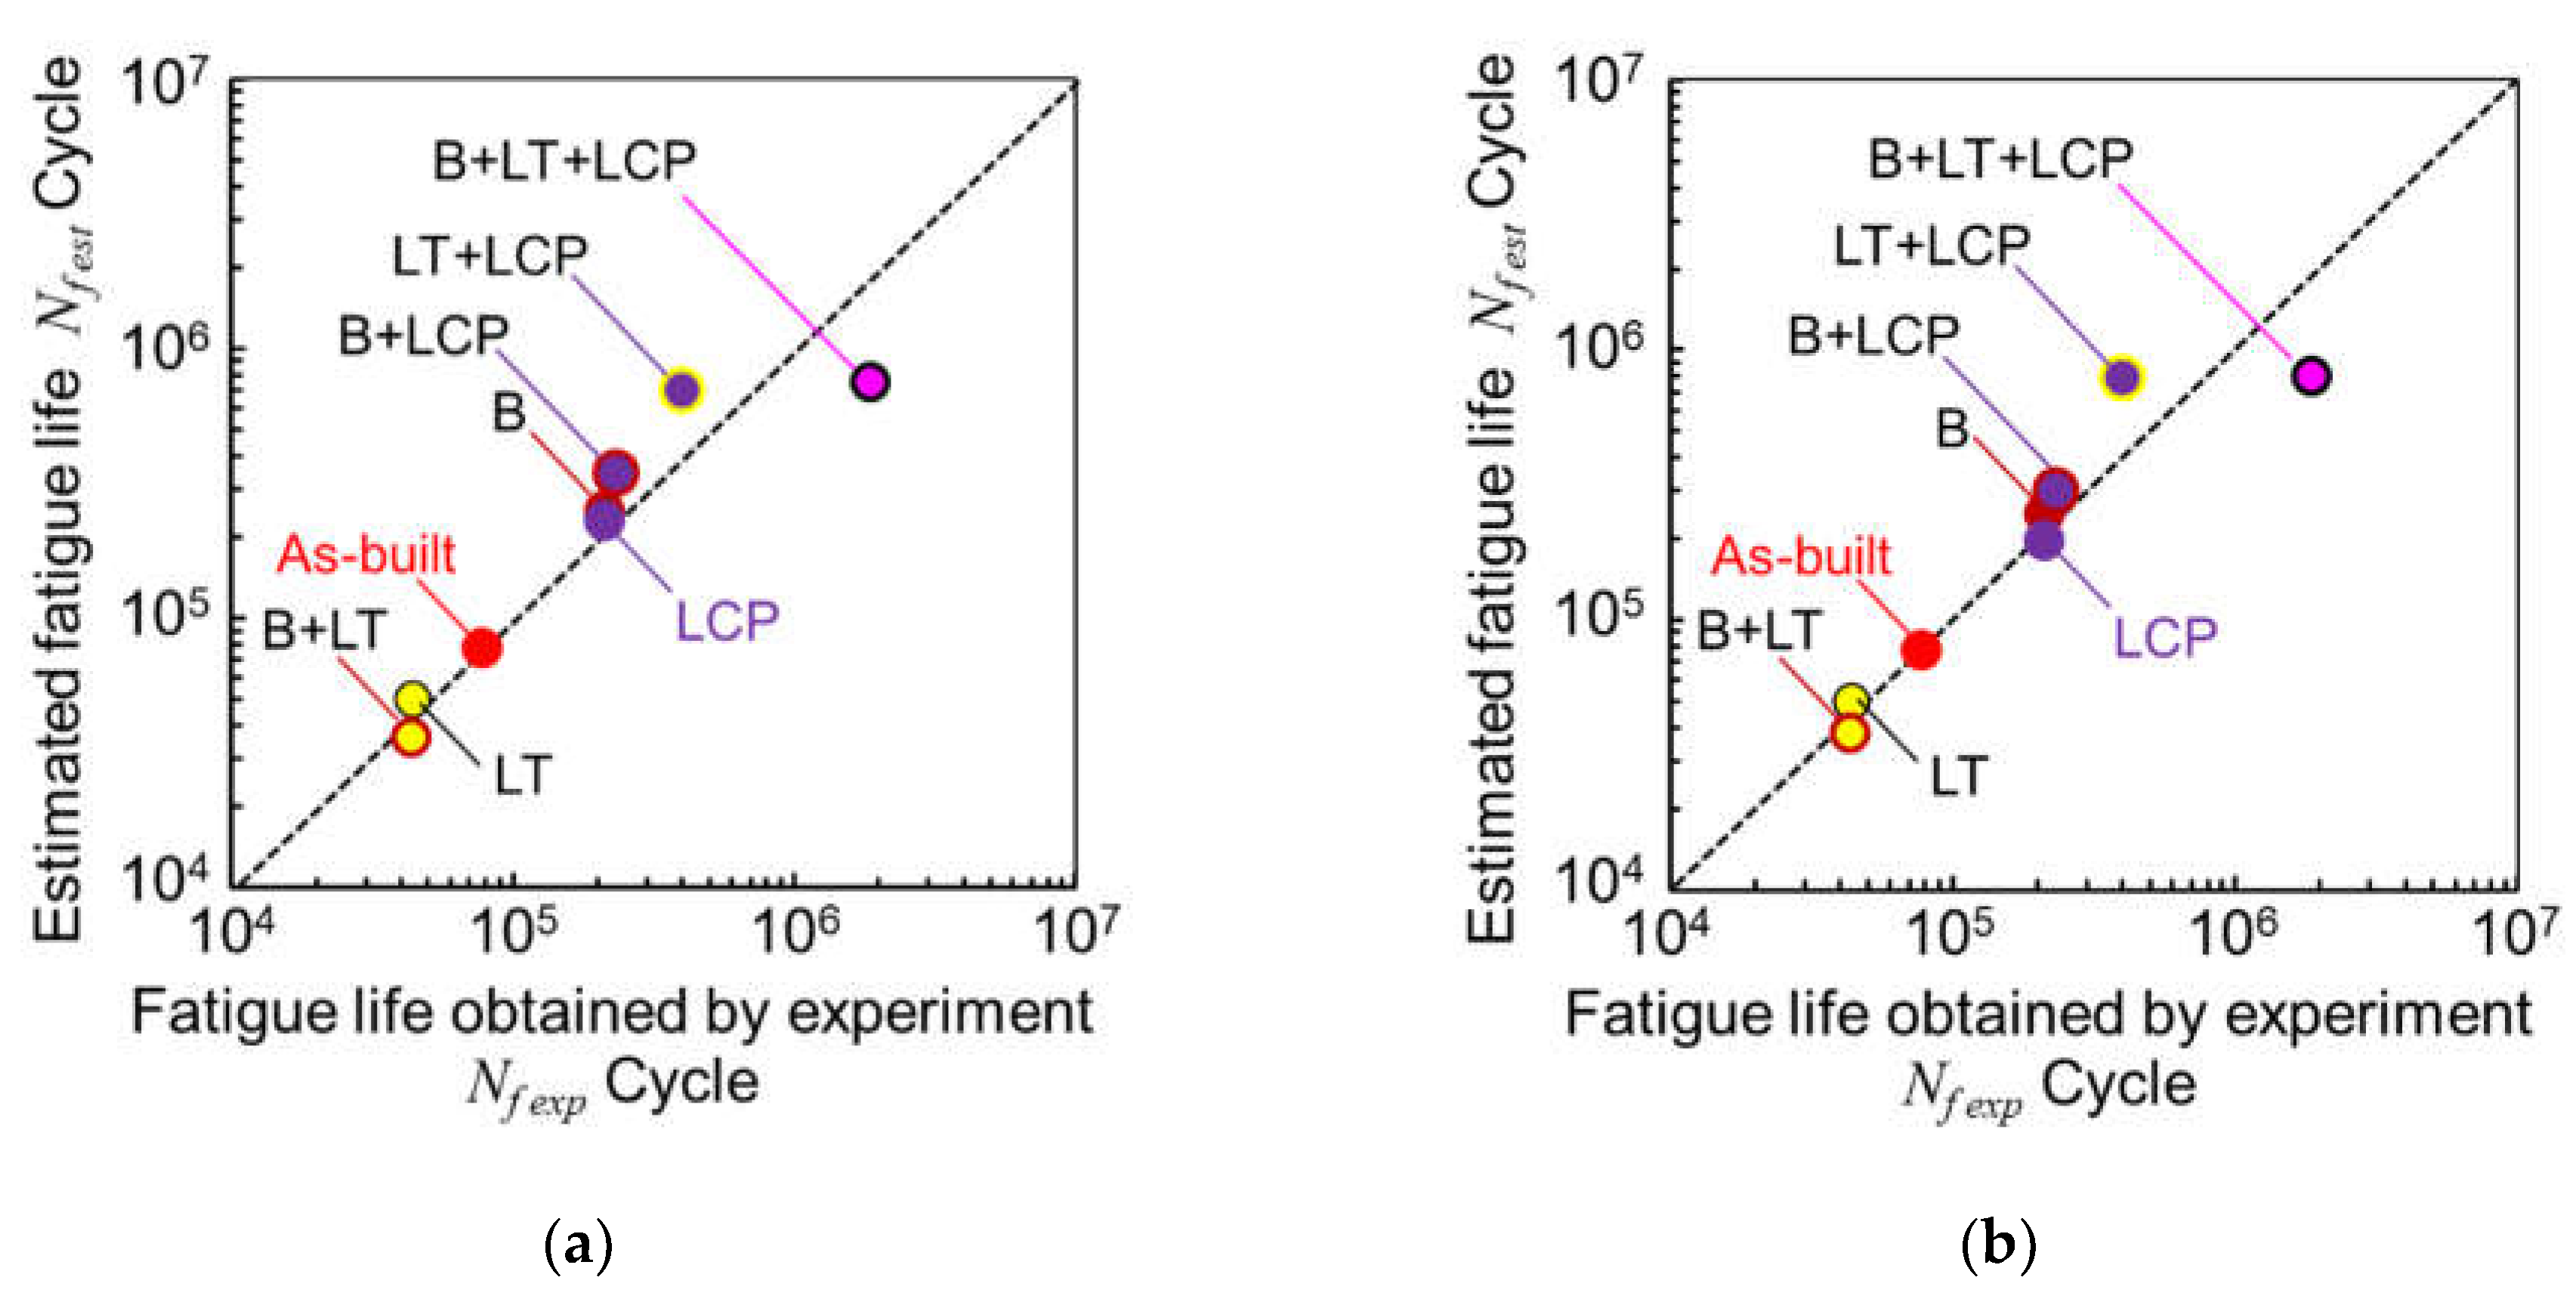
- The improvement of fatigue strength of as-built PBF-LS/AlSi10Mg can be estimated by surface roughness and the surface residual stress. The work hardening also contributed the improvement of the fatigue strength, however, the contribution of work hardening in improving fatigue strength was relatively small, considering the difficulty in evaluating hardness of as-built PBF-LS/AlSi10Mg due to rough surface.
- Regarding SLP by the fiber laser, when the pulse width was shorter, the sound pressure of LC collapse became larger. At LC collapse using the larger pulse width, the sound pressure of 1st LC collapse became smaller, and that of 2nd LC collapse became larger, as heat energy was introduced into bubble during 1st shrinking of LC.
Author Contributions
Funding
Institutional Review Board Statement
Informed Consent Statement
Data Availability Statement
Conflicts of Interest
Abbreviations
| 2D | two-dimension |
| AB | as-built |
| AM | additive manufacturing |
| B | blasting |
| CAD | computer-aided design |
| CAM | computer-aided manufacturing |
| CP | cavitation peening |
| HIP | hot isostatic pressing |
| ISO | International Organization for Standardization |
| JIS | Japanese Industrial Standards |
| LA | laser ablation |
| LC | laser cavitation |
| LCP | laser cavitation peening |
| LP | laser peening |
| LS | laser sintering |
| LT | laser treatment |
| PBF | powder bed fusion |
| PSPC | position sensitive proportional counter |
| PVDF | polyvinylidene fluoride |
| SAE | Society of Automotive Engineers |
| SLP | submerged laser peening |
| SP | shot peening |
| XRD | X-ray diffraction |
| Symbol | |
| abest | slope |
| b | width of specimen |
| cH | constant for surface hardness |
| cR | constant for surface residual stress |
| cs | constant for surface roughness |
| Dc | determination coefficient |
| dmax | maximum diameter of LC |
| E | Young’s modulus |
| FWHM | Full width at half maximum of X-ray diffraction |
| fL | repetition frequency of the laser |
| HR15T | Rockwell hardness |
| h | arc height |
| k | proportional constant |
| M | bending moment |
| N | number of cycles to failure |
| Nf est | estimated fatigue life |
| Nf exp | fatigue life obtained by experiment |
| p | pressure |
| pnon | probability of a non-correlation |
| ps | sound pressure detected by hydrophone |
| R | stress ratio |
| R0 | initial radius of bubble |
| Ra | surface roughness |
| r | correlation coefficient |
| sa | standoff distance in air |
| sv | vertical direction |
| sw | standoff distance in water |
| tc | collapse time of bubble |
| tL | time after irradiated pulsed laser |
| tD | developing time of LC |
| tw | laser pulse width |
| vh | horizontal velocity |
| χ | Debye ring direction |
| | thickness of specimen |
| | rotation angle of specimen |
| | diffraction angle |
| | density of water |
| L | laser pulse density |
| | wave length |
| | Poisson ratio |
| a | applied stress |
| R | residual stress |
| s | standard deviation of slope |
| | incidence angle |
References
- Murr, L.E.; Gaytan, S.M.; Ramirez, D.A.; Martinez, E.; Hernandez, J.; Amato, K.N.; Shindo, P.W.; Medina, F.R.; Wicker, R.B. Metal fabrication by additive manufacturing using laser and electron beam melting technologies. J. Mater. Sci. Technol. 2012, 28, 1–14. [Google Scholar] [CrossRef]
- Wang, X.J.; Xu, S.Q.; Zhou, S.W.; Xu, W.; Leary, M.; Choong, P.; Qian, M.; Brandt, M.; Xie, Y.M. Topological design and additive manufacturing of porous metals for bone scaffolds and orthopaedic implants: A review. Biomaterials 2016, 83, 127–141. [Google Scholar] [CrossRef] [PubMed]
- DebRoy, T.; Wei, H.L.; Zuback, J.S.; Mukherjee, T.; Elmer, J.W.; Milewski, J.O.; Beese, A.M.; Wilson-Heid, A.; De, A.; Zhang, W. Additive manufacturing of metallic components - process, structure and properties. Prog. Mater. Sci. 2018, 92, 112–224. [Google Scholar] [CrossRef]
- You, S.G.; You, S.M.; Kang, S.Y.; Bae, S.Y.; Kim, J.H. Evaluation of the adaptation of complete denture metal bases fabricated with dental CAD-CAM systems: An in vitro study. J Prosthet Dent 2021, 125, 479–485. [Google Scholar] [CrossRef]
- Wang, P.; Li, X.; Luo, S.; Nai, M.L.S.; Ding, J.; Wei, J. Additively manufactured heterogeneously porous metallic bone with biostructural functions and bone-like mechanical properties. J. Mater. Sci. Technol. 2021, 62, 173–179. [Google Scholar] [CrossRef]
- Alammar, A.; Kois, J.C.; Revilla-Leon, M.; Att, W. Additive manufacturing technologies: Current status and future perspectives. J Prosthodont 2022, 31, 4–12. [Google Scholar] [CrossRef] [PubMed]
- Edwards, P.; O'Conner, A.; Ramulu, M. Electron beam additive manufacturing of titanium components: Properties and performance. J. Manuf. Sci. Eng. Trans. ASME 2013, 135, 1–7. [Google Scholar] [CrossRef]
- Kahlin, M.; Ansell, H.; Moverare, J.J. Fatigue behaviour of notched additive manufactured Ti6Al4V with as-built surfaces. Int. J. Fatigue 2017, 101, 51–60. [Google Scholar] [CrossRef]
- Soyama, H.; Sanders, D. Use of an abrasive water cavitating jet and peening process to improve the fatigue strength of titanium alloy 6Al-4V manufactured by the electron beam powder bed melting (EBPB) additive manufacturing method. JOM 2019, 71, 4311–4318. [Google Scholar] [CrossRef]
- Kahlin, M.; Ansell, H.; Kerwin, A.; Smith, B.; Moverare, J. Variable amplitude loading of additively manufactured Ti6Al4V subjected to surface post processes. Int. J. Fatigue 2021, 142, 12. [Google Scholar] [CrossRef]
- Soyama, H., Improvement of fatigue strength of 3D-metal by combined process of blasting and cavitation peening, Proceedings of the 3rd international conference on advanced surface enhancement (INCASE) 2023, 2024, pp. 23-29. [CrossRef]
- Soyama, H.; Wong, K.L.; Eakins, D.; Korsunsky, A.M. The effects of submerged laser peening, cavitation peening, and shot peening on the improvement of the torsional fatigue strength of powder bed fused Ti6Al4V produced through laser sintering. Int. J. Fatigue 2024, 185, 108348. [Google Scholar] [CrossRef]
- Kahlin, M.; Ansell, H.; Basu, D.; Kerwin, A.; Newton, L.; Smith, B.; Moverare, J.J. Improved fatigue strength of additively manufactured ti6al4v by surface post processing. Int. J. Fatigue 2020, 134, 105497. [Google Scholar] [CrossRef]
- Sanders, D.; Soyama, H.; De Silva, C. Use of cavitation abrasive surface finishing to improve the fatigue properties of additive manufactured titanium alloy Ti6Al4V. SAE Technical Papers 2021. [Google Scholar] [CrossRef]
- Khajehmirza, H.; Heydari Astaraee, A.; Monti, S.; Guagliano, M.; Bagherifard, S. A hybrid framework to estimate the surface state and fatigue performance of laser powder bed fusion materials after shot peening. Appl. Surf. Sci. 2021, 567, 150758. [Google Scholar] [CrossRef]
- Maleki, E.; Bagherifard, S.; Razavi, N.; Bandini, M.; du Plessis, A.; Berto, F.; Guagliano, M. On the efficiency of machine learning for fatigue assessment of post-processed additively manufactured AlSi10Mg. Int. J. Fatigue 2022, 160, 106841. [Google Scholar] [CrossRef]
- Maleki, E.; Bagherifard, S.; Guagliano, M. Correlation of residual stress, hardness and surface roughness with crack initiation and fatigue strength of surface treated additive manufactured AlSi10Mg: Experimental and machine learning approaches. Journal of Materials Research and Technology 2023, 24, 3265–3283. [Google Scholar] [CrossRef]
- Zhang, C.; Zhu, H.; Liao, H.; Cheng, Y.; Hu, Z.; Zeng, X. Effect of heat treatments on fatigue property of selective laser melting AlSi10Mg. Int. J. Fatigue 2018, 116, 513–522. [Google Scholar] [CrossRef]
- Romano, S.; Brückner-Foit, A.; Brandão, A.; Gumpinger, J.; Ghidini, T.; Beretta, S. Fatigue properties of AlSi10Mg obtained by additive manufacturing: Defect-based modelling and prediction of fatigue strength. Eng. Fract. Mech. 2018, 187, 165–189. [Google Scholar] [CrossRef]
- Qian, G.; Jian, Z.; Qian, Y.; Pan, X.; Ma, X.; Hong, Y. Very-high-cycle fatigue behavior of AlSi10Mg manufactured by selective laser melting: Effect of build orientation and mean stress. Int. J. Fatigue 2020, 138, 105696. [Google Scholar] [CrossRef]
- Beretta, S.; Gargourimotlagh, M.; Foletti, S.; du Plessis, A.; Riccio, M. Fatigue strength assessment of “as built” AlSi10Mg manufactured by SLM with different build orientations. Int. J. Fatigue 2020, 139, 105737. [Google Scholar] [CrossRef]
- Lehner, P.; Blinn, B.; Beck, T. Improving the defect tolerance and fatigue strength of am AlSi10Mg. Adv. Eng. Mater. 2023, 25. [Google Scholar] [CrossRef]
- Bagherifard, S.; Beretta, N.; Monti, S.; Riccio, M.; Bandini, M.; Guagliano, M. On the fatigue strength enhancement of additive manufactured AlSi10Mg parts by mechanical and thermal post-processing. Mater. Des. 2018, 145, 28–41. [Google Scholar] [CrossRef]
- Uzan, N.E.; Ramati, S.; Shneck, R.; Frage, N.; Yeheskel, O. On the effect of shot-peening on fatigue resistance of AlSi10Mg specimens fabricated by additive manufacturing using selective laser melting (AM-SLM). Addit. Manuf. 2018, 21, 458–464. [Google Scholar] [CrossRef]
- Maleki, E.; Bagherifard, S.; Sabouri, F.; Bandini, M.; Guagliano, M. Hybrid thermal, mechanical and chemical surface post-treatments for improved fatigue behavior of laser powder bed fusion AlSi10Mg notched samples. Surface and Coatings Technology 2022, 430, 127962. [Google Scholar] [CrossRef]
- Nakamura, M.; Takahashi, K.; Saito, Y. Effect of shot and laser peening on fatigue strength of additively manufactured aluminum alloy with rough surfaces. J. Mater. Eng. Perform. 2022, 32, 1589–1600. [Google Scholar] [CrossRef]
- Maleki, E.; Bagherifard, S.; Unal, O.; Sabouri, F.; Bandini, M.; Guagliano, M. Effects of different mechanical and chemical surface post-treatments on mechanical and surface properties of as-built laser powder bed fusion AlSi10Mg. Surface and Coatings Technology 2022, 439, 128391. [Google Scholar] [CrossRef]
- Maleki, E.; Bagherifard, S.; Unal, O.; Bandini, M.; Guagliano, M. On the effects of laser shock peening on fatigue behavior of V-notched AlSi10Mg manufactured by laser powder bed fusion. Int. J. Fatigue 2022, 163, 107035. [Google Scholar] [CrossRef]
- Maleki, E.; Bagherifard, S.; Unal, O.; Jam, A.; Shao, S.; Guagliano, M.; Shamsaei, N. Superior effects of hybrid laser shock peening and ultrasonic nanocrystalline surface modification on fatigue behavior of additive manufactured AlSi10Mg. Surface and Coatings Technology 2023, 463, 129512. [Google Scholar] [CrossRef]
- Biddlecom, J.; Li, Y.; Zhao, X.; Berfield, T.A.; Pataky, G.J. Femtosecond laser shock peening residual stress and fatigue life of additive manufactured AlSi10Mg. JOM 2023, 75, 1964–1974. [Google Scholar] [CrossRef]
- Maleki, E.; Bagherifard, S.; Heydari Astaraee, A.; Sgarbazzini, S.; Bandini, M.; Guagliano, M. Application of gradient severe shot peening as a novel mechanical surface treatment on fatigue behavior of additively manufactured AlSi10Mg. Materials Science and Engineering: A 2023, 881, 145397. [Google Scholar] [CrossRef]
- Maleki, E.; Bagherifard, S.; Unal, O.; Revuru, M.; Bandini, M.; Guagliano, M. The efficiency of tumble finishing as a final post-treatment for fatigue enhancement of notched laser powder bed fusion AlSi10Mg. Sci Rep 2023, 13, 4602. [Google Scholar] [CrossRef]
- Peyre, P.; Fabbro, R.; Merrien, P.; Lieurade, H.P. Laser shock processing of aluminium alloys. Application to high cycle fatigue behaviour. Mater. Sci. Eng. A. 1996, 210, 102–113. [Google Scholar] [CrossRef]
- Hatamleh, O.; Lyons, J.; Forman, R. Laser and shot peening effects on fatigue crack growth in friction stir welded 7075-T7351 aluminum alloy joints. Int. J. Fatigue 2007, 29, 421–434. [Google Scholar] [CrossRef]
- Luong, H.; Hill, M.R. The effects of laser peening and shot peening on high cycle fatigue in 7050-T7451 aluminum alloy. Mater. Sci. Eng. A 2010, 527, 699–707. [Google Scholar] [CrossRef]
- Trdan, U.; Skarba, M.; Grum, J. Laser shock peening effect on the dislocation transitions and grain refinement of Al–Mg–Si alloy. Mater. Charact. 2014, 97, 57–68. [Google Scholar] [CrossRef]
- Lu, J.; Lu, H.; Xu, X.; Yao, J.; Cai, J.; Luo, K. High-performance integrated additive manufacturing with laser shock peening –induced microstructural evolution and improvement in mechanical properties of ti6al4v alloy components. International Journal of Machine Tools and Manufacture 2020, 148, 103475. [Google Scholar] [CrossRef]
- Zhang, Y.; Guo, W.; Shi, J.; Chi, J.; Chen, G.; Han, G.; Zhang, H. Improved rotating bending fatigue performance of laser directed energy deposited Ti6Al4V alloys by laser shock peening. Journal of Alloys and Compounds 2024, 980, 173664. [Google Scholar] [CrossRef]
- Stránský, O.; Beránek, L.; Pathak, S.; Šmaus, J.; Kopeček, J.; Kaufman, J.; Böhm, M.; Brajer, J.; Mocek, T.; Holešovský, F. Effects of sacrificial coating material in laser shock peening of L-PBF printed AlSi10Mg. Virtual Phys. Prototyp. 2024, 19. [Google Scholar] [CrossRef]
- Gong, Z.; Zhang, T.; Chen, Y.; Lu, J.; Ding, X.; Zhang, S.; Lan, M.; Shen, Y.; Wang, S. Effect of laser shock peening on stress corrosion cracking of TC4/2A14 dissimilar metal friction stir welding joints. Journal of Materials Research and Technology 2024, 30, 1716–1725. [Google Scholar] [CrossRef]
- Liu, Q.; Chu, S.; Zhang, X.; Wang, Y.; Zhao, H.; Zhou, B.; Wang, H.; Wu, G.; Mao, B. Laser shock processing of titanium alloys: A critical review on the microstructure evolution and enhanced engineering performance. J. Mater. Sci. Technol. 2025, 209, 262–291. [Google Scholar] [CrossRef]
- Sano, Y.; Mukai, N.; Okazaki, K.; Obata, M. Residual stress improvement in metal surface by underwater laser irradiation. Nucl. Instrum. Methods Phys. Res. Sect. B-Beam Interact. Mater. Atoms 1997, 121, 432–436. [Google Scholar] [CrossRef]
- Sano, Y.; Obata, M.; Kubo, T.; Mukai, N.; Yoda, M.; Masaki, K.; Ochi, Y. Retardation of crack initiation and growth in austenitic stainless steels by laser peening without protective coating. Materials Science and Engineering A 2006, 417, 334–340. [Google Scholar] [CrossRef]
- Sano, T.; Eimura, T.; Hirose, A.; Kawahito, Y.; Katayama, S.; Arakawa, K.; Masaki, K.; Shiro, A.; Shobu, T.; Sano, Y. Improving fatigue performance of laser-welded 2024-T3 aluminum alloy using dry laser peening. Metals 2019, 9, 1192. [Google Scholar] [CrossRef]
- Sano, Y. Quarter century development of laser peening without coating. Metals 2020, 10, 152. [Google Scholar] [CrossRef]
- Sano, Y.; Kato, T.; Mizuta, Y.; Tamaki, S.; Yokofujita, K.; Taira, T.; Hosokai, T.; Sakino, Y. Development of a portable laser peening device and its effect on the fatigue properties of HT780 butt-welded joints. Forces in Mechanics 2022, 7, 100080. [Google Scholar] [CrossRef]
- Kato, T.; Sakino, Y.; Sano, Y. Effect of laser peening without coating (LPwC) on retardation of fatigue crack growth in SM490 plates. Forces in Mechanics 2023, 13, 100234. [Google Scholar] [CrossRef]
- Sano, Y.; Akita, K.; Sano, T. A mechanism for inducing compressive residual stresses on a surface by laser peening without coating. Metals 2020, 10, 816. [Google Scholar] [CrossRef]
- Sasoh, A.; Watanabe, K.; Sano, Y.; Mukai, N. Behavior of bubbles induced by the interaction of a laser pulse with a metal plate in water. Applied Physics A 2005, 80, 1497–1500. [Google Scholar] [CrossRef]
- Soyama, H. Comparison between the improvements made to the fatigue strength of stainless steel by cavitation peening, water jet peening, shot peening and laser peening. J. Mater. Process. Technol. 2019, 269, 65–78. [Google Scholar] [CrossRef]
- Soyama, H.; Korsunsky, A.M. A critical comparative review of cavitation peening and other surface peening methods. J. Mater. Process. Technol. 2022, 305, 117586. [Google Scholar] [CrossRef]
- Leuders, S.; Thone, M.; Riemer, A.; Niendorf, T.; Troster, T.; Richard, H.A.; Maier, H.J. On the mechanical behaviour of titanium alloy TiAl6V4 manufactured by selective laser melting: Fatigue resistance and crack growth performance. Int. J. Fatigue 2013, 48, 300–307. [Google Scholar] [CrossRef]
- Masuo, H.; Tanaka, Y.; Morokoshi, S.; Yagura, H.; Uchida, T.; Yamamoto, Y.; Murakami, Y., Effects of defects, surface roughness and hip on fatigue strength of Ti-6A1-4V manufactured by additive manufacturing, 3rd International Symposium on Fatigue Design and Material Defects (FDMD), Lecco, ITALY, 2017, 19-26. [CrossRef]
- Sun, Y.Y.; Lu, S.L.; Gulizia, S.; Oh, C.H.; Fraser, D.; Leary, M.; Qian, M. Fatigue performance of additively manufactured Ti-6Al-4V: Surface condition vs. Internal defects. JOM 2020, 72, 1022–1030. [Google Scholar] [CrossRef]
- Tarik Hasib, M.; Ostergaard, H.E.; Li, X.; Kruzic, J.J. Fatigue crack growth behavior of laser powder bed fusion additive manufactured Ti-6Al-4V: Roles of post heat treatment and build orientation. Int. J. Fatigue 2021, 142, 105955. [Google Scholar] [CrossRef]
- Mishurova, T.; Artzt, K.; Rehmer, B.; Haubrich, J.; Ávila, L.; Schoenstein, F.; Serrano-Munoz, I.; Requena, G.; Bruno, G. Separation of the impact of residual stress and microstructure on the fatigue performance of LPBF Ti-6Al-4V at elevated temperature. Int. J. Fatigue 2021, 148, 106239. [Google Scholar] [CrossRef]
- du Plessis, A.; Razavi, N.; Wan, D.; Berto, F.; Imdaadulah, A.; Beamer, C.; Shipley, J.; MacDonald, E. Fatigue performance of shelled additively manufactured parts subjected to hot isostatic pressing. Addit. Manuf. 2022, 51, 102607. [Google Scholar] [CrossRef]
- Guennec, B.; Hattal, A.; Hocini, A.; Mukhtarova, K.; Kinoshita, T.; Horikawa, N.; Gubicza, J.; Djemaï, M.; Dirras, G. Fatigue performance of zirconia-reinforced Ti-6Al-4V nanocomposite processed by laser powder bed fusion: An improvement by hot isostatic pressing. Int. J. Fatigue 2022, 164, 107129. [Google Scholar] [CrossRef]
- Bhandari, L.; Gaur, V. Different post-processing methods to improve fatigue properties of additively built Ti-6Al-4V alloy. Int. J. Fatigue 2023, 176, 107850. [Google Scholar] [CrossRef]
- Chern, A.H.; Nandwana, P.; Yuan, T.; Kirka, M.M.; Dehoff, R.R.; Liaw, P.K.; Duty, C.E. A review on the fatigue behavior of Ti-6Al-4V fabricated by electron beam melting additive manufacturing. Int. J. Fatigue 2019, 119, 173–184. [Google Scholar] [CrossRef]
- Soyama, H.; Kuji, C.; Liao, Y. Comparison of the effects of submerged laser peening, cavitation peening and shot peening on the improvement of the fatigue strength of magnesium alloy az. Journal of Magnesium and Alloys 2023, 11, 1592–1607. [Google Scholar] [CrossRef]
- Soyama, H.; Kuji, C. Improving effects of cavitation peening, using a pulsed laser or a cavitating jet, and shot peening on the fatigue properties of additively manufactured titanium alloy ti6al4v. Surface and Coatings Technology 2022, 451, 129047. [Google Scholar] [CrossRef]
- Soyama, H.; Tanaka, M.; Takiguchi, T.; Yamamoto, M. Development of a cavitation generator mimicking pistol shrimp. Biomimetics 2024, 9, 47. [Google Scholar] [CrossRef] [PubMed]
- Soyama, H.; Liang, X.; Yashiro, W.; Kajiwara, K.; Asimakopoulou, E.M.; Bellucci, V.; Birnsteinova, S.; Giovanetti, G.; Kim, C.; Kirkwood, H.J.; Koliyadu, J.C.P.; Letrun, R.; Zhang, Y.; Ulicny, J.; Bean, R.; Mancuso, A.P.; Villanueva-Perez, P.; Sato, T.; Vagovic, P.; Eakins, D.; Korsunsky, A.M. Revealing the origins of vortex cavitation in a venturi tube by high speed x-ray imaging. Ultrason Sonochem 2023, 101, 106715. [Google Scholar] [CrossRef] [PubMed]
- Blanken, J.; De Moor, R.J.G.; Meire, M.; Verdaasdonk, R. Laser induced explosive vapor and cavitation resulting in effective irrigation of the root canal. Part 1: A visualization study. Lasers Surg. Med. 2009, 41, 514–519. [Google Scholar] [CrossRef] [PubMed]
- Matsumoto, H.; Yoshimine, Y.; Akamine, A. Visualization of irrigant flow and cavitation induced by Er:YAG laser within a root canal model. J. Endod. 2011, 37, 839–843. [Google Scholar] [CrossRef] [PubMed]
- Lukac, N.; Jezersek, M. Amplification of pressure waves in laser-assisted endodontics with synchronized delivery of Er:YAG laser pulses. Lasers Med. Sci. 2018, 33, 823–833. [Google Scholar] [CrossRef] [PubMed]
- Sugimoto, Y.; Obata, S. Behavior of a sphere caused by pulsed laser induced bubble simulating stone crushing with tul. Proceedings of 11th International Symposium on Cavitation 2021, 614–617. [Google Scholar]
- Soyama, H. Development of laser cavitation peening using a normal-oscillation Nd:YAG laser. Coatings 2023, 13, 1395. [Google Scholar] [CrossRef]
- SAE J442 Test strip, holder, and gage for shot peening. SAE International Standards 2013, 1–5.
- SAE J443 Procedures for using standard shot peening almen strip. SAE International Standards 2010, 1–6.
- Soyama, H.; Iga, Y. Laser cavitation peening: A review. Applied Sciences 2023, 13, 6702. [Google Scholar] [CrossRef]
- Ward, B.; Emmony, D.C. The energies and pressures of acoustic transients associated with optical cavitation in water. J. Mod. Opt. 1990, 37, 803–811. [Google Scholar] [CrossRef]
- Ohl, C.D.; Lindau, O.; Lauterborn, W. Luminescence from spherically and aspherically collapsing laser induced bubbles. Phys. Rev. Lett. 1998, 80, 393–396. [Google Scholar] [CrossRef]
- Lauterborn, W.; Ohl, C.D. Cavitation bubble dynamics. Ultrason. Sonochem. 1997, 4, 65–75. [Google Scholar] [CrossRef] [PubMed]
- Ohl, C.D.; Kurz, T.; Geisler, R.; Lindau, O.; Lauterborn, W. Bubble dynamics, shock waves and sonoluminescence. Philos. Trans. R. Soc. A-Math. Phys. Eng. Sci. 1999, 357, 269–294. [Google Scholar] [CrossRef]
- Rayleigh, L. On the pressure developed in a liquid during the collapse of a spherical cavity. The London, Edinburgh, and Dublin Philosophical Magazine and Journal of Science 1917, 34, 94–98. [Google Scholar] [CrossRef]
- Little, R.E. Estimating the median fatigue limit for very small up-and-down quantal response tests and for S-N data with runouts. ASTM STP 1972, 511, 29–42. [Google Scholar]
- He, B.B. Two-dimensional X-ray diffraction. John Wiley & Sons, Inc., New Jersey 2009, 249-328.
- ISO 21920-2, I. Geometrical product specifications (gps) — surface texture: Profile, part 2: Terms, definitions and surface texture parameters. ISO 2021. [Google Scholar]
- Linder, J.; Axelsson, M.; Nilsson, H. The influence of porosity on the fatigue life for sand and permanent mould cast aluminium. Int. J. Fatigue 2006, 28, 1752–1758. [Google Scholar] [CrossRef]
- Taylor, J.R., An introduction to error analysis, the study of uncertainties in physical measurements, University Science Books, 1982.


| Specimen | As-built | Post-processing | Improvement ratio | |||
|---|---|---|---|---|---|---|
| Fatigue strength at 107 [present] (Plane bending, R = 1) |
54 MPa | LCP | 85 MPa | 57 % | ||
| B+LT+LCP | 103 MPa | 91 % | ||||
| Fatigue strength at 3×10⁶ [16] (Rotating bending, R = 1 with notch) |
10 MPa | SP1 | 72 MPa | (720 %) | ||
| SP2 | 92 MPa | (920 %) | ||||
| Fatigue strength at 106 [26] (Plane bending, R = 0) |
56 MPa | LP | 90 MPa | 61 % | ||
| SP | 89 MPa | 59 % | ||||
| Fatigue strength at 107 [26] (Plane bending, R = 0) |
51 MPa | LP | 90 MPa | 76 % | ||
| SP | 81 MPa | 59 % | ||||
| Fatigue strength at 107 [24] (Rotating bending, R = 1) |
75 MPa | Polished | 100 MPa | 33 % | ||
| Polished + SP | 110 MPa | 47 % | ||||
| Post-processing | Number of cycles to failure Nf exp [cycles] |
Arithmetical mean roughness Ra [m] | Residual stress σR [MPa] |
Rockwell hardness HR15T AB | |||
|---|---|---|---|---|---|---|---|
| Average value | Standard deviation | Average value | Standard deviation | Average value | Standard deviation | ||
| As-built | 77,417 | 12.88 | 1.14 | 68 | 19 | 76.6 | 4.0 |
| LT | 43,862 | 8.37 | 0.85 | 412 | 31 | 76.9 | 3.0 |
| B | 211,922 | 10.74 | 0.24 | 165 | 26 | 77.2 | 1.1 |
| LCP | 211,419 | 10.68 | 0.77 | 135 | 20 | 74.2 | 5.2 |
| B + LT | 43,134 | 6.86 | 0.52 | 567 | 23 | 78.4 | 2.5 |
| B + LCP | 234,637 | 10.03 | 0.88 | 256 | 20 | 74.8 | 1.5 |
| LT + LCP | 404,759 | 9.40 | 0.27 | 480 | 24 | 80.3 | 1.5 |
| B + LT + LCP | 1,865,502 | 8.44 | 0.35 | 489 | 20 | 79.0 | 2.4 |
| Symbol | Eq. (6) | Eq. (7) | |
|---|---|---|---|
| Constant for surface roughness | cS | 0.192 | 0.181 |
| Constant for residual stress | cR | 0.162 | 0.160 |
| Constant for hardness | cH | – | 0.023 |
| Slope | abest | 1.082 | 1.075 |
| Standard deviation of slope | σs | 0.028 | 0.035 |
| Correlation coefficient | r | 0.933 | 0.936 |
| Determination coefficient | Dc | 0.870 | 0.831 |
| Probability of a non-correlation | pnon | 0.22% | 0.20% |
Disclaimer/Publisher’s Note: The statements, opinions and data contained in all publications are solely those of the individual author(s) and contributor(s) and not of MDPI and/or the editor(s). MDPI and/or the editor(s) disclaim responsibility for any injury to people or property resulting from any ideas, methods, instructions or products referred to in the content. |
© 2024 by the authors. Licensee MDPI, Basel, Switzerland. This article is an open access article distributed under the terms and conditions of the Creative Commons Attribution (CC BY) license (http://creativecommons.org/licenses/by/4.0/).


