Submitted:
30 July 2024
Posted:
31 July 2024
You are already at the latest version
Abstract
Keywords:
1. Introduction
2. Results
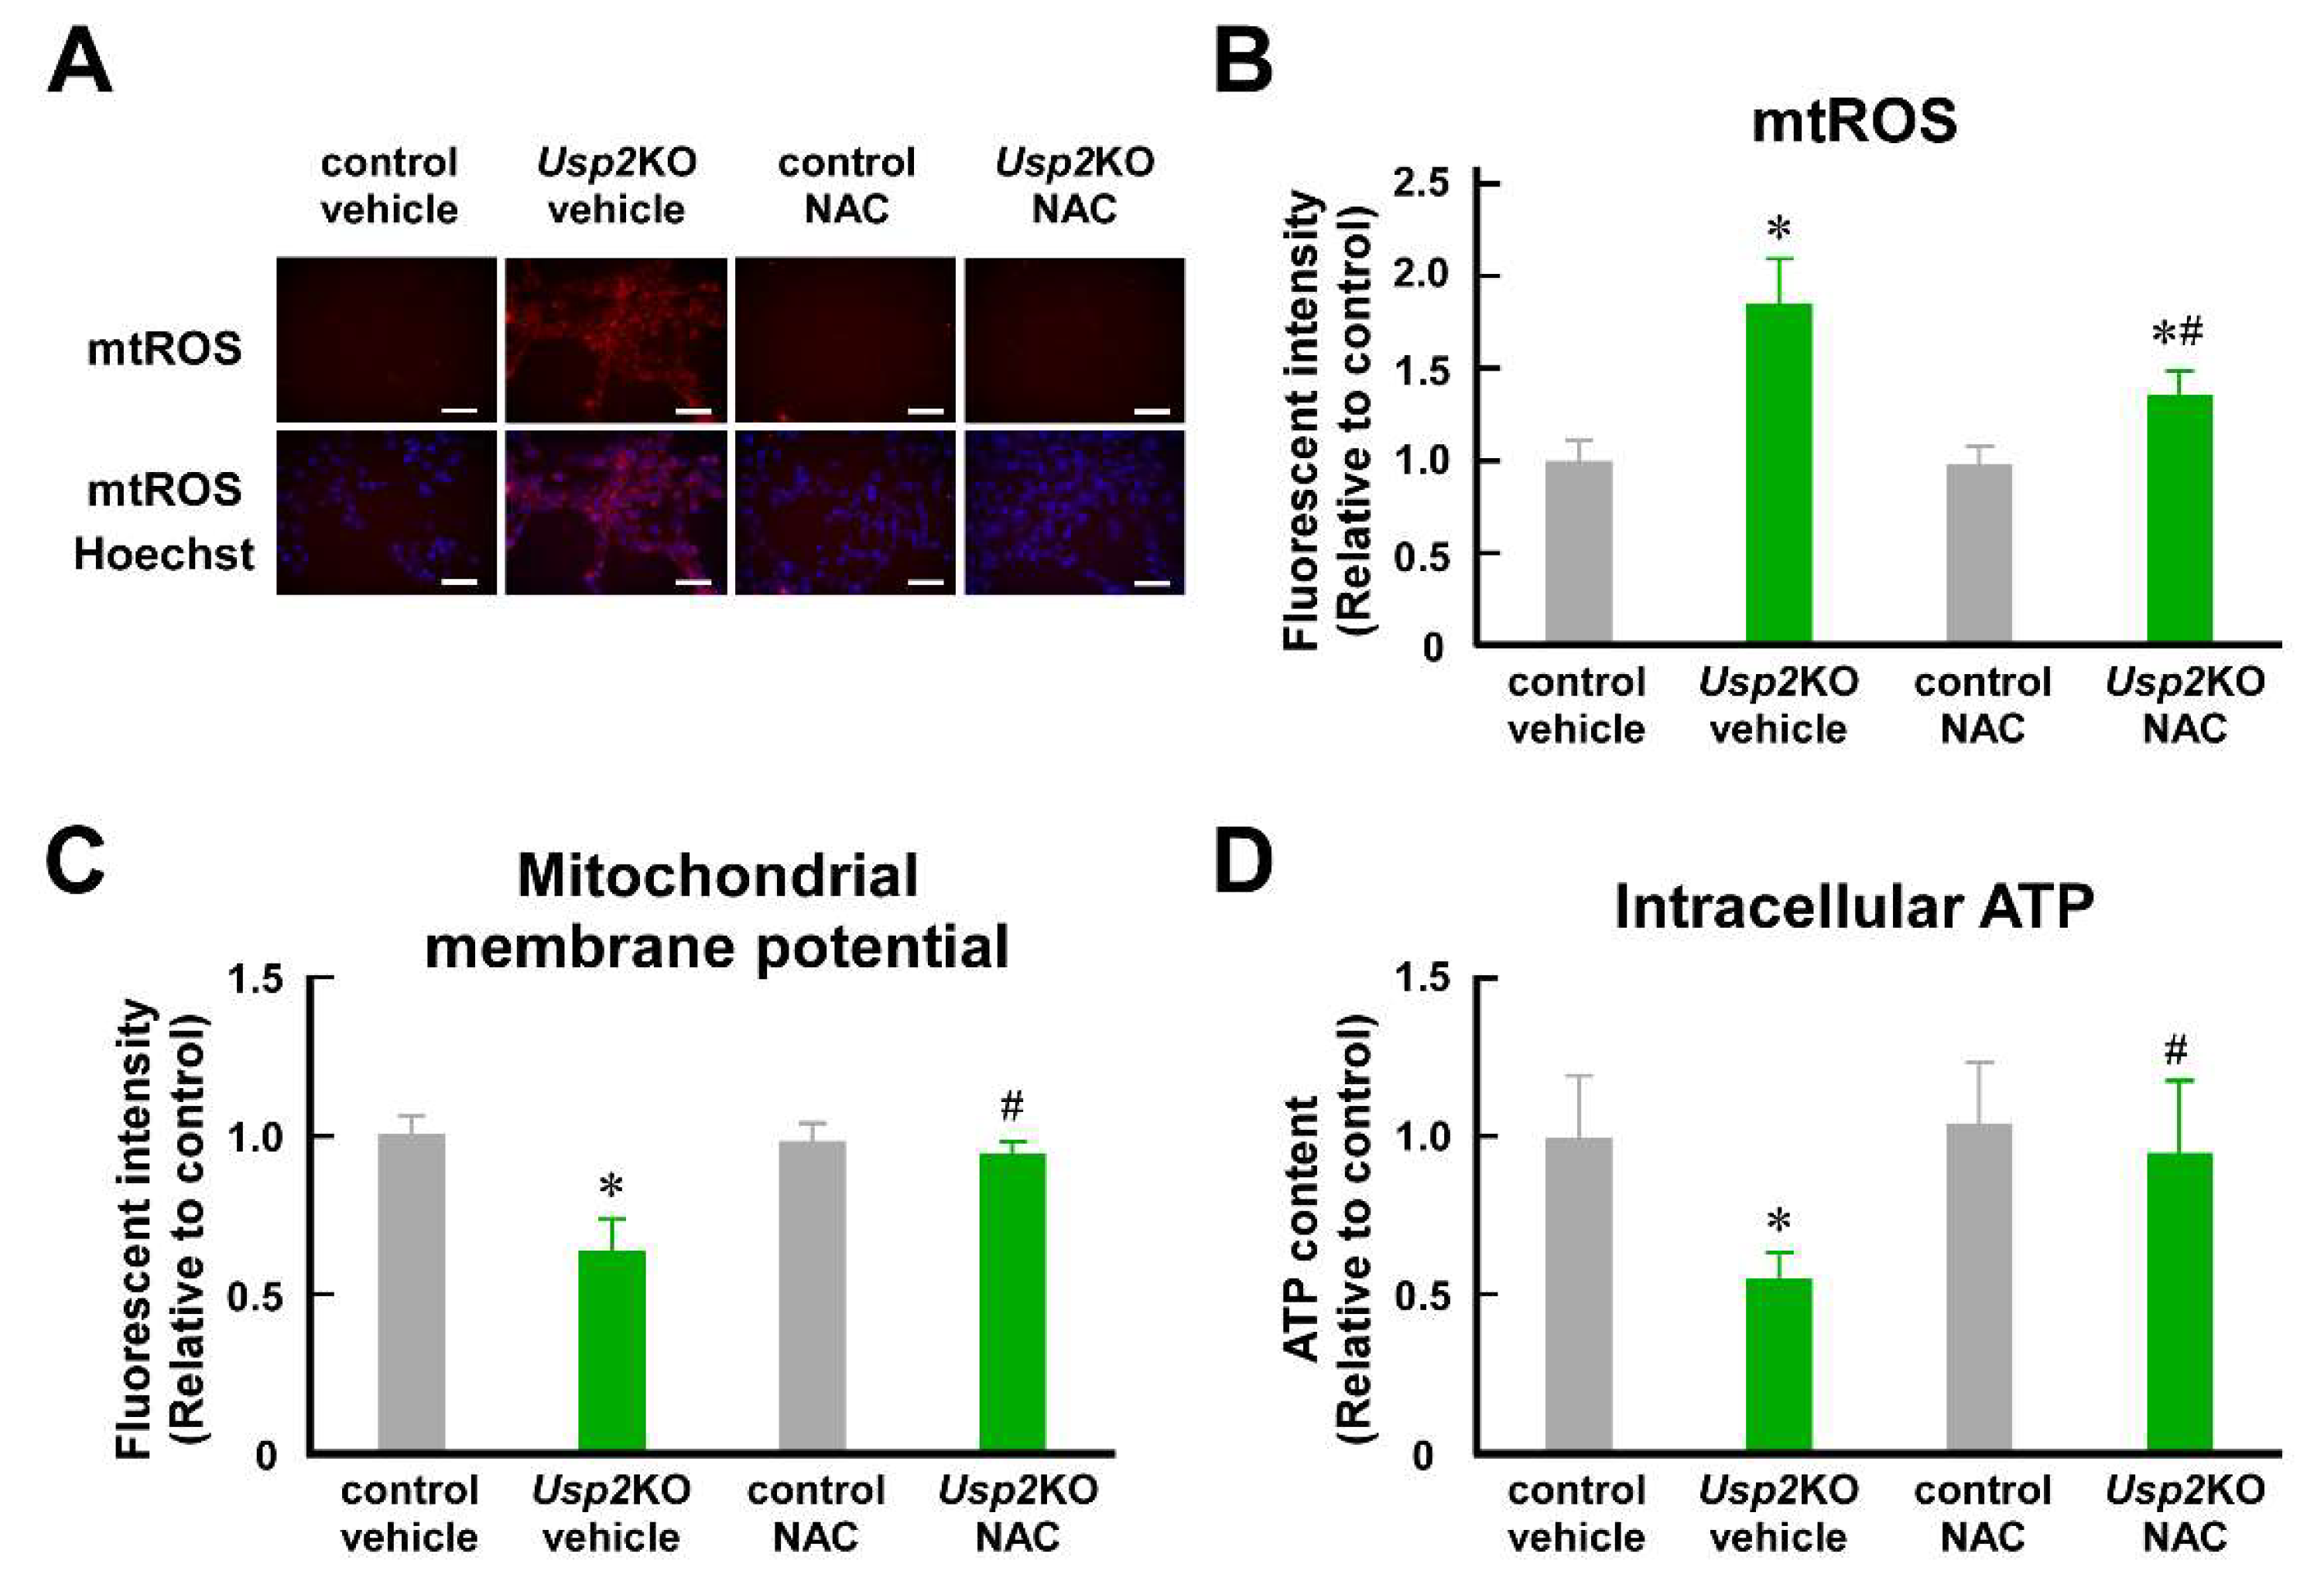
2.1. Mitochondrial ROS Is Involed in Mitochondrial Dysfunction in Usp2KO C2C12 Cells
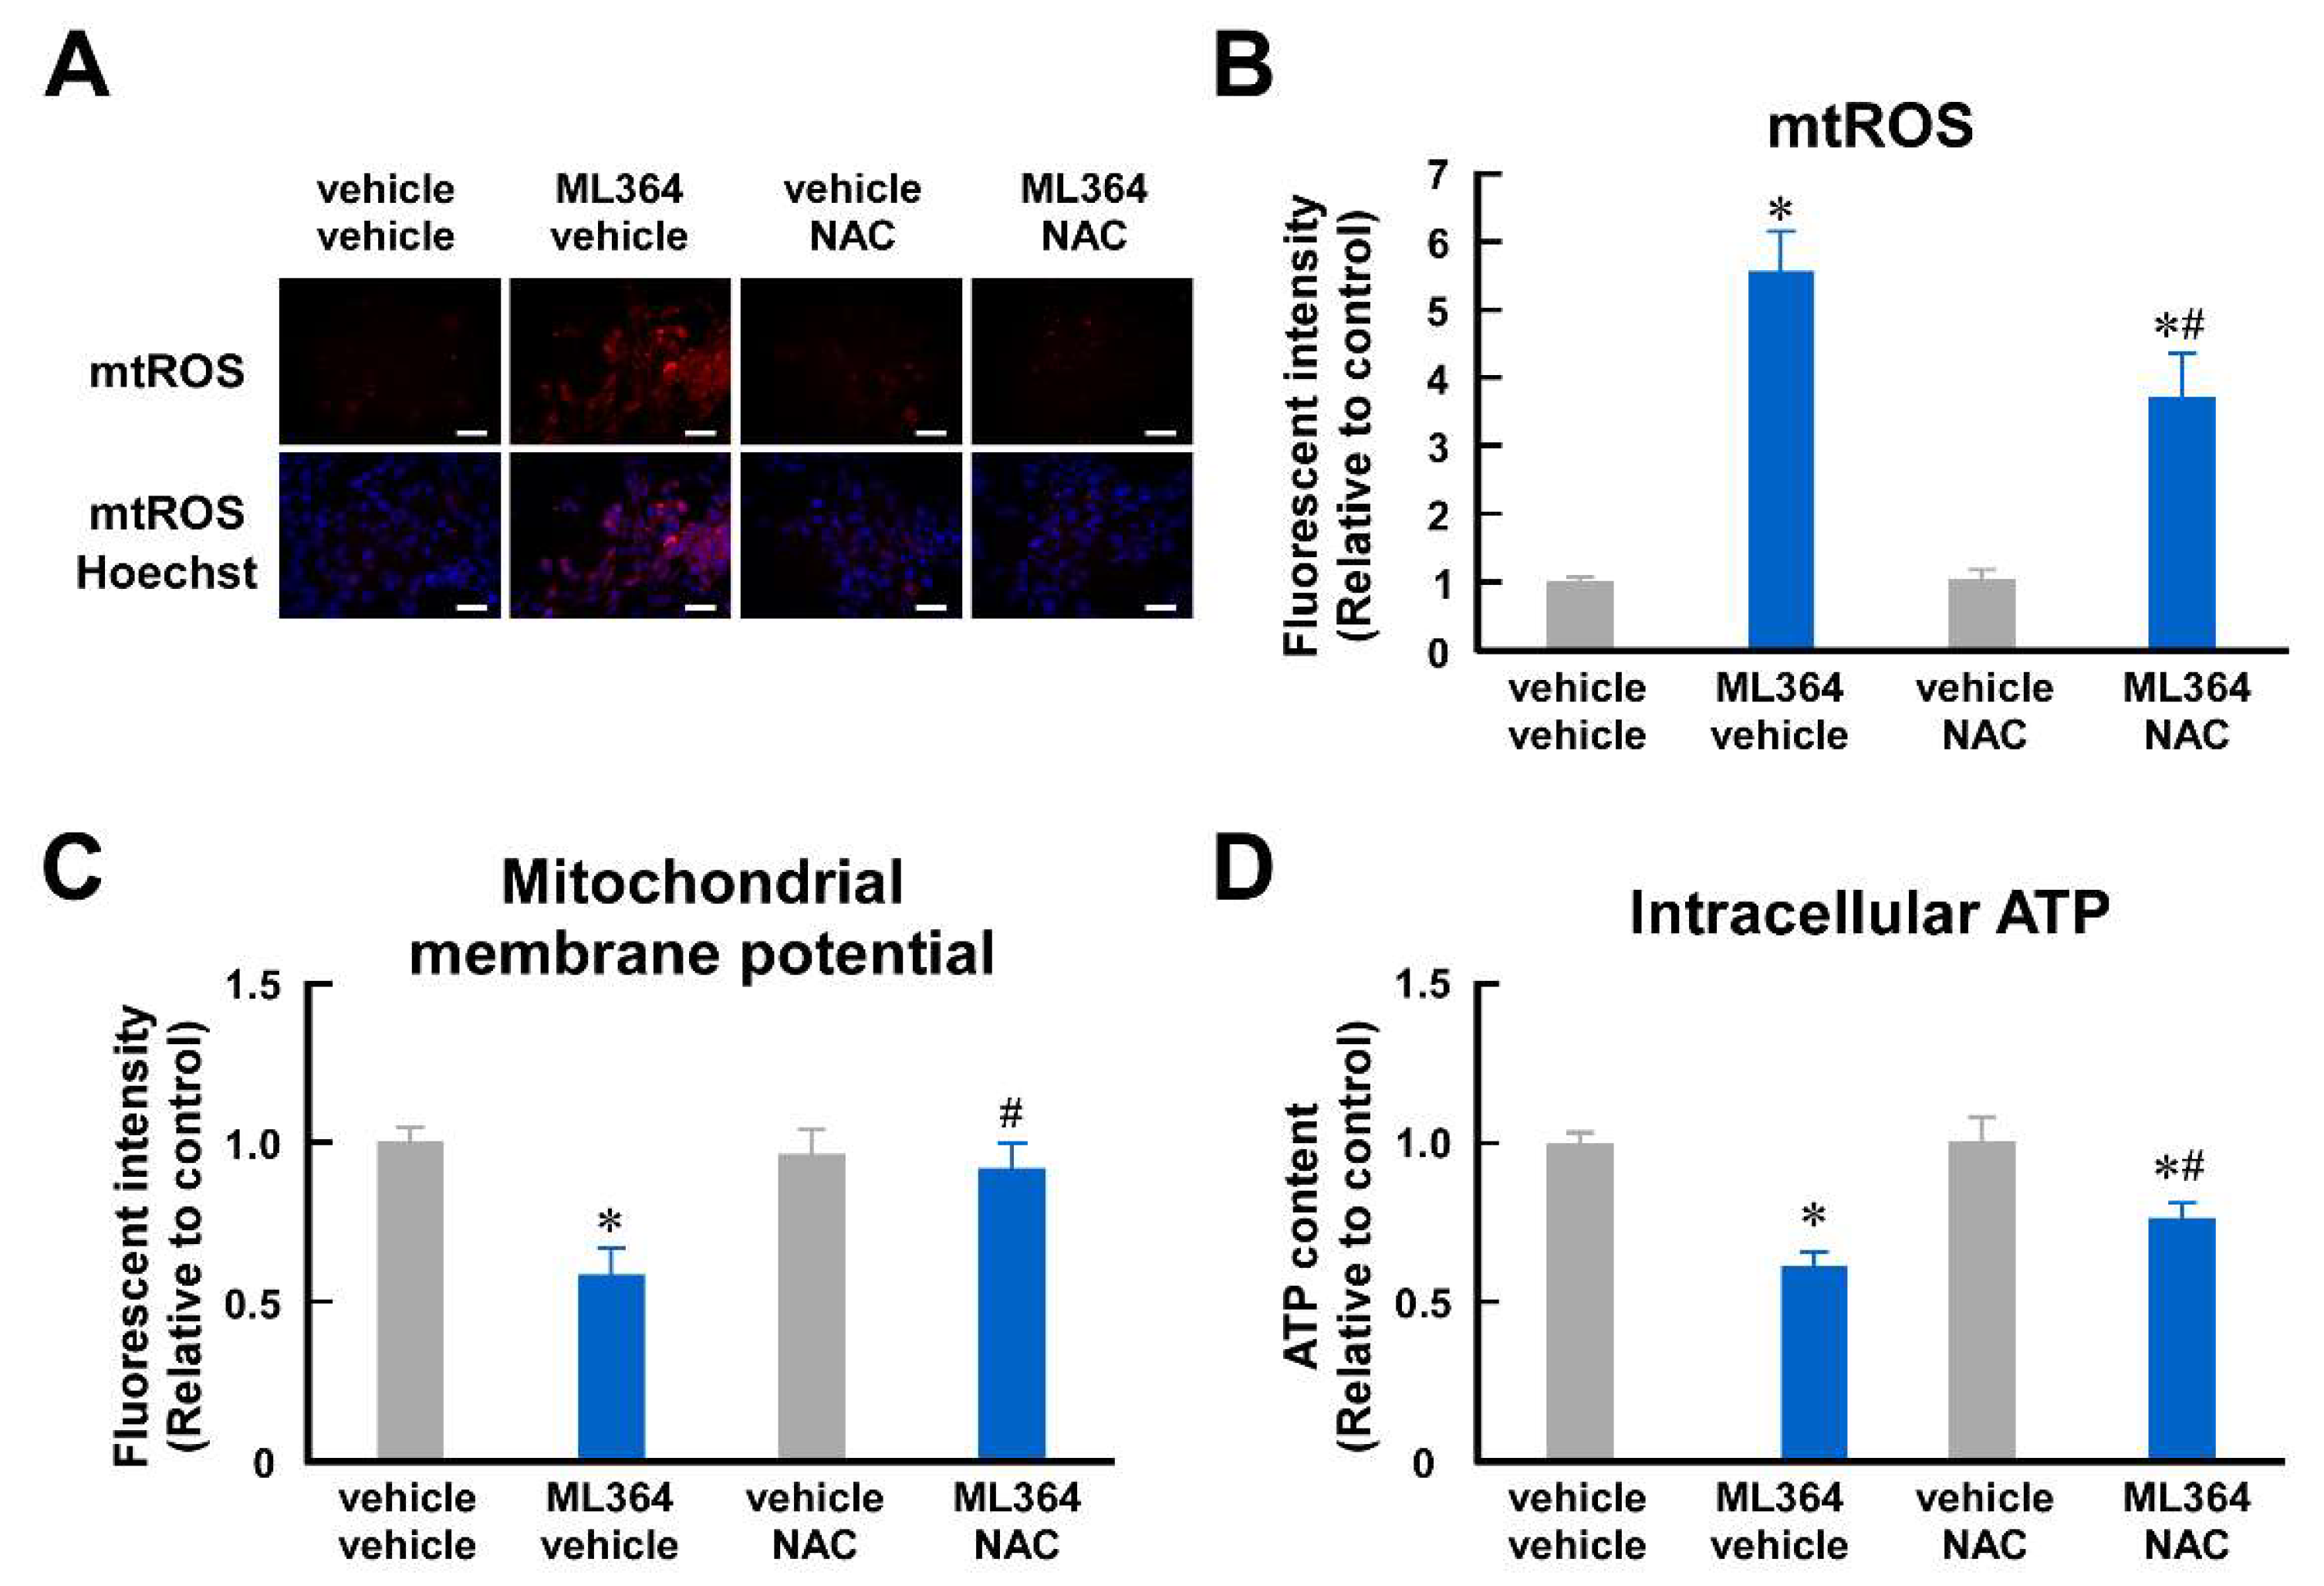
2.2. Mitochondrial ROS Is Involved in Mitochondrial Dysfunction in ML364-Treated C2C12 Cells
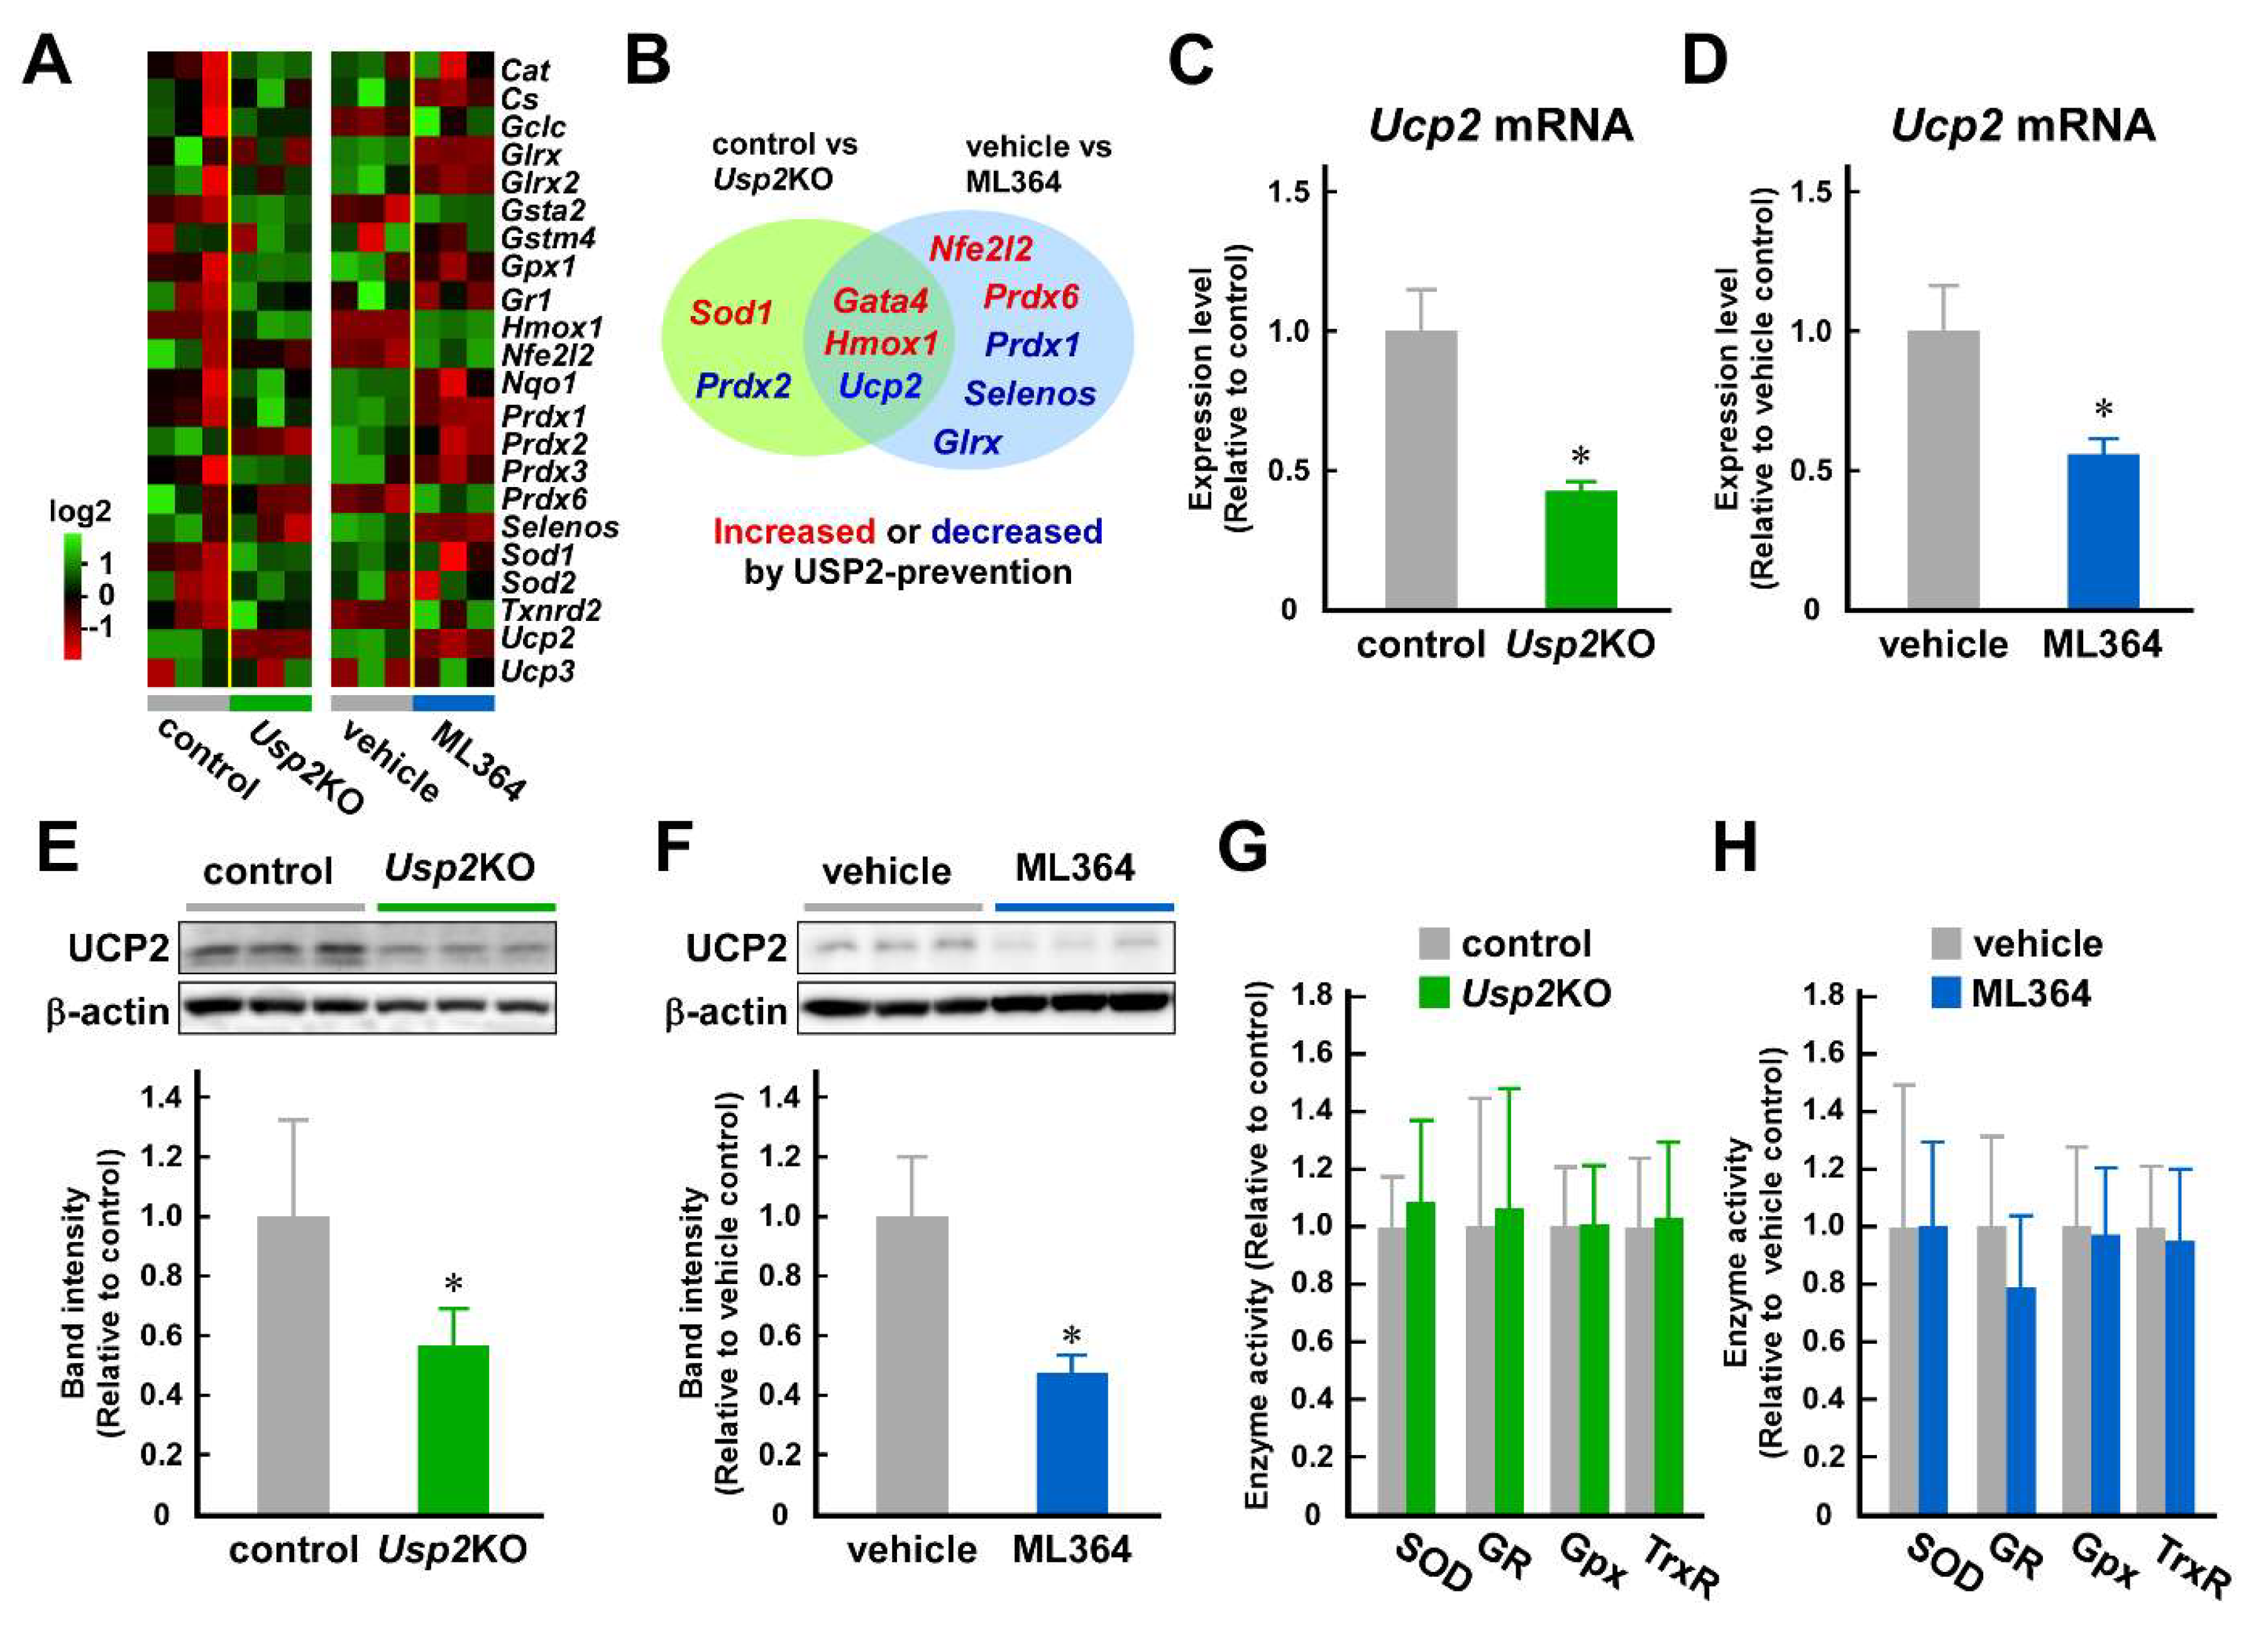
2.3. USP2 Maintains UCP2 Expression at mRNA and Protein Levels in C2C12 Cells
2.4. Decrement of UCP2 Seems to Participate in USP2 Deficiency–Elicited Mitochondrial Dysfunction
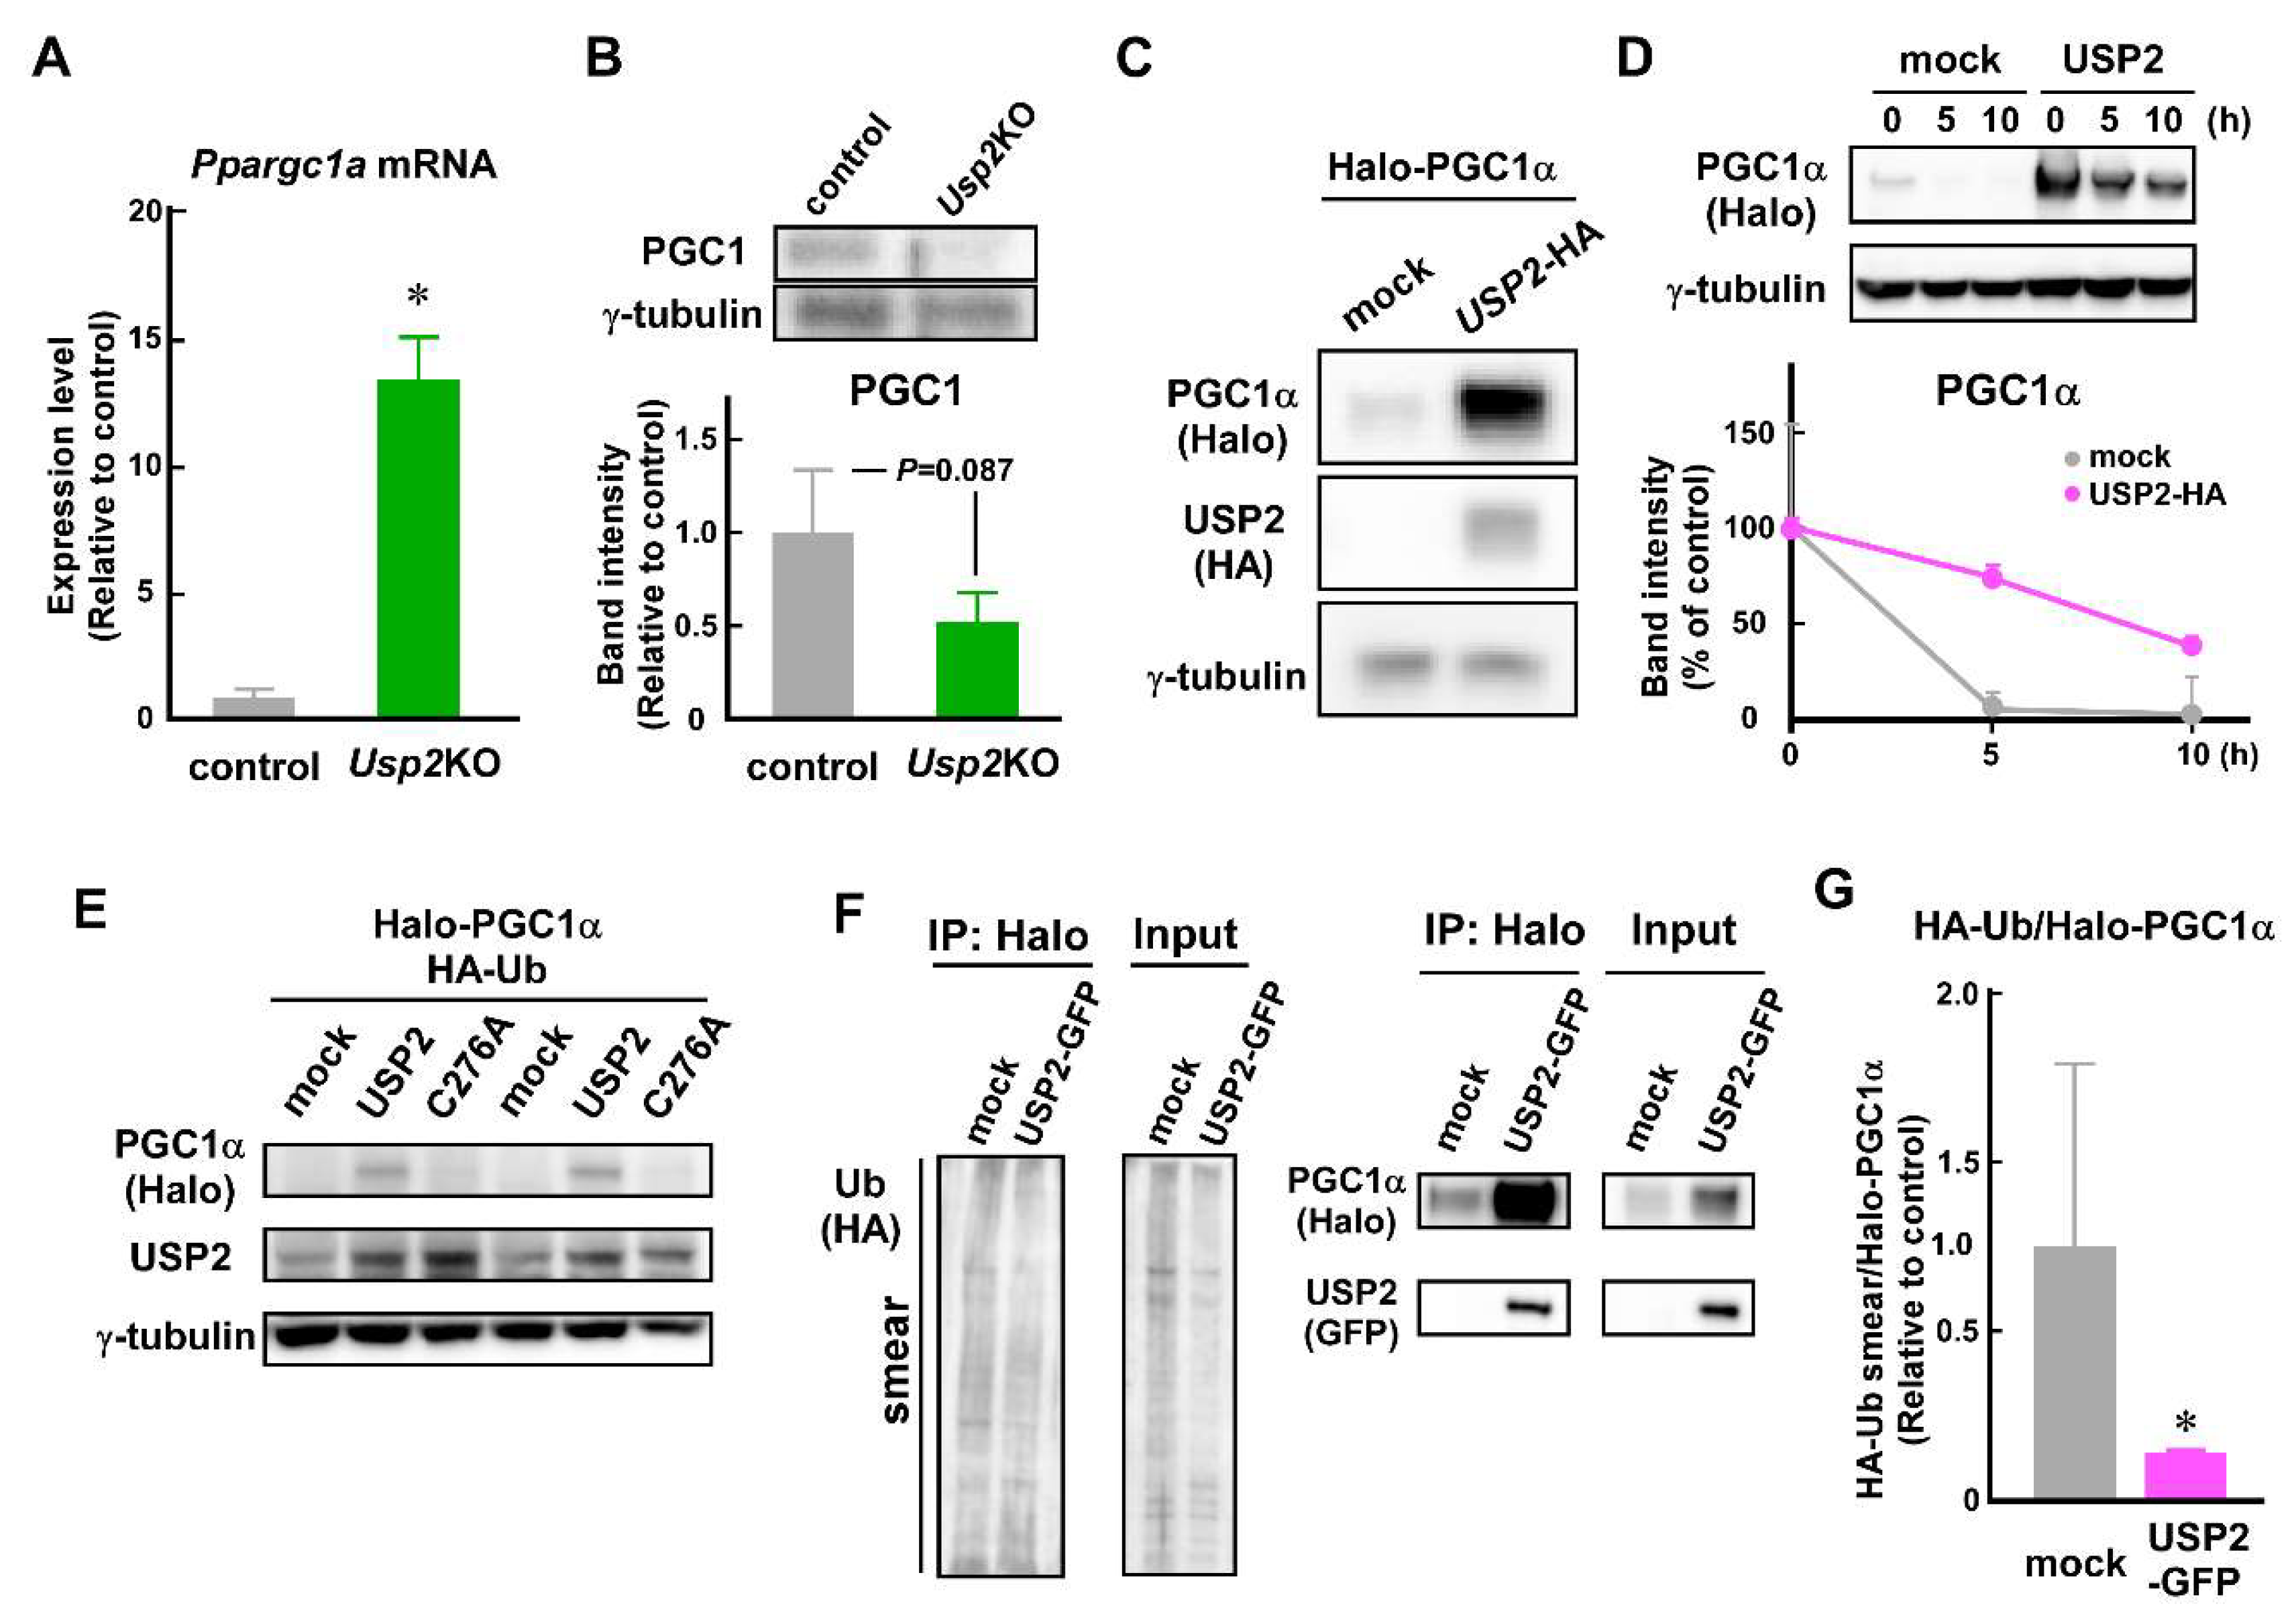
2.5. USP2 Stabilizes PGC1α in an Isopeptidase-Dependent Manner
3. Discussion
4. Materials and Methods
4.1. Cells
4.2. Plasmid Constructs and Transfection
4.3. Lentivirus Constructs and Infection
4.3. Mitochondrial ROS Accumulation
4.4. Mitochondrial Membrane Potential
4.5. Intracellular ATP Content
4.6. Cellular Toxicity
4.7. RT-qPCR Analysis
4.8. Antioxidative Enzyme Activities
4.9. Western Blot Analysis
4.10. Immune Precipitation
4.11. Statistical Analysis
5. Conclusions
Supplementary Materials
Author Contributions
Funding
Institutional Review Board Statement
Informed Consent Statement
Data Availability Statement
Acknowledgments
Conflicts of Interest
References
- Cruz-Jentoft, A.J.; Sayer, A.A. Sarcopenia. Lancet 2019, 393, 2636–2646. [Google Scholar] [CrossRef]
- García-Prat, L.; Martínez-Vicente, M.; Perdiguero, E.; Ortet, L.; Rodríguez-Ubreva, J.; Rebollo, E.; Ruiz-Bonilla, V.; Gutarra, S.; Ballestar, E.; Serrano, A.L.; et al. Autophagy Maintains Stemness by Preventing Senescence. Nature 2016, 529, 37–42. [Google Scholar] [CrossRef] [PubMed]
- Haramizu, S.; Asano, S.; Butler, D.C.; Stanton, D.A.; Hajira, A.; Mohamed, J.S.; Alway, S.E. Dietary Resveratrol Confers Apoptotic Resistance to Oxidative Stress in Myoblasts. J. Nutr. Biochem. 2017, 50, 103–115. [Google Scholar] [CrossRef]
- Wang, S.; Zhao, X.; Liu, Q.; Wang, Y.; Li, S.; Xu, S. Selenoprotein K Protects Skeletal Muscle from Damage and Is Required for Satellite Cells-Mediated Myogenic Differentiation. Redox Biol. 2022, 50, 102255. [Google Scholar] [CrossRef]
- Le Moal, E.; Pialoux, V.; Juban, G.; Groussard, C.; Zouhal, H.; Chazaud, B.; Mounier, R. Redox Control of Skeletal Muscle Regeneration. Antioxidants Redox Signal. 2017, 27, 276–310. [Google Scholar] [CrossRef] [PubMed]
- Di Filippo, E.S.; Mancinelli, R.; Pietrangelo, T.; La Rovere, R.M.L.; Quattrocelli, M.; Sampaolesi, M.; Fulle, S. Myomir Dysregulation and Reactive Oxygen Species in Aged Human Satellite Cells. Biochem. Biophys. Res. Commun. 2016, 473, 462–470. [Google Scholar] [CrossRef]
- Brand, M.D.; Affourtit, C.; Esteves, T.C.; Green, K.; Lambert, A.J.; Miwa, S.; Pakay, J.L.; Parker, N. Mitochondrial Superoxide: Production, Biological Effects, and Activation of Uncoupling Proteins. Free Radic. Biol. Med. 2004, 37, 755–767. [Google Scholar] [CrossRef] [PubMed]
- Willems, P.H.G.M.; Rossignol, R.; Dieteren, C.E.J.; Murphy, M.P.; Koopman, W.J.H. Redox Homeostasis and Mitochondrial Dynamics. Cell Metab. 2015, 22, 207–218. [Google Scholar] [CrossRef]
- Yu, T.; Robotham, J.L.; Yoon, Y. Increased Production of Reactive Oxygen Species in Hyperglycemic Conditions Requires Dynamic Change of Mitochondrial Morphology. Proc. Natl. Acad. Sci. U. S. A. 2006, 103, 2653–2658. [Google Scholar] [CrossRef]
- Tahrir, F.G.; Langford, D.; Amini, S.; Mohseni Ahooyi, T.; Khalili, K. Mitochondrial Quality Control in Cardiac Cells: Mechanisms and Role in Cardiac Cell Injury and Disease. J. Cell. Physiol. 2019, 234, 8122–8133. [Google Scholar] [CrossRef]
- Wang, Y.; Branicky, R.; Noë, A.; Hekimi, S. Superoxide Dismutases: Dual Roles in Controlling ROS Damage and Regulating ROS Signaling. J. Cell Biol. 2018, 217, 1915–1928. [Google Scholar] [CrossRef]
- Molavian, H.; Madani Tonekaboni, A.; Kohandel, M.; Sivaloganathan, S. The Synergetic Coupling among the Cellular Antioxidants Glutathione Peroxidase/Peroxiredoxin and Other Antioxidants and Its Effect on the Concentration of H2O2. Sci. Rep. 2015, 5, 1–8. [Google Scholar] [CrossRef]
- Mailloux, R.J.; Harper, M.E. Uncoupling Proteins and the Control of Mitochondrial Reactive Oxygen Species Production. Free Radic. Biol. Med. 2011, 51, 1106–1115. [Google Scholar] [CrossRef] [PubMed]
- Cadenas, S. Mitochondrial Uncoupling, ROS Generation and Cardioprotection. Biochim. Biophys. Acta - Bioenerg. 2018, 1859, 940–950. [Google Scholar] [CrossRef] [PubMed]
- Arsenijevic, D.; Onuma, H.; Pecqueur, C.; Raimbault, S.; Manning, B.S.; Miroux, B.; Couplan, E.; Alves-Guerra, M.C.; Goubern, M.; Surwit, R.; et al. Disruption of the Uncoupling Protein-2 Gene in Mice Reveals a Role in Immunity and Reactive Oxygen Species Production. Nat. Genet. 2000, 26, 435–439. [Google Scholar] [CrossRef]
- Li, L.X.; Jørgensen, I.H.; Grill, I.H.; Skorpen, F.; Egeberg, K. Uncoupling Protein-2 Participates in Cellular Defense against Oxidative Stress in Clonal β-Cells. Biochem. Biophys. Res. Commun. 2001, 282, 273–277. [Google Scholar] [CrossRef]
- Erlanson-Albertsson, C. The Role of Uncoupling Proteins in the Regulation of Metabolism. Acta Physiol. Scand. 2003, 178, 405–412. [Google Scholar] [CrossRef]
- Donadelli, M.; Dando, I.; Fiorini, C.; Palmieri, M. UCP2, a Mitochondrial Protein Regulated at Multiple Levels. Cell. Mol. Life Sci. 2014, 71, 1171–1190. [Google Scholar] [CrossRef]
- Zhao, M.; Wang, Y.; Li, L.; Liu, S.; Wang, C.; Yuan, Y.; Yang, G.; Chen, Y.; Cheng, J.; Lu, Y.; et al. Mitochondrial ROS Promote Mitochondrial Dysfunction and Inflammation in Ischemic Acute Kidney Injury by Disrupting TFAM-Mediated MtDNA Maintenance. Theranostics 2021, 11, 1845–1863. [Google Scholar] [CrossRef]
- Zhu, Z.; Kawai, T.; Umehara, T.; Hoque, S.A.M.; Zeng, W.; Shimada, M. Negative Effects of ROS Generated during Linear Sperm Motility on Gene Expression and ATP Generation in Boar Sperm Mitochondria. Free Radic. Biol. Med. 2019, 141, 159–171. [Google Scholar] [CrossRef]
- Quan, Y.; Xin, Y.; Tian, G.; Zhou, J.; Liu, X. Mitochondrial ROS-Modulated MtDNA: A Potential Target for Cardiac Aging. Oxid. Med. Cell. Longev. 2020, 2020. [Google Scholar] [CrossRef] [PubMed]
- Chakrabarty, R.P.; Chandel, N.S. Mitochondria as Signaling Organelles Control Mammalian Stem Cell Fate. Cell Stem Cell 2021, 28, 394–408. [Google Scholar] [CrossRef] [PubMed]
- Minet, A.D.; Gaster, M. Cultured Senescent Myoblasts Derived from Human Vastus Lateralis Exhibit Normal Mitochondrial ATP Synthesis Capacities with Correlating Concomitant ROS Production While Whole Cell ATP Production Is Decreased. Biogerontology 2012, 13, 277–285. [Google Scholar] [CrossRef] [PubMed]
- Wolberger, C. Mechanisms for Regulating Deubiquitinating Enzymes. Protein Sci. 2014, 23, 344–353. [Google Scholar] [CrossRef] [PubMed]
- Pickart, C.M.; Eddins, M.J. Ubiquitin: Structures, Functions, Mechanisms. Biochim. Biophys. Acta - Mol. Cell Res. 2004, 1695, 55–72. [Google Scholar] [CrossRef] [PubMed]
- Kitamura, H. Ubiquitin-Specific Proteases (USPs) and Metabolic Disorders. Int. J. Mol. Sci. 2023, 24. [Google Scholar] [CrossRef]
- Kitamura, H.; Hashimoto, M. USP2-Related Cellular Signaling and Consequent Pathophysiological Outcomes. Int. J. Mol. Sci. 2021, 22. [Google Scholar] [CrossRef] [PubMed]
- Molusky, M.M.; Li, S.; Ma, D.; Yu, L.; Lin, J.D. Ubiquitin-Specific Protease 2 Regulates Hepatic Gluconeogenesis and Diurnal Glucose Metabolism through 11&beta-Hydroxysteroid Dehydrogenase 1. Diabetes 2012, 61, 1025–1035. [Google Scholar] [CrossRef]
- Kitamura, H.; Kimura, S.; Shimamoto, Y.; Okabe, J.; Ito, M.; Miyamoto, T.; Naoe, Y.; Kikuguchi, C.; Meek, B.; Toda, C.; et al. Ubiquitin-Specific Protease 2-69 in Macrophages Potentially Modulates Metainflammation. FASEB J. 2013, 27, 4940–4953. [Google Scholar] [CrossRef]
- Saito, N.; Kimura, S.; Miyamoto, T.; Fukushima, S.; Amagasa, M.; Shimamoto, Y.; Nishioka, C.; Okamoto, S.; Toda, C.; Washio, K.; et al. Macrophage Ubiquitin-Specific Protease 2 Modifies Insulin Sensitivity in Obese Mice. Biochem. Biophys. Reports 2017, 9, 322–329. [Google Scholar] [CrossRef]
- Hashimoto, M.; Fujimoto, M.; Konno, K.; Lee, M.L.; Yamada, Y.; Yamashita, K.; Toda, C.; Tomura, M.; Watanabe, M.; Inanami, O.; et al. Ubiquitin-Specific Protease 2 in the Ventromedial Hypothalamus Modifies Blood Glucose Levels by Controlling Sympathetic Nervous Activation. J. Neurosci. 2022, 42, 4607–4618. [Google Scholar] [CrossRef] [PubMed]
- Hashimoto, M.; Kimura, S.; Kanno, C.; Yanagawa, Y.; Watanabe, T.; Okabe, J.; Takahashi, E.; Nagano, M.; Kitamura, H. Macrophage Ubiquitin-Specific Protease 2 Contributes to Motility, Hyperactivation, Capacitation, and in Vitro Fertilization Activity of Mouse Sperm. Cell. Mol. Life Sci. 2021, 78, 2929–2948. [Google Scholar] [CrossRef] [PubMed]
- Hashimoto, M.; Saito, N.; Ohta, H.; Yamamoto, K.; Tashiro, A.; Nakazawa, K.; Inanami, O.; Kitamura, H. Inhibition of Ubiquitin-Specific Protease 2 Causes Accumulation of Reactive Oxygen Species, Mitochondria Dysfunction, and Intracellular ATP Decrement in C2C12 Myoblasts. Physiol. Rep. 2019, 7, 1–14. [Google Scholar] [CrossRef] [PubMed]
- YAFFE, D.; SAXEL, O. Serial Passaging and Differentiation of Myogenic Cells Isolated from Dystrophic Mouse Muscle. Nature 1977, 270, 725–727. [Google Scholar] [CrossRef] [PubMed]
- Sin, J.; Andres, A.M.; Taylo, R.D.J.R.; Weston, T.; Hiraumi, Y.; Stotland, A.; Kim, B.J.; Huang, C.; Doran, K.S.; Gottlieb, R.A. Mitophagy Is Required for Mitochondrial Biogenesis and Myogenic Differentiation of C2C12 Myoblasts. Autophagy 2016, 12, 369–380. [Google Scholar] [CrossRef] [PubMed]
- Forterre, A.; Jalabert, A.; Berger, E.; Baudet, M.; Chikh, K.; Errazuriz, E.; De Larichaudy, J.; Chanon, S.; Weiss-Gayet, M.; Hesse, A.M.; et al. Proteomic Analysis of C2C12 Myoblast and Myotube Exosome-like Vesicles: A New Paradigm for Myoblast-Myotube Cross Talk? PLoS One 2014, 9. [Google Scholar] [CrossRef]
- Calzia, D.; Ottaggio, L.; Cora, A.; Chiappori, G.; Cuccarolo, P.; Cappelli, E.; Izzotti, A.; Tavella, S.; Degan, P. Characterization of C2C12 Cells in Simulated Microgravity: Possible Use for Myoblast Regeneration. J. Cell. Physiol. 2020, 235, 3508–3518. [Google Scholar] [CrossRef] [PubMed]
- Davis, M.I.; Pragani, R.; Fox, J.T.; Shen, M.; Parmar, K.; Gaudiano, E.F.; Liu, L.; Tanega, C.; McGee, L.; Hall, M.D.; et al. Small Molecule Inhibition of the Ubiquitin-Specific Protease USP2 Accelerates Cyclin D1 Degradation and Leads to Cell Cycle Arrest in Colorectal Cancer and Mantle Cell Lymphoma Models. J. Biol. Chem. 2016, 291, 24628–24640. [Google Scholar] [CrossRef] [PubMed]
- Wu, Z.; Puigserver, P.; Andersson, U.; Zhang, C.; Adelmant, G.; Mootha, V.; Troy, A.; Cinti, S.; Lowell, B.; Scarpulla, R.C.; et al. Mechanisms Controlling Mitochondrial Biogenesis and Respiration through the Thermogenic Coactivator PGC-1. Cell 1999, 98, 115–124. [Google Scholar] [CrossRef]
- Yi, J.; Tavana, O.; Li, H.; Wang, D.; Baer, R.J.; Gu, W. Targeting USP2 Regulation of VPRBP-Mediated Degradation of P53 and PD-L1 for Cancer Therapy. Nat. Commun. 2023, 14. [Google Scholar] [CrossRef]
- Fu, D.; Luo, J.; Wu, Y.; Zhang, L.; Li, L.; Chen, H.; Wen, T.; Fu, Y.; Xiong, W. Angiotensin II-Induced Calcium Overload Affects Mitochondrial Functions in Cardiac Hypertrophy by Targeting the USP2/MFN2 Axis. Mol. Cell. Endocrinol. 2023, 571, 111938. [Google Scholar] [CrossRef] [PubMed]
- Santel, A.; Fuller, M.T. Control of Mitochondrial Morphology by a Human Mitofusin. J. Cell Sci. 2001, 114, 867–874. [Google Scholar] [CrossRef]
- Pernas, L.; Scorrano, L. Mito-Morphosis: Mitochondrial Fusion, Fission, and Cristae Remodeling as Key Mediators of Cellular Function. Annu. Rev. Physiol. 2016, 78, 505–531. [Google Scholar] [CrossRef]
- Jiang, Z.; Shen, J.; Ding, J.; Yuan, Y.; Gao, L.; Yang, Z.; Zhao, X. USP18 Mitigates Lipopolysaccharide-Induced Oxidative Stress and Inflammation in Human Pulmonary Microvascular Endothelial Cells through the TLR4/NF-ΚB/ROS Signaling. Toxicol. Vitr. 2021, 75, 105181. [Google Scholar] [CrossRef]
- Marcassa, E.; Kallinos, A.; Jardine, J.; Rusilowicz-Jones, E.V.; Martinez, A.; Kuehl, S.; Islinger, M.; Clague, M.J.; Urbé, S. Dual Role of USP 30 in Controlling Basal Pexophagy and Mitophagy. EMBO Rep. 2018, 19, 1–14. [Google Scholar] [CrossRef] [PubMed]
- Molusky, M.M.; Ma, D.; Buelow, K.; Yin, L.; Lin, J.D. Peroxisomal Localization and Circadian Regulation of Ubiquitin-Specific Protease 2. PLoS One 2012, 7, 1–10. [Google Scholar] [CrossRef]
- Nègre-Salvayre, A.; Hirtz, C.; Carrera, G.; Cazenave, R.; Troly, M.; Salvayre, R.; Pénicaud, L.; Casteilla, L. A Role for Uncoupling Protein-2 as a Regulator of Mitochondrial Hydrogen Peroxide Generation. FASEB J. 1997, 11, 809–815. [Google Scholar] [CrossRef]
- Gousseva, N.; Baker, R.T. Gene Structure, Alternate Splicing, Tissue Distribution, Cellular Localization, and Developmental Expression Pattern of Mouse Deubiquitinating Enzyme Isoforms Usp2-45 and Usp2-69. Gene Expr. 2003, 11, 163–179. [Google Scholar] [CrossRef] [PubMed]
- Fu, Y.; Tao, L.; Wang, X.; Wang, B.; Qin, W.; Song, L. PGC-1α Participates in Regulating Mitochondrial Function in Aged Sarcopenia through Effects on the Sestrin2-Mediated MTORC1 Pathway. Exp. Gerontol. 2024, 190, 112428. [Google Scholar] [CrossRef]
- Oishi, Y.; Manabe, I.; Tobe, K.; Ohsugi, M.; Kubota, T.; Fujiu, K.; Maemura, K.; Kubota, N.; Kadowaki, T.; Nagai, R. SUMOylation of Krüppel-like Transcription Factor 5 Acts as a Molecular Switch in Transcriptional Programs of Lipid Metabolism Involving PPAR-δ. Nat. Med. 2008, 14, 656–666. [Google Scholar] [CrossRef]
- Oberkofler, H.; Klein, K.; Felder, T.K.; Krempler, F.; Patsch, W. Role of Peroxisome Proliferator-Activated Receptor-γ Coactivator-1α in the Transcriptional Regulation of the Human Uncoupling Protein 2 Gene in INS-1E Cells. Endocrinology 2006, 147, 966–976. [Google Scholar] [CrossRef] [PubMed]
- Park, K.C.; Kim, J.H.; Choi, E.J.; Min, S.W.; Rhee, S.; Baek, S.H.; Chung, S.S.; Bang, O.; Park, D.; Chiba, T.; et al. Antagonistic Regulation of Myogenesis by Two Deubiquitinating Enzymes, UBP45 and UBP69. Proc. Natl. Acad. Sci. U. S. A. 2002, 99, 9733–9738. [Google Scholar] [CrossRef] [PubMed]
- Bedard, N.; Yang, Y.; Gregory, M.; Cyr, D.G.; Suzuki, J.; Yu, X.; Chian, R.C.; Hermo, L.; O’Flaherty, C.; Smith, C.E.; et al. Mice Lacking the USP2 Deubiquitinating Enzyme Have Severe Male Subfertility Associated with Defects in Fertilization and Sperm Motility. Biol. Reprod. 2011, 85, 594–604. [Google Scholar] [CrossRef] [PubMed]
- Manesia, J.K.; Xu, Z.; Broekaert, D.; Boon, R.; van Vliet, A.; Eelen, G.; Vanwelden, T.; Stegen, S.; Van Gastel, N.; Pascual-Montano, A.; et al. Highly Proliferative Primitive Fetal Liver Hematopoietic Stem Cells Are Fueled by Oxidative Metabolic Pathways. Stem Cell Res. 2015, 15, 715–721. [Google Scholar] [CrossRef] [PubMed]
- Jagannathan, L.; Cuddapah, S.; Costa, M. Oxidative Stress Under Ambient and Physiological Oxygen Tension in Tissue Culture. Curr. Pharmacol. Reports 2016, 2, 64–72. [Google Scholar] [CrossRef]
- Kitamura, H.; Ishino, T.; Shimamoto, Y.; Okabe, J.; Miyamoto, T.; Takahashi, E.; Miyoshi, I. Ubiquitin-Specific Protease 2 Modulates the Lipopolysaccharide-Elicited Expression of Proinflammatory Cytokines in Macrophage-like HL-60 Cells. Mediators Inflamm. 2017, 2017. [Google Scholar] [CrossRef]


Disclaimer/Publisher’s Note: The statements, opinions and data contained in all publications are solely those of the individual author(s) and contributor(s) and not of MDPI and/or the editor(s). MDPI and/or the editor(s) disclaim responsibility for any injury to people or property resulting from any ideas, methods, instructions or products referred to in the content. |
© 2024 by the authors. Licensee MDPI, Basel, Switzerland. This article is an open access article distributed under the terms and conditions of the Creative Commons Attribution (CC BY) license (http://creativecommons.org/licenses/by/4.0/).


