Preprint
Article

Interplay between mTORC1 and mTORC2 in Regulating cAMP Signaling and Cell Adhesion in Dictyostelium discoideum

Altmetrics

Downloads

69

Views

46

Comments

0

This version is not peer-reviewed

Submitted:

31 July 2024

Posted:

31 July 2024

You are already at the latest version

Alerts
Abstract
The mechanistic Target of Rapamycin Complex 1 (mTORC1) regulates ribosome biogenesis and the transcription of ribosomal genes. Its inactivation impacts protein synthesis necessary for transport of cell adhesion molecule. In Dictyostelium discoideum, the activity of mechanistic Target of Rapamycin Complex 2 (mTORC2) is crucial for cAMP synthesis and relay, processes that depend on heterotrimeric G-proteins and Ras GTPases. Mutants lacking rip3 or lst-8 genes exhibit impaired adenyl cyclase activation and cAMP signaling, resulting in deficient expression of the cell adhesion protein CsaA. Despite this, rip3- cells, which have impaired mTORC2, upregulate Cad-1 expression, a cell adhesion protein regulated by Ras-GTPases, to compensate for the loss of CsaA. lst-8- cells, which have both mTORC1 and mTORC2 inactivated, show reduced nutrient sensing, premature CsaA expression and solitary cell behavior. These cells also show defective transport of adhesion proteins to the cell surface, impeding aggregation. Similar defects are observed with caffeine treatment, suggesting both mTORC1 and mTORC2 inhibition. This study highlights the interplay between mTORC1 and mTORC2 in regulating cell adhesion and aggregation through cAMP signaling and protein synthesis pathways in Dictyostelium.
Keywords: 
Subject: Biology and Life Sciences  -   Life Sciences

Introduction

After a brief period of starvation, single cells aggregate to form a multicell structure, which subsequently undergoes morphogenesis to develop into a motile slug. This aggregation process is mediated by two key glycoproteins: Cad-1 (gp24; calcium-dependent cell adhesion molecule-1) and CsaA (gp80; contact site-A protein). Cad-1 expression begins at the early aggregation stage and is essential for mediating initial cell-cell contacts during this phase [1,2,3,4]. Its role is critical in the early stages of cell aggregation, facilitating the initial interactions between cells. CsaA expression is observed after six hours of development and is induced by cAMP as development progresses [4,5,6]. It establishes a second type of contact in the developing cell stream, which is crucial for the further stabilization and organization of the multicellular structure [6,7]. Additionally, other known factors, such as counting factors, density-promoting factor 1 (DPF1), and pre-starvation factor (PSF), can govern the timing and development of multicellular aggregates [8,9,10].
mTORC1 (mechanical Target of Rapamycin Complex 1) plays a significant role in regulating genes involved in ribosome biogenesis. Impairment of mTORC1 activity affects the transcription of several genes essential for development ([11,12,13,14]. mTORC2 (mechanical Target of Rapamycin Complex 2) is involved in the synthesis and relay of cAMP, and cells deficient in mTORC2 activity exhibit impaired chemotaxis, which is vital for aggregation and subsequent development [13,15,16]. Lst-8 is a component of both mTORC1 and mTORC2 complexes, while RIP-3 is a component of mTORC2 only [16,17]. Cells lacking Lst-8 (lst-8- cells) are defective in aggregation, whereas cells lacking RIP-3 (rip-3- cells) form clumps but their development arrests at this stage. Both types of mutant cells exhibit reduced cell polarity and a lower chemotaxis index, indicating their compromised ability to respond to chemotactic signals and organize into streams [16,17,18]. These defects underline the critical roles of Lst-8 and RIP-3 in cell migration and aggregation.
It has been observed that lst-8- and rip-3- cells do not migrate effectively in a chemotactic gradient, unlike wild-type cells. They fail to organize into streams, highlighting their impaired chemotactic response [16,18]. To investigate the underlying mechanisms, we monitored the expression and localization of the cell adhesion proteins Cad-1 and CsaA in wild-type, lst-8-, and rip-3- cells. Our findings indicate that both lst-8- and rip-3- cells exhibit defects in the synthesis and localization of Cad-1 and CsaA proteins. These defects likely contribute to their impaired ability to form aggregates and undergo normal development, emphasizing the essential roles of these proteins and the mTOR complexes in D. discoideum multi-cell development.

Methods

Cell Culture

AX3 Dictyostelium cells were grown in Cosson HL5 media (14.3 g bactopeptone, 7.15 g yeast extract, 18 g maltose monohydrate, 3.6 mM Na2HPO4 and KH2PO4) with penicillin (100 units/ml) and streptomycin (100 μg/ml) at 220C either in petridishes or in shaking suspension (150 rpm; [as described in [4,19]. lst8‾ and rip3‾ cells were grown in Cosson HL5 media containing 5 μg/ml of blasticidin in the presence of penicillin and streptomycin to prevent bacterial contamination.

Assay for the Aggregation Pattern with Caffeine

Axenically grown cells were harvested and plated at a density of 1 X 10⁶ cells/cm2 on non-nutrient agar plates (KK2 buffer containing 15 g agar per litre, pH 6.4) containing the specified concentration of caffeine. The changes in the aggregation patterns were monitored under a microscope (Nikon TM SMZ1000 and Nikon TM eclipse 80i).

Immunofluorescence Detection of Cellular Proteins

Dictyostelium cells (WT or mutants) grown in petridishes were harvested by flooding the plates with ice cold KK2 buffer, centrifuged, washed twice with KK2 buffer and resuspended at density of 1 X 10⁶ cells/ml. 400 μl of the cell suspension was pipetted on to an 18 mm glass coverslip adhered to a petridish containing 5 ml starvation buffer and was incubated for 4 hours and 8 hours. After incubation, the supernatant was aspirated and the coverslip with the cells were fixed either with 4 % PFA (Paraformaldehyde) for 30 minutes at room temperature or dipped into pre-chilled (-350C) methanol for 30 minutes [20]. The coverslip fixed with PFA was neutralized with a quenching solution (100 mM glycine in phosphate buffer saline buffer) for 10 minutes. The fixed cells were blocked with gelatin (0.2 % gelatin in PBS buffer) by incubating them at room temperature for 2 hours. After the blocking reaction, the cover slips were incubated with primary antibodies (anti-csaA and anti-Cad1) for 1-2 hours in a humid box at room temperature. The excess antibody was washed off 5 times with phosphate buffer saline (PBS) for 5 minutes. Then the cover slip was incubated for 1 hour with appropriate secondary antibody followed by three washings with PBS for 5 minutes. The coverslip was mounted onto a glass slide and observed under a confocal LeicaTMSP2 laser scanning microscope.

Western Blotting

Western blotting was performed as described at [19,21]. SDS-polyacrylamide gel (10-15 % resolving gel, 5 % stacking gel) was prepared using glass-plates of 10 cm X 7.5 cm dimensions and spacers of 1 mm thickness. Cell pellets (4 X 10⁶ cells) were resuspended in a suitable 200 μl of cell lysis buffer. Denaturation of the samples were carried out by heating them at 95ºC for 5 minutes and 20 μl (4 X 10⁵ cells) of the denatured sample was loaded into the wells in a stacking gel. Appropriate molecular weight markers were used as standards to estimate the molecular weight of the proteins resolved on SDS-polyacrylamide gels. After loading the samples into the gel, electrophoresis was carried out in a 1X gel running buffer with a constant voltage of 100 V until the bromophenol blue dye front reached almost lower end of the gel. After SDS-page, gel was transferred on nitrocellulose membrane, blocked with 5% non-fat dry milk, subsequently probed with primary antibodies anti-CsaA and anti-Cad-1. anti-CsaA antibody was used at dilution of 1:1000 and anti-CAD-1 at a dilution of 1:10000.

Result

Defective Multi-Cell Aggregates Formation in lst-8- and rip-3- Cells

In Dictyostelium, synthesis and relay of cAMP is regulated by mTOR complex 2 (mTORC2) [16]. Mutant cells in subunit of mTORC2 have weak responses to cAMP and are defective in aggregation [16]. We assayed the aggregate formation in Dictyostelium AX2 cells and cells lesion in lst-8 and rip-3 genes. lst-8- did not participate in aggregate, however rip-3- cells formed clumps of cells at 24 hours of time course (Figure 1). In contrast, fruiting bodies were observed in Dictyostelium AX2 cells at 24 hours of time course of development (Figure 1). Development can be impaired if cell adhesion proteins expression and its surface localization is not normal. Inability of these mutant cells to stream can be due to loss or defective cell adhesion process.

Reduced Aggregate Size of Mutants in mTOR Complexes I and II Components Resembles Aggregates Formed in the Presence of Caffeine

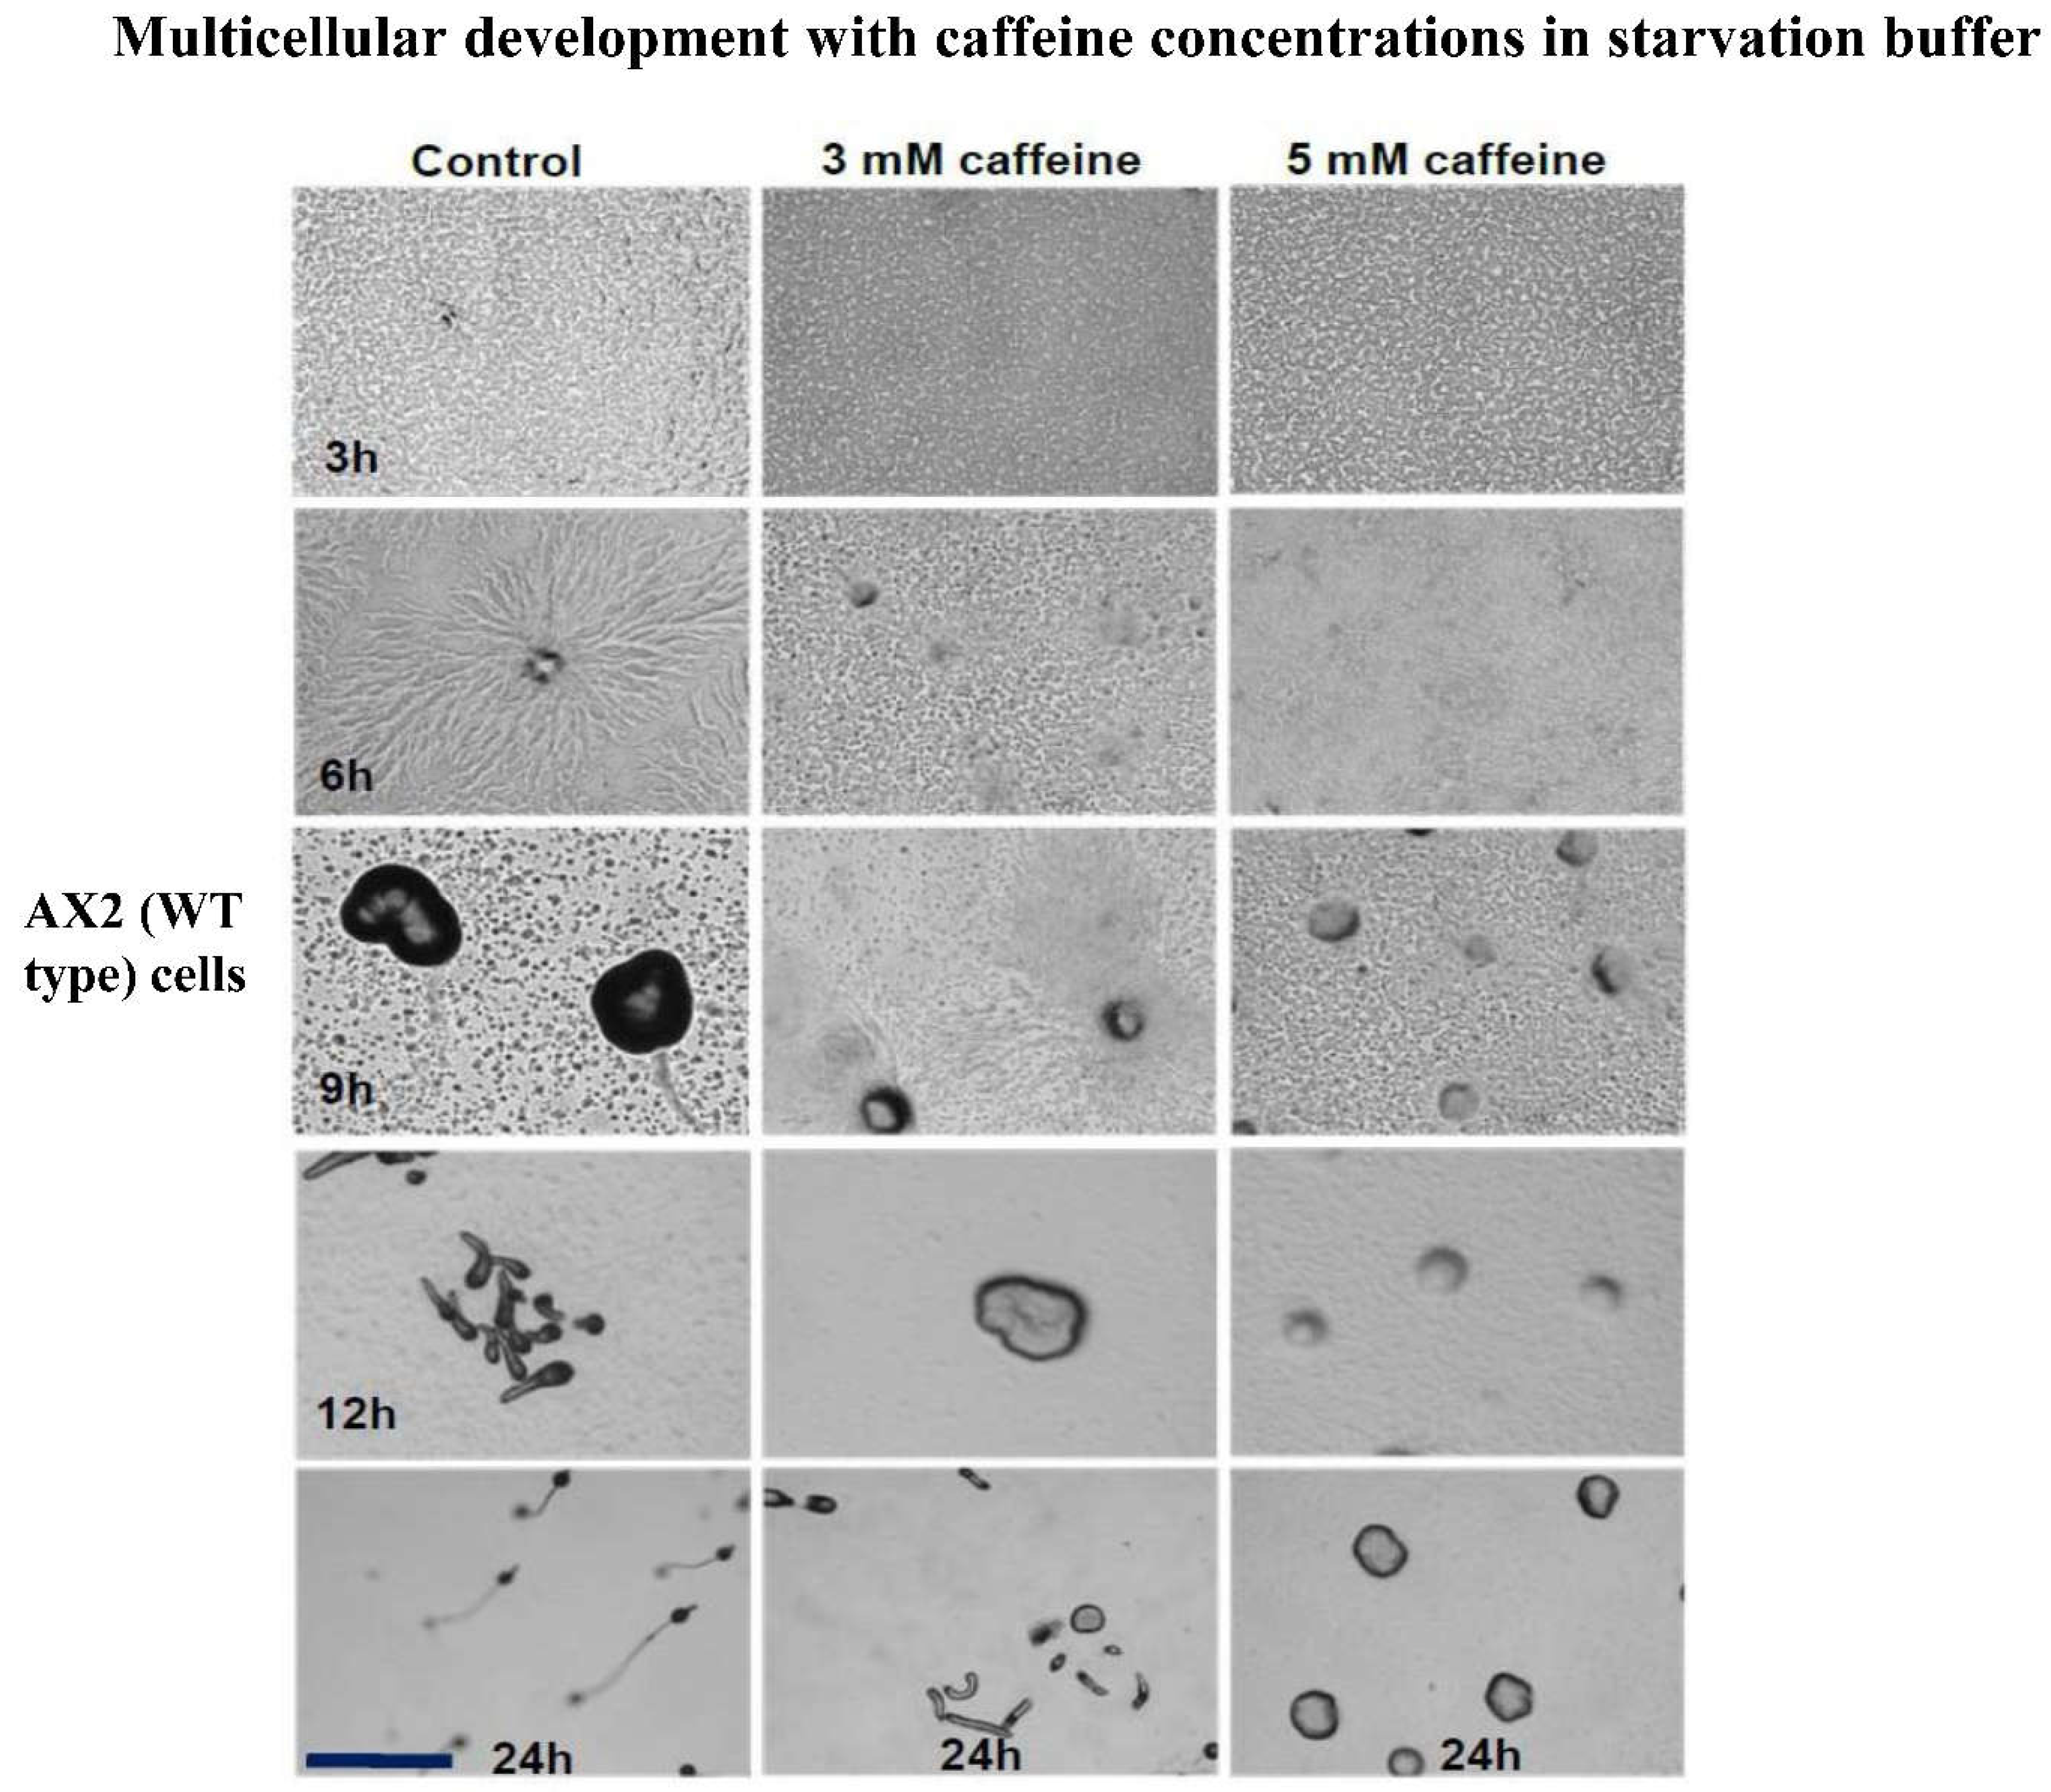
In Dictyostelium, mTORC2 is known to regulate cAMP signal relay, chemotaxis and development. rip-3- cells (mutant cells in a component of mTORC2) form a mound, which does not proceed to form slugs and fruiting bodies [16]. To validate our hypothesis that caffeine action on development is mediated by mTORC2 complexes, also. We assayed the development of Dictyostelium WT cells in the presence of caffeine. We treated vegetative Dictyostelium AX2 cells with varying concentrations of caffeine, and periodically monitored developmental timing and developmental defects. In controls, the first sign of aggregation could be seen after 3h of development and at 6h, a fully developed aggregate was observed. With increasing caffeine concentrations, there was a gradual delay in development (Figure 2). The aggregate size decreased with increasing caffeine concentrations (Figure 2) and at 7 mM caffeine, cells did not participate in aggregation (data not shown). At 5 mM caffeine, development arrested at the aggregation stage (Figure 2). AX2 aggregates, formed in the presence of caffeine (5 mM), resembled rip-3- mounds (Figure 1).

Expression of the Cell Adhesion Proteins Cad-1 and CsaA Is Impaired in lst-8-and rip-3- Cells

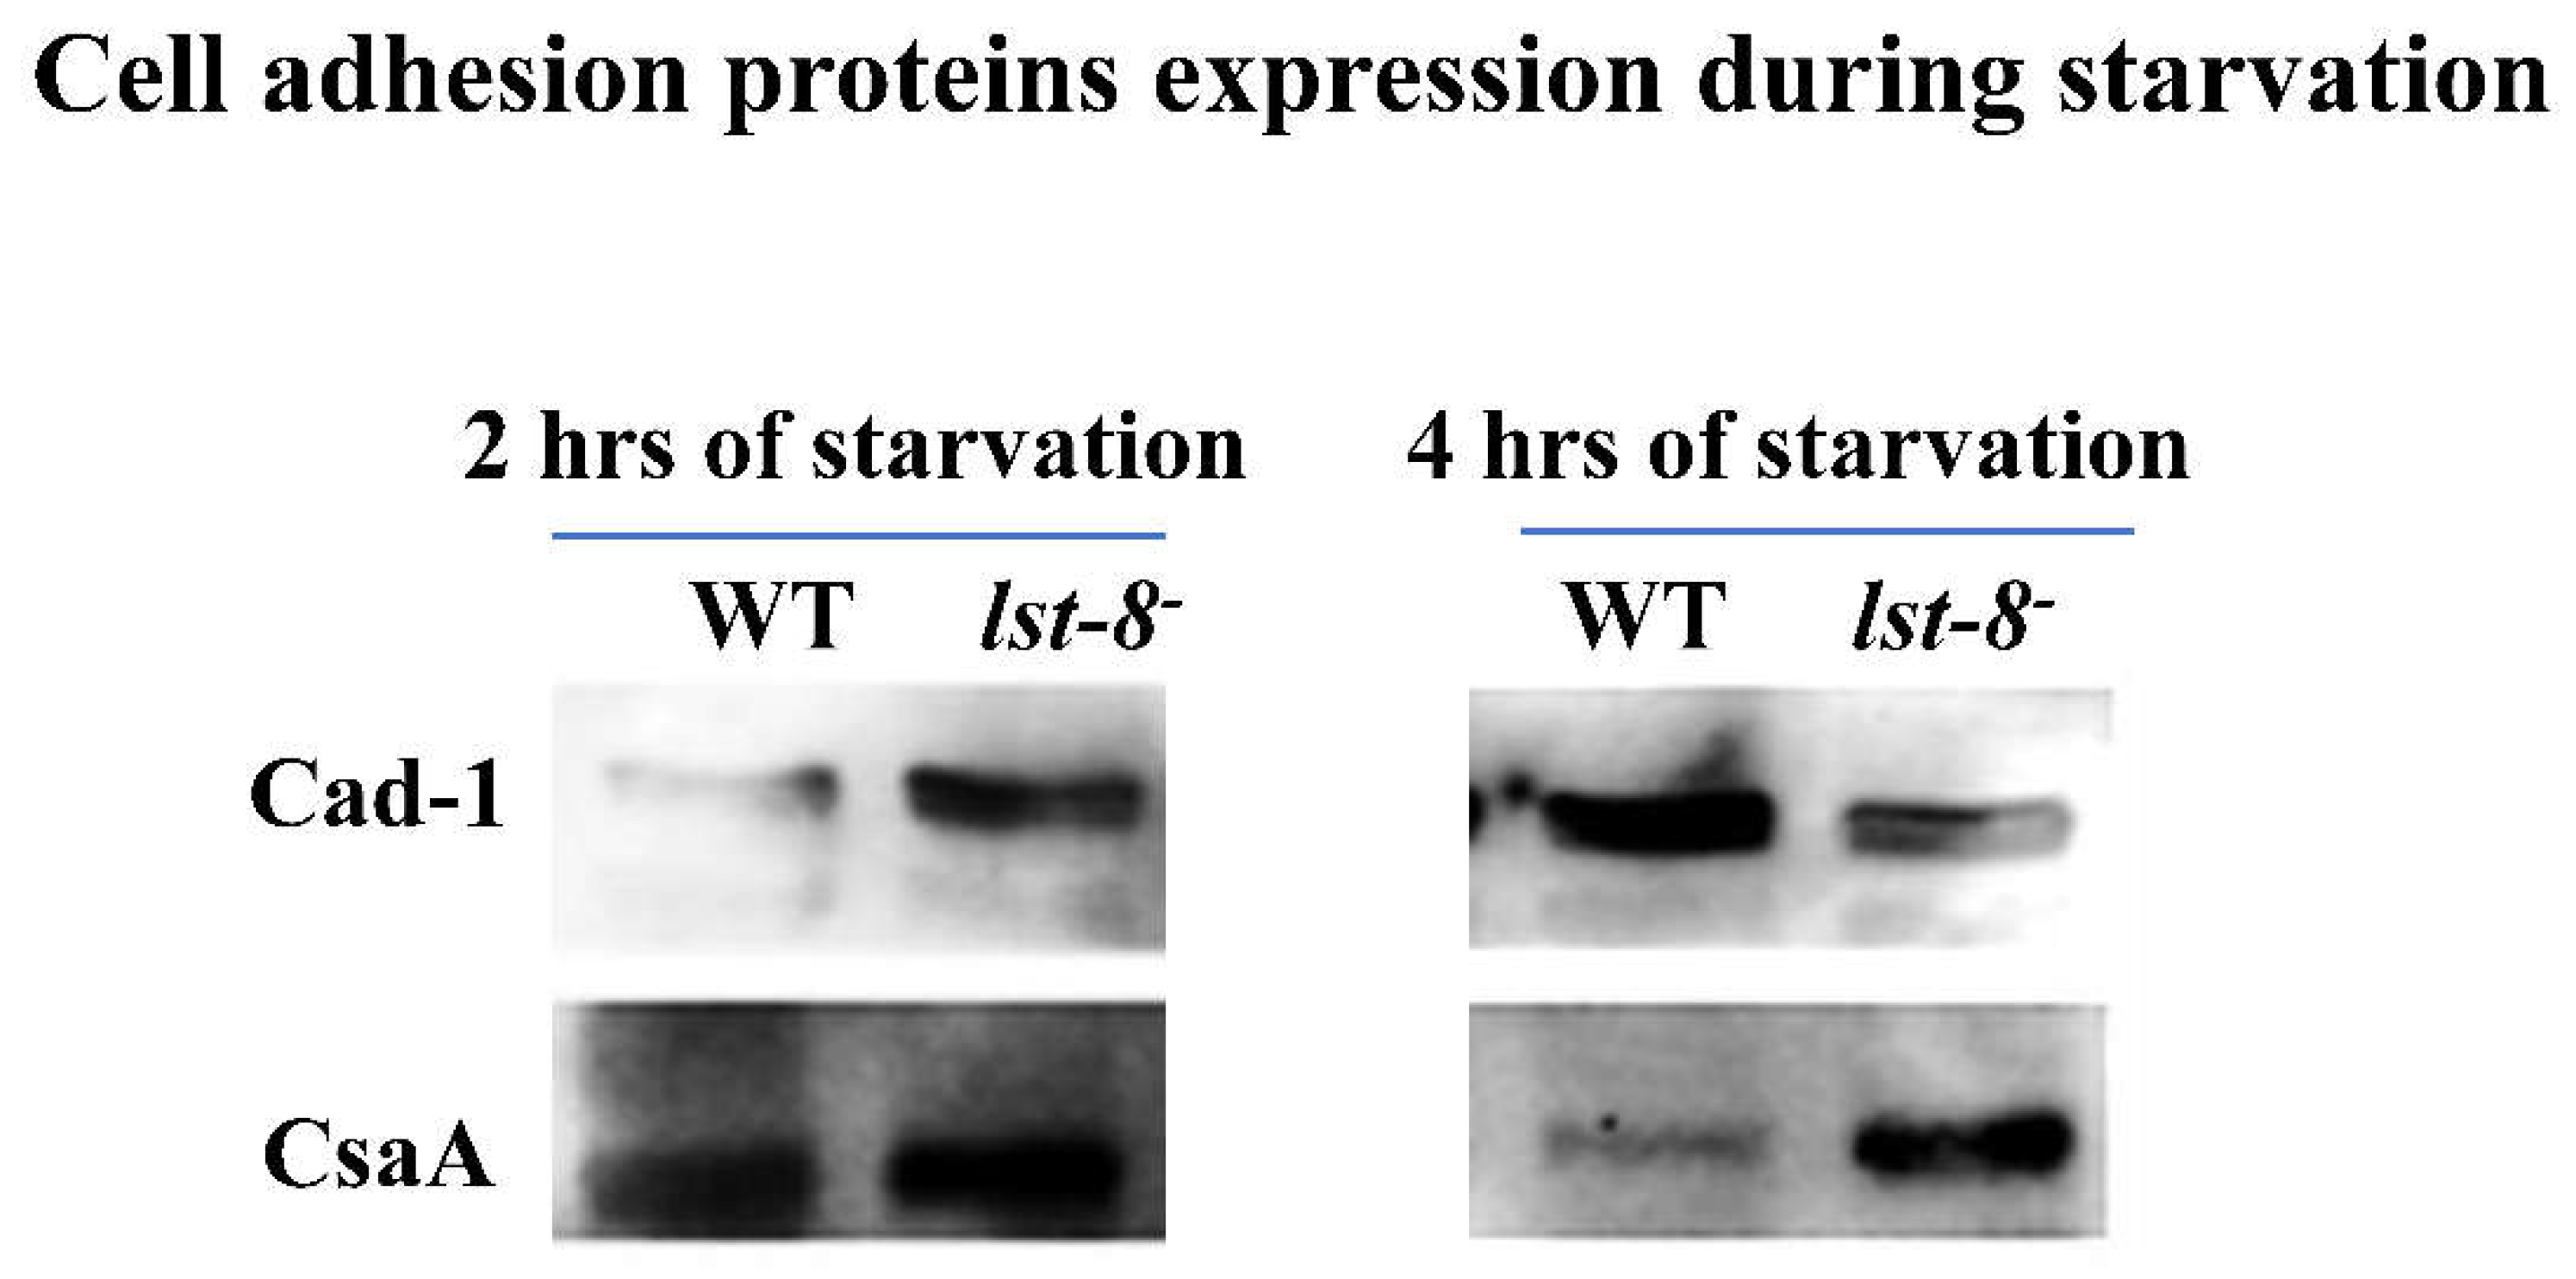
Since the effect of caffeine at concentration of 5-7 mM on aggregation resembles the development of rip-3- and lst-8- cells therefore we studied the cell adhesion protein expression and localization in rip-3- and lst-8- cells to know the reason for affected aggregation in the presence of caffeine. As shown in Figure 1, lst-8- and rip-3- cells do not stream and remain solitary or form small cell clumps. Western blot was performed to monitor the expression of cell adhesion proteins Cad-1 and CsaA in these cells starved for 2 to 24h in starvation buffer. AX2 cells expressed higher levels of Cad-1 and CsaA proteins than WT cells. lst-8- cells that are aggregation-defective expressed even higher levels of these two glycoproteins than the WT cells (AX2) at early stages (Figure 3). Expression of Cad-1 at 2 hours of development in lst8- cells was higher compared to WT cells. However, at 4h of development, Cad-1 expression in lst8- cells was equal to the expression observed from WT cells. In lst8- cells, the expression of CsaA was observed at 2h and 4h of development which was not seen in WT cells at the same time course of development (Figure 3). CsaA is a marker protein for early differentiation and its early expression suggest that cells with defective lst-8 genes undergo starvation at the earliest stage.
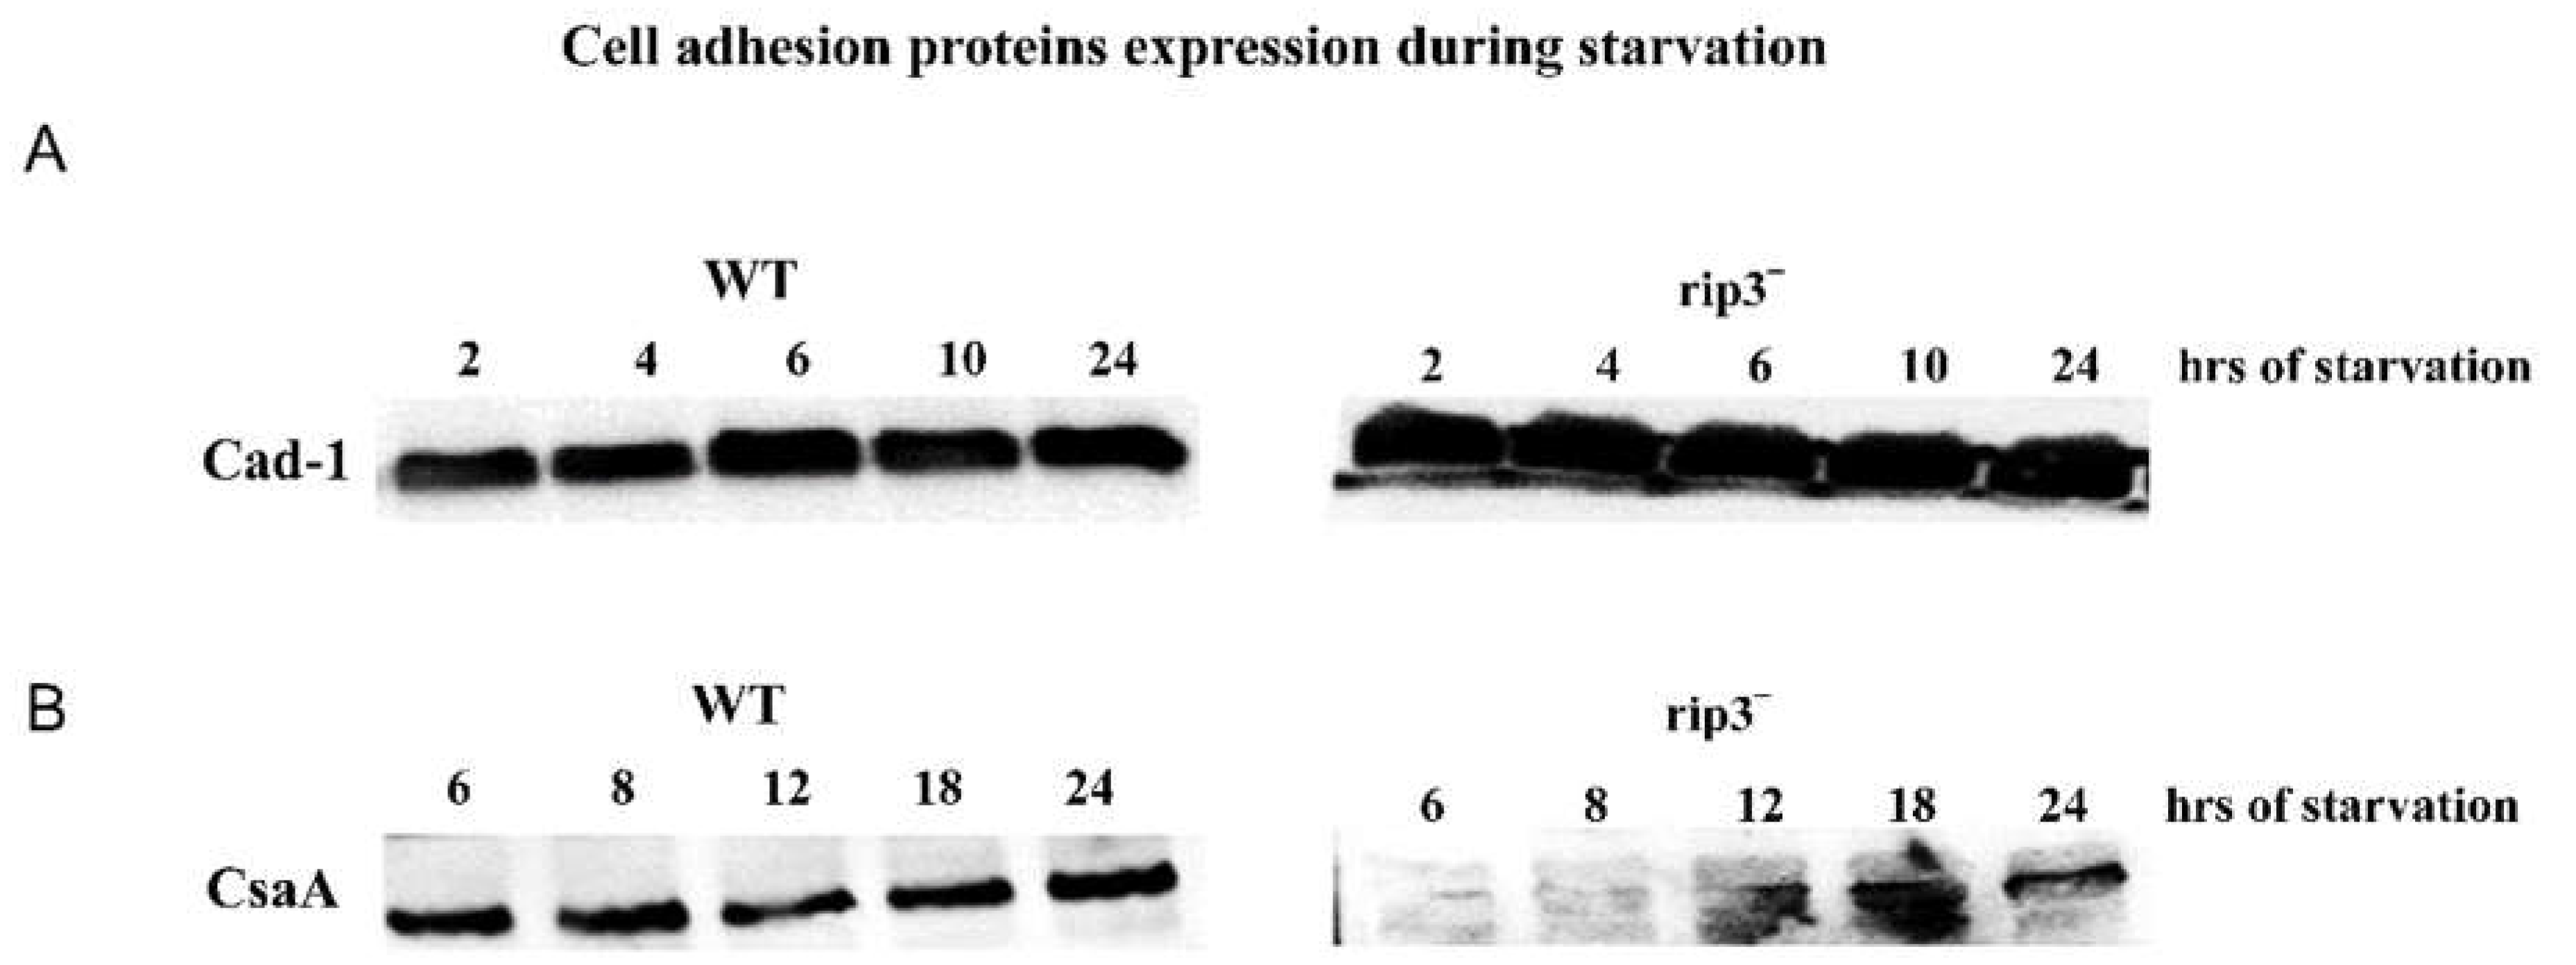
Further, we monitored the expression levels of Cad-1 and CsaA in rip-3- cells developed for 2 to 24h in starvation buffer. In rip-3- cells, the expression of Cad-1 was extremely high compared to the controls (Figure 4). However, there was no CsaA expression in rip-3- cells even at 6h and 8h of development and only a low level of expression was seen at 12h, 18h and 24h of development (Figure 4).
High levels of Cad-1 protein expression in rip-3- cells might allow them to form small cell clumps, but the lack or expression of CsaA prevents evolution towards a tighter stream and aggregate. We thus conclude that rip-3- cells do not express CsaA. Taken together this study suggest that, although lst8- cells express both cell adhesion proteins Cad-1 and CsaA, they do not stream and aggregate. One plausible reason might be that the cells are defective in transporting these proteins to the plasma membrane.

Localization of Cell Adhesion Proteins Cad-1 and CsaA Is Defective in lst-8- Cells

During differentiation, cell-adhesion proteins are transported to the cell surface to initiate development [2]. lst8- cells are aggregation defective but express higher levels of cell adhesion proteins than WT cells. lst-8- mutants may also have impaired transport mechanism that prevents adhesion proteins to be targeted to the cell surface. We performed immunofluorescence localization of Cad-1 and CsaA proteins in these mutants. These adhesion proteins are known to be expressed when development is triggered and hence, we starved Dictyostleium AX2 cells and lst-8- cells for 4h and 8h.
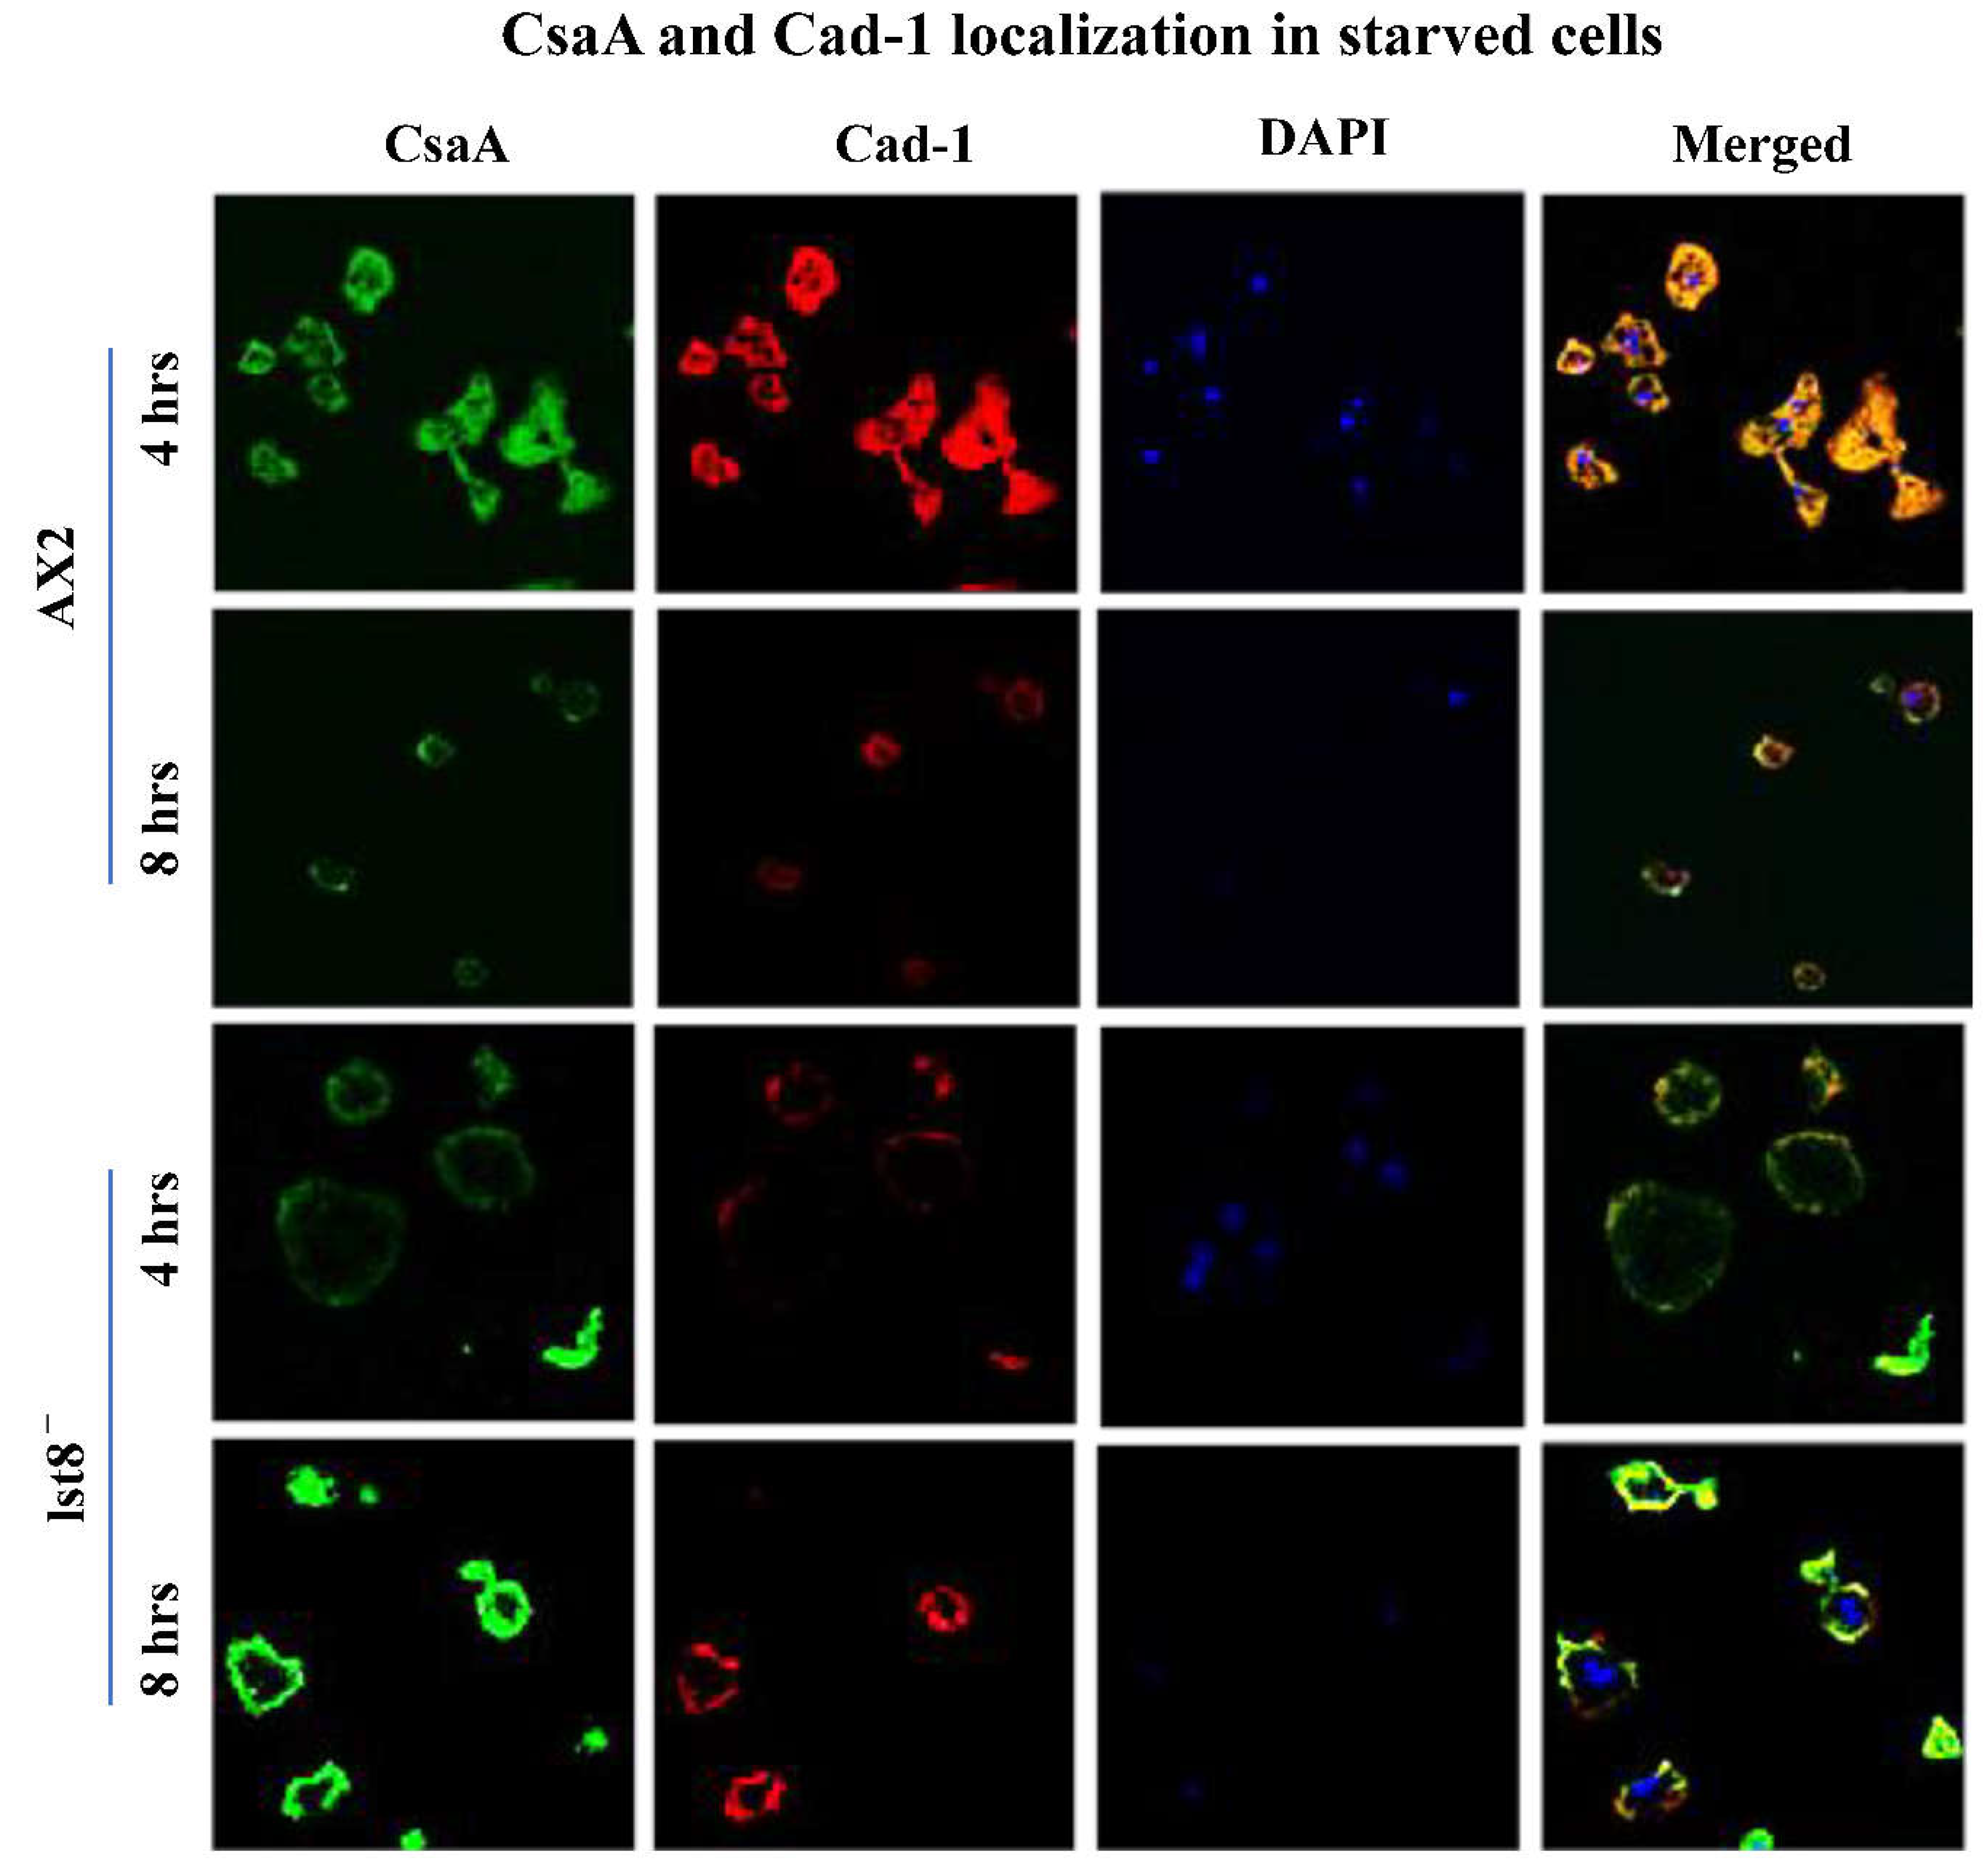
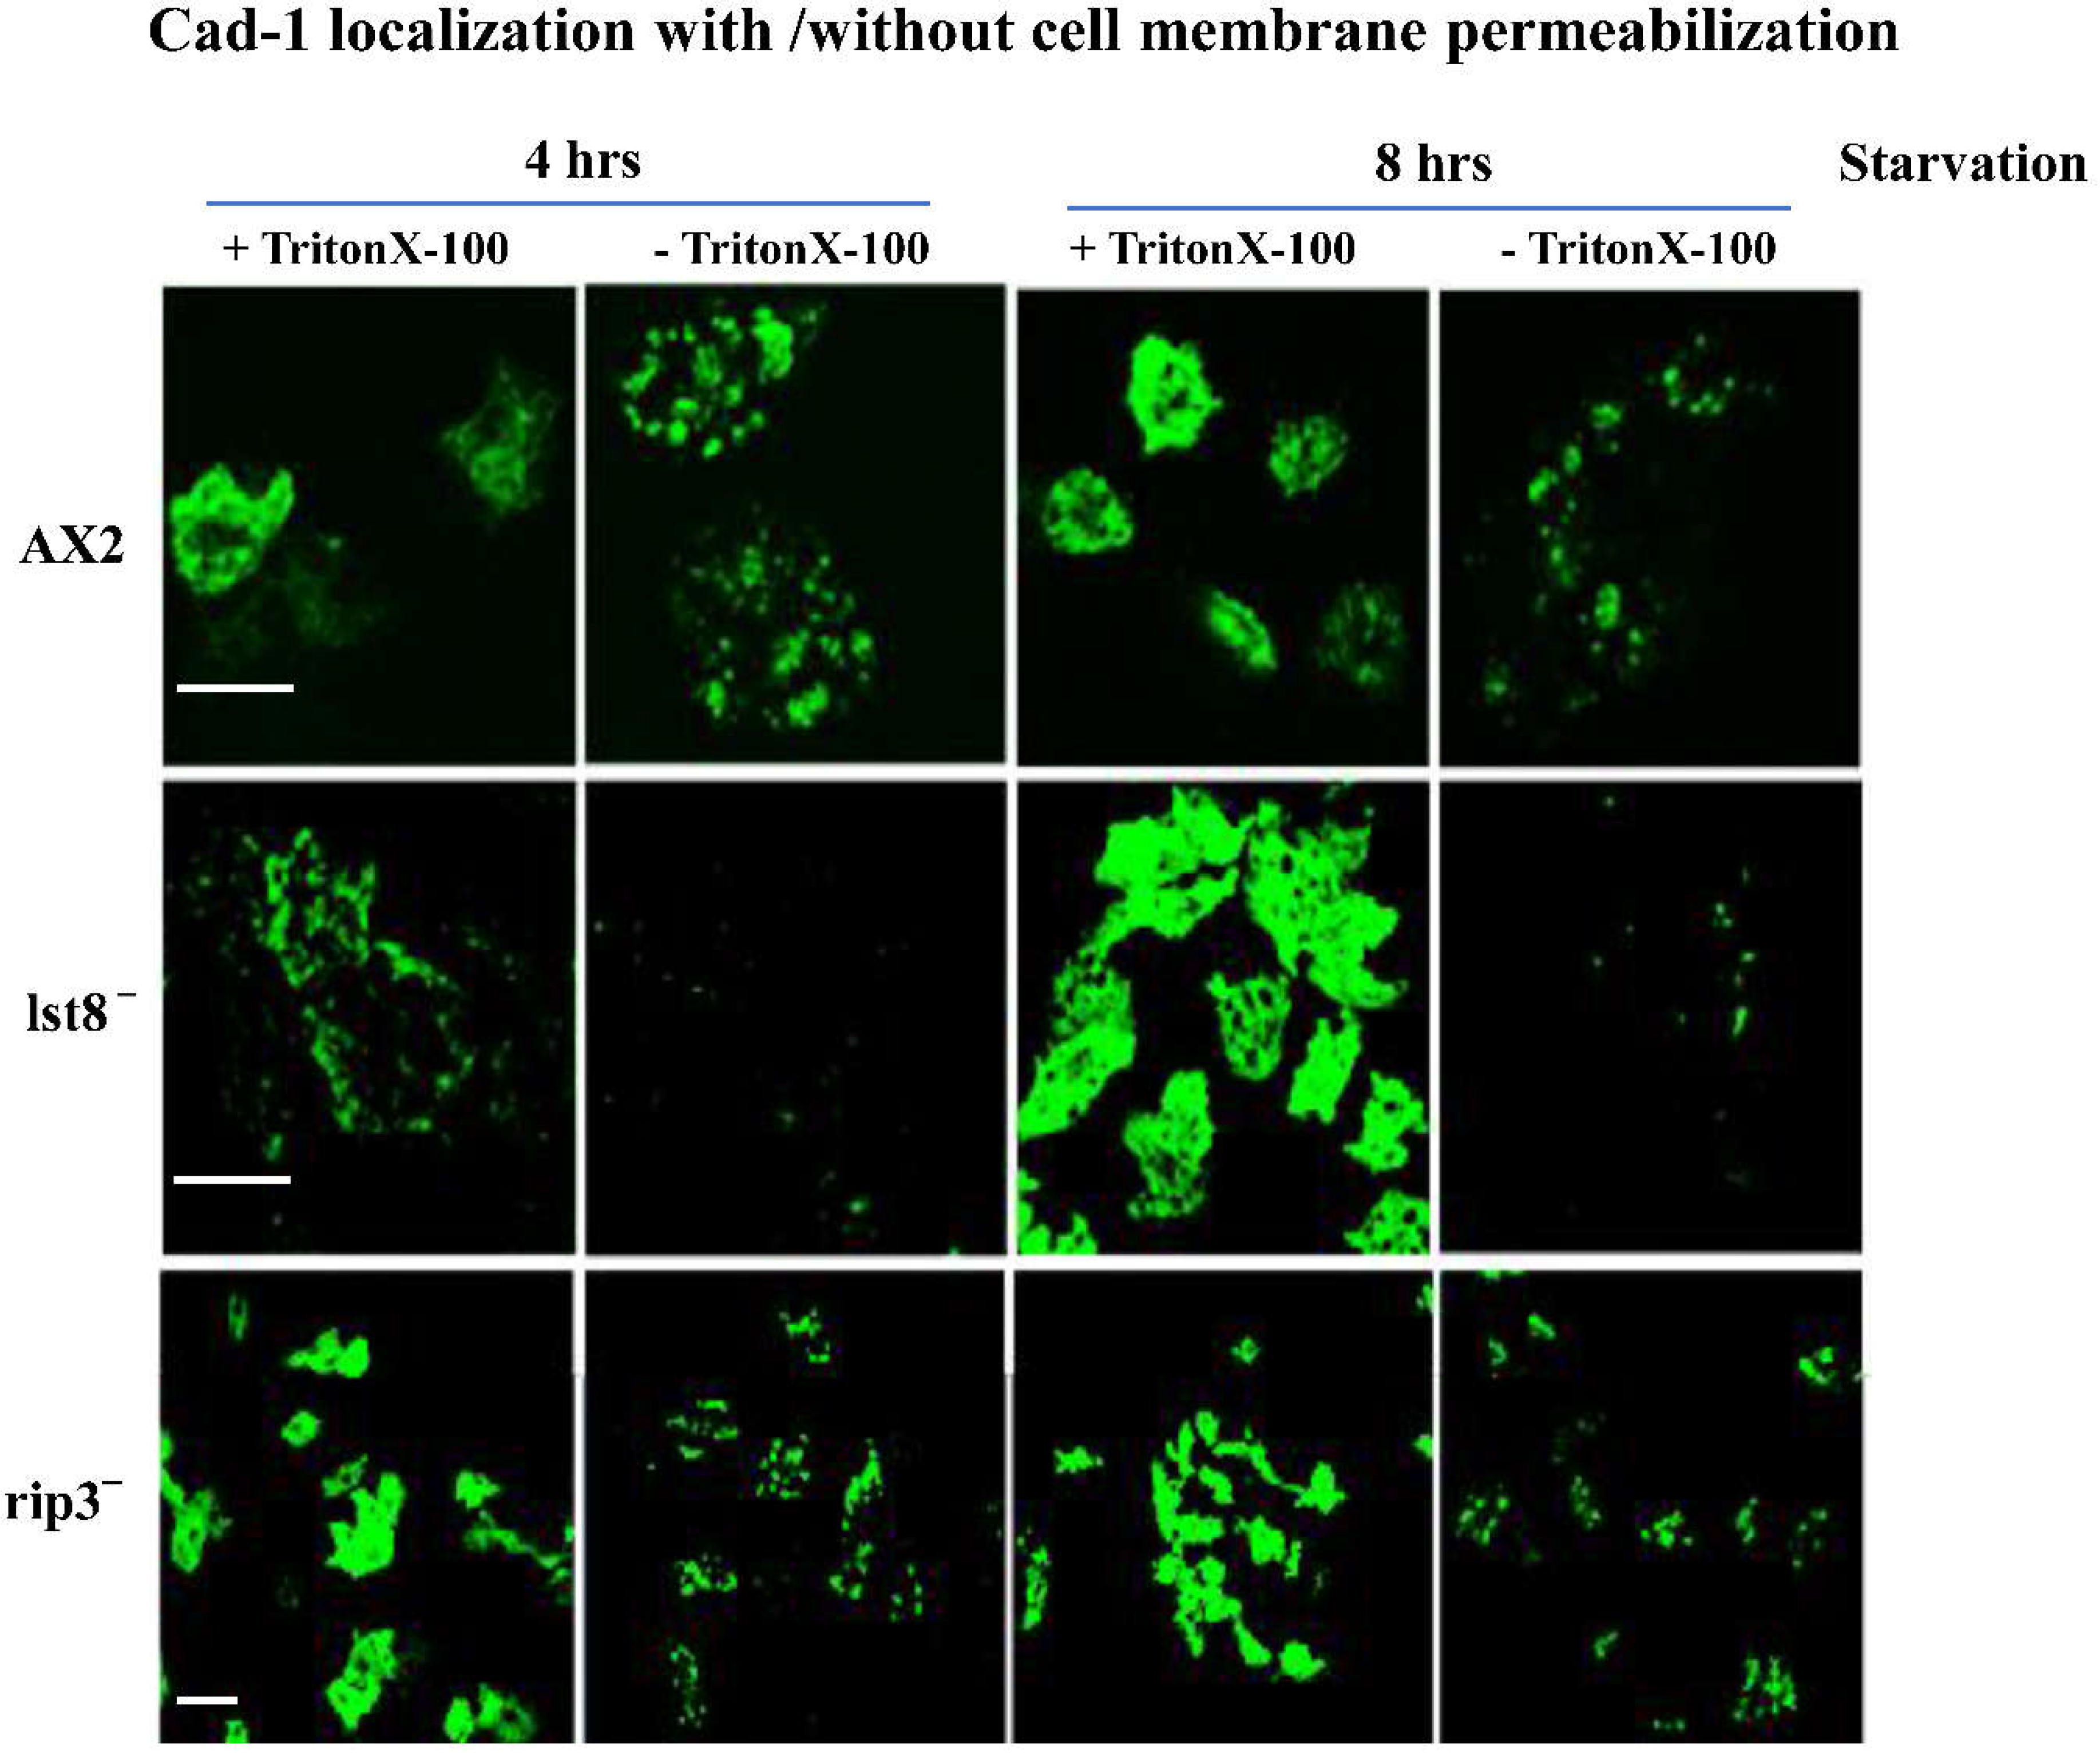
Both Cad-1 and CsaA proteins localized beneath the plasma membrane in lst-8- cells but its expression in AX2 cells could be seen at the cell surface (Figure 5). At 4h of starvation, the distribution of Cad-1 and CsaA in AX2 cells is throughout the cytoplasm and at 8h these proteins get transported to the cell surface. From early stages (4h) in lst-8- cells, both these proteins are beneath the cell surface and at 8h though the expression was high, there was no correct localization of the adhesion proteins to the cell surface. To confirm if there is a defective transport of cell adhesion proteins to the plasma membrane, we performed differential localization of Cad-1 proteins in cells by blocking permeability in a batch of cells fixed with paraformaldehyde solution and comparing the results with cells permeabilized with Triton X-100 (Figure 6). In AX2 and rip3- cells, not permeabilized with Triton X-100, patches of Cad-1 presence were observed at the cell surface (Figure 6), while in lst-8- cells, no Cad-1 localization was visible (Figure 6). The absence of Cad-1 signals in non-permeabilized lst-8- cells may be due to defective Cad-1 transport from a cytoplasmic pool to the cell surface.

Discussion

mTORC2 (Target of Rapamycin Complex -2) mediates the synthesis and relay of cAMP [11,15,16,22]. Activation of mTORC2 depends on heterotrimeric G- protein function and intermediate G-proteins, including Ras GTPases [23,24,25]. rip3- and lst-8- cells are unable to activate aggregation stage specific adenyl cyclase in response to chemoattractant stimulation [16,18]. Our Western blot studies show the absence of CsaA expression in rip-3- cells, which can be due to inhibition of adenyl cyclase and weak cAMP signal relay. The inductions of Cad-1 protein expression are independent of cAMP response and hence rip-3- cells (impaired mTORC2 activity) compensate the loss of CsaA by expressing higher levels of Cad-1 proteins. Phosphorylation of Cad-1 is regulated by Ras GTPases and influences Dictyostelium cell-cell adhesion [26]. Ras-GTP/RIP-3 interaction is essential for normal RIP- 3/mTORC2 function [16] and loss of rip-3 or mTOR kinase activity could result in hyper-phosphorylation of Cad-1 proteins by Ras-GTPase. The mTOR signaling cascade regulates gene expression in response to nutrient stress [27]. Caffeine affects growth and development of Dictyostelium by inactivating mTORC1 [4,28]. When Dictyostelium cells are grown for 12h in the presence of caffeine and developed in its absence, it induces early CsaA expression [4]. This indicates deficiency of nutrient sensing capability mediated by mTORC1. The expression of CsaA in early stages suggests precocious differentiation. Lst-8 is part of both mTORC1 and mTORC2 [29] and so lst8- cells may have both the complexes mTORC1 and mTORC2 inactivated. The early expression of CsaA in lst-8- cells may be because mTORC1 is inactivated, and hence nutrient sensing capability is limited, and the cells may go through developmental program earlier than wild type cells. Although lst-8- cells produce both the cell adhesion proteins Cad-1 and CsaA they remain solitary and do not participate in streaming and aggregate formation. Our earlier study showed [4] that the expression of CsaA is not detectable at 6h and 8h of development of Dictystelium AX2 cells in the presence of caffeine that result in delayed aggregation by 3-4 hours. These results corroborate with absence of CsaA in rip3- cells. Immuno-fluorescence staining reveals that lst-8- cells are defective in transport of these proteins to the cell surface to mediate cell adhesion. The defective of protein transport mechanism is independent of mTORC2 as rip3- mutants (inactive mTORC2) mimic wild type cells distribution of the proteins at the cell surface. lst-8- cells have a weak cAMP signal relay that is regulated by mTORC2.
Lst- 8 is also an essential unit for the activity of mTORC1 and regulating transcription of several genes involved in proteins trafficking. Caffeine may also be accompanying these effects via affecting the mTOR complexes. Caffeine is known to weaken the cAMP signal relay that could also be due to inhibition of mTORC2 activation as it regulates activity of adenyl cyclases [4,28,30]. Similar to lst-8- cells, caffeine (5-7 mM) may also be impairing cell adhesion proteins expression at cell surface that result in no aggregation. Weaken cAMP singal relay and impaired expression and localization of cell adhesion proteins (Cad-1 and CsaA) may result in inhibition of aggregates formation in the presence of caffeine. Process regulated by mTORC1 such as ribosome biogenesis is carried out by ribosomal proteins [11,31,32,33,34]. mTORC1 mediates transcription of ribosomal genes through all three RNA polymerases (I, II, and III; [32,35,36,37]. Inactivation of mTORC1 may affect the synthesis of proteins essential for transporting these cell adhesion molecules to the cell surface. In the future, caffeine’s effect on innate immunity can be pursued as it causes DNA damage. Innate immune responses are mediated through the cGAS and RIG-I pathways [38,39]. It can also be investigated whether mTOR kinases regulate cGAS and RIG-I pathways for immune responses against pathogens like Salmonella [40,41].

Conclusions

Our study highlights the essential roles of mTORC1 and mTORC2 in Dictyostelium discoideum multi-cell development. The absence of key components Lst-8 and RIP-3 impairs the synthesis and localization of cell adhesion proteins Cad-1 and CsaA, cAMP signal relay, cell-adhesion and proper aggregation. These findings underscore the critical interplay between mTORC1 and mTORC2 signaling pathways and cell adhesion mechanisms, providing valuable insights into the molecular regulation of multicellular development in D. discoideum.

References

  1. Beug, H.; Katz, F.E.; Gerisch, G. DYNAMICS OF ANTIGENIC MEMBRANE SITES RELATING TO CELL AGGREGATION IN DICTYOSTELIUM DISCOIDEUM. Journal of Cell Biology 1973, 56, 647–658. [Google Scholar] [CrossRef]
  2. Sriskanthadevan, S.; Zhu, Y.; Manoharan, K.; Yang, C.; Siu, C.-H. The cell adhesion molecule DdCAD-1 regulates morphogenesis through differential spatiotemporal expression in Dictyostelium discoideum. Development 2011, 138, 2487–2497. [Google Scholar] [CrossRef]
  3. Sesaki, H.; Siu, C.-H. Novel Redistribution of the Ca2+-Dependent Cell Adhesion Molecule DdCAD-1 during Development ofDictyostelium discoideum. Developmental Biology 1996, 177, 504–516. [Google Scholar] [CrossRef]
  4. Jaiswal, P.; Soldati, T.; Thewes, S.; Baskar, R. Regulation of aggregate size and pattern by adenosine and caffeine in cellular slime molds. BMC developmental biology 2012, 12, 1–19. [Google Scholar] [CrossRef] [PubMed]
  5. Siu, C.H.; Cho, A.; Choi, A.H. The contact site A glycoprotein mediates cell-cell adhesion by homophilic binding in Dictyostelium discoideum. J Cell Biol 1987, 105, 2523–2533. [Google Scholar] [CrossRef] [PubMed]
  6. Faix, J.; Gerisch, G.; Noegel, A.A. Overexpression of the csA cell adhesion molecule under its own cAMP-regulated promoter impairs morphogenesis in Dictyostelium. J Cell Sci 1992, 102 ( Pt 2), 203–214. [Google Scholar] [CrossRef]
  7. Müller, K.; Gerisch, G. A specific glycoprotein as the target site of adhesion blocking Fab in aggregating Dictyostelium cells. Nature 1978, 274, 445–449. [Google Scholar] [CrossRef]
  8. Meena, N.P.; Jaiswal, P.; Chang, F.-S.; Brzostowski, J.; Kimmel, A.R. DPF is a cell-density sensing factor, with cell-autonomous and non-autonomous functions during Dictyostelium growth and development. BMC biology 2019, 17, 1–21. [Google Scholar] [CrossRef]
  9. Clarke, M.; Gomer, R.H. PSF and CMF, autocrine factors that regulate gene expression during growth and early development of Dictyostelium. Experientia 1995, 51, 1124–1134. [Google Scholar] [CrossRef]
  10. Roisin-Bouffay, C.; Jang, W.; Caprette, D.R.; Gomer, R.H. A precise group size in Dictyostelium is generated by a cell-counting factor modulating cell-cell adhesion. Mol Cell 2000, 6, 953–959. [Google Scholar] [CrossRef]
  11. Jaiswal, P.; Kimmel, A.R. mTORC1/AMPK responses define a core gene set for developmental cell fate switching. BMC biology 2019, 17, 1–20. [Google Scholar] [CrossRef] [PubMed]
  12. Jaiswal, P. Caffeine and Rapamycin Impair Growth and Morphogenesis by Affecting Both TOR-Dependent Pathways in Dictyostelium. 2024.
  13. Jaiswal, P.; Majithia, A.R.; Rosel, D.; Liao, X.-H.; Khurana, T.; Kimmel, A.R. Integrated actions of mTOR complexes 1 and 2 for growth and development of Dictyostelium. International Journal of Developmental Biology 2019, 63, 521–527. [Google Scholar] [CrossRef] [PubMed]
  14. Jaiswal Pundrik, K.A.R. Nutrient/Starvation sensing for Reciprocal mTORC1/AMPK response in Dictyostelium, at the junction between Growth and Development. In Proceedings of the The FASEB Journal; 2018; p. 141. [Google Scholar]
  15. Jaiswal, P.; Meena, N.P.; Chang, F.-S.; Liao, X.-H.; Kim, L.; Kimmel, A. An Integrated, Cross-Regulation Pathway Model Involving Activating/Adaptive and Feed-Forward/Feed-Back Loops for Directed Oscillatory cAMP Signal-Relay/Response during the Development of Dictyostelium. Frontiers in Cell and Developmental Biology 2024, 11, 1263316. [Google Scholar] [CrossRef] [PubMed]
  16. Lee, S.; Comer, F.I.; Sasaki, A.; McLeod, I.X.; Duong, Y.; Okumura, K.; Yates, J.R.; Parent, C.A.; Firtel, R.A. TOR Complex 2 Integrates Cell Movement during Chemotaxis and Signal Relay in Dictyostelium. Molecular Biology of the Cell 2005, 16, 4572–4583. [Google Scholar] [CrossRef] [PubMed]
  17. Rosel, D.; Khurana, T.; Majithia, A.; Huang, X.; Bhandari, R.; Kimmel, A.R. TOR complex 2 (TORC2) in Dictyostelium suppresses phagocytic nutrient capture independently of TORC1-mediated nutrient sensing. J Cell Sci 2012, 125, 37–48. [Google Scholar] [CrossRef] [PubMed]
  18. Lee, S.; Parent, C.A.; Insall, R.; Firtel, R.A. A Novel Ras-interacting Protein Required for Chemotaxis and Cyclic Adenosine Monophosphate Signal Relay inDictyostelium. Molecular Biology of the Cell 1999, 10, 2829–2845. [Google Scholar] [CrossRef]
  19. Singh, S.P.; Dhakshinamoorthy, R.; Jaiswal, P.; Schmidt, S.; Thewes, S.; Baskar, R. The thyroxine inactivating gene, type III deiodinase, suppresses multiple signaling centers in Dictyostelium discoideum. Developmental biology 2014, 396, 256–268. [Google Scholar] [CrossRef]
  20. Hagedorn, M.; Rohde, K.H.; Russell, D.G.; Soldati, T. Infection by Tubercular Mycobacteria Is Spread by Nonlytic Ejection from Their Amoeba Hosts. Science 2009, 323, 1729–1733. [Google Scholar] [CrossRef]
  21. Jaiswal, P.; Singh, S.P.; Aiyar, P.; Akkali, R.; Baskar, R. Regulation of multiple tip formation by caffeine in cellular slime molds. BMC developmental biology 2012, 12, 1–14. [Google Scholar] [CrossRef]
  22. Senoo, H.; Kamimura, Y.; Kimura, R.; Nakajima, A.; Sawai, S.; Sesaki, H.; Iijima, M. Phosphorylated Rho–GDP directly activates mTORC2 kinase towards AKT through dimerization with Ras–GTP to regulate cell migration. Nature Cell Biology 2019, 21, 867–878. [Google Scholar] [CrossRef] [PubMed]
  23. Cai, H.; Katoh-Kurasawa, M.; Muramoto, T.; Santhanam, B.; Long, Y.; Li, L.; Ueda, M.; Iglesias, P.A.; Shaulsky, G.; Devreotes, P.N. Nucleocytoplasmic Shuttling of a GATA Transcription Factor Functions as a Development Timer. Science 2014, 343, 1249531. [Google Scholar] [CrossRef]
  24. Smith, S.F.; Collins, S.E.; Charest, P.G. Ras, PI3K and mTORC2 - three’s a crowd? J Cell Sci 2020, 133. [Google Scholar] [CrossRef]
  25. Fu, W.; Hall, M.N. Regulation of mTORC2 Signaling. Genes 2020, 11, 1045. [Google Scholar] [CrossRef]
  26. Secko, D.M.; Siu, C.H.; Spiegelman, G.B.; Weeks, G. An activated Ras protein alters cell adhesion by dephosphorylating Dictyostelium DdCAD-1. Microbiology (Reading) 2006, 152, 1497–1505. [Google Scholar] [CrossRef]
  27. Cardenas, M.E.; Cutler, N.S.; Lorenz, M.C.; Di Como, C.J.; Heitman, J. The TOR signaling cascade regulates gene expression in response to nutrients. Genes Dev 1999, 13, 3271–3279. [Google Scholar] [CrossRef]
  28. Tariqul Islam, A.F.M.; Scavello, M.; Lotfi, P.; Daniel, D.; Haldeman, P.; Charest, P.G. Caffeine inhibits PI3K and mTORC2 in Dictyostelium and differentially affects multiple other cAMP chemoattractant signaling effectors. Molecular and Cellular Biochemistry 2019, 457, 157–168. [Google Scholar] [CrossRef]
  29. Soulard, A.; Cohen, A.; Hall, M.N. TOR signaling in invertebrates. Curr Opin Cell Biol 2009, 21, 825–836. [Google Scholar] [CrossRef]
  30. Brenner, M.; Thoms, S.D. Caffeine blocks activation of cyclic AMP synthesis in Dictyostelium discoideum. Dev Biol 1984, 101, 136–146. [Google Scholar] [CrossRef]
  31. Powers, T.; Walter, P. Regulation of ribosome biogenesis by the rapamycin-sensitive TOR-signaling pathway in Saccharomyces cerevisiae. Mol Biol Cell 1999, 10, 987–1000. [Google Scholar] [CrossRef]
  32. Mayer, C.; Grummt, I. Ribosome biogenesis and cell growth: mTOR coordinates transcription by all three classes of nuclear RNA polymerases. Oncogene 2006, 25, 6384–6391. [Google Scholar] [CrossRef]
  33. Jiao, L.; Liu, Y.; Yu, X.-Y.; Pan, X.; Zhang, Y.; Tu, J.; Song, Y.-H.; Li, Y. Ribosome biogenesis in disease: new players and therapeutic targets. Signal Transduction and Targeted Therapy 2023, 8, 15. [Google Scholar] [CrossRef] [PubMed]
  34. Iadevaia, V.; Liu, R.; Proud, C.G. mTORC1 signaling controls multiple steps in ribosome biogenesis. Semin Cell Dev Biol 2014, 36, 113–120. [Google Scholar] [CrossRef]
  35. Papadopoli, D.; Boulay, K.; Kazak, L.; Pollak, M.; Mallette, F.A.; Topisirovic, I.; Hulea, L. mTOR as a central regulator of lifespan and aging. F1000Res 2019, 8. [Google Scholar] [CrossRef]
  36. Shor, B.; Wu, J.; Shakey, Q.; Toral-Barza, L.; Shi, C.; Follettie, M.; Yu, K. Requirement of the mTOR kinase for the regulation of Maf1 phosphorylation and control of RNA polymerase III-dependent transcription in cancer cells. J Biol Chem 2010, 285, 15380–15392. [Google Scholar] [CrossRef]
  37. Kantidakis, T.; Ramsbottom, B.A.; Birch, J.L.; Dowding, S.N.; White, R.J. mTOR associates with TFIIIC, is found at tRNA and 5S rRNA genes, and targets their repressor Maf1. Proc Natl Acad Sci U S A 2010, 107, 11823–11828. [Google Scholar] [CrossRef]
  38. Chauhan, S.; Jena, K.K.; Mehto, S.; Chauhan, N.R.; Sahu, R.; Dhar, K.; Yadav, R.; Krishna, S.; Jaiswal, P.; Chauhan, S. Innate immunity and inflammophagy: balancing the defence and immune homeostasis. The FEBS Journal 2022, 289, 4112–4131. [Google Scholar] [CrossRef]
  39. Bai, J.; Liu, F. The cGAS-cGAMP-STING Pathway: A Molecular Link Between Immunity and Metabolism. Diabetes 2019, 68, 1099–1108. [Google Scholar] [CrossRef]
  40. Mehto, S.; Jena, K.K.; Yadav, R.; Priyadarsini, S.; Samal, P.; Krishna, S.; Dhar, K.; Jain, A.; Chauhan, N.R.; Murmu, K.C. Selective autophagy of RIPosomes maintains innate immune homeostasis during bacterial infection. The EMBO Journal 2022, 41, e111289. [Google Scholar] [CrossRef]
  41. Tattoli, I.; Philpott, D.J.; Girardin, S.E. The bacterial and cellular determinants controlling the recruitment of mTOR to the Salmonella-containing vacuole. Biol Open 2012, 1, 1215–1225. [Google Scholar] [CrossRef]
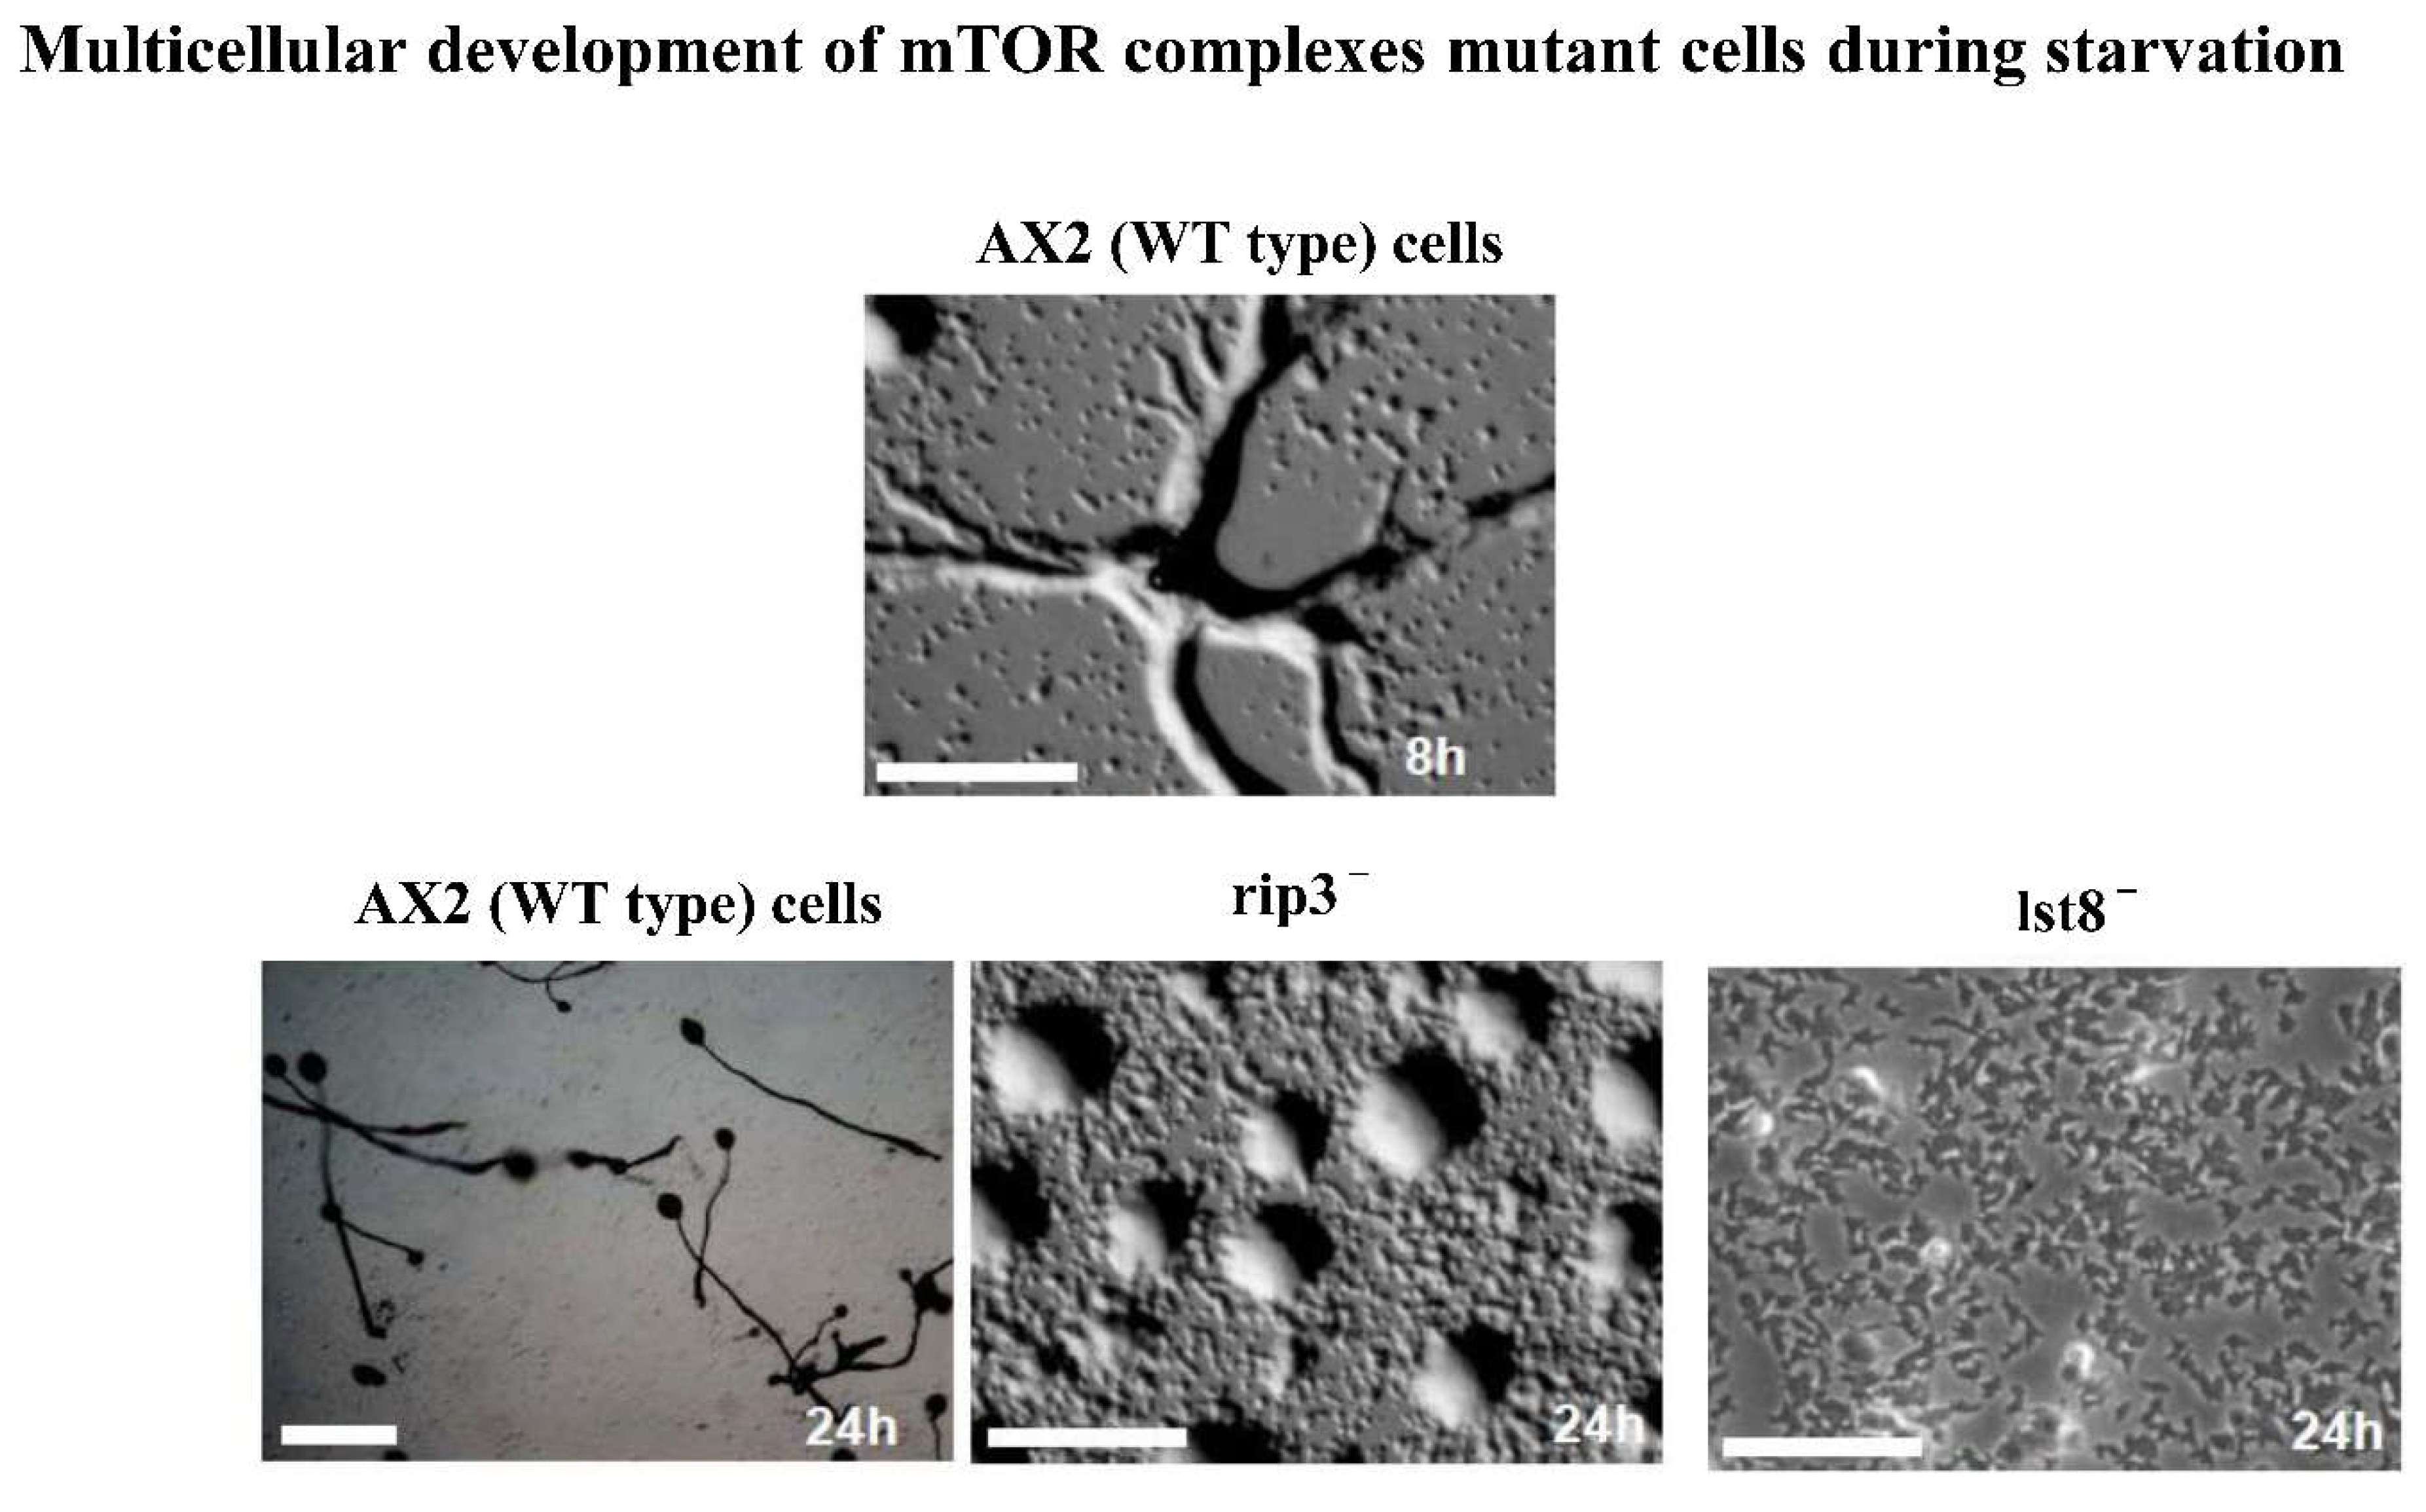
Figure 1. Altered development of Dictyostelium cells lesion in lst-8 and rip-3 genes. To score the development defect cells were placed on non-nutrient agar plate and aggregate formation was observed at mentioned time points. Scale bar = 200 μm.
Preprints 113859 g001
Figure 2. Development in the presence of caffeine: Developmental time course of AX2 cells. Control or treated with caffeine (3 and 5 mM) Scale bar = 1000 μM.
Preprints 113859 g002
Figure 3. Cell adhesion proteins Cad-1 and CsaA expression levels in WT and lst-8- cells. Expression levels of Cad-1 and CsaA in WT and lst-8- cells at 2h and 4h of development. Cad-1 expression is comparatively higher in lst-8- cells compared to wild type cells. CsaA expression seen in lst-8- cells at 2h and 4h development and this protein is which is not significantly expressed at the same time points in wild type cells.
Preprints 113859 g003
Figure 4. Cell adhesion proteins Cad-1 and CsaA expression levels in WT and rip3- cells. A) Expression levels of Cad-1 and CsaA in AX2 and rip3- cells at the mentioned time intervals of development. Expression levels of Cad-1 are higher in rip3- null cells compared to wild type cells. B) Expression levels of CsaA in AX2 and rip-3- cells at 6h, 8h, 12h, 18h and 24h of development. The CsaA expression in rip-3- cells was not seen during different time of development.
Preprints 113859 g004
Figure 5. Localization of Cad-1 and CsaA in AX2 and lst-8 deficient mutants. The cells were fixed in ultra freeze methanol and were stained with anti-CsaA monoclonal and anti-Cad-1 polyclonal antibodies followed by cy3 conjugated rabbit anti-mouse and alexa 488 goat anti rabbit secondary antibodies. Localization of Cad-1 and CsaA is altered in lst-8- cells which could possibly be attributed to impaired transport of these proteins to the cell surface. The images were obtained from confocal LeicaTMSP2 laser scanning microscope. Scale bar= 10µm.
Preprints 113859 g005
Figure 6. Differential localization of Cad-1 expression in AX2, lst-8- and rip3- cells. The cells were fixed in paraformaldehyde solution (4%). The cells were permeabilized using Triton X-100 and were stained with anti-Cad-1 polyclonal antibody followed alexa 488 goat anti-rabbit secondary antibodies. The localization of these cell adhesion proteins to the cell surface is impaired in lst-8- cells. lst-8- cells not treated with Triton X-100 show no expression of Cad-1. The images were obtained using confocal LeicaTM SP2 laser scanning microscope. Scale bar= 10µm..
Preprints 113859 g006
Disclaimer/Publisher’s Note: The statements, opinions and data contained in all publications are solely those of the individual author(s) and contributor(s) and not of MDPI and/or the editor(s). MDPI and/or the editor(s) disclaim responsibility for any injury to people or property resulting from any ideas, methods, instructions or products referred to in the content.
Copyright: This open access article is published under a Creative Commons CC BY 4.0 license, which permit the free download, distribution, and reuse, provided that the author and preprint are cited in any reuse.
Prerpints.org logo

Preprints.org is a free preprint server supported by MDPI in Basel, Switzerland.

Subscribe

© 2024 MDPI (Basel, Switzerland) unless otherwise stated