1. Introduction
The threat of hydrometeorological disasters such as floods is the most frequent and most dynamic disaster threat in Indonesia. One of the provinces that experienced flooding was Riau Province with exposure to the risk of flood disasters with a social impact of 6,009,366 people, physical risk of Rp 10.75 trillion, risk of economic loss Rp 32.85 trillion and environmental risk of 726,422 hectares [
1].
The conflict of interest between economic interests and environmental sustainability is increasingly exacerbated by the paradigm that economic interests and environmental sustainability are things that cannot possibly be reconciled. In fact, both economics and environmental sustainability both have a close reciprocal relationship and both must often be carried out simultaneously [
2].
Flood disasters are a problem that arises every year in Pekanbaru City. A number of roads include Jenderal Sudirman Street, Riau Street, Bintara Street, Arifin Ahmad Street, K.H Nasution Street, HR. Suburban Street areas and residential areas are not spared from waterlogging and this becomes an obstacle to residents' activities, which has an impact on economic activities in Pekanbaru City. Flooding due to overflowing drainage during heavy rain disrupts access and submerges residential areas and economic facilities [
3].
The area of flood inundation in Pekanbaru City reached 291 Ha, the number of people exposed was 353,133 people and economic losses reached 592.51 billion. Pekanbaru City's flood disaster risk index is included in the high-risk class with a score of 36.00 [
1]. There are at least 113 points of inundation and 375 problems or causes of flooding that need to be addressed [
4].
The areas most affected by the Pekanbaru City flood are areas within the Sail River Watershed. The Sail Watershed has an important role in supporting the development of Pekanbaru City. About a third of the area of Pekanbaru City, the southern part of the Siak River, flows into the Sail Watershed [
4]. The population distribution of Pekanbaru City in the districts crossed by the Sail River is 327 thousand people or around 33.27% of the total population of Pekanbaru City [
5]. The watershed in the southern part of Pekanbaru City which is a priority for flood management is the Sail Watershed.
The flooding phenomenon in Pekanbaru City is an interrelated problem between social, economic and environmental problems. Based on the results of the identification and formulation of priority sustainable development issues Strategic Environmental Study of Pekanbaru City Spatial Planning for 2020-2040, three of the five priority development problems are the causes of flooding in Pekanbaru City, including: decreasing groundwater availability and river quality, not yet optimal drainage systems for controlling floods/puddles and reduced water absorption region. Another factor that is no less important in causing flooding is socio-economic factors. The socio-economic problem that causes floods every year in Pekanbaru City is waste management. The waste management system in the Sail Watershed area still depends on the local government, relying on the old system, namely transporting waste directly to the Final Processing Site in Muara Fajar. Another socio-economic problem is the behavior of using water for daily needs, bathing, washing toilets, and other uses. Formation of socio-hydraulic character (water culture) or a culture of understanding water also plays a role in environmental management. External factors that cause flooding in river basins include land use, waste disposal behavior, slum areas, flood control system planning, drainage maintenance, distance of buildings to rivers and backflow (back water) [
6]. Appropriate spatial planning by involving the important role of the community is a reason to conduct a study on the Influence of Spatial Planning and Community Behavior on Flood Control in the Sail Watershed, Pekanbaru City.
2. Materials and Methods
The location of this research is in the Sail Watershed area including Tanjung Rhu Village and Sekip Village (Limapuluh District), Tangkerang Utara Village, Simpang Tiga Village, and Tangkerang Labuai Village (Bukit Raya District), Sukamaju Village and Sukamulia Village (Sail District), Bambu Kuning Village, Sialang Sakti Village, East Tangkerang Village, and Rejosari Village (Tenayan Raya District), Pematang Kapau Village, Pebatuan Village, and Sialang Rampai Village (Kulim District). The research time is January 2022 to June 2023.
The research approach used is a combination of qualitative and quantitative (Mixed Method). The analytical method in this research uses a qualitative descriptive method, and quantitative data analysis. Analysis of spatial planning in flood areas of Pekanbaru City was carried out using quantitative data analysis. This analysis uses ArcGIS with overlap analysis (overlay) called a spatial analysis that combines two thematic inputs of land use changes in the planning area over a period of fifteen years (2007-2022). The analysis was carried out by calculating several spatial planning indicators including land use (proportion of built-up and non-built areas), area of green open space (RTH), building density, distance of buildings to rivers and length of drainage channels. Analysis of the characteristics of people's behavior using descriptive analysis techniques. Analyzing the characteristics of community behavior of 225 respondents regarding waste management, including habits of throwing away waste, behavior of sorting waste, behavior of processing and/or recycling waste, habit of carrying their own shopping bags and treatment of used goods suitable for use. Water use behavior that are analyzed including clean water sources, water use behavior when washing, use of used water and the presence of plants/absorption areas. The strategy analysis is carried out using Participatory Prospective Analysis (PPA). Prospective analysis in this study was used to determine the dominant variables that influence strategy determination. The prospective method is a tool used for policy analysis, especially in research involving sustainable development, because it can facilitate the anticipation of change in an unstable environment.
3. Results
3.1. Behavioral Characteristics of Waste Management and Water Utilization in the Sail Watershed, Pekanbaru City
3.1.1. Waste Management Behavior
The waste management system still depends on local governments, relying on the old system called transporting waste directly to the final processing site (
Table 1).
From 225 respondents, it was found that 189 respondents or 84% disposed of waste at Temporary Disposal Site and Final Processing Site. Generally, waste is transported by waste officers from house to house to be taken to the Temporary Disposal Site, and the public pays a waste fee to the waste manager in the range of Rp. 10,000,- to Rp. 35,000,- per month. Meanwhile, 36 respondents did not throw rubbish into the Temporary Disposal Site. It is because where the community lives there is no Temporary Disposal Site and it is also not serviced by waste transportation.
Furthermore, waste sorting behavior is carried out for easily decomposable/organic and inorganic waste. It was discovered that 155 respondents or 68.8% of people's behavior in waste sorting sorted easily decomposable/organic and inorganic waste, and 70 respondents or 31.2% did not separate easily decomposable/organic and inorganic waste. Waste management that is currently considered the most effective is by sorting waste according to its type, they are organic, inorganic, and residual waste, each type of which requires different actions. Waste sorting behavior is related to environmental concern [
7]. Environmental concern can encourage individuals to sort and recycle waste. Waste sorting behavior is related to the physical and social environmental conditions of the community as an external factor, so it is necessary to strengthen policies, provide facilities and involve the community in changing behavior [
8].
Environmental awareness can be increased with waste management counseling which will provide individuals with increased awareness, knowledge, skills, values and experience to solve environmental problems including waste management.
Furthermore, there is still minimal community behavior to process and/or recycle waste by making compost/fertilizer which are only 27 and 37 respondents respectively. Recycling activities can be carried out by collecting, processing and converting waste into new materials or products that can be used. This is still minimally implemented due to the lack of supporting infrastructure.
The habit of carrying your own shopping bag is generally done when shopping at traditional markets. The reasons why people bring their own shopping bags are because they feel it is more comfortable and simpler, they feel they don't need to bother with lots of plastic bags, and they feel they need to reduce waste. Another reason is that paid plastic has been implemented in several shopping centers. Principle reuses namely considering items before they are thrown away and estimating their possibility of being reused (
Table 2).
The community is reusing other waste by reusing plastic mineral water bottles for drinking bottles and/or as a place to store cleaning fluids. Used clothing that is still fit for use can be donated, as can other things such as books and furniture that has been replaced because it is bored or slightly damaged. Apart from reducing waste, these items can also be useful for other people. The need to provide understanding to the public regarding environmental concerns, especially regarding household waste management and water conservation for a future based on water conservation [
9].
3.2.2. Water Use Behavior
Water availability is important as recharge area in an area will guard stability of water supply. Currently, residents of Pekanbaru City tend to depend on well water to meet their clean water needs. In the research area, people's daily water needs are met from wells, drilled wells, springs, PDAM and buying from the private sector. A total of 218 respondents used clean water sources from drilled wells and dug wells or 96.9%. In meeting water needs, 149 households (66.2%) received water from one source, 69 households (30.7%) received water from two sources. An increase in population will increase underground water extraction continuously and can cause land subsidence (land subsidence). Furthermore, land subsidence has an impact on increasing the risk of flooding [
10].
The behavior of using water when washing, including washing utensils, washing vegetables and fruit and washing clothes, the majority of respondents used flowing water when washing, respectively 145 respondents (64.4%) and 150 respondents (66.7%). Using flowing water is more wasteful than using collected water because when using flowing water, it is difficult to control the amount of water used, some taps with flowing water are designed without considering efficiency and the inability to stop the flow of water easily and causes unnecessary water waste. However, in terms of water use when washing clothes, there have been efforts to use collected water. Using collected water in certain containers such as buckets or basins can make it easier to control the amount of water used. There are habits that are more efficient in using water, such as turning off the tap when not in use, using a tap with a water saving feature.
Furthermore, the use of used water is not yet popular among the public. In the research area, only 5 household respondents or 2.2% used used water. Used water is generally used for washing rice, vegetables and fruit for watering plants, while water used for ablutions and washing clothes is used for washing bathrooms. Water conservation efforts from the use of used water can contribute to sustainable water resource management. Behavior, norms and habits play an important role in determining people's water saving patterns and habits are a factor in determining people's water saving behavior [
11]. So, changing people's habits is an important component in managing water demand in cities. People living in villages are more concerned about saving water use than those in cities [
12]. The influencing factors are family education patterns, lack of access to domestic water, and socialization of the importance of clean water. This research also recommends a processing system of grey water to reduce water use and increase water reuse.
Table 4.
Water utilization infrastructure.
Table 4.
Water utilization infrastructure.
| Description |
Category |
Frequency |
Percentage |
| Availability of infiltration/bio pores |
Not available |
128 |
56,9 |
| Available |
97 |
43,1 |
| Total |
225 |
100,0 |
| Availability of rainwater storage |
Not available |
129 |
57,3 |
| Available |
96 |
42,7 |
| Total |
225 |
100,0 |
| Availability of garden plants at home |
Not available |
27 |
12,0 |
| Available |
198 |
88,0 |
| Total |
225 |
100,0 |
One of the reasons for flooding that often occurs when the intensity of rain is high is the reduction in water catchment areas, so the availability of catchments/bio pores is an effort to overcome the flood problem where the availability of bio pores is 43.1%. The presence of bio pores can increase water absorption into the soil to reduce flooding and improve the quality of the soil around where the bio pores are installed. Furthermore, as many as 198 households or 88% have plants in their yards. This is because plants are able to absorb water, the more vegetation there is, the higher the absorption of water into the soil so that it can minimize flooding.
3.2. Spatial Planning Strategy and Community Behavior to Control Floods in the Sail Watershed, Pekanbaru City
3.2.1. Identify Variables’ Status
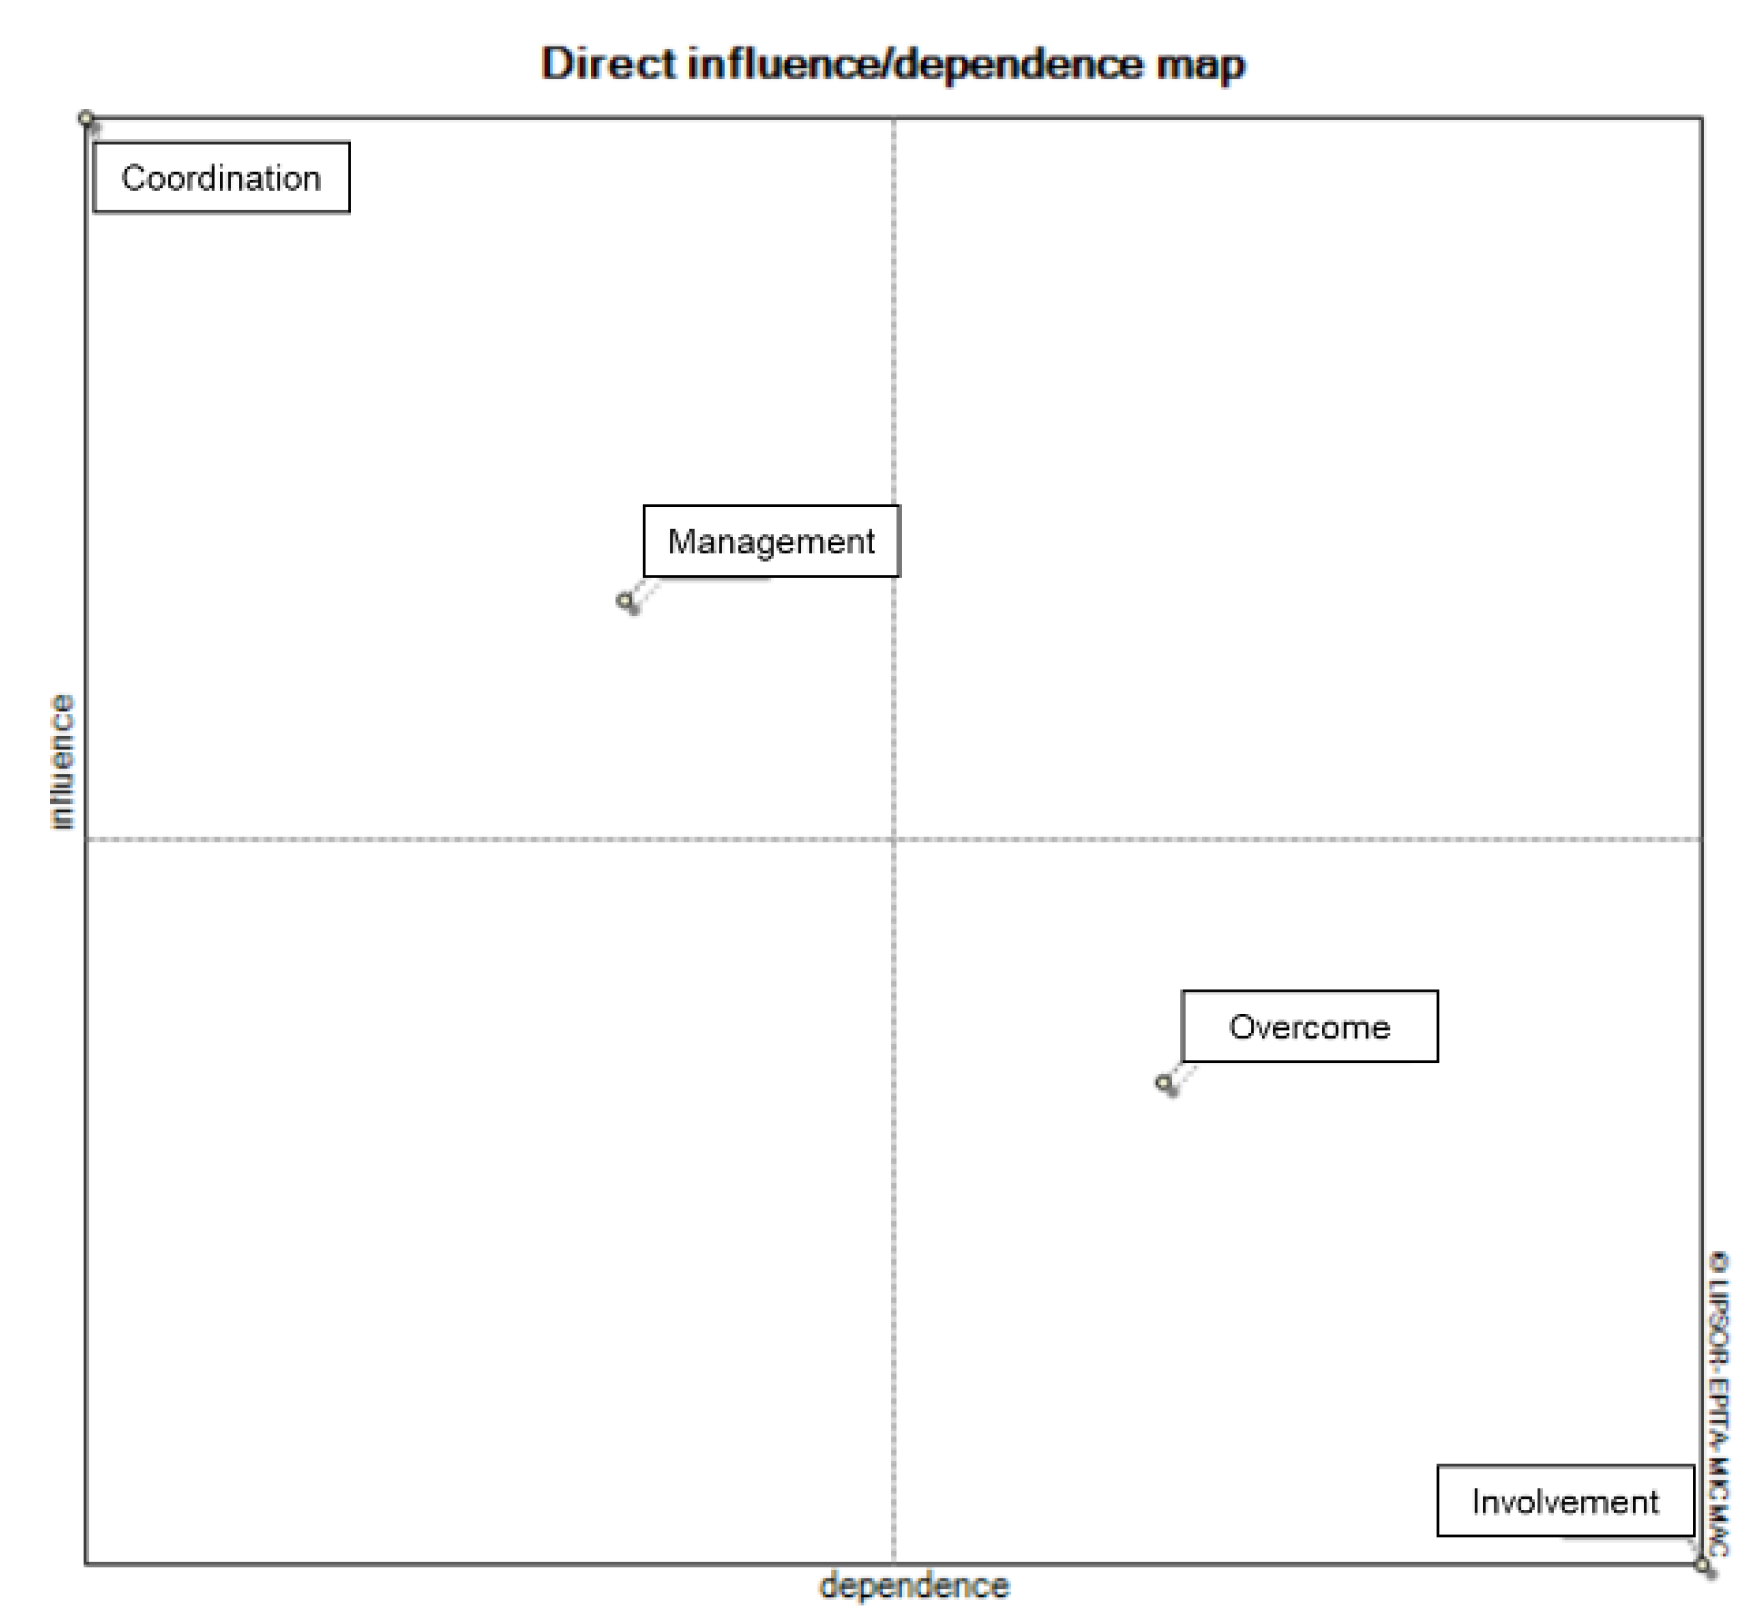
The first interpretation of the results is to identify variables. The variables in micmac are divided into four, called the access variable (supply) di quadrant I, stakes (relay) in quadrant II, output in quadrant III, and autonomous in quadrant IV. The horizontal axis describes the level of dependency scale, while the vertical axis describes the level of influencing ability.
Figure 1.
Direct map influence/dependence.
Figure 1.
Direct map influence/dependence.
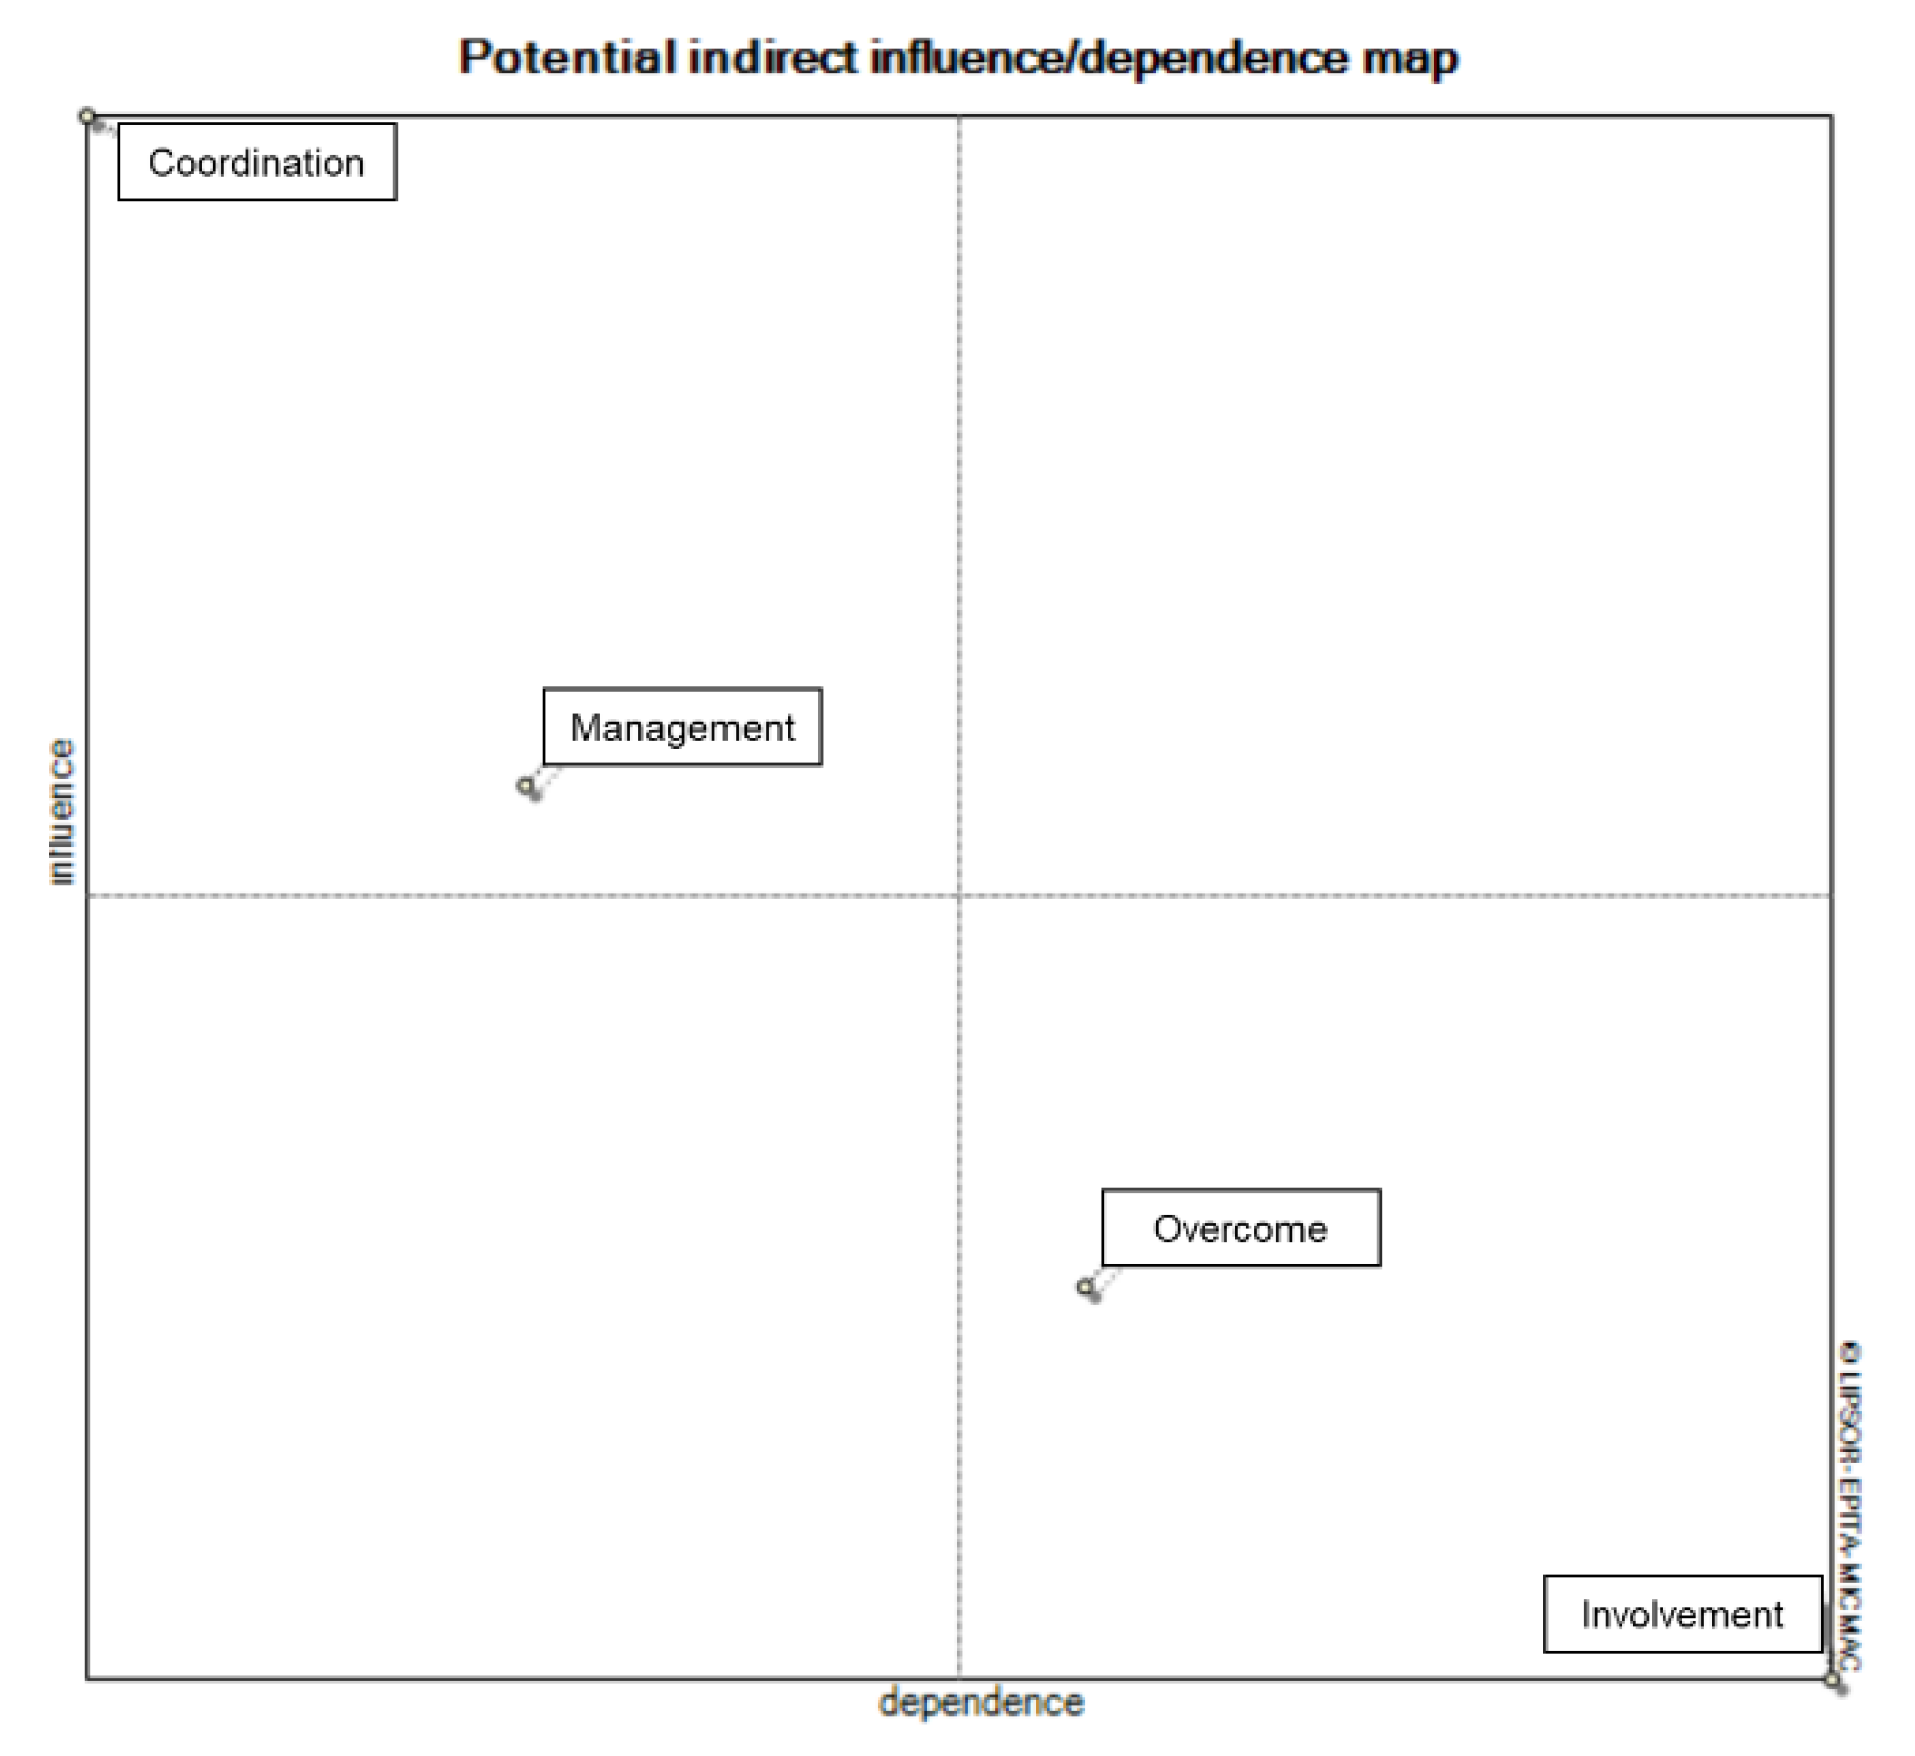
Access variable position (supply) in quadrant I or upper left, variable stakes (relay) in quadrant II or upper right, variable output in quadrant III or lower right, and variable autonomous in quadrant IV or lower left. This classification is based on the high or low level of dependence and its influence on other variables. Key variables are variables stakes (relay) because its function is to deliver input variables to output.
Analysis results direct map influence/dependence explains there is no variable in the variable position stakes (relay) or top right and variables autonomous in the bottom left position. Coordination and management variables in access positions (supply) or top left, overcome variables and involvement in position output or bottom right. The micmac output in direct status refers to existing conditions, while indirect status refers to forecasting or future conditions. Analysis results indirect map explains the shift in the position of the managed and involved variables which appear to be more in quadrant I. Overall there is no very sharp difference between direct and indirect map.
Figure 2.
Indirect map influence/dependence.
Figure 2.
Indirect map influence/dependence.
3.2.2. Policy Making
Making policy based on the results of this micmac can be seen by looking the Matrix of Potential Direct Influences (MPDI) and Matrix of Potential Indirect Influences (MPII). The two are distinguished by words direct (present) and indirect (future/forecast). Reading this output is the same as Matrix of Direct Influences (MDI) or Matrix of Indirect Influences (MII), the only difference is in MPDI and MPII, micmac has sorted the most important variables from highest to lowest values. The results are obtained from MDI and MII with a tendency to change due to given iterations both in the present and in the future.
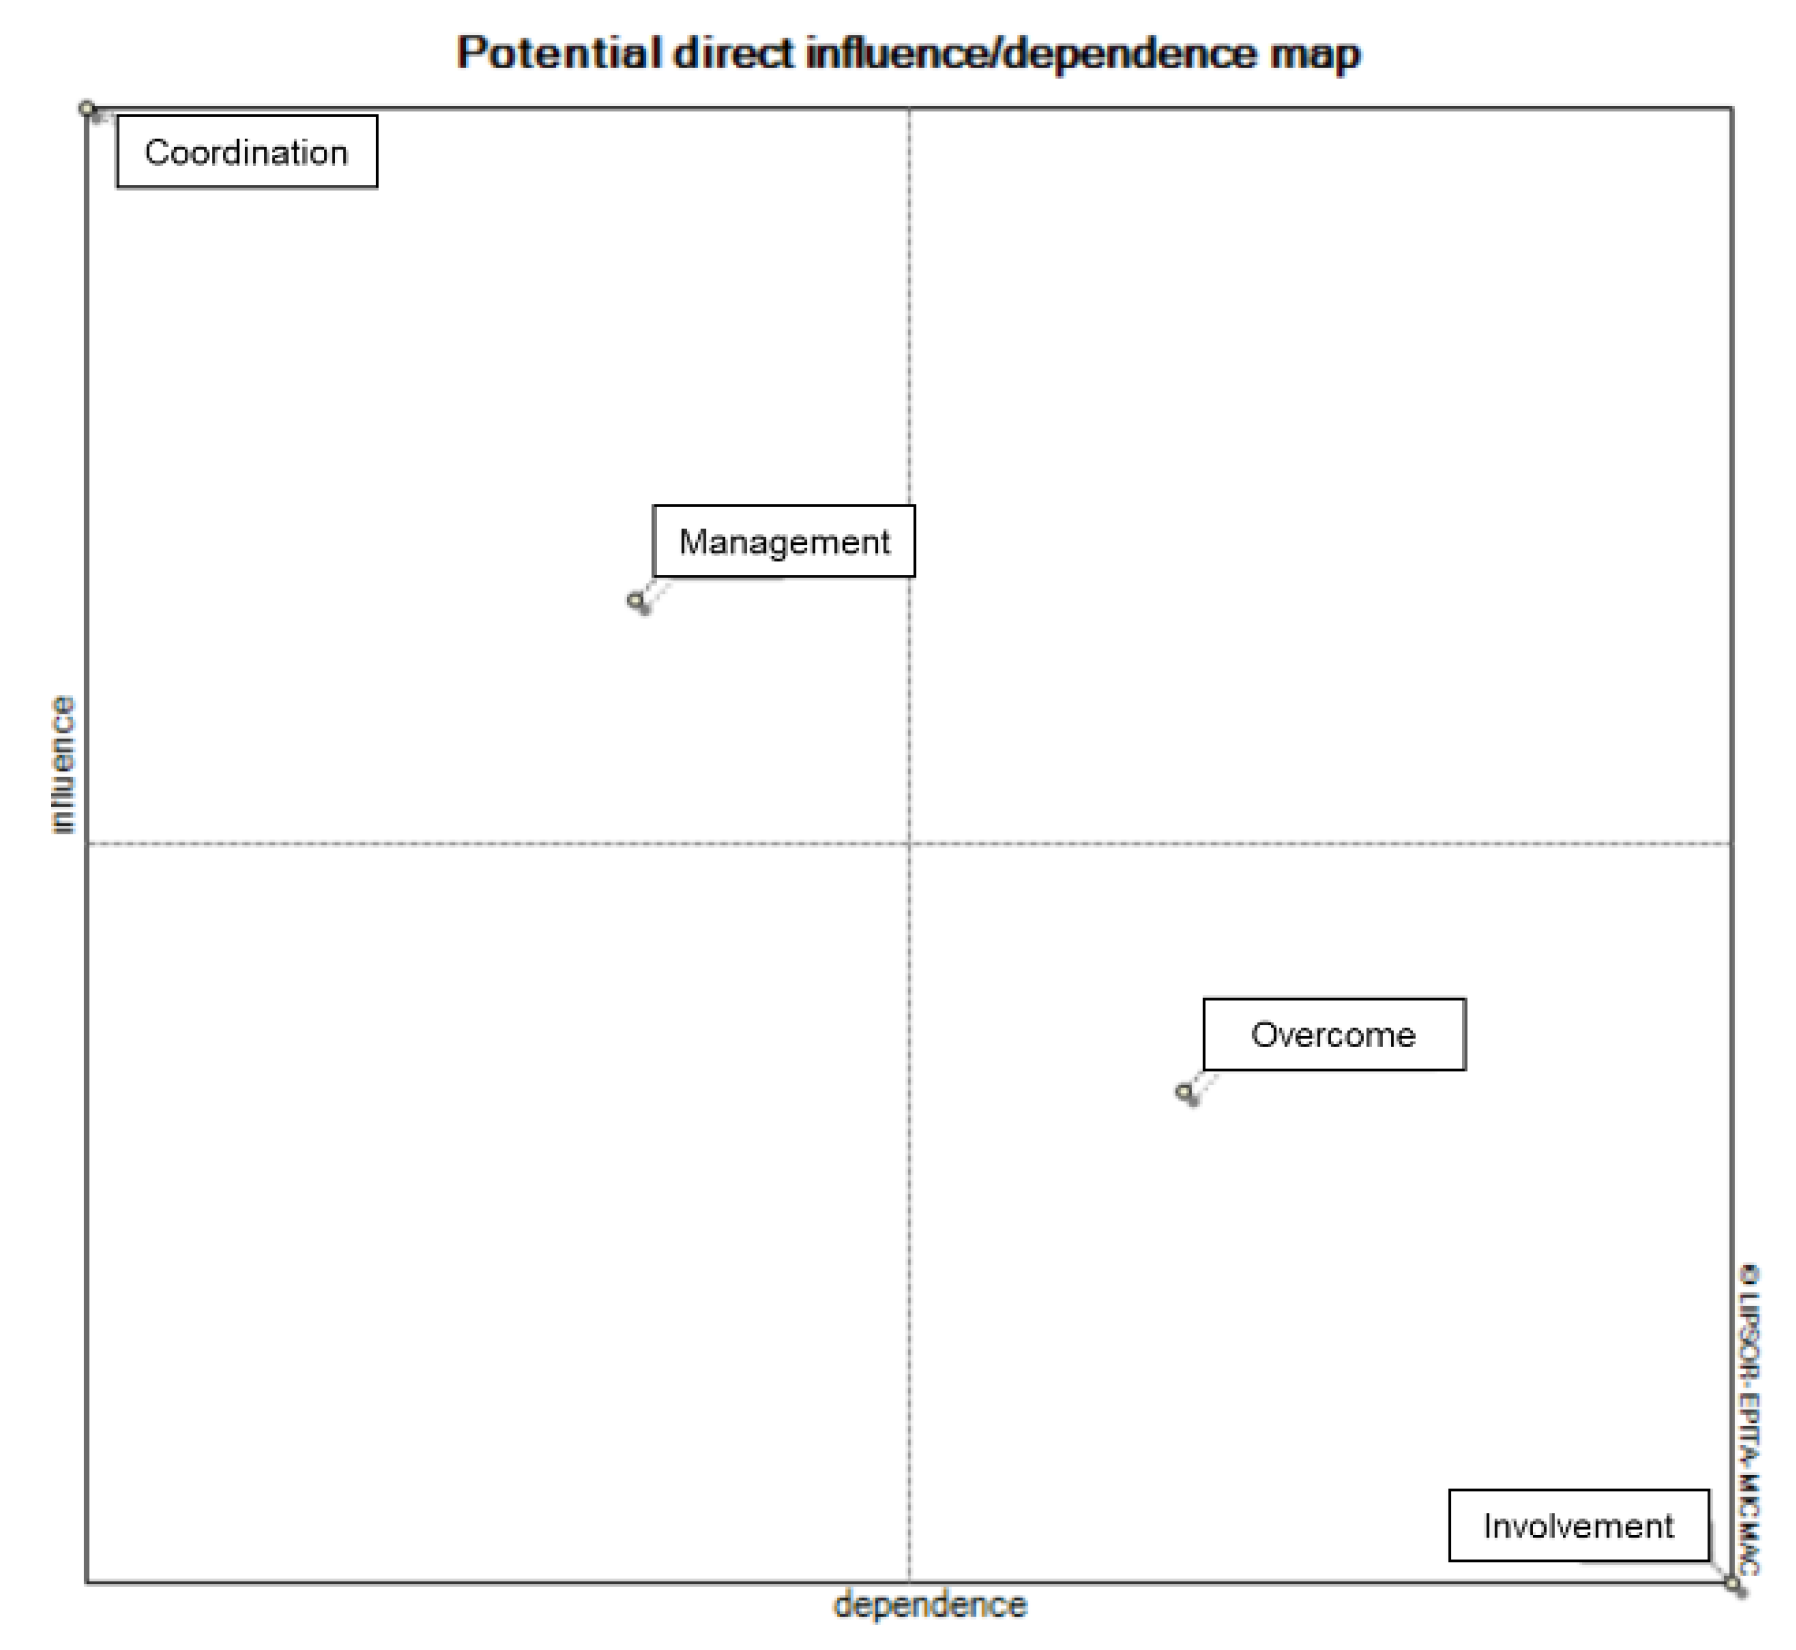
Analysis results potential direct map influence/dependence in
Figure 3 explains that there are no variables in the variable position stakes (relay) or top right and variables autonomous in the bottom left position. Variables coordinate, management, and involvement in access positions (supply) or top left, and overcome variables in position output or lower right.
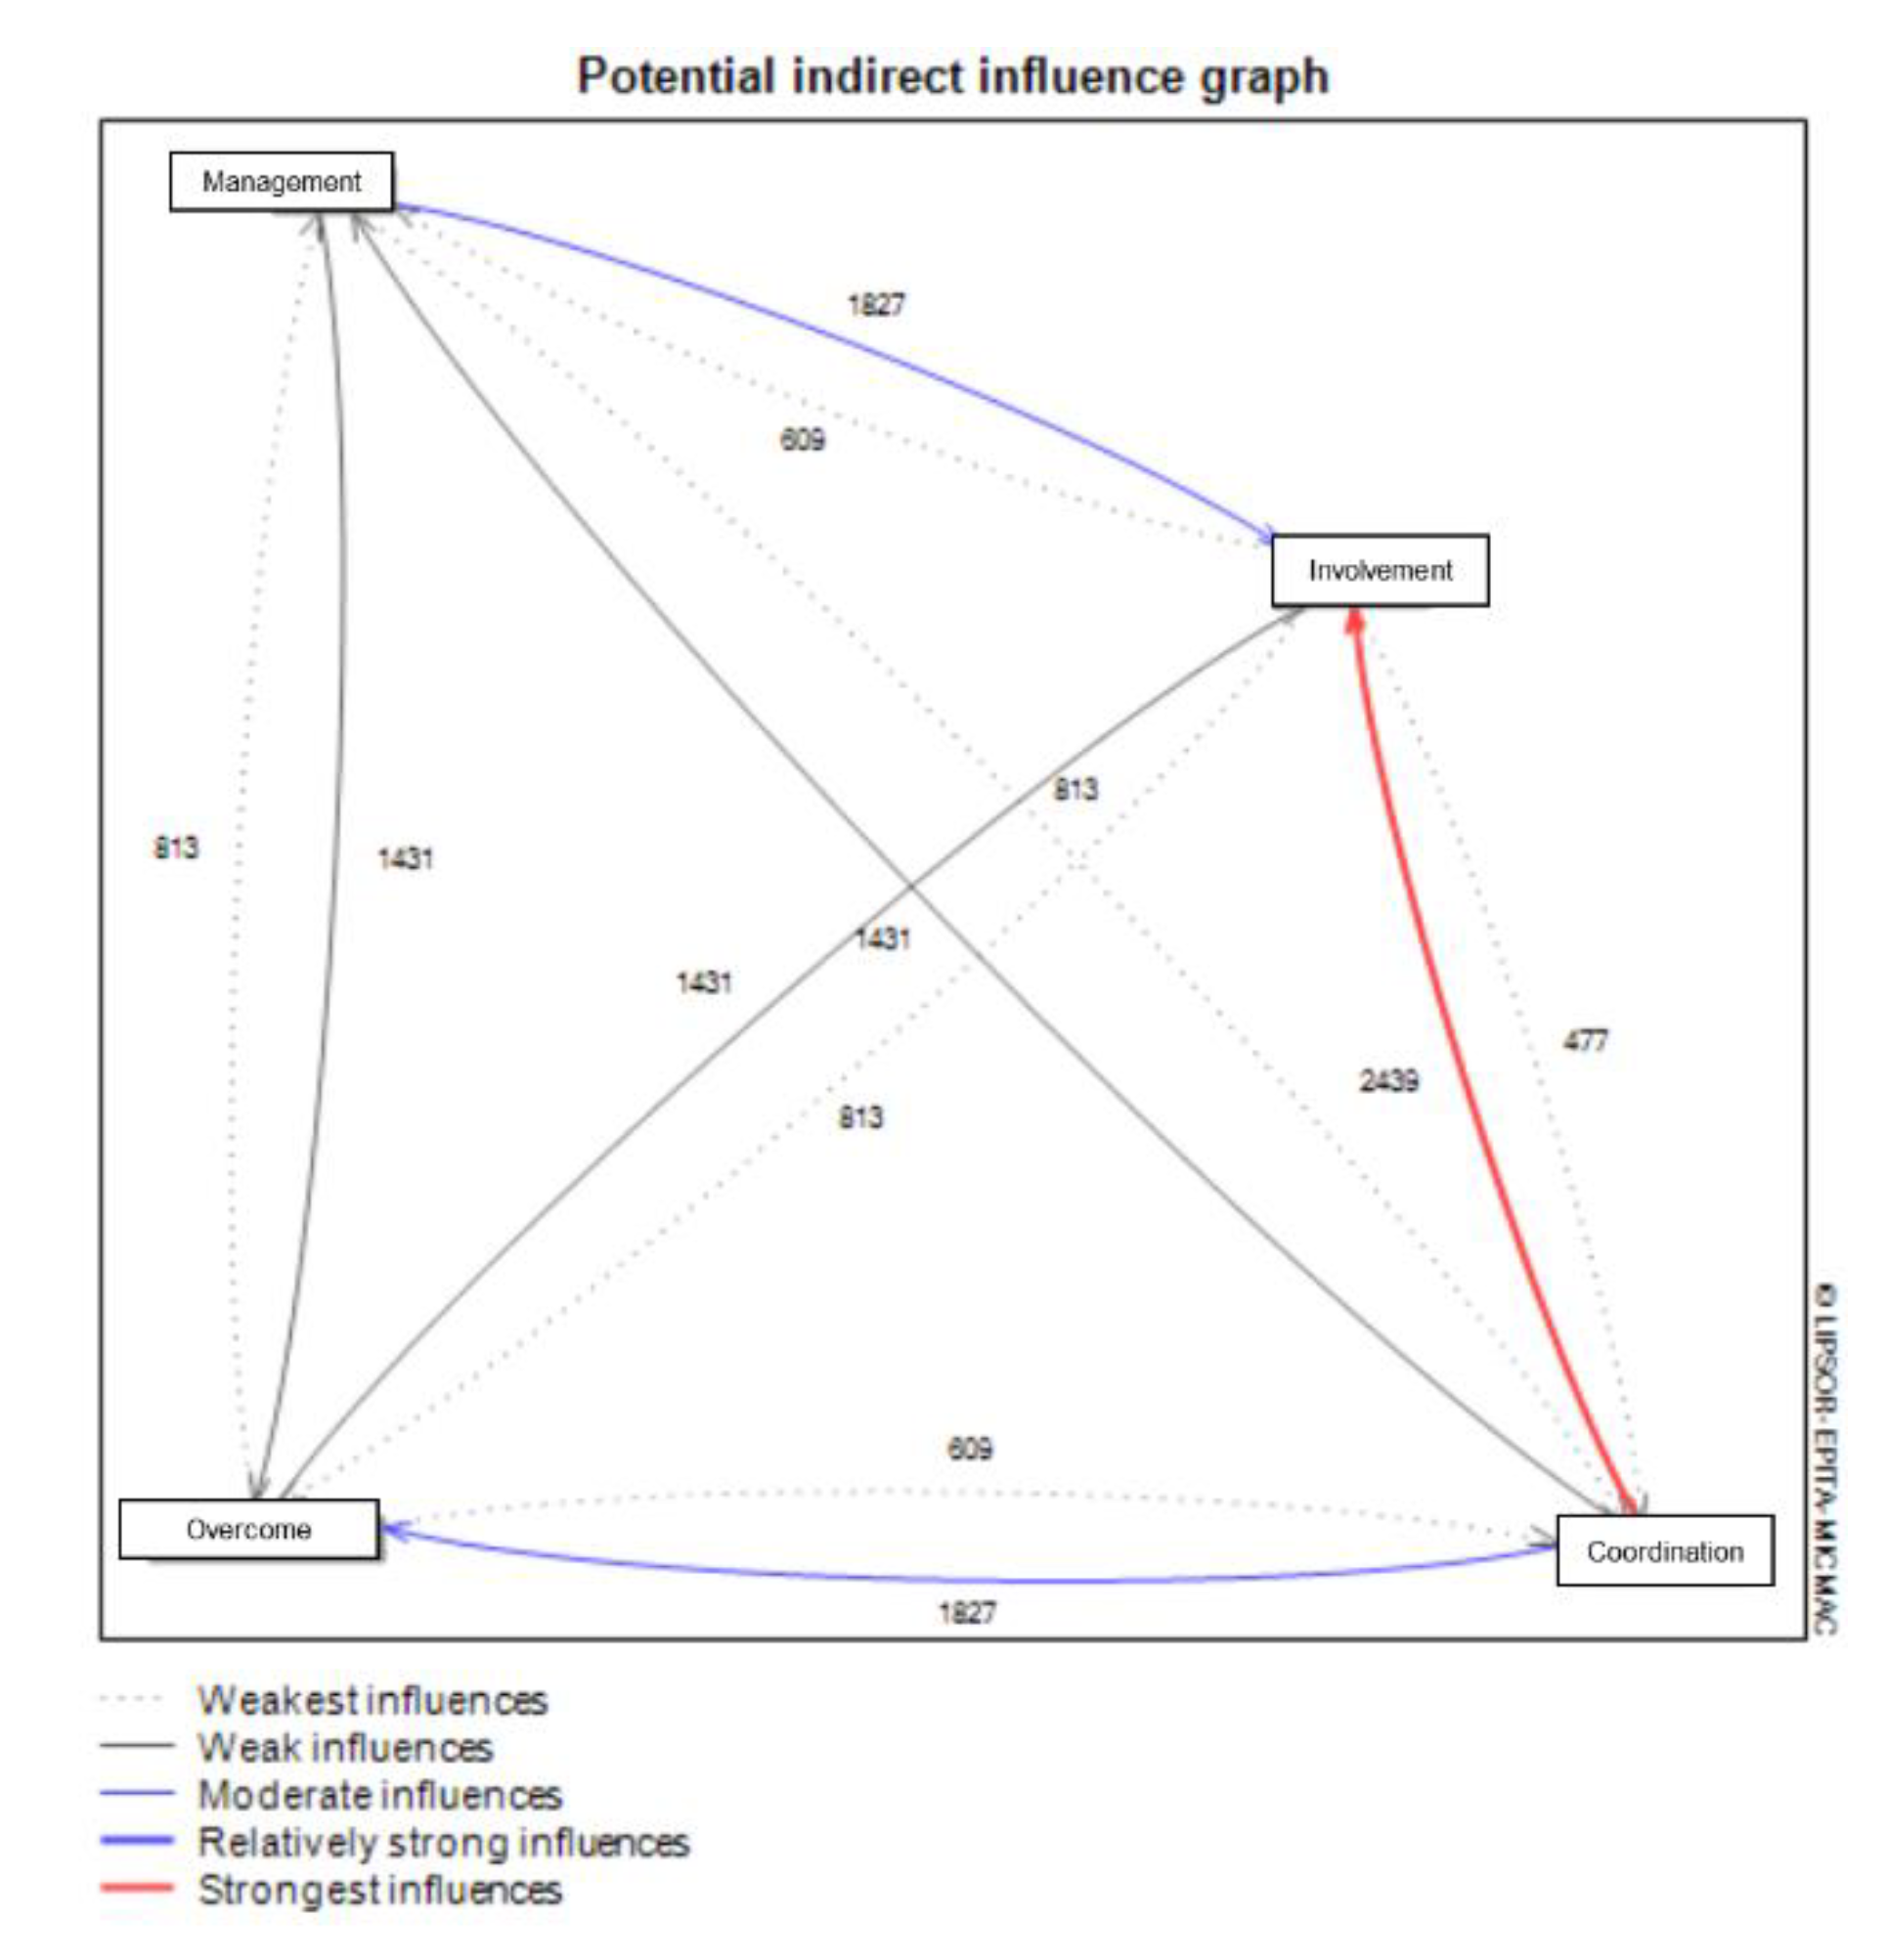
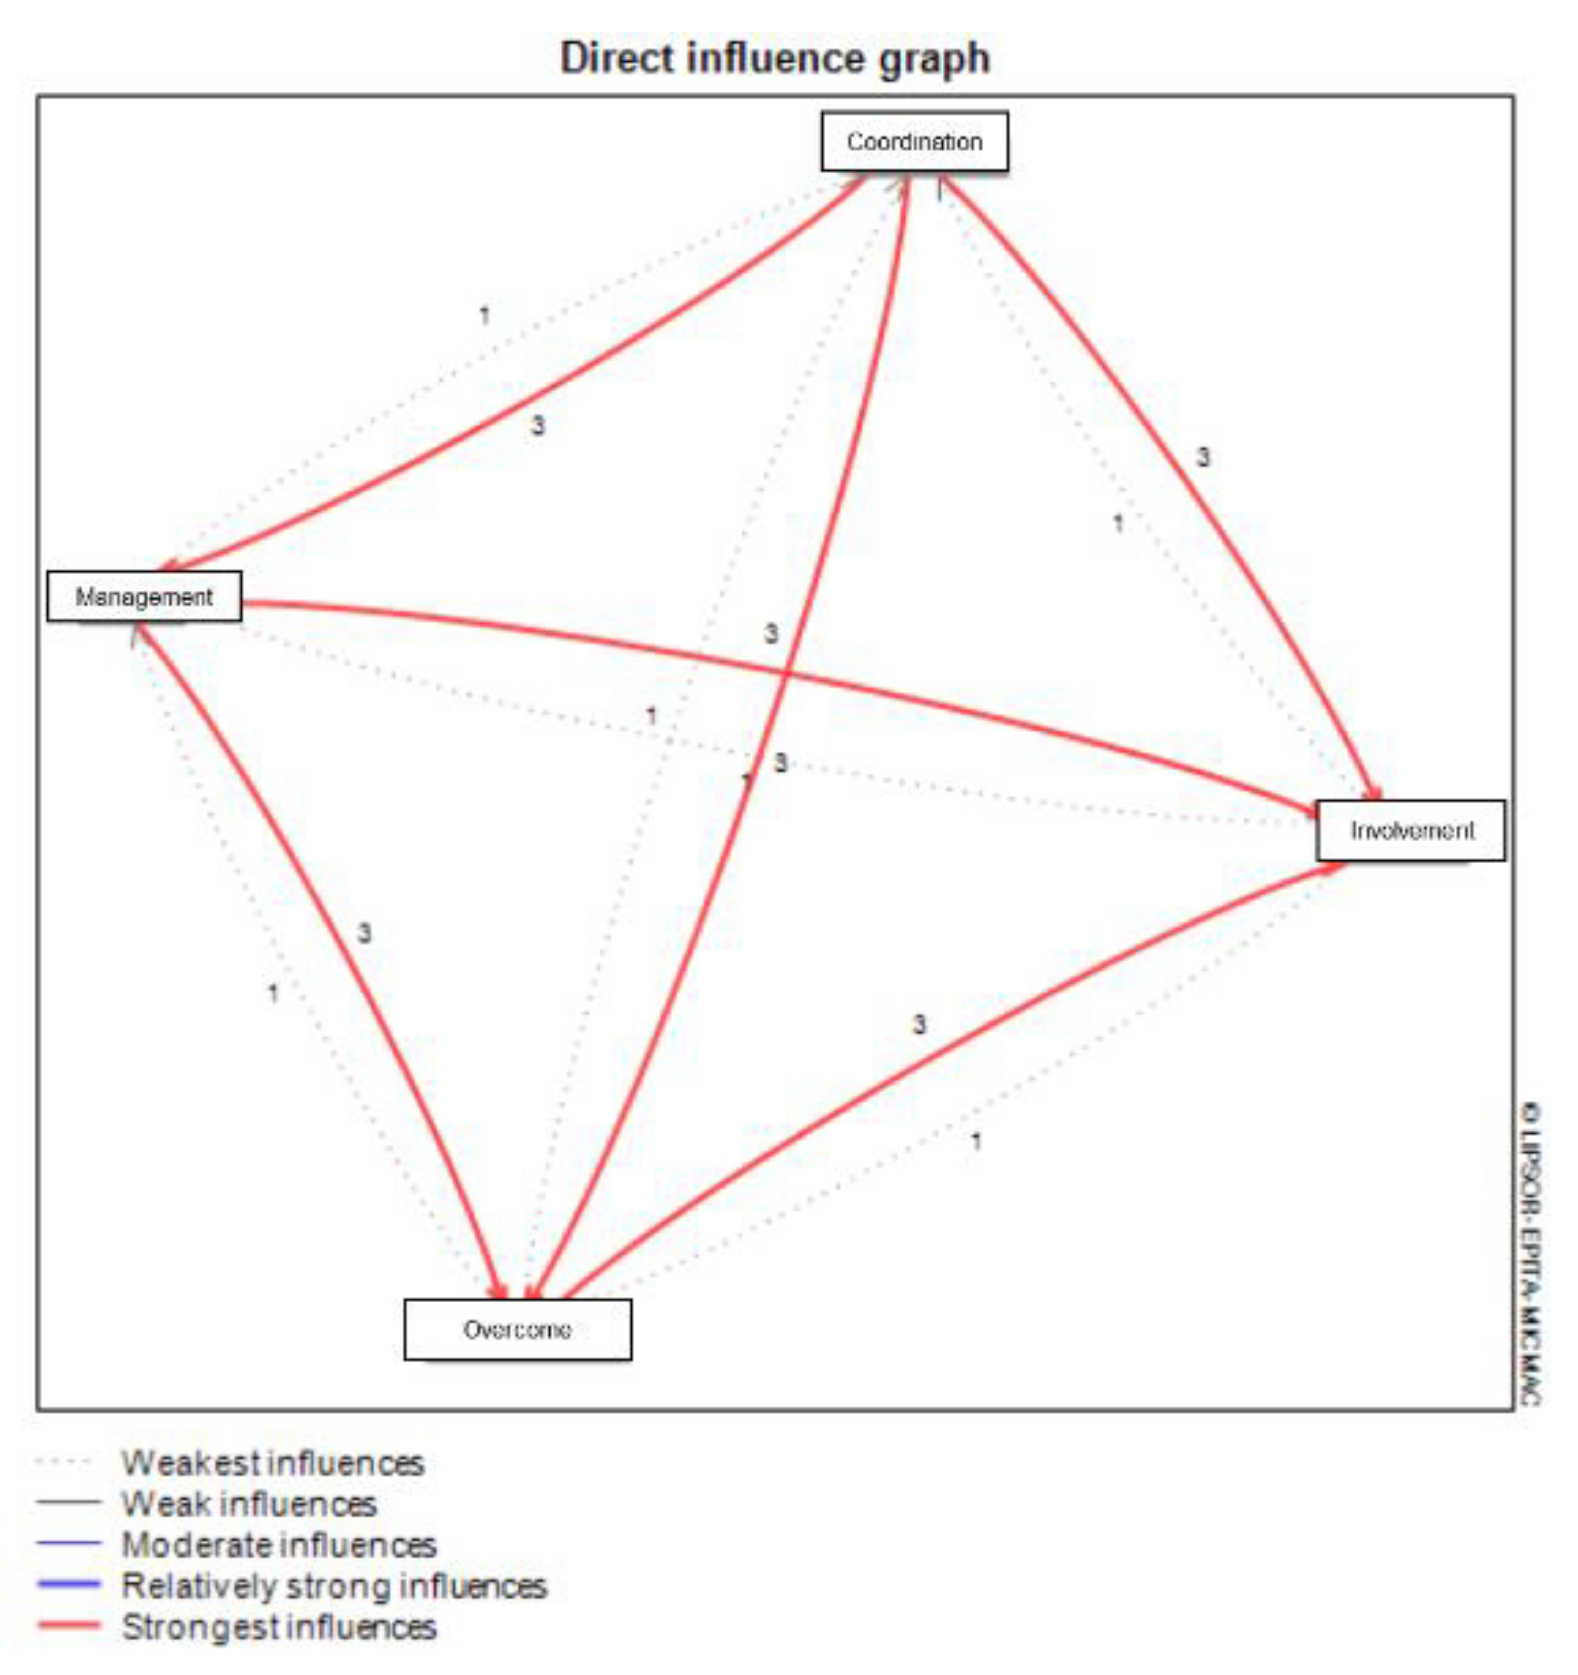
Figure 4 shows that in relationship influence between two variables is bidirectional in the current conditions. In this picture, it is explained that what must be done first in order to influence other variables is explained by the red and thick lines. In the picture you can see the direction of influence starting from coordination, management and handling ending in involvement. Next the results will be explained potential indirect map influence/dependence. Analysis results potential indirect map influence/dependence explains overall there is no very sharp difference between potential direct and indirect map.
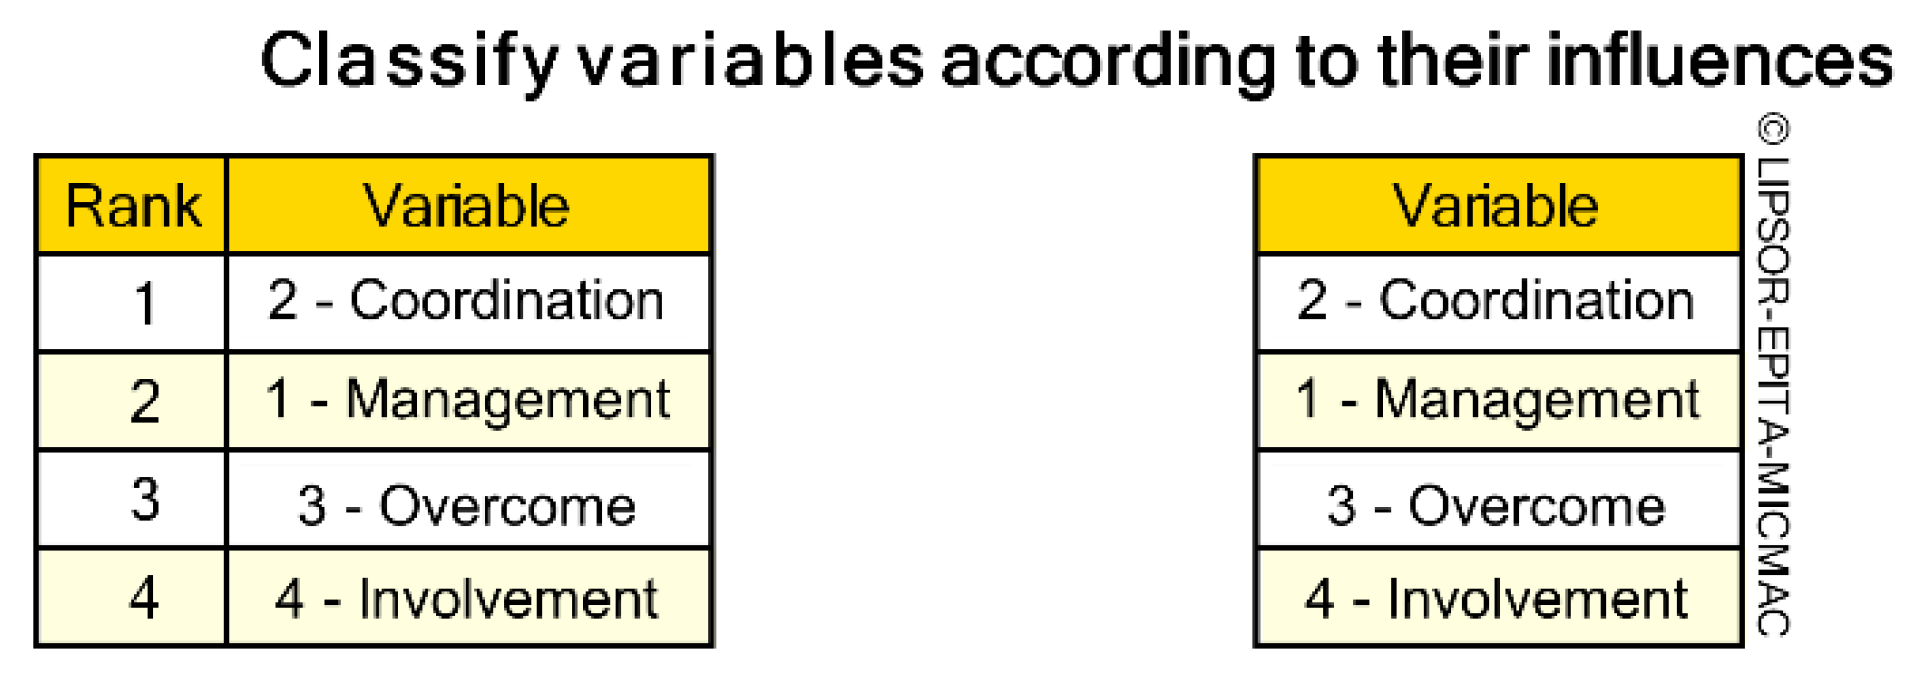
Figure 5 shows that in the future conditions of the relationship influence between two variables tends to be one-way. In the sense that the potential of one variable has a single role (influence or dependence). Changes in priority levels, both in terms of influence and dependency, can be seen from the results list of variables sorted by influence and list of variables sorted by dependence. The results of the analysis explain the potential shift in variable ranking in current conditions compared to future conditions.
Figure 5.
Potential indirect map influence/dependence.
Figure 5.
Potential indirect map influence/dependence.
Figure 6.
Potential indirect influence graph.
Figure 6.
Potential indirect influence graph.
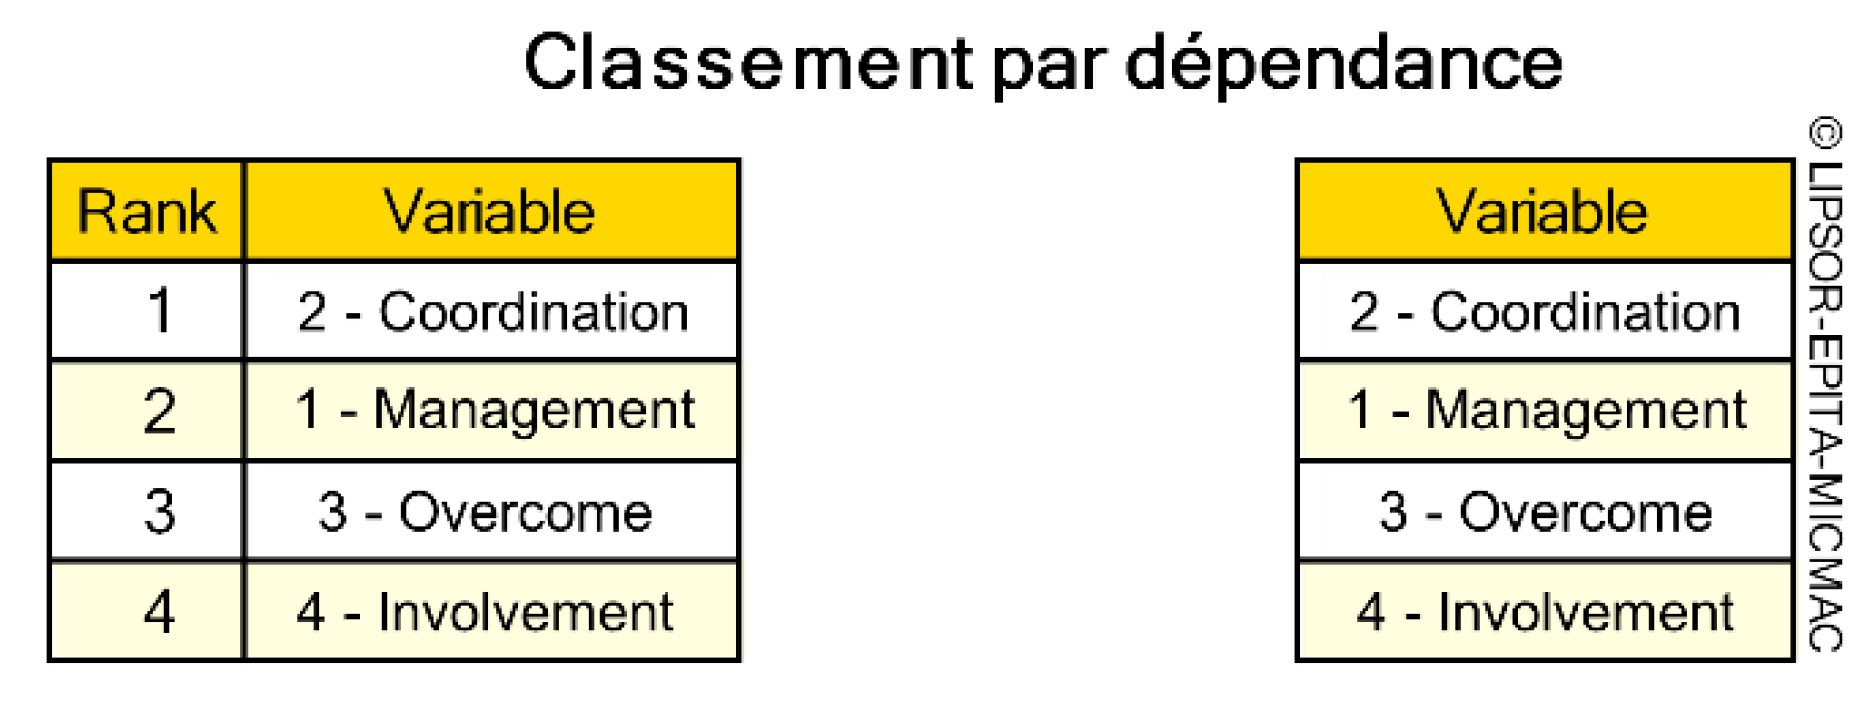
Figure 7 predicts that the variable priority level does not change in influencing other variables in the future. The order of being a variable that will influence other variables (influence), they are coordination, management, overcome, and involvement. Classification of variables based on priority dependence or influenced by other variables can be seen in
Figure 8. The strongest potential is in the position as a variable that will be influenced by other variables (dependence) sequentially are involvement, overcome, management, and coordination. This output will help policy makers to anticipate changes in variables that influence and are influenced compared to other variables, so that the policies issued are right on target.
Table 5.
Final weight of flood management strategy.
Table 5.
Final weight of flood management strategy.
| Rank |
Label |
Direct Influence |
Indirect Influence |
Label |
Direct Dependence |
Indirect Dependence |
| 1 |
Coordination |
3750 |
3597 |
Involvement |
3750 |
3597 |
| 2 |
Management |
2916 |
2734 |
Overcome |
2916 |
2734 |
| 3 |
Overcome |
2083 |
2087 |
Management |
2083 |
2087 |
| 4 |
Involvement |
1250 |
1581 |
Coordination |
1250 |
1581 |
| Rank |
Label |
Potential Direct Influence |
Potential Indirect Influence |
Label |
Potential Dependence |
Potential Indirect Dependence |
| 1 |
Coordination |
3750 |
3597 |
Involvement |
3750 |
3597 |
| 2 |
Management |
2916 |
2734 |
Overcome |
2916 |
2734 |
| 3 |
Overcome |
2083 |
2087 |
Management |
2083 |
2087 |
| 4 |
Involvement |
1250 |
1581 |
Coordination |
1250 |
1581 |
4. Discussion
This study combines the concept of space in the phenomenon of urban flooding and research on community behavior holistically. Minimizing flood disasters can be done through structural development and synergized with non-structural development that provides space for community behavior so that the results are more optimal. Flood control are carried out in an integrated and comprehensive manner starting from stakeholder coordination, flood disaster management, flood handling and involving the community. Strategies that can be taken to control floods are as follows:
Coordination of flood control technical stakeholders has a weight in the position as a strategy that will influence other strategies at present 37.50%, and in the future has a weight of 35.97%. Meanwhile, in its position as a strategy influenced by other strategies, it is currently 12.50%, and in the future 15.81%. So, this stakeholder coordination strategy has more of an influence on other strategies.
The role of stakeholders in flood control is carried out by the Governments, House of Representatives, Private, and Community. The government is fully responsible for resolving disaster problems, especially flood disasters, in accordance with Law Number 24 of 2007. Stakeholder coordination can be carried out by dividing the tasks, functions and roles of each in accordance with established regulations. Granting authority for the provision of road infrastructure and drainage channels to the Public Works and Spatial Planning Department, and the Public Housing and Settlement Areas Department (Provincial and City), authority for the management of the Sail Watershed (Sumatra River Region III Office, Riau Province Public Works and Spatial Planning Department, and Pekanbaru City Public Works and Spatial Planning Department), authority regarding the granting of permits and supervision (Pekanbaru City Public Works and Spatial Planning Department and Pekanbaru City Investment and Integrated Services Department) and authority in handling flood disasters (National Agency for Disaster Countermeasure).
- 2.
Floodplain management
Floodplain management includes determining flood boundaries, determining zoning, providing infrastructure to support settlements, supervision and monitoring. Floodplain management includes zoning and regional development concepts by taking into account the capacity and ability of the region to respond to climate and adapt to flood conditions [
13].
The weight in the position as a strategy that will influence other strategies is 29.16%, and in the future, it has a weight of 27.34%. Meanwhile, the position as a strategy that is influenced by other strategies is currently around 20.83%, and in the future 20.87%. So, this floodplain management strategy has two characteristics that influence it slightly stronger than other strategies.
The strategy for structuring the area around the banks of the Sail River is more adaptive and sustainable, so as to reduce flooding problems around the river. This strategy is carried out by determining river border boundaries, in accordance with Pekanbaru City Regulation Number 7 of 2020, Sail River borderline is set at a minimum of fifteen meters, this area is included in the zoning with the protection function of local protected areas, where it is conditionally/limited to provision of transportation infrastructure, water resources infrastructure, ranges of electric cables and electricity buildings, gas pipelines, drinking water pipes, waste water pipes in accordance with statutory provisions and permanent buildings and activities that will damage and change the balance of the environment and the function of the area are prohibited. around the river.
Green open space planning is an ecosystem service for flood management [
14]. Provision of infrastructure and facilities to support settlements, including construction and improvement of drainage channels, provision of Temporary Disposal Site, and provision of piped clean water services. Supervise and monitor the granting of building approvals to buildings, especially housing and settlements in flood-prone areas.
- 3.
Flood mitigation
Flood management includes before a disaster occurs, during a disaster and after a disaster. The weight in the position as a strategy that will influence other strategies is currently around 20.83%, and in the future, it will have a weight of 20.87%. Meanwhile, the position as a strategy that is influenced by other strategies is currently around 29.16%, and in the future 27.34%. So, this flood management strategy has two characteristics that are influenced slightly more strongly than other strategies.
Flood management include before the flood, during the flood and after the flood. Prior to a flood, this is done by monitoring and evaluating data, reporting and identifying flood areas, providing maps of flood-prone areas, implementing an early warning system, planning needs and providing funds, emergency response planning and implementing a flood information system. When a flood occurs, flood management, evacuation, rescue of people and facilities, rapid reporting, provision of aid and assistance with social tasks are carried out. After the flood, including research and assessment of the consequences of the flood (updating data) and reporting, repair of damage to flood control buildings.
Flood hazard areas are very high in areas with low-lying morphology, flat slopes, closed streams, expanding impermeable areas and intense urbanization [
15].
- 4.
Community involvement
Community involvement includes before a disaster occurs, during a disaster and after a disaster. The weight in the position as a strategy that will influence other strategies is currently around 12.50%, and in the future, it will have a weight of 15.81%. Meanwhile, the position as a strategy influenced by other strategies is currently around 37.50%, and in the future 35.97%. So, this community involvement strategy is more influenced by other strategies.
Community involvement was carried out in stages, starting with the stipulation of the Pekanbaru Mayor's Regulation regarding community participation in development (covering the community's role directly and indirectly in maintaining infrastructure), socialization/counseling in managing the environment, especially water use, healthy lifestyles, not throwing away rubbish. carelessly, managing used goods, implementing Clean and Healthy Living Behavior after the flood can minimize negative impacts on health [
16]. It is necessary to hold community consultations in explaining the mapping and description of the conditions of drainage channel management in the context of flood control [
17].
The final result of the relationship map to the four strategies, starting from coordination, shows that the strong arrow direction is from coordination to overcome, management and involvement. This means that the other three strategies depend on how the coordination strategy is carried out optimally by the regional government. From
Figure 6 it can be seen that all strategy arrows point to the engagement strategy. This means that the quality of community involvement is largely determined by coordination, overcome and management strategies. Overcome and management strategies are influenced and influence other strategies or are better known as mediation because they are between two strategies. So, the sequence of strategies based on the results of the analysis is coordination, management, overcome, and community involvement.
5. Conclusions
The conclusion obtained from the results of this research is that spatial planning strategies and community behavior in flood control efforts are carried out with coordination of technical stakeholders related to flood control, flood management including before a disaster occurs, during a disaster and after a disaster, flood plain management, including determining flood boundaries, determining zoning, supervision and monitoring as well as community involvement.
Author Contributions
Conceptualization, R.D., S., N., and B.A.; methodology, R.D., S., N., and B.A.; software, R.D.; validation, R.D., S., N., and B.A.; formal analysis, R.D.; investigation, R.D.; resources, R.D.; data curation, R.D.; writing—original draft, R.D.; writing—review & editing, R.D., S., N., and B.A.; visualization, R.D.; supervision, S., N., and B.A.; project administration, R.D. All authors have read and agreed to the published version of the manuscript.
Funding
This research received no external funding.
Institutional Review Board Statement
Not applicable.
Informed Consent Statement
Not applicable.
Acknowledgments
The authors express their sincere gratitude to Riau University for their essential resources and unwavering support, which were crucial for the successful completion of this research.
Conflicts of Interest
The authors declare no conflicts of interest.
References
- National Agency for Disaster Countermeasure. Indonesian Disaster Risk Index; National Agency for Disaster Countermeasure: Jakarta, 2016.
- Armayani, R. R.; Lubis, H. K.; Sari, N. The Relationship Between the Economy and the Environment: A Literature Review. Sinomika Journal 2022, 1 (2).
- Ainurrosyidah, E. The Impact of Floods on the Economy and Community Activities of the City of Surabaya (Case Study of Ketintang Village, Surabaya City). Journal of Economics and Strategy (JES) 2022, 3 (1).
- Pekanbaru City Public Works and Spatial Planning Department. Pekanbaru City Flood Control Masterplan; Pekanbaru, 2020.
- Statistics of Pekanbaru Municipality. Pekanbaru Municipality in Figures; Pekanbaru, 2022.
- Awaliyah, N.; Ariyaningsih, A.; Ghozali, A. Analysis of Factors That Influence the Occurrence of Floods in the Ampal/Klandasan Besar Watershed and the Suitability of the Program to Handling Factors. Jurnal Penataan Ruang 2020, 57. https://doi.org/10.12962/j2716179X.v15i2.7376. [CrossRef]
- Sabarinah, Z. The Importance of Waste Management Knowledge to Encourage Household Waste-Sorting Behaviour in Indonesia. Int J Waste Resour 2017, 07 (04). https://doi.org/10.4172/2252-5211.1000309. [CrossRef]
- Andina, E. Analysis of Waste Sorting Behavior in the Surabaya City. Aspirasi: Jurnal Masalah-masalah Sosial 2019, 10 (2).
- Zuraidah, S.; Sujatmiko, B.; Bustamin, M. octaviani. Overcoming Flood Problems and Independent Waste Management Using the Takakura Method (Berbek Village, Waru Sidoarjo District). Jurnal Abadimas Adi Buana 2019, 2 (2), 1–4. https://doi.org/10.36456/abadimas.v2.i2.a1754. [CrossRef]
- Pujiastuti, R.; Suripin; Syafrudin. The Effect of Land Subsidence on Flood Inundation and Rob in East Semarang. Jurnal MTKS 2015, 21 (1).
- Russell, S. V.; Knoeri, C. Exploring the Psychosocial and Behavioural Determinants of Household Water Conservation and Intention. Int J Water Resour Dev 2020, 36 (6), 940–955. https://doi.org/10.1080/07900627.2019.1638230. [CrossRef]
- Njoku, P. O.; Durowoju, O. S.; Uhunamure, S. E.; Makungo, R. Investigating the Attitude of Domestic Water Use in Urban and Rural Households in South Africa. Water (Basel) 2022, 14 (2), 210. https://doi.org/10.3390/w14020210. [CrossRef]
- Afandi, A. A.; Utama, V. P.; Khomenie, A.; Prabowo, C. H.; Apriyanto, R.; Barus, L. S.; Nurhasana, R. Development of Residential Areas in Flood Prone Areas in Kampung Melayu, East Jakarta. RUAS 2023, 21 (1).
- Schuch, G.; Serrao-Neumann, S.; Morgan, E.; Low Choy, D. Water in the City: Green Open Spaces, Land Use Planning and Flood Management – An Australian Case Study. Land use policy 2017, 63, 539–550. https://doi.org/10.1016/j.landusepol.2017.01.042. [CrossRef]
- Bathrellos, G. D.; Karymbalis, E.; Skilodimou, H. D.; Gaki-Papanastassiou, K.; Baltas, E. A. Urban Flood Hazard Assessment in the Basin of Athens Metropolitan City, Greece. Environ Earth Sci 2016, 75 (4), 319. https://doi.org/10.1007/s12665-015-5157-1. [CrossRef]
- Laksmi Trisasmita. Post-Flood Education and Socialization of Clean and Healthy Living Behavior. Sarwahita 2022, 19 (03), 434–448. https://doi.org/10.21009/sarwahita.193.6. [CrossRef]
- Aditianata. Community Participation in Flood Management in Duri Kosambi Village, West Jakarta. Jurnal Abdimas 2015, 2 (1), 127–136.
|
Disclaimer/Publisher’s Note: The statements, opinions and data contained in all publications are solely those of the individual author(s) and contributor(s) and not of MDPI and/or the editor(s). MDPI and/or the editor(s) disclaim responsibility for any injury to people or property resulting from any ideas, methods, instructions or products referred to in the content. |
© 2024 by the authors. Licensee MDPI, Basel, Switzerland. This article is an open access article distributed under the terms and conditions of the Creative Commons Attribution (CC BY) license (http://creativecommons.org/licenses/by/4.0/).
