1. Introduction
Titanium (Ti) is known as the rising third metal element, after iron (Fe) and aluminium (Al), and titanium alloys are widely used in a variety of engineering and living scenarios. The element titanium has an isotropic transition: being α phase with hexagonal close-packed (HCP) lattice at temperatures below 882.5 °C, i.e., β transus, in standard atmosphere; and β phase with body-centered cubic (BCC) lattice at high temperatures above β transus. Some chemical elements, e.g., Al and vanadium (V), can alloy titanium alloys to stabilize their α and β phases, called α and β stabilizing elements, respectively. Depending on the content of α and β stabilising elements, titanium alloys can be divided into four types: near α, α + β, metastable β and β. [
1,
2]
Additive manufacturing (AM), also known as 3D printing, is a form of rapid prototyping, a technique for constructing objects by printing layer by layer from a digital model file using bondable materials such as powdered metals or photosensible resins [
3]. Powder bed fusion (PBF) is one of the advanced AM technologies, which has gradually matured over a long period of research and industrial development. This development has enabled the widespread adoption of commercial applications of PBF, particularly to produce high value products that are not technically feasible with traditional manufacturing processes [
4].
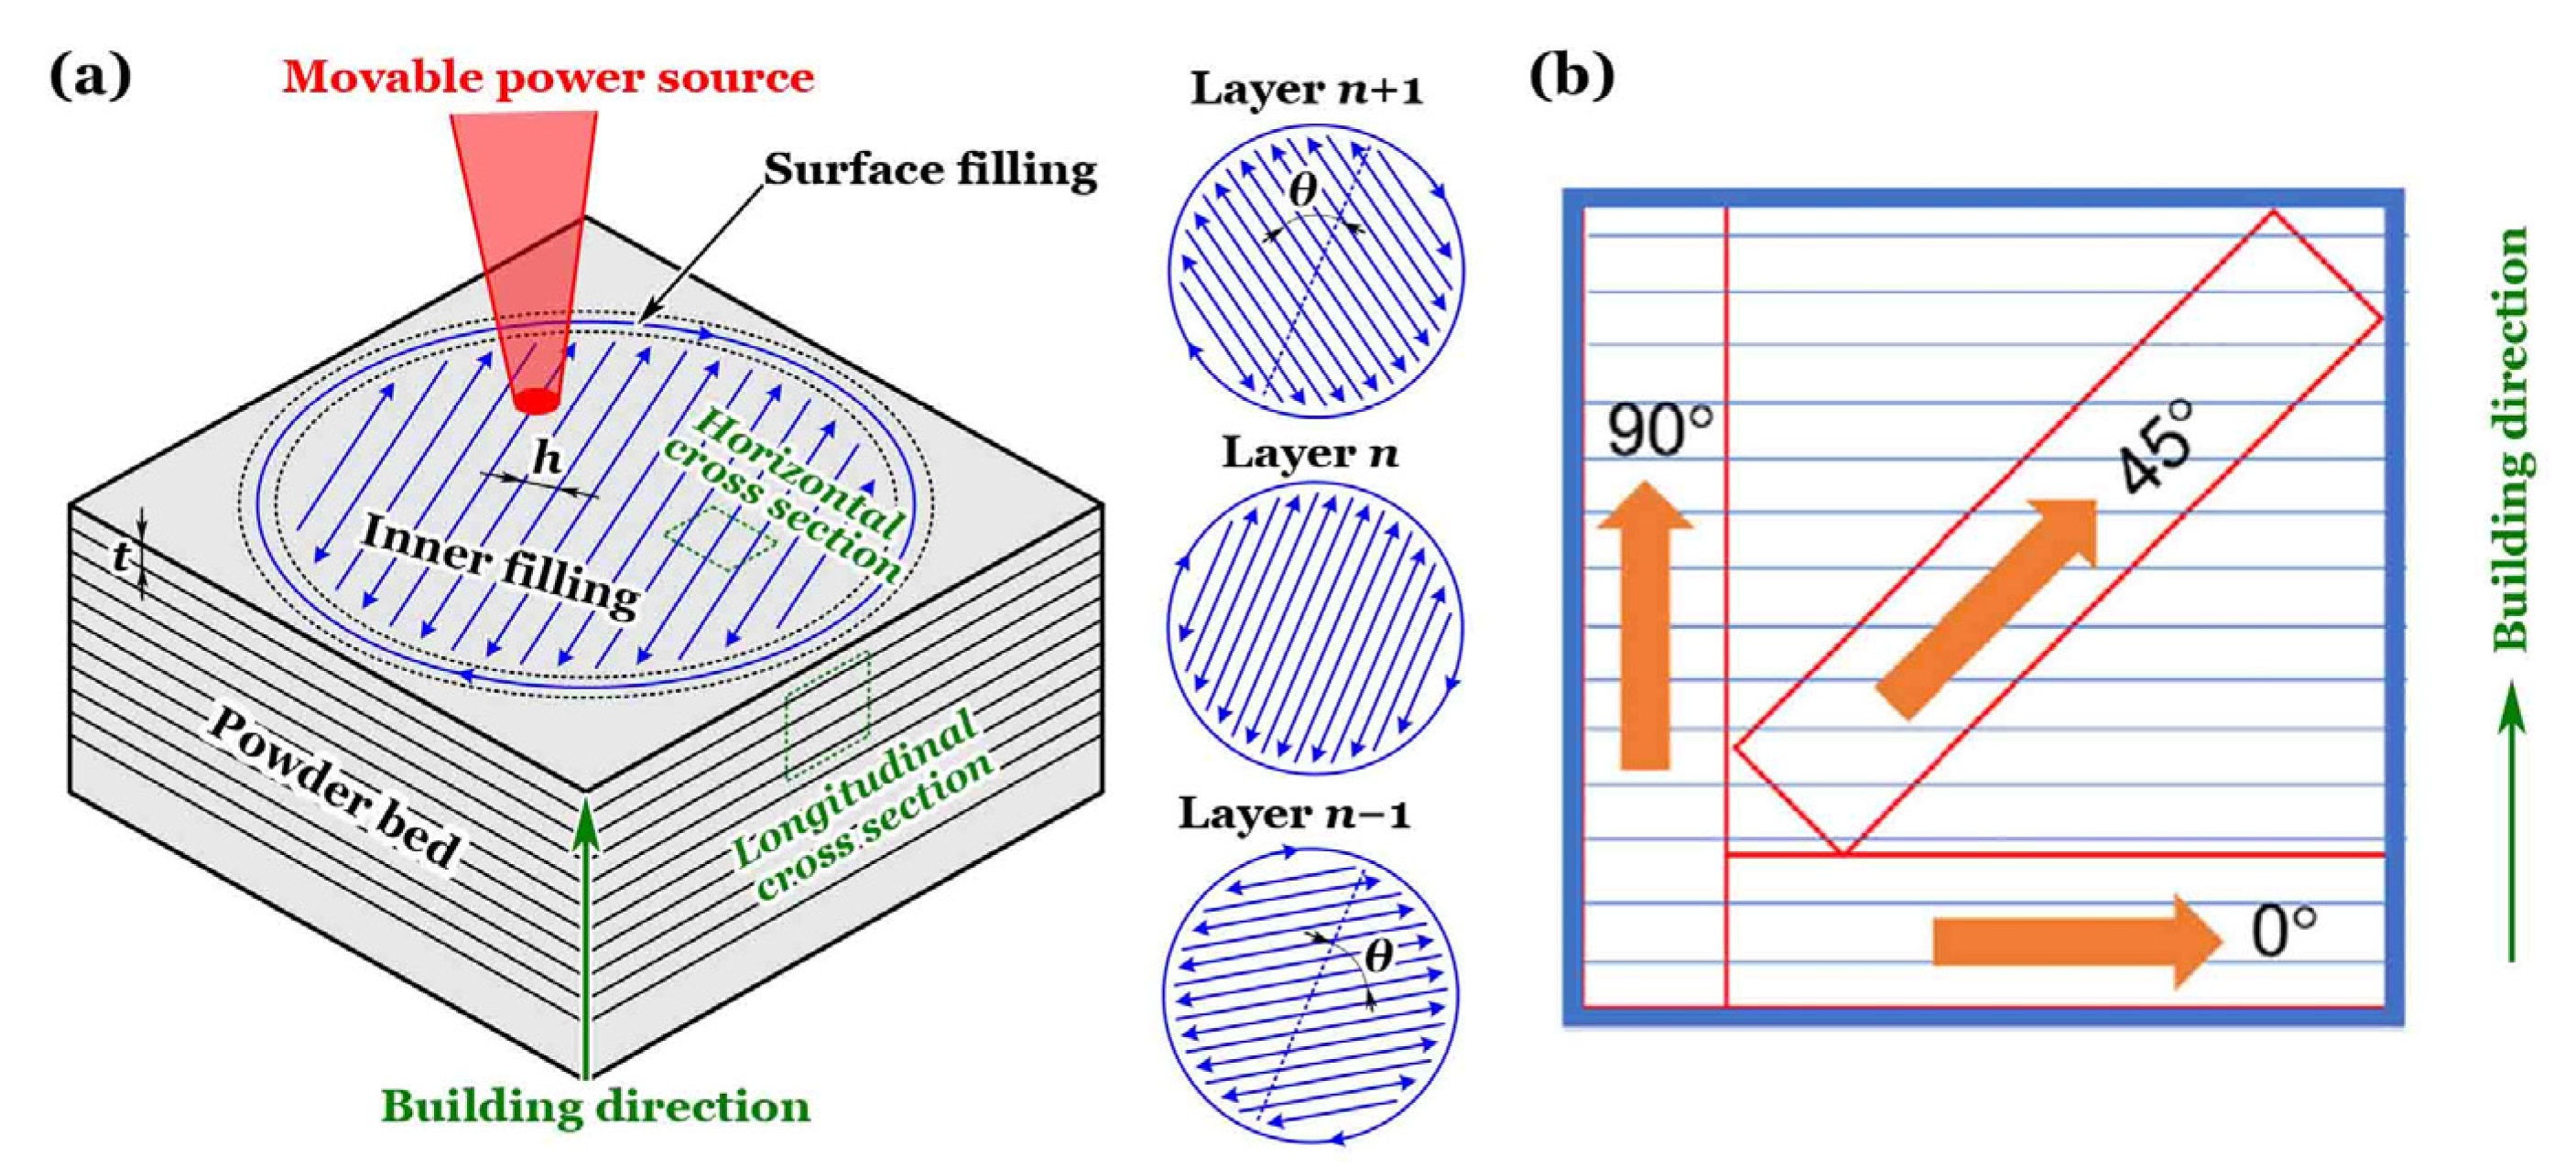
Figure 1a gives an illustration of PBF with a scan strategy of meandering paths [
5]. At first, a powder bed of metallic materials was stacked layer by layer with a thickness of
t; and then a moving heat source with a power of
p, usually a laser or electron beam, was focused on the top of the powder bed along a specific track with a velocity of
v. As the beam scanned, the powder melted, fused and solidified at a rapid cooling rate, the interval between two adjacent scan tracks being called the hatch spacing of
h. After completing the programmed path for the current layer of powder, a roller restacked the new powder on top of the current layer to form a new layer of powder; and the previous scanning operation was replicated, with the scan path typically requiring a rotation angle of
θ. These steps would be repeated many times until the designed specimen was finally 3D printed.
Figure 1b depicts an additively manufactured (AMed) titanium alloy of Ti-6Al-4V [
6], which is an α + β type, via laser PBF technique (L-PBF) with different orientations of 0° (horizontally printed), 45° and 90° (vertically printed). Ti-6Al-4V is the most used titanium alloy [
1,
2] and one of the few metallic materials suitable for AM [
3,
4]. Taking advantage of the unique microstructure produced by the rapid cooling of AM process, the AMed Ti-6Al-4V is very easy to make the ultimate tensile strength (UTS) of
σu > 1100 MPa, and access to the category of so-called high-strength titanium alloys [
7]. For the conventional melting-forging process, the manufactured high-strength titanium alloys have almost always been preferred to the use of a metastable β type [
7].
Nevertheless, the AM process may also cause unavoidable metallurgical defects [
8], e.g., lack-of-fusion (LoF), gas pore, keyholing pore and other AM pores. These AM defects will greatly deteriorate the microstructural integrity of AMed materials and significantly reducing their fatigue strengths, in particular for the cases of loading number
N > 10
7 cycles.
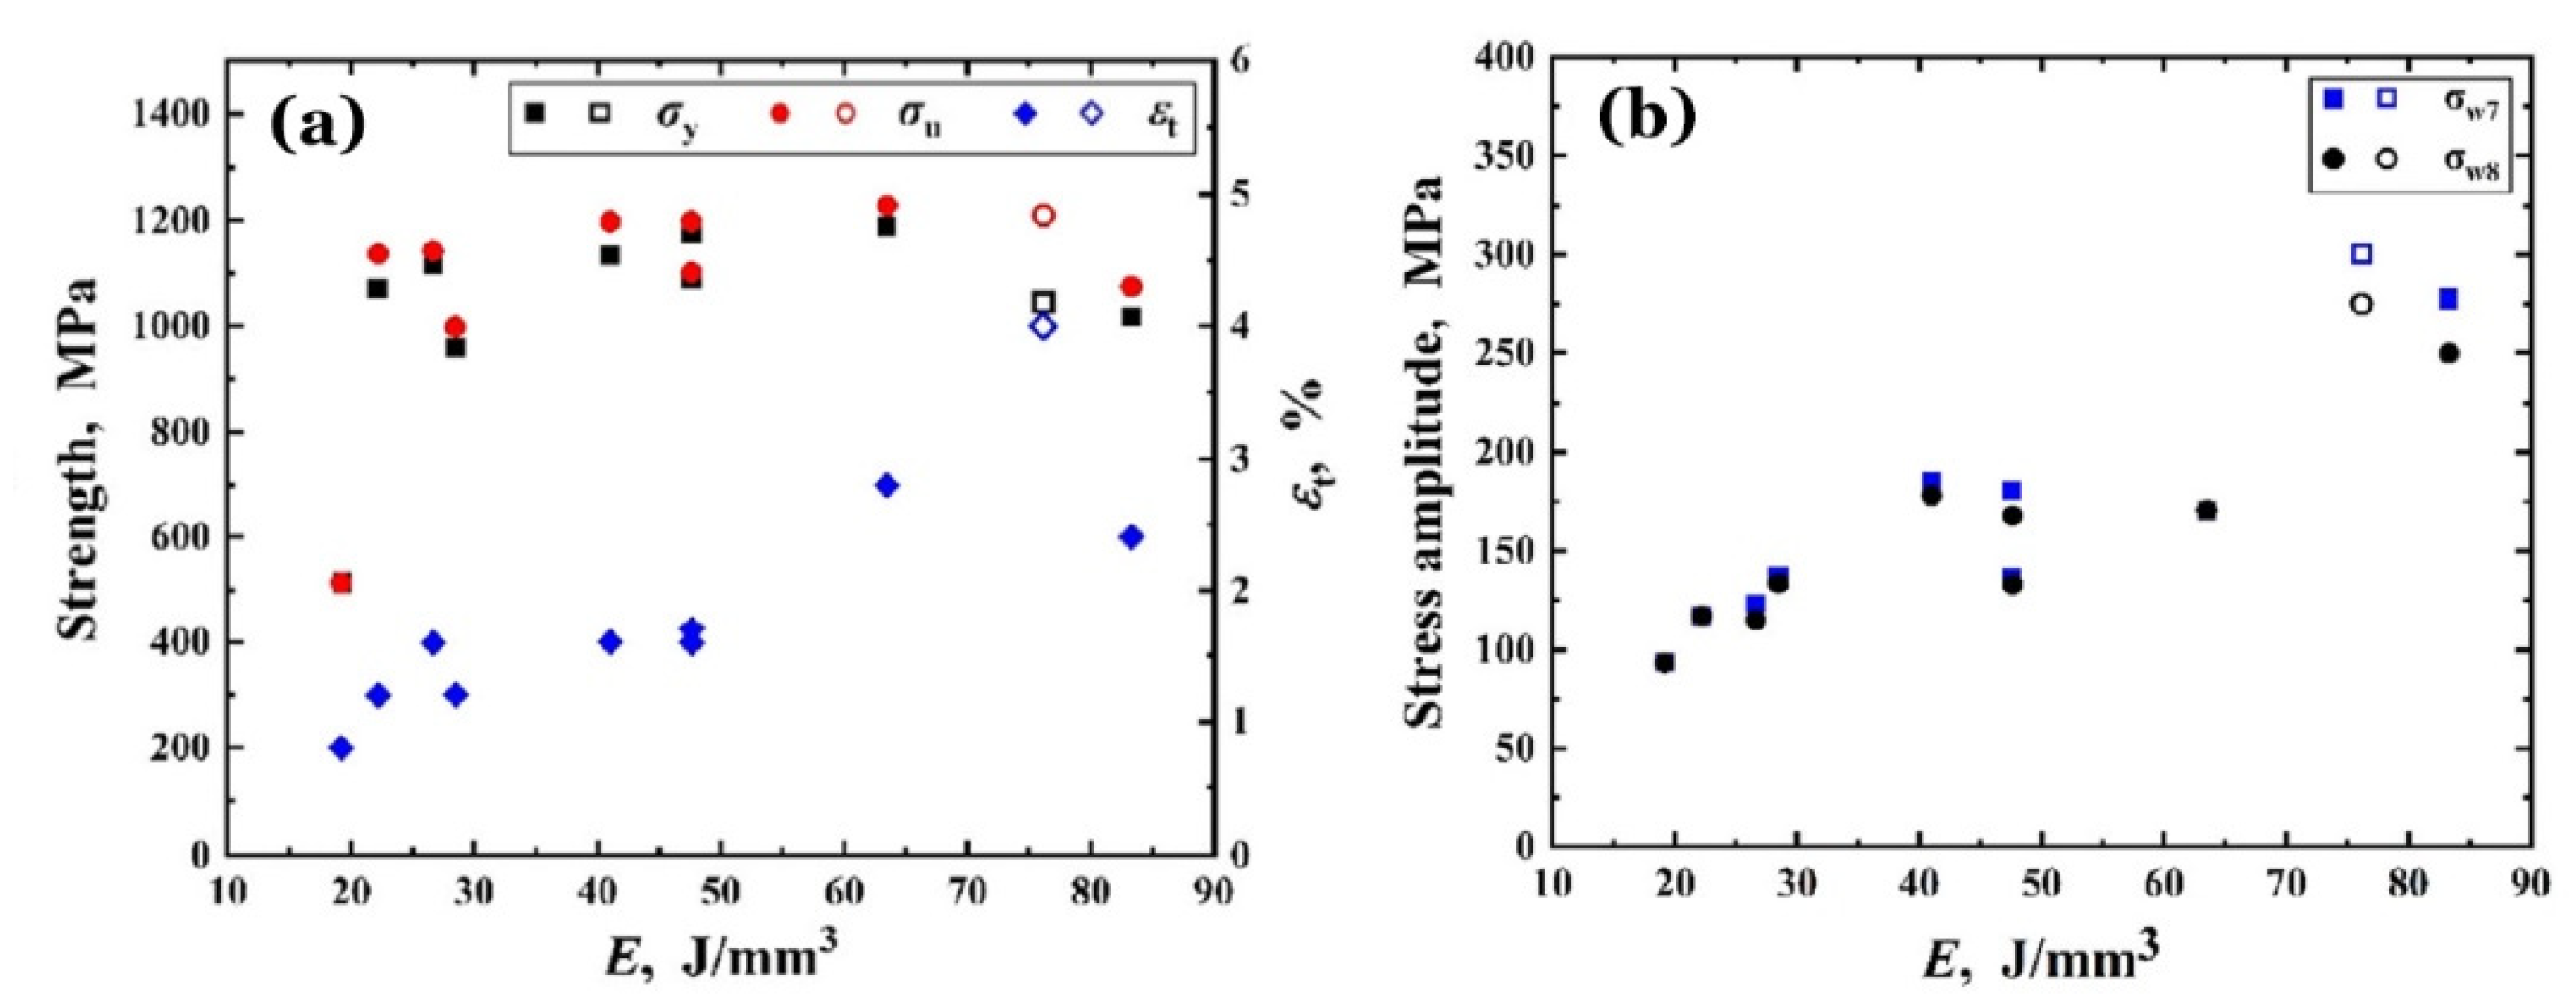
Figure 2 presents an example [
9], in which a batch of pre-alloyed Ti-6Al-4V powder was used to vertically print axissymmetric specimens via L-PBF with ten combinations of processing parameters and a heat treatment of stress relief by heating at 600 °C for 2 hours then cooled in a vacuum furnace. These combinations were named as Group 1, Group 2, …, Group 10.
Figure 2a shows the tensile properties of the yield strength
σy, the UTS
σu and the total elongation of
εt at fracture under quasi-static monotonic loading;
Figure 2b shows the fatigue strengths of
σw7 at 10
7 cycles, i.e., the traditional fatigue limit [
10,
11], and
σw8 at 10
8 cycles under axially ultrasonic cycling with resonant frequency of 20k ± 500 Hz at stress ratio of
R = –1. In
Figure 2, the abscissa
E =
p / (
t ∙
v ∙
h) is the volumetric energy density of the movable power source [
12].
2. Additively Manufactured Titanium Alloys
2.1. Porosities and Metallurgical Defect Types
Although the heat treatments of annealing types may degrade the tensile strength of AMed Ti-6Al-4V [
13], the majority of the obtained UTS values in
Figure 2a still satisfy
σu > 1100 MPa. In contrast, the greatest one of fatigue strengths
σw7 and
σw8 does not exceed 300 MPa. Obviously, even if the applied stress amplitude
σa is less than the traditional fatigue limit of
σw7, the fatigue failure will occur during
N > 10
7 cycles as long as
σa >
σw8. This falls into the scope of very-high-cycle fatigue (VHCF) [
13,
14].
In this regard, Du et al. [
9] successively used the methods of Archimedean drainage and cross section to measure the porosity
RD of the AMed specimens for Groups 1 ~ 10.
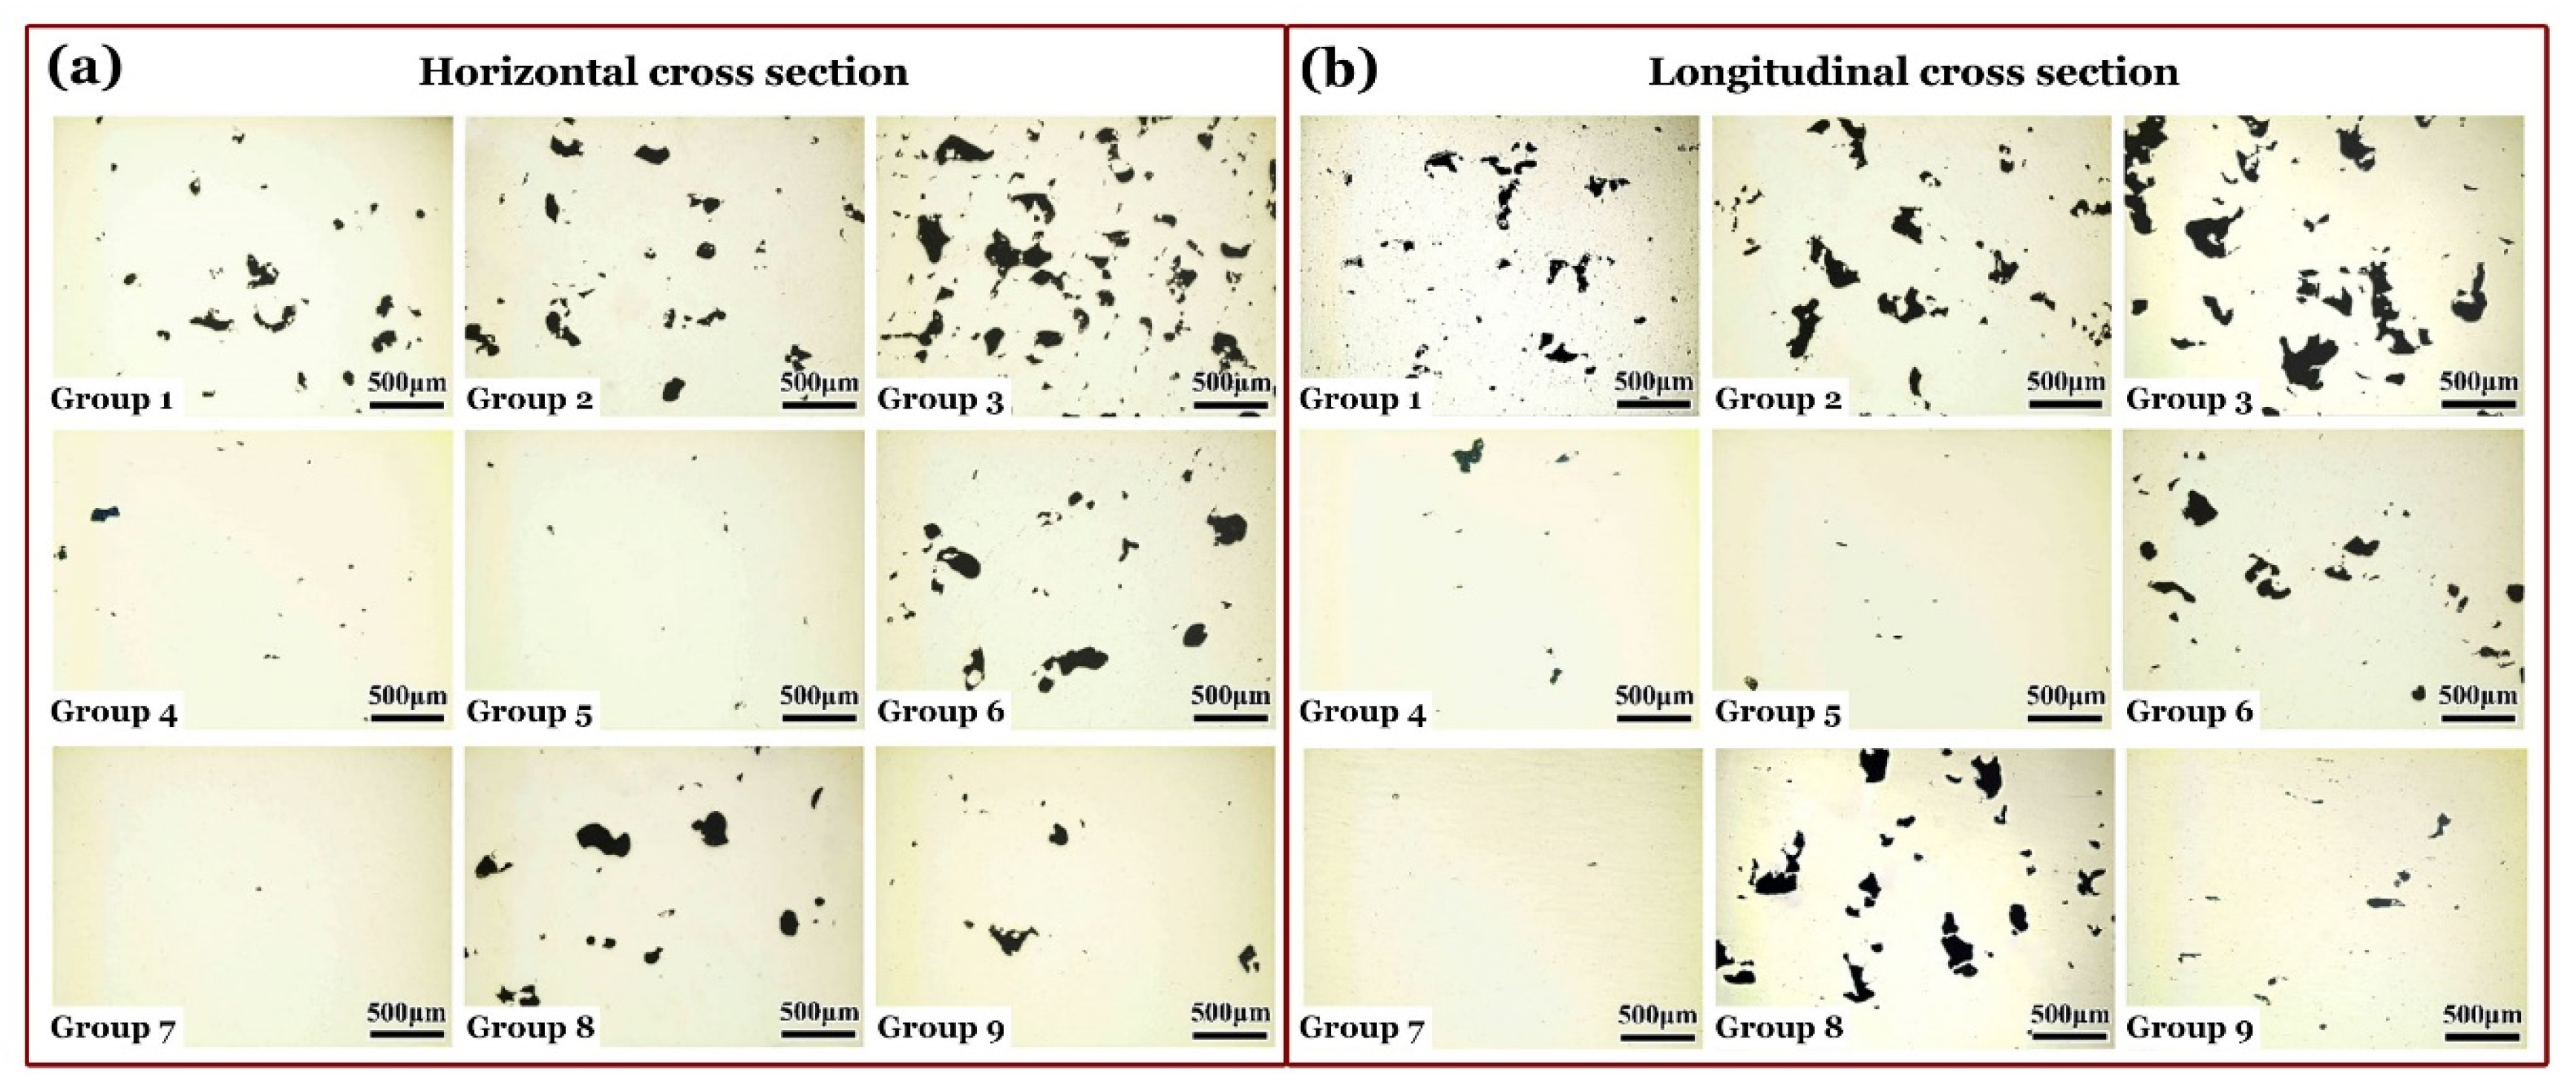
Figure 3 exhibits the distributed AM defects for Groups 1 ~ 9 on the selected representative regions within the horizontal and longitudinal cross sections cut from their specimens under optical microscopy (OM). The measured porosities were displayed on
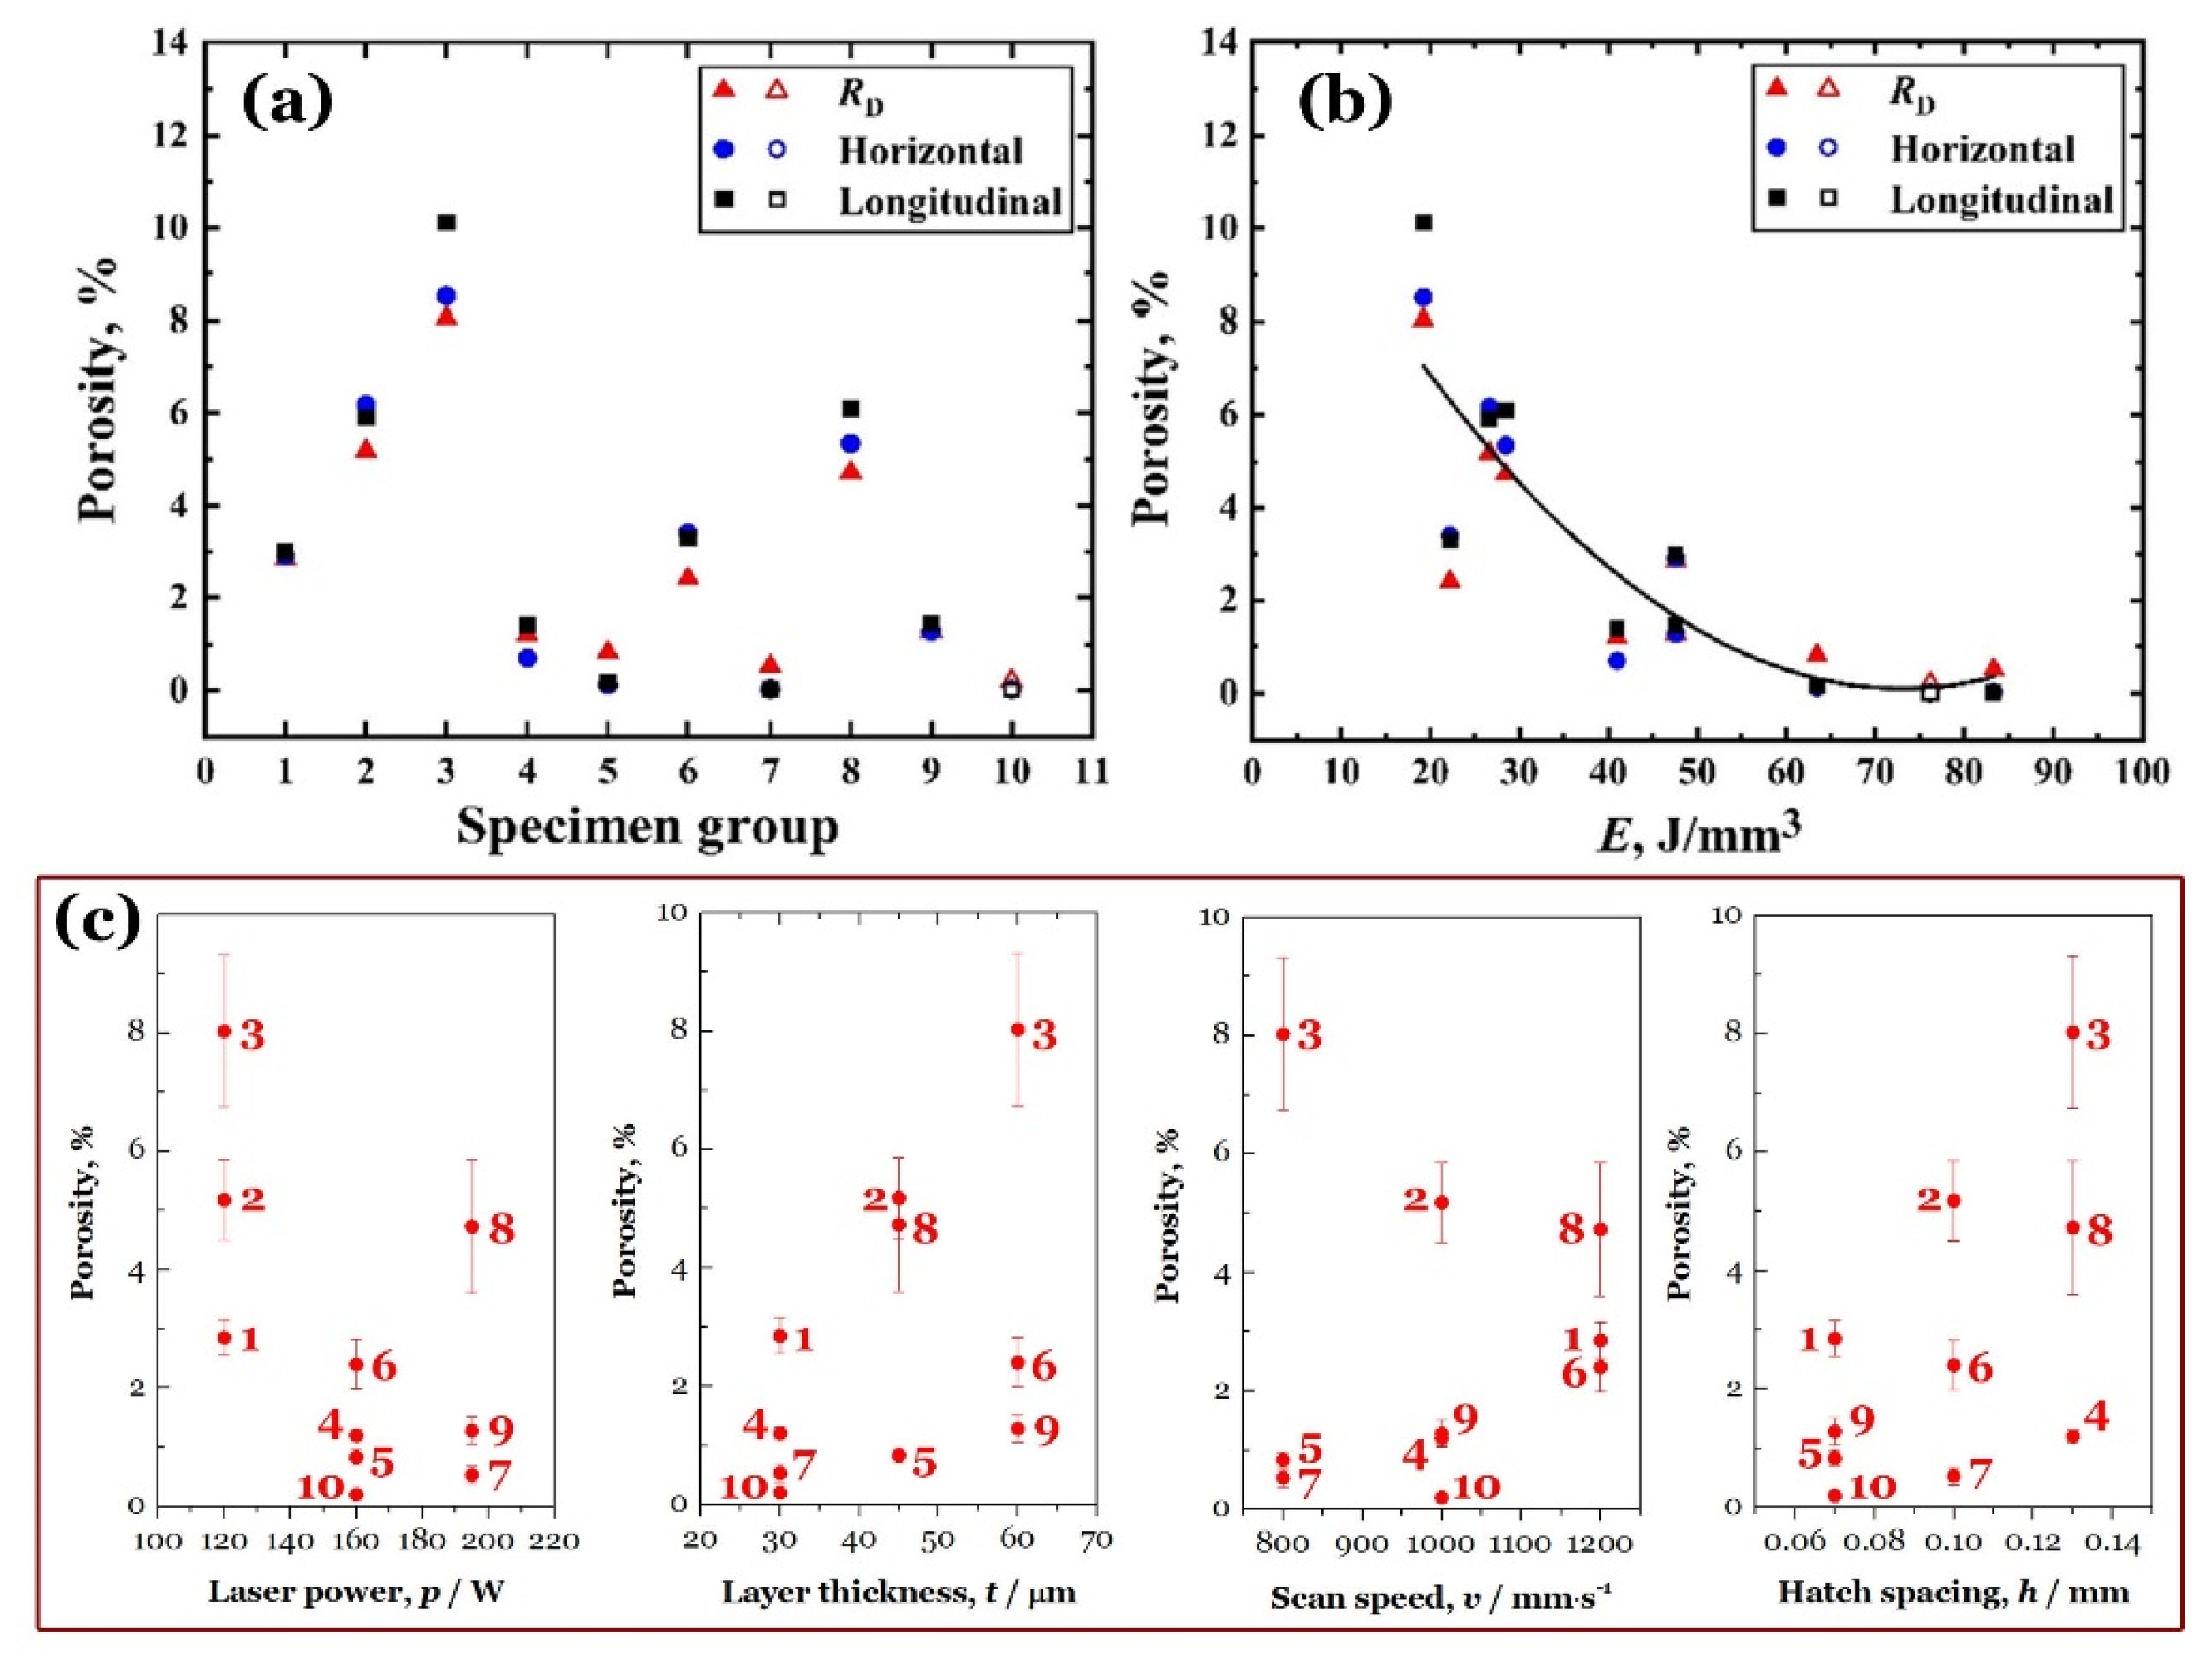
Figure 4 with different abscissas. Generally, as the energy density
E increases, the porosity decreases to a minimum value, at Group 10, and then rebounds slightly at Group 7. As shown in
Figure 3, the metallurgical defects are remarkably diverse and their shapes become more and more irregular with the increasing porosity. In comparison of Figures 2a and 4b, the tensile quantities of
σy,
σu and
εt basically have an opposite trend to the porosity with varying
E value. At last,
Figure 4c enumerates the detail L-PBF parameters of Groups 1 ~ 10 for AMed Ti-6Al-4V.
2.2. Basic Features of 3D Printed Microstructures
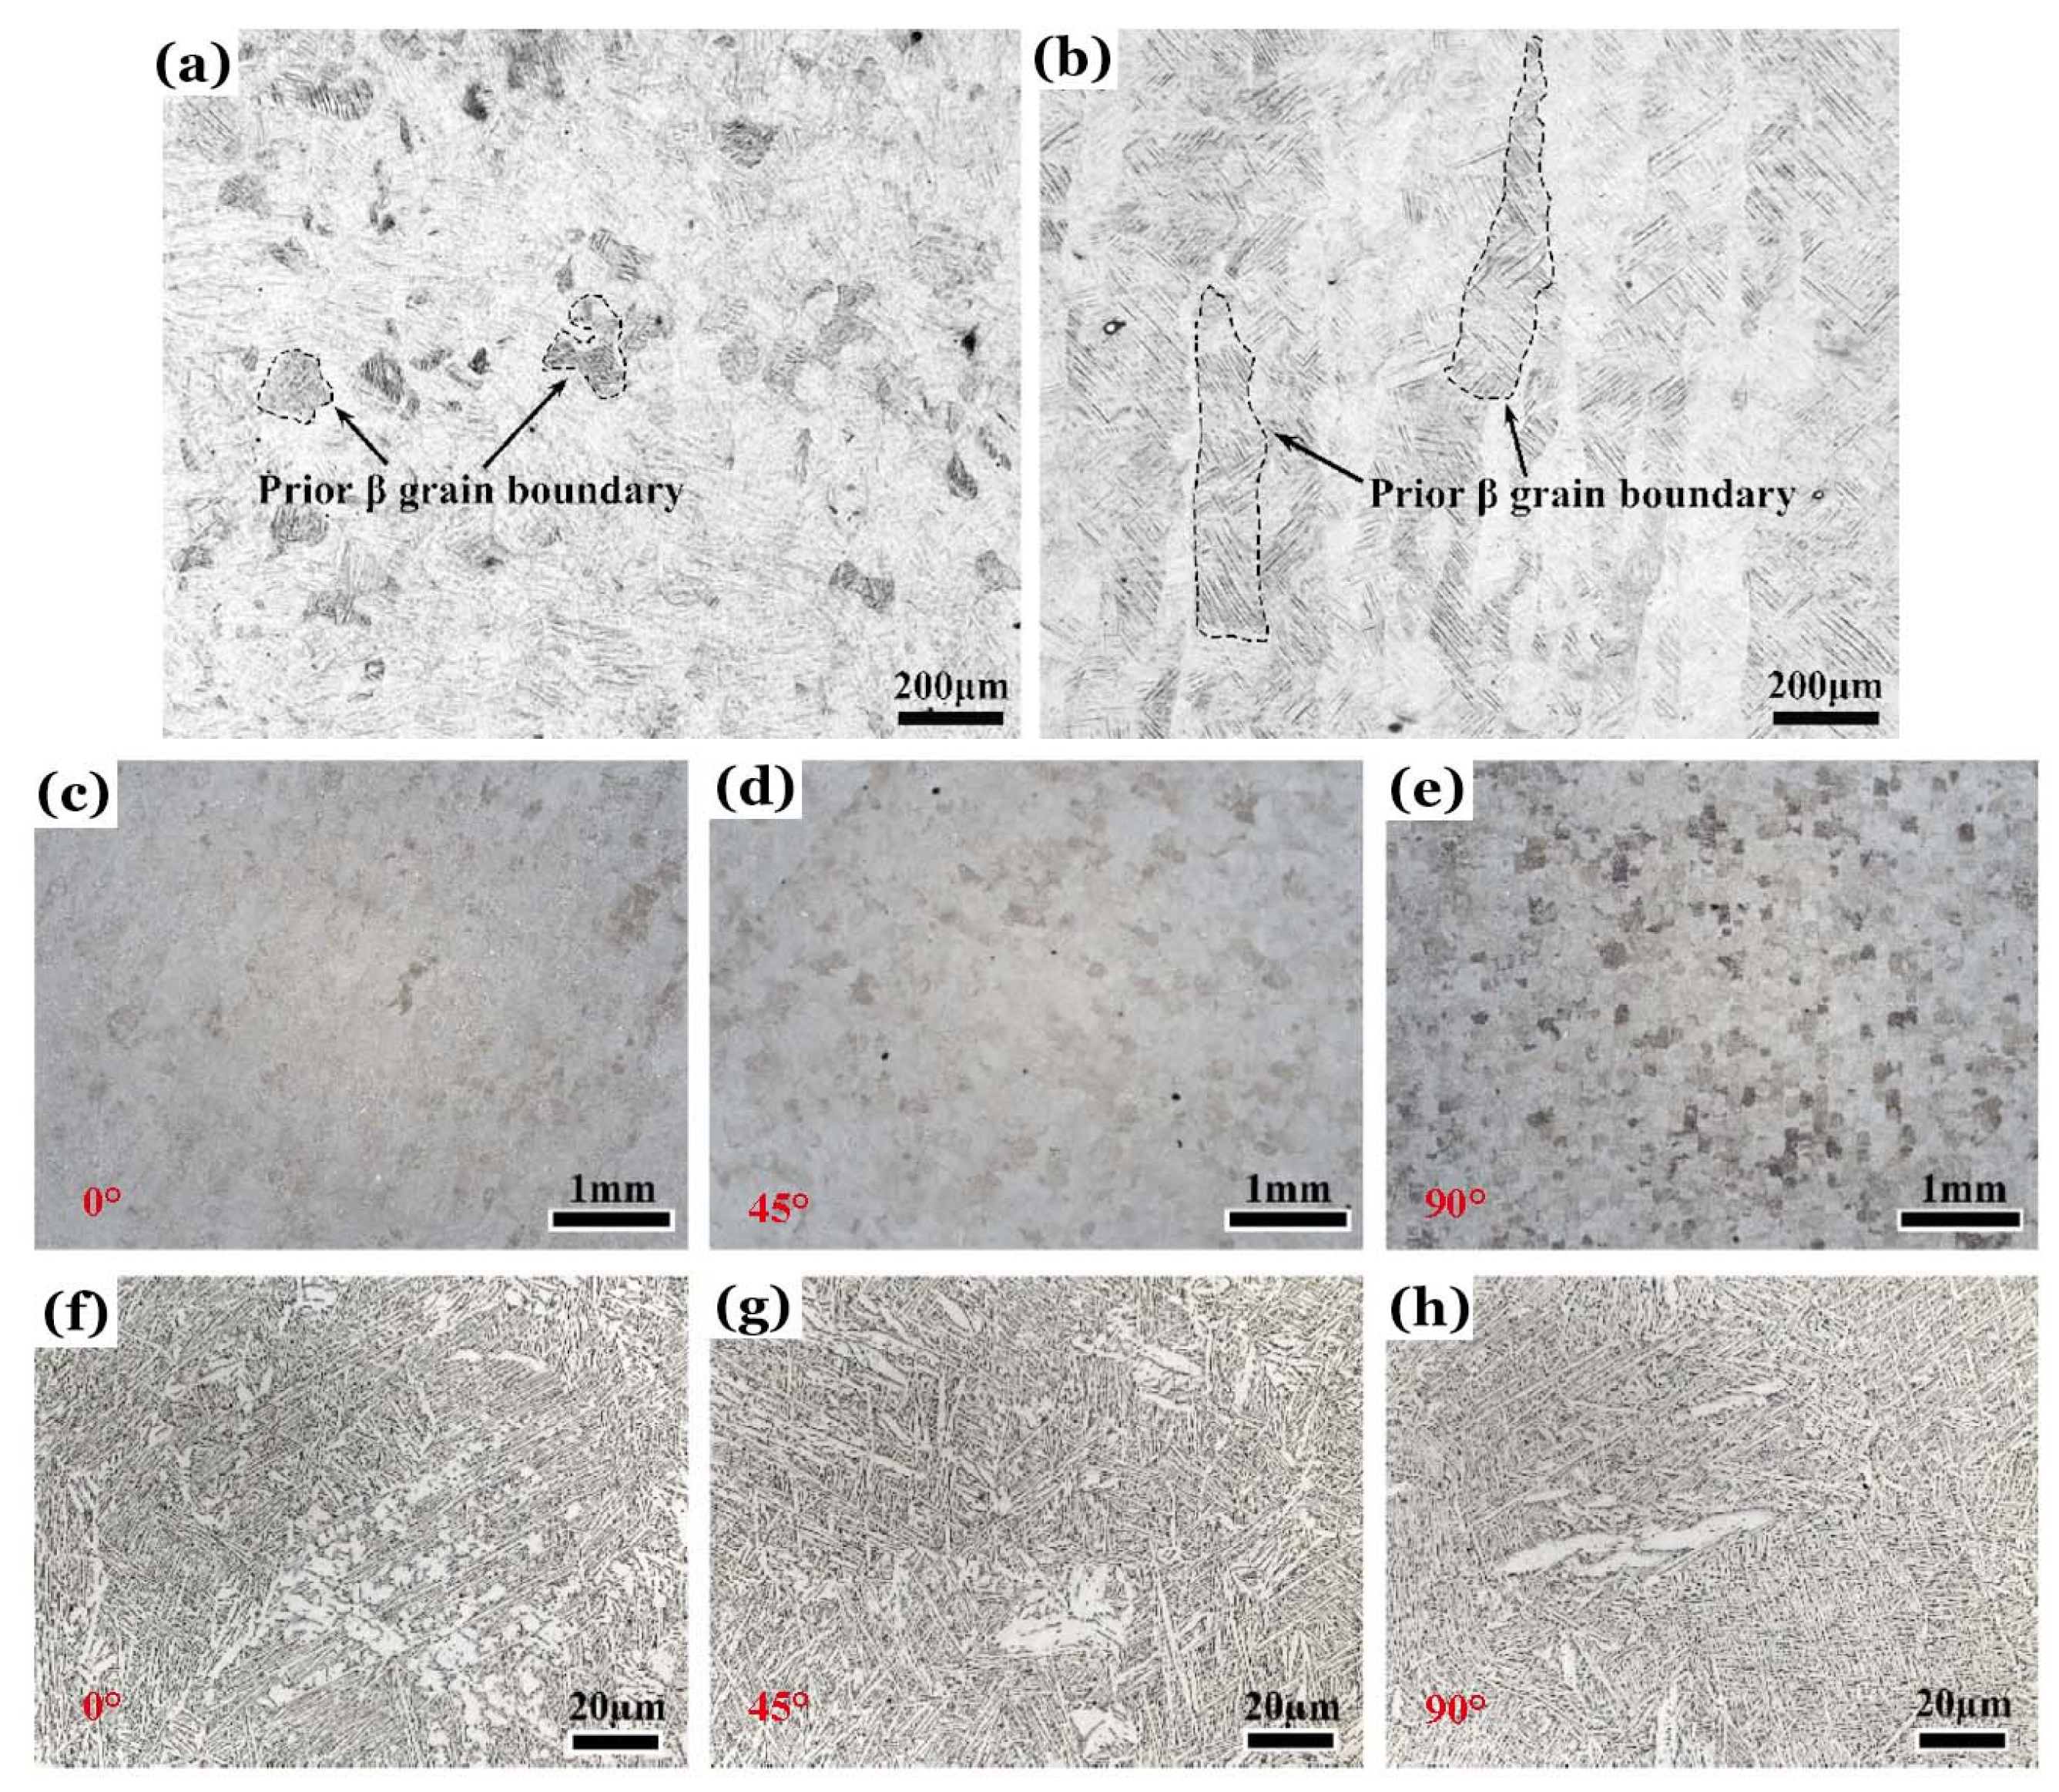
Figure 5 presents the typical OM microstructure of AMed titanium alloys via L-PBF [
6,
15].
Figure 5a is with an almost equiaxed microstructure (EM) of prior β grains on the cross section perpendicular to the building direction; and
Figure 5b is with almost columnar prior β grains on the cross section parallel to the building direction. Within the grain boundary as dashed in
Figure 5, the prior β phase have transformed to the lamellae of α and β, which constitutes lamellar microstructure (LM). The neighboring lamellae with a similar crystallographic orientation have stacked one by one to form an LM colony. Along the building direction, many LM colonies have piled up to a columnar grain of the prior β phase.
Figure 5c-h is for an AMed Ti-6Al-4V with different orientations of 0°, 45° and 90° [
6] by using another combination of PBF parameters and after heat treatment of an annealing, named Group 11. Their OM images show the microstructures on the cross sections perpendicular to the oriented specimen axes at a low and a high magnification. As the angle of orientation increases from 0° to 90°, a global EM morphology gradually emerges on the cross sections from
Figure 5c with blurred domains to
Figure 5e with clear grains of prior β. For the enlarged OM images of
Figure 5f–h, within the LM domains, there do not appear to be any significant differences in the cross sections for the oriented specimens, except for the presence of coarsened lamellar grains.
According to the traditional classification [
1,
2] of microstructural morphologies for the α + β typed titanium alloys, there are four basic microstructures: (1) EM of equiaxed α grains and transformed β domains [
16], (2) LM of lamellar α and β grains [
17], (3) bimodal microstructure (BM) of equiaxed α grains and LM domains [
18], (4) basket weave (BW) microstructure of lamellar α and β grains with irregular orientations.
Figure 5f–h shows an example of OM images for the BW microstructure. These four microstructures can be obtained by many specific procedure of thermal-mechanical processing.
2.3. Thermal-Mechanical Evolution of Defect and Microstructure
One of the major advantages of AM is the ease with which printed specimens with complex configurations can be manufactured, but that also limits the possibility of further mechanical processing. For example, the complexly shapes cannot be rolled, forged, stamped and so forth [
19]. This leaves hot isostatic pressing (HIP) as the most popular methods of thermal-mechanical processing for the AMed specimens.
In the HIP process, the specimens are simultaneously subjected to both high temperatures and high isostatic pressures using a gaseous transfer medium. The main factor that distinguishes HIP from other processing techniques is the use of gas as a pressure transfer medium to induce equivalent changes in three dimensions in the material it surrounds. For a successful HIP, three variables must be properly controlled: temperature, pressure and time. [
20]
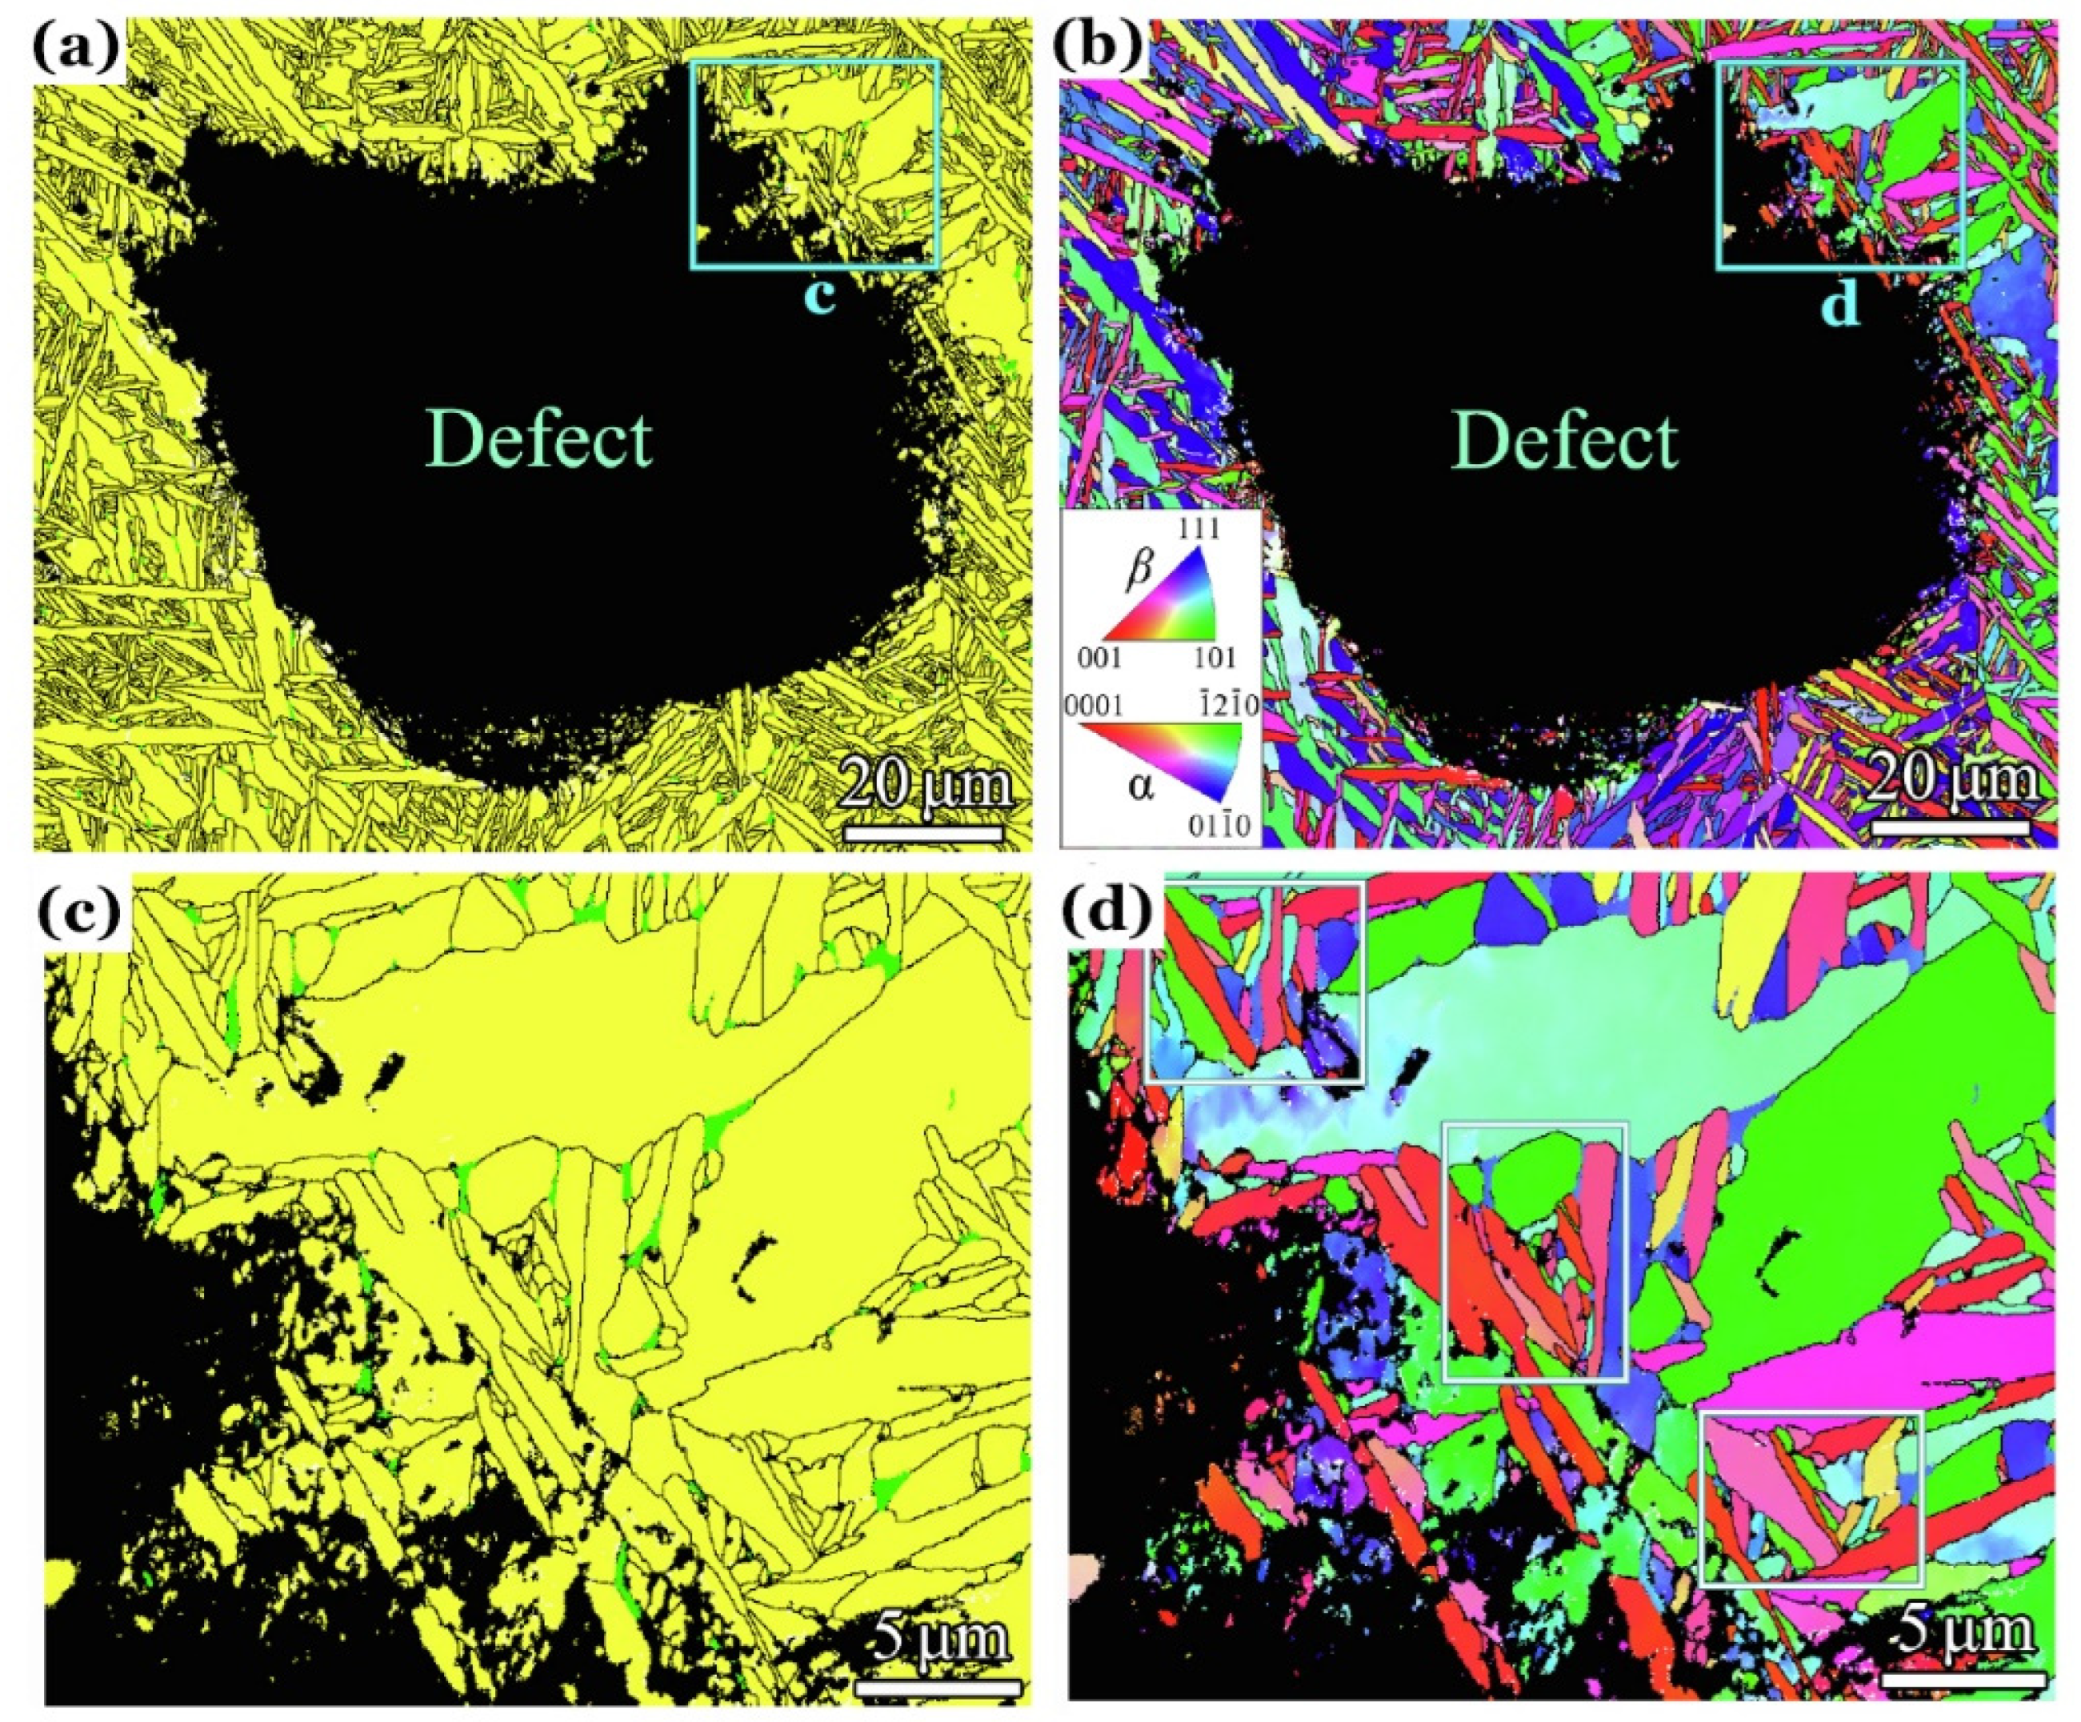
Figure 6 and
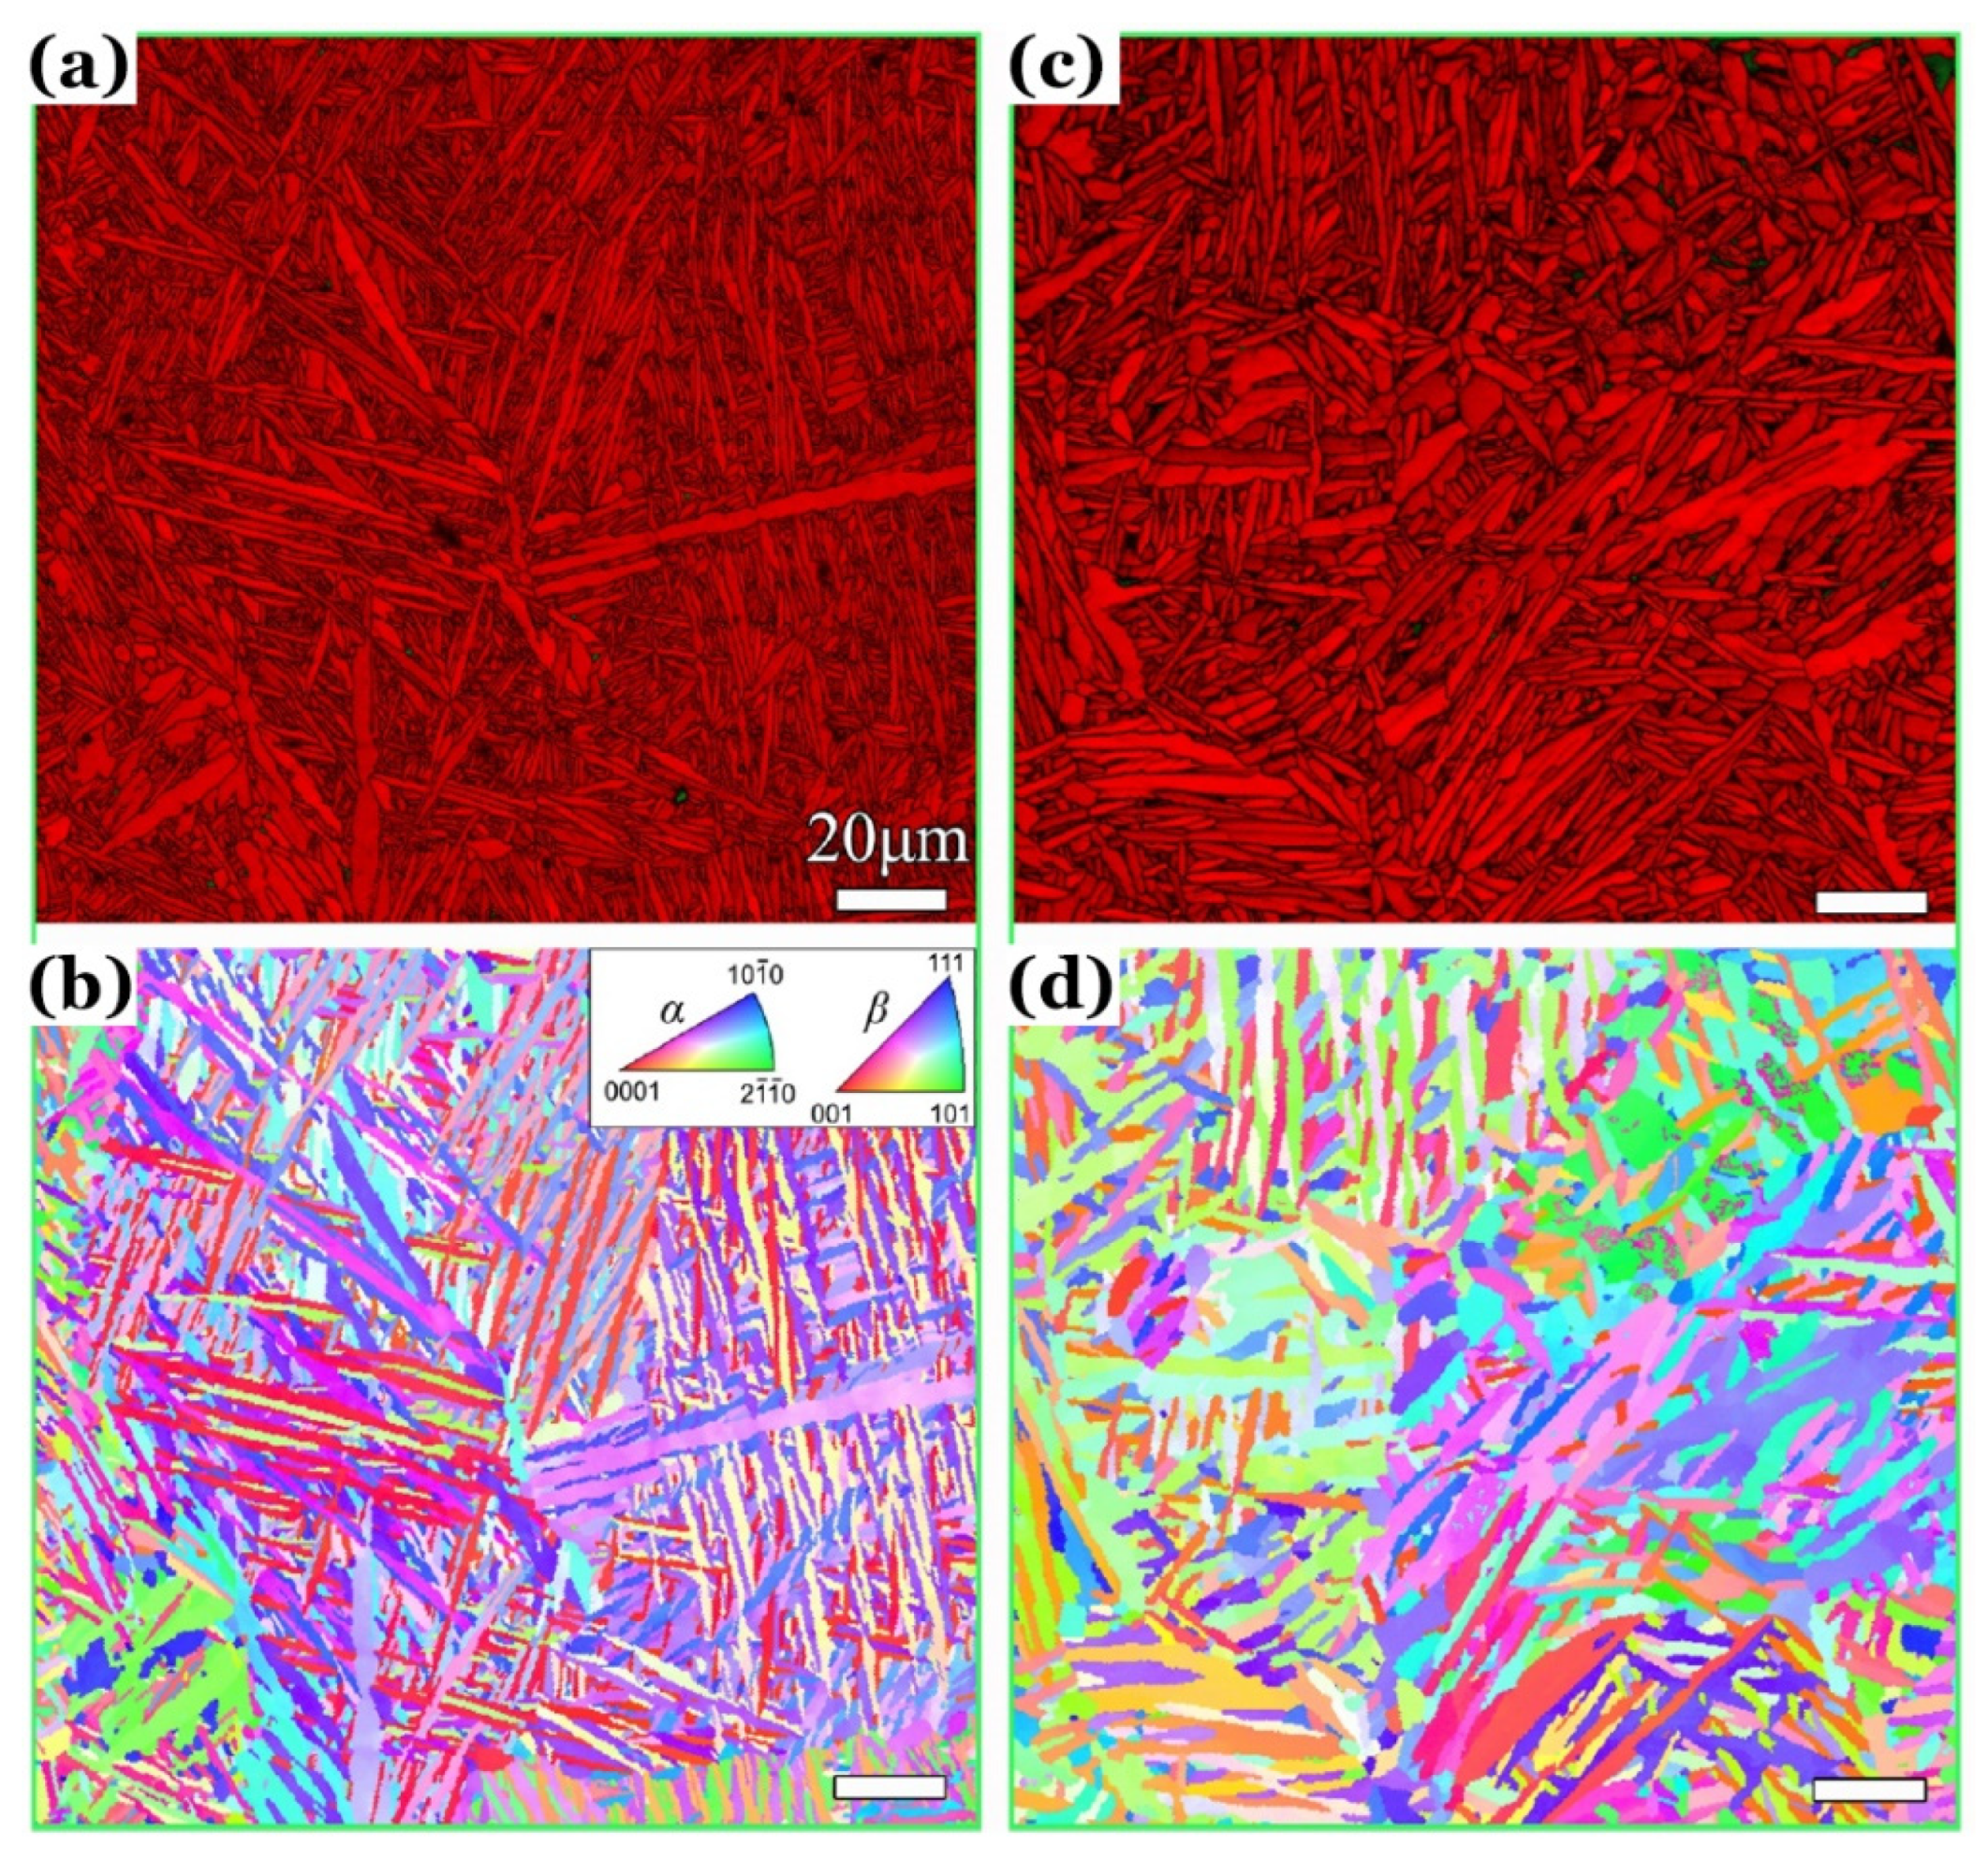
Figure 7 give an example to describe the effect of HIP on the AMed microstructure and metallurgical defects of the specimen. Chi et al. [
21,
22] vertically printed two batch of specimens for an AMed Ti-6Al-4V via L-PBF, subsequently heat-treated for 2 hours at 710 °C in vacuum, and then cooled in Argon atmosphere. This parameter combination of the PBF processing and the annealing was named as Group 12, in which one batch was selected to further post-treat with a HIP, at 920 °C and 1000 bar for 2 hours in Argon atmosphere. As a control group, the other batch of specimens is without any post process.
Figure 6 shows a characterization of electron backscatter diffraction (EBSD) for a very local region around an AM defect on a cross section cut from these specimens of Group 12 without HIP. No difference was observed in the local microstructure of the defect edges from that of the LM or BW matrix.
Figure 7 gives a visual comparison of the EBSD morphologies for the AMed matrix after the heat treatment (Group 12) and then with (
Figure 7a,b) or without (
Figure 7c,d) this HIP treat.
In general, the main purpose of HIP is focused on the effectiveness in eliminating the void-types of metallurgical defects; and the side effect is equivalent to doing additional heat treatment, which will coarsen the AMed microstructure. For Group 12, along the building direction, the tensile properties of the specimens without HIP [
21] are:
σy = 951 MPa,
σu = 1007 MPa, and the elongation is about 14% at fracture. Comparatively, the specimens with HIP [
22] are:
σy = 849 MPa,
σu = 946 MPa, and a longer elongation. This is attributed to the additional annealing of the HIP, i.e., at 920 °C for 2 hours.
3. Fatigue Behaviors in High-Cycle and Very-High-Cycle Regimes
3.1. S-N Data and Curves
Figure 8 shows S-N data and curves for AMed Ti-6Al-4V alloys via L-PBF with different combinations of processing parameters, heat treatments, surface states and building orientations. The abscissa is the failure cycle
Nf, and the ordinate is the applied stress amplitude
σa. All fatigue tests were conducted at room temperature and in ambient air by axial cycling at an ultrasonic frequency of 20k ± 500 Hz.
Figure 8a is for the combinations of Groups 1 ~ 10 under stress ratios
R = –1 [
9]. The fatigue specimens of Groups 1 ~ 10 were vertically printed to hourglass shapes; after heat treatment, the specimens were ground and polished to the final dimensions [
9,
15].
Figure 8b is for vertically printed specimens with a combination Group 13 of L-PBF parameters of
p = 325 W,
t = 0.03 mm,
v = 1300 mm/s,
h = 0.12 mm, and
E = 69.44 J/mm
3 [
23], then stress relieved by heating at 600 °C for 2 hours. Along the building direction, the Vickers hardness is 367 HV, and
σy = 1068 MPa,
σu = 1202 MPa. The fatigue specimens were divided into two batches: one retained the directly printed rough surface, called As-built; and the other had a polished surface, called Polished.
Figure 8c is for Group 11 [
6]. The fatigue specimens were printed with orientations of 0°, 45° and 90°; and the tensile properties along these orientations of were not reported in Ref. [
6].
3.2. Specimens with Different Surface States
The S-N curve of As-built specimens for Group 13 is with a slope in high-cycle regime (N < 107 cycles) and a horizontal asymptote at negative stress ratio of R = –1. All specimens failed by high-cycle fatigue (HCF, Nf < 107 cycles) while σa > 80 MPa, and either failed in the HCF stage or survived beyond 109 cycles while σa < 80 MPa. No VHCF occurs.
The S-N curve of Polished specimens for Group 13 has two slopes in high-cycle and very-high-cycle regimes, respectively, at R = –1; and changes to a single slope from HCF to VHCF at R = 0.7. The fatigue strengths at 107 cycles are: σa7 = 130 MPa at R = –1, and σa7 = 80 MPa at R = 0.7. VHCF can occur at the both stress ratios of R = –1 and 0.7.
For Group 13,
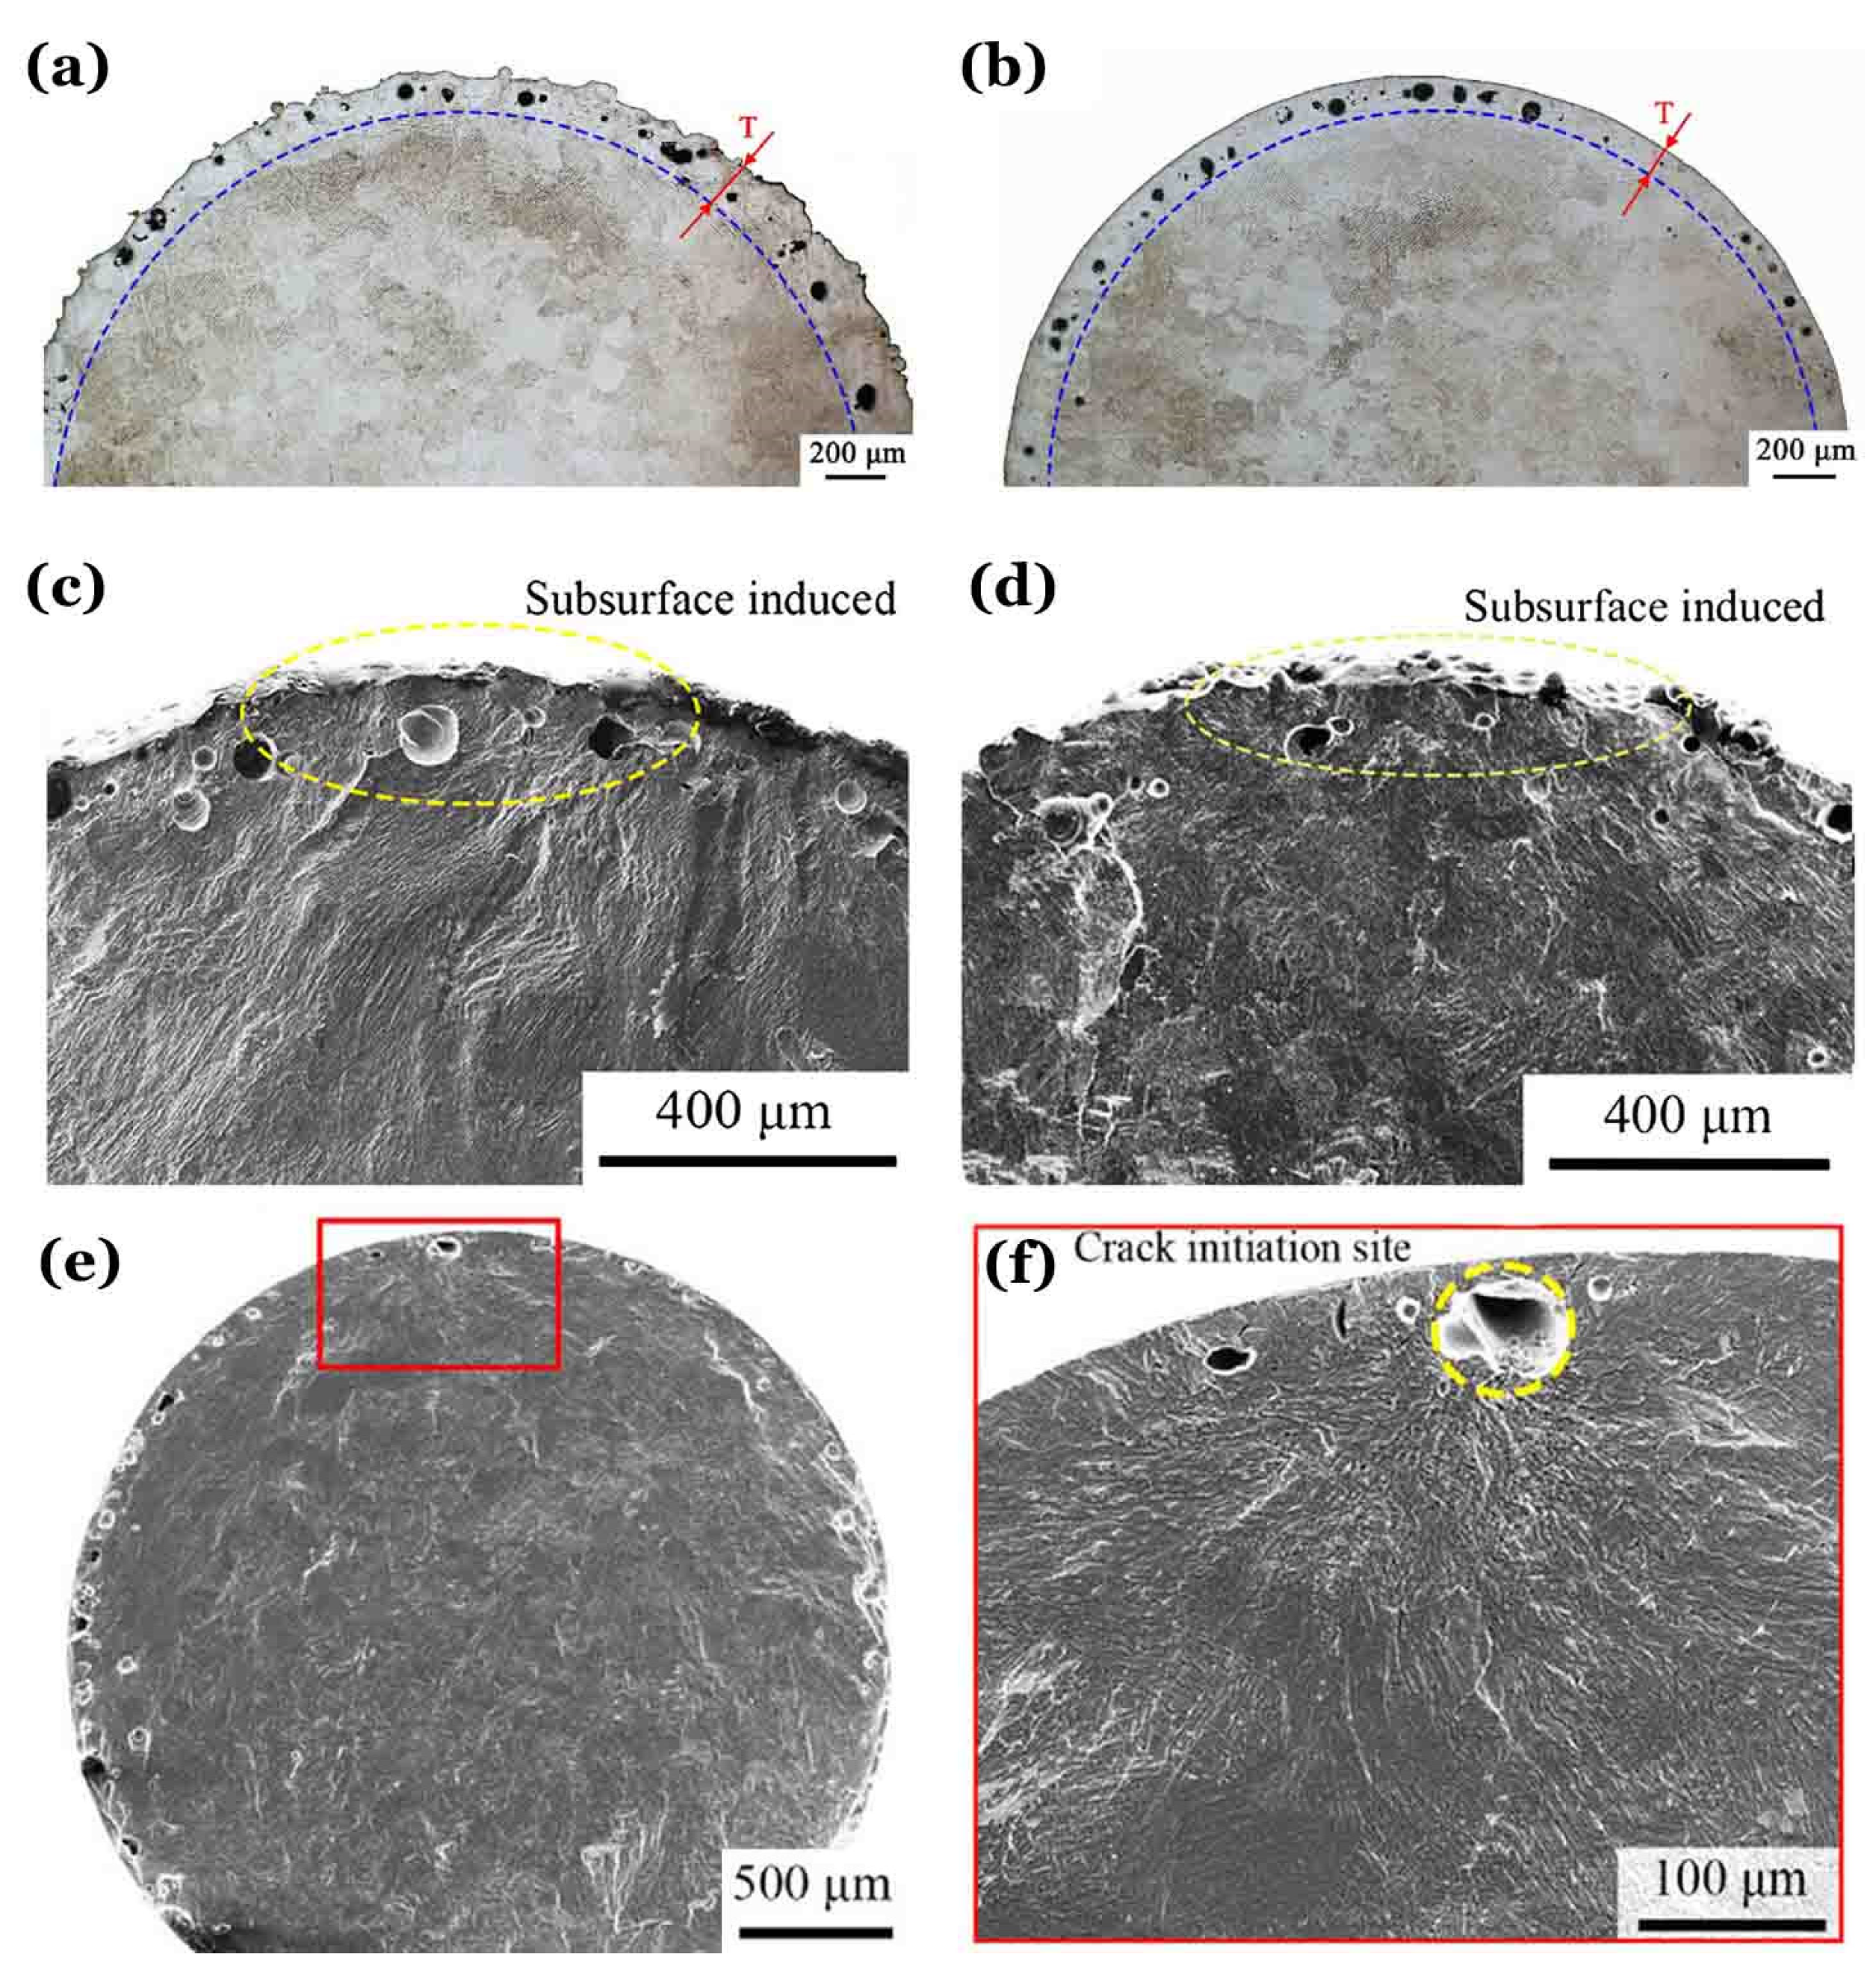
Figure 9 a and b of OM images presents the AM defect distributions on the horizontal cross sections of As-built and Polished specimens with metallographic etching. There is a defect-enriched layer with an offset distance
T inward from the surface for both As-built and Polished specimens due to different AM strategies for surface and inner filling as shown in
Figure 1a.
Figure 9c-f shows the representative morphologies of fatigue fracture surfaces imaged by scanning electron microscopy (SEM).
Figure 9 c and d is for HCF of As-built specimens, in which fatigue failure was induced by cooperative interactions of directly printed rough surface and subsurface enriched defects.
Figure 9 e and f gives an example of VHCF for Polished specimens, the enriched subsurface defects still appeared on the fracture surface as shown in
Figure 9e, and the final failure originated from a subsurface defect as shown in
Figure 9f.
It should be noted that although the fatigue cracks lead to the final failure initiated from the edge of the subsurface defect, this does not indicate that the failure type of the AMed specimens can be classified as a surface one. In fact, the classification of failure types should be based on the overall macroscopic fractography rather than on some local fracture characteristics [
24].
3.3. Specimens with Different Processing Parameters
For Groups 1 ~ 10 of different L-PBF parameters, in
Figure 8a, the hollow and solid symbols represent fatigue failure induced by surface and internal crack initiation. Fatigue performances are optimized with decreasing porosity of Groups 1 ~ 10, and single S-N characteristics become duplex or stepwise at negative stress ratio of
R = –1. The fatigue strength at 10
7 cycles from
σa7 = 75 MPa enhancing to 300 MPa.
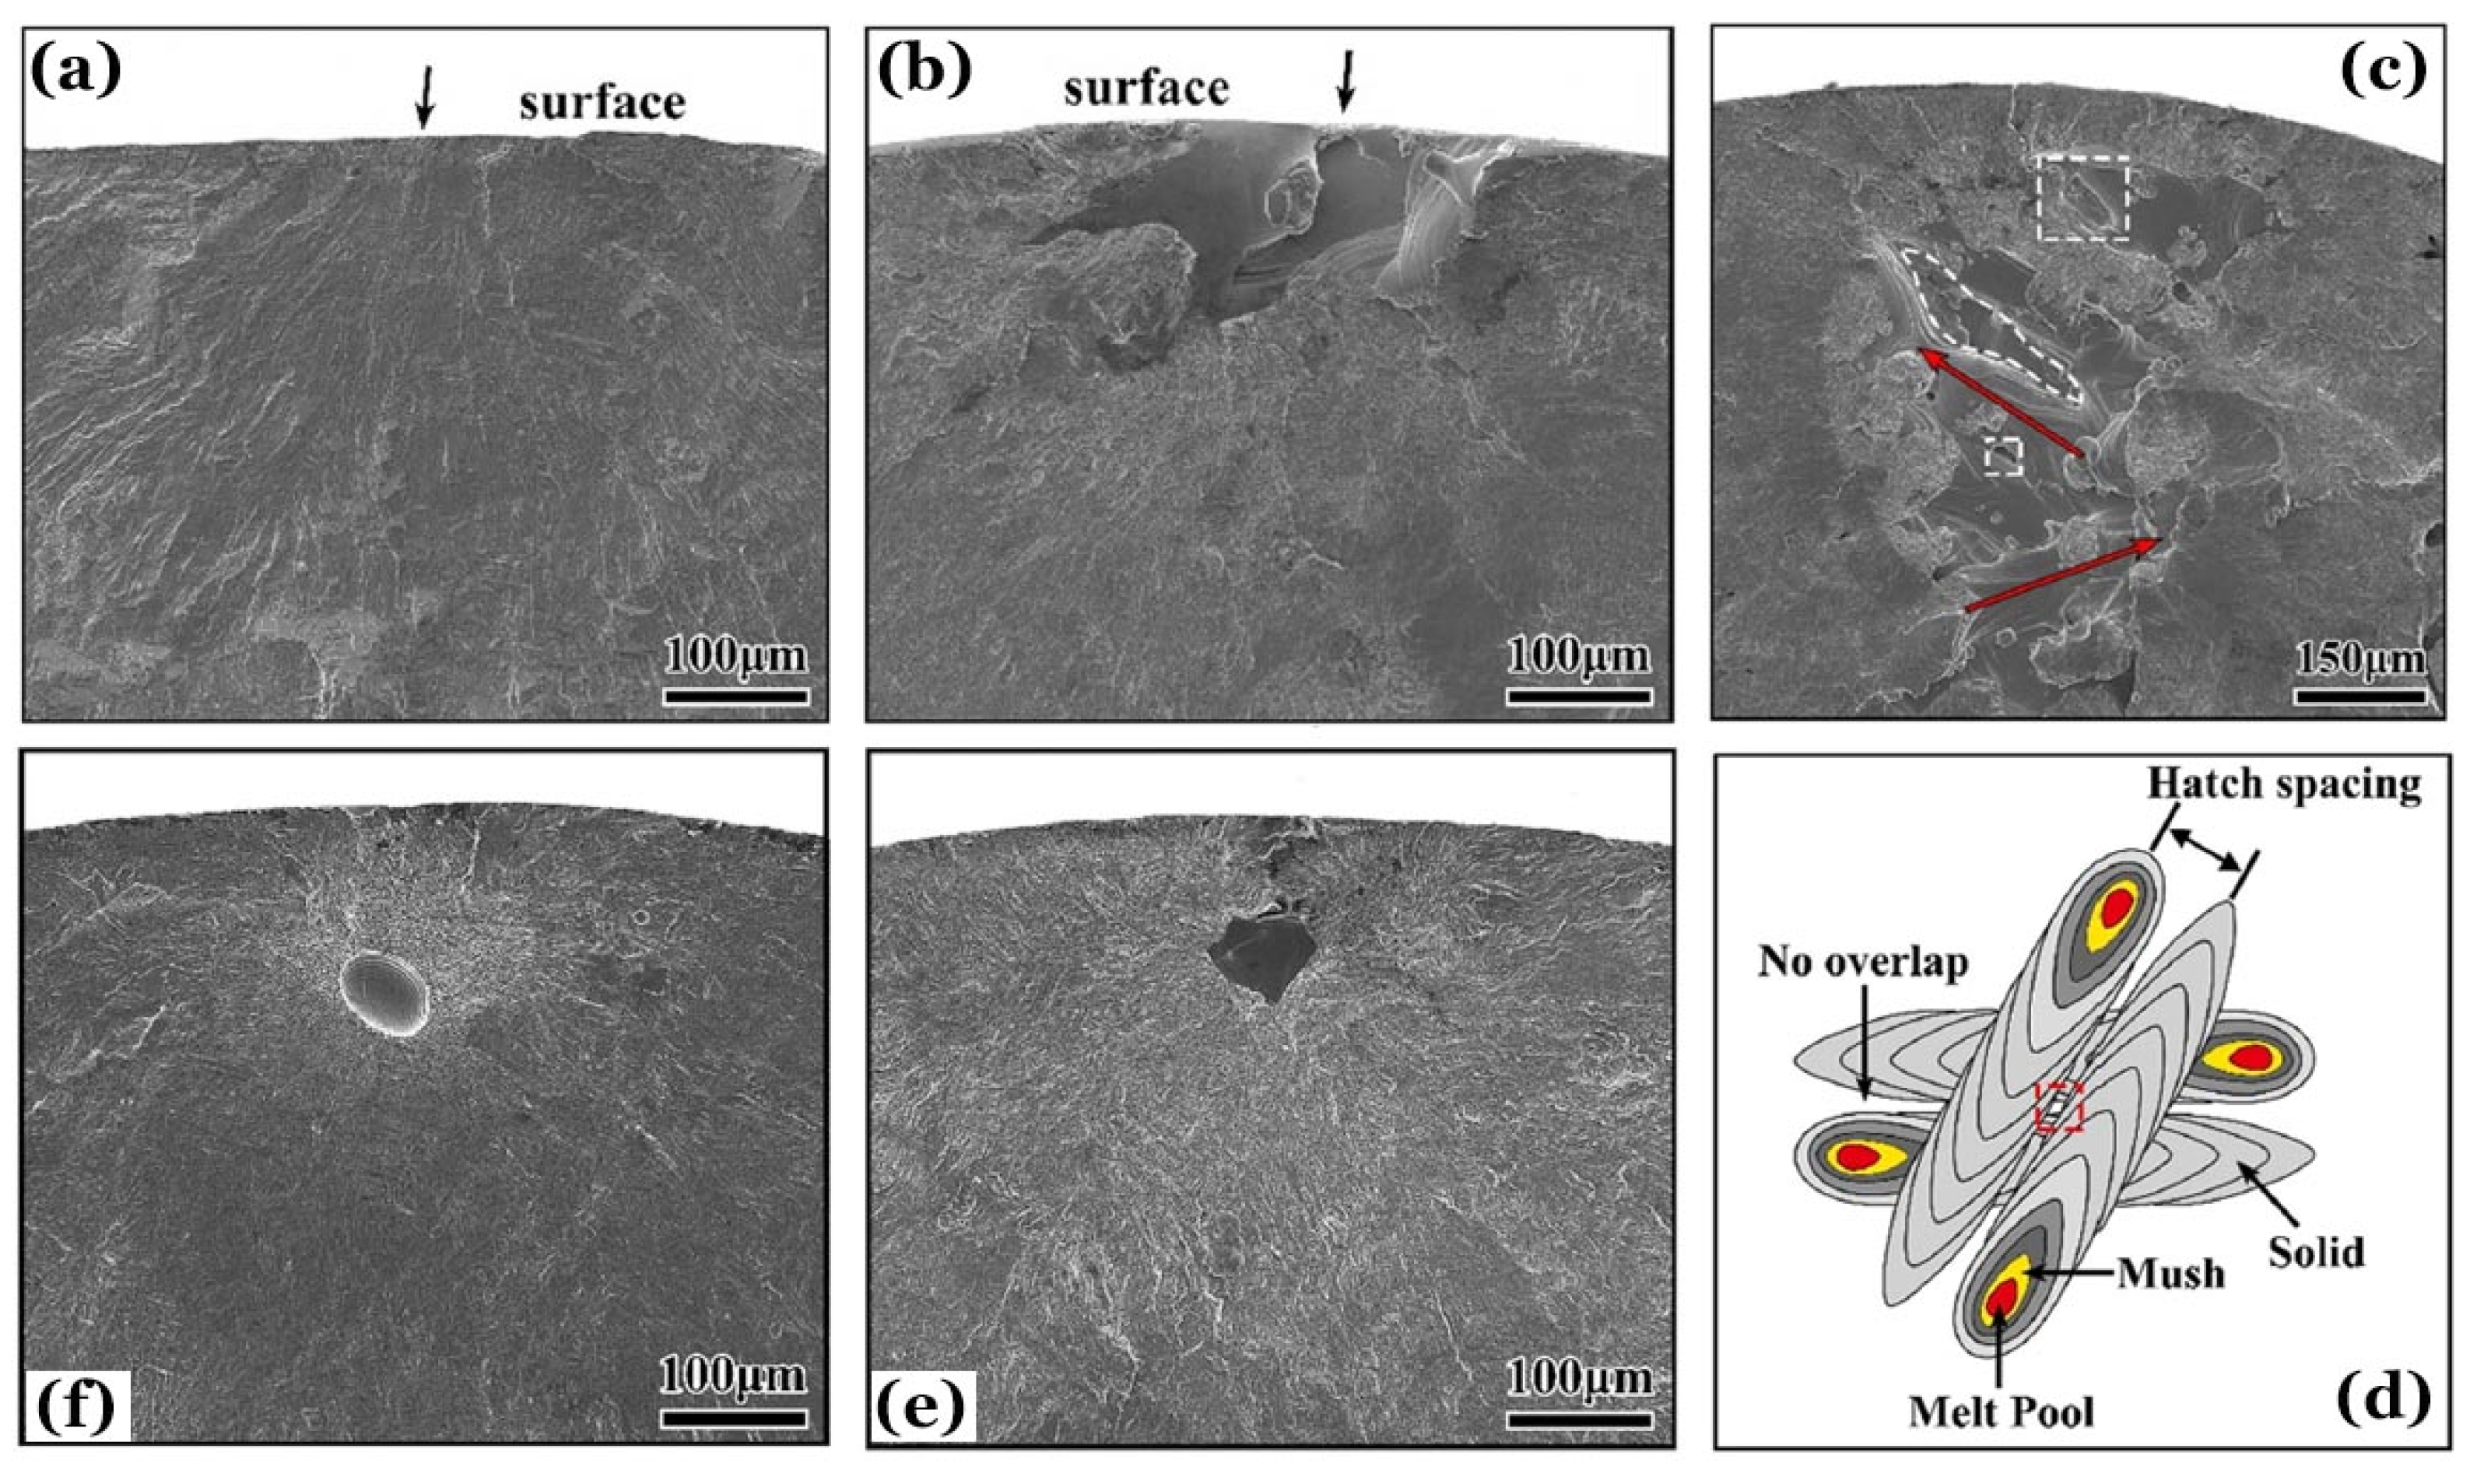
Figure 10 demonstrates typical morphologies of fatigue crack initiation for different failure types.
Figure 10a,b of SEM images is for HCF induced by specimen surface and a surface defect, respectively.
Figure 10c of SEM image is for VHCF induced by an irregular void-typed defect at specimen subsurface caused by AM process.
Figure 10d schematically draws the possible formation process of this AM defect.
Figure 10e and f of SEM images is for VHCF induced by subsurface AM defects with different shapes or types.
Figure 9a,b also presents an EM of prior β grains distributed on the cross sections perpendicular to the building direction. Their equivalent diameters are in a same order of magnitude as the transverse dimensions of columnar grains as dashed in
Figure 5a,b. Consequently, the yield strength and UTS of As-built and Polished specimens for Group 13 are close to those for Group 10. However, their fatigue performance varies greatly in both HCF and VHCF regimes. The fatigue strength of As-built specimens is only comparable to that of specimens for Group 3 with the highest porosity in HCF and VHCF regimes. The HCF strength of Polished specimens is between those of specimens with the second and third highest porosity for Groups 2 and 8, and the VHCF strength is even lower than the latter two. This indicates that the weakening of fatigue strength, especially in VHCF regime, is attributed firstly to the directly printed rough surface and secondly to the subsurface enriched defects in the AMed specimens of titanium alloys.
3.4. Internal Crack Initiation with Different Building Orientations
For Group 11 with orientations 0°, 45° and 90°, the fatigue specimens were coaxially machined from the heat-treated round bars of AMed Ti-6Al-4V, and then ground to the final hourglass shapes. In the range of 200 MPa ≤ σa ≤ 500 MPa, all specimens failed by internal crack initiation in HCF and VHCF regimes regardless of failure cycles. The S-N curves show continuously decreasing slopes with low data scatter. Basically, the specimens with 0° orientation had the best fatigue resistance, followed by 45° and 90°, although the differences in their values are inconsiderable.
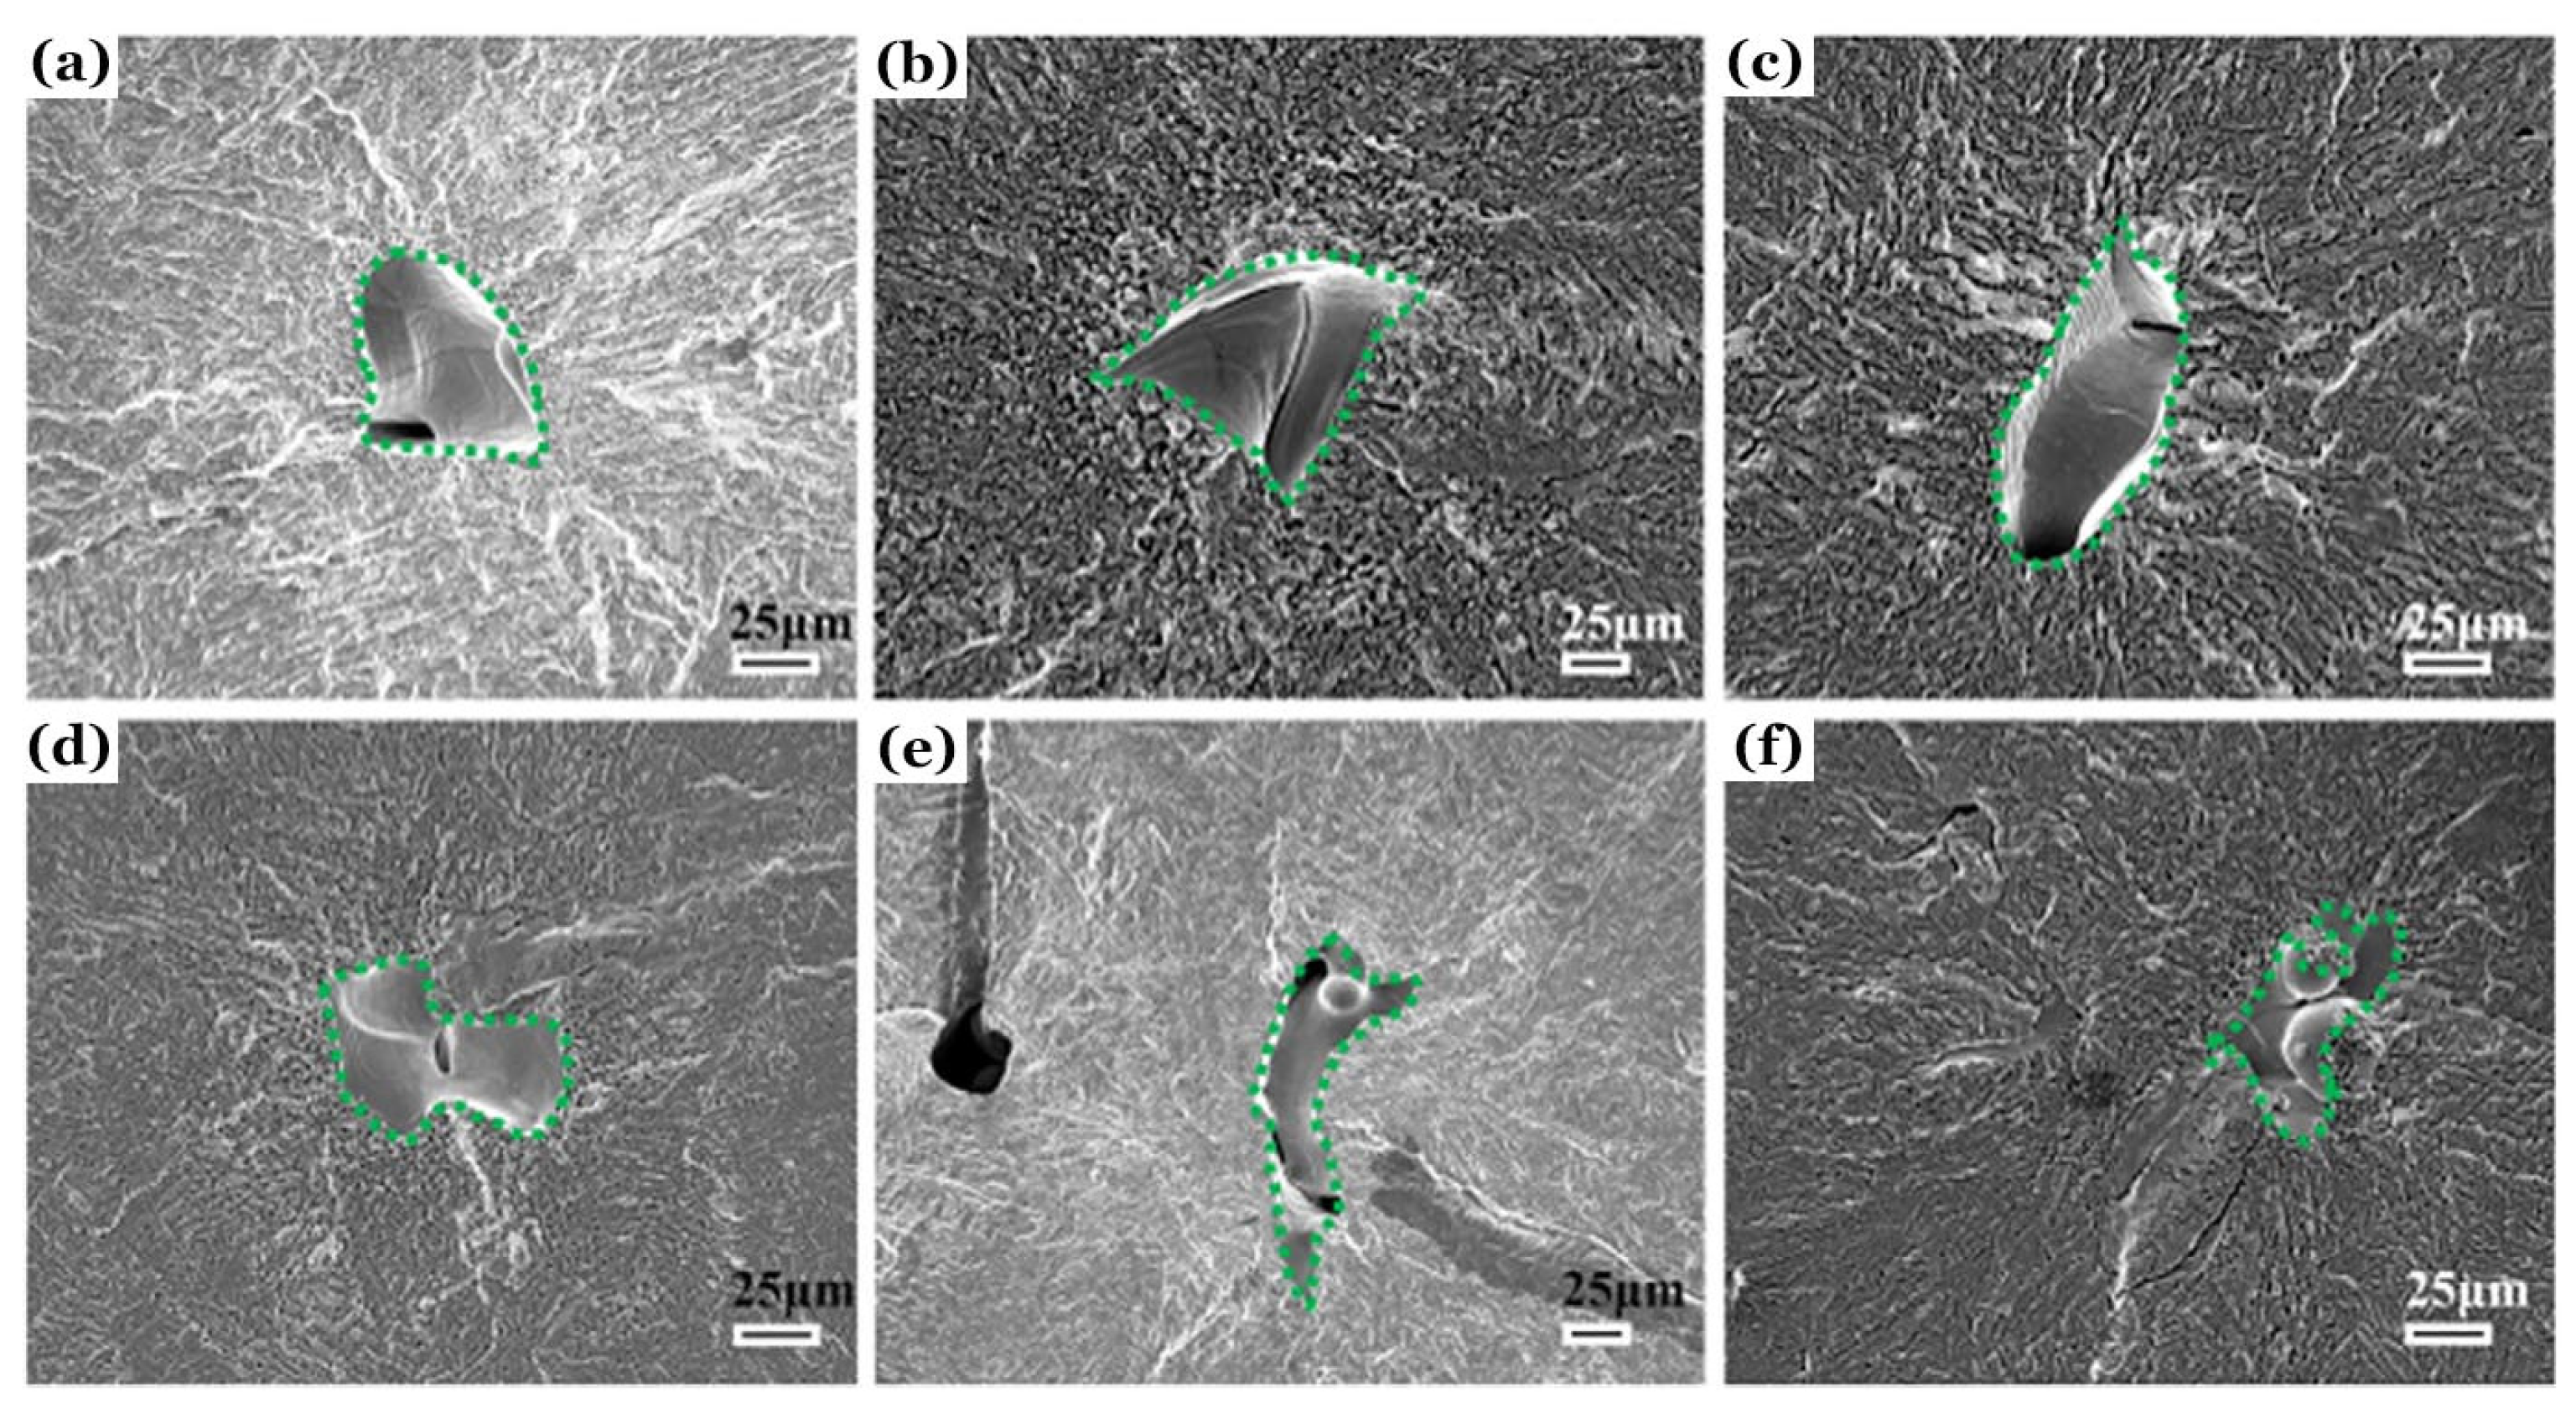
Figure 11 provides the representative SEM morphologies of crack initiation for these specimens, in which the main cracks originated from the AM defects at the specimen interior. There appears to be a certain orientation relationship of these critical AM defects that lead to the ultimate fatigue fracture. The AM defect in
Figure 11a can be tilted 45° to obtain the defect in
Figure 11b, and then tilted a further 45° to obtain the defect in
Figure 11c. They also seem to be interpreted by
Figure 10d.
Figure 11d–f gives alternative situations for other metallurgical defects with different shapes or AM types.
The AM defects in Group 11 have projected areas on the fracture surfaces of about the same order of magnitude as those in Group 1 as shown in
Figure 10e. In comparison of the crack initiation behaviors above mentioned, the location of fatigue origin tends to be the specimen interior (Group 11) rather than on the directly printed rough surface, polished surface, subsurface enriched defects (As-built and Polished specimens of Group 13) or other subsurface defects (Group 1 ~ 10) as the depth of the layer removed from the specimen surface increases. As a result, the fatigue resistance of Group 11 is much better than that of Groups 1 ~ 10 and 13. Even for Group 10, which has the lowest porosity, its HCF resistance is significantly lower than that of Group 11.
4. Effect of Stress Ratio on Fatigue Strength and Fractography
4.1. S-N Data with Various Stress Ratios
Fu et al. [
25] vertically printed a batch of round bars for an AMed Ti-6Al-4V by using L-PBF with the same parameters of processing and heat treatment as Group 13. The porosity is 2.93%, and the tensile properties are:
σy = 1191 MPa, 1246 MPa and
εt = 5.6%, along the building direction. The fatigue specimens were coaxially machined from the round bars, then ground and polished to hourglass shapes for ultrasonic push-pull and pull-pull cycling at a loading frequency of 20k ± 500 Hz in ambient air and at room temperature. These specimens were named as Group 14.
Figure 12 shows the S-N data in terms of the applied maximum stress
σmax for the AMed Ti-6Al-4V alloys with different L-PBF processing and heat treatments of Groups 10 (
Figure 12a), 14 (
Figure 12b) and 12 (
Figure 12c) under various stress ratios of
R = –1, –0.5, 0.1, 0.2 and 0.5.
For Group 10 of
Figure 12a, in the range of 300 MPa ≤
σmax ≤ 800 MPa, the S-N data exhibit continuous decreasing shape for the failure life from 10
5 to 10
9 cycles. While
σmax > 500 MPa, 2 specimens were tested and failed by surface crack initiation induced HCF; while
σmax < 500 MPa, 6 specimens were tested, 1 runs out and others failed by internal crack initiation induced VHCF. At
σmax = 500 MPa, 2 specimens were tested, 1 failed by surface crack induced HCF and the other by internal crack induced VHCF.
4.2. Crack Initiation Morphologies for Case-I
For Group 14 of
Figure 12b, the fatigue resistance in terms of maximum stress first decreases and then increases as the stress ratio of the
R value increases. Among
R = –1, –0.5, 0.1 and 0.5, the specimens under
R = 0.5 have the highest
σmax,
R = –1 the second,
R = 0.1 the third and
R = –0.5 the lowest. All fatigue specimens failed in VHCF regime were classified to internal crack initiation.
While R = –1, 25 specimens were tested, 2 run out of 109 cycles, 21 failed by internal crack initiation induced VHCF or HCF, and only 1 failed by surface crack initiation induced fatigue failure at Nf = 3 × 10⁵ cycles under σmax > 300 MPa, which has the shortest Nf and the highest σmax. While R = –0.5, 13 specimens were tested, 1 runs out of 109 cycles at σmax < 100 MPa, and other 12 failed in HCF or VHCF regime caused by internal crack initiation in the range of 100 MPa < σmax < 250 MPa. While R = 0.1, 11 specimens were tested and all fatigue failed by internal crack initiation in HCF and VHCF from 2 × 10⁵ to 5 × 10⁸ cycles, regardless of failure life. While R = 0.5, 24 specimens were tested, 1 runs out of 109 cycles at σmax = 200 MPa, and the others prefer (18/19) to internal crack initiation in the range of 300 MPa < σmax < 400 MPa.
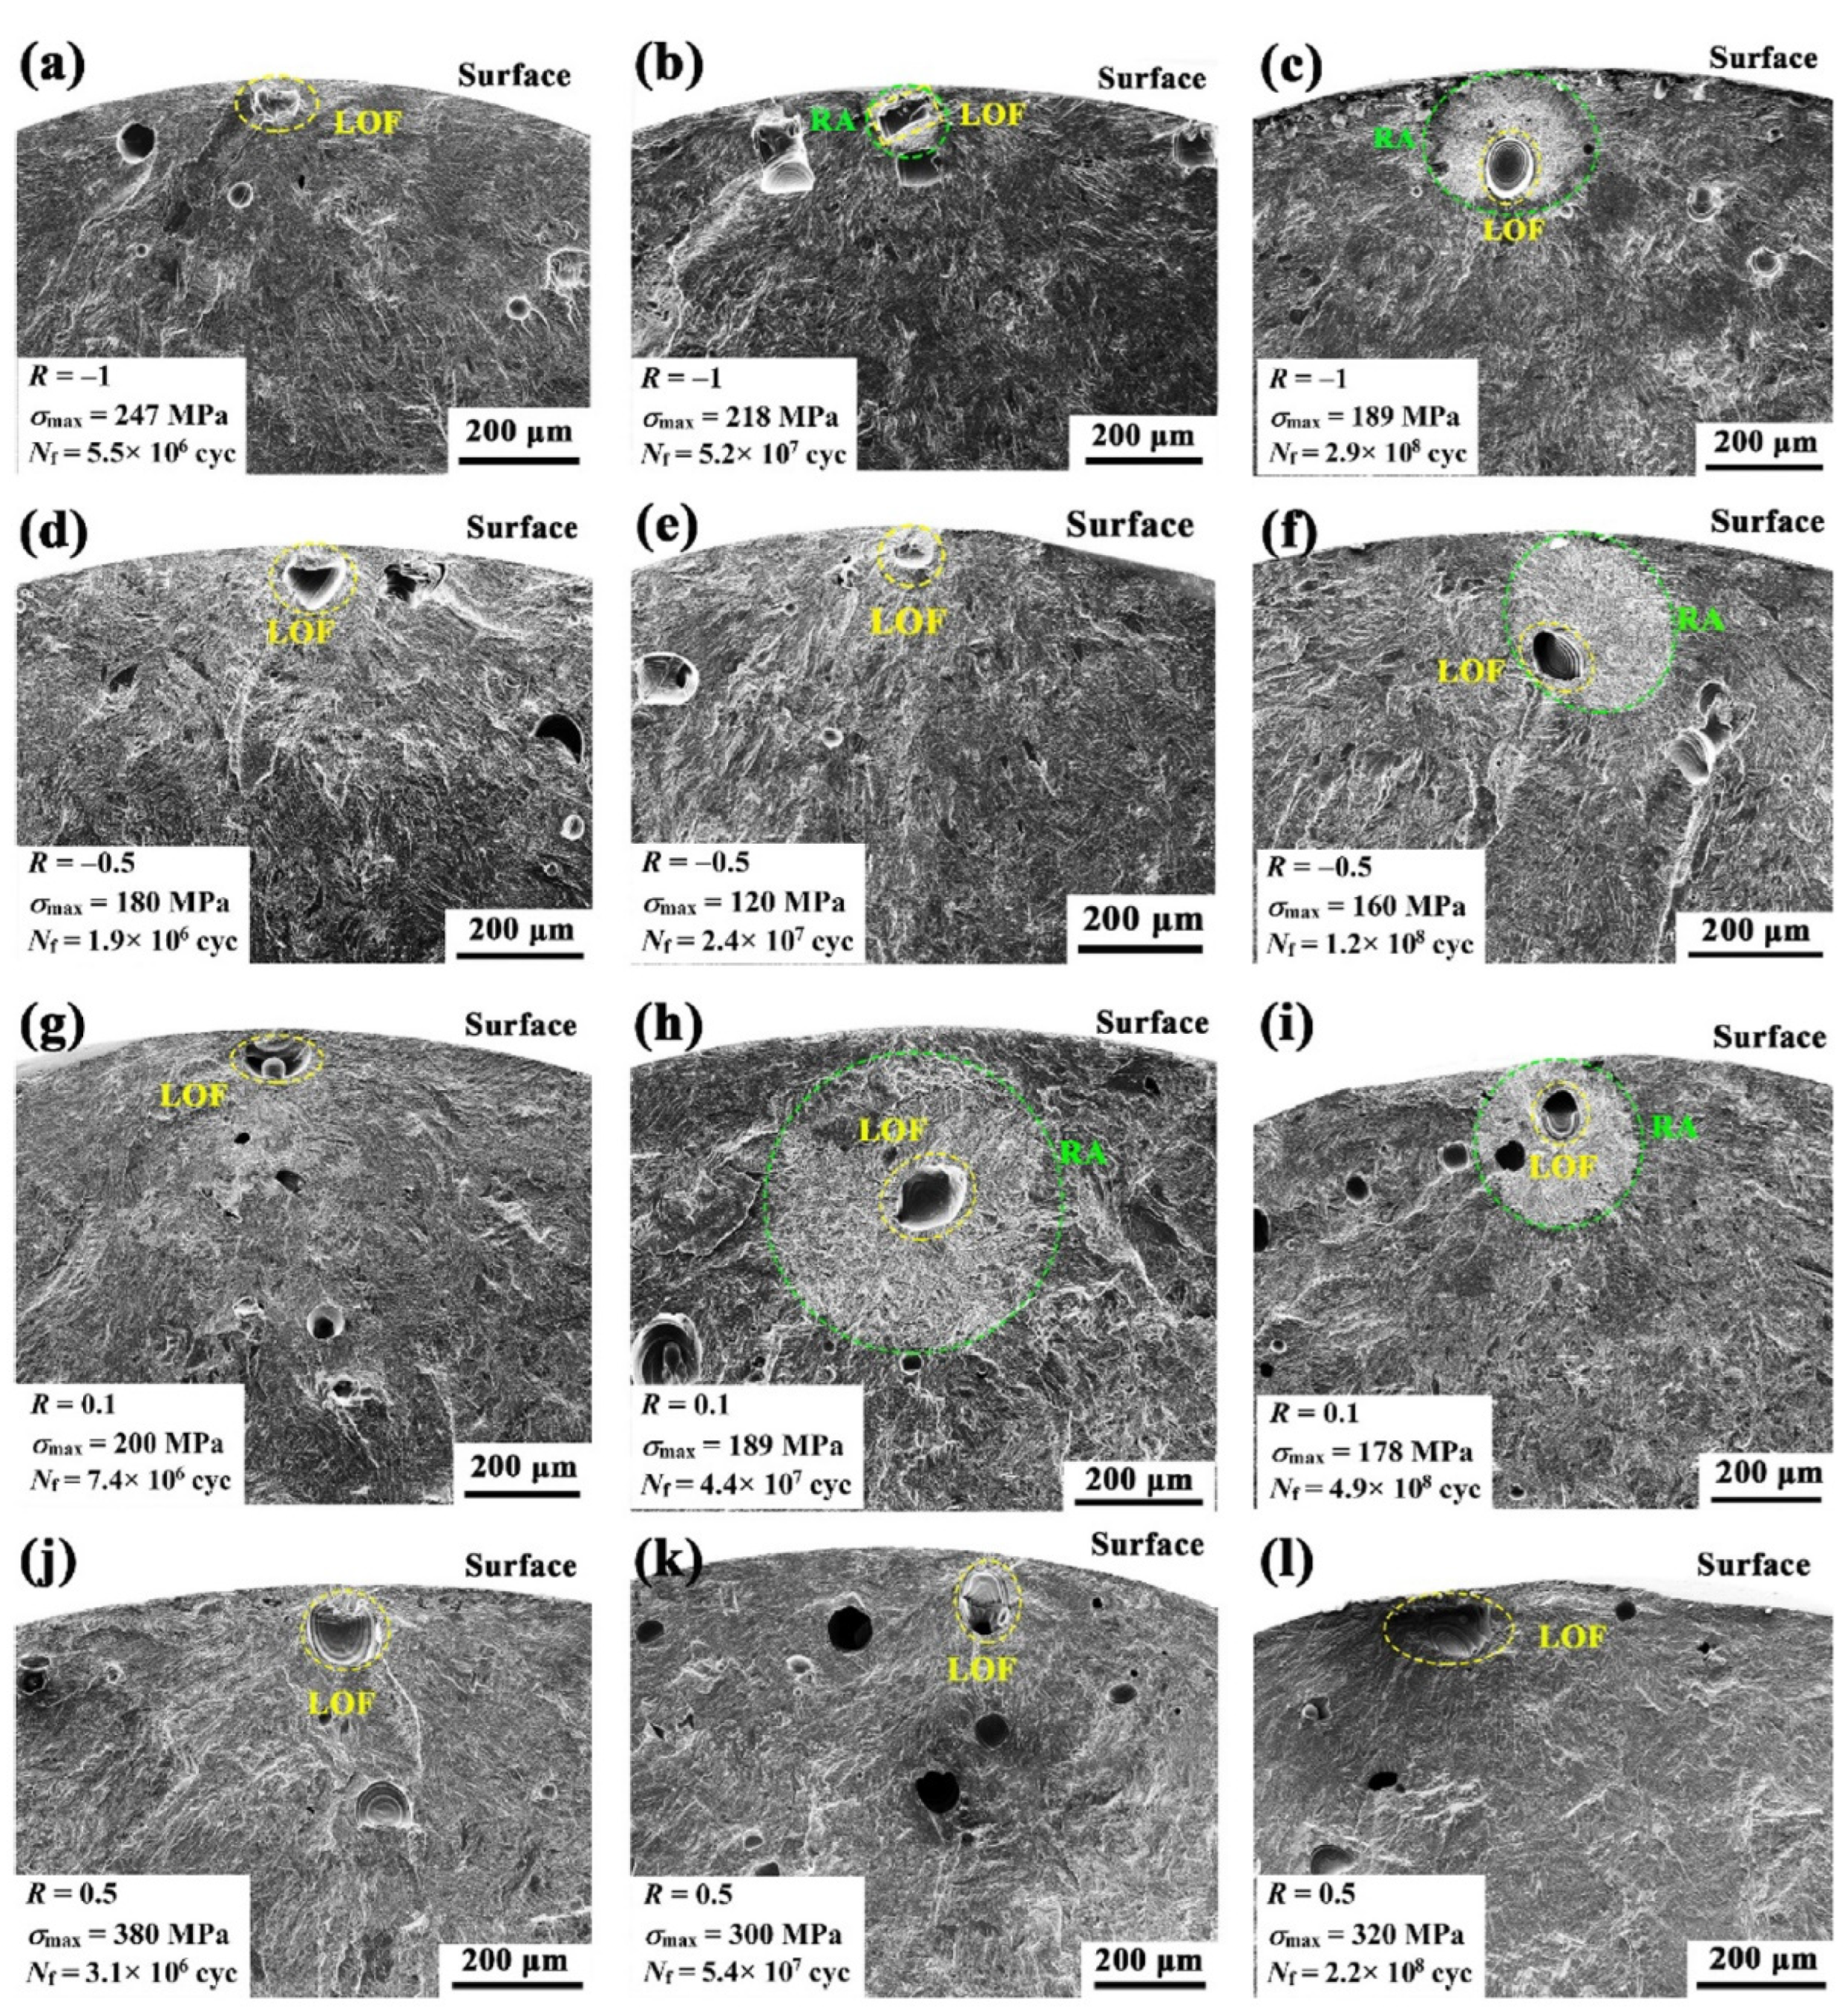
Figure 13a–l offers representative SEM images of crack initiation and growth morphologies on the fracture surface for selected specimens failed in different fatigue regimes and stress ratios. In these subfigures, the crack leads to the final fatigue failure was originated from an AM defect which was yellow dashed and marked as LOF. Exactly, the defect is not LoF but a type of AM pore that Fu et al. [
25] had mislabeled.
For the negative stress ratios of
R = –1 and –0.5, as the fatigue life grows, around the AM defect, a crack initiation region of rough area (RA) incubates, nucleates and matures at
Nf > 10
8 cycles. The RA regions are circular or elliptical in shape and tangent to the specimen surfaces as shown in
Figure 13 c and f. As the stress ratio increases to
R = 0.1, a large RA region can be formed at 10
7 cycles <
Nf < 10
8 cycles as shown in
Figure 13h, the boundary of which is not tangent to the specimen surface and the projected area of which is even larger than the RA at
Nf > 10
8 cycles as shown in
Figure 13i. While the stress ratio further increases to
R = 0.5, around the dominating AM defect which causes the final failure, no identifiable RA region was observed on the fracture surface even at
Nf > 10
8 cycles, as shown in
Figure 13j–l. This crack initiation behavior with the RA region is quite similar to that with the fine granular area (FGA, [
26]) in high-strength steels under negative and positive
R values [
27].
4.3. Crack Initiation Morphologies for Case-II
For Group 10 of the AMed Ti-6Al-4V,
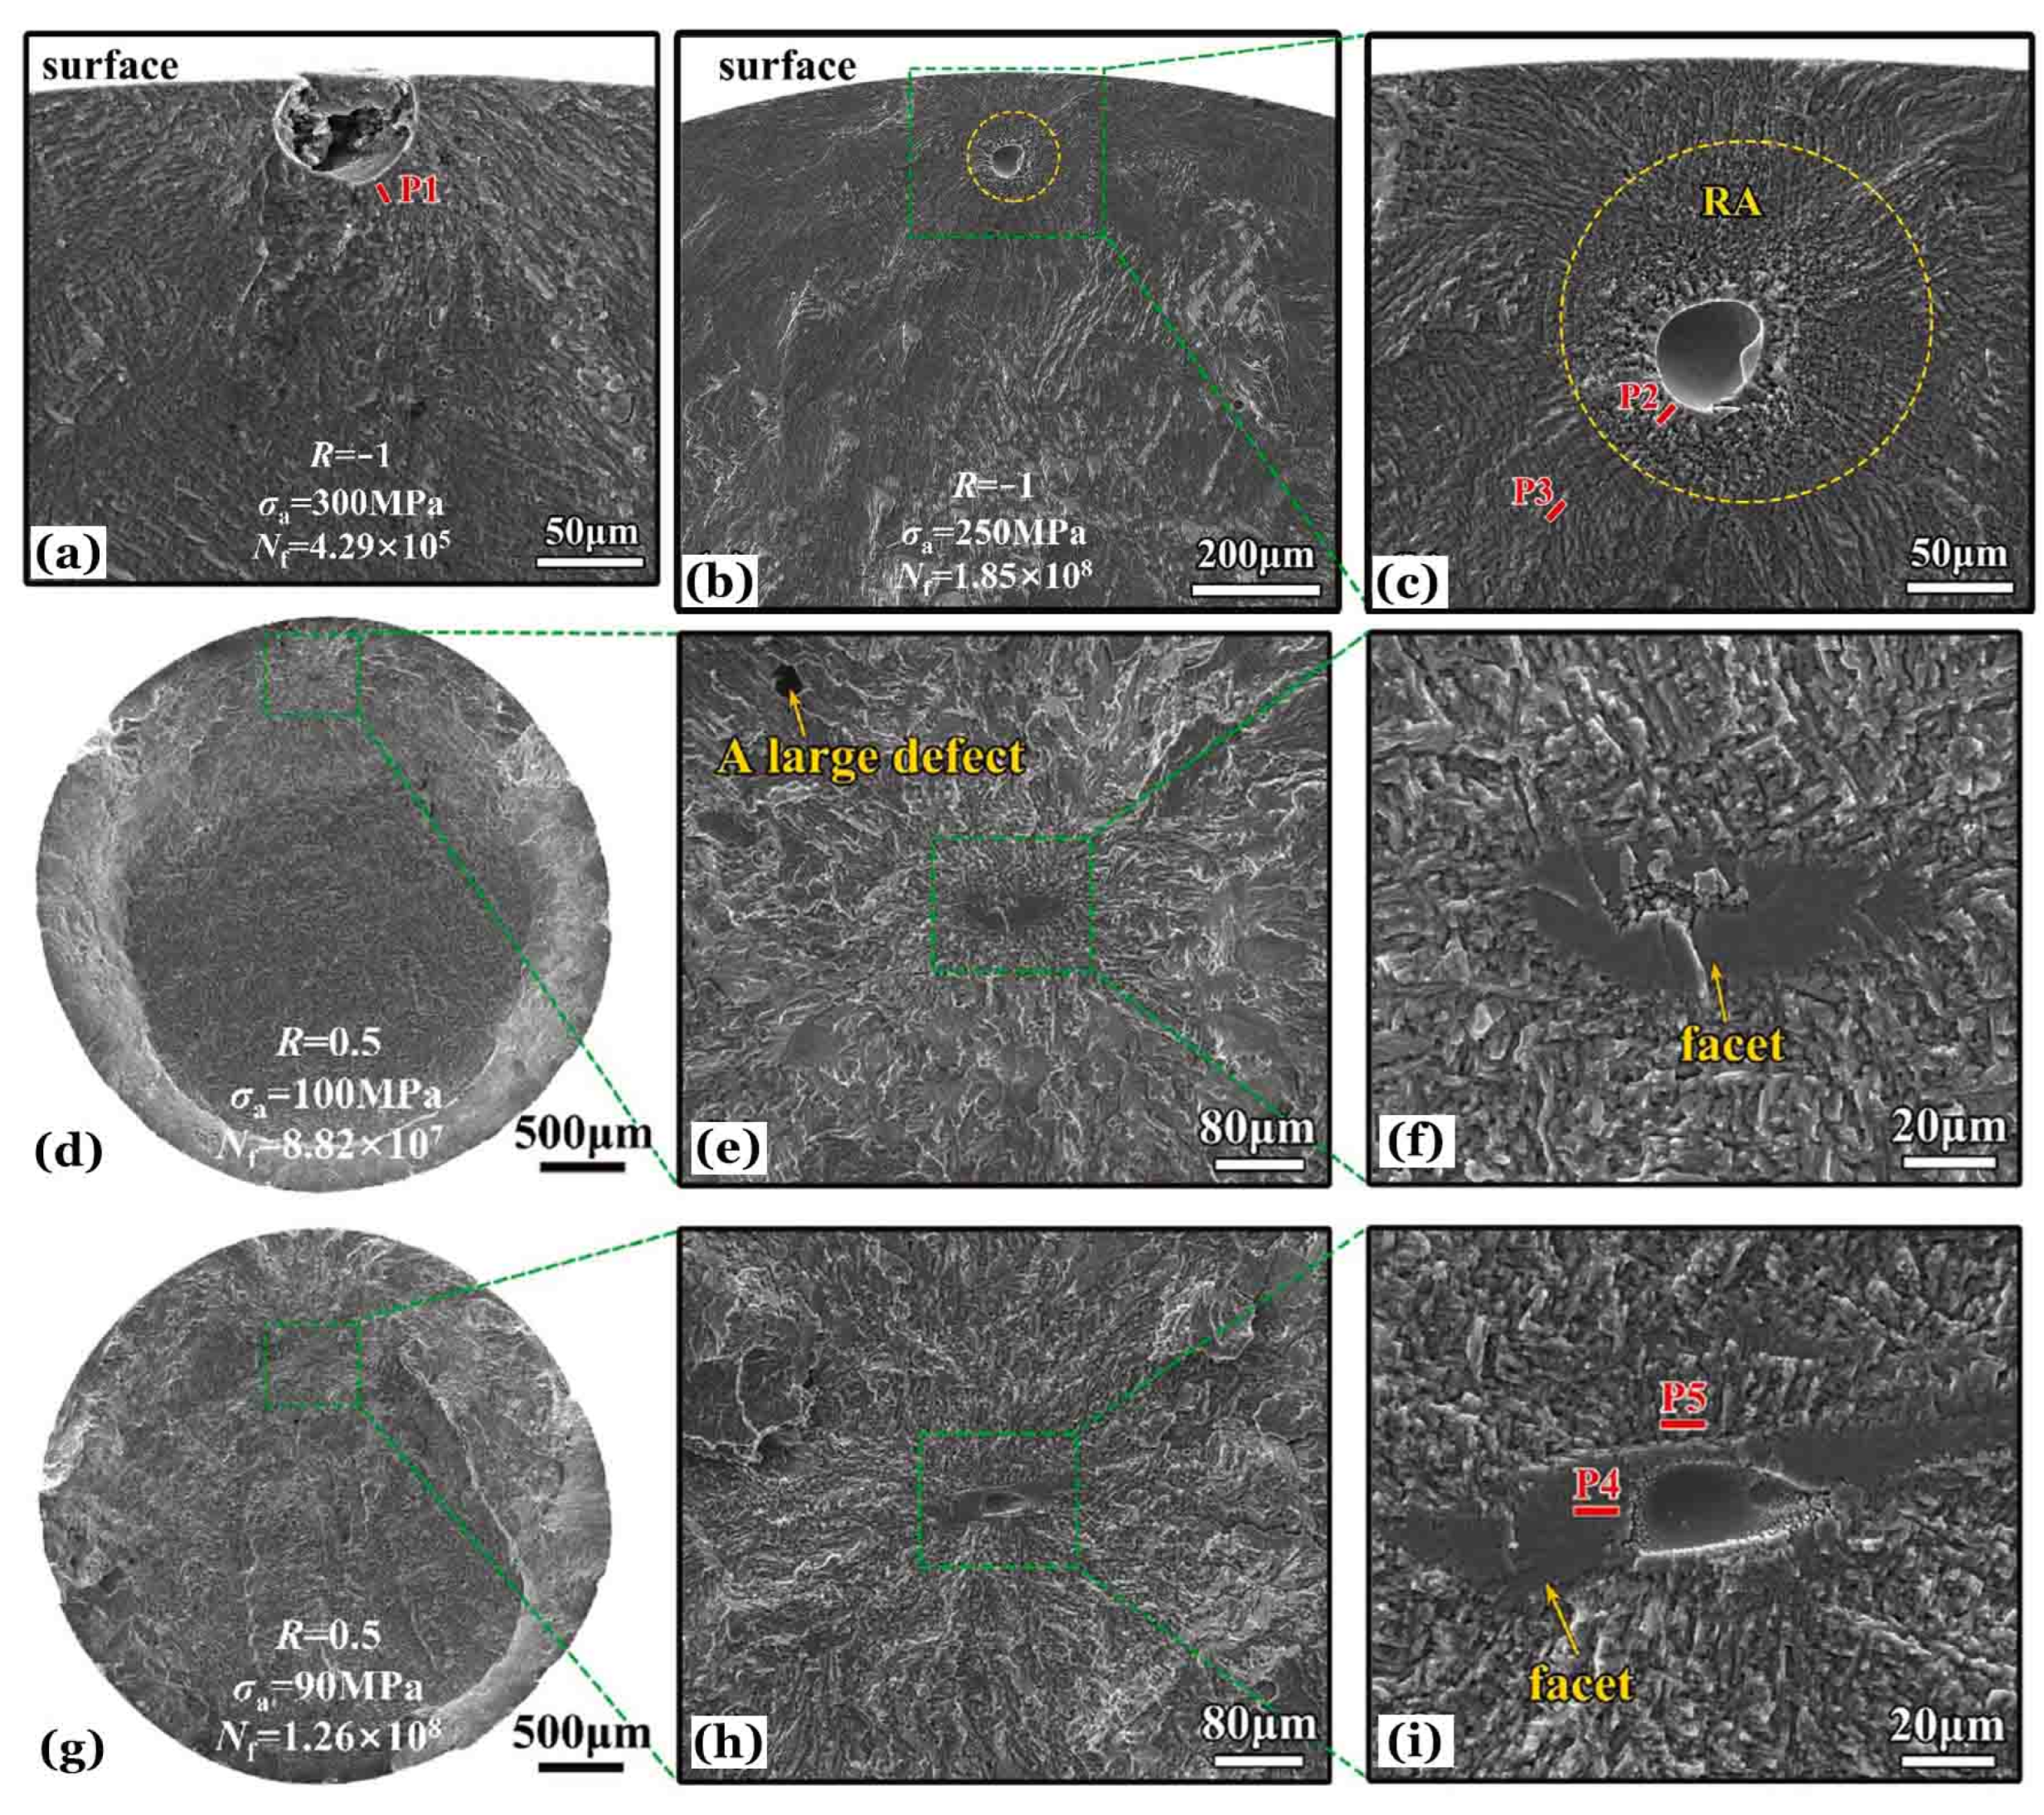
Figure 14 displays the typical SEM images for crack initiation in HCF and VHCF under negative and positive stress ratios of
R = –1 and 0.5.
Figure 14a is for surface crack initiation induced HCF, which was originated from a surface AM defect.
Figure 14b,c is for internal crack initiation induced VHCF at
R = –1, which was originated from a subsurface AM defect and encircled by an RA region with granular morphology.
Figure 14 d-f and g-i gives two examples showing the whole fracture surface (
Figure 14d,g) and the detailed region of fatigue crack initiation and early propagation, which originated from an internal AM defect and cracking of a leaf-like facet (
Figure 14e,f,h,i) for failure lives of 10
7 and 10
8 cycles at
R = 0.5. Obviously, for a positive stress ratio of
R = 0.5, the crack initiation morphologies of Group 10 as shown in
Figure 14d–i are very different from those of Group 14 as shown in
Figure 13k,l, which is defined as Case-I. As a contrast, the former case of fatigue crack initiation for Group 10 is defined as Case-II.
In
Figure 14, the red bars of P1, P2, P3, P4 and P5 locate the lamellae for further characterization of the profile microstructure underneath the fracture surface by using transmission electron microscopy (TEM). The lamellae were cut from the representative locations on the fracture surfaces with milling of focused ion beam (FIB). P1 is for a core region around a surface AM defect of crack initiation experienced HCF at
R = –1; P2 and P3 are for locations near and away from crack initiation site of a subsurface AM defect experienced VHCF at
R = –1, P2 is within the RA region and P3 outs; P4 and P5 are for locations near the internal AM defect of crack initiation experienced VHCF at
R = 0.5, P4 is within the facet and P5 outs but adjacent. The microstructures on TEM lamellae of P1, P3, P4 and P5 almost keep the original AMed LM or BW with coarse grains of α and β phases. On top of the TEM lamella of P2, there is a nanograin layer [
15] with a heterogeneous refined microstructure [
28] of twisted lamellar α/β grains and equiaxed grains which may be produced by recrystallization.
The similar phenomena of nanograin formation and microstructure refinement can also occur in other metallic materials whether conventional manufacturing [
27,
29,
30,
31,
32] or AM [
5,
25,
33]. Hong et al. [
27] proposed a model of numerous cyclic pressing (NCP) to explain these phenomena, in which fracture surface nanocrystallization occurs associating with VHCF initiation under negative stress ratios due to a very long process (
N > 10
7 cycles) of repeated crack opening and closing. This process can assume and store a massive amount of cyclic strain energy, which is introduced by the applied stress amplitude, allowing the material to have a relatively high
σa value. The key of NCP model is a sufficient number of load cycles and a sufficiently high value of the compressive stress component.
4.4. Fatigue Strength Estimation under Tensile Mean Stress
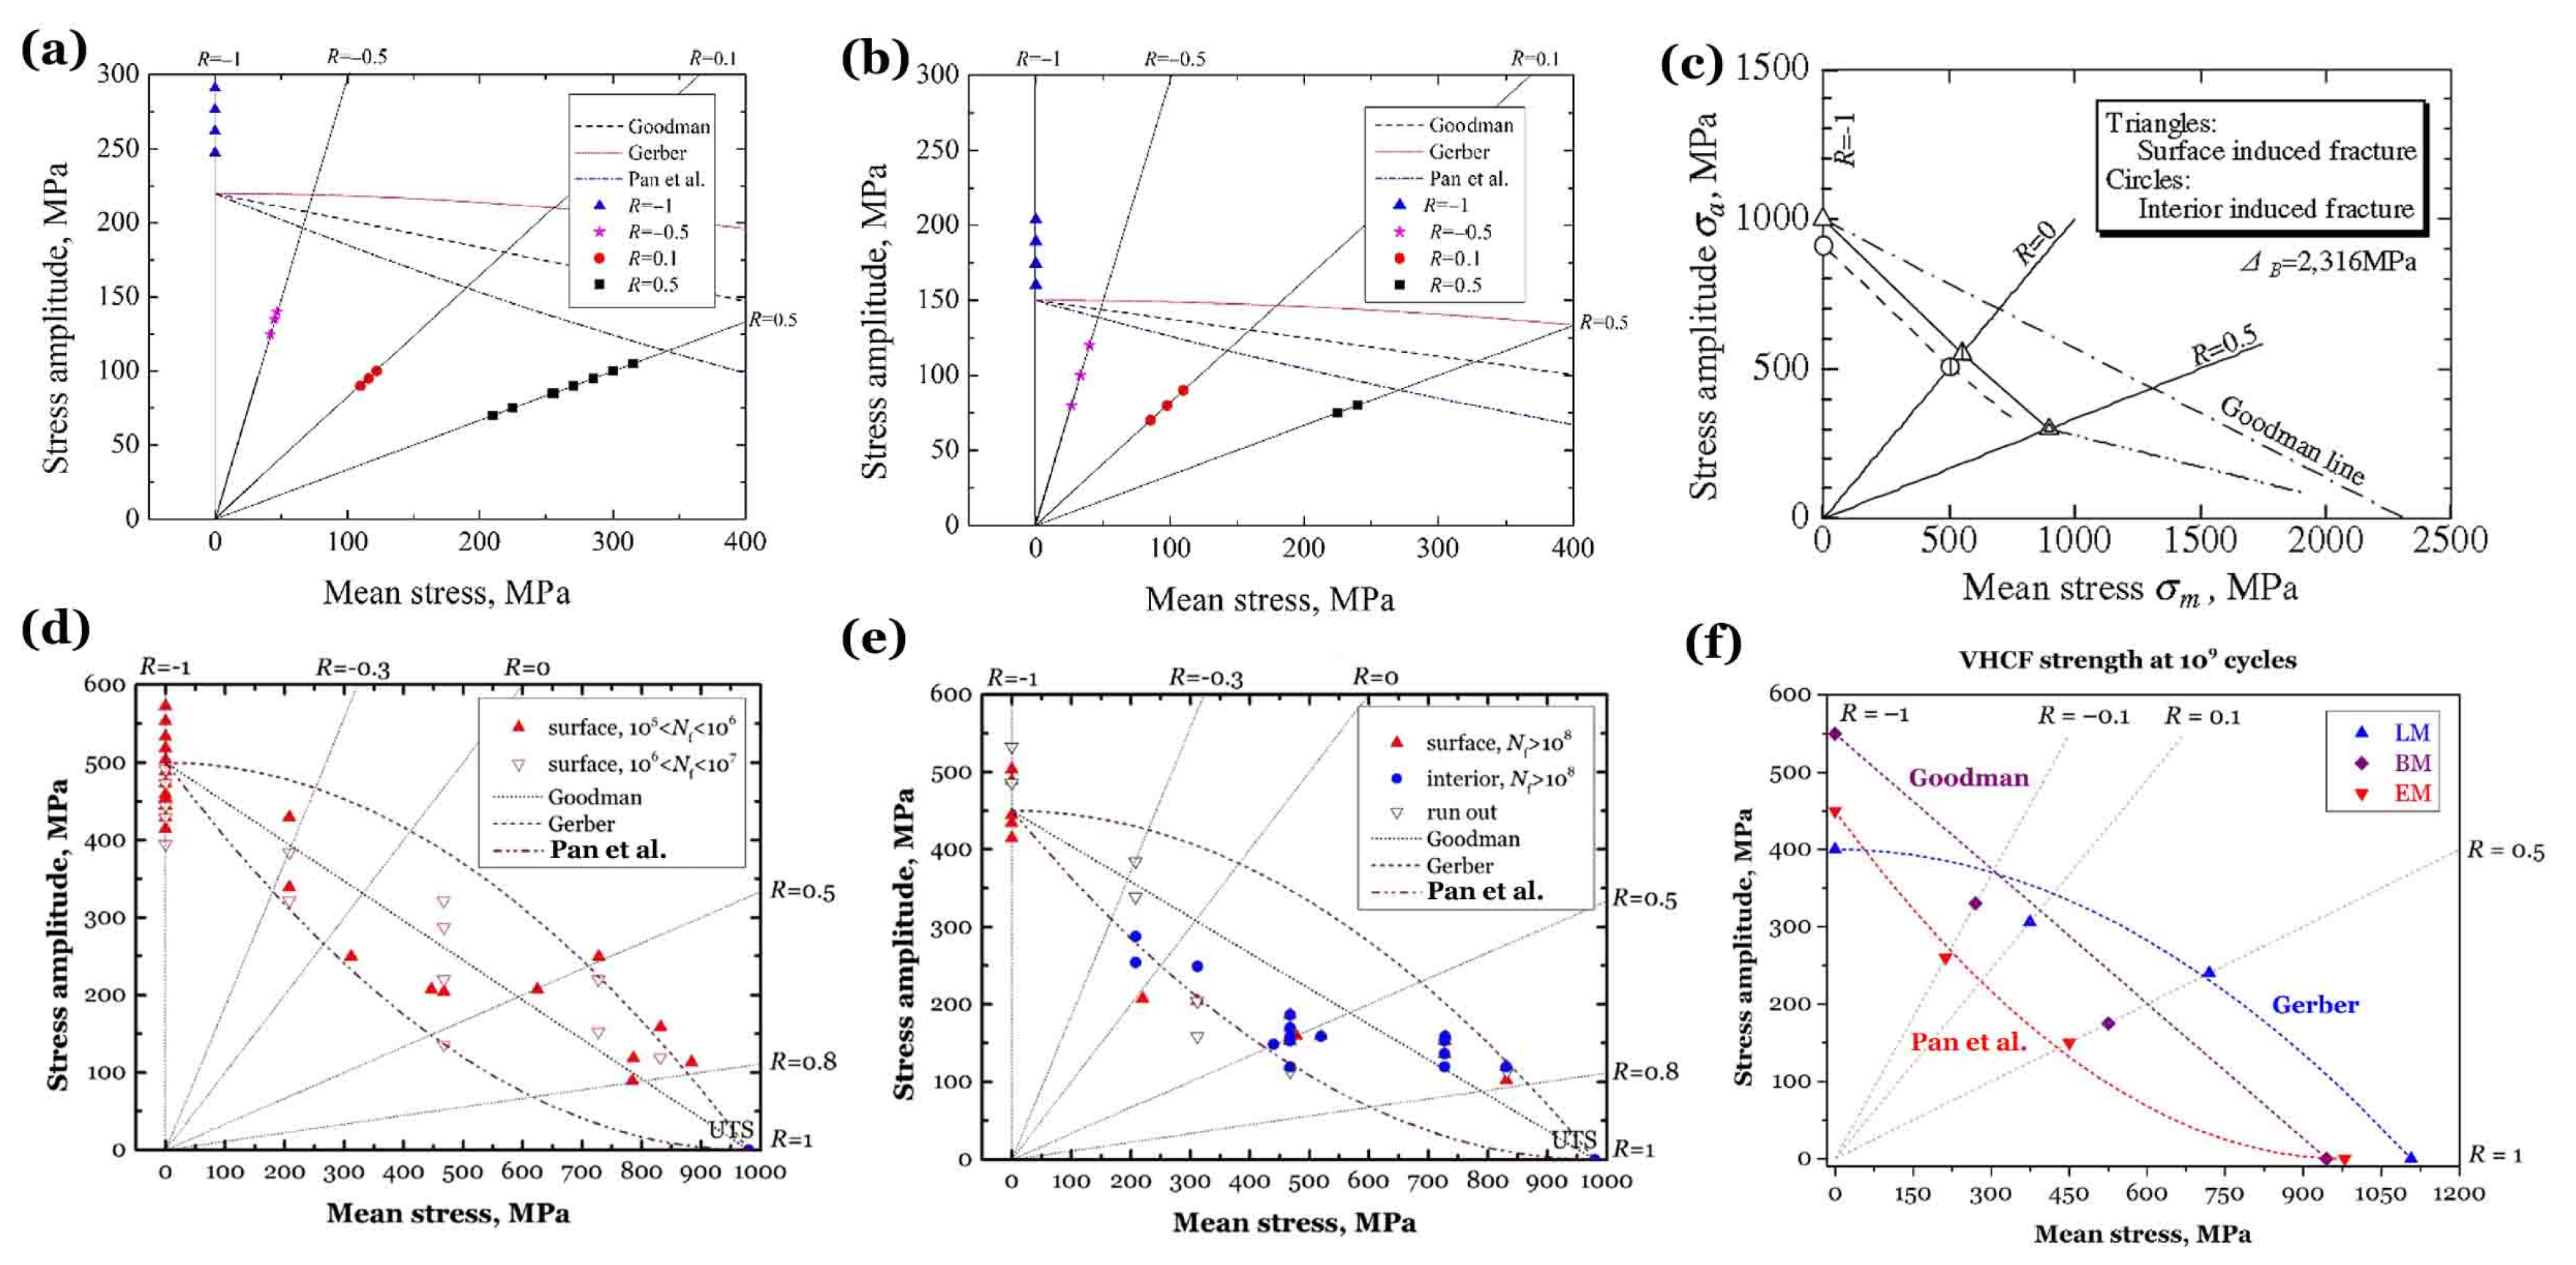
Figure 15 of Haigh diagrams [
34] quantitatively delineates the effect of tensile mean stress or stress ratio on fatigue resistance of an AMed Ti-6Al-4V alloy in comparison of high-strength steels and titanium alloys with several microstructures based on the relations of Goodman [
35], Gerber [
36] and Pan et al. [
29].
Figure 15a,b is for the AMed titanium alloy of Group 14 [
25] in HCF and VHCF regime, respectively.
Figure 15c is for VHCF limit of a high-strength steel [
37].
Figure 15d,e is for a Ti-6Al-4V alloy with EM [
38] in HCF and VHCF regime, respectively.
Figure 15f is for VHCF limit of titanium alloys with LM, BM or EM.
For both HCF and VHCF regimes, fatigue strength of the AMed titanium alloy degrades sharply from the stress ratio of
R = –1 to 0.5, worse than that of a mill-annealed titanium alloy with EM [
38]. We noticed that the AMed alloys and high-strength steels have many similarities [
39], e.g., the nonmetallic inclusions [
40,
41] in high-strength steels play a similar role in inducing fatigue crack initiation and early growth, as do the AM defects in AMed alloys. Sakai et al. [
37] proposed a bilinear model to describe the stress ratio effect on the VHCF limit of
σa with varying mean stress
σm in a high-strength steel. Following the analogy of inclusions and AM defects, this model can be transferred to AMed alloys from the high-strength steel.
The AMed titanium alloy is often with a microstructure of LM or BW. For the conventionally manufactured titanium alloys,
Figure 15d–f depicts how microstructure affects the effect of tensile mean stress
σm and stress ratio
R on fatigue strength. For the EM, HCF and VHCF strengths deteriorate with increasing
σm in accordance with a Goodman line and Pan et al. [
29,
38]’s under-convex curve, respectively. On the “true” fatigue limit beyond 10
9 cycles, crack initiation in an LM domain [
17] abides by a Gerber up-convex curve, and the BM [
18] follows a Goodman line, which can be regarded as a mixed microstructure of LM and EM.
5. Discussion of Promising Methods to Improve Fatigue Performance
5.1. Influences of Heat Treament and Hot Isostatic Pressing
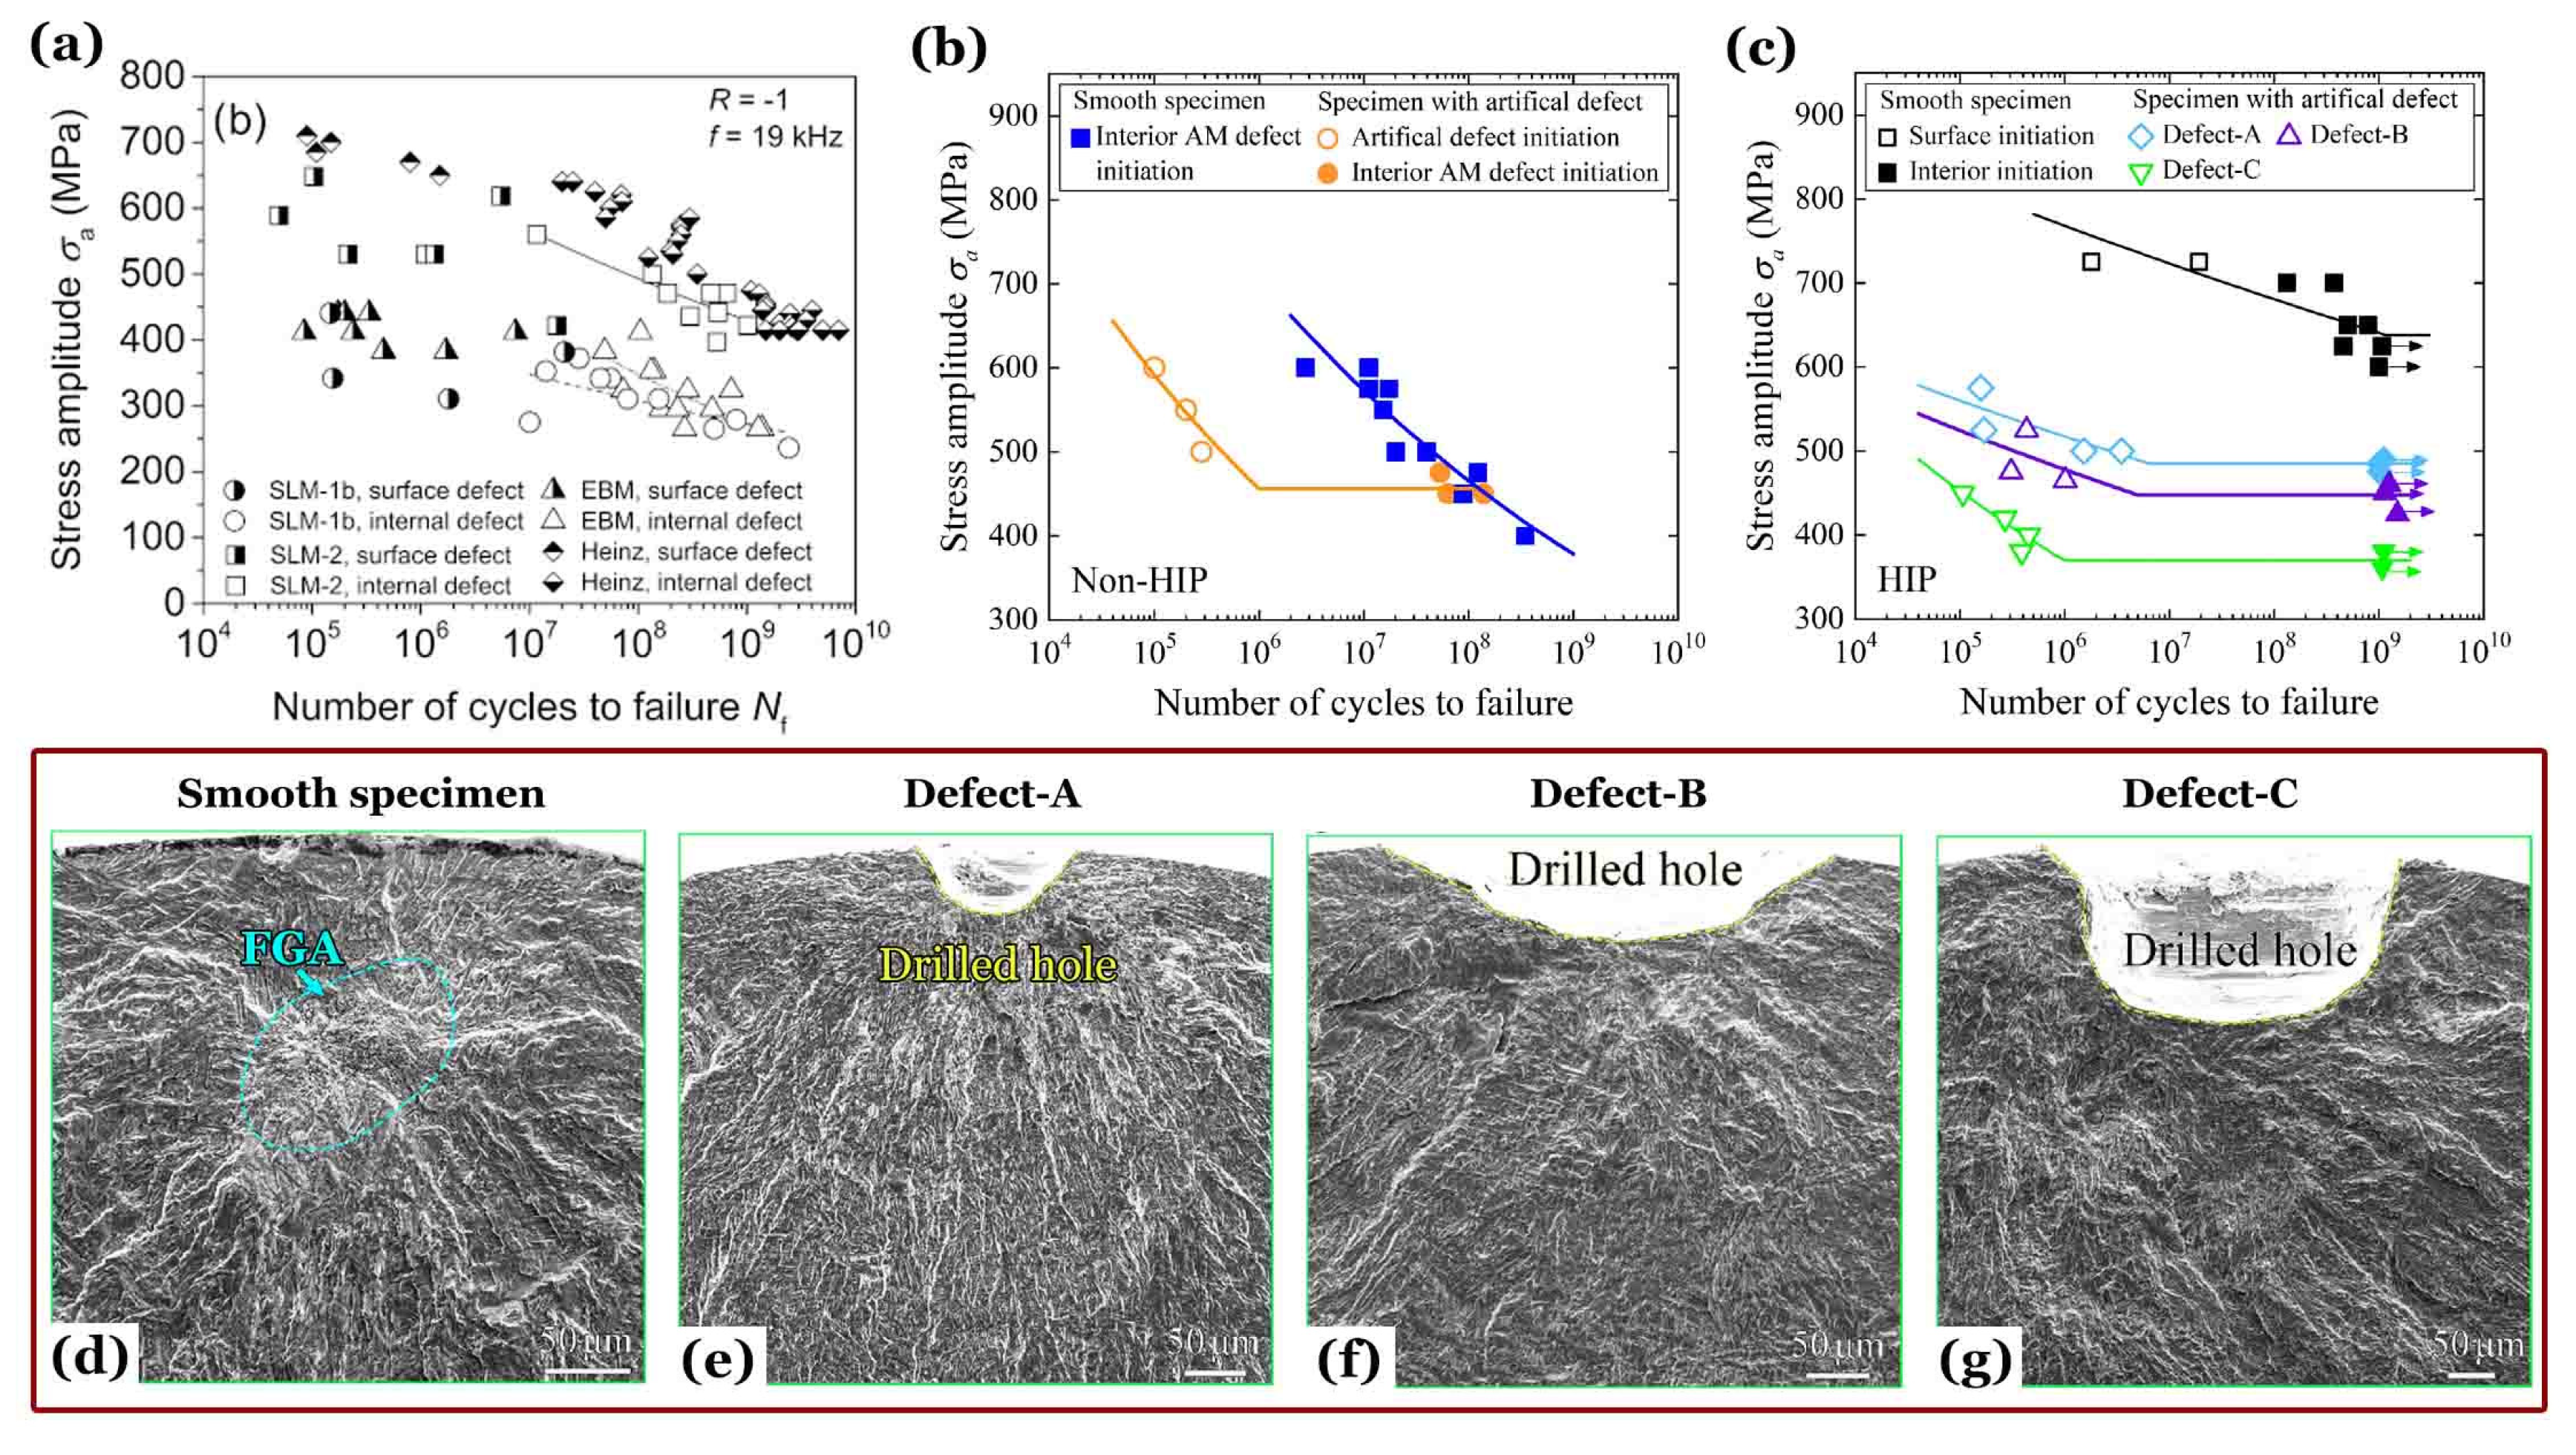
Figure 16a presents S-N data and curves for Ti-6Al-4V alloys with a BM [
42] and several AMed microstructures [
43] subjected to HCF and VHCF with axial cycling at ultrasonic frequency of 20 [
42] and 19 kHz [
43] under
R = –1 at room temperature and in ambient air. The BM is with tensile properties of
σy = 920 MPa,
σu = 1010 MPa and
εt = 17.5%, named Heinz [
42]. An AMed Ti-6Al-4V was produced via L-PBF with processing parameters of
p = 175 W,
t = 0.03 mm,
v = 710 mm/s,
h = 0.12 mm, and
E = 68.47 J/mm
3 by using a SLM (selective laser melting) 250
HL system to obtain a batch of raw cylinders. Then, the cylinders were divided into two groups: one named SLM-1b which was heat treated at 800 °C for 2 hours in Argon atmosphere, and the other named SLM-2 which was HIP treated at 920 °C for 2 hours at 1000 bar in an Argon atmosphere. The other AMed Ti-6Al-4V was produced via electron beam PBF (EB-PBF) or called electron beam melting (EBM) [
44] with processing parameters of acceleration voltage 60 kV, maximum current 21 mA,
t = 0.05 mm,
v = 4530 mm/s,
h = 0.1 mm by using an Arcam A2X system to obtain a batch of raw cylinders and without any post treatment. This batch was designated EBM. All specimens of the AMed Ti-6Al-4V alloys were machined from the raw cylinders by turning along the building direction.
In the range of 400 MPa <
σa < 700 MPa, the conventionally manufactured Ti-6Al-4V with BM of Heinz [
42] maintains the maximum HCF and VHCF strengths than SLM-2, EBM and SLM-1b; The HCF and VHCF strengths for HIP specimens of SLM-2 are the second for the corresponding range of 400 MPa <
σa < 600 MPa; EBM and SLM-1b are the third and the minimum in the range of 250 MPa <
σa < 450 MPa. In VHCF regime, fatigue damage preferentially initiates from internal defect, and S-N data and curves can be easily categorized into two groups, from high to low stress amplitude of
σa, and from long to short fatigue life of
Nf. The VHCF resistance of SLM-2 is slightly less than that of the BM; they both greatly exceed that of EBM and SLM-1b; and the resistance of SLM-1b is also slightly less than that of EBM. In HCF regime, fatigue damage preferentially initiates from surface defect, and S-N data can be categorized into four groups: the BM, SLM-2, EBM and SLM-1b from high to low stress amplitude of
σa, and from long to short fatigue life of
Nf.
It is easy to see that HIP significantly improves the fatigue properties of AMed titanium alloys, especially in VHCF. This improvement can be attributed to two factors: the coarsening of AMed microstructure and the elimination of void-typed defects.
For AMed Ti-6Al-4V, annealing can also produce a coarsened LM or BW microstructure, which enhances the ductility with reducing the tensile strength. Groups 10, 12 and 14 give examples. Group 14 has the optimum fatigue performance and the best tensile plasticity. In fact, due to the presence of void-typed AM defects, the fatigue strength is strongly dependent on some quantities of fatigue short or long crack growth [
45,
46], similar to fracture toughness, which is more appropriately related to local plasticity and can be directly assessed by tensile strength and ductility.
5.2. Competitions among Metallurgical and Artificial Defects
Chi et al. [
22] investigated the HCF and VHCF behaviors of smooth specimens and the specimens with artificial defects for an AMed Ti-6Al-4V of Group 12 without and with a HIP treatment as shown in
Figure 16b,c. All fatigue specimens were tested at room temperature and in air by ultrasonic axial cycling at a loading frequency of 20 k ± 500 Hz with a stress ratio of
R = –1.
For specimens without HIP, in the range of 500 MPa ≤ σa ≤ 600 MPa, fatigue cracks tend to nucleate from the edges of the artificial surface defects for 1 × 10⁵ cycles ≤ Nf ≤ 3 × 10⁵ cycles, and from the AM defects at specimen interior for 3 × 10⁶ cycles ≤ Nf ≤ 5 × 10⁷ cycles. While σa < 500 MPa, all failed specimens were internally cracked by interior AM defects inducing VHCF, despite specimens with or without artificial defects.
For specimens with HIP, the smooth specimens perform very well in both HCF and VHCF regimes. While
σa > 700 MPa, 2 specimens were tested and all failed by surface crack initiation, one failed at about
Nf = 2 × 10
6 cycles and the other failed at about
Nf = 2 × 10
7 cycles. In the range of 600 MPa <
σa < 700 MPa, 7 specimens were tested, 2 runout of 10
9 cycles, the other 5 failed by internal crack initiation inducing VHCF, and
Figure 16d gives an SEM example for the fracture surface. Simultaneously, all specimens with artificial defects were failed in the HCF regime, no VHCF occurs, and the fatigue cracks all originated from the drilled holes on specimen surfaces as shown in
Figure 16e–g, named Defect-A, Defect-B and Defect-C.
In
Figure 16d, a crack initiation area with rough fracture surface was identified as a dashed ellipse, which had been mislabeled FGA by Chi et al. [
22], and the correct name should be RA. Within the RA region, no AM defect of the void types can be determined on the fracture surface. In
Figure 16e–g, around the artificial defects, there is no discernible region of crack initiation and early growth.
Attributed to the presence of artificial defects, the fatigue strength of the drilled specimens is significantly lower than that of the smooth specimens and continues to decrease as the defect size increases. The VHCF limit at 109 cycles was measured as σa = 625 MPa for the smooth specimens, σa = 490 MPa for specimens with Defect-A, σa = 460 MPa for Defect-B, and σa = 380 MPa for Defect-C. For the smooth specimens of Group 12 with HIP, the fatigue performance is even better than the BM without any AM defects which is produced by a conventional manufacturing.
5.3. Roles of Microstructure, Local Plastiticity, Tensile Strength and Ductility
It is very reasonable that the fatigue behavior of AMed materials can be modulated by adjusting the defect size. For the AMed microstructure of Group 12 with HIP treatment, fatigue crack initiation occurs from the matrix and sustains a VHCF limit of σa = 625 MPa in the absence of void-typed AM defects and other artificial defects. Even if an AM defect with equivalent size of Defect-C exists in specimen interior, the AMed matrix with HIP still can endure a VHCF limit of σa = 380 MPa, which is greater than that of the AMed Ti-6Al-4V of Groups 1 ~ 11, 13 and 14 without HIP treatment. This is because the additional annealing introduced by HIP actually coarsens the AMed microstructure.
As the mentioned in
Section 5.1, the coarsening of AMed microstructure also plays a key role in fatigue performance, especially in very-high-cycle regime. It is noted that, for materials with void-typed defects, coarsening of the microstructure is not required and simply increasing the local plasticity of the defect edges can make a substantial improvement in fatigue properties.
For titanium alloys, the local plasticity depends on the local microstructure and can be enhanced by methods of microstructural design [
16,
18,
47,
48,
49,
50,
51,
52], e.g., tension [
16], torsion [
49], and compression with or without recrystallization annealing. This method is not only applicable to the symmetrically cyclic tension and compression (
R = –1), but may also be applied to a wider range of working conditions. Specifically, the VHCF crack initiation in the LM domain [
17] with increasing tensile mean stress approximately obeys a Gerber relation for –1 <
R ≤ 0.5 [
18], which is consistent with the case in AMed aluminium alloys [
53,
54]. In the result of Du et al. [
15], the AM defect causes the surrounding LM domain cleavage to form a lamellar facet as the VHCF origin, and leads to the final fatigue fracture at
R = 0.5. Therefore, we can shield the AM defect itself by regulating the microstructure around the AM defect to optimally dominate the VHCF behavior of the AMed materials at
R > –1.
We can utilize the micro and/or nano tests, such as microhardness and nanoindentation [
55], to provide a better assessment of the local microstructure and plasticity. However, it is always difficult to acquire the detail information of local microstructure and plasticity around the AM defects, so we also often use global quantities to estimate the potential fatigue resistance of AMed Titanium alloys. Tensile strength and ductility are the most popularly used global quantities for structural materials.
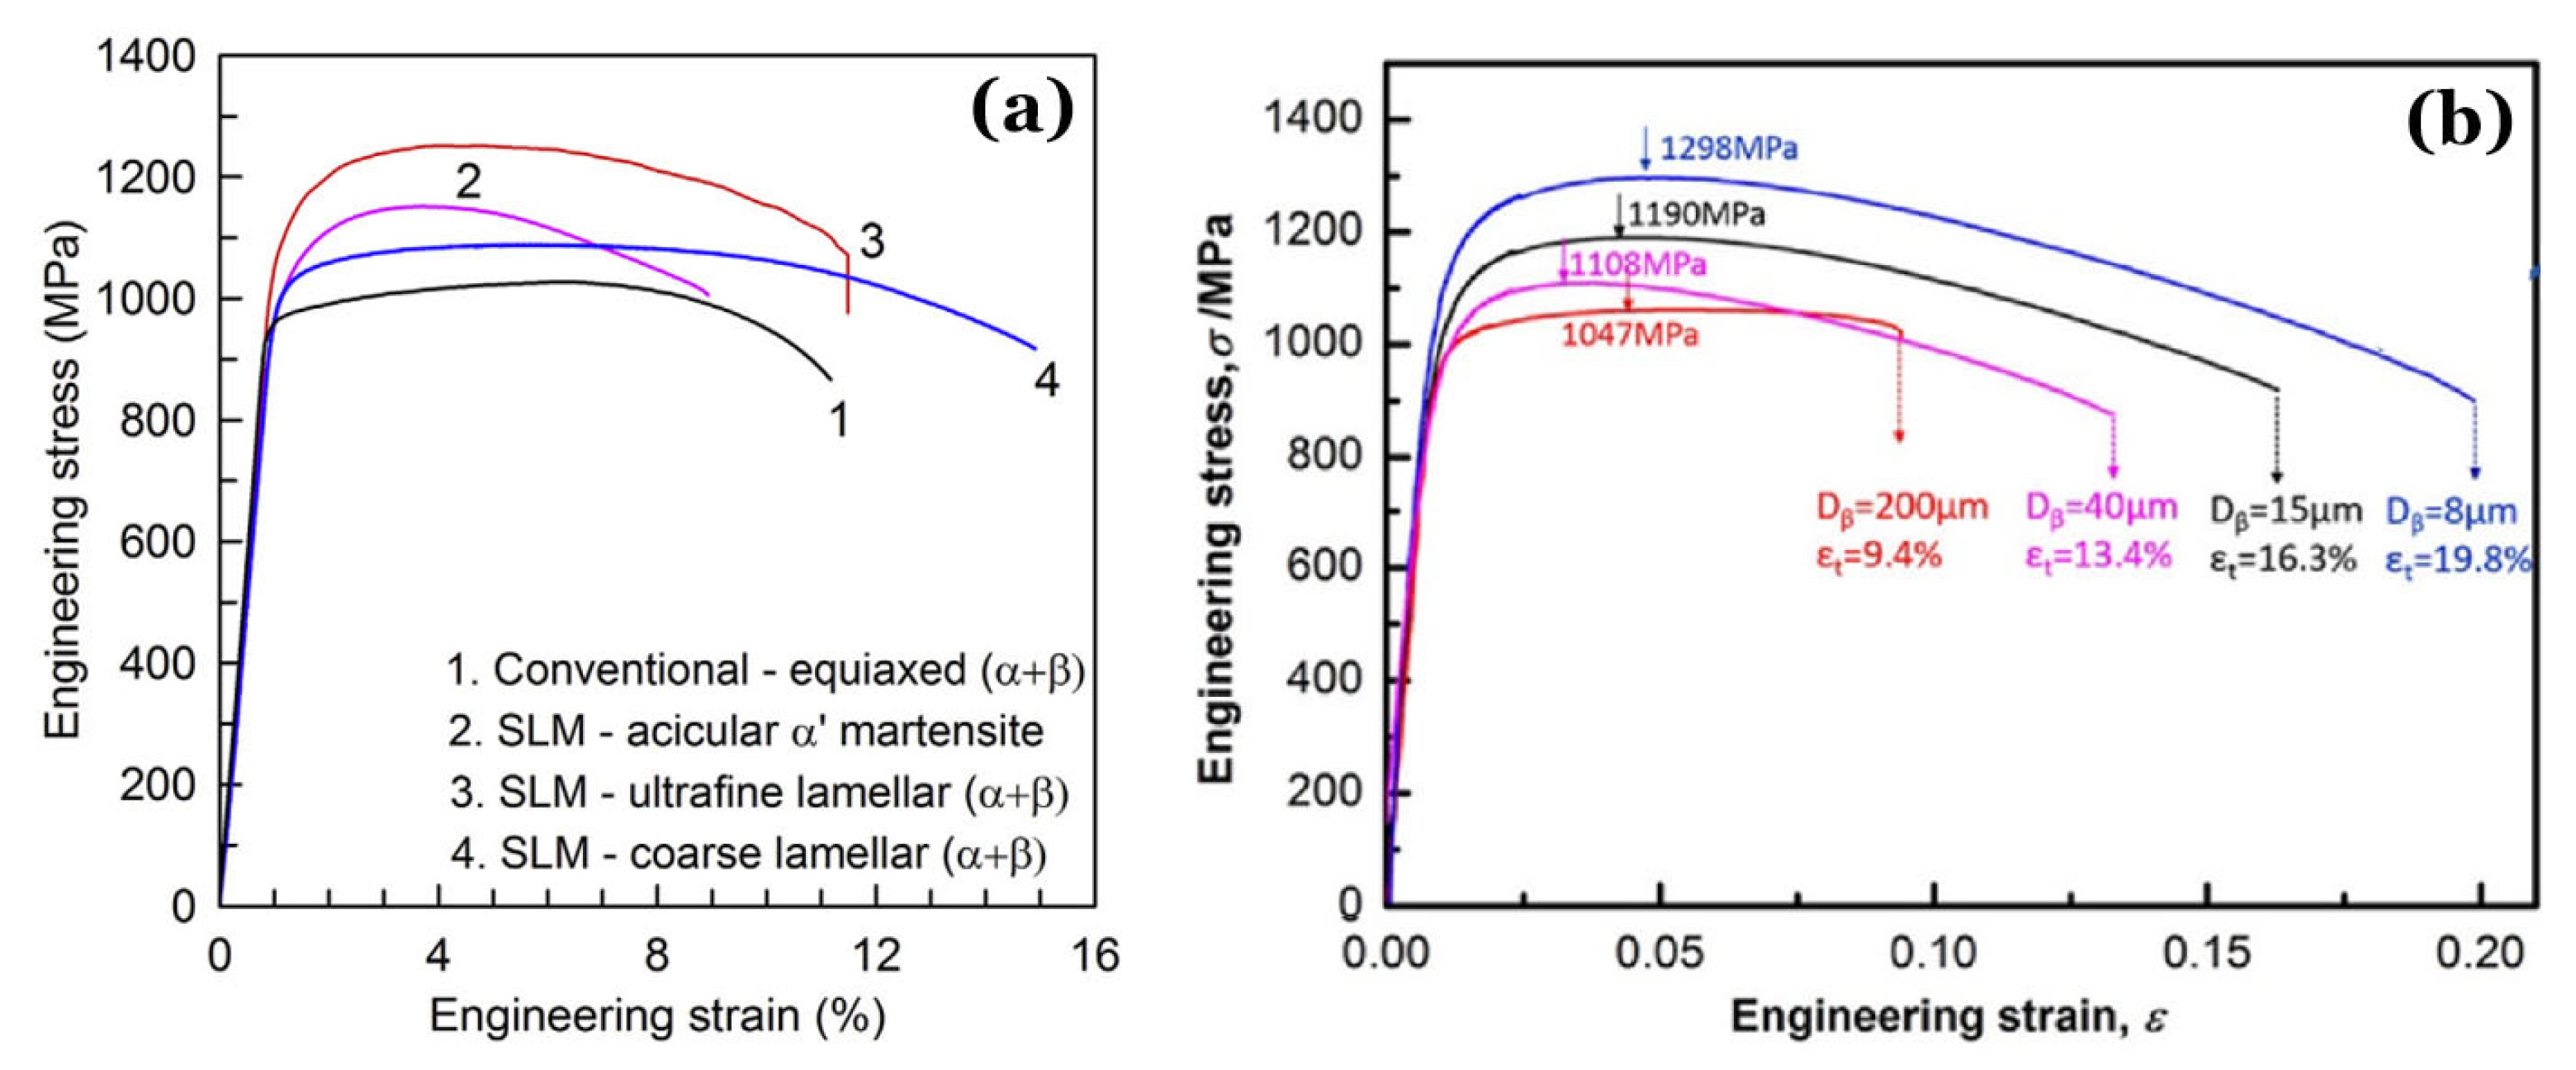
Figure 17 displays the several tensile curves of engineering stress versus engineering strain under quasi-static monotonic loading of titanium alloys produced by methods of AM and conventional manufacturing. The tensile properties rely mainly on the global microstructure rather than the distribution of metallurgical defects when the porosity is not very large. As shown in
Figure 17a, in comparison with a titanium alloy with EM of equiaxed (α + β), the microstructure of acicular α’ martensite makes a higher strength and a lower plasticity. After an annealing, the martensite will transform to a microstructure of coarse lamellar (α + β) with a downgraded strength and an upgraded ductility. Xu et al. [
56] tailored the microstructure of ultrafine lamellar (α + β) to simultaneously achieve superior tensile properties of AMed Ti-6Al-4V than the conventional one. Chong et al. [
57] developed a technique of rapid heat treatment that can globally enhance the tensile strength and ductility of a Ti-6Al-4V with fully martensitic microstructures as shown in
Figure 17b.
6. Viewpoints and Perspectives
In this paper, we have reviewed the characteristics of additively manufactured (AMed) titanium alloys and the current status of fatigue research in the high-cycle and very-high-cycle regimes to summarize the main factors affecting fatigue properties and discuss the effect of stress ratio on fatigue strength and fractography.
By using AM, AMed titanium alloys can easily achieve high-strengths, even for the commercially used Ti-6Al-4V, an α + β type, whereas metastable β types are required by conventional methods. For optimized AM parameters, the directly printed state has the highest strength and not optimal plasticity. In very-high-cycle regime, fatigue strength is related to both tensile strength and ductility. If the AM parameters are not optimized, the primary factor influencing fatigue performance is porosity, which tends to be a high value. When the porosity is relatively low, surface roughness, e.g., the as-built specimen surface, becomes an important influence, followed by the maximum size of metallurgical defects on projection plane perpendicular to the loading direction. These factors are also dependent on the plasticity and their influence decreases as ductility increases. As a result, the AMed titanium alloys often exhibit higher values of very-high-cycle fatigue strength after an equivalent annealing of thermal-mechanical treatments than the directly printed state. However, annealing will inevitably reduce the strength of the AMed material, which in turn will reduce its fatigue strength. In this way, the trade-off relationship between strength and plasticity can be reproduced to very-high-cycle fatigue. Therefore, those methods that can simultaneously improve the strength and plasticity of titanium alloys also hold promise for improving very-high-cycle fatigue strength.
Author Contributions
Conceptualization, X.P.; Data curation, R.F., L.D., and X.P; Investigation, C.G., Y.Z., J.J., and X.P.; Methodology, X.P.; Project administration, C.G. and X.P.; Resources, R.F., L.D., and X.P; Supervision, C.G., Y.Z., J.J., and X.P.; Visualization, X.P.; Writing—original draft, C.G., Y.Z., and X.P.; Writing—review & editing, X.P. The authors have read and agreed to the published version of the manuscript.
Funding
This research received no external funding.
Data Availability Statement
No new data were created or analyzed in this study.
Acknowledgments
C.G. is very grateful to Harbin University for the financial support.
Conflicts of Interest
The authors declare no conflicts of interest.
References
- Lütjering, G.; Williams, J. Titanium, 2nd ed.; Springer-Verlag: Berlin, Germany, 2003. [Google Scholar]
- Leyens, C.; Peters, M. Titanium and Titanium Alloys; Wiley-VCH Verlag: Weinheim, Germany, 2003. [Google Scholar]
- Gibson, I.; Rosen, D.; Stucker, B.; Khorasani, M. Additive Manufacturing Technologies, 3rd ed.; Springer: Gewerbestrasse, Cham, Switzerland, 2021. [Google Scholar]
- Leary, M. Design for Additive Manufacturing; Elsevier: Amsterdam, Netherlands, 2020. [Google Scholar]
- Pan, X.; Du, L.; Qian, G.; Hong, Y. Microstructure features induced by fatigue crack initiation up to very-high-cycle regime for an additively manufactured aluminium alloy. J. Mater. Sci. Tech. 2024, 173, 247–260. [Google Scholar] [CrossRef]
- Qian, G.; Li, Y.; Paolino, D.S.; Tridello, A.; Berto, F.; Hong, Y. Very-high-cycle fatigue behavior of Ti-6Al-4V manufactured by selective laser melting: Effect of build orientation. Int. J. Fatigue 2020, 136, 105628. [Google Scholar] [CrossRef]
- Zhao, Q.; Sun, Q.; Xin, S.; Chen, Y.; Wu, C.; Wang, H.; Xu, J.; Wan, M.; Zeng, W.; Zhao, Y. High-strength titanium alloys for aerospace engineering applications: A review on melting-forging process. Mater. Sci. Eng. A 2022, 845, 143260. [Google Scholar] [CrossRef]
- Sanaei, N.; Fatemi, A. Defects in additive manufactured metals and their effect on fatigue performance: A state-of-the-art review. Prog. Mater. Sci. 2021, 117, 100724. [Google Scholar] [CrossRef]
- Du, L.; Qian, G.; Zheng, L.; Hong, Y. Influence of processing parameters of selective laser melting on high-cycle and very- high-cycle fatigue behaviour of Ti-6Al-4V. Fatigue Fract. Eng. Mater. Struct. 2021, 44(1), 240–256. [Google Scholar] [CrossRef]
- Schijve, J. Fatigue of Structures and Materials, 2nd ed.; Springer: Dordrecht, Germany, 2009. [Google Scholar]
- Bathias, C.; Paris, P. Gigacycle Fatigue in Mechanical Practice; Marcel Dekker: New York, NY, USA, 2005. [Google Scholar]
- Thijs, L.; Verhaeghe, F.; Craeghs, T.; Humbeeck, J.; Kruth, J. A study of the microstructural evolution during selective laser melting of Ti-6Al-4V. Acta Mater. 2010, 58, 3303–3312. [Google Scholar] [CrossRef]
- Bathias, C. There is no infinite fatigue life in metallic materials. Fatigue Fract. Eng. Mater. Struct. 1999, 22(7), 559–565. [Google Scholar] [CrossRef]
- Sakai, T. Review and prospects for current studies on very high cycle fatigue of metallic materials for machine structural use. J. Solid Mech. Mater. Eng. 2009, 3(3): 425–439. [CrossRef]
- Du, L.; Pan, X.; Qian, G.; Zheng, L.; Hong, Y. Crack initiation mechanisms under two stress ratios up to very-high-cycle fatigue regime for a selective laser melted Ti-6Al-4V. Int. J. Fatigue 2021, 149, 106294. [Google Scholar] [CrossRef]
- Pan, X.; Qian, G.; Hong, Y. Nanograin formation in dimple ridges due to local severe-plastic-deformation during ductile fracture. Scripta Mater. 2021, 194, 11363. [Google Scholar] [CrossRef]
- Pan, X.; Xu, S.; Qian, G.; Nikitin, A.; Shanyavskiy, A.; Palin-Luc, T.; Hong, Y. The mechanism of internal fatigue-crack initiation and early growth in a titanium alloy with lamellar and equiaxed microstructure. Mater. Sci. Eng. A 2020, 798, 140110. [Google Scholar] [CrossRef]
- Pan, X.; Su, H.; Liu, X.; Hong, Y. Multi-scale fatigue failure features of titanium alloys with equiaxed or bimodal microstructures from low-cycle to very-high-cycle loading numbers. Mater. Sci. Eng. A 2024, 890, 145906. [Google Scholar] [CrossRef]
- Meyers, M.A.; Chawla, K.K. Mechanical Behavior of Materials, 2nd ed.; Cambridge University Press: Cambridge, United Kingdom, 2009. [Google Scholar]
- Davis, R.F. Hot isostatic pressing. In Concise Encyclopedia of Advanced Ceramic Materials; Brook, R.J., Cahn, R.W., Eds.; Bever, M.B. Pergamon: Oxford, England, 1991; pp. 210–215. [Google Scholar]
- Chi, W.; Li, Gen.; Wang, W.; Sun, C. Interior initiation and early growth of very high cycle fatigue crack in an additively manufactured Ti-alloy. Int. J. Fatigue 2022, 160, 106862. [CrossRef]
- Chi, W.; Wang, W.; Li, Y.; Xu, W.; Sun, C. Defect induced cracking and modeling of fatigue strength for an additively manufactured Ti-6Al-4V alloy in very high cycle fatigue regime. Theor. Appl. Fract. Mech. 2022, 119, 103380. [Google Scholar] [CrossRef]
- Fu, R.; Zheng, L.; Zhong, Z.; Hong, Y. High-cycle and very-high-cycle fatigue behavior at two stress ratios of Ti-6Al-4V manufactured via laser powder bed fusion with different surface states. Fatigue Fract. Eng. Mater. Struct. 2023, 46, 2348–2363. [Google Scholar] [CrossRef]
- Hull, D. Fractography: Observing, Measuring and Interpreting Fracture Surface Topography; Cambridge University Press: Cambridge, United Kingdom, 1999. [Google Scholar]
- Fu, R.; Zheng, L.; Ling, C.; Zhong, Z.; Hong, Y. An experimental investigation of fatigue performance and crack initiation characteristics for an SLMed Ti-6Al-4V under different stress ratios up to very-high-cycle regime. Int. J. Fatigue 2022, 164, 107119. [Google Scholar] [CrossRef]
- Sakai, T.; Sato, Y.; Oguma, N. Characteristic S-N properties of high-carbon-chromium-bearing steel under axial loading in long-life fatigue. Fatigue Fract. Eng. Mater. Struct. 2002, 25, 765–773. [Google Scholar] [CrossRef]
- Hong, Y.; Liu, X.; Lei, Z.; Sun, C. The formation mechanism of characteristic region at crack initiation for very-high-cycle fatigue of high-strength steels. Int. J. Fatigue 2016, 89, 108–118. [Google Scholar] [CrossRef]
- Du, L.; Pan, X.; Hong, Y. New insights into microstructure refinement in crack initiation region of very-high-cycle fatigue for SLM Ti-6Al-4V via precession electron diffraction. Materialia 2024, 33, 102008. [Google Scholar] [CrossRef]
- Pan, X.; Su, H.; Sun, C.; Hong, Y. The behavior of crack initiation and early growth in high-cycle and very-high-cycle fatigue regimes for a titanium alloy. Int. J. Fatigue 2018, 115, 67–78. [Google Scholar] [CrossRef]
- Chang, Y.; Zheng, L.; Pan, X.; Hong, Y. Further investigation on microstructure refinement of internal crack initiation region in VHCF regime of high-strength steels. Frattura ed Integrità Strutturale, 2019, 13(49), 1–11. [CrossRef]
- Chang, Y.; Pan, X.; Zheng, L.; Hong, Y. Microstructure refinement and grain size distribution in crack initiation region of very-high-cycle fatigue regime for high-strength alloys. Int. J. Fatigue 2020, 134, 105473. [Google Scholar] [CrossRef]
- Pan, X.; Xu, S.; Nikitin, A.; Shanyavskiy, A.; Palin-Luc, T.; Hong, Y. Crack initiation induced nanograins and facets of a titanium alloy with lamellar and equiaxed microstructure in very-high-cycle fatigue. Mater. Lett. 2024, 357, 135769. [Google Scholar] [CrossRef]
- Piette, T.D.; Warren, R.J.; Spangenberger, A.G.; Hummelt, E.J.; Lados, D.A. Microstructure evolution, fatigue crack growth, and ultrasonic fatigue in as-fabricated laser powder bed and conventionally cast Al-10Si-0.4Mg: A mechanistic understanding and integrated flaw-sensitive fatigue design methods. Mater. Sci. Eng. A 2021, 825, 141892. [Google Scholar] [CrossRef]
- Haigh, B.P. Experiments on the fatigue of brasses. J. Inst. Metals 1917, 18, 55–86. [Google Scholar]
- Goodman, J. Mechanics Applied to Engineering; Longmans Green: London, United Kingdom, 1899. [Google Scholar]
- Gerber, H. Bestimmung der zulässigen spannungen in eisen-konstructionen. Zeitschrift des Bayerischen Architeckten und Ingenieur-Vereins 1874, 6, 101–110. [Google Scholar]
- Sakai, T.; Sato, Y.; Nagano, Y.; Takeda, M.; Oguma, N. Effect of stress ratio on long life fatigue behavior of high carbon chromium bearing steel under axial loading. Int. J. Fatigue 2006, 28, 1547–1554. [Google Scholar] [CrossRef]
- Pan, X.; Hong, Y. High-cycle and very-high-cycle fatigue behaviour of a titanium alloy with equiaxed microstructure under different mean stresses. Fatigue Fract. Eng. Mater. Struct. 2019, 42(9), 1950–1964. [Google Scholar] [CrossRef]
- Tao, Z.; Wang, Z.; Pan, X.; Su, T.; Long, X.; Liu, B.; Tang, Q.; Ren, X.; Sun, C.; Qian, G.; Hong, Y. A new probabilistic control volume scheme to interpret specimen size effect on fatigue life of additively manufactured titanium alloys, Int. J. Fatigue 2024, 183, 108262. [Google Scholar] [CrossRef]
- Sun, C.; Song, Q.; Zhou, L.; Pan, X. Characteristic of interior crack initiation and early growth for high cycle and very high cycle fatigue of a martensitic stainless steel. Mater. Sci. Eng. A 2019, 758, 112–120. [Google Scholar] [CrossRef]
- Cong, T.; Qian, G.; Zhang, G.; Wu, S.; Pan, X.; Du, L.; Liu, X. Effects of inclusion size and stress ratio on the very-high-cycle fatigue behavior of pearlitic steel. Int. J. Fatigue 2021, 142, 105958. [Google Scholar] [CrossRef]
- Heinz, S.; Balle, F.; Wagner, G.; Eifler, D. Analysis of fatigue properties and failure mechanisms of Ti6Al4V in the very high cycle fatigue regime using ultrasonic technology and 3D laser scanning vibrometry. Ultrasonics 2013, 53, 1433–1440. [Google Scholar] [CrossRef] [PubMed]
- Günther, J.; Krewerth, D.; Lippmann, T.; Leuders, S.; Tröster, T.; Weidner, A.; Biermann, H.; Niendorf, T. Fatigue life of additively manufactured Ti–6Al–4V in the very high cycle fatigue regime. Int. J. Fatigue 2017, 94, 236–245. [Google Scholar] [CrossRef]
- Zenou, M.; Grainger, L. Additive manufacturing of metallic materials. In Additive Manufacturing: Materials, Processes, Quantifications and Applications; Zhang, J., Jung, Y.-G., Eds.; Butterworth-Heinemann: Oxford, United Kingdom, 2018; pp. 53–103. [Google Scholar]
- Zhou, H.; Suzuki, Y.; Kinefuchi, M.; Shibanuma, K. Applicability of the multiscale model for predicting fatigue strength to short and long crack problems. ISIJ int. 2022, 62(10), 2126–2131. [Google Scholar] [CrossRef]
- Zhou, H.; Suzuki, Y.; Kinefuchi, M.; Schmauder, S.; Dogahe, K.; Shibanuma, K. Bridging strategy between microscopic and macroscopic crack growth simulations to predict fatigue strength of steels. Int. J. Fatigue 2023, 168, 107386. [Google Scholar] [CrossRef]
- Cao, F.; Ravi Chandran, K.S. The role of crack origin size and early stage crack growth on high cycle fatigue of powder metallurgy Ti-6Al-4V alloy. Int. J. Fatigue 2017, 102, 48–58. [Google Scholar] [CrossRef]
- Zheng, Y.; Zhao, Z.; Zhang, Z.; Zong, W.; Dong, C. Internal crack initiation characteristics and early growth behaviors for very-high-cycle fatigue of a titanium alloy electron beam welded joints. Mater. Sci. Eng. A 2017, 706, 311–318. [Google Scholar] [CrossRef]
- Pan, X.; Qian, G.; Wu, S.; Fu, Y.; Hong, Y. Internal crack characteristics in very-high-cycle fatigue of a gradient structured titanium alloy. Sci. Rep. 2020, 10, 4742. [Google Scholar] [CrossRef] [PubMed]
- Zhou, H.; Liu, Z.; Kinefuchi, M.; Shibanuma, K. Multiscale modelling strategy for predicting fatigue lives and limits of steels based on a generalised evaluation method of grain boundaries effects. Int. J. Fatigue 2022, 158, 106749. [Google Scholar] [CrossRef]
- Zhou, H.; Liu, Z.; Kikuchi, S.; Shibanuma, K. Analysis of fatigue performance of austenitic stainless steels with bimodal harmonic structures based on multiscale model simulations. Mater. Design 2023, 226, 111657. [Google Scholar] [CrossRef]
- Hu, Y.; Wu, S.; Wu, Z.; Wu, W.; Qian, W. Integrity of Additively Manufactured Advanced Mterials and Structures; National Defense Industry Press: Beijing, China, 2023. [Google Scholar]
- Qian, G.; Jian, Z.; Qian, Y.; Pan, X.; Ma, X.; Hong, Y. Very-high-cycle fatigue behavior of AlSi10Mg manufactured by selective laser melting: Effect of build orientation and mean stress. Int. J. Fatigue 2020, 138, 105696. [Google Scholar] [CrossRef]
- Pan, X.; Hong, Y. High-cycle and very-high-cycle fatigue of an additively manufactured aluminium alloy under axial cycling at ultrasonic and conventional frequencies. Int. J. Fatigue 2024, 185, 108363. [Google Scholar] [CrossRef]
- Long, X.; Jia, Q.; Li, J.; Chong, K.; Du, L.; Pan, X.; Chang, C. Mechanical properties and parameter optimization of TC4 alloy by additive manufacturing. China Surf. Eng. 2022, 35(2), 215–223. [Google Scholar]
- Xu, W.; Lui, E.W.; Pateras, A.; Qian, M.; Brandt, M. In situ tailoring microstructure in additively manufactured Ti-6Al-4V for superior mechanical performance. Acta Mater. 2017, 125, 390–400. [Google Scholar] [CrossRef]
- Chong, Y.; Bhattacharjee, T.; Yi, J.; Shibata, A.; Tsuji, N. Mechanical properties of fully martensite microstructure in Ti-6Al-4V alloy transformed from refined beta grains obtained by rapid heat treatment (RHT). Scripta Mater. 2017, 138, 66–70. [Google Scholar] [CrossRef]
|
Disclaimer/Publisher’s Note: The statements, opinions and data contained in all publications are solely those of the individual author(s) and contributor(s) and not of MDPI and/or the editor(s). MDPI and/or the editor(s) disclaim responsibility for any injury to people or property resulting from any ideas, methods, instructions or products referred to in the content. |
© 2024 by the authors. Licensee MDPI, Basel, Switzerland. This article is an open access article distributed under the terms and conditions of the Creative Commons Attribution (CC BY) license (http://creativecommons.org/licenses/by/4.0/).
