Introduction
Among the world’s greatest causes of mortality are auxotrophic tumors for the amino acid L-arginine [
1]. Among these malignancies are solid tumors such as prostatic and lung carcinomas [
2]. Natural human cells can synthesize L-arginine through a variety of metabolic pathways, but auxotrophic cancer cells lack the capability to do this while using L-arginine as their metabolic sole supply of carbon and nitrogen [
3]. As a result, restricting L-arginine to auxotrophic cancer cells facilitates the demise of such cells [
4].
Enzymes that degrade arginine, such as L-arginase, catalyze the hydrolysis of L-arginine to L-ornithine and urea [
5]. These days, L-arginase is essential to medicine because of its importance as an anticancer drug against auxotrophic tumors for L-arginine [
6]. There is limited data on L-arginase from bacteria, however, it is present and extensively dispersed in fungi, chordates, and non-chordates [
7].
Due to L-arginosuccinate synthetase-1’s lack of expression, auxotrophic tumors for L-arginine are unable to biosynthesize L-arginine [
8]. L-arginine is required for the production of proline and L-glutamate, two amino acids that are vital for cell growth [
9]. L-arginine, a nutrient-sensing kinase, directly stimulates the production of mTOR in auxotrophic cancer cells, resulting in carcinogenesis [
10].
The amounts of L-arginine within auxotrophic cancer cells control their mitochondrial activity [
11]. In auxotrophic cancer cells, a deficiency in L-arginine inhibits the production of nucleic acids and proteins, which in turn causes the cancer cells to undergo programmed cell death or apoptosis [
12]. Moderate anticancer actions of arginine degrading enzymes have been demonstrated against melanoma [
13] and hepatic carcinoma [
14]. However, in contrast to colorectal cancer forms that are auxotrophic for L-arginine, L-arginase has shown exceptional efficacy [
15].
It was detected that 70% of cancers are auxotrophic for L-arginine [
16]. Thus the objective of this work was to investigate 16S rRNA-based L-arginase-producing bacterial isolates from various Egyptian soil settings and characterize their anticancer enzyme activities.
Methodology
Ethical Statement:
All applicable national, international, and/or institutional criteria for the care and use of animals were preceded in the current investigation. The local authorities, Cairo University’s faculty of pharmacy, and the Ethical Committee for Animal Handling at Cairo University (ECAHCU) approved all study procedures, including the use of animals, in accordance with the recommendations of the Weatherall Report (approval number PLf184/2023). Every attempt was made to minimize the number of animals used in the study as well as their suffering.
Material and Microorganisms:
L-arginine, thiocarbazide, and diacetyl monoxime were acquired from Alnasr Chemical Company in Egypt. The following materials were purchased from the Algumhoria Chemical Company located in Egypt: soluble starch, lactose, mannitol, glucose, NaCl, L-arginine, KH2PO4, MgCl2, MnCl2, CoCl2, NiCl2, ZnSO4, FeSO4, FeCl3. The bacterial isolates were obtained from Egypt’s varied soil conditions. The reagents and markers required for molecular identification of L-arginase were supplied by Bio-Rad laboratories in the United States. Only analytical-grade chemical reagents were used in this study. All cancer cell lines were obtained from the USA-based company Accegen Biological. Bacillus cereus strain AH173, which served as the reference bacteria in this experiment, contributed to the research’s standardization.
Collection of Samples:
In Egypt, 100 soil samples were gathered at a depth of 11–20 cm from various governorates next to flour mills. Random sampling was done, and samples were kept in sterile polythene bags at 4 ̊C until needed.
Date and the Place of the Study:
Between April 2023 and June 2024, the current study was carried out at Cairo University’s pharmacy faculty in Egypt.
Type of Study:
Screening experimental work.
Methods:
Isolation and Screening of L-Arginase Producing Bacteria:
Following a 24-hour incubation period at 37 ̊C, soil samples were serially diluted and placed on nutrient agar plates. The morphology of bacterial colonies was analyzed, and their microscopic and biochemical features were checked. To check for L-arginase activity, isolates were streaked on mineral arginine agar media (MAA) that included the following: fluconazole (30 µg/ml), KCl 0.6%, MgSO4 0.4%, KH2PO4 2%, FeSO4 0.1%, PbSO4 0.3%, and L-arginine 5.0%. The inoculation plates were kept at 37 ̊C for a full day of incubation.
The instrument lists are displayed in
Table 1.
Determination and Description of the Mainstream Bacteria Producing L-Arginase:
Using morphological analysis and biochemical reactions, the highly potent isolates were identified. Employing the 16S rRNA sequencing method, more molecular characterization was completed. A modified QIAamp DNA Mini kit (Quiagen, Canada) was used to extract bacterial genomic DNA from 5-ml cultures that were cultivated overnight in nutrient broth for the promising isolates. Using the universal primers 5′ CCAGCA GCCGCGGTAATACG 3′ and 5′ ATC GGCTACCTTGTTACG ACT TC 3′, the isolated DNA from each bacterial isolate was utilized as a template to amplify the 16S rRNA gene. The following ingredients were added to the 100 µL PCR mixtures: 2.5 µL of DNA template, 2 IU of Taq polymerase, 10 mM Tris-HCl (pH 8.3), 100 mM KCl, 4 mM MgCl2, and each dNTP at 0.4 mM. The final volume was raised to 100 µL using water. Using the following thermocycler program, PCR was carried out: 10 minutes of 94 °C denaturation were followed by 35 cycles of 94 °C denaturation for 1 minute, 55 °C annealing for 1 minute, 72 °C extension for 2 minutes, and 72 °C final extension for 10 minutes. Using MEGA version 5.0 and the neighbor-joining algorithm, a phylogenetic tree was created to ascertain the taxonomic position of the isolates. The nucleotide sequences of the amplified 16S rRNA genes of the bacteria described in this investigation were compared to the GenBank nucleotide sequence database using BLASTn software.
Purification of L-Arginase from the Soil Samples:
After the soil samples were put into centrifuge tubes, the tubes were spun for five minutes at 500 rpm. The supernatants were divided into several test tubes, and L-arginase was removed by adding 1 ml of 70% ammonium sulfate to each 1 ml of supernatant. Additionally, the test enzyme was fully purified utilizing the cation exchange resin chromatography approach with a BioPro IEX SmartSep Q kit (bought from YMC, USA). Using a mass spectrometer (QUADRUPOLE MASS SPECTROMETER BELMASS II, MICROTRAC, USA), the molecular mass of L-arginase was ascertained.
Identification of physiological and environmental variables influencing the growth of L-arginase producing bacterial isolates on MAA plates:
In this application, different temperatures (25-100 ̊C), pH (3-13), different metal cations (Co+2, Mn+2, Ni+2, Mg+2, Fe+2, Zn+2, Ba+2) in a concentration of 5 mM for each metal ion, various metabolic sources of carbon (Maltose, lactose, starch, mannitol, glucose, sucrose, fructose) in a concentration of 10 mM for each carbon source and nitrogen metabolic sources (peptone, ammonium sulfate, L-arginine, Na nitrite, sodium nitrate, ammonium nitrate) in a concentration of 5 mM for each nitrogen source were utilized during the production of L-arginase using MAA plates. As well as inhibitors such as EDTA (5mM) and L-ornithine (10mM) were utilized. The DAM method was used to determine the activity of L-arginase produced spectrophotometrically at a wavelength of 505 nm. As well as the effect of different inoculum volumes (1-10) on the L-arginase production and activity was assessed.
Production of L-Arginase by Linked In Vitro Transcription-Translation Technique:
The 1-Step Human Coupled IVT Kit (purchased from ThermoFisher Scientific, USA) was used for this. The steps were taken in accordance with the manufacturer’s instructions for the kit. In summary, restriction endonuclease enzymes type II (bought from Invitrogen, USA) such as Hind III and EcoRI were used to extract the genomic DNA encoding the protein of interest (L-arginase) from the soil samples. Additionally, PCR was used to clone this gene. The primer for PCR cloning was designed using Primer plus version 3 software.
Forward primer for cloning the gene of interest was 5- GCGTGATGGAAGAAACCATT-3; while Reverse primer was 5- CATCCAGAATCGGGTTCACT-3. Furthermore, an aliquot of the 1-Step Human Coupled IVT kit was placed into a test tube along with 0.5 µg of a PCR-generated fragment that contained a T7 promoter. The mixture was incubated for 100 minutes at 29.5 ̊C in a 50 µl reaction container. There was no need for further protein purification.
Estimation of Protein Content:
The procedure was applied according to Biuret assay. Bovine Albumin was used as a standard drug.
Determination of Antioxidant Activity of L-Arginase:
A dot-blot rapid DPPH radical scavenging test was used to apply this. A Silica gel 60 F254 Merck thin-layer chromatography (TMC) plate was carefully filled with 5 µl dilutions of each L-arginase extract and a standard antioxidant, ascorbic acid, and left to air dry. Afterward, the sheets were sprayed with DPPH (0.2% W/V in L-arginase) to demonstrate the extract’s antioxidant properties. The extract’s ability to scavenge and its antioxidant qualities were assessed based on the strength of the yellow tint and the rate at which the extract spots’ color transitioned from purple to yellow.
Determination of Kinetic Properties of L-Arginase:
Plotting Michaelis Menten was used to accomplish this. Version 5 of GraphPad Prism software was used to fit the data to a one-phase exponential association nonlinear regression curve. The kinetic parameters of the purified L-arginase, including the Michaelis–Menten constant (Km) and maximal velocity (Vmax), were determined using varying concentrations of L-arginine (1–10 mM) as substrate. The rate at which L-arginine hydrolyzes under typical test conditions was measured using the Michaelis-Menten plot to evaluate L-arginase kinetic properties.
Determination of Anticancer Activity of L-Arginase:
This was performed using invitro MTT ((dimethylthiazol-2-yl) diphenyl tetrazonium) cell viability assay. Cancer cell lines (PC-3 human lung carcinoma cell line with Catalog number ABL-TC0543, E006AA human prostate cancer cell line with Catalog number ABI-TC008D and VERO control cell line with Catalog number ABC-TC1273) were purchased from an Accegen biotic company, USA; while acute promyelocytic leukemic cancer cell line HL60 with Catalog number CCL-240TM and kidney cancer cell line 786-O with Catalog number CRL-1932TM were obtained from ATCC, USA. Cell lines were passaged in the log arithmetic growth phase and placed into 96 well plates at a density of 7.1×10⁴ cells.ML-1. Cells were processed with the test L-arginase or the control phosphate buffered saline [PBS] in serum free medium for 1 day. For cell viabilities evaluation, 30 µl of MTT solution (10 mg.mL-1) was added for 5 hours in the dark. The supernatants were thrown-away and 200 µl of DMSO( Dimethyl sulfoxide) was added to each well to solubilize the formazan crystals. Optical densities were recordered at 500 nm on a microplate reader. Cell inhibition rates were assessed applying the following formula: IC50 = (1-A medication group ÷ A control group) * 100%.
Determination of Apoptosis Evoked by L-Arginase:
For this, the Caspase 3 assay was employed. According to the Kim RH et al., 2021 study, the method was carried out as previously reported [
18].
Statistical Analysis
For every culture, triplets were used. Standard deviation and mean were the methods they used to present. Both Excel spreadsheet software and one-way analysis of variance (p value≤.05) were employed as methods for doing statistical analysis. The current study used the F statistical test.
Results
Only the bacterial isolates capable of using L-arginine as their only carbon and nitrogen metabolic source were cultivated on the MAA medium. It was established that Bacillus cereus strain DSM 360 was the major bacterial isolate generating L-arginase using molecular detection and biochemical testing. The anticancer impact of bacterial L-arginase on auxotrophic tumors for L-arginine was remarkable when co-factors such as Co+2, Ni+2, and Mn+2 metal ions were present. The overall protein content was 0.349 mg, and the total enzyme activity was 8.174 U with 61% enzyme recovery. Moreover, the particular activity reached 23.4212 U/mg. Using the mass spectrometer, the molecular weight of the bacterial L-arginase was found to be 37 KDa.
The MTT method was utilized to ascertain the anticancer activity.
Different cancer cell lines showed reduced cell viability; on the other hand, the Vero cell line showed no reduction in cell vitality. For renal cancer, 2.73 U/ml, prostatic cancer, 3.91 U/ml, acute promyelocytic leukemia cancer, and lung cancer, 0.91 U/ml were the (median inhibitory concentration) IC50 values of bacterial L-arginase. For the Vero cell line, the IC50 value was close to zero.
Just 71 of the 100 soil samples that were taken from various sites in Egypt showed positive (+ve) development on MAA plates. However, Bacillus cereus DSM 360 was identified as the predominant bacterial isolate in 55 of the bacterial isolates cultivated on MAA plates by means of Gram staining, morphological characterization, and molecular detection using the 16S rRNA homology approach. The other bacterial isolates were identified as belonging to other Bacillus species. Using 70% ammonium sulfate salting out and cation exchange chromatography, the test L-arginase was purified. 53% of the degree was pure.
Mannitol was shown to be the best metabolic carbon source that increased the synthesis of the test enzyme, whereas peptone was found to be the best metabolic inducer nitrogen source.
The DAM test was used to measure L-arginase activity. It was shown that the quantity of urea generated as a result of L-arginase’s breakdown of L-arginine substrate rose proportionately with an increase in L-arginase concentration.
Conversely, in this work, L-arginase was translated using an invitro coupled translation approach. L-arginase produced 90 µg/ml of product. There was no need to purify this extracellular enzyme.
GraphPad Prism software version 5 was utilized to assess the kinetic characteristics of L-arginase throughout the DAM experiment. The enzyme that was being tested has kinetic characteristics of 7.36 mmol/l for Km and 6.14 μmol/min for Vmax, respectively. The half-life duration (T1/2) was 86.53 minutes at 60°C and 90.17 minutes at 50°C. The test enzyme held its thermostability at 60°C for one hour.
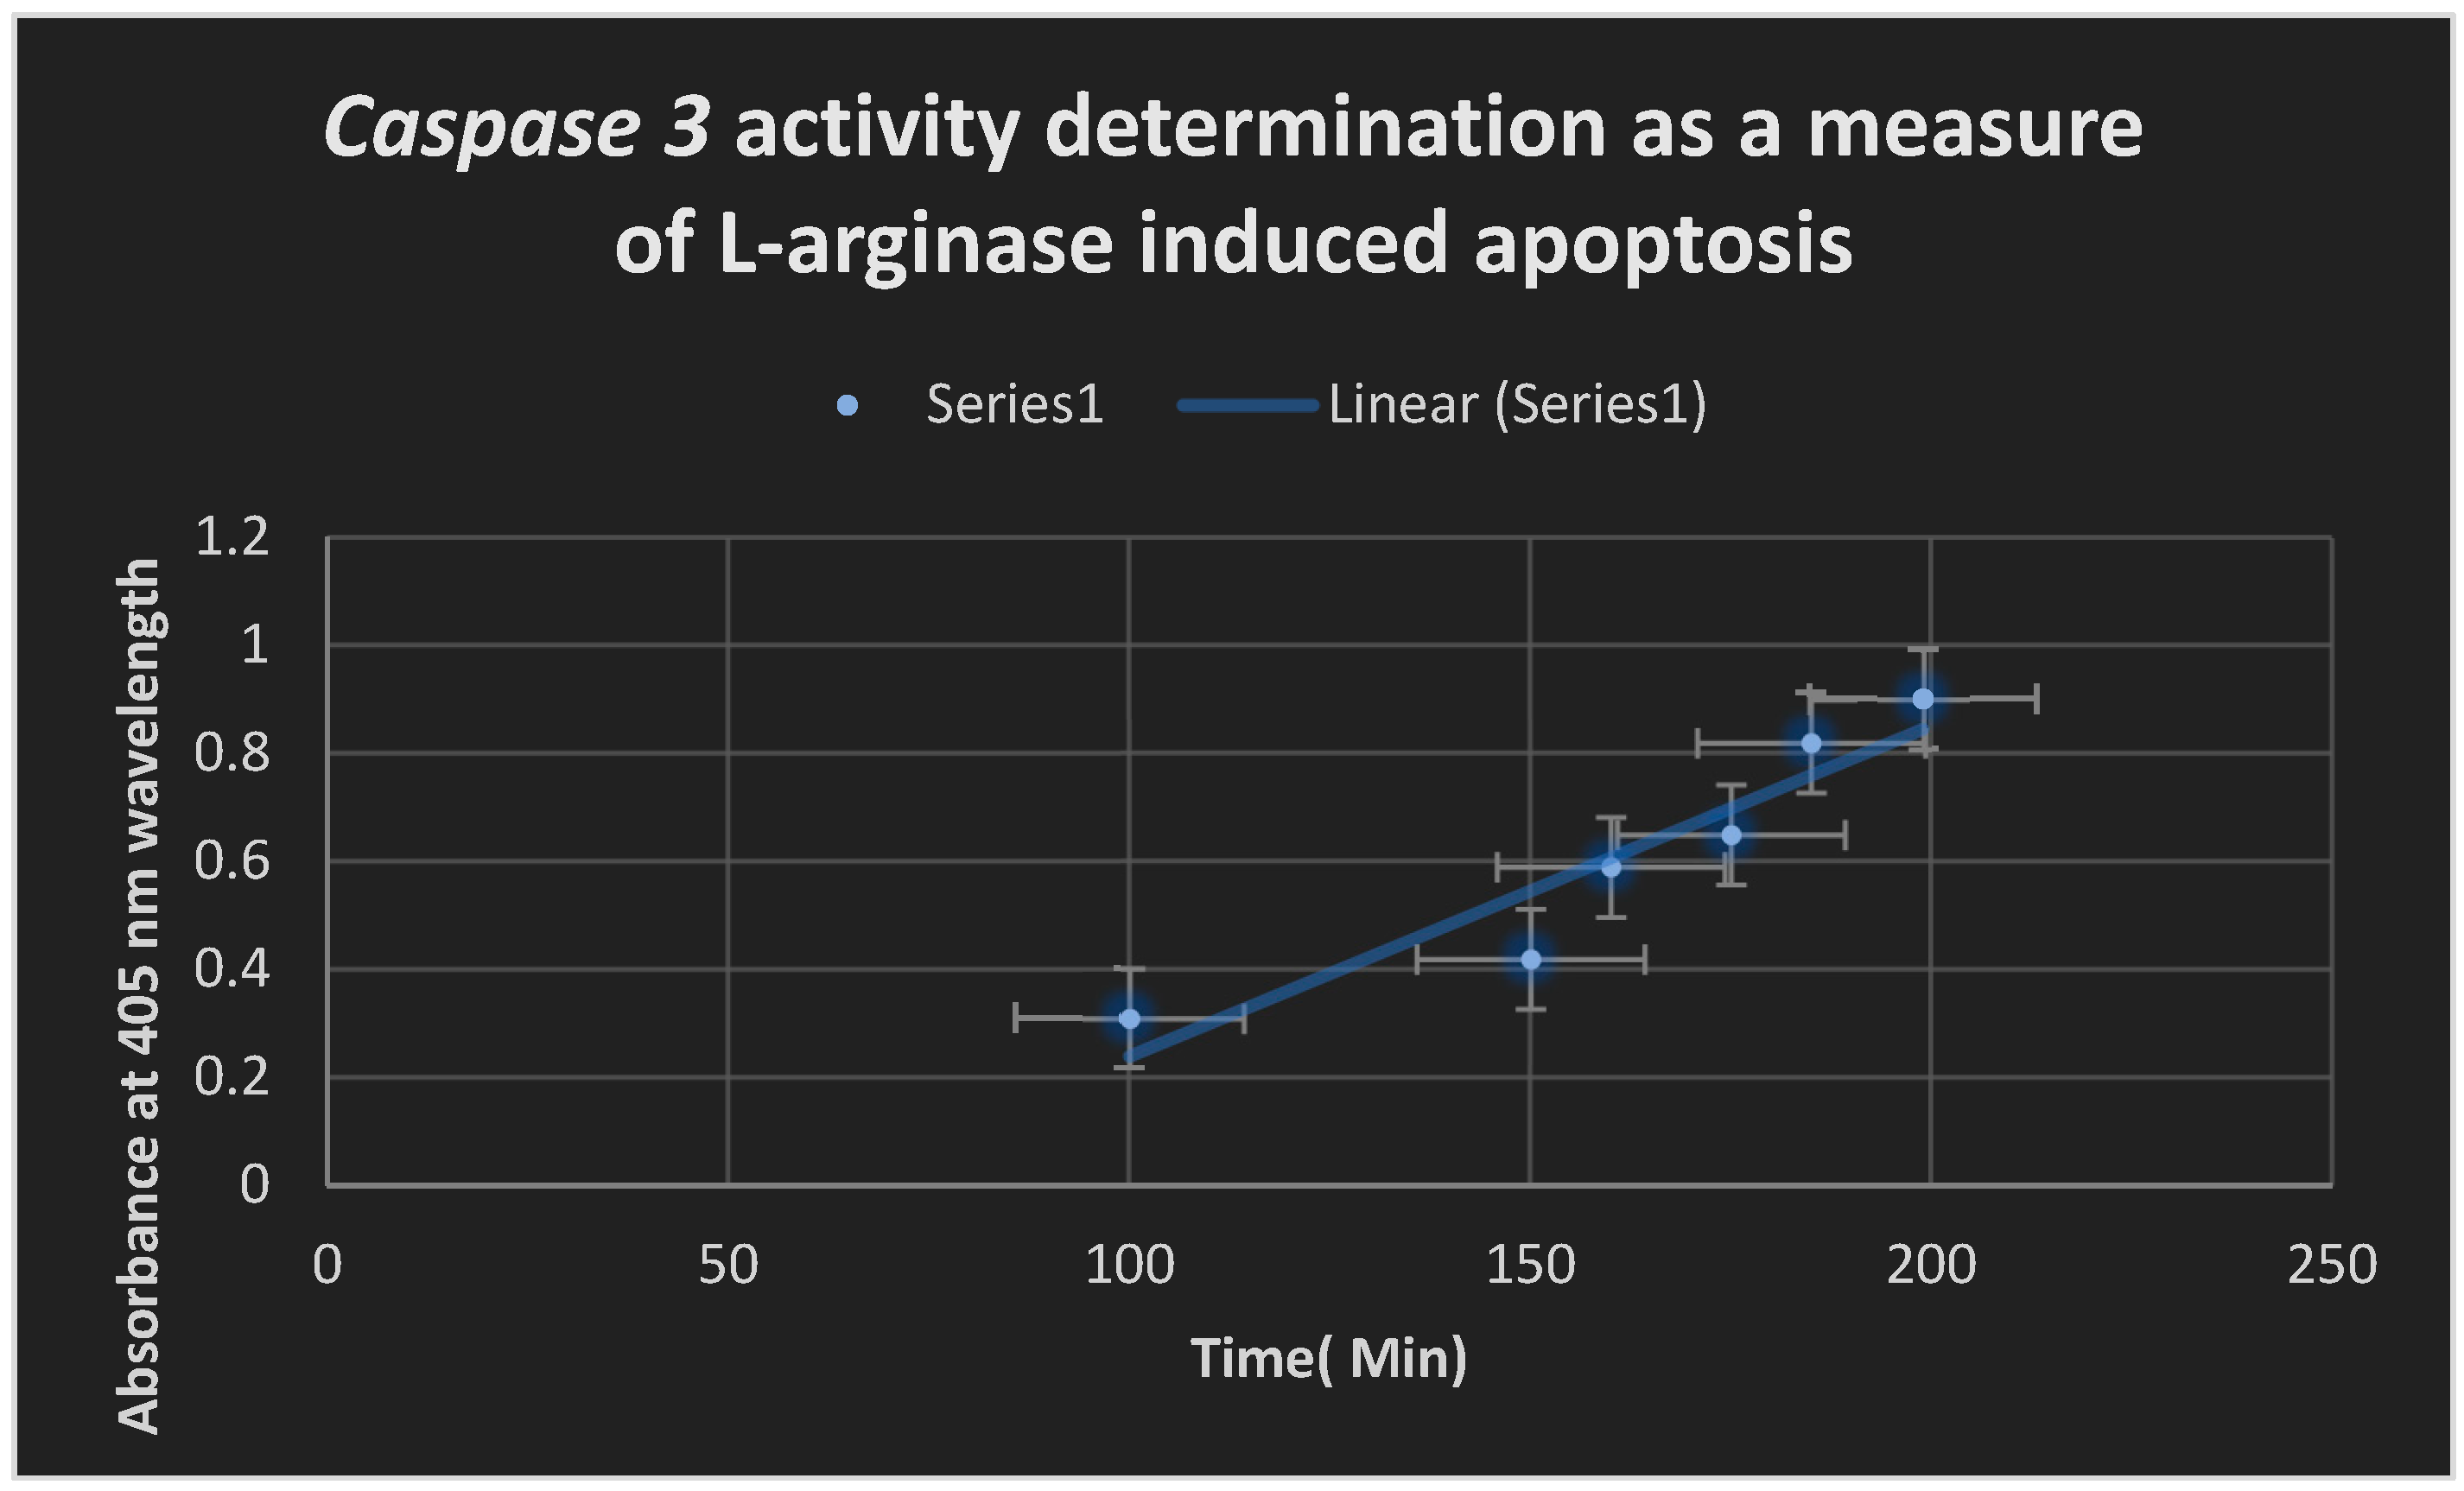
The test enzyme activity was shown to be most active at an alkaline pH, peaking at pH 9. At 40 °C, the test enzyme’s peak production was found. It was established that pH ranges of 7.4 to 10 were ideal for the development of isolates of bacteria that produced L-arginase. Using the Caspase 3 method, it was determined that L-arginase enhanced apoptosis by boosting Caspase 3 activity.
Ideal metal cations, such as Co+2, Ni+2, and Mn+2, were shown to increase the test enzyme’s productivity and efficacy. However, the presence of L-ornithine amino acid was discovered to eliminate the enzyme’s productivity and efficacy. Also productivity and activity was reduced significantly in presence Fe+3 and Zn+2 metal ions.
During the DPPH scavenging experiment, no L-arginase antioxidant activity was achieved. On the other hand, it had qualities of a moderate oxidizing agent.
Disscussion
arginine auxotrophic tumors are among the world’s most deadly illnesses, thus it’s important to look to nature for new and creative treatments [
19].
Using the 16S rRNA homology approach, the current work sought to identify and screen the powerful bacterial isolates that produced L-arginase, which were obtained from various soil habitats in Egypt and used as an anticancer drug. After it was discovered that L-arginase is a metallic hydrolytic enzyme that changes L-arginine into L-ornithine and urea, it was thought to be a promising anticancer drug, especially against auxotrophic malignancies for L-arginine, which include renal, lung, prostatic, and acute promyelocytic leukemia cancers.
Just 71 of the 100 soil samples that were taken from various Egyptian locations provided evidence of bacterial growth on MAA plates. The Bacillus cereus strain DSM 360 was identified as the source of fifty-five bacterial isolates. All of the bacterial isolates that produced L-arginase were confirmed to be Gram +ve Bacilli by homology modeling using both BLASTn and Clustal Omega tools.
It was discovered that
Pseudomonas sp strain PV1 was the primary source of L-arginase production (Nadaf P. D, Kulkarni A. G, and Vedamurthy A. B. research, 2019) [
20]. In this study,
Bacillus cereus strain DSM 360 bacterial isolates were the predominant ones that produced L-arginase.
For the bacterial isolates that produced L-arginase, peptone, and mannitol were the best sources of carbon and nitrogen for metabolism. Furthermore, the best inoculum amount for L-arginase synthesis was 2%. When Co+2, Ni+2, and Mn+2 metal activator ions were present as cofactors, it was shown that productivity and biological activity were greatly increased; however, when Fe+3,Zn+2 metal ions and L-ornithine amino acid were present, there was a considerable decrease in enzymatic activity. The ideal temperature and pH for the test enzyme’s maximal yield were 40 °C and 9 °P. For 60°C for an hour, the test enzyme demonstrated thermostability. Conversely, L-arginase activity was maintained within the 25–70 °C temperature range.
The impact of L-arginase on the viability and proliferation of cancer cells was assessed using the MTT assay. The optimal anticancer drug against lung, acute promyelocytic leukemia, kidney, and prostatic malignancies was found to be L-arginase, as demonstrated by the significant decrease in cell viability and proliferation observed in all cancer cell lines. The viability and proliferation of Vero normal cell lines were not considerably impacted.
The mechanism of action was found to be caused by L-arginase inducing apoptosis (as revealed by the Caspase 3 activity testing) and hydrolyzing L-arginine to urea and L-ornithine (as indicated utilizing the DAM test).
Using the DPPH scavenging method, no antioxidant activity for L-arginase was found. The minor oxidizing activity of L-arginase, on the other hand, was established.
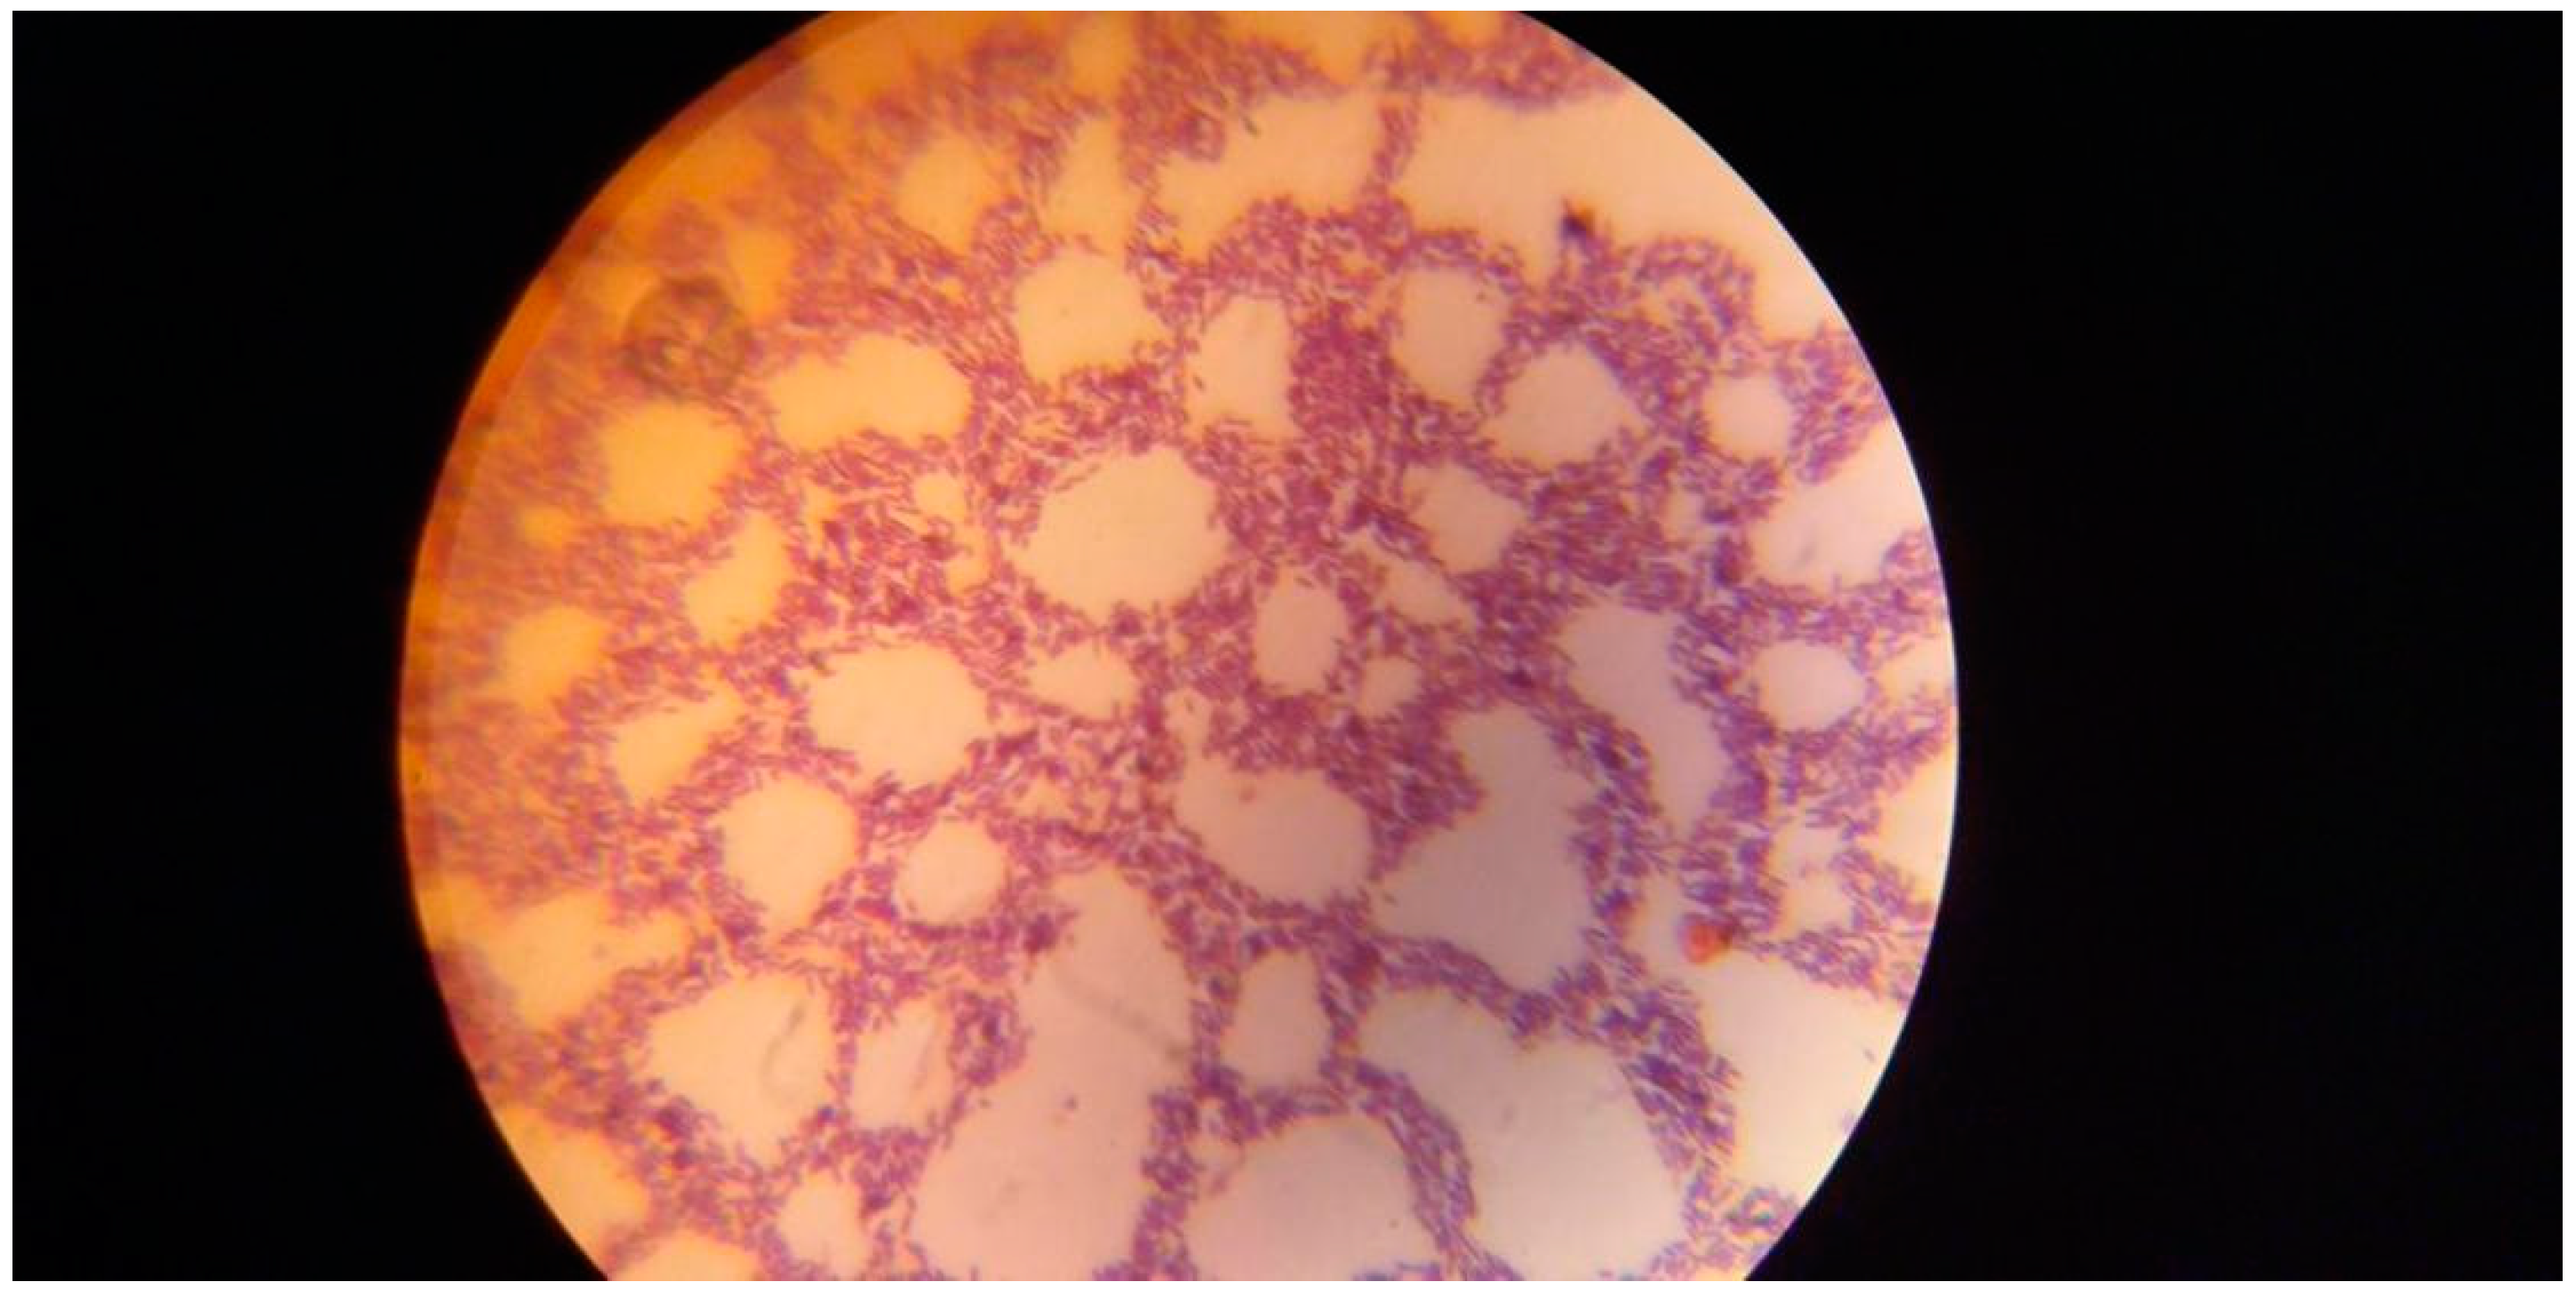
Using gram staining,
Figure 1 shows purple-colored
Bacillus cereus DSM 360 isolates generating L-arginase enzyme under a standard light microscope.
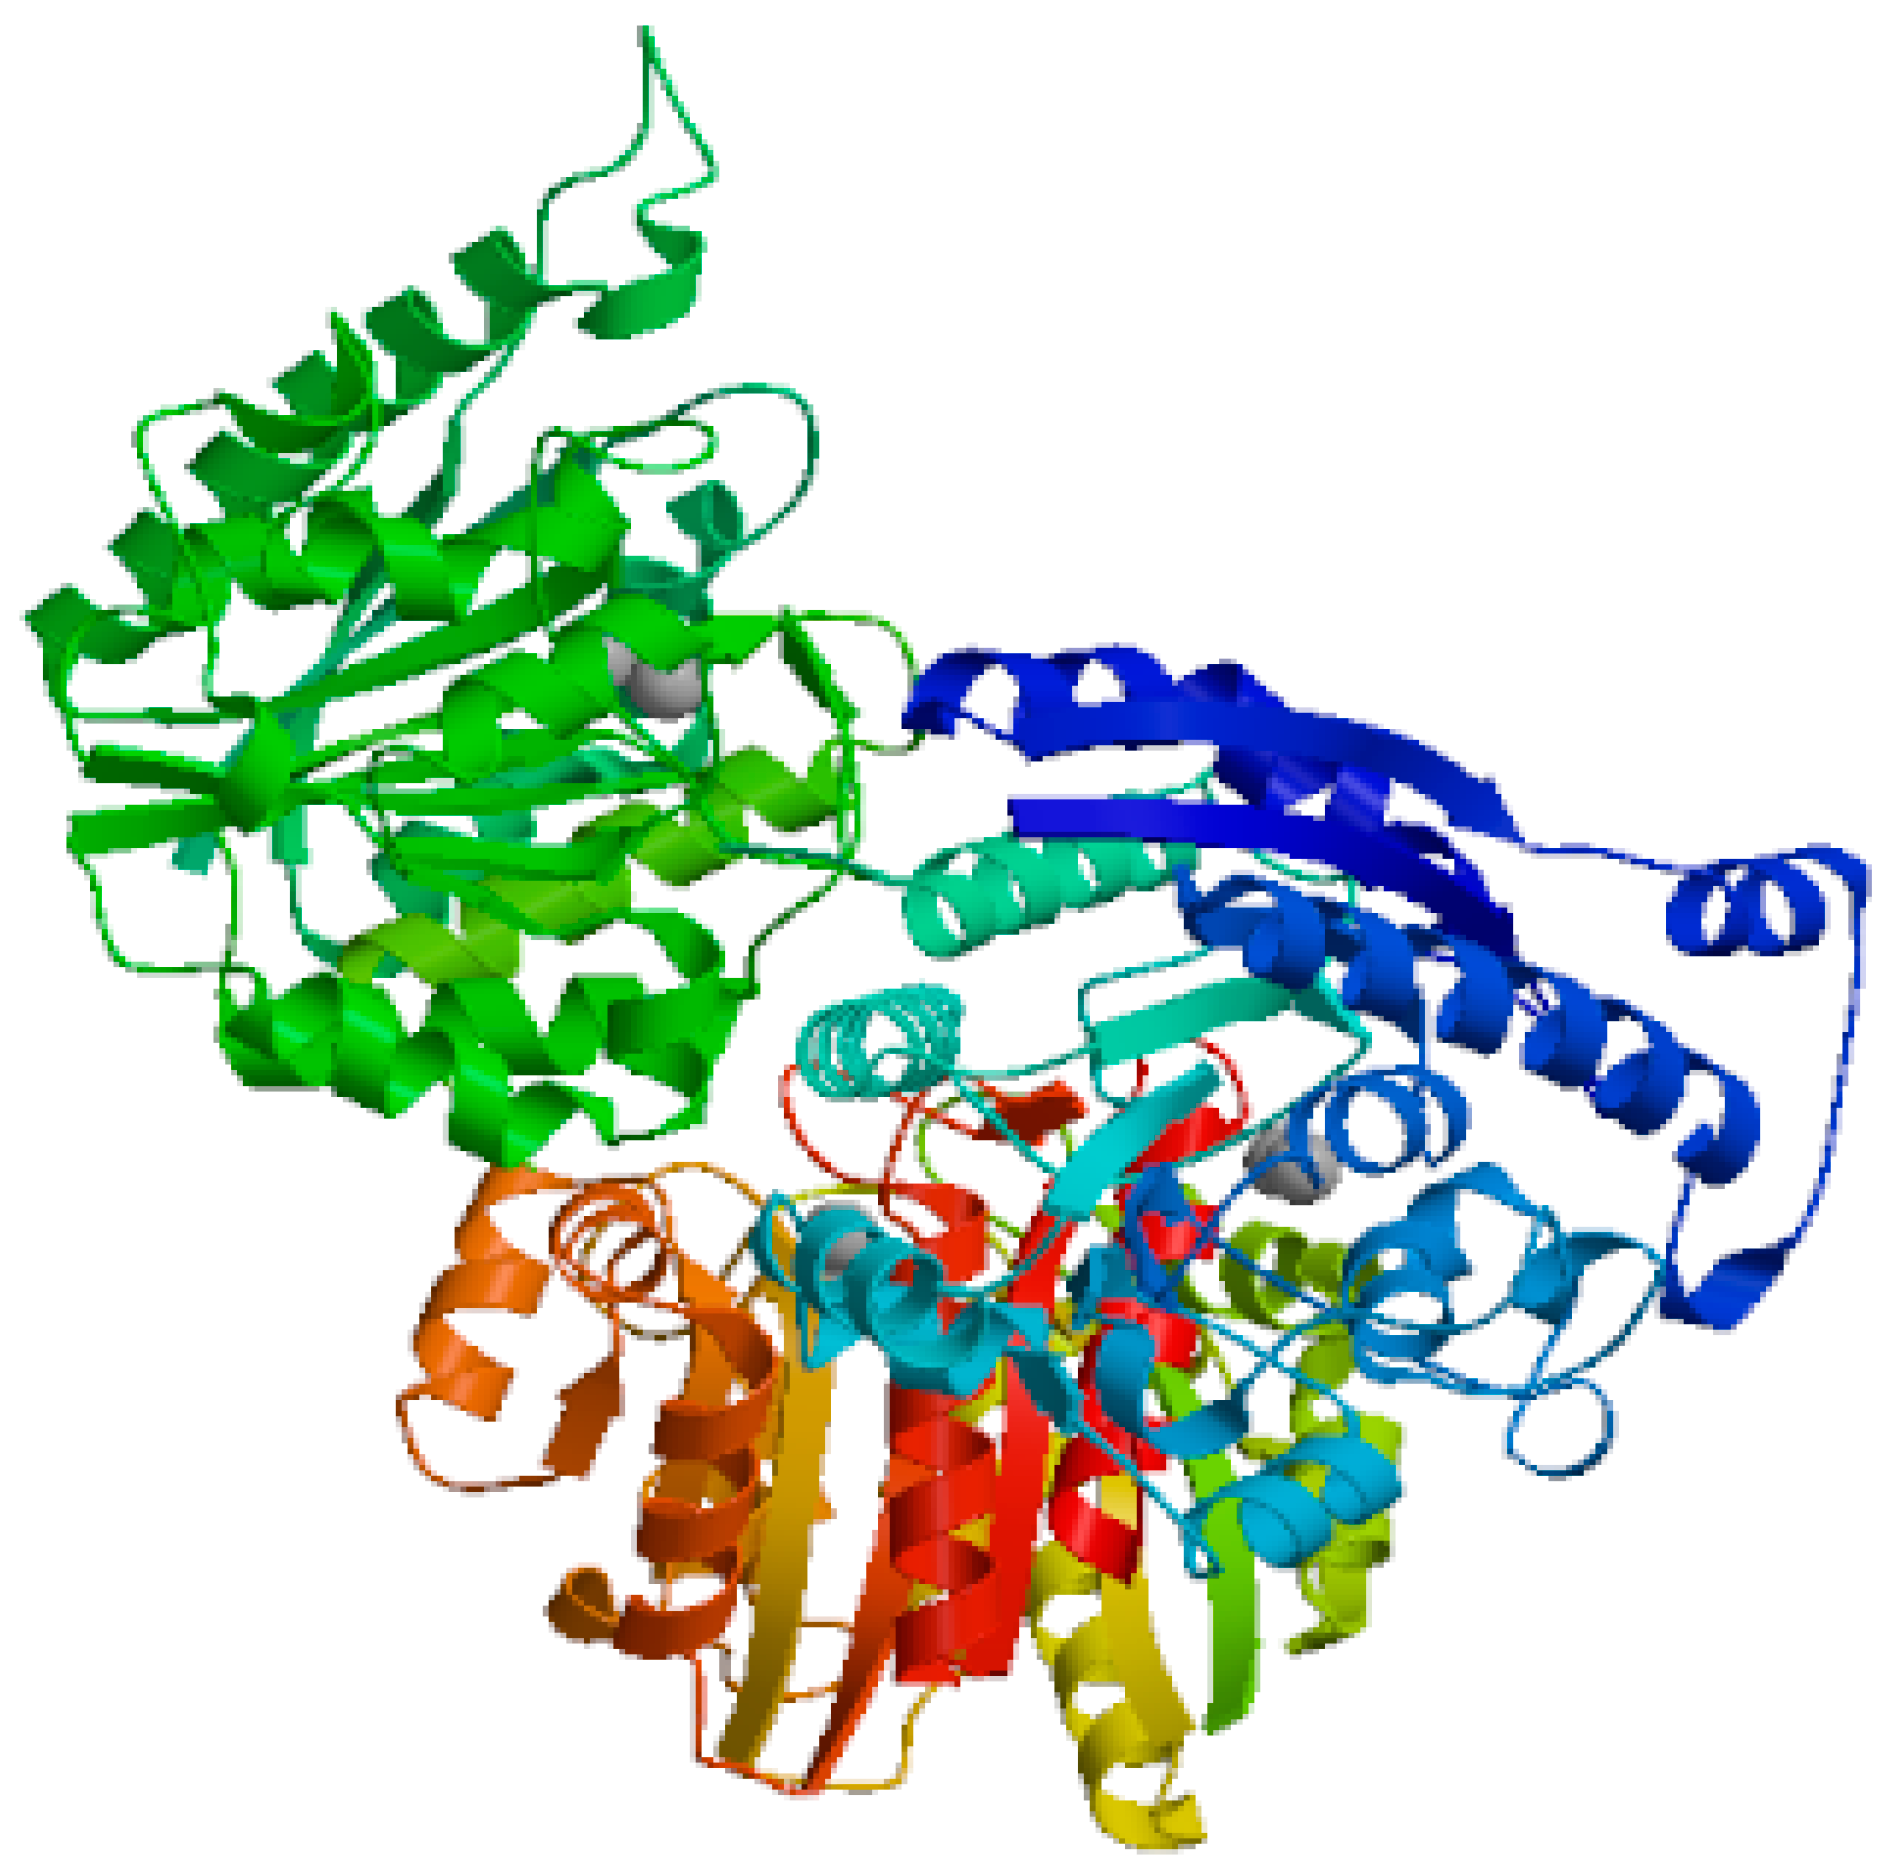
Figure 3, which was produced with the SWISS-MODEL program, shows the L-arginase of
Bacillus cereus DSM 360 in three dimensions. The biological action of L-arginase as an anticancer drug was shown to be mostly attributed to its spiral alpha helices. The docking of L-arginase with Ni
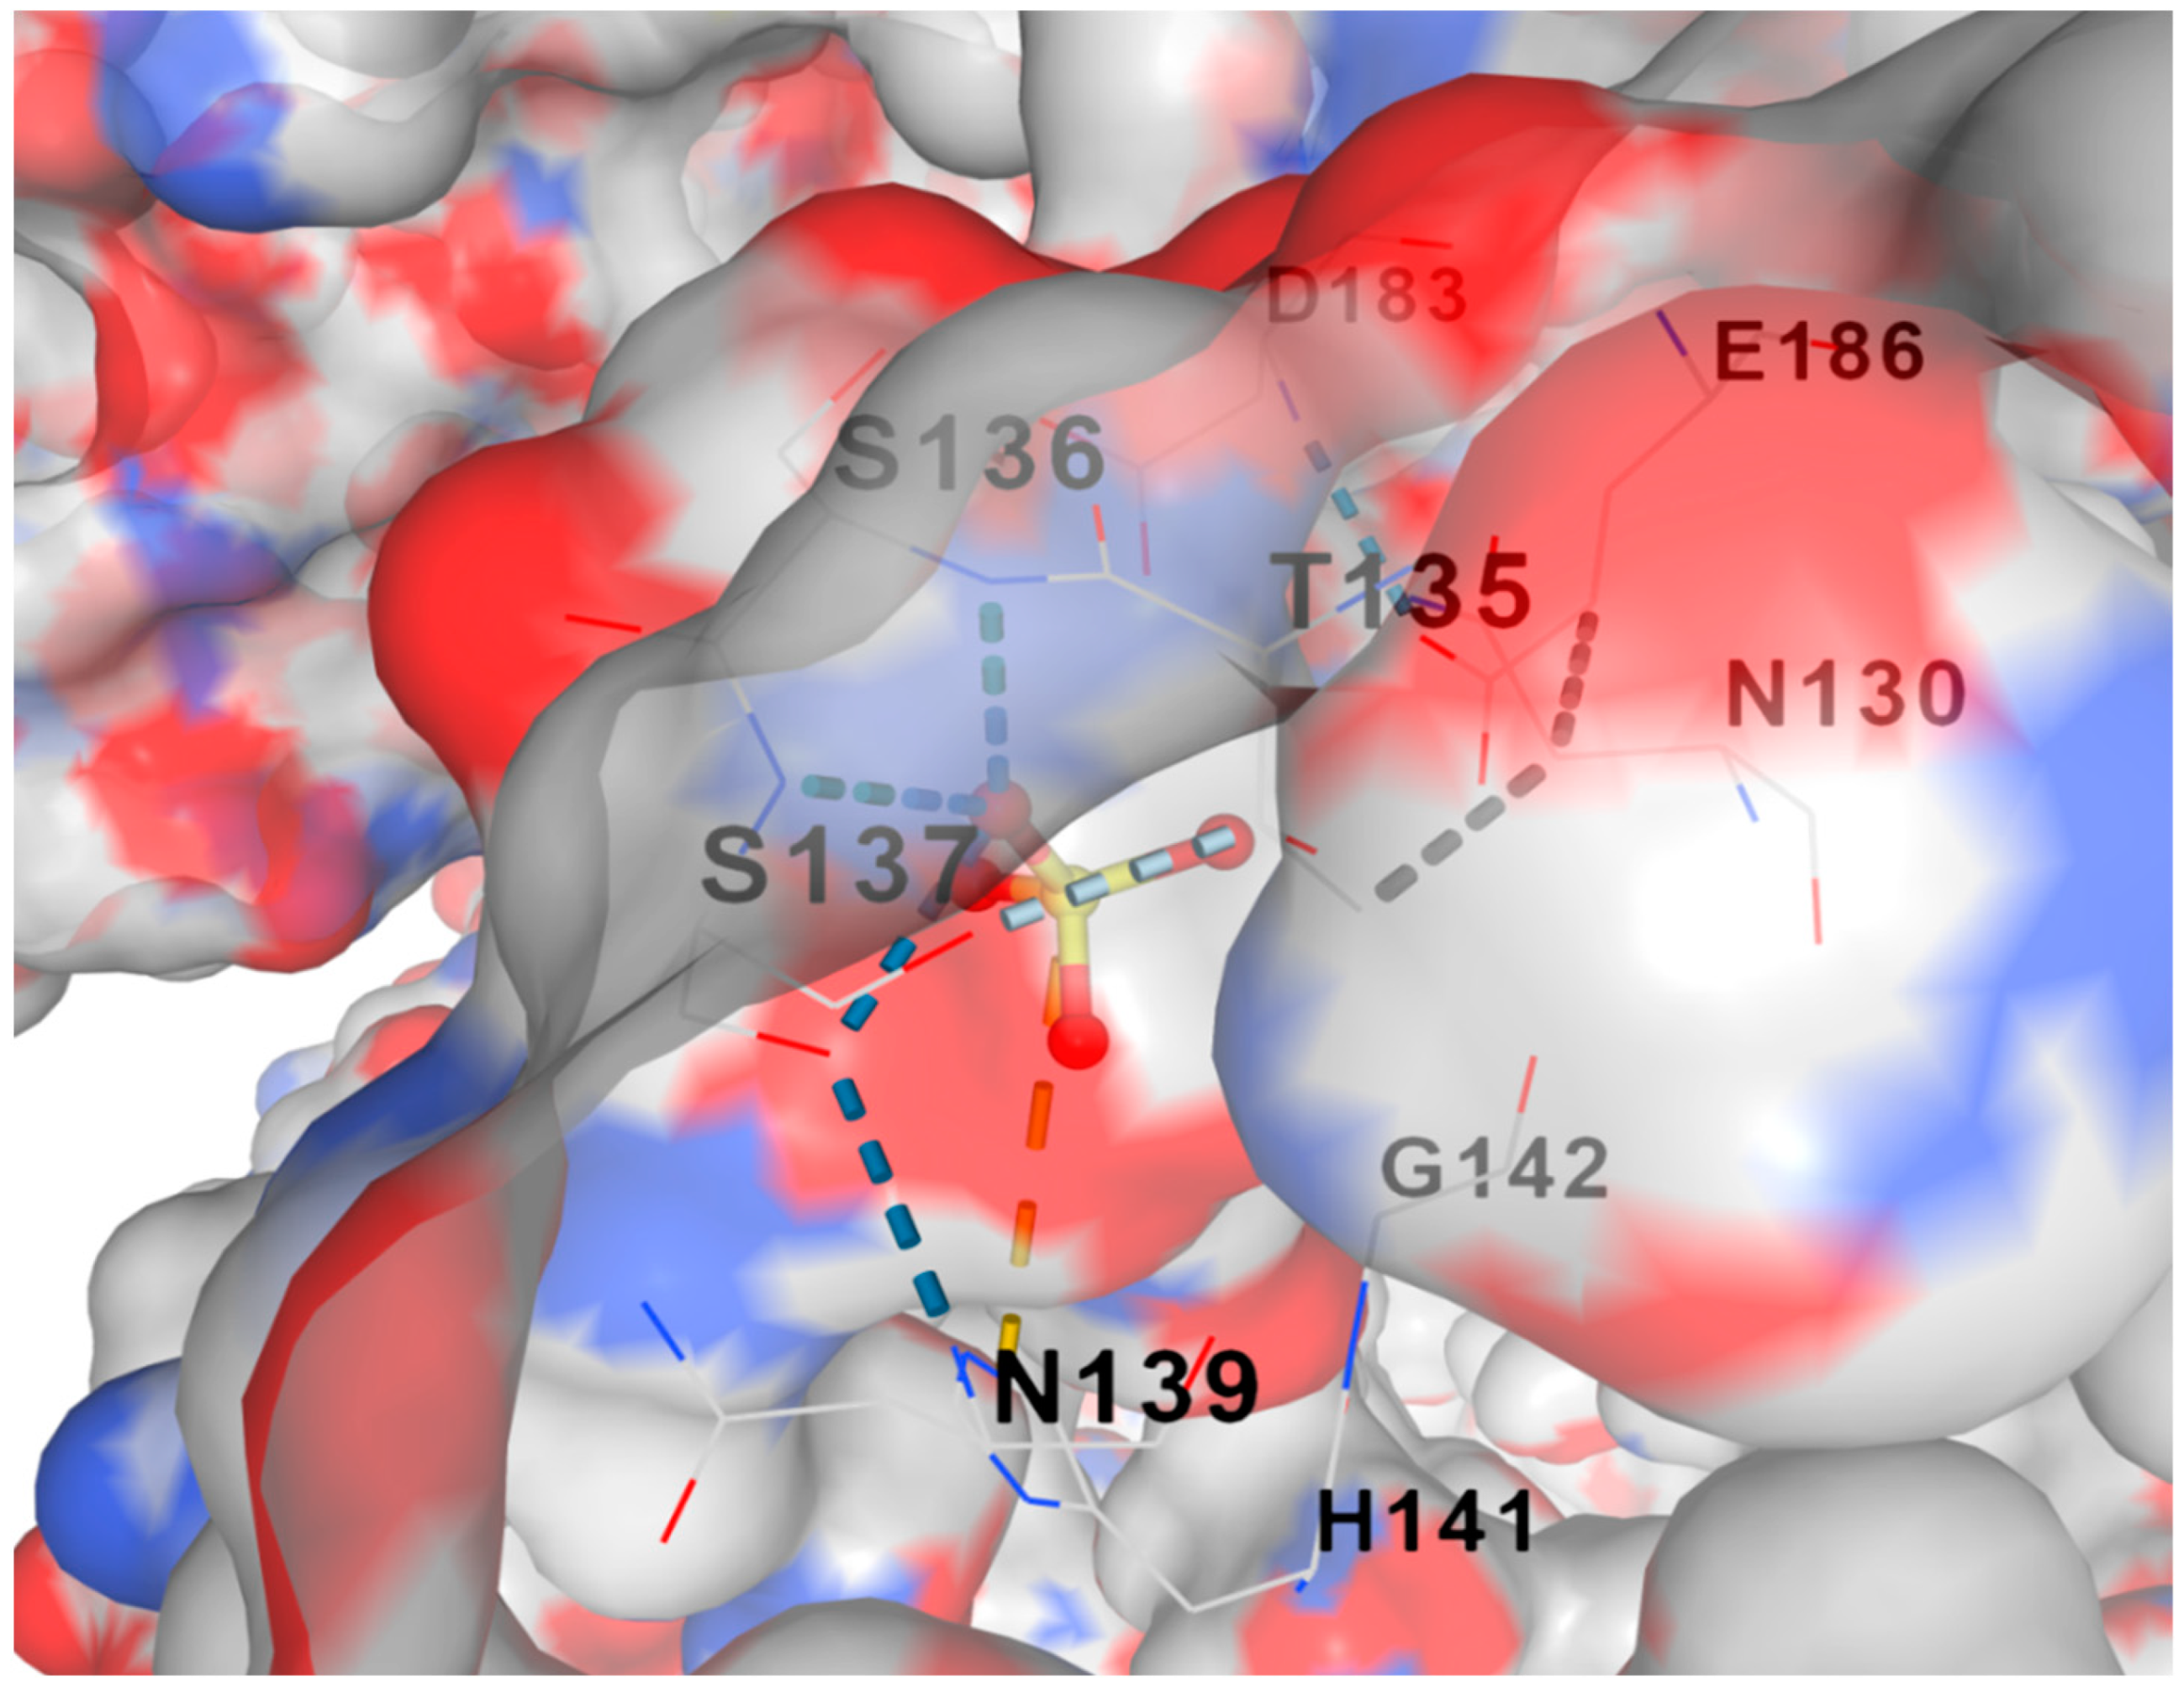
+2 ligand using CB-DOCK2 software is depicted in
Figure 5. The reaction’s standard Gibbs free energy change (∆G) was around -2.8 J/mol, indicating a high affinity between the metal ions Ni
+2 and L-arginase.
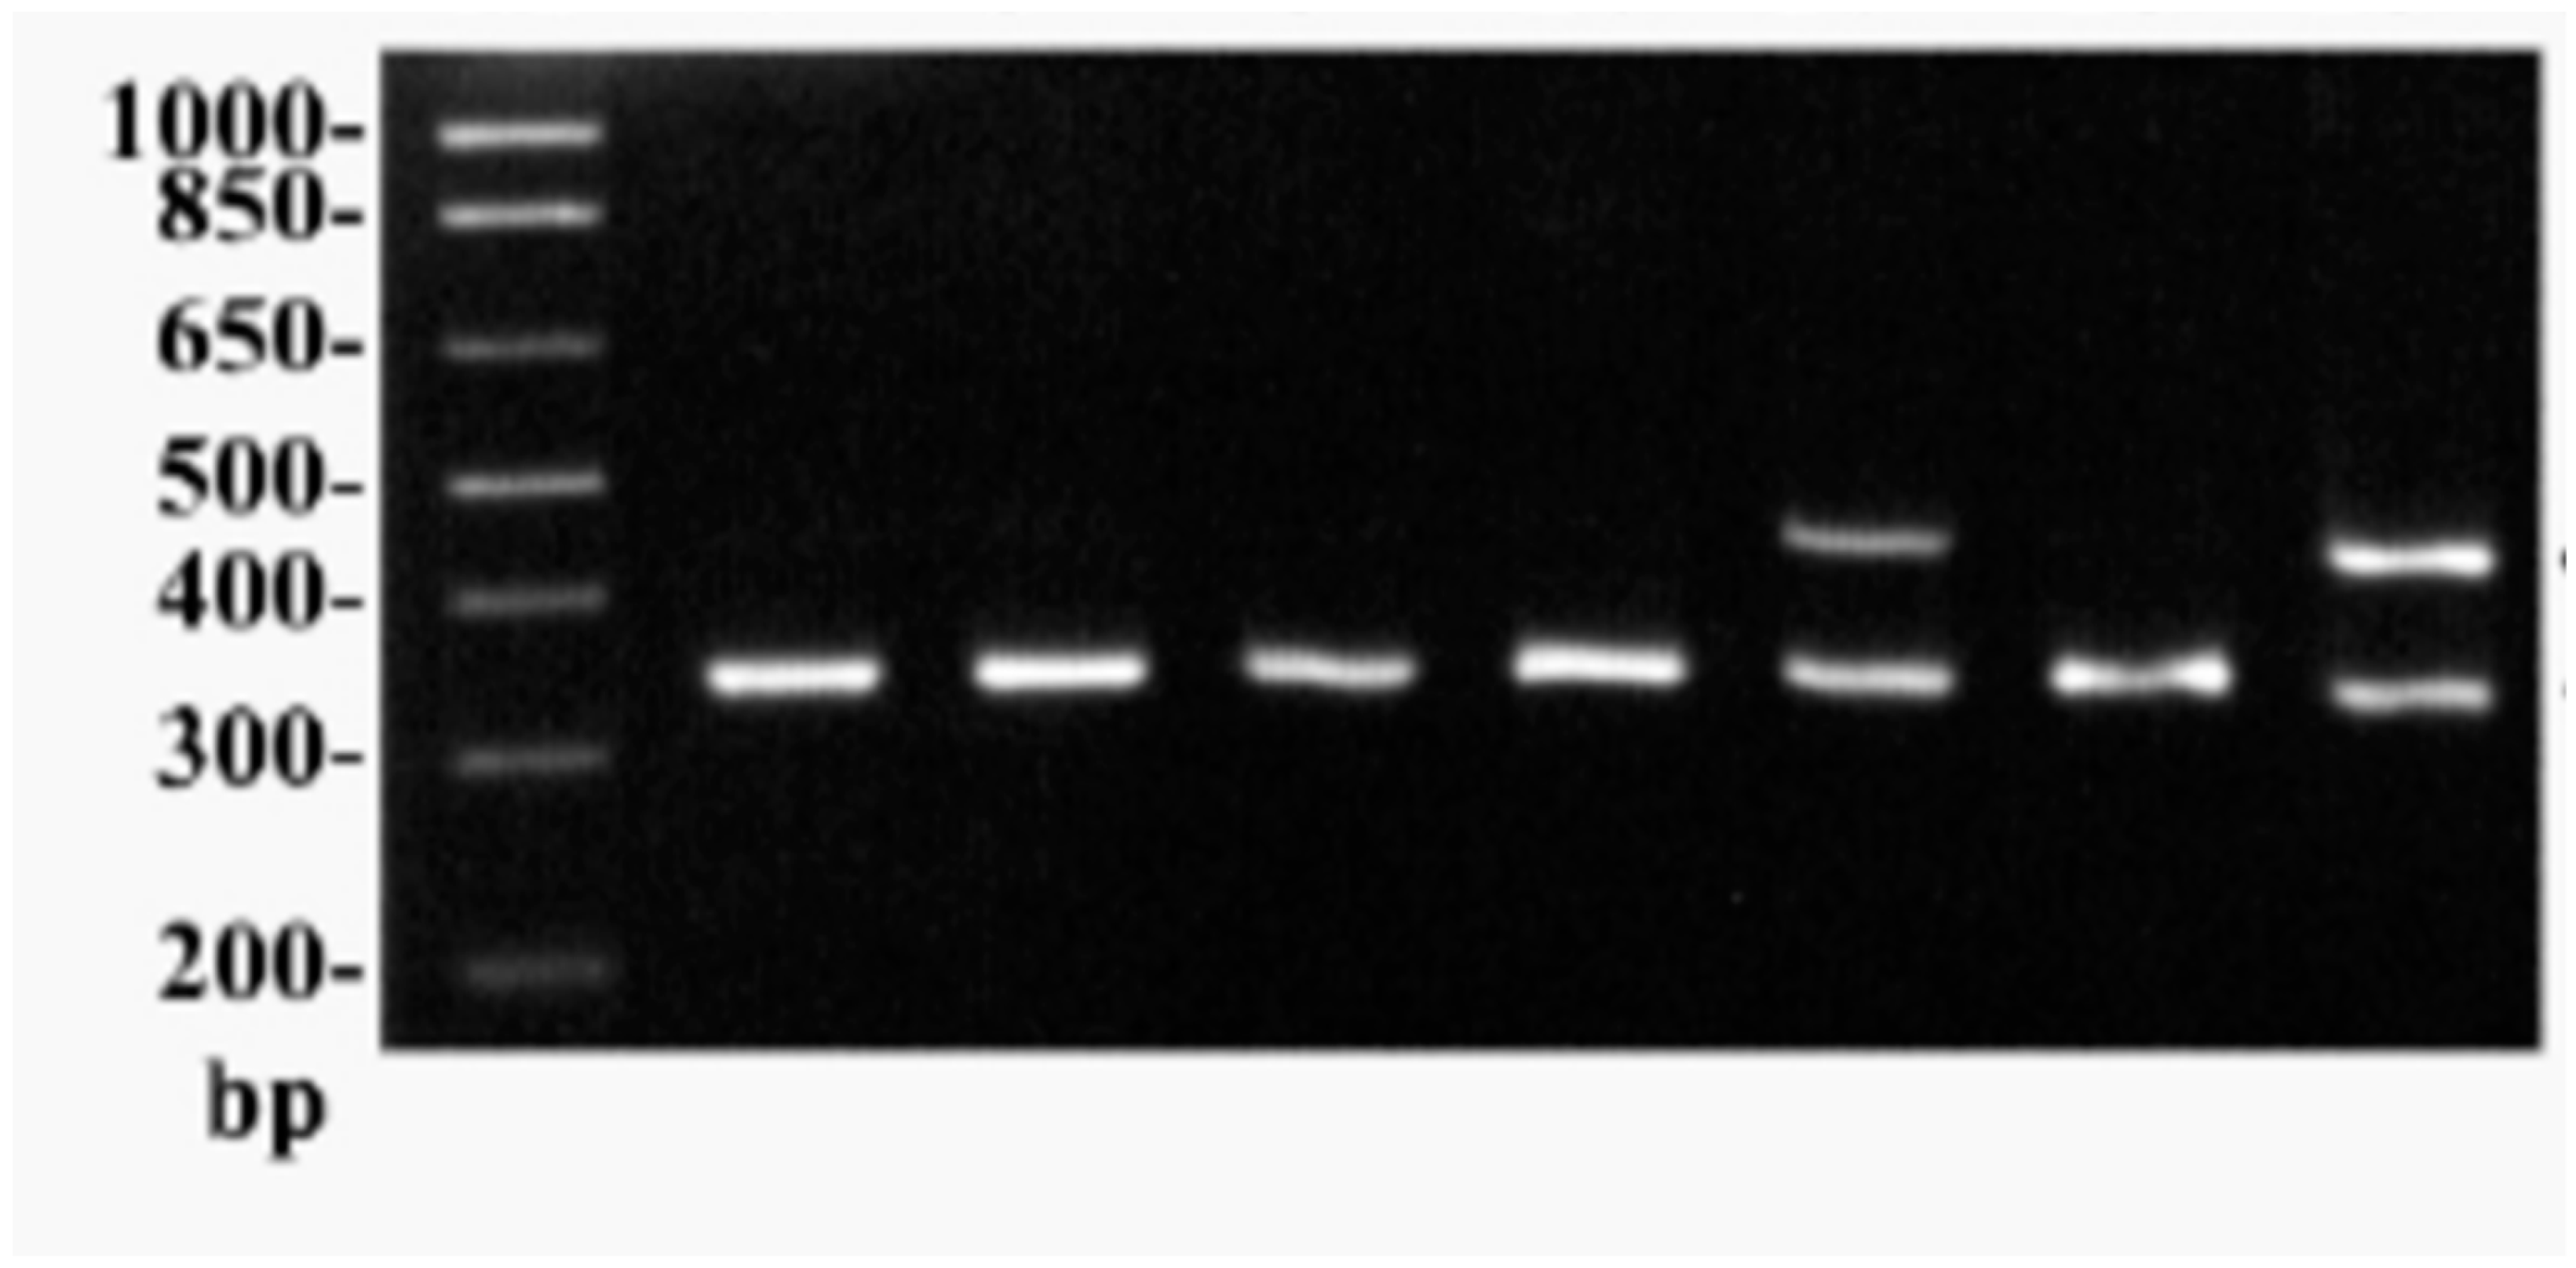
The PCR-based gene cloning of the L-arginase enzyme, which was isolated from the main soil bacterial strain
Bacillus cereus DSM 360, is shown in
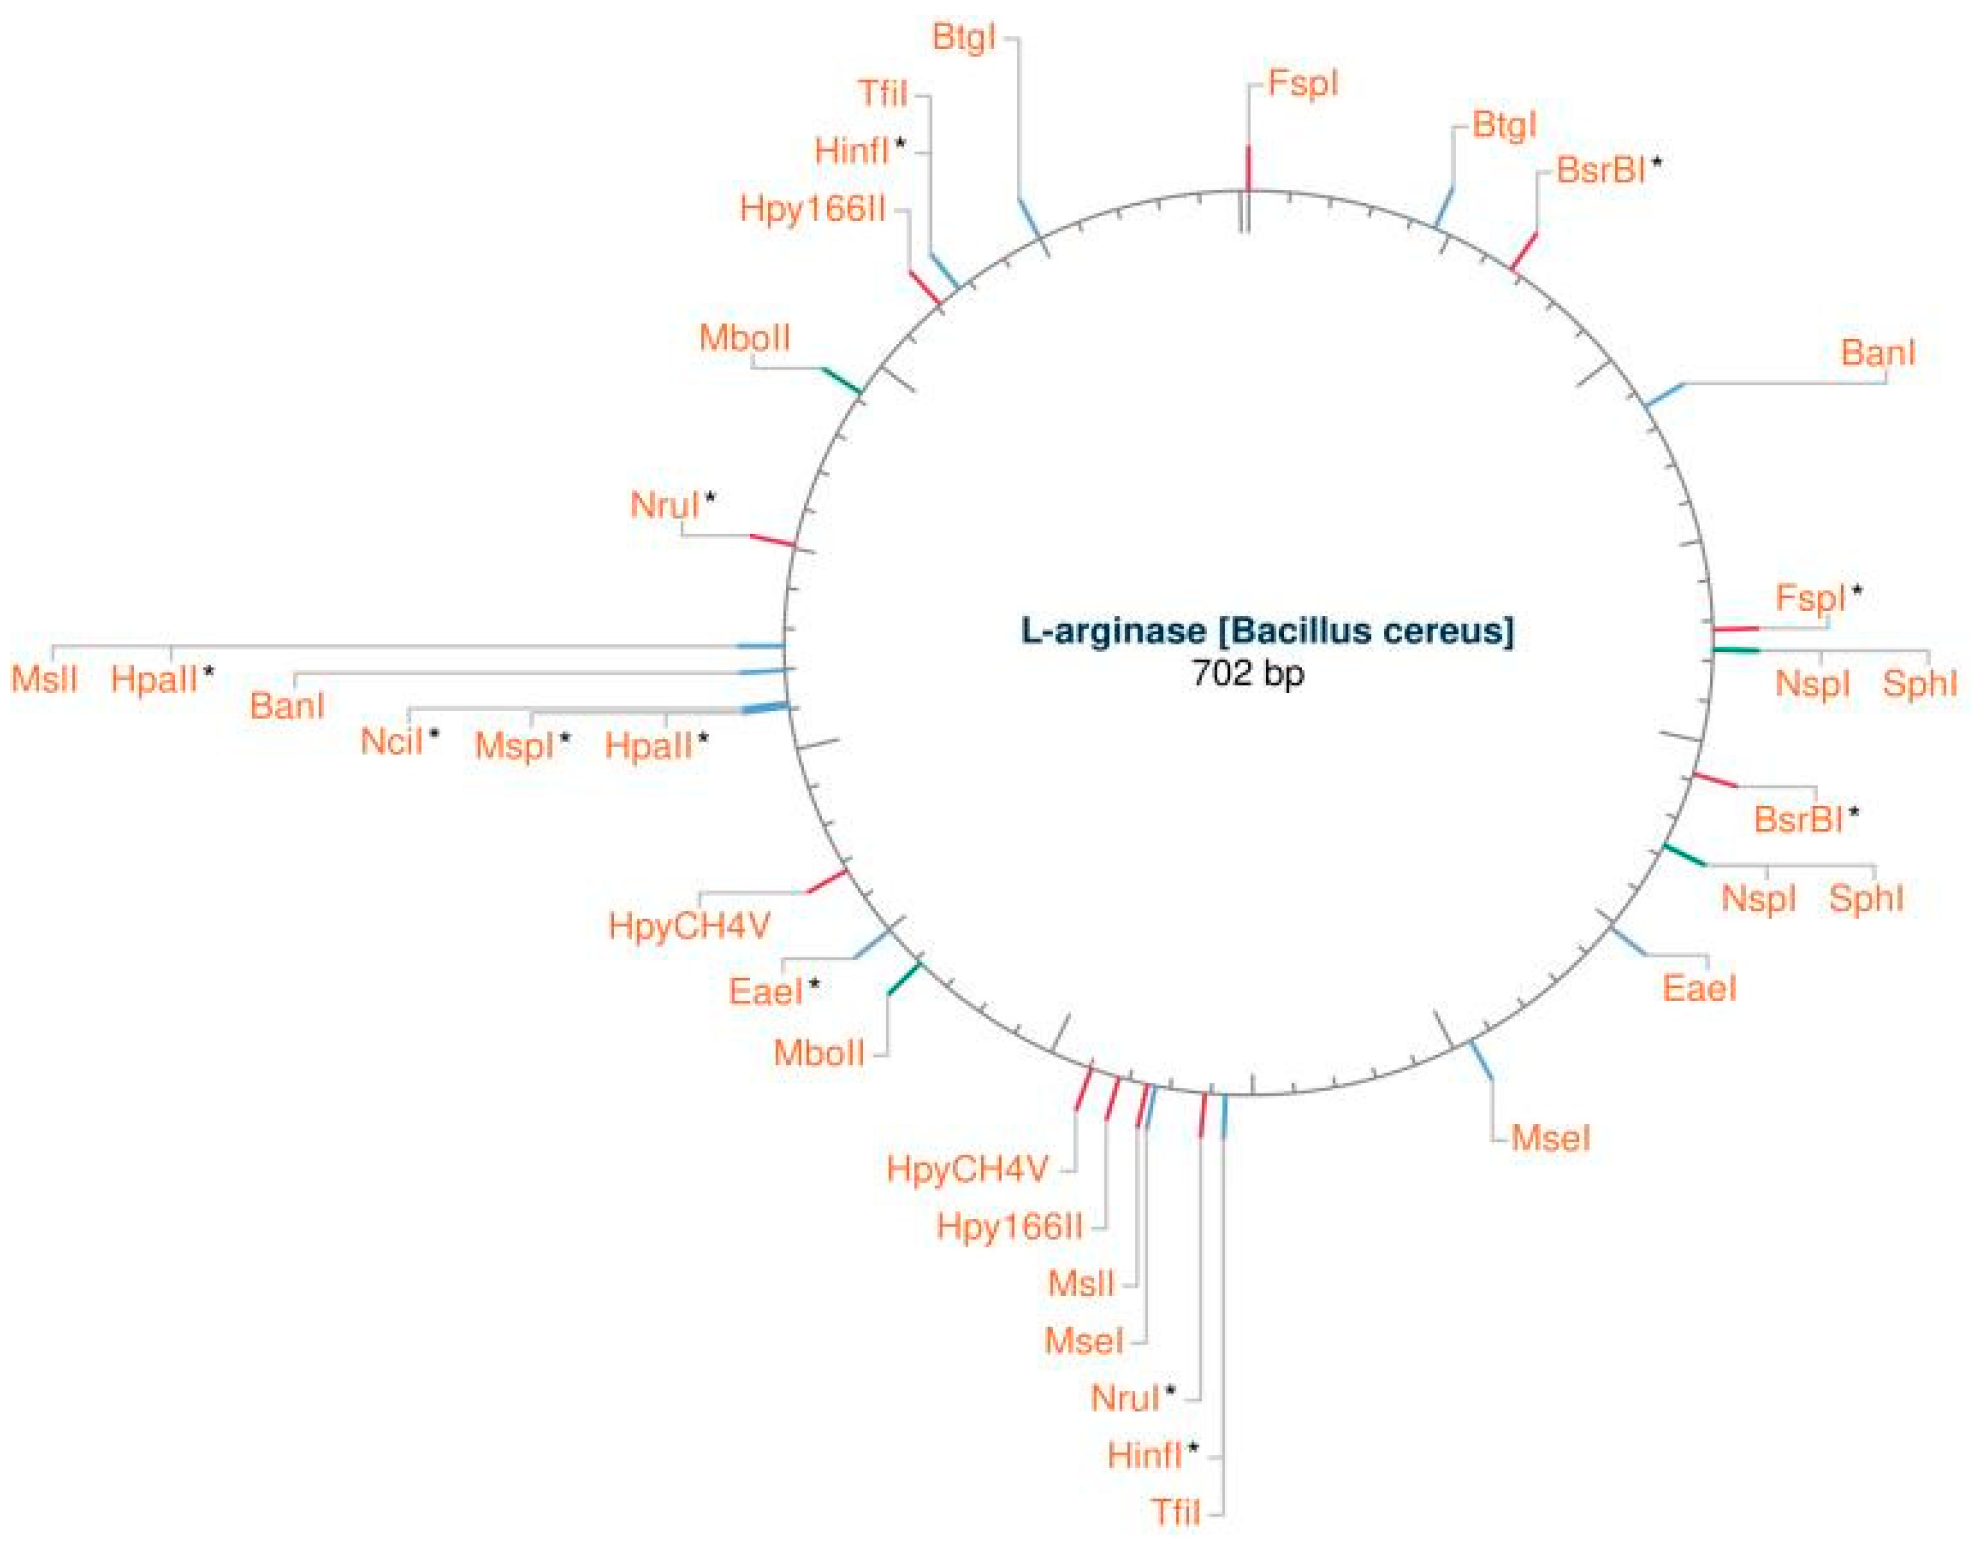
Figure 2. The NEBcutter
TM v3.0 program was used to create
Figure 4, which shows the identification of a suitable restriction endonuclease type II [restriction map view] for cloning the L-arginase enzyme. Using Clustal Omega software,
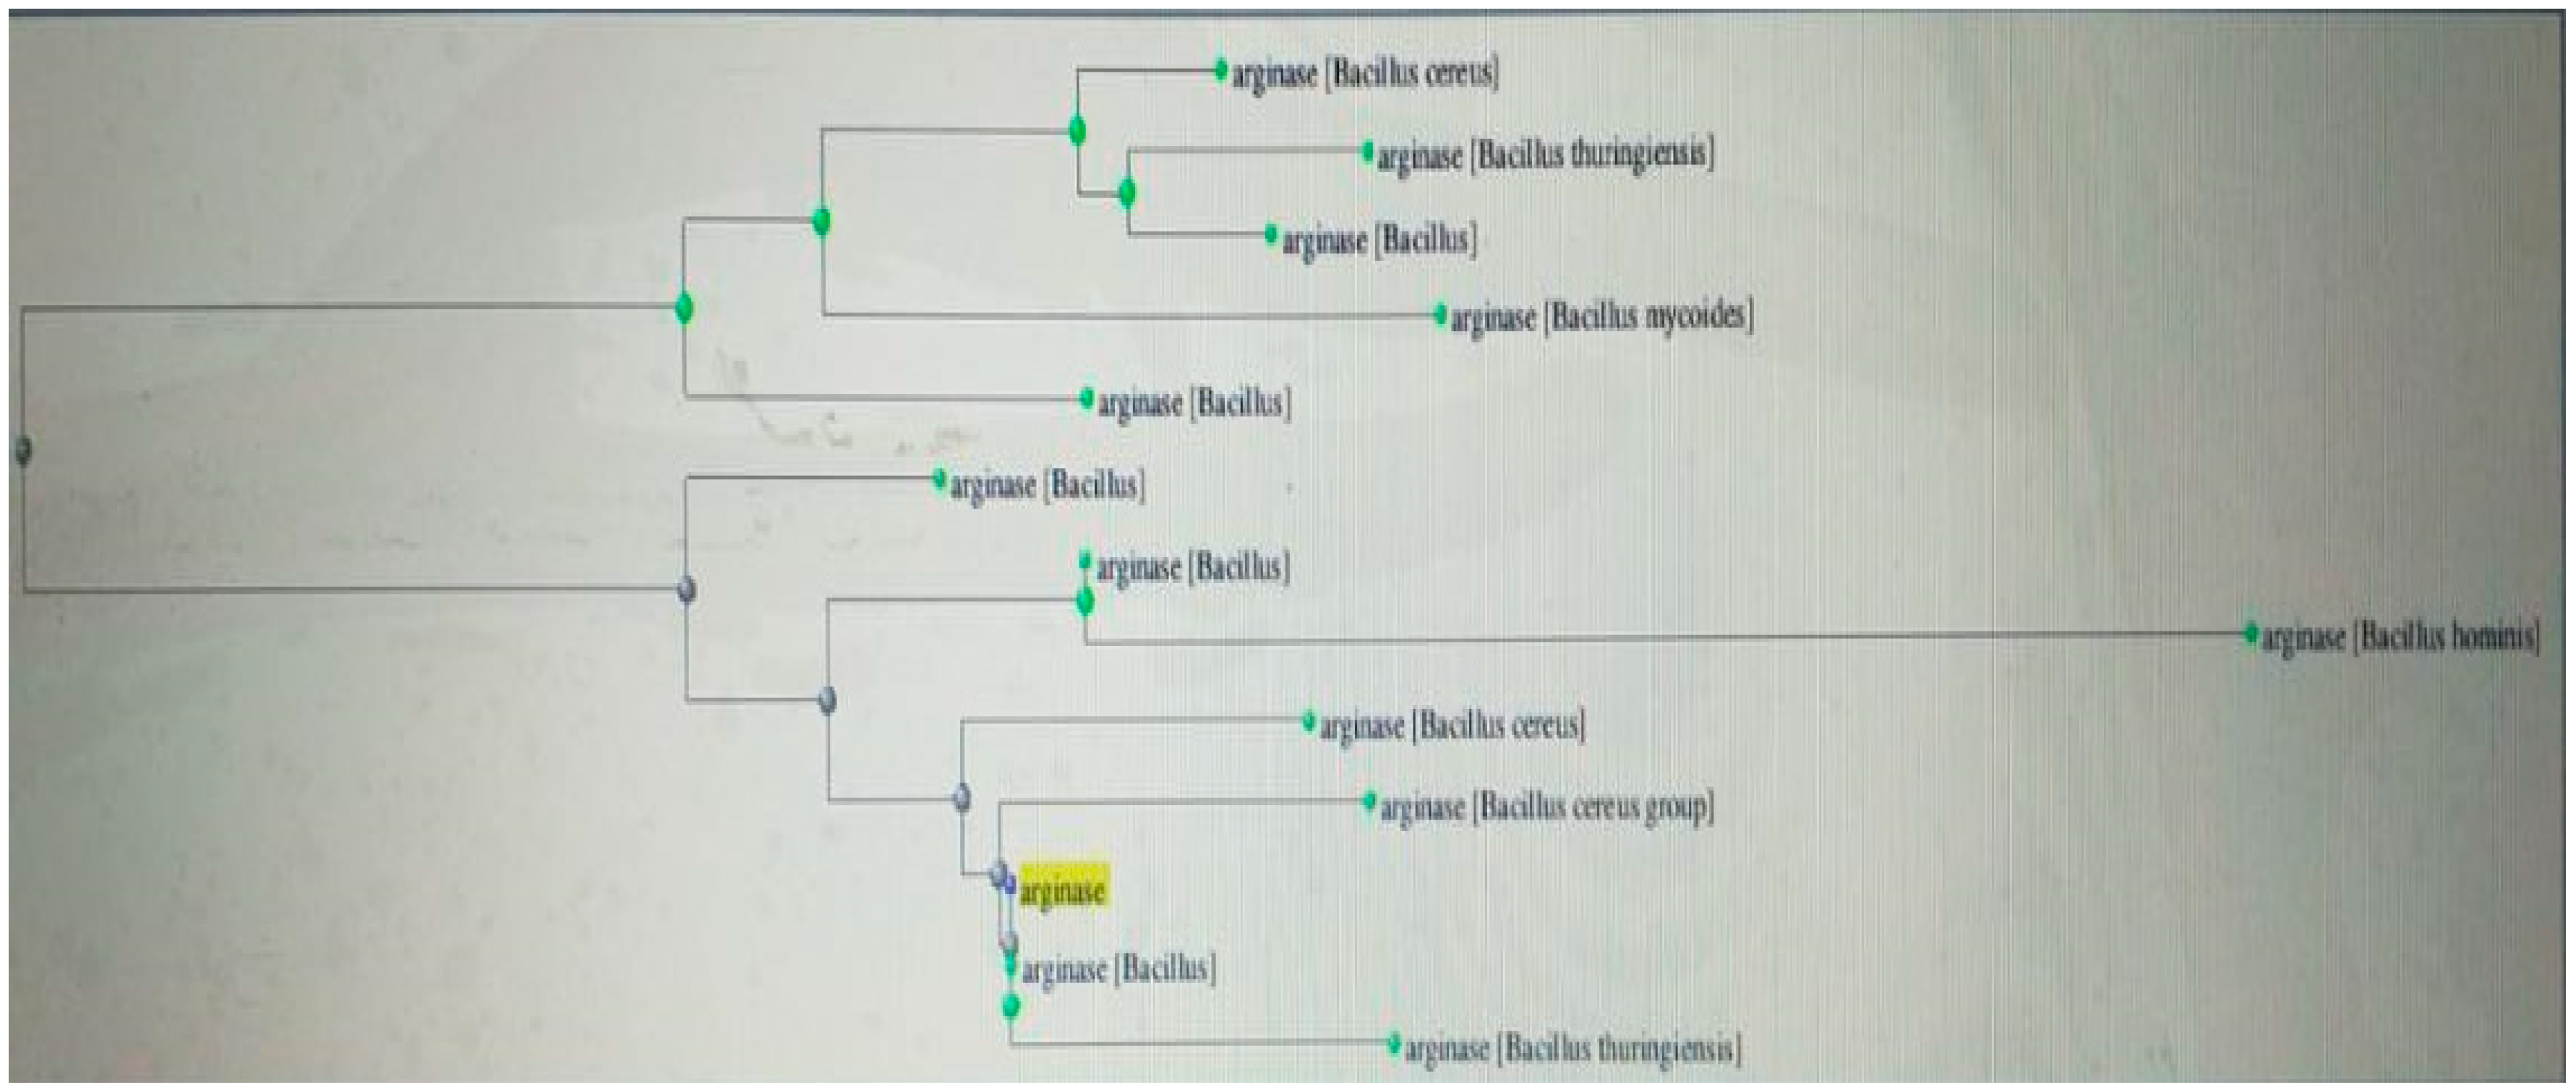
Figure 6 displays the evolutionary tree of L-arginase. Caspase 3 activity seen in
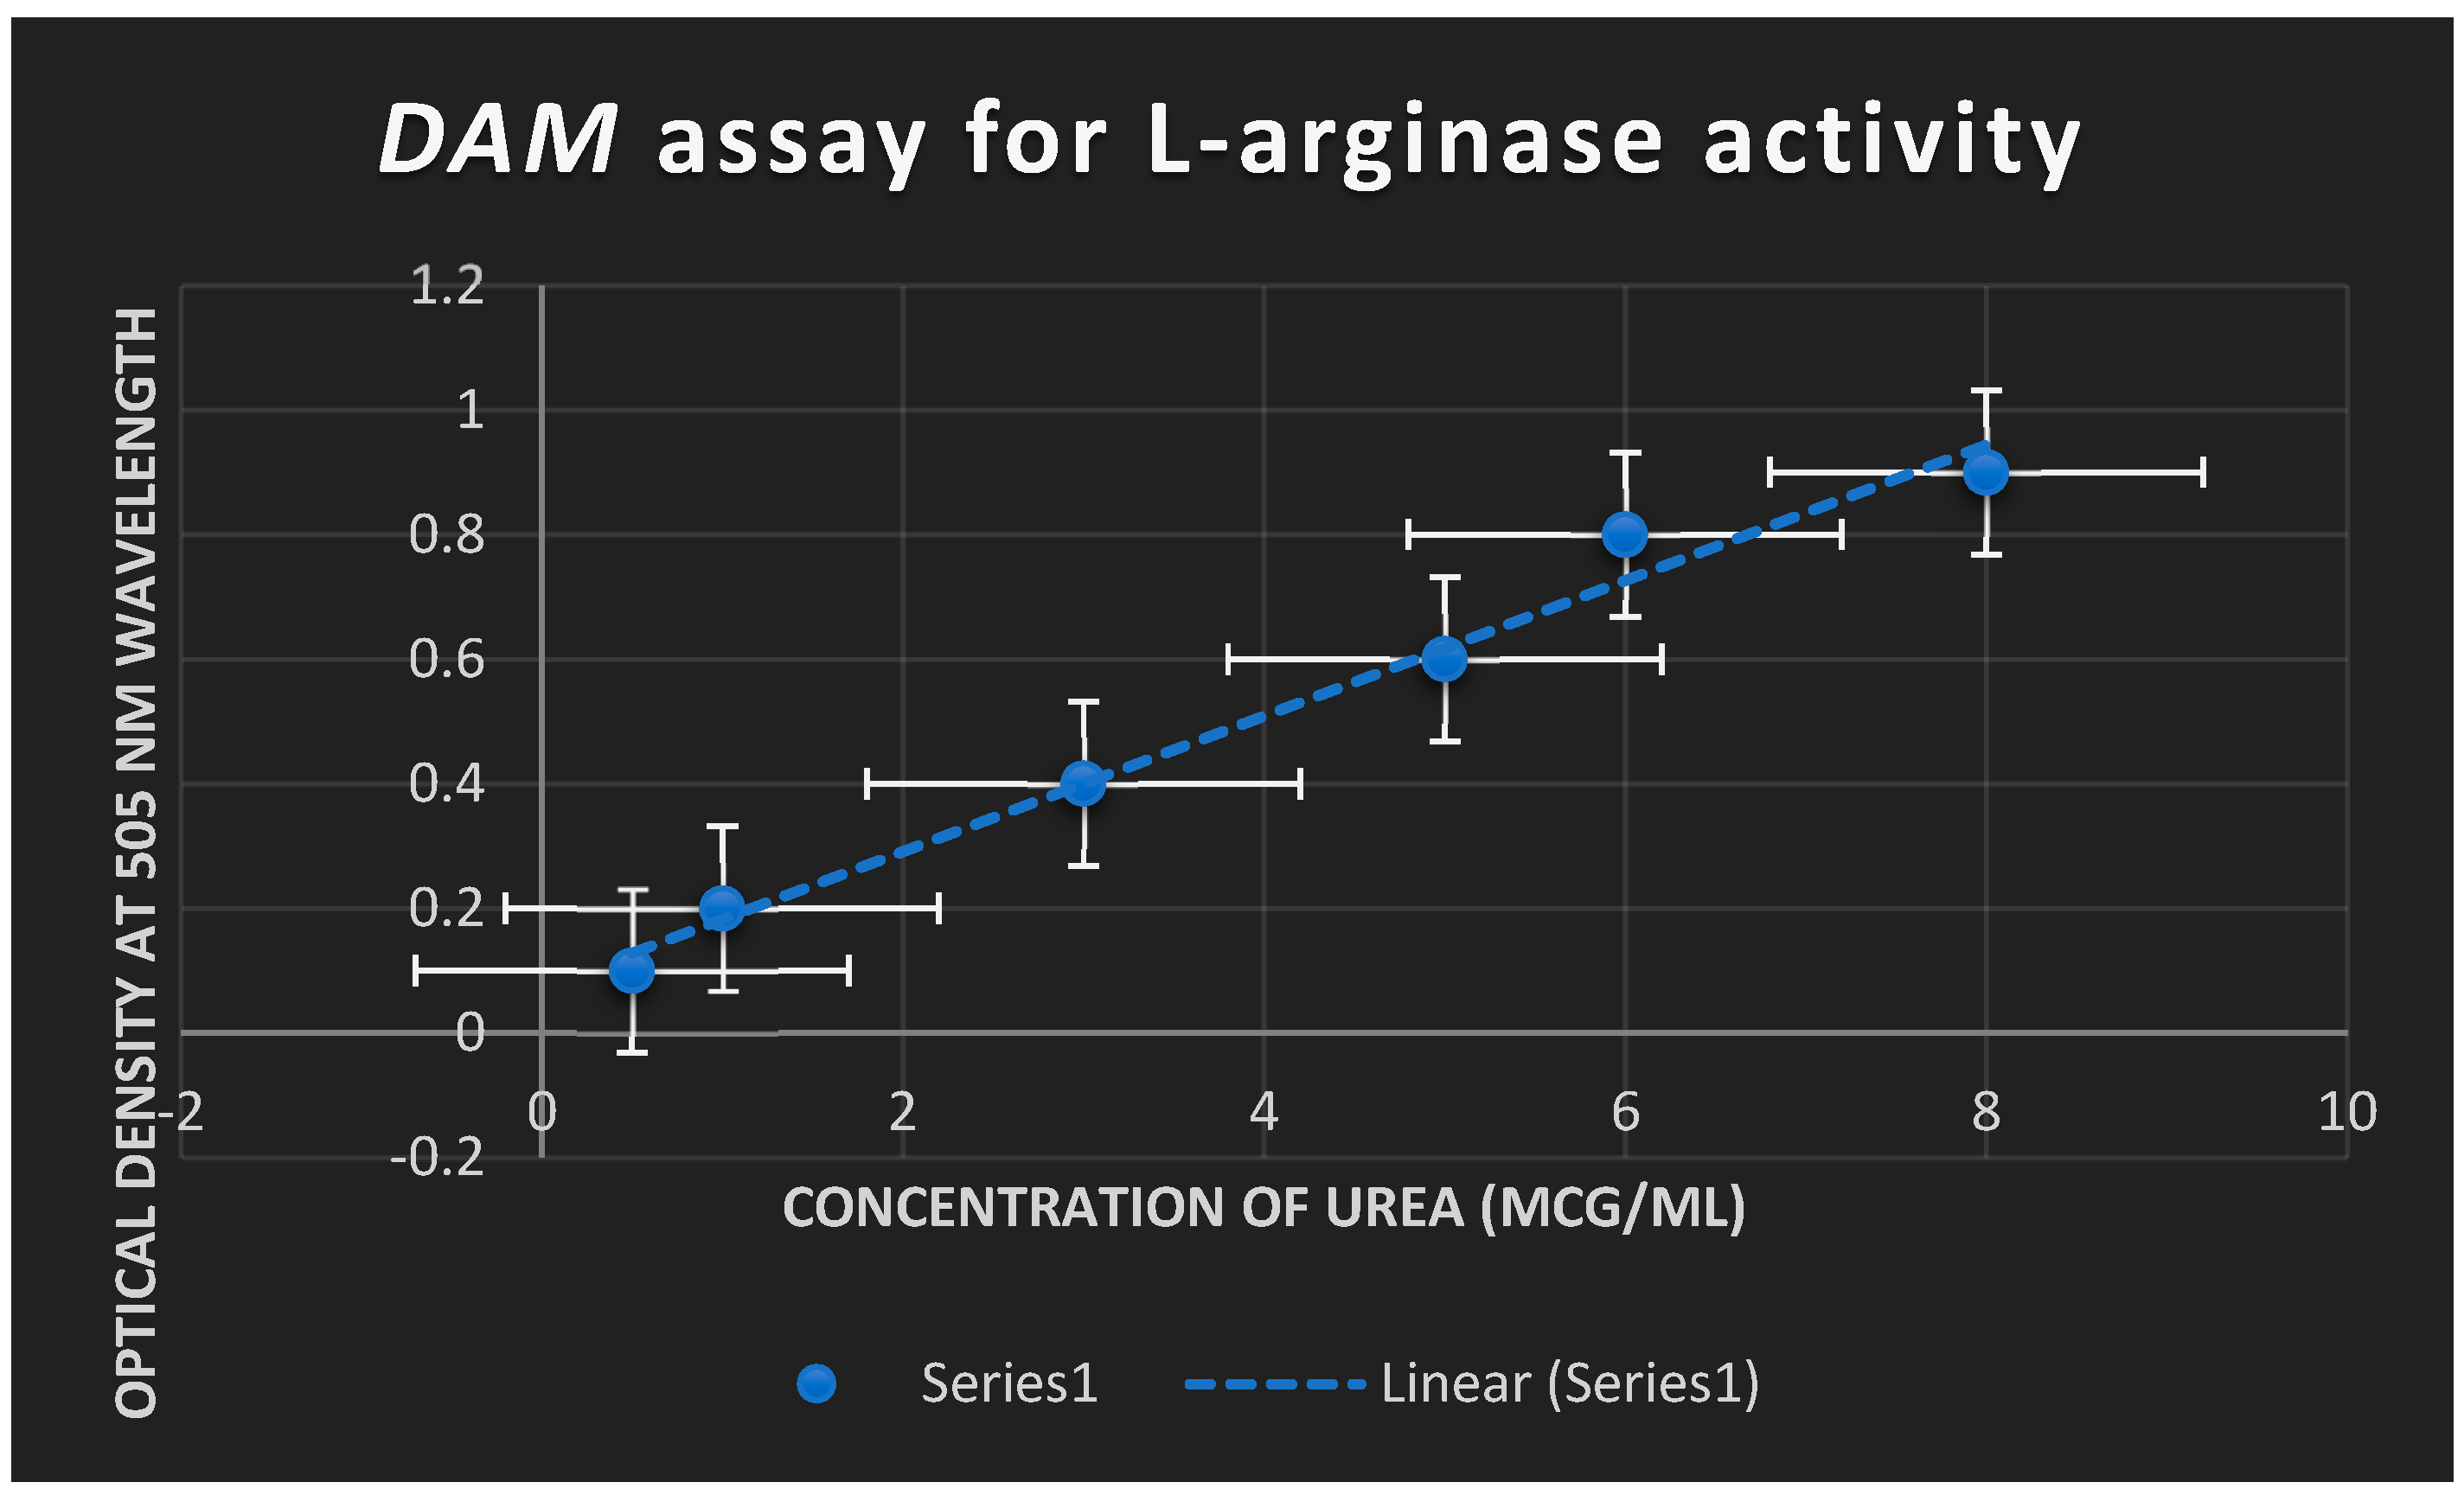
Figure 9 shows that L-arginase induced apoptosis. At 505 nm,
Figure 8 shows the optical density of L-arginase activity. As urea content rose as a result of L-arginine being broken down by L-arginase, absorbance rose as well.
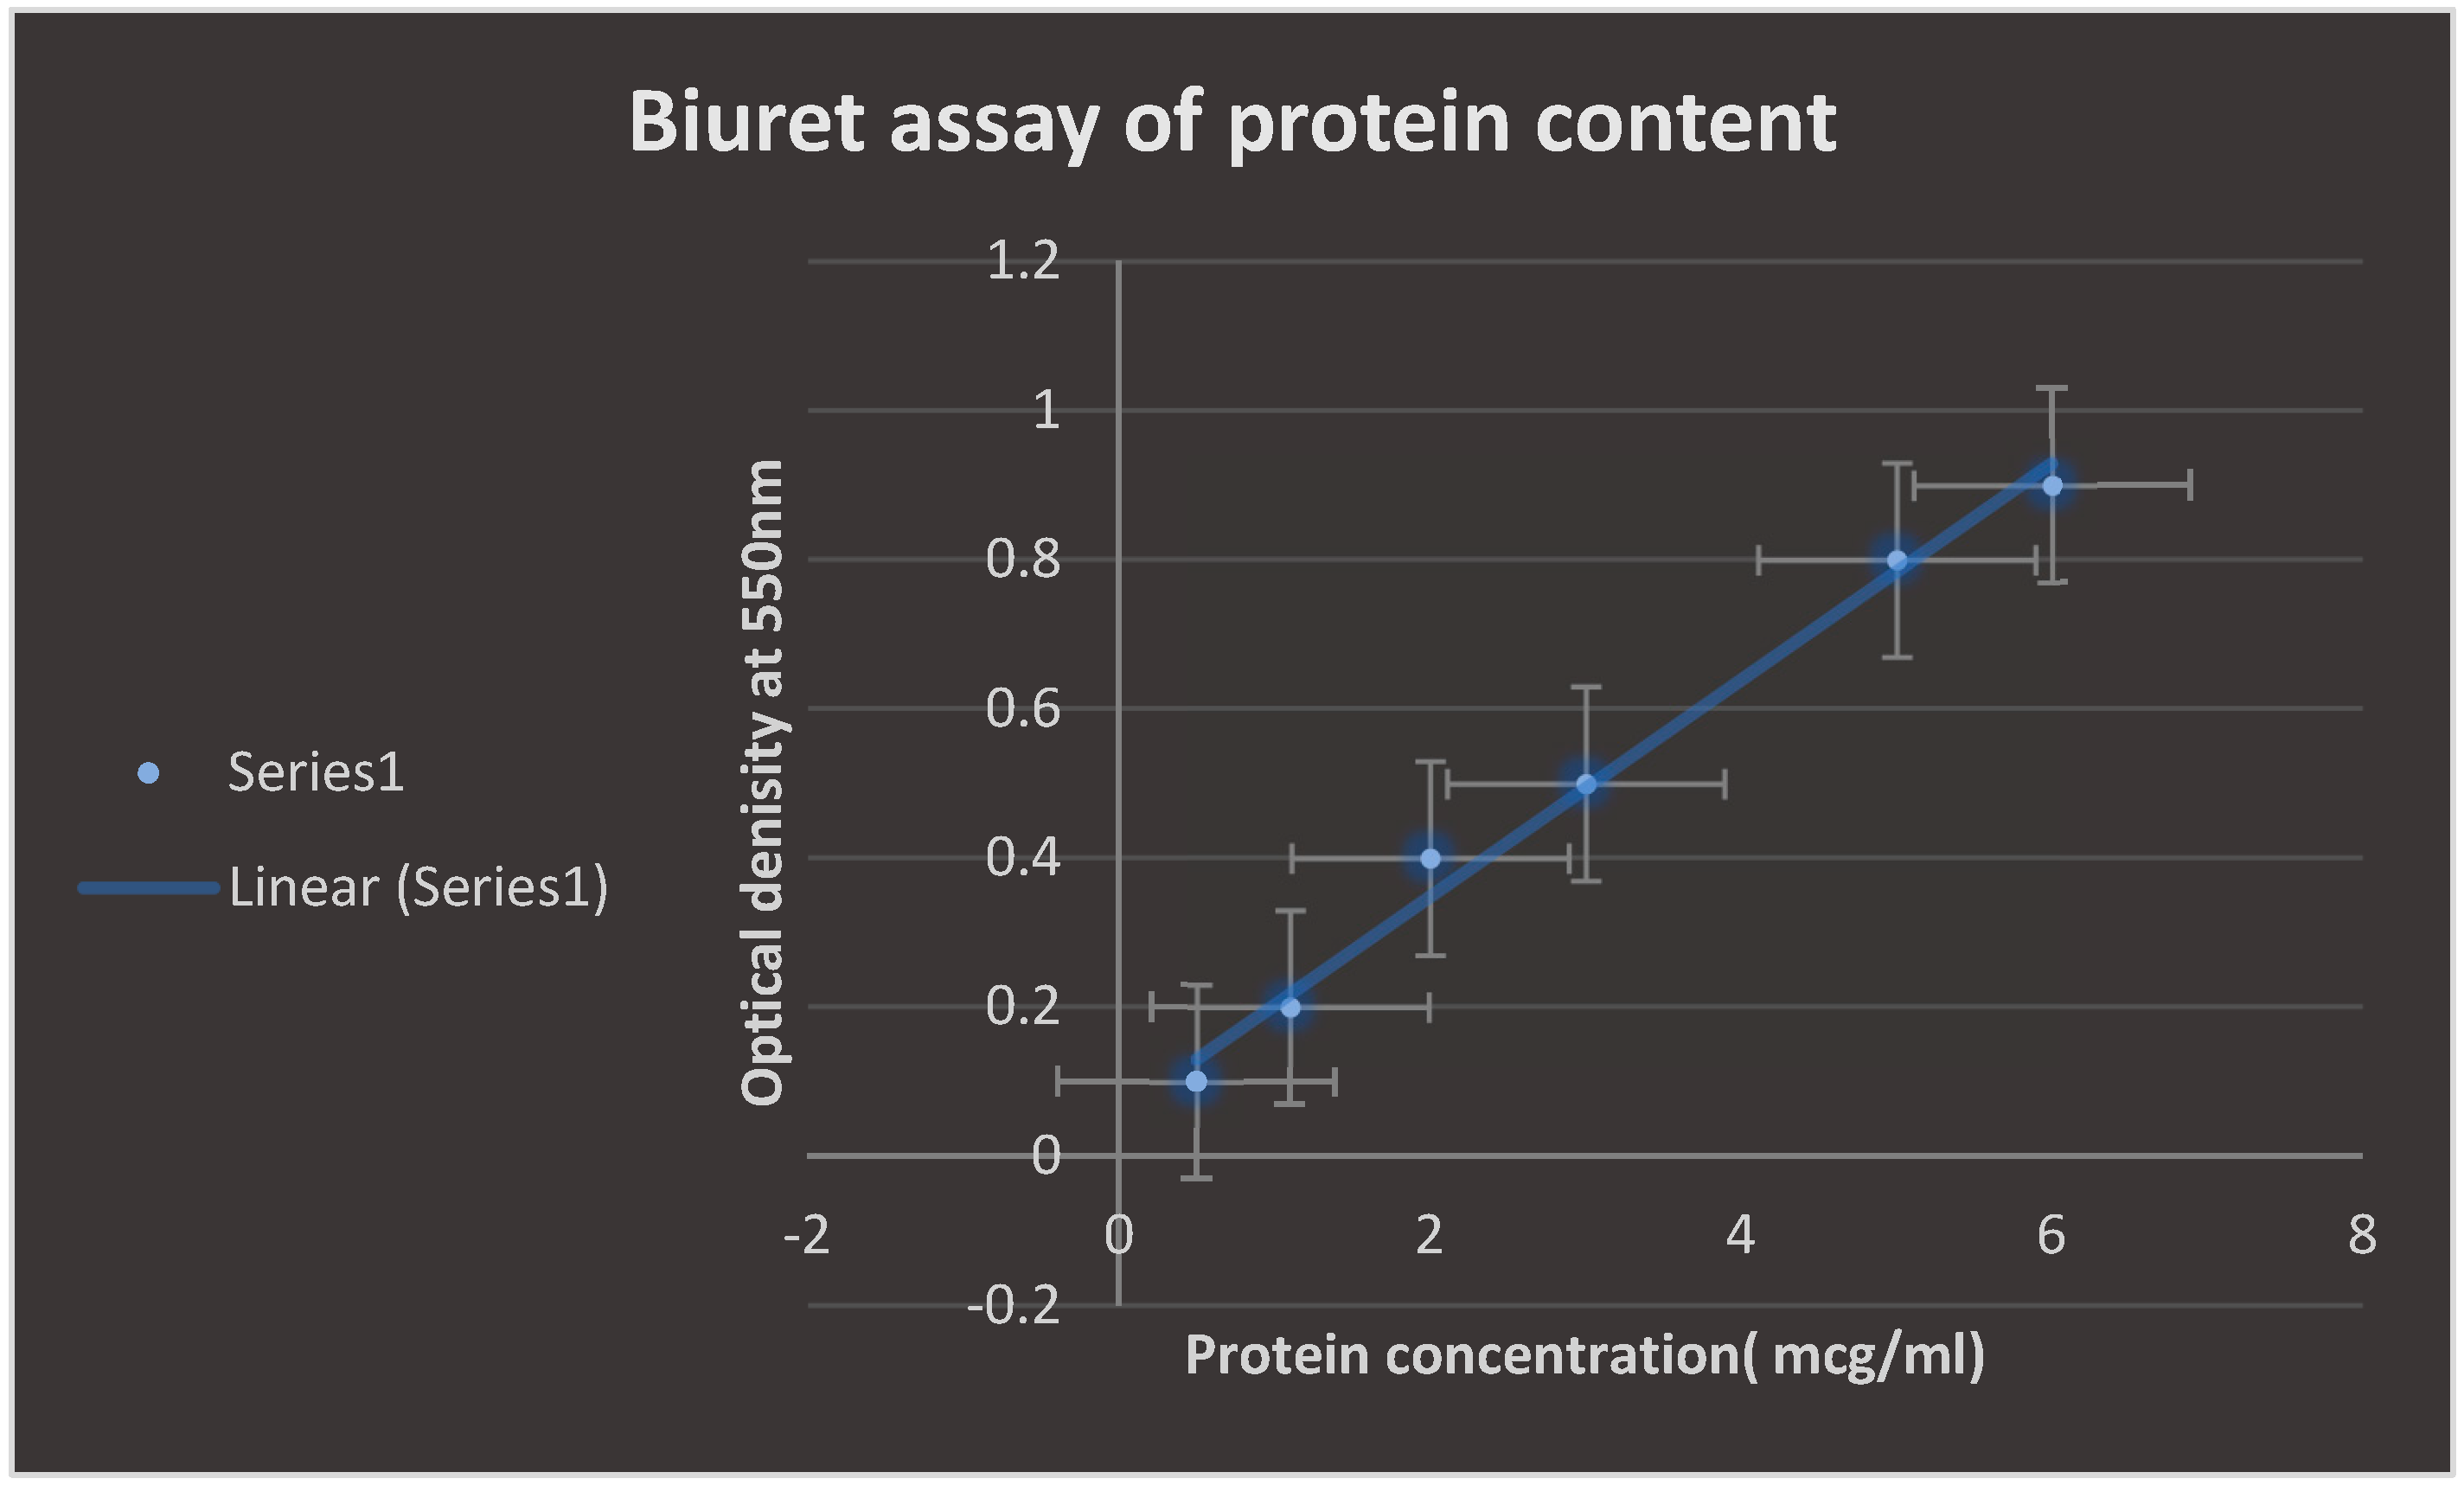
The Biuret test for determining protein concentration is validated in
Figure 7. It was discovered that when the protein level increased, absorbance increased proportionately.
Table 5 displays the morphological characteristics and biochemical response profile of the powerful bacterial isolates that produce L-arginase.
Table 4 displays the percentages of cell viability and proliferation following treatment with 10 µg L-arginase of several cancer cell lines. The physiological and environmental variables influencing L-arginase activity and productivity are determined in
Table 2.
Table 3 shows the molecular homology of L-arginase as determined by the BLASTn program and 16S rRNA sequencing method.
The study’s sample size limitations and funding constraints were its main drawbacks.
Figure 1.
shows Gram staining of Bacillus cereus DSM 360 isolates producing L-arginase enzyme under the normal light microscope.
Figure 1.
shows Gram staining of Bacillus cereus DSM 360 isolates producing L-arginase enzyme under the normal light microscope.
Figure 2.
demonstrates the PCR cloning of gene encoding L-arginase.
Figure 2.
demonstrates the PCR cloning of gene encoding L-arginase.
Figure 3.
generated using SWISS-MODEL software demonstrates 3D structure of L-arginase of Bacillus cereus DSM 360. L-arginase consisted largely of spiral alpha helices which was detected to be responsible for its biological activity as anticancer agent.
Figure 3.
generated using SWISS-MODEL software demonstrates 3D structure of L-arginase of Bacillus cereus DSM 360. L-arginase consisted largely of spiral alpha helices which was detected to be responsible for its biological activity as anticancer agent.
Figure 4.
generated using NEBcutter™ v3.0 software Displays the detection of suitable restriction endonuclease type II [restriction map view] for cloning of L-arginase enzyme.
Figure 4.
generated using NEBcutter™ v3.0 software Displays the detection of suitable restriction endonuclease type II [restriction map view] for cloning of L-arginase enzyme.
Figure 5.
shows the docking of L-arginase with Ni+2 ligand using CB-DOCK2 software. The standard Gibbs free energy change (∆G) for the reaction was approximately -2.8 J/mol which indicates the presence of a strong affinity between L-arginase and Ni+2 metal ion.
Figure 5.
shows the docking of L-arginase with Ni+2 ligand using CB-DOCK2 software. The standard Gibbs free energy change (∆G) for the reaction was approximately -2.8 J/mol which indicates the presence of a strong affinity between L-arginase and Ni+2 metal ion.
Figure 6.
expatiates phylogenetic tree of L-arginase producing bacterial isolates generated using Blastn and Clustal omega softwares.
Figure 6.
expatiates phylogenetic tree of L-arginase producing bacterial isolates generated using Blastn and Clustal omega softwares.
Figure 7.
confirms Biuret assay for the determination of protein content. Absorbance was found to increase proportionally with increasing the protein content.
Figure 7.
confirms Biuret assay for the determination of protein content. Absorbance was found to increase proportionally with increasing the protein content.
Figure 8.
establishes the optical density of L-arginase activity at 505 nm. Absorbance was increased with increasing the urea concentration liberated due to the degradation of L-arginine by L-arginase.
Figure 8.
establishes the optical density of L-arginase activity at 505 nm. Absorbance was increased with increasing the urea concentration liberated due to the degradation of L-arginine by L-arginase.
Figure 9.
indicates L-arginase elicited apoptosis through the spotting of Caspase 3 activity.
Figure 9.
indicates L-arginase elicited apoptosis through the spotting of Caspase 3 activity.
Conclusions
Because of the development of a novel L-arginase enzyme derived from Bacillus cereus strain DSM 360, which was isolated from several soil habitats in Egypt, the current study was able to offer a promising methodology. It is advised that randomized human clinical studies and preclinical experiments be taken into consideration in the future.
Ethical statement: All applicable national, international, and/or institutional criteria for the care and use of animals were preceded in the current investigation. The local authorities, Cairo University’s faculty of pharmacy, and the Ethical Committee for Animal Handling at Cairo University (ECAHCU) approved all study procedures, including the use of animals, in accordance with the recommendations of the Weatherall Report (approval number PLf184/2023). Every attempt was made to minimize the number of animals used in the study as well as their suffering.
Publication consent
Not applicable.
Authors Contributions
The present study was completely achieved via the single author Dr. Mohammed Kassab, Faculty of Pharmacy, Cairo University, Egypt.
Funding
No funding was obtained.
Data Availability Statement
The datasets generated and/or analyzed during the current study are available in the Gen-bank repository, [accession numbers: PP946256].
Acknowledgments
The faculty of Pharmacy, Cairo University, Egypt are acknowledged for their support of the present study.
Conflicts of Interest
There is no conflict of interest.
Abbreviations
IM: Intramuscular, IV: Intravenous SC: Subcutaneous, IP: Intraperitoneal, Cmax: Maximum concentration, Tmax: Maximum time, t1/2: biological half life time of the drug. SDS-PAGE: Sodium dodecyl sulfate polyacrylamide gel electrophoresis, CL: Clearance. Vd: Volume of distribution.
References
- Riess, C.; Shokraie, F.; Classen, C.F.; Kreikemeyer, B.; Fiedler, T.; Junghanss, C.; Maletzki, C. Arginine-Depleting Enzymes – An Increasingly Recognized Treatment Strategy for Therapy-Refractory Malignancies. Cell. Physiol. Biochem. 2018, 51, 854–870. [Google Scholar] [CrossRef] [PubMed]
- Ebrahimi, N.; Gharibi, S.; Ghoshoon, M.B.; Karimi, Z.; Gholami, A.; Nezafat, N.; Mohkam, M.; Ghasemi, Y. Selective Isolation and Identification of Arginine Degrading Bacteria; the Optimized Arginine Deaminase Production by Enterobacter sp. sgn1 as a New Source of This Potentially Anti-Tumor Enzyme. J. Appl. Pharm. Sci. 2016, 6, 093–101. [Google Scholar] [CrossRef]
- Al-Koussa, H.; El Mais, N.; Maalouf, H.; Abi-Habib, R.; El-Sibai, M. Arginine deprivation: a potential therapeutic for cancer cell metastasis? A review. Cancer Cell Int. 2020, 20, 1–7. [Google Scholar] [CrossRef] [PubMed]
- Grzywa, T.M.; Sosnowska, A.; Matryba, P.; Rydzynska, Z.; Jasinski, M.; Nowis, D.; Golab, J. Myeloid Cell-Derived Arginase in Cancer Immune Response. Front. Immunol. 2020, 11, 938. [Google Scholar] [CrossRef] [PubMed]
- Raber, P.; Ochoa, A.C.; Rodríguez, P.C. Metabolism of L-arginine by myeloid-derived suppressor cells in cancer: Mechanisms of T cell suppression and therapeutic perspectives. Immunol. Investig. 2012, 41, 614–634. [Google Scholar] [CrossRef] [PubMed]
- El-Sayed, A.S.; Shindia, A.A.; Diab, A.A.; Rady, A.M. Purification and immobilization of l-arginase from thermotolerant Penicillium chrysogenum KJ185377.1; with unique kinetic properties as thermostable anticancer enzyme. Arch. Pharmacal Res. [CrossRef]
- Zhang, X.; Liu, J.; Yu, X.; Wang, F.; Yi, L.; Li, Z.; Liu, Y.; Ma, L. High-level expression of human arginase I in Pichia pastoris and its immobilization on chitosan to produce L-ornithine. BMC Biotechnol. 2015, 15, 66. [Google Scholar] [CrossRef] [PubMed]
- Li, M.; Qin, J.; Xiong, K.; Jiang, B.; Zhang, T. Review of arginase as a promising biocatalyst: characteristics, preparation, applications and future challenges. Crit. Rev. Biotechnol. 2021, 42, 651–667. [Google Scholar] [CrossRef] [PubMed]
- Quintero, M.J.; Muro-Pastor, A.M.; Herrero, A.; Flores, E. Arginine Catabolism in the Cyanobacterium Synechocystis sp. Strain PCC 6803 Involves the Urea Cycle and Arginase Pathway. J. Bacteriol. 2000, 182, 1008–1015. [Google Scholar] [CrossRef] [PubMed]
- Feun, L.G.; Kuo, M.T.; Savaraj, N. Arginine deprivation in cancer therapy. Curr. Opin. Clin. Nutr. Metab. Care 2015, 18, 78–82. [Google Scholar] [CrossRef] [PubMed]
- Kuo, M.T.; Savaraj, N.; Feun, L.G. Targeted cellular metabolism for cancer chemotherapy with recombinant arginine-degrading enzymes. Oncotarget 2010, 1, 246–251. [Google Scholar] [CrossRef] [PubMed]
- Feun, L.; You, M.; Wu, C.J.; Kuo, M.T.; Wangpaichitr, M.; Spector, S.; Savaraj, N. Arginine Deprivation as a Targeted Therapy for Cancer. Curr. Pharm. Des. 2008, 14, 1049–1057. [Google Scholar] [CrossRef] [PubMed]
- Thongkum, A.; Wu, C.; Li, Y.-Y.; Wangpaichitr, M.; Navasumrit, P.; Parnlob, V.; Sricharunrat, T.; Bhudhisawasdi, V.; Ruchirawat, M.; Savaraj, N. The Combination of Arginine Deprivation and 5-Fluorouracil Improves Therapeutic Efficacy in Argininosuccinate Synthetase Negative Hepatocellular Carcinoma. Int. J. Mol. Sci. 2017, 18, 1175. [Google Scholar] [CrossRef] [PubMed]
- A McAlpine, J.; Lu, H.-T.; Wu, K.C.; Knowles, S.K.; A Thomson, J. Down-regulation of argininosuccinate synthetase is associated with cisplatin resistance in hepatocellular carcinoma cell lines: implications for PEGylated arginine deiminase combination therapy. BMC Cancer 2014, 14, 1–12. [Google Scholar] [CrossRef] [PubMed]
- Fernandes, H.S.; Teixeira, C.S.S.; Fernandes, P.A.; Ramos, M.J.; Cerqueira, N.M.F.S.A. Amino acid deprivation using enzymes as a targeted therapy for cancer and viral infections. Expert Opin. Ther. Patents 2016, 27, 283–297. [Google Scholar] [CrossRef] [PubMed]
- De Santo, C.; Booth, S.; Vardon, A.; Cousins, A.; Tubb, V.; Perry, T.; Noyvert, B.; Beggs, A.; Ng, M.; Halsey, C.; et al. The arginine metabolome in acute lymphoblastic leukemia can be targeted by the pegylated-recombinant arginase I BCT-100. Int. J. Cancer 2017, 142, 1490–1502. [Google Scholar] [CrossRef] [PubMed]
- Langenfeld, N.J.; Payne, L.E.; Bugbee, B. Colorimetric determination of urea using diacetyl monoxime with strong acids. PLOS ONE 2021, 16, e0259760. [Google Scholar] [CrossRef] [PubMed]
- Kim, S.R.; Tone, A.; Kim, R.H.; Cesari, M.; Clarke, B.A.; Eiriksson, L.; Hart, T.L.; Aronson, M.; Holter, S.; Lytwyn, A.; et al. Maximizing cancer prevention through genetic navigation for Lynch syndrome detection in women with newly diagnosed endometrial and nonserous/nonmucinous epithelial ovarian cancer. Cancer 2021, 127, 3082–3091. [Google Scholar] [CrossRef] [PubMed]
- Jørgensen, M.A.; Ugel, S.; Hübbe, M.L.; Carretta, M.; Perez-Penco, M.; Weis-Banke, S.E.; Martinenaite, E.; Kopp, K.; Chapellier, M.; Adamo, A.; et al. Arginase 1–Based Immune Modulatory Vaccines Induce Anticancer Immunity and Synergize with Anti–PD-1 Checkpoint Blockade. Cancer Immunol. Res. 2021, 9, 1316–1326. [Google Scholar] [CrossRef] [PubMed]
- Nadaf, P.D.; Kulkarni, A.G.; Vedamurthy, A.B. Isolation, screening and characterization of L-arginase producing soil bacteria. Int. J. Pharm. Sci. Res. 2019, 10, 3440–44. [Google Scholar]
|
Disclaimer/Publisher’s Note: The statements, opinions and data contained in all publications are solely those of the individual author(s) and contributor(s) and not of MDPI and/or the editor(s). MDPI and/or the editor(s) disclaim responsibility for any injury to people or property resulting from any ideas, methods, instructions or products referred to in the content. |
© 2024 by the authors. Licensee MDPI, Basel, Switzerland. This article is an open access article distributed under the terms and conditions of the Creative Commons Attribution (CC BY) license (https://creativecommons.org/licenses/by/4.0/).
