1. Introduction
The electrical industry is evolving rapidly, which creates more opportunities and requires empirical research like forecasting. Numerous novel techniques and areas of application have emerged in recent years. The fragmented scientific work must be merged and structured as research expands and becomes more specialized and diverse. It is critical to balance the production and consumption of electricity. Its implementation primarily depends on the strategies and tactics used to plan electricity production. Since having an accurate prediction increases the validity of management decisions, forecasting is essentially one of the planning instruments. Probabilistic and contemporary forecasting techniques employ classical and deep machine learning algorithms, rank analysis methodology, fuzzy set theory, singular spectral analysis, wavelet transformations, gray models, and other techniques. Classical forecasting techniques are grounded in the theory of regression and statistical analysis (regression, autoregressive models).
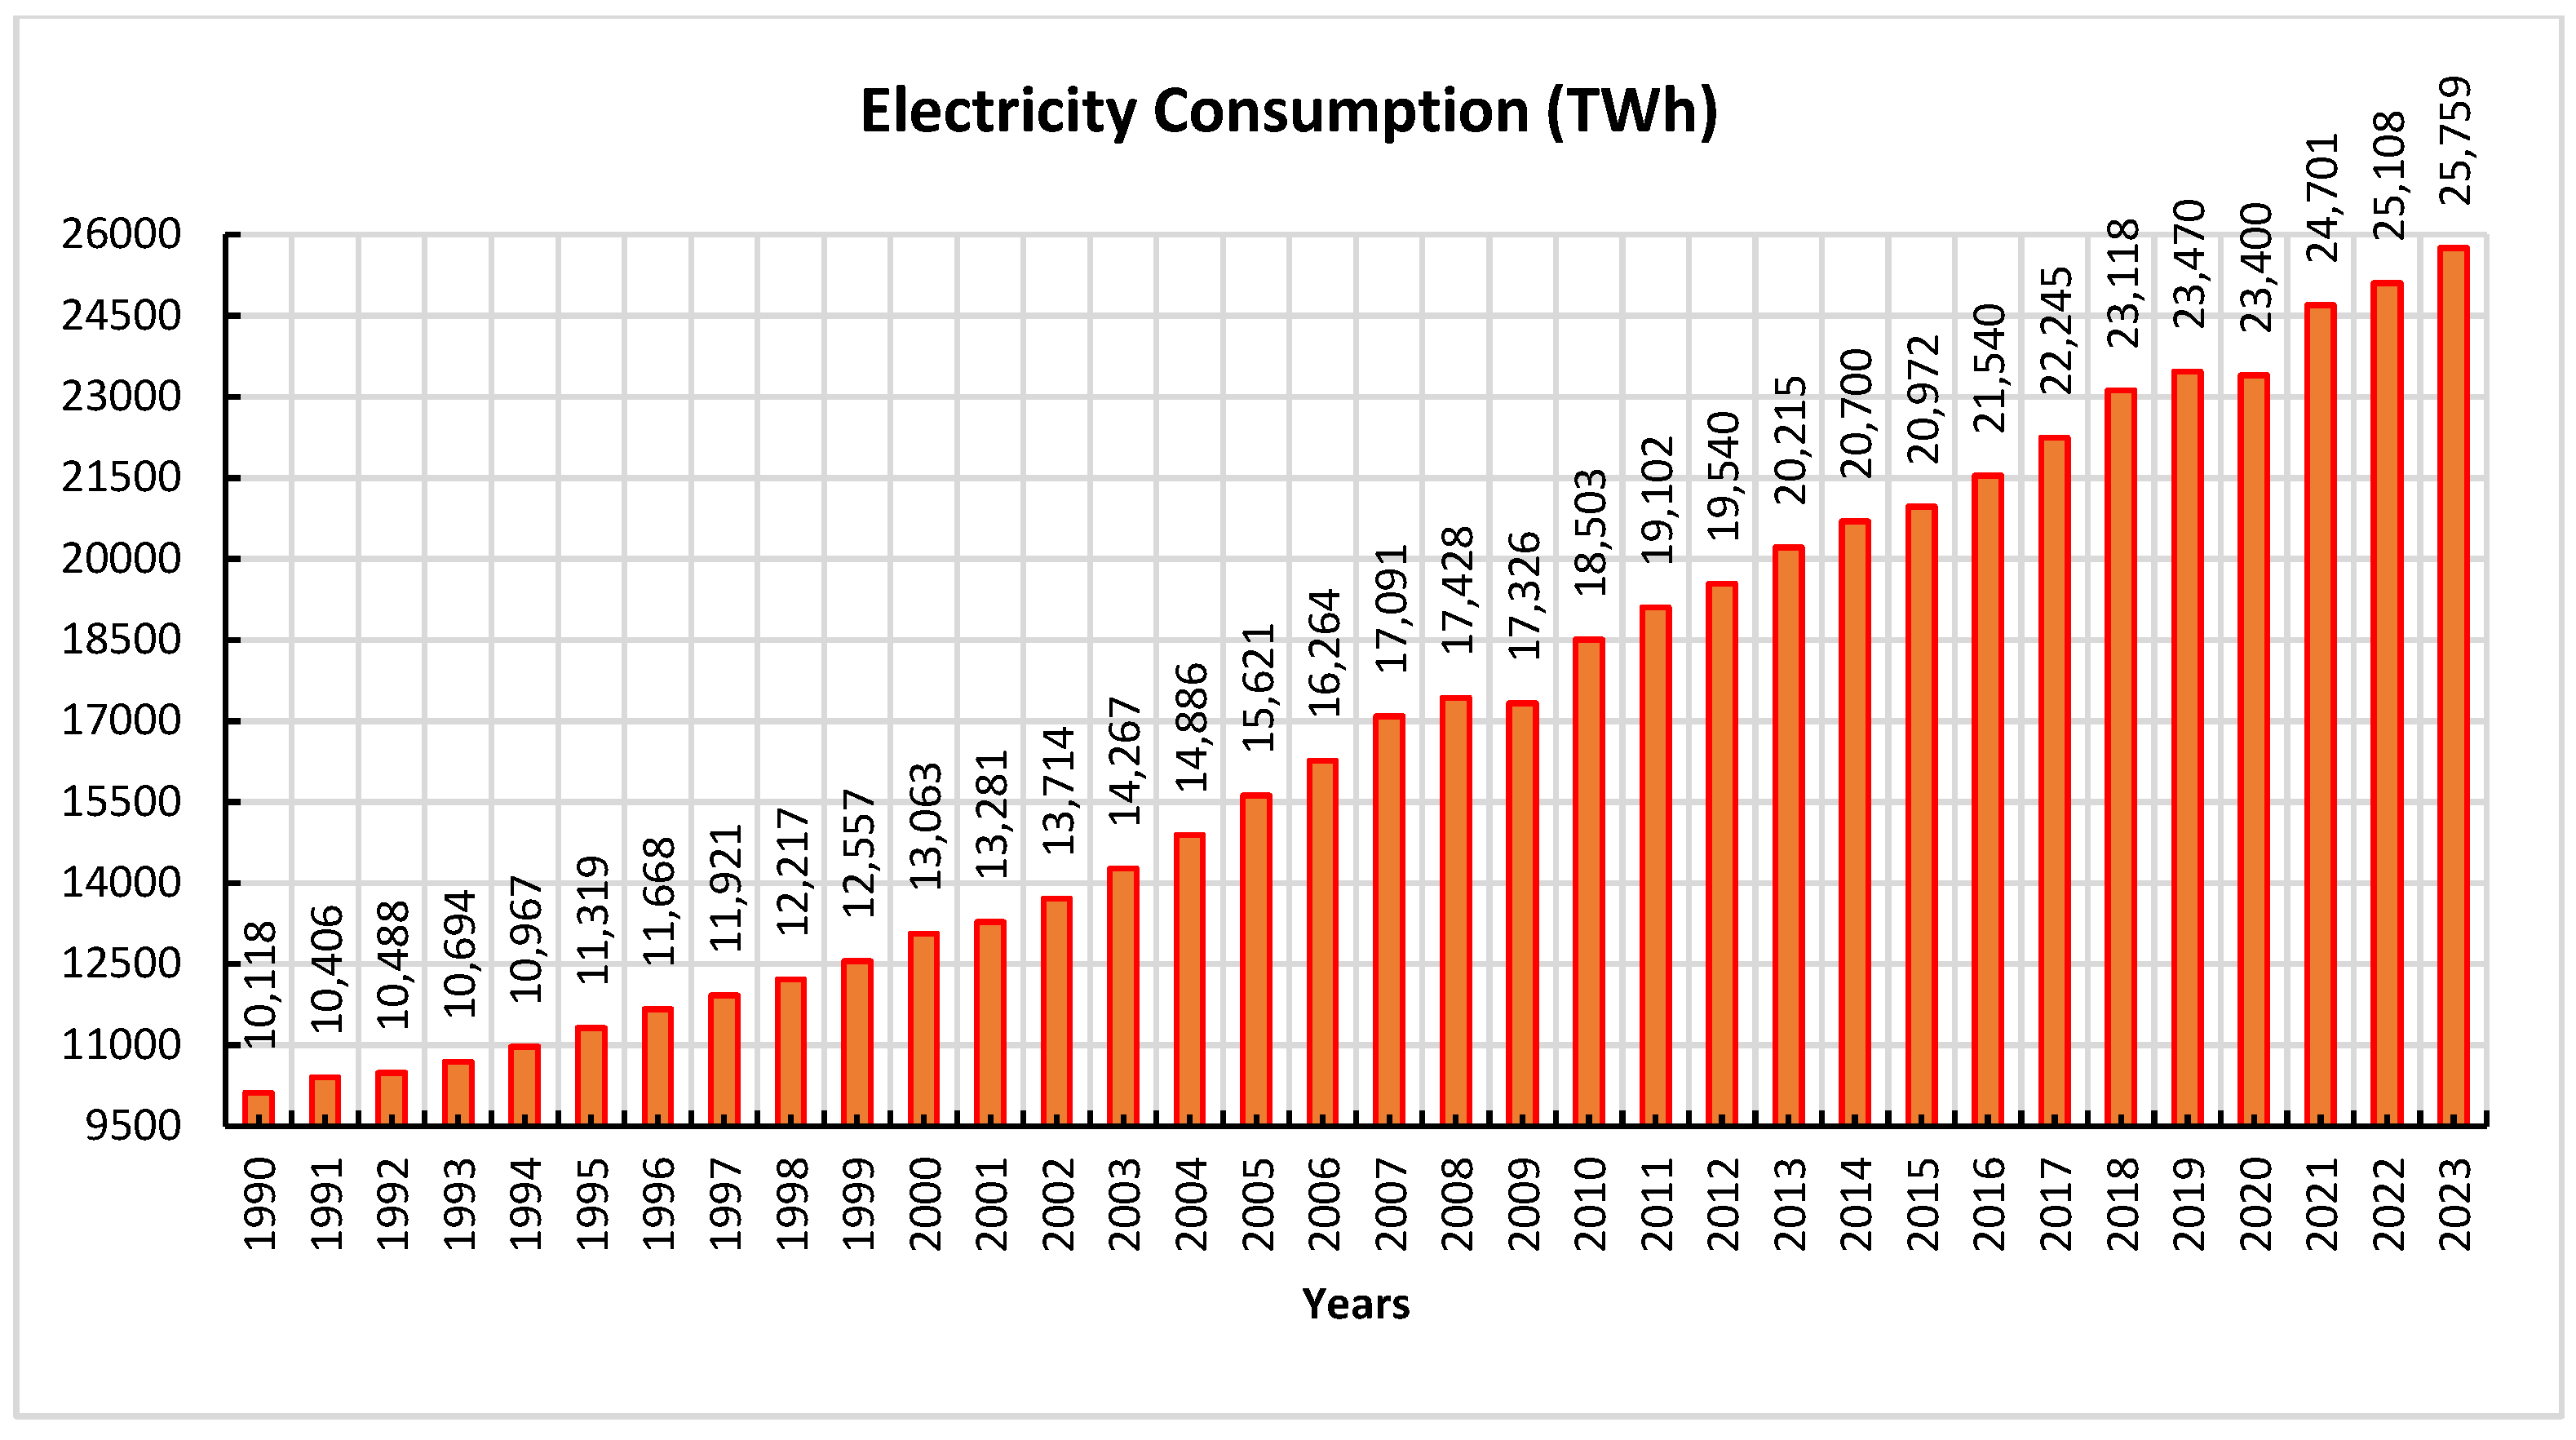
For over 33 years, the global patterns of electricity consumption growth have been sustained (
Figure 1). Since electricity is a vital resource in the current stage of human development and is necessary for household and professional activities, there are no requirements for cutting back on energy consumption in the future. Enerdata, a global energy and climate portal, reports statistics for 2024 that show that, at 25,759 TWh, electricity consumption in 2023 was 10.08% and 9.75% higher than in 2020 and 2019, respectively. Data on the electrification of final consumption worldwide also supports the increase in electricity consumption. The global electrification trend is still increasing; in 2023, the indicator increased by 31.21% from 2010 to 2023 [
1].
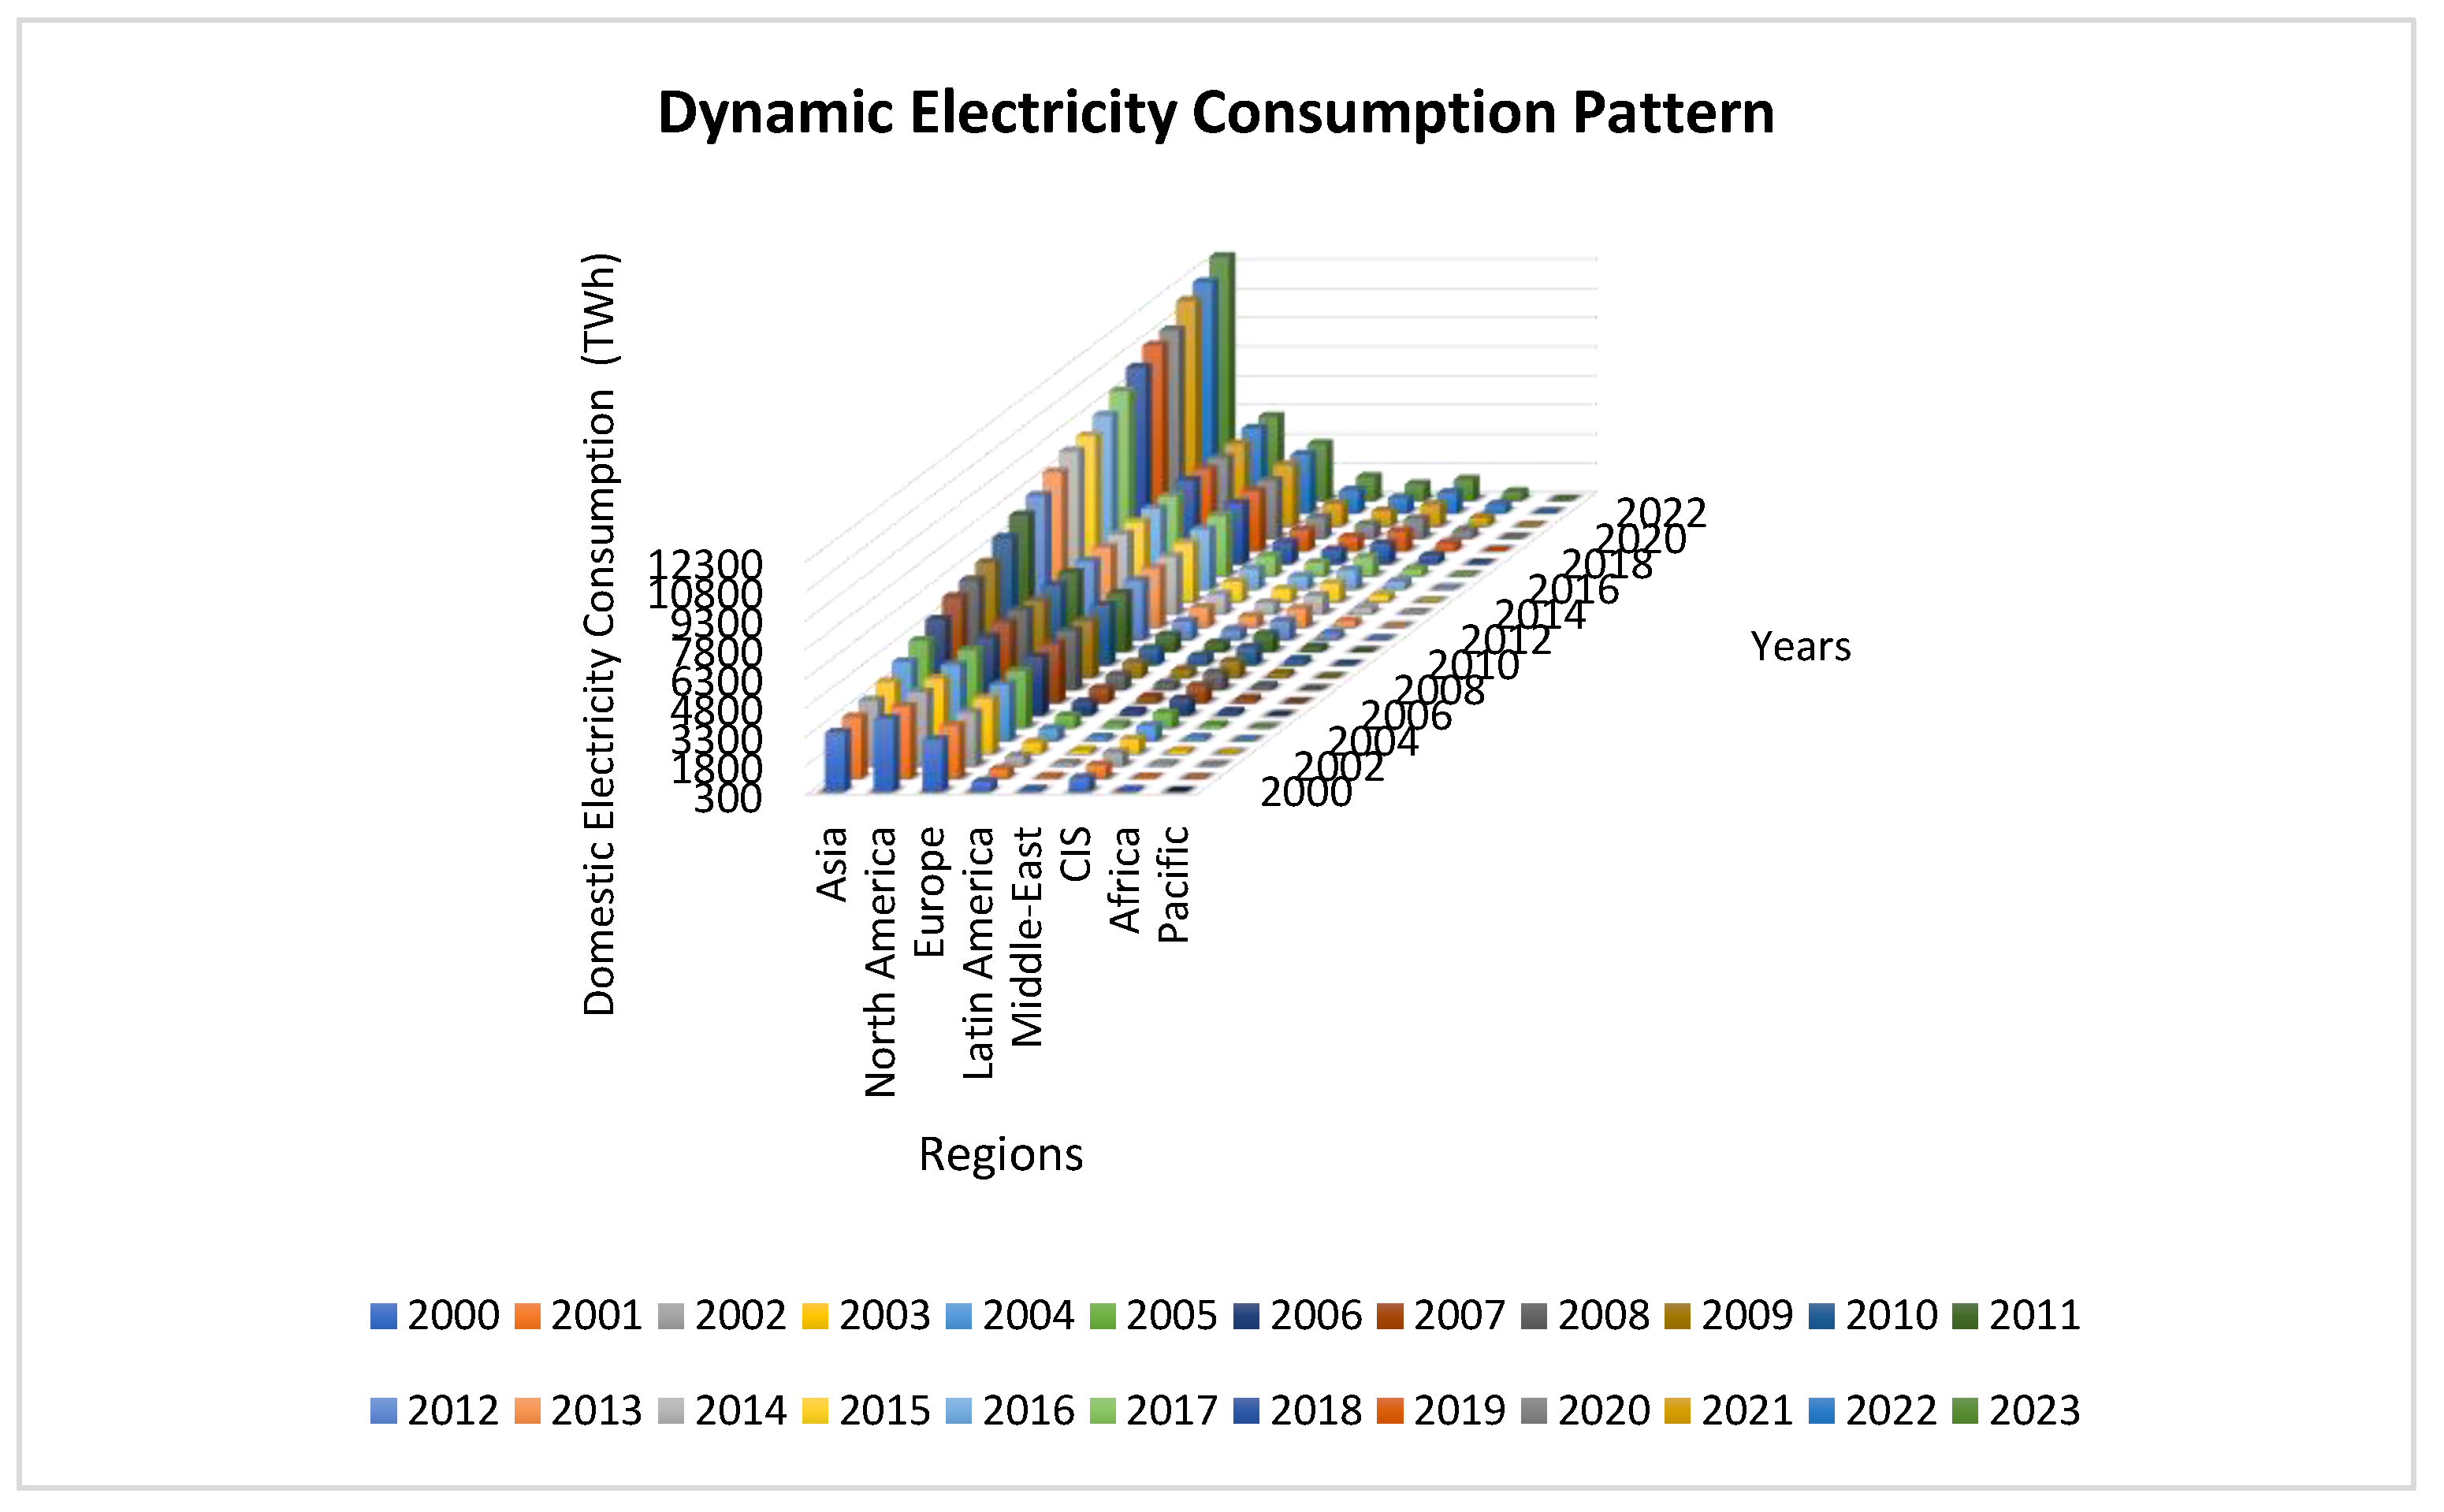
As per the global energy and climate data provided by Enerdata, Asia has the highest growth rate of electricity consumption from 2000 to 2023, with a rate of 286.09%. Comparably, for the Middle East, Africa, Latin America, CIS, Pacific, North America, and Europe throughout this time, the growth rates for electricity are 199.01%, 103.75%, 91.31%, 39.26, 33.39%, 14.32%, and 9.18%, respectively. However, if we look at the data on the top 10 countries' electricity consumption in 2023, we can see that China consumed the most, with 8391.78 TWh. The USA, India, Brazil, Canada, South Korea, Germany, and France were the next countries with higher electricity consumption, followed by the USA (4065.29 TWh), India (1406.66 TWh), Russia (996.59 TWh), Japan (908.65 TWh), Brazil (594.30 TWh), Canada (557.56TWh), South Korea (557.56TWh), Germany (557.56TWh), France (557.56TWh).
Figure 2 displays the dynamic pattern of power use in the eight regions from 2010 to 2023.
There is a plethora of research on electricity consumption/load/demand forecasting based on geographical regions, time span, nature of data sets, and methodology.
Quantitative methods in electricity consumption forecasting encompass a variety of statistical, econometric, and machine learning techniques, each tailored to address specific forecasting horizons and accuracy requirements. Traditional methods such as regression analysis, autoregressive models, and time series analysis have been foundational in this field, providing a basis for understanding consumption patterns and trends. Many researchers have compared different techniques for forecasting electricity consumption. In this context, studies have compared several methods based on quantitative methods, including time series econometrics, machine learning, deep learning, hybrid models, and optimized models, e.g., [
2,
3,
4,
5,
6,
7,
8,
9,
10,
11,
12,
13,
14,
15,
16,
17,
18,
19,
20,
21,
22,
23,
24]. On the other hand, some studies focus on time horizons, e.g. [
25,
26,
27,
28,
29,
30,
31,
32,
33,
34,
35,
36,
37]. Some studies used univariate analysis and multivariate analysis for electricity consumption forecasting. The current study highlighted the most crucial literature review with respect to short-term, medium-term, and long-term forecasting. The study highlights the important quantitative methods and categorizes them into time series econometrics forecasting models, grey forecasting models, machine learning models, deep learning models, and hybrid models.
The study tries to reflect the forecasting accuracy by mentioning the accuracy metrics, e.g., Mean Absolute Error (MAE); Mean Squared Error (MSE); Root Mean Squared Error (RMSE); Mean Absolute Percentage Error (MAPE); R-squared (R2). Moreover, the study analyzed the network visualization map for authors concerning citations and published documents, coauthors association, organizations association, countries association, co-occurrence of Authors Keywords, documentation and citation to countries, publication sources, and bibliographic coupling for Authors and countries. Furthermore, the study highlighted the important visualized facts and figures by mentioning the total number of documents over time, average number of citations per year, ccountries' publication production over time, affiliations’ publication production over time, most relevant authors to publication, most relevant Source to publication; publication sources production over time; Word’s frequency over time; view of Author’s Local Impact by H index, and view of Country Collaboration Map.
Table 1 provides a comprehensive overview of the state of research in electricity consumption forecasting. It highlights the diversity of methodologies, the global relevance of the topic, and the importance of context-specific approaches.
The present work makes the following contributions to the literature on energy modeling:
This paper provides an extensive and in-depth evaluation of earlier cutting-edge research on electricity consumption forecasting, considering the methodologies employed, the duration, and the accuracy metrics utilized in the forecast.
The study provides a succinct synopsis of the practical features of the compared methods for forecasting electricity consumption/loading/demand.
The study determined the obstacles and prospects for additional research in forecasting electricity consumption/load/demand.
The remainder of the paper is organized as follows:
Section 2 reports the relevant material and methods.
Section 3 provides a comprehensive literature review.
Section 4 presents and discusses the results.
Section 5 provides conclusions.
2. Material and Methods
2.1. Information Extraction
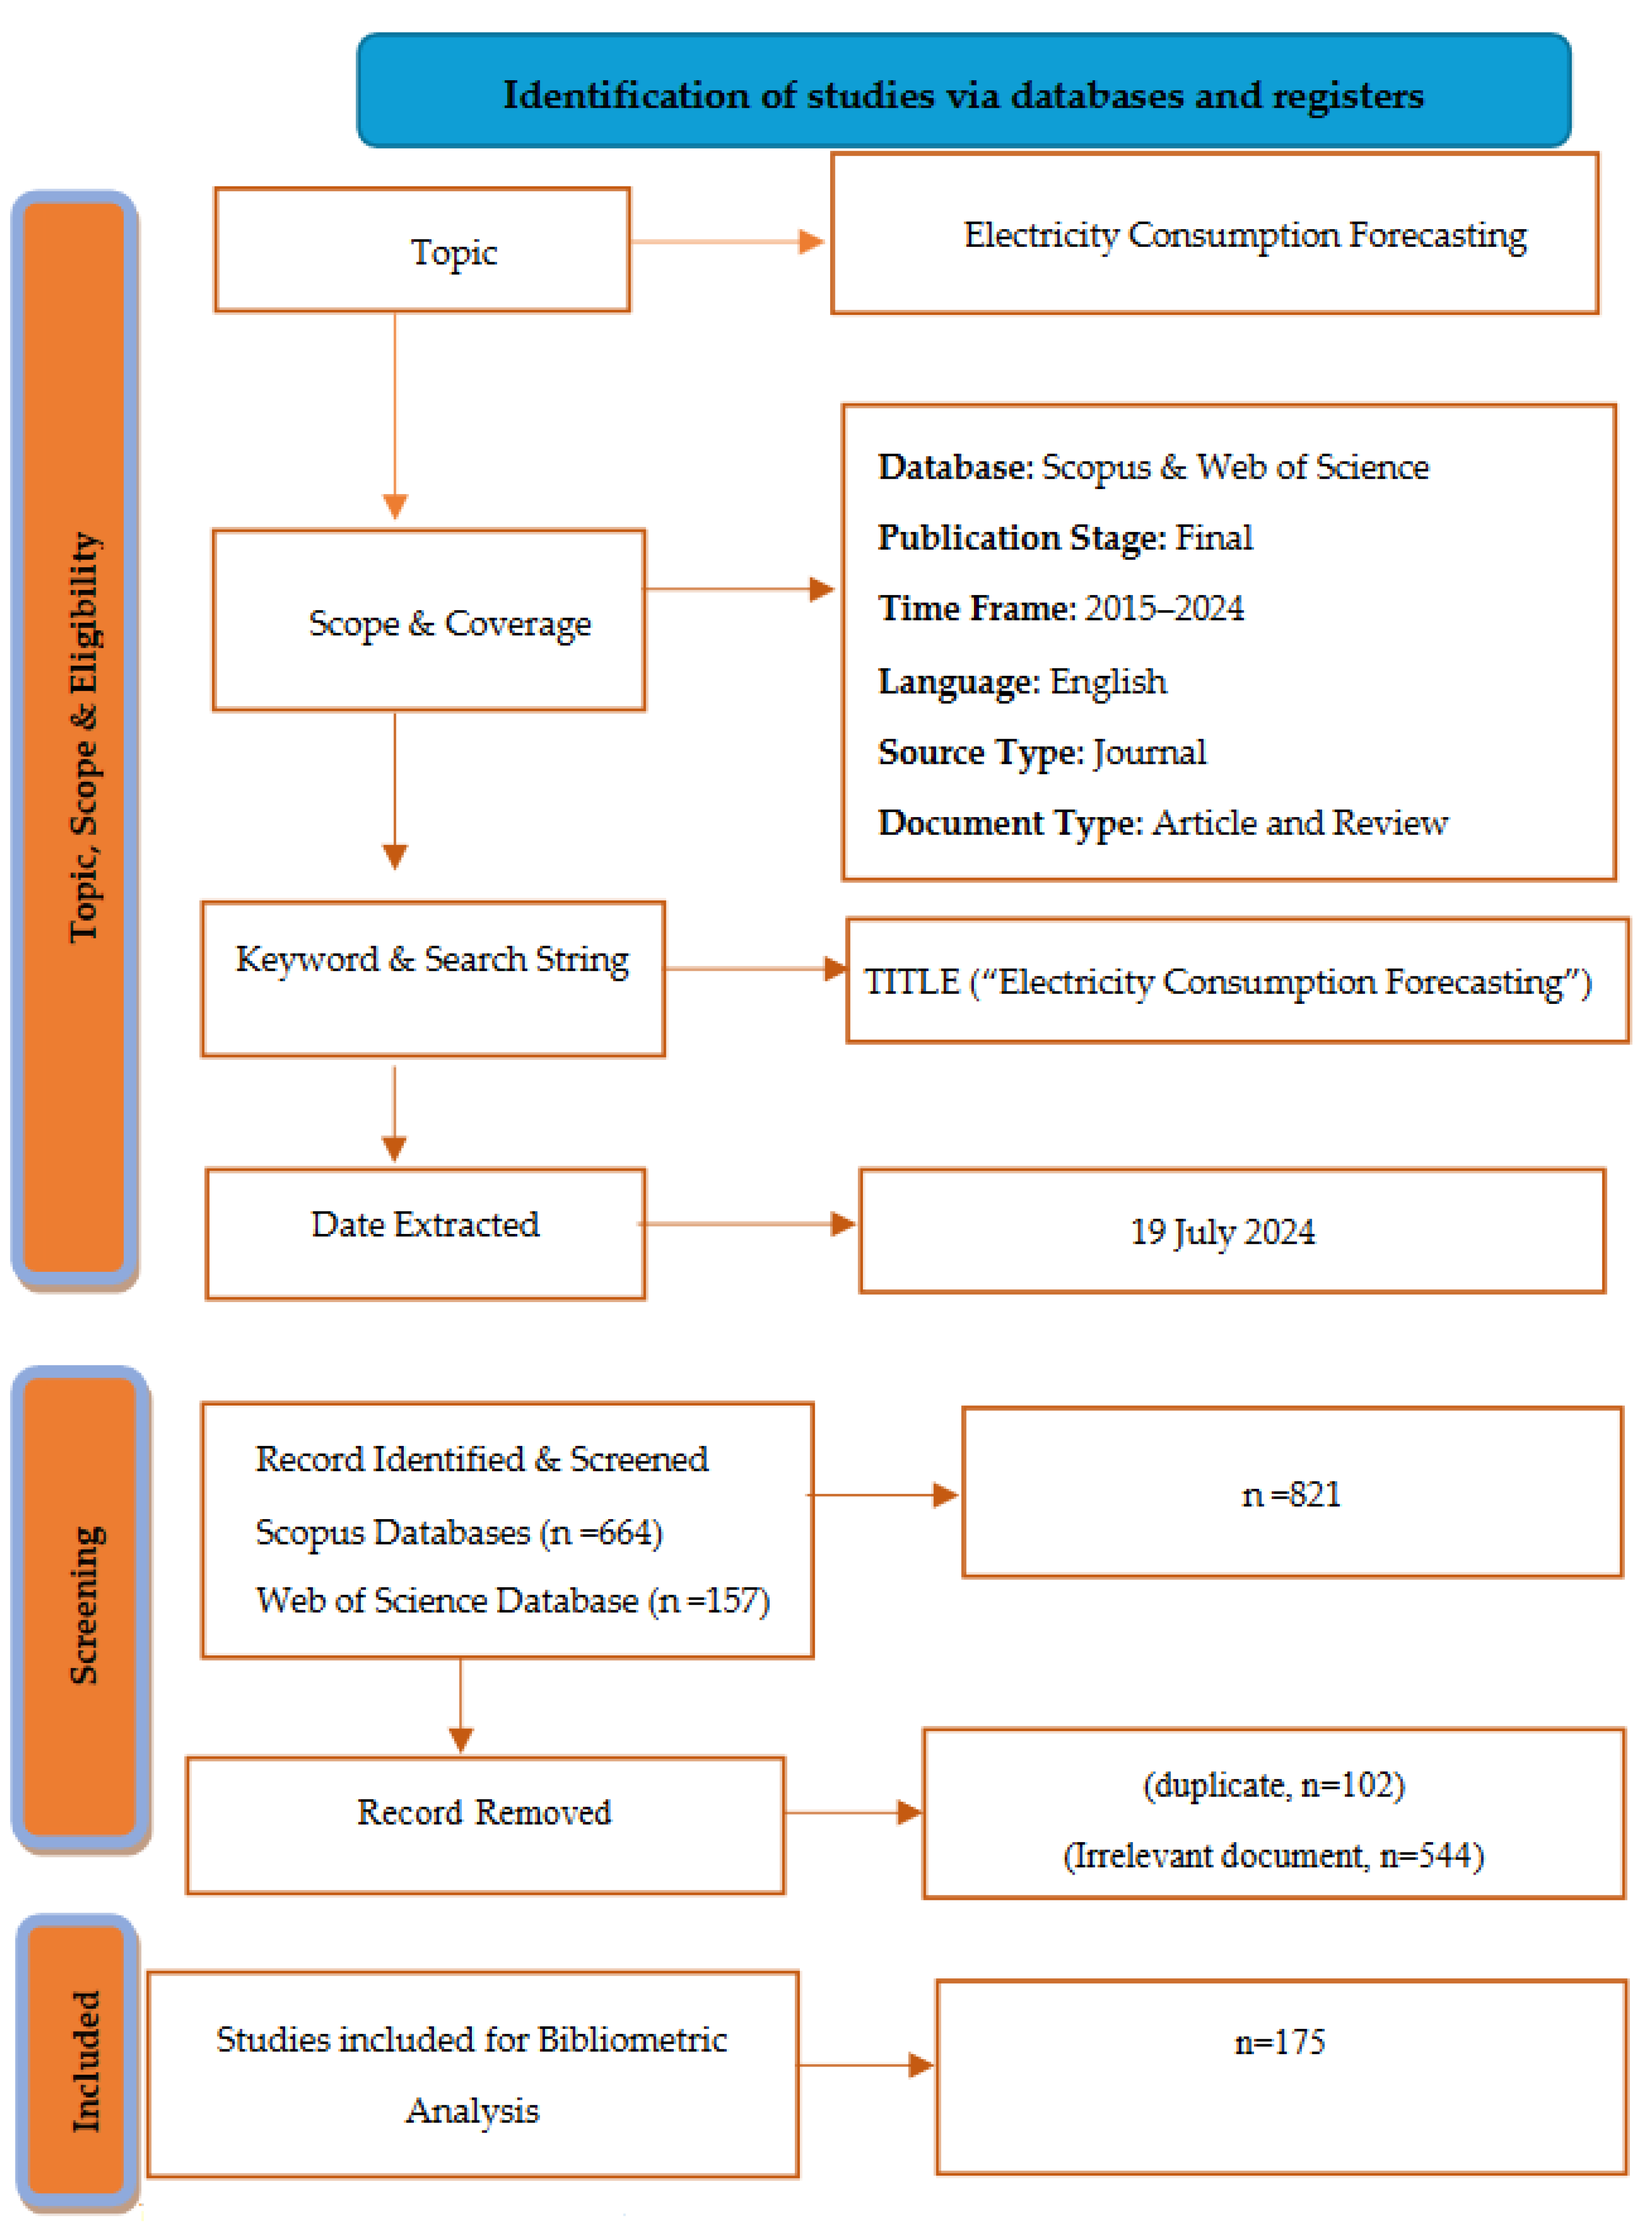
Figure 3 shows our search strategy. To avoid double counting in this investigation, we deleted erratum documents and withdrawn papers that would have produced false-positive results. Every document was examined using bibliometrics. Using Microsoft Excel 2016, we produced the pertinent charts and graphs and calculated the citation metrics. Har-zing's Publish and Perish software was used to calculate the frequencies and percentages of the published materials. VOSviewer (version 1.6.20) created and visualized the bibliometric networks.
2.2. Data Analysis
The current study examined previous research on electricity consumption forecasting using several quantitative methods (e.g., time series models, grey forecasting, machine learning methods, deep learning approaches, and probabilistic forecasting methods). The study considered research and review studies from 2015 and earlier during the review. In the last five years, the dynamics of research have changed, and in applied research work, many researchers have adopted artificial intelligence methods for predicting the accuracy of electricity consumption. However, we also focused on earlier research that reflected the primary advancement paths in electricity consumption forecasting. From 2015 to 2024, bibliometric analysis was done using the Web of Science and the Scopus database. The search term "electricity consumption forecasting," which appears in the article's title, abstract, and keywords, was used to find pertinent English-language publications about research on the subject. The study only included articles and review documents and excluded the conference and book chapters. Because it is easy for readers to follow up on the pertinent information, the current study concentrated on the article titles. It is a pertinent subject that is important to the study's goal and research field. The study eliminated and retracted document kinds to prevent multiple or fraudulent document counts (false positive data)[
66].
Using keywords and terms like artificial intelligence (AI), electricity consumption forecasting (ECF), time series (TS), machine learning (ML), and combinations of AI and ECP, ML and ECF, ML and ECF, and ML and ECF, the current study selected 175 cutting-edge research works out of 821 documents from Scopus and Web of Science. Following a thorough analysis, each downloaded research work was divided into two categories for electricity consumption forecasting: engineering approaches and data-driven (artificial intelligence) methods.
The study extracted the data from Scopus by using the keywords: TITLE-ABS-KEY ( electricity AND consumption AND forecasting ) AND PUBYEAR > 2014 AND PUBYEAR < 2025 AND ( LIMIT-TO ( LANGUAGE , "English" ) ) AND ( LIMIT-TO ( DOCTYPE , "ar" ) OR LIMIT-TO ( DOCTYPE , "re" ) ) AND ( LIMIT-TO ( PUBSTAGE , "final" ) ) AND ( LIMIT-TO ( SUBJAREA , "ENER" ) OR LIMIT-TO ( SUBJAREA , "ENGI" ) OR LIMIT-TO ( SUBJAREA , "ENVI" ) OR LIMIT-TO ( SUBJAREA , "ECON" ) OR LIMIT-TO ( SUBJAREA , "MULT" ) OR LIMIT-TO ( SUBJAREA , "DECI" ) ) AND ( LIMIT-TO ( SRCTYPE , "j" ) ) AND ( LIMIT-TO ( EXACTKEYWORD , "Machine Learning" ) OR LIMIT-TO ( EXACTKEYWORD , "Forecasting Method" ) OR LIMIT-TO ( EXACTKEYWORD , "Electricity" ) OR LIMIT-TO ( EXACTKEYWORD , "Electricity Consumption" ) OR LIMIT-TO ( EXACTKEYWORD , "Electricity Consumption Forecasting" ) OR LIMIT-TO ( EXACTKEYWORD , "Times Series" ) OR LIMIT-TO ( EXACTKEYWORD , "Forecasting Models" ) ).
2.3. Study framework
Every systematic review's quality, according to Ref.[
67]It depends on its building protocol, which describes the study's purpose, theory, and techniques. Only a small number of systematic reviews, though, provide their framework's report. A comprehensive and articulated framework for systemic reviews aids in comprehending and assessing the employed techniques. As shown in
Figure 3, this investigation used the PRISMA model [
68]. The PRISMA provides the flow of information from one step of a systematic literature review to the next, as illustrated in
Figure 1. It also lists all the research that has been identified, excluded, and included, along with the rationale behind each decision.
As seen in
Figure 3, the PRISMA flow diagram has five (5) phases. Phase 1 comprises the review's scope, questions, and inclusion/exclusion criteria.
Figure 3.
Following the PRISMA flow diagram. Source: [
68].
Figure 3.
Following the PRISMA flow diagram. Source: [
68].
Phase 2 searches the literature with keywords to identify potential studies. Phase 3 includes determining the addition of a paper by screening its abstracts to see if it meets the inclusion criteria. Phase 4 provides for the characterization of the paper for mapping by keywords. This review aimed to document an overview of research in electricity consumption forecasting to make way for future studies. As a result, a fifth (5) step offers an in-depth quantitative synthesis (meta-analysis) of studies included in the review.
Phase 2 looks for possible research by using keywords to search the literature. Phase 3 involves evaluating a paper's abstract to check if it fits the inclusion requirements before adding it. Phase 4 consists of characterizing the paper and mapping it using keywords. To make a precise view of the study, this review aims to compile an overview of the literature on electricity consumption forecasts. Thus, a comprehensive quantitative synthesis (meta-analysis) of the papers included in the review is provided in the fifth phase.
The current research work extracted 821 documents (articles and reviews) from Scopus and Web of Science (see
Figure 3). During the identification and screening process, six hundred sixty-four (664) documents were extracted from Scopus and one hundred, and fifty-seven (157) articles were extracted from Web of Science out of 821 articles. Of the 821 records, 102 were duplicates, and 544 documents were irrelevant to the study's objective; hence, they were removed, leaving one hundred and seventy-five (175) records shortlisted in the screening stage.
Table 2 lists the top 10 most productive authors between 2015 and 2024 whose research focused on forecasting electricity consumption. The table ranks these authors based on several bibliometric indicators. The table reveals a notable concentration of productive authors from China, which shows that universities in China have become key centers for research in electricity consumption forecasting. The h-index values indicate that these authors publish frequently and produce well-cited work, suggesting a high impact within the research community. For example, Dang Y, with an h-index of 4 and 502 total citations, stands out as having a particularly strong influence. Ddeinec A and Ding S have a lower publication count, but their work is highly cited on average, with C/P values of 244 and 176, respectively, indicating that their publications are highly valued.
3. Comprehensive Review for Electricity Consumption Forecasting
The current section is based on a detailed review of electricity consumption forecasting based on the review of time span (e.g., short-term, long-term, and long-term). On the other hand, the second part of the study reviews electricity consumption forecasting concerning quantitative methods used for forecasting (e.g., time series modeling, grey prediction models, machine learning models, deep learning models, probabilistic models, regression analysis, etc.). Third, the study also reviewed the comparative studies based on mixed approaches.
3.1. Review of Electricity Consumption Based on Time Span
3.1.1. Short-Term Forecasting
This subsection is based on a review of electricity consumption forecasting based on short-term periods. Many researchers explored this topic in different regions and quantitative methods [
25,
26,
27,
28,
29,
30,
31,
32,
33,
34,
35,
36,
37] A vital part of an energy management system, STLF manages time zones that can vary by a few minutes, hours, or days. It plays a major role in a power company's daily operations and planning. The short-term forecasting strategy directly impacts savings by effectively lowering operational risks and financial expenses. As a result, the cutthroat energy market is being paid a lot of attention and is considered a severe issue [
30].
Ref. [
46] used the BPNN model to analyze the short-term forecasting performance, and projected sample generation helped to improve it. The accuracy of the BPNN model was improved by increasing both the number of training samples and the amount of information gleaned from the data set—two essential components for building a strong model. The utilization of the latent information function in the projected sample generation demonstrated by the results made the upgraded BPNN model superior to the original BPNN model. The study concluded that small-time series forecasts can be effectively performed using the BPNN model with projected samples.
To study the short-term power load, Ref. [
33] created a novel short-term load forecasting model that combines several machine learning techniques, including random forest (RF), grey catastrophe (GC (1,1)), and support vector regression (SVR). RF's superior optimization capabilities are employed to maximize forecasting performance. The researcher used electric loads from the Australian-Energy-Market-Operator, the suggested SVR-GC-RF model has higher forecasting accuracy (MAPE values are 6.35% and 6.21%, respectively); it can offer analytical support to anticipate electricity consumption accurately.
Ref. [
34] examined several algorithms and a novel hybrid deep learning model that combines long short-term memory networks (LSTM) and convolutional neural network (CNN) models to evaluate their effectiveness for short-term load forecasting. The suggested model is PLCNet, which is short for parallel LSTM-CNN Network. The proposed models are tested and compared using two real-world data sets: the "hourly load consumption of Malaysia" and the "daily power electric consumption of Germany." R-squared, mean absolute percentage error (MAPE), and root mean squared error (RMSE) were used to assess the performance of the tested models. The findings demonstrate the suitability of deep neural network models—PLCNet in particular—as short-term prediction instruments. PLCNet greatly succeeded in load forecasting, increasing the accuracy from 83.17% to 91.18% for the German data and achieving 98.23% accuracy for the Malaysian data.
To estimate the short-term power consumption for an enterprise's daily power consumption data, Ref. [
35] observed the time-series prediction model based on the EMD-Fbprophet-LSTM approach. The time series was split into a residual component and a multisong intrinsic mode function (IMF) using the EMD model. The study reported that the time-series prediction model based on the EMD-Fbprophet-LSTM approach has higher forecast accuracy than the single time-series prediction model. This method may substantially increase the accuracy of short-term regional power consumption prediction.
3.1.2. Medium-Term Forecasting
This subsection is based on the reviews of the most crucial studies on medium-term forecasting for electricity consumption, e.g., [
69,
70]. Ref. [
69] developed and compared district-level models for electrical load demand prediction based on deep learning techniques like recurrent neural networks (LSTM) and non-linear auto-regressive exogenous (NARX) neural networks, as well as machine learning techniques like support vector machines (SVM) and Random Forest (RF). After completing the preprocessing and cleaning steps, the models are trained using a dataset that includes nine years of historical load demand for Bruce County, Ontario, Canada, fused with the climatic information (temperature and wind speed). With an R-squared of roughly 0.93–0.96 and a MAPE of approximately 4–10%, the results demonstrate that the model could forecast the load demand more correctly by utilizing deep learning than SVM and RF.
Ref. [
70] combines the GRU model, which is appropriate for long-term forecasting, with the Prophet model, which is appropriate for seasonality and event handling, to offer a short- and medium-term power consumption prediction algorithm. The researchers preprocessed the data to anticipate seasonality and event management and put forth the Prophet model. Seven multivariate data are tested using GRU in the second step. Additionally, projections of electricity consumption are provided for both short- and medium-term periods (2 days and 7 days) and (15 days and 30 days). The suggested method works better than the Prophet and GRU models, lowering prediction errors and providing insightful information about electricity consumption patterns.
Ref. [
71] employed a SARIMA model for medium—and long-term forecasting built by simulating Yunnan Province's entire society's electricity consumption data from 2008 to 2018. The analysis results indicate that the experimental data have strong autocorrelation, a continuous upward trend, and strong seasonality. Lastly, the model's parameters were optimized, and it was tested using the test set. Ultimately, the model obtained a MAPE of 6.05%.
3.1.3. Long-Term Forecasting
This subsection is based on the reviews of the most significant studies on long-term forecasting for electricity consumption [
71,
72,
73]. Ref. [
74] estimated Sierra Leone's electricity consumption from 2023 to 2050 using MAED-D (version 2.0.0) demand software. The researchers used technical and socioeconomic factors to study three new scenarios—baseline, high, and low demand. The high-demand scenario looks at an ambitious development future with increasing economic diversification and mechanization, while the low-demand scenario looks at more restrained future development. The baseline scenario treats the current electrical sector as if it were a business as usual. The base case, high demand, and low demand scenarios show a rise in power demand by 2050 of 7.32 PJ, 12.23 PJ, and 5.53 PJ, respectively, according to the results of the modeled scenario.
Among various data-driven techniques, Ref.[
73] found the most effective one for estimating the effects of socioeconomic and climatic shifts on Hong Kong's long-term monthly electricity demand in the future. First, these models are trained and validated using 40 years of historical data on socioeconomic conditions, climate, and electricity consumption. Second, as future climate changes are anticipated, three percentiles of the results from 24 global circulation models and several representative concentration pathway (RCP) scenarios are used. For future socioeconomic uncertainty, however, five common socioeconomic routes are considered. According to the findings, the ANN approach has the lowest accuracy and the least capacity for generalization, while the GBDT method offers the highest accuracy, time-series stability, and generalization.
3.2. Review of Electricity Consumption Based on Quantitative Methods
This subsection is based on the review of the most prominent studies, which exhibit the types, impact, scope, and significance of quantitative methods used in electricity consumption forecasting. In this section, the study mentioned the most important and frequently used quantitative methods in electricity consumption forecasting (e.g., time series econometrics modeling, grey forecasting models, machine learning models, deep learning models, optimization-based models, top-down and bottom-up models, and hybrid models).
3.2.1. Time Series Econometric Modelling
This subsection reviews the most prominent studies based on time series econometrics approaches. Most of the studies used the traditional forecasting methods (e.g., ARIMA, Seasonal ARIMA (SARIMA), SARIMAX, Holt-Winters, ETS, decomposition methods, Auto-Regressive Conditional Heteroscedasticity (ARCH), Generalized ARCH (GARCH), Exponential Smoothing (ETS)). Generally, researchers adopted the ARIMA forecasting methods as a benchmark to measure forecasting accuracy. Researchers often used solely ARIMA methods; however, some studies compared ARIMA predicting performance with other quantitative methods. The studies used the ARIMA models [
44,
45,
48,
60,
75,
76,
77,
78,
79,
80,
81,
82,
83], SARIMA models [
56,
84,
85], regression analysis [
41,
86,
87,
88,
89], SARIMAX [
65], ETS [
10,
30,
43], decomposition methods [
60,
77,
83].
To create forecasting models of the amount of electricity consumption, Ref. [
56] examined the various forecasting techniques, including hybrid SARIMA-ANN and hybrid model by SARIMA-Gaussian Processes (GP) with coupled Kernel Function methodology. Utilizing data on electricity consumption, the study examined how well the two systems performed. The research computed the SARIMA model's forecast values and Thailand's electricity consumption between 2005 and 2015. With a MAPE of 4.7072e-09 and 4.8623, respectively, the hybrid model by SARIMA-GP with an integrated Kernel Function approach performed better than the SARIMA-ANN model.
Using a novel framework, the panel quantile regression neural network (PQRNN) is created by incorporating an artificial neural network structure into a panel quantile regression model, Ref. [
41] examined the prediction of electricity consumption for China. An empirical examination of China's province panel dataset from 1999 to 2017 is used to assess the prediction accuracy and demonstrate the effectiveness of the PQRNN-based electricity consumption forecast. Lastly, using the PQRNN model, the province's electricity consumption for the following five years (2018–2022) is estimated. The empirical study assesses accuracy using MAE, RMSE, MAPE, RRMSE, Total RMAE, Total RMSE, Total MAPE, and Total RRMSE. The data gets increasingly spread, as evidenced by the Mean ± standard deviation of power consumption, which is 411:5 ± 247:7 in 1999, 1219:2 ± 892:4 in 2009, and 2100:6 ± 1500:7 in 2017.
Ghana's electricity consumption by 2030 was predicted using the Autoregressive Integrated Moving Average (ARIMA) model, employed in Ref. [
76]. Ghana's electricity consumption is expected to increase from 8.5210 billion kWh in 2012 to 9.5597 billion kWh in 2030 under the predicted scenario, from 8.5210 billion kWh in 2012 to 4.7839 billion kWh in 2030 under the low growth scenario, and from 8.5210 billion kWh in 2012 to 17.3267 billion kWh in 2030 under the high growth scenario, according to data from the ARIMA forecast using a time series spanning from 1980 to 2013. Moreover, the empirical findings show the accuracy of the forecast, the study employed goodness-of-fit measures such as R
2 (0.931), stationary R
2 (0.894), RMSE (0.419), MAPE (5.34%), MAE (0.297), MaxAPE (13%), MaxAE (0.793).
Using a spatial model, Ref. [
48] examined the regional electricity consumption in Brazil and produced a spatial pattern of regional dissimilarity. After applying the suggested method to the regional power demand in Brazil, it was discovered that there is a spatial dependence on the region's regional electricity consumption, resulting in a spatial pattern of dissimilarity between areas. By lowering the MAPE of forecasts, the ARIMASp model—presented in this paper—performed better predictively than the ARIMA model. In terms of numbers, the ARIMA forecast showed a shortfall of 1,317.30 GW, but the ARIMASp model overestimated the electricity demand by 214.68 GW.
3.2.1. GREY Forecasting Models
This subsection reviews the most prominent studies based on GREY forecasting methods. The literature investigates several approaches to electricity consumption forecasting using grey prediction models. The main advantage of the grey model is that it is best suited for predicting with a small data span. Many researchers have explored the issue of electricity consumption forecasting on an hourly, daily, monthly, quarterly, and annual basis, e.g., [
50,
54,
59,
61,
90,
91,
92,
93,
94,
95,
96,
97,
98,
99,
100,
101,
102,
103,
104,
105,
106,
107,
108,
109,
110,
111,
112,
113].
Ref. [
50] examined the predictive accuracy for residential electricity consumption in China from 2015 to 2022 using the novel discrete grey model (DTGFM (1,1,
N)). The study compared the ARIMA, Deep neural network (DNN), and four grey models, e.g., SGM (1,1); GMP (1,1); GFM (1,1,6), and proposed model DTGFM (1,1, N). The results indicate that the proposed model captures the dynamic amplitude variations of the time series and has better prediction performances than other benchmark grey prediction models and non-grey prediction models. The results show that MAPE of the test data set is 3.26%, 4.4.6%, 12.89%, 4.29%, 6.73%, and 11.26% for DTGFM (1,1,
N), GFM (1,1,6), GMP (1,1); SGM (1,1), DNN, and ARIMA models respectively.
Ref. [
90] creates a novel discrete grey model (abbreviated as DGM(2,1,kn)), for predicting China's per-capita electricity consumption. The research employed in this work predicts China's per capita electricity consumption using the DGM(2,1,kn) model. The CPR, BPNN, NDGM(1,1,k), and DGM(2,1) models are contrasted with the results. The raw data for China's per-person electricity consumption (kilowatt-hours) between 1997 and 2017. The MAPEs of five models were empirically numerically determined between 1997 and 2017. The MAPEs of the CPR, BPNN, NDGM(1,1,k), DGM(2,1), and DGM(2,1,kn) models are observed to be 3.01%, 5.29%, 6.02%, 6.70%, and 3.03% during the simulation stage, and 9.75%, 14.40%, 8.47%, 8.12%, and 2.72% at the verification stage, respectively.
Ref.[
98] analyzed three different grey forecasting models to predict yearly net electricity consumption in Turkey. The study applied three models, which were compared to find the best model using performance criteria. The best approach, the Nonhomogeneous Discrete Grey Model (NDGM), is employed to forecast electricity consumption from 2014 to 2030. The study proposed that the NDGM grey model delivers better forecasting performance. The results indicate the MAPE values of the DGM, ODGM, and NDGM models are 22. 39%, 11.45%, and 6.38% respectively.
Ref.[
109] proposed a novel unbiased fractional nonlinear grey Bernoulli model [i.e., UFNGBM (1,1)] to forecast China’s annual electricity consumption based on the nonlinear grey Bernoulli model [i.e., NGBM (1,1)]. The experimental results demonstrate that our proposed model is significantly superior to nine alternative models in terms of the electricity consumption data of Jilin and Jiangsu. The performance of our novel method is close to the state-of-the-art deep learning method on the electricity consumption data of Shandong. It is noticed that our method [as an extended version of NGBM (1,1)] is significantly better than NGBM (1,1) on these three real-world datasets, which further shows the effectiveness of our proposed algorithm. The UFNGBM (1,1) models show the best predictive performance with the smallest MAPE values of 2.94% and 3.04% for Jiangsu and Jilian provinces, respectively.
3.2.1. Machine Learning Models
There is a plethora of electricity consumption forecasting using machine learning approaches, e.g., [
2,
43,
53,
63,
114,
115,
116,
117,
118,
119,
120,
121,
122,
123,
124,
125,
126,
127,
128,
129,
130,
131,
132,
133,
134,
135,
136,
137,
138]. On the one hand, some researchers examined the forecasting issue based on single machine learning methods; some used a comparison of machine learning methods, and similarly, some used a comparison of machine learning and other well-known methods.
Overall, the application of machine learning in electricity consumption forecasting holds great promise for enhancing energy management, reducing costs, and supporting the integration of renewable energy sources into the grid. In Singapore, a hybrid approach combining building characteristics and urban landscape variables with XGboost has outperformed other models like Geographically Weighted Regression (GWR) and Random Forest (RF), achieving an R
2 value of 0.9 in forecasting residential electricity consumption [
138]. In Saudi Arabia, a hybrid model combining Bayesian optimization algorithm (BOA) with support vector regression (SVR) and nonlinear autoregressive networks with exogenous inputs (NARX) has shown high accuracy in long-term electricity consumption forecasting, with R
2 values exceeding 0.98 [
139]. Machine learning in electricity consumption forecasting is not limited to large-scale applications; it also extends to individual households, where models can predict electricity bills based on historical conssumption patterns, helping consumers manage their energy expenses better [
140].
Using historical time series data from January 1975 to December 2021 and suitable estimation techniques, Ref.[
3] investigated the Gross electricity consumption (GEC) forecasting models. To anticipate GEC in Türkiye, a machine-learning model utilizing a deep-learning technique based on an LSTM neural network was employed in this study. The seasonal autoregressive integrated moving average (SARIMA) model was compared to the LSTM model to calculate the total amount of electricity consumption. Despite the results being near one another, the LSTM model fared better overall than the SARIMA model. It had the highest R2-value (0.9992) and the lowest values of MAPE (2.42%), MAE (215.35 GWh), and RMSE (329.9 GWh).
Ref. [
20] forecasted the electricity consumption of an administration building in London, United Kingdom, to compare the prediction abilities of five distinct intelligent system methodologies. Support Vector Machine (SVM), Artificial Neural Network (ANN), Deep Neural Network (DNN), Genetic Programming (GP), and Multiple Regression (MR) are these five approaches. The five years' worth of observed data for five distinct parameters—such as solar radiation, temperature, wind speed, humidity, and weekday index—were used to build the prediction models. The weekday index is an essential metric to distinguish between working and non-working days. The first four years' worth of data are used to generate prediction data for the fifth year and train the models. Lastly, a comparison is made between each model's estimated and actual electricity consumption for the fifth year. The results show that, with a Mean Absolute Percentage Error (MAPE) of 6%, ANN outperforms the other four techniques, MR, GP, SVM, and DNN, having MAPEs of 8.5%, 8.7%, 9%, and 11%, respectively.
A model for estimating power consumption in Agartala, Tripura, India, was proposed by Ref. []. This model can accurately anticipate the load for the following 24 hours and can estimate the load for a week or a month. Furthermore, the current work demonstrates how an ensemble machine-learning procedure can significantly increase prediction accuracy. We showed how Random Forest and XGBoost performed both individually and collectively. The accuracy achieved by the RF and XGBoost ensemble was improved by 15–29%.
3.2.1. Deep Learning Models
This subsection reviews the most prominent studies based on deep-learning approaches, [
38,
39,
42,
47,
98,
141,
142,
143,
144,
145,
146,
147,
148,
149,
150,
151,
152,
153,
154,
155,
156,
157,
158,
159,
160,
161,
162,
163,
164,
165]. Ref. [
161] adopted a panel semiparametric quantile regression neural network (PSQRNN) developed by combining an artificial neural network and semiparametric quantile regression for panel data. By embedding penalized quantile regression with the least absolute shrinkage and selection operator (LASSO), ridge regression, and backpropagation, PSQRNN keeps the flexibility of nonparametric models and the interpretability of parametric models simultaneously. The prediction accuracy is evaluated based on a study of 30 provinces’ panel datasets from 1999 to 2018 in China under three different scenarios. The results indicate that with the lowest MAPE value, PSQRNN with 0.1364 performs better compared with three benchmark methods, including BP neural network (BP) with 0.2621, Support Vector Machine (SVM) with 0.2345, and Quantile Regression Neural Network (QRNN) with 0.2559.
In Ref.[
165] analyzed the sample data to remove the volatility of the electricity consumption data by denoising it using a wavelet transform. The multi-layer LSTM model is then trained using the pre-processed samples, and the suggested model is validated and projected to consume daily power consumption based on the area controlled by the U.S. electric power company. The experimental findings demonstrate that this model outperforms bidirectional and conventional LSTM in terms of prediction performance. The coefficient of determination (R
2) is as high as 0.997, and the MSE is 0.019.
Ref. [
147] used the deep belief networks (DBN), which are based on multiple layers of restricted Boltzmann machines, to investigate Macedonia's electricity consumption forecasting. Short-term electrical load forecasting using the suggested DBN model used hourly electricity consumption data from 2008 to 2014. The results are compared with the most recent real data, the data from the Macedonian system operator (MEPSO), and the predicted data from a conventional feed-forward multi-layer perceptron neural network. The comparisons demonstrate that the used model outcome has better results than those produced with conventional techniques and is appropriate for the Macedonian electric power system's hourly electricity load forecasts. When utilizing DBN instead of MEPSO data for 24-hour forward forecasting, the mean MAPE is lowered by 8.6%, and the MAPE for daily peak forecasting is lowered by up to 21%.
A novel convolutional neural network (CNN) technique using an input signal decomposition algorithm was presented in Ref. [
143]. Hourly electricity consumption data for Turkey's COVID-19 period were used as input data, and the short-term electricity consumption was projected using the suggested CNN architecture. Empirical Mode Decomposition (EMD), a signal decomposition technique, was used to break the input data into smaller components. All input data were converted into 2D feature maps to extract the deep features and fed into CNN. The pre-trained models GoogleNet, AlexNet, SqueezeNet, and ResNet18 were used to compare the outcomes. According to model-wise comparisons, the suggested approach exhibited the best R2, the lowest mean absolute error (MAE), and the lowest root mean square error (RMSE) values for the 1-, 2-, and 3-hour periods. For one hour, two hours, and three hours ahead, the suggested method's mean R
2-values were 95.6%, 95.2%, and 94.0%, respectively.
3.2.1. Hybrid Models
This subsection is based on the reviews of the most critical studies on hybrid models forecasting electricity consumption [
49,
51,
52,
57,
62,
64,
95,
166,
167,
168,
169,
170,
171,
172,
173,
174,
175,
176,
177].
For the ultra-short-term forecasts of Chinese residential electricity consumption, Ref. [
169] created a hybrid model based on the Extreme Learning Machine (ELM) network and the Holt-Winters (HW) approach. The suggested HW-ELM model was applied to various training set sizes and seasons to forecast results for 15-minute electricity consumption. The suggested model frequently showed reduced inaccuracy for forecasting residential electricity consumption compared to HW, ELM, and long short-term memory network (LSTM). The RMSE values were decreased by 87.98%, 64.89%, and 53.39%, respectively, for a training set size of 50 days in the spring. The trials' findings demonstrate that the suggested HW-ELM model performs more exceptionally than the established models created using other techniques.
In order to estimate energy consumption in China's primary sector, Ref. [
64] proposed the Fourier-modified grey forecasting model (FDSGM (1, 1, x(β), γ)) based on seasonal fluctuation features and starting condition optimization. This study compares the grey forecasting models based on seasonal index (SGM (1,1)), grey correlation seasonal index (RSGM (1,1)), and dynamic seasonal index (DSGM (1,1)) with empirical data on seasonal electricity consumption in China's primary industry. In the training set, the MAPEs of the SGM, RSGM, and DSGM models were 2.89 %, 2.92 %, and 1.08 %, respectively; in the testing set, they were 6.13 %, 6.16 %, and 6.09 %. The FDSGM (1, 1, x(β), γ) model's prediction accuracy is superior to three prior prediction models combined. The training and testing sets' MAPEs decreased to 0.2% and 6.02%, respectively. The dynamic seasonal factor-constructed model has been demonstrated to outperform the previous two seasonal models in terms of accuracy and suitability for electricity consumption prediction.
Ref. [
62] uses hourly data from Ukraine from 2013 to 2020 to forecast the country's electricity demand using an innovative hybrid approach combining traditional statistics and machine learning. The hourly, daily, and annual time series of electricity consumption were examined in the study, along with their underlying structures. Macroeconomic regression analysis assesses the annual trend over the long run. The mid-term model describes the error term by combining ARIMA and LSTM "black-box" pattern-based techniques, while the underlying structure is defined by integrating temperature and calendar regressors. The short-term model captures the hourly seasonality using several ARMA models for the residual and calendar regressors. According to the results, the best forecasting model combines an LSTM hybrid model for residual prediction with multiple regression models. On an hourly level, our hybrid model performs exceptionally well in predicting long-term electricity consumption. For LM, LM+ARIMA, LM+LSTM, and LM+ARIMA+LSTM, the corresponding RMSE values in megawatts (MW) are 552.8 MW, 533.4 MW, 500.6 MW, and 504 MW.
Ref. [
52] looked at Türkiye's forecasting model for electricity consumption. This involves comparing the predicting abilities of single and hybrid electricity consumption models; SARIMA is the time series model, ANNs and MLPs are single machine learning models, and SARIMA-ANNs and SARIMA-MLPs are hybrid models. Using novel hybrid models, this study investigates whether Zhang's hybrid model—often employed as the ARIMA-hybrid model with well-known flaws—is better than the multiplicative model of Wang et al. or the combination model of Khashei and Bijari. The findings indicate that when it comes to predicting Turkish electricity consumption, hybrid models outperform single-time series and machine learning models in terms of accuracy. Furthermore, it was shown that the Khashei and Bijari hybrid models performed better than the others and were the most accurate in predicting Turkey's electricity consumption, respectively.
3.3. The accuracy metrics
The accuracy metrics of electricity consumption forecasting models found in the papers include:
Mean Absolute Error (MAE)
Mean Squared Error (MSE)
Root Mean Squared Error (RMSE)
Mean Absolute Percentage Error (MAPE)
R-squared (R2)
These metrics provide a comprehensive understanding of the model's predictive performance and ability to accurately capture the underlying patterns in the data. Almost every study mentioned the accuracy metrics MAE, MSE, RMSE, MAPE, and R
2; however, for the reader, the Ref. [
30] mentioned different values of MAPE in the previous studies.
3.5. Obstacles to Additional Research in Forecasting Electricity Consumption
Forecasting models are heavily dependent on the quality and availability of historical data, and therefore, inconsistent, incomplete, or outdated data significantly hinder the development and validation of effective forecasting models. The lack of historical data series with high time granularity limits the ability to perform accurate short-term forecasts. In the case of mid- and long-term forecasts, a particular challenge is incorporating the impact of energy and climate policy goals, which influence the dynamics of the energy transition and lead to the diffusion of new electric end-use technologies that substitute the fossil-fuel status quo. This creates difficulties for models that rely on historical data.
As forecasting models become more complex, especially with the integration of machine learning and deep learning techniques, their interpretability decreases. This complexity can create challenges in understanding the underlying factors driving electricity consumption.
Furthermore, advanced forecasting models require substantial computational resources, particularly machine learning and deep learning. This can be a barrier for researchers or institutions with limited access to high-performance computing facilities.
4. Results and Discussion
The study highlights the most significant quantitative forecasting approaches and their forecasting performance. As was previously mentioned in this study, one hundred and seventy-five (175) papers were included in the quantitative analysis. The present work makes the following contributions to the literature on energy modeling. The current study used the bibliometric R package to estimate the empirical findings[
178].
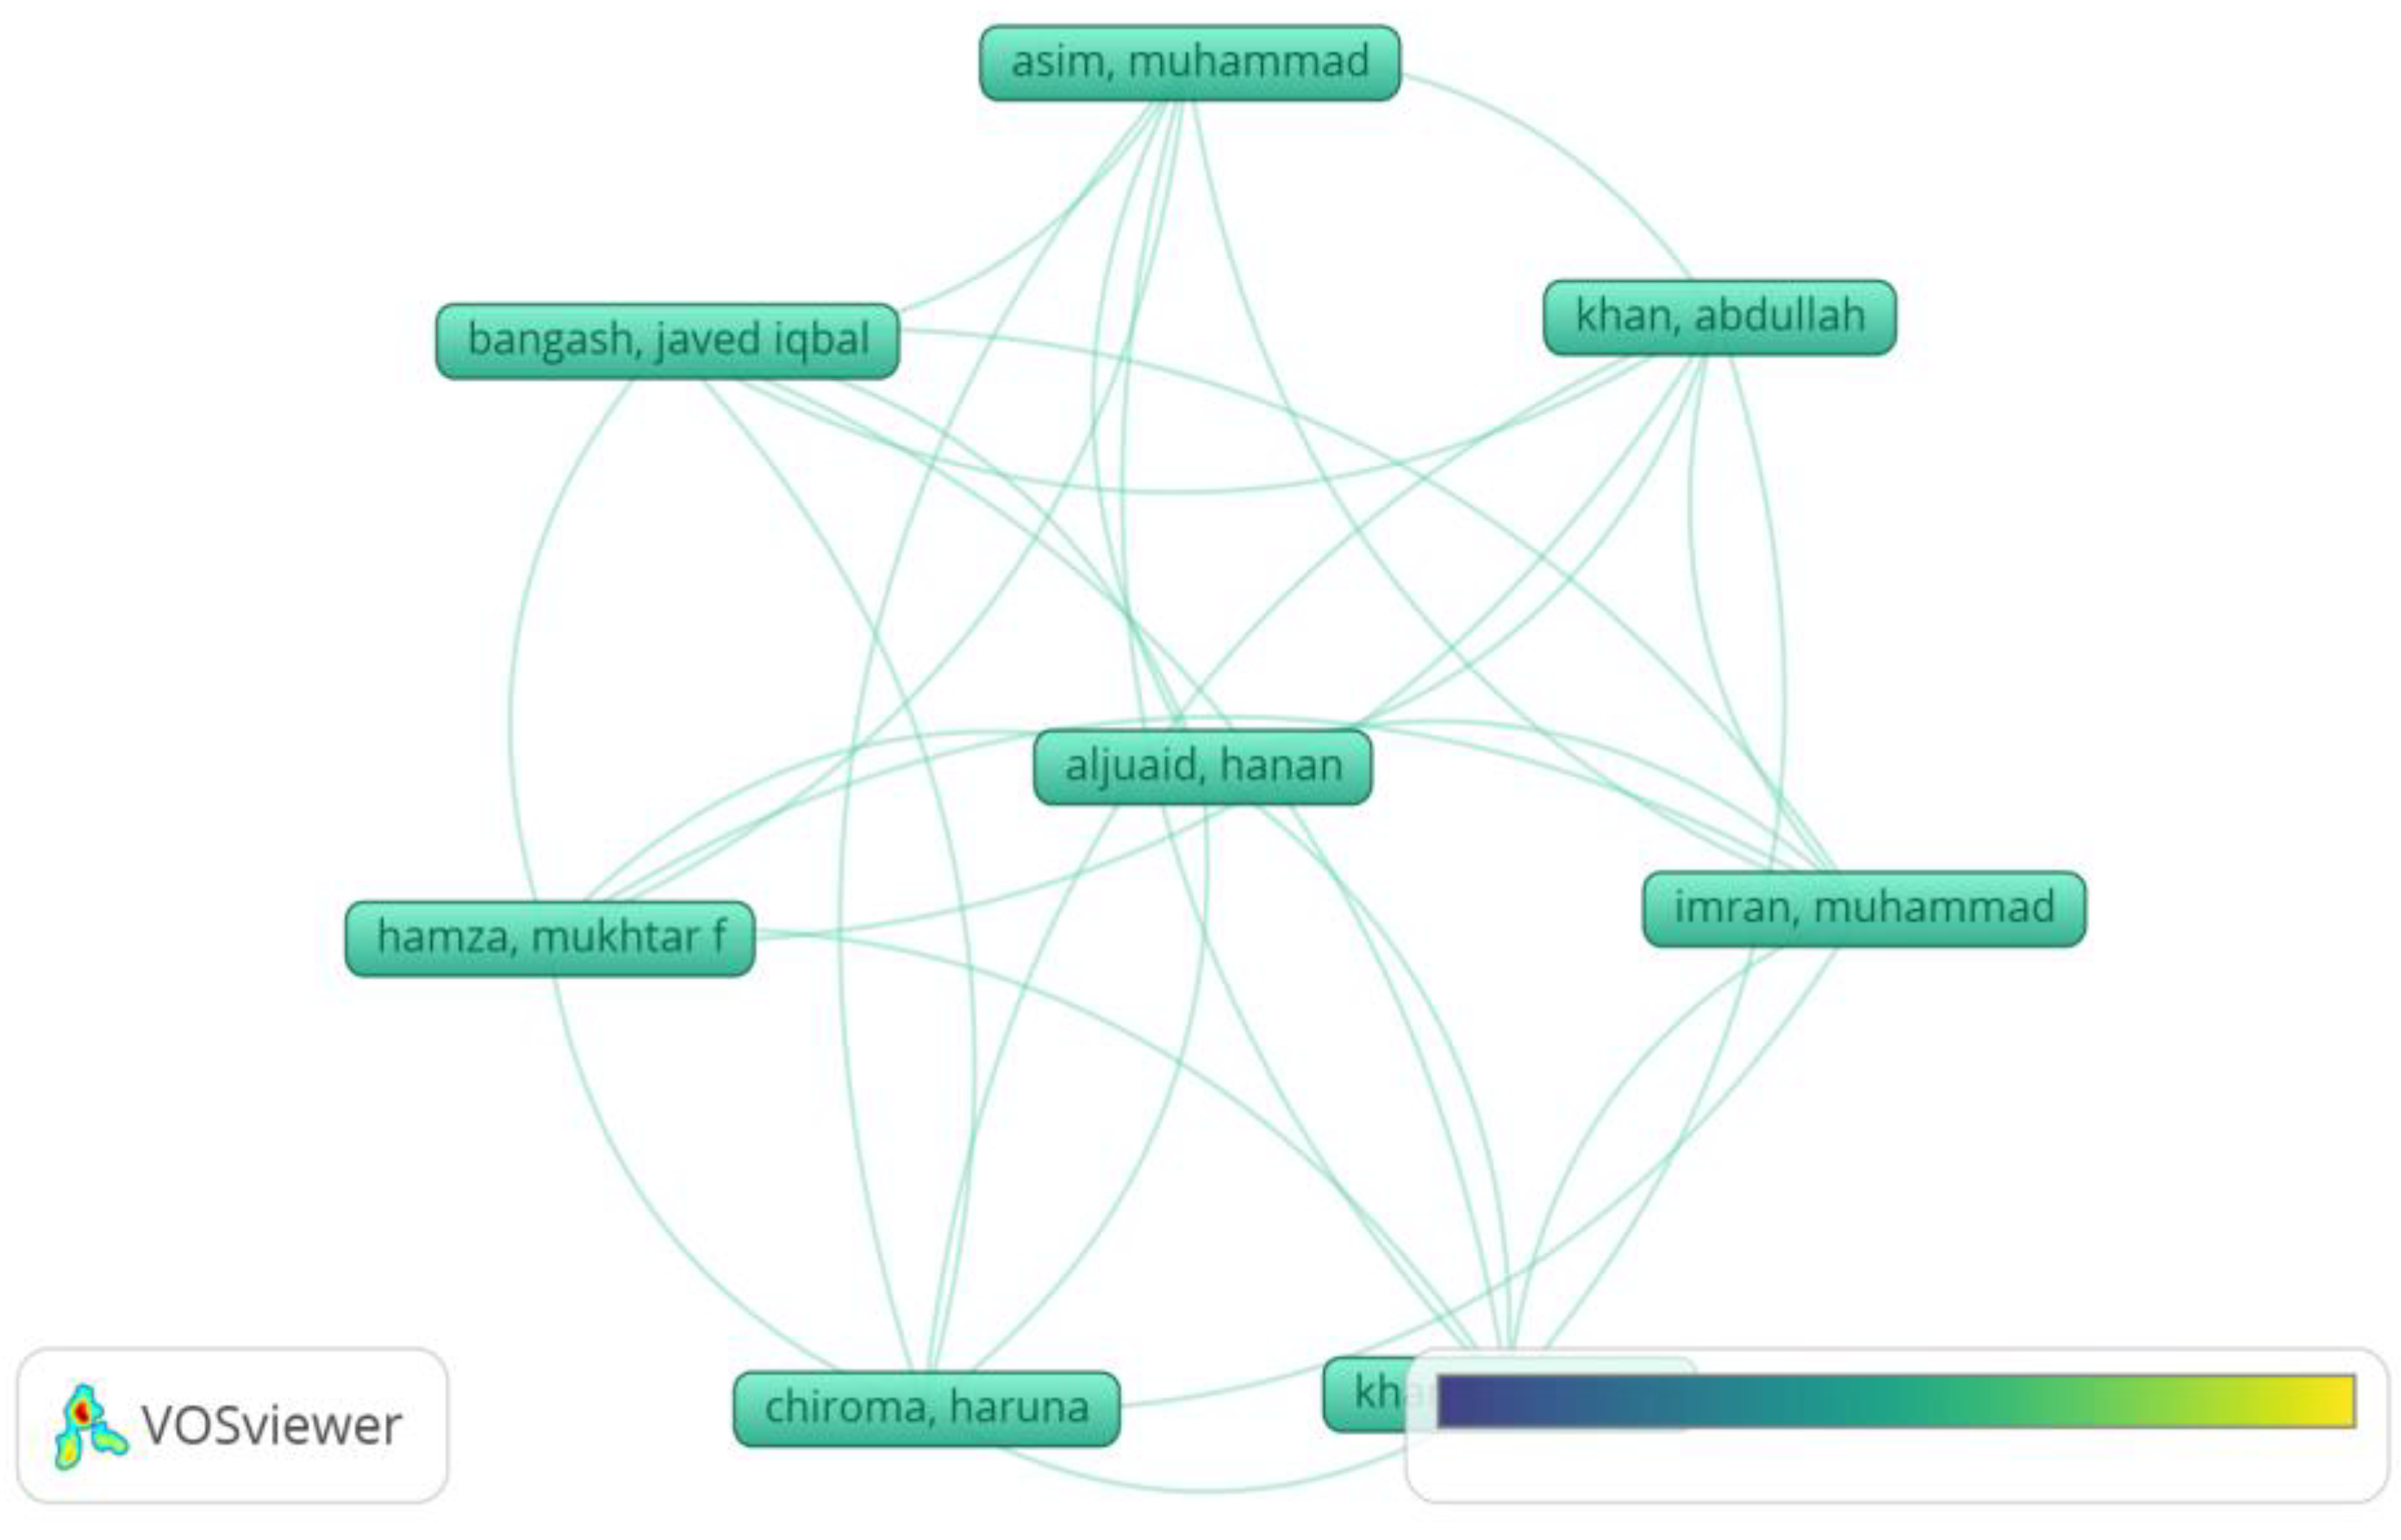
Figure A1 shows the (Coauthors association concerning citation); 8 coauthors strongly associate with a minimum of one document and ten citations per document). On the other hand,
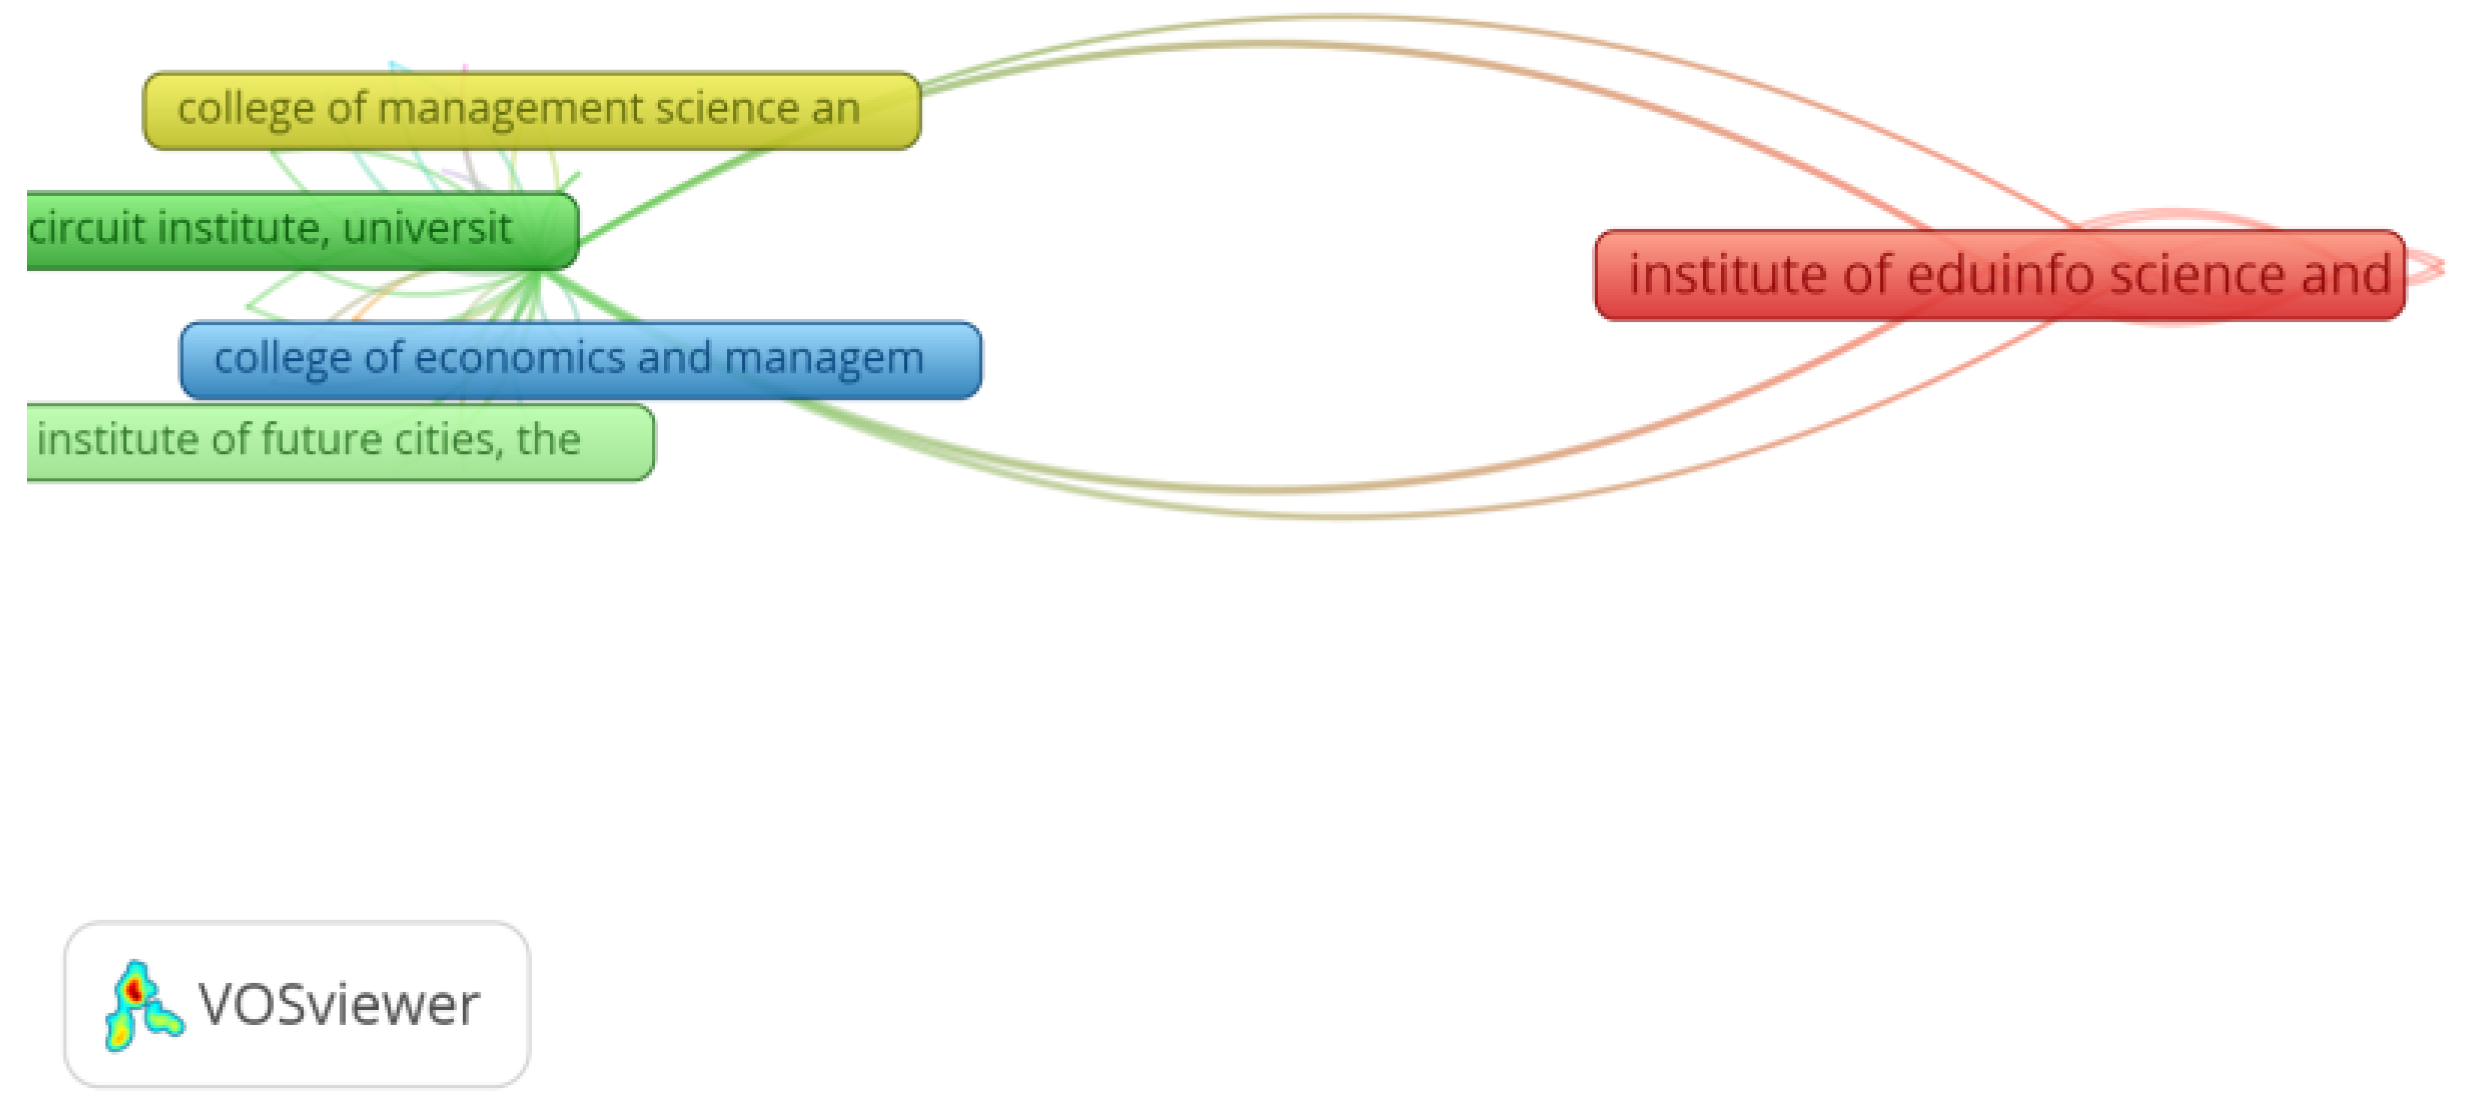
Figure A2 depicts the association of the Organization to documents and their citation. The minimum number of documents in an organization is one, and the minimum number of citations is 30. The results show that 30 organizations are associated with each other. In
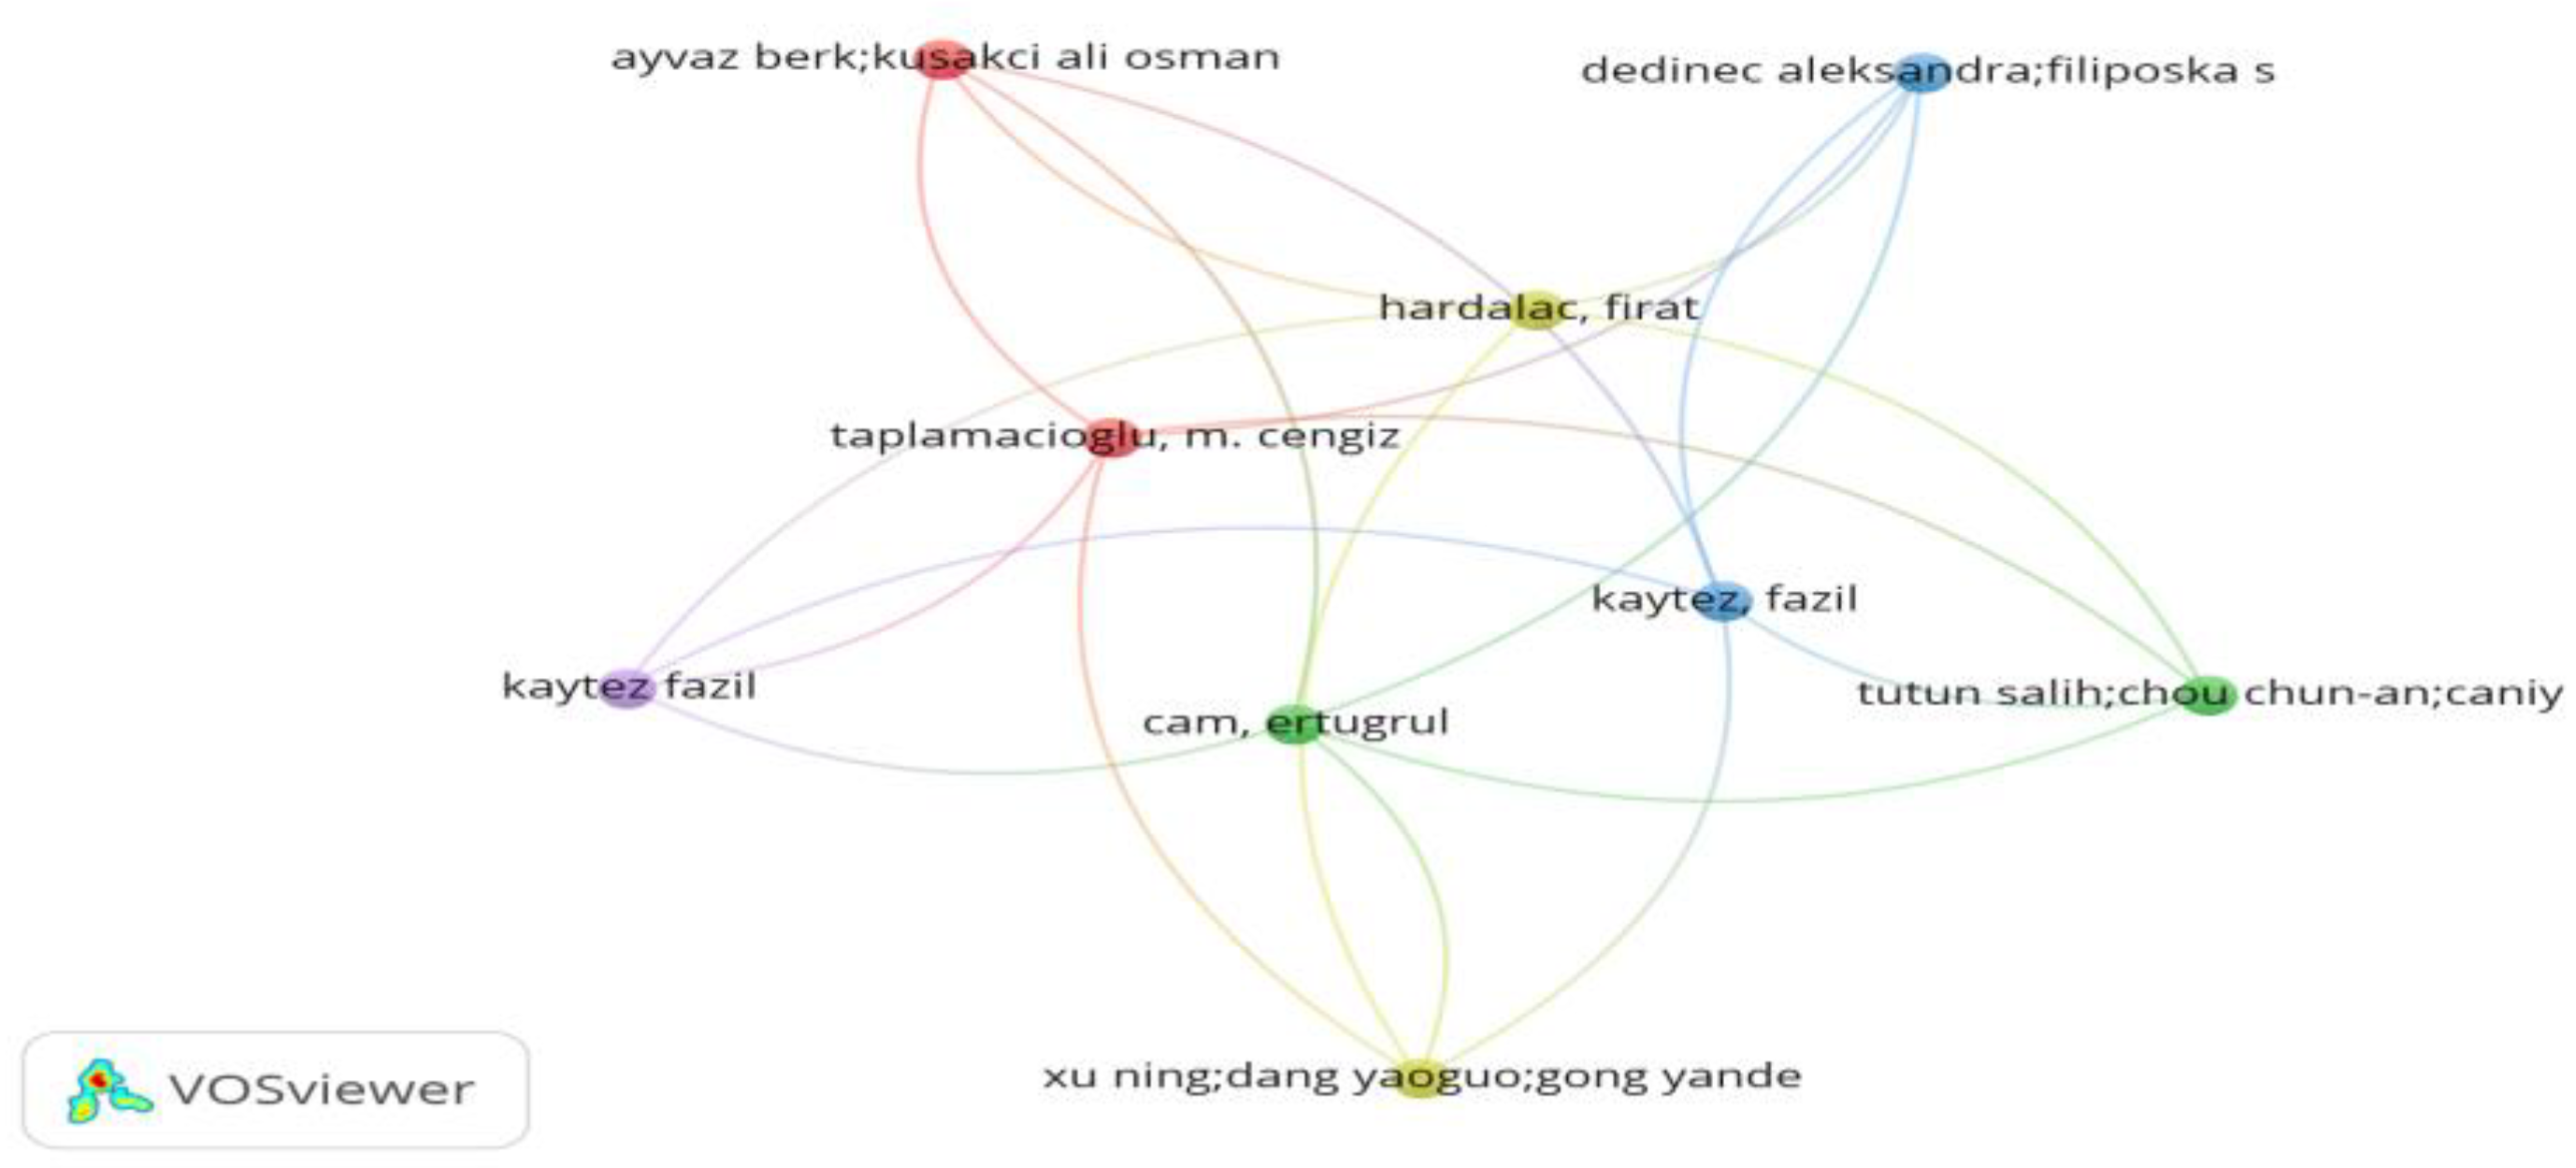
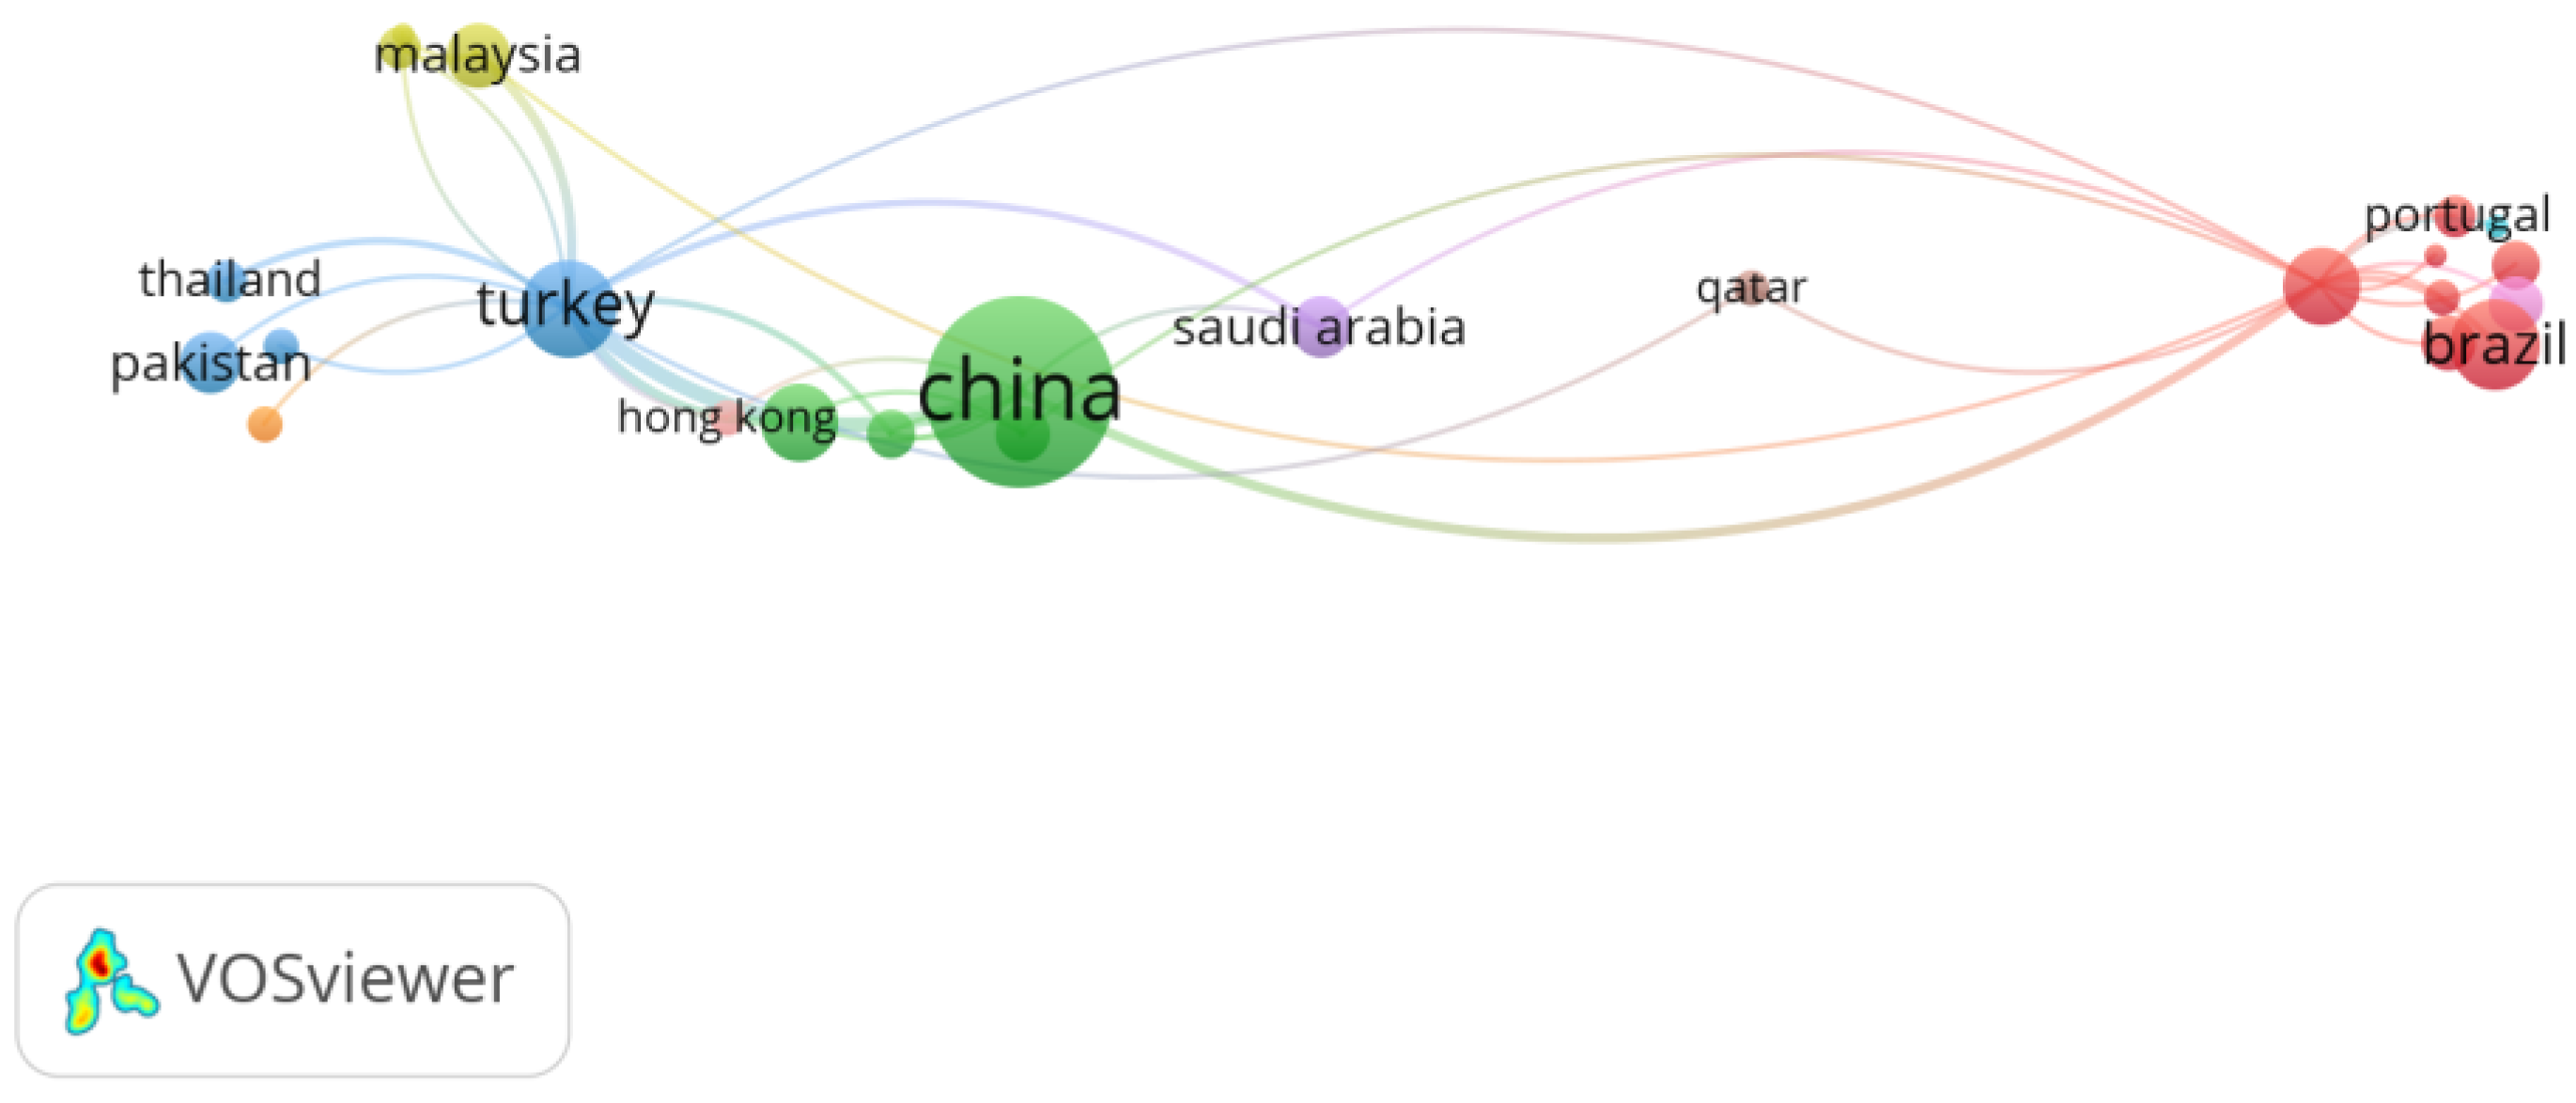
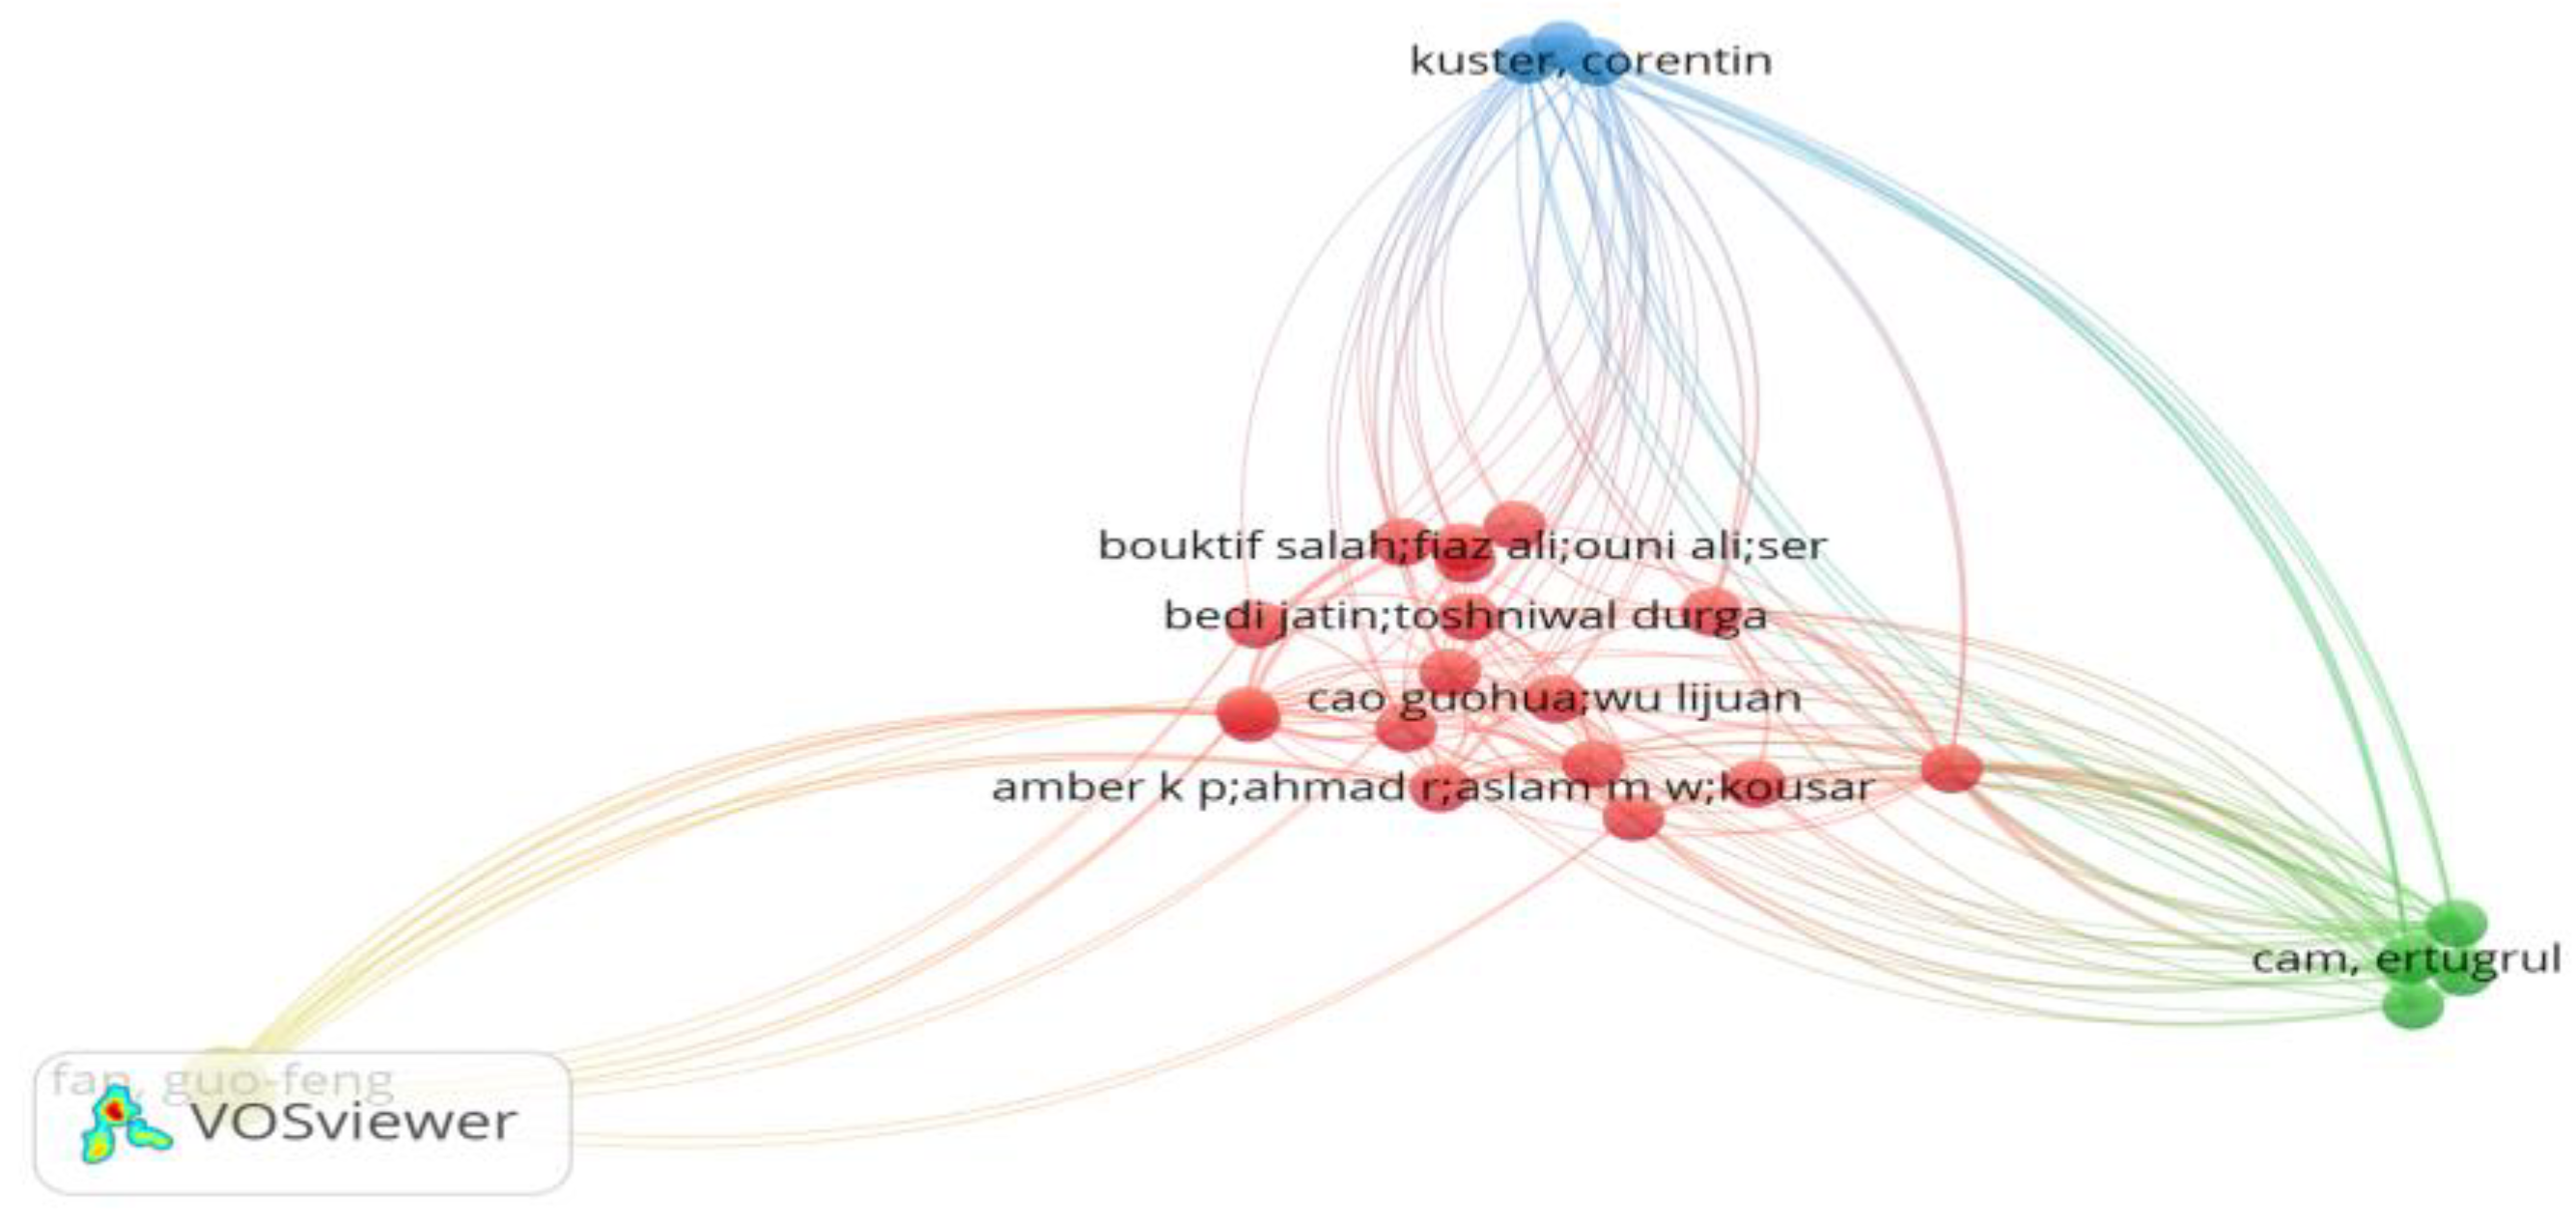
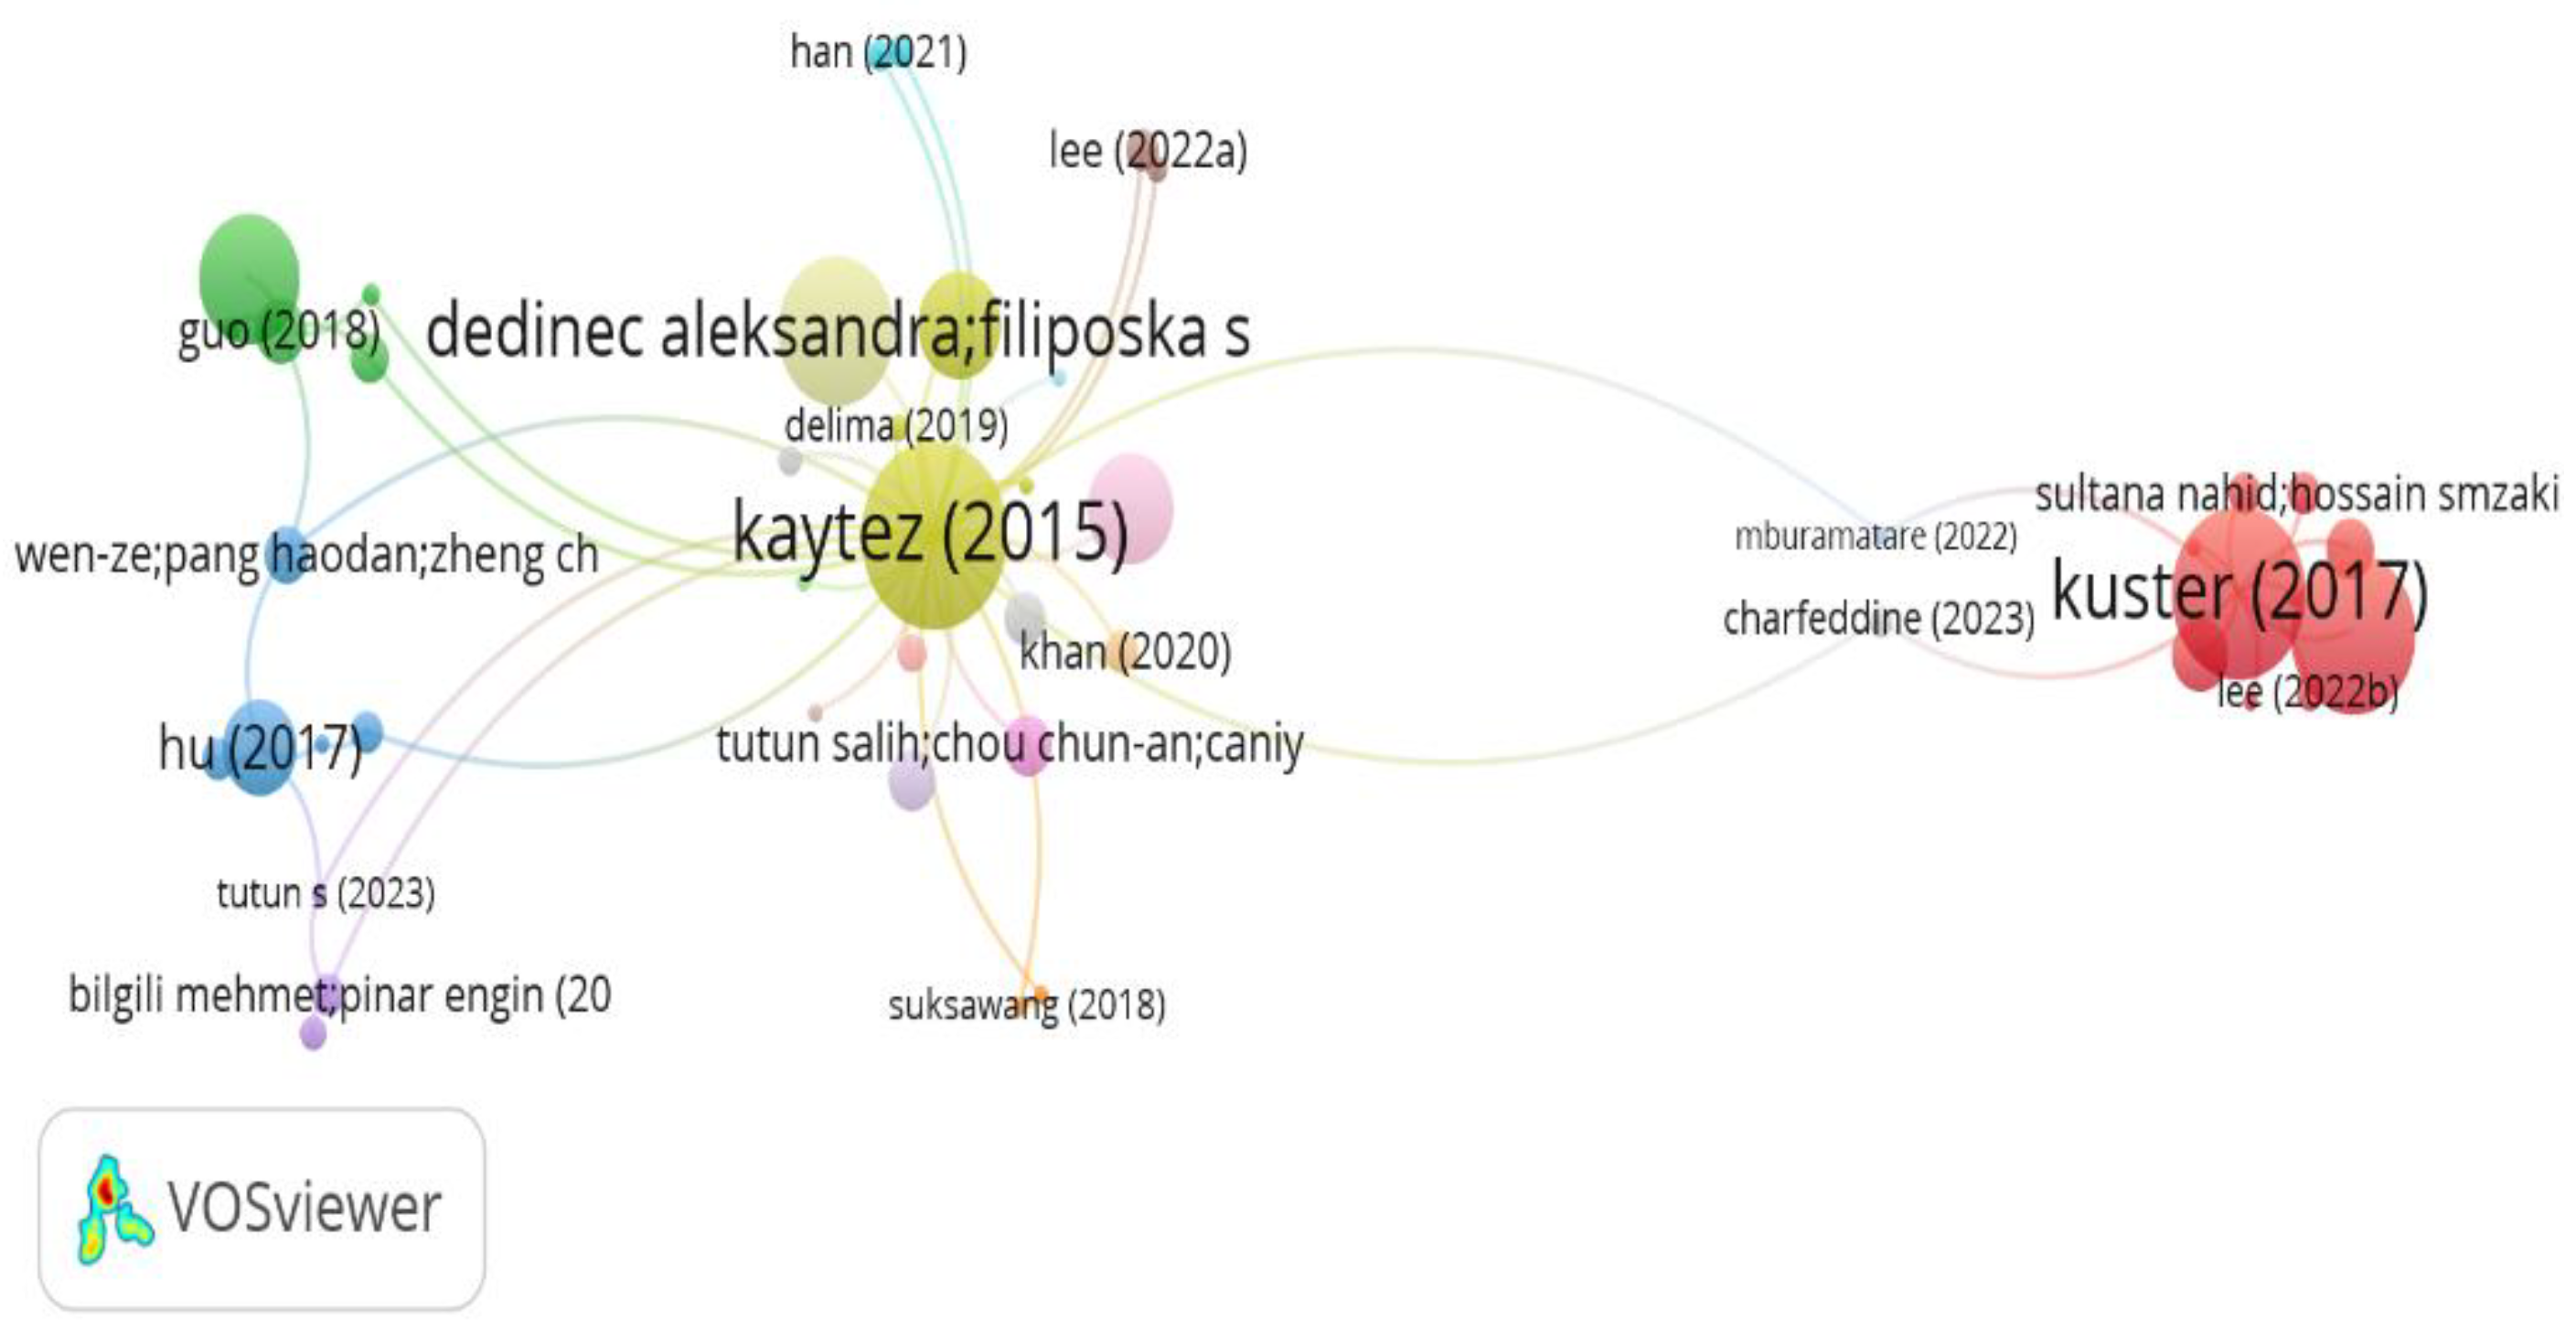
Figure A3, the study also analyzed the Network visualization map of documents and citations for countries. At least one document with a minimum of 10 citations was selected from 46 countries, and the results found that 24 documents are strongly connected across the countries. Similarly, Figure 4. depicts the visualization of citations and authors; in this analysis, the study selected at least 1 document and 40 citations. The results show that nine authors are connected.
In
Figure A5, the study analyzed the connection between countries by taking at least 1 document and ten citations, and the results showed that 24 countries are strongly associated with each other.
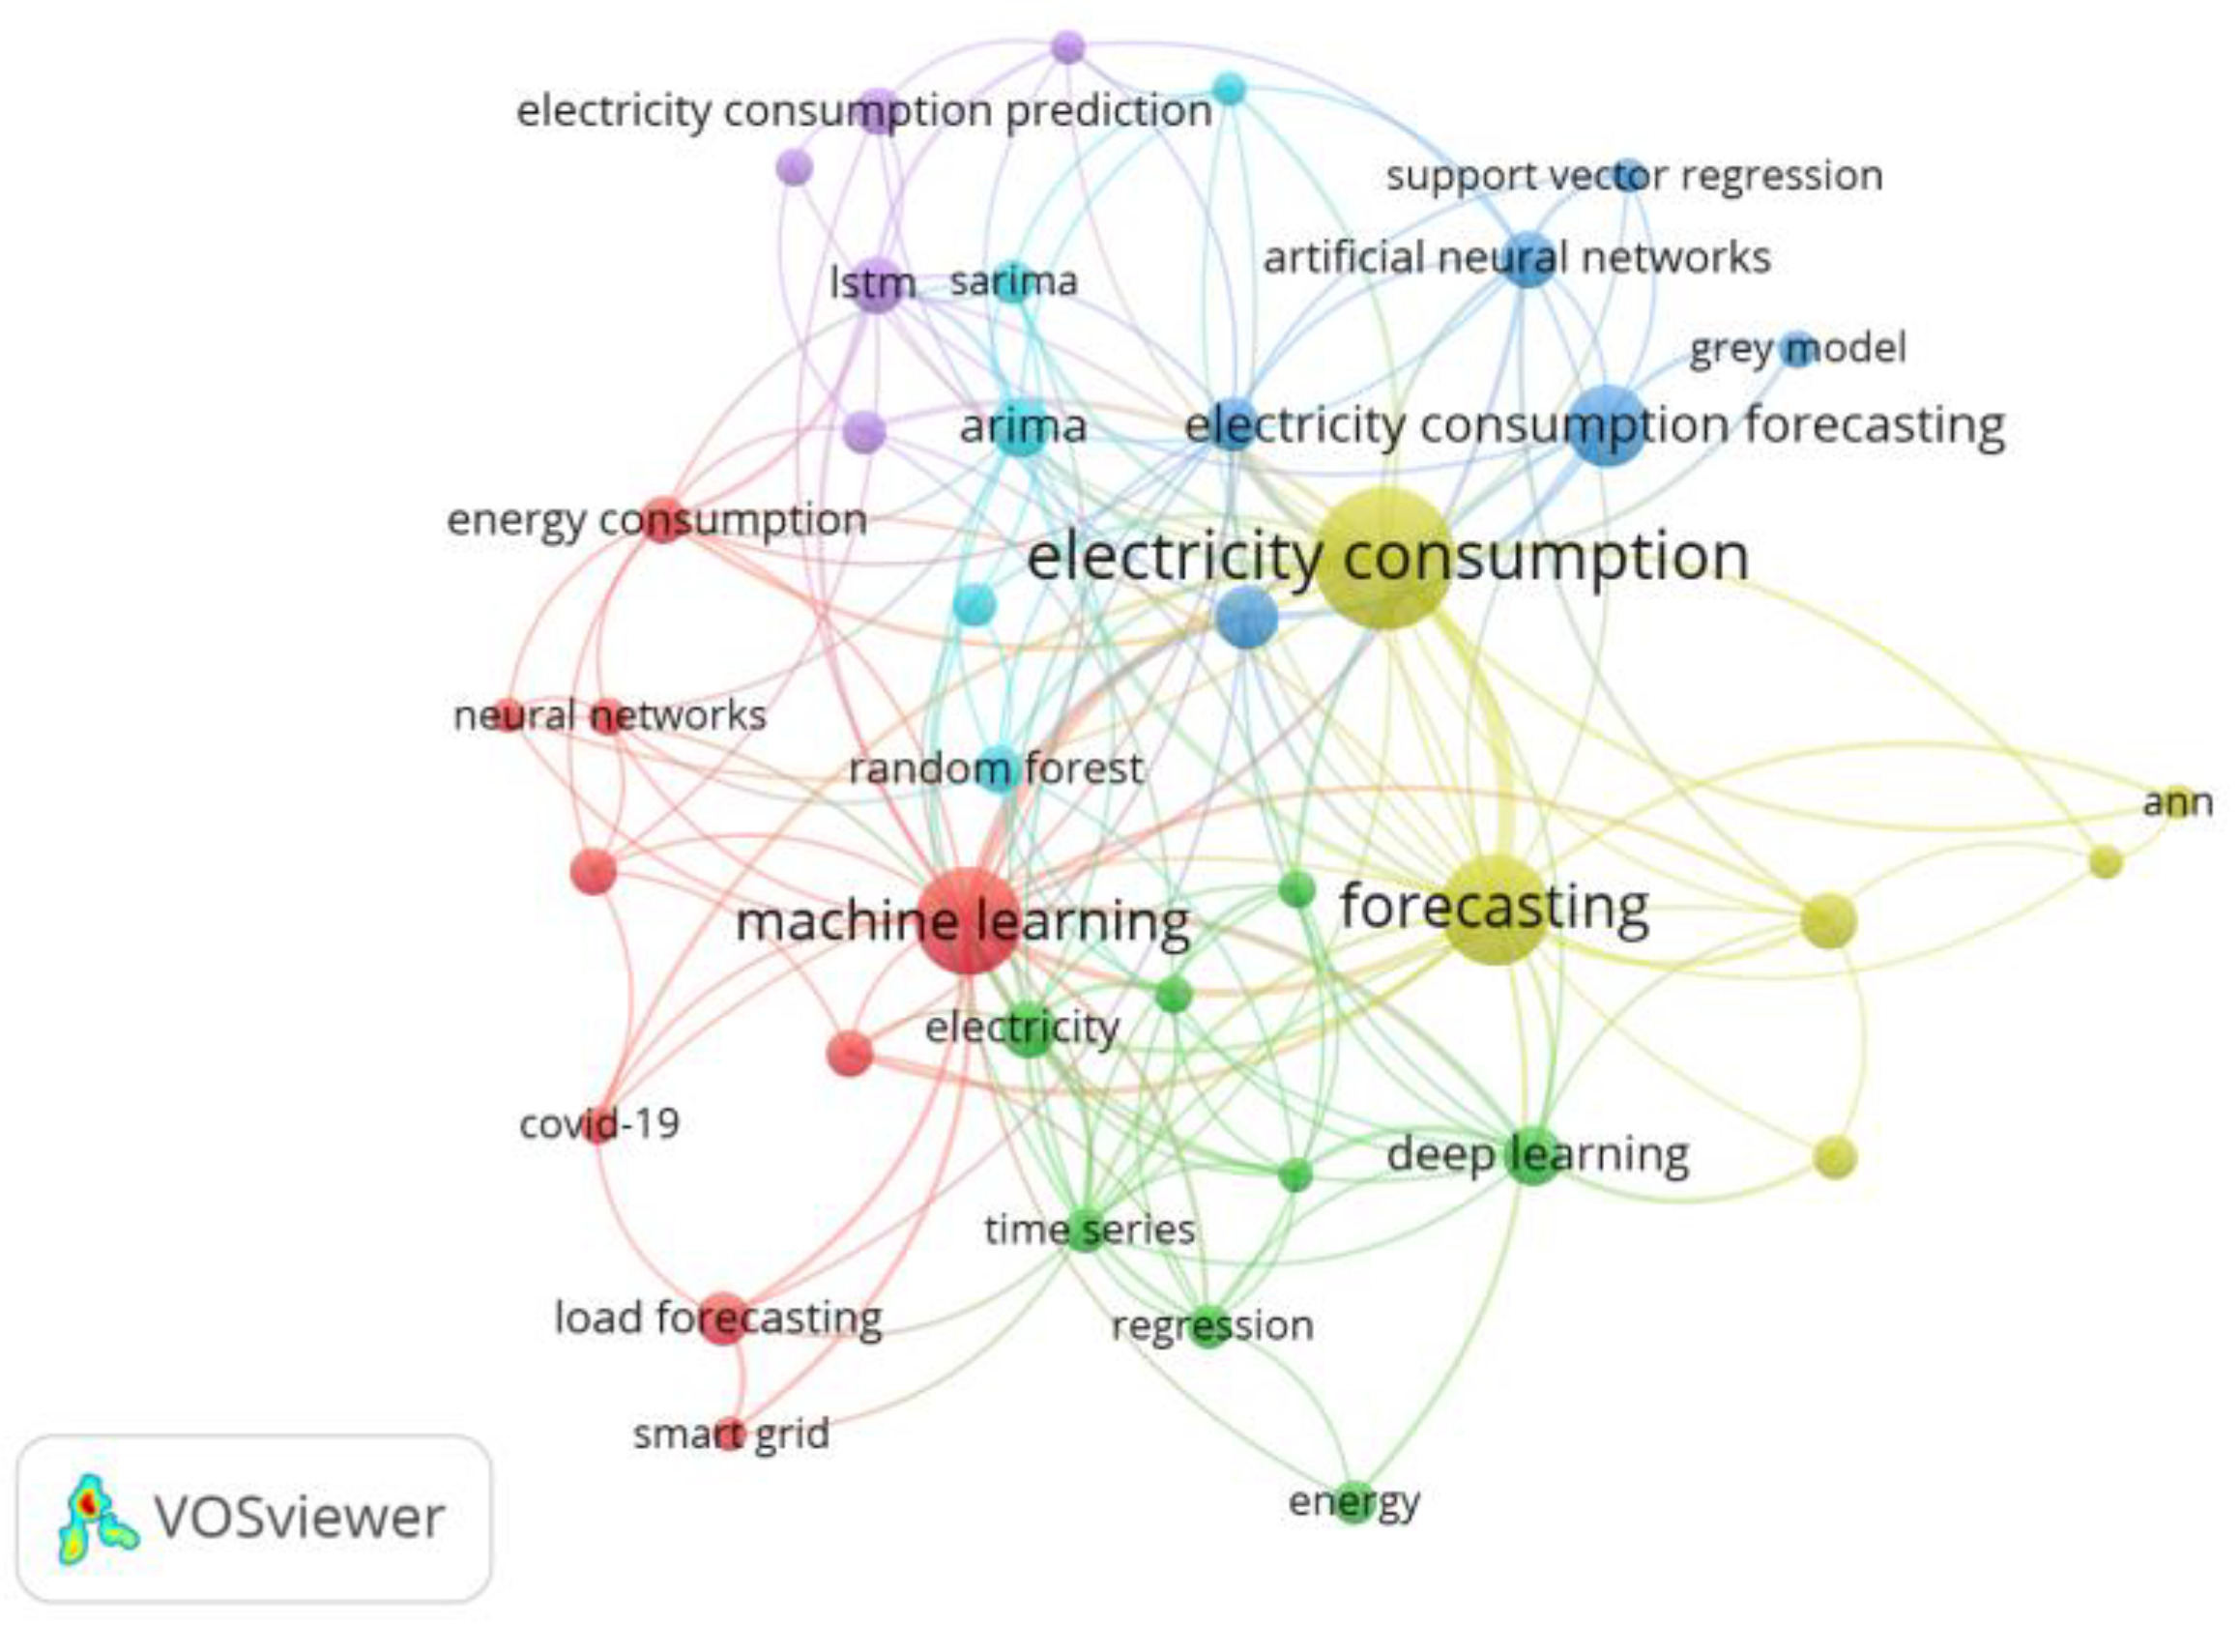
Figure A6 shows the network visualization of authors' keyword occurrences. The study selected at least three keyword occurrences in this analysis, and the results show 39 occurrences. Similarly,
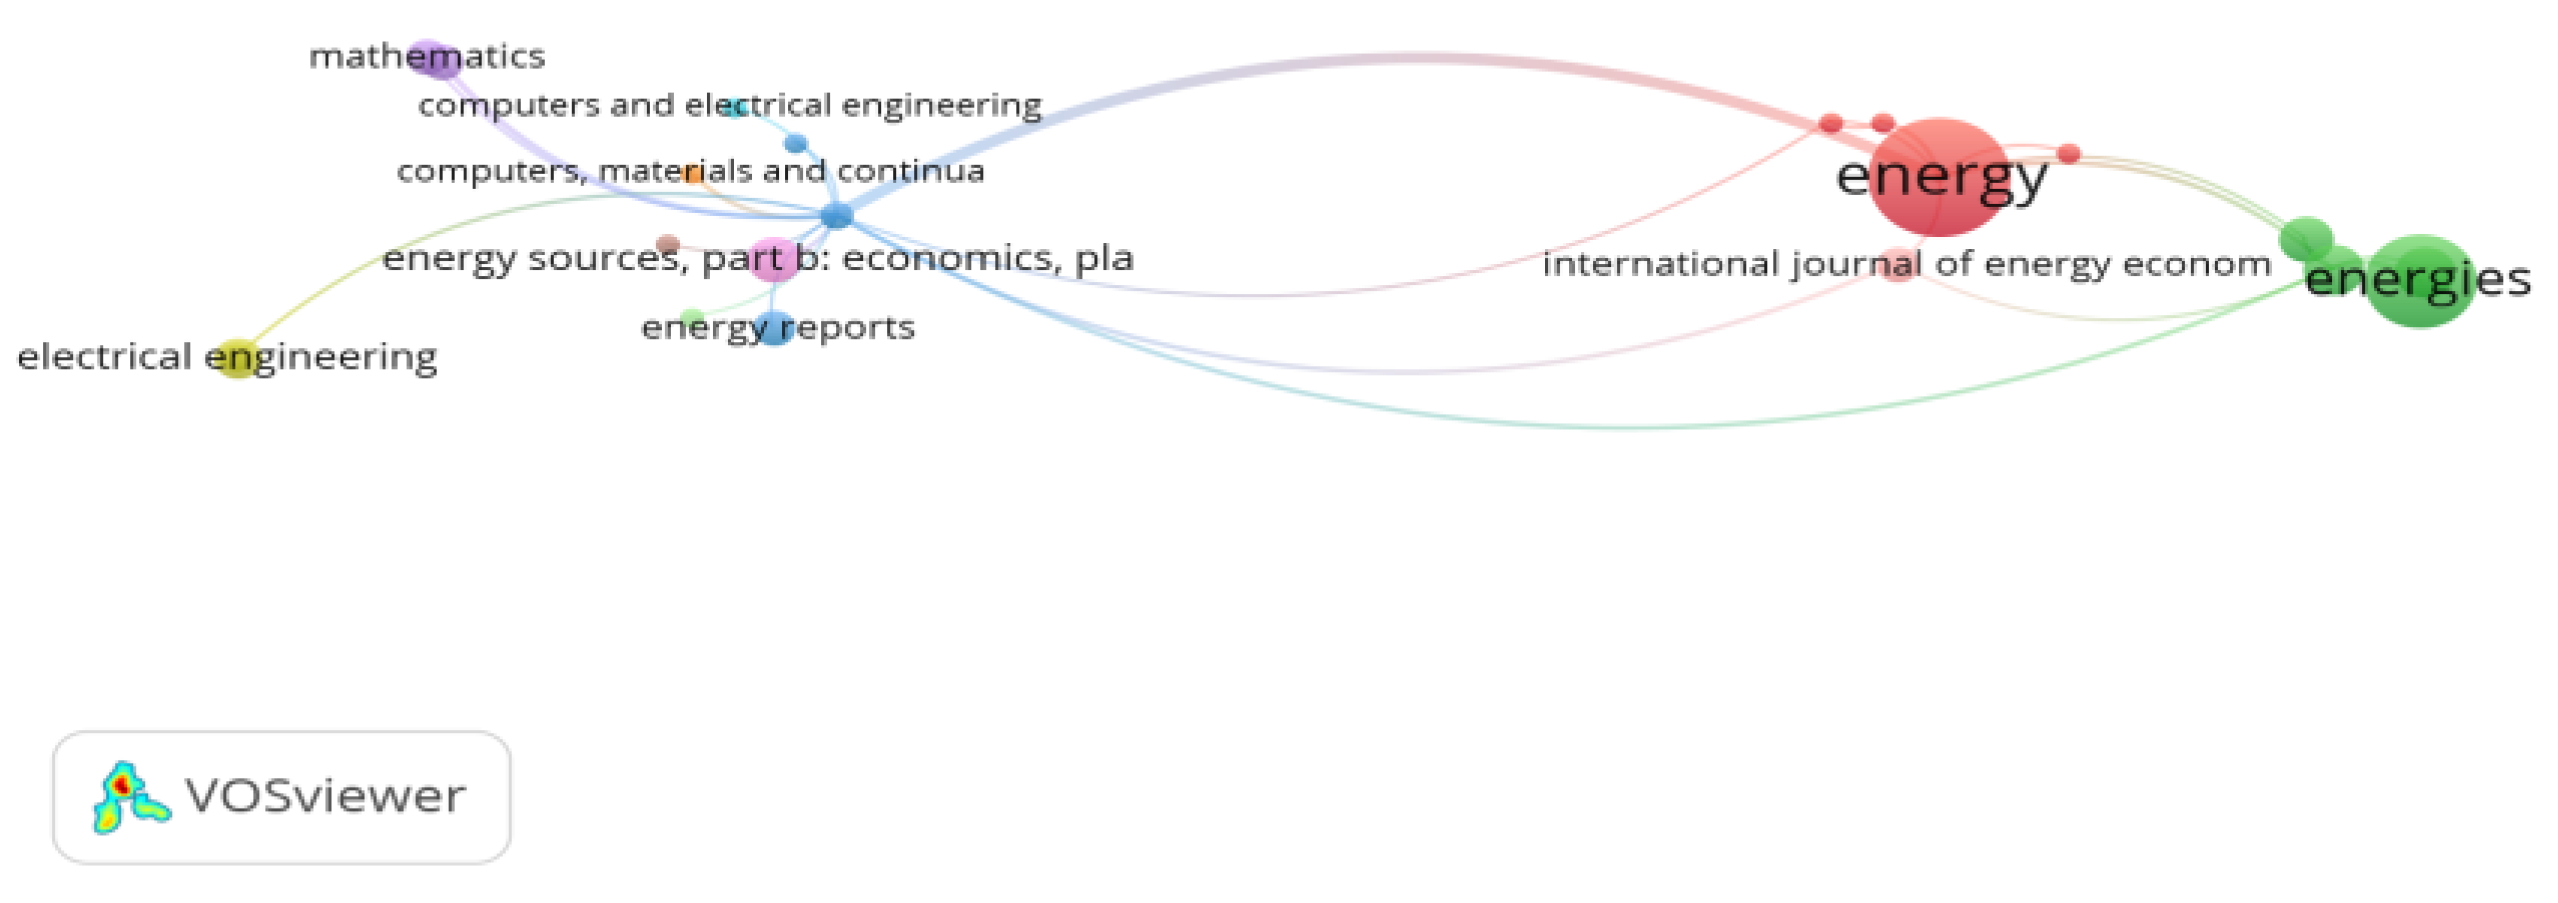
Figure A7 depicts the association of publication sources by choosing at least 1 document and five citations. The findings show that 21 sources of document publication are connected. The
Figure A8. It shows the bibliographic coupling, and the study selected at least one document and 120 citations, and the results depict that 26 authors are strongly connected.
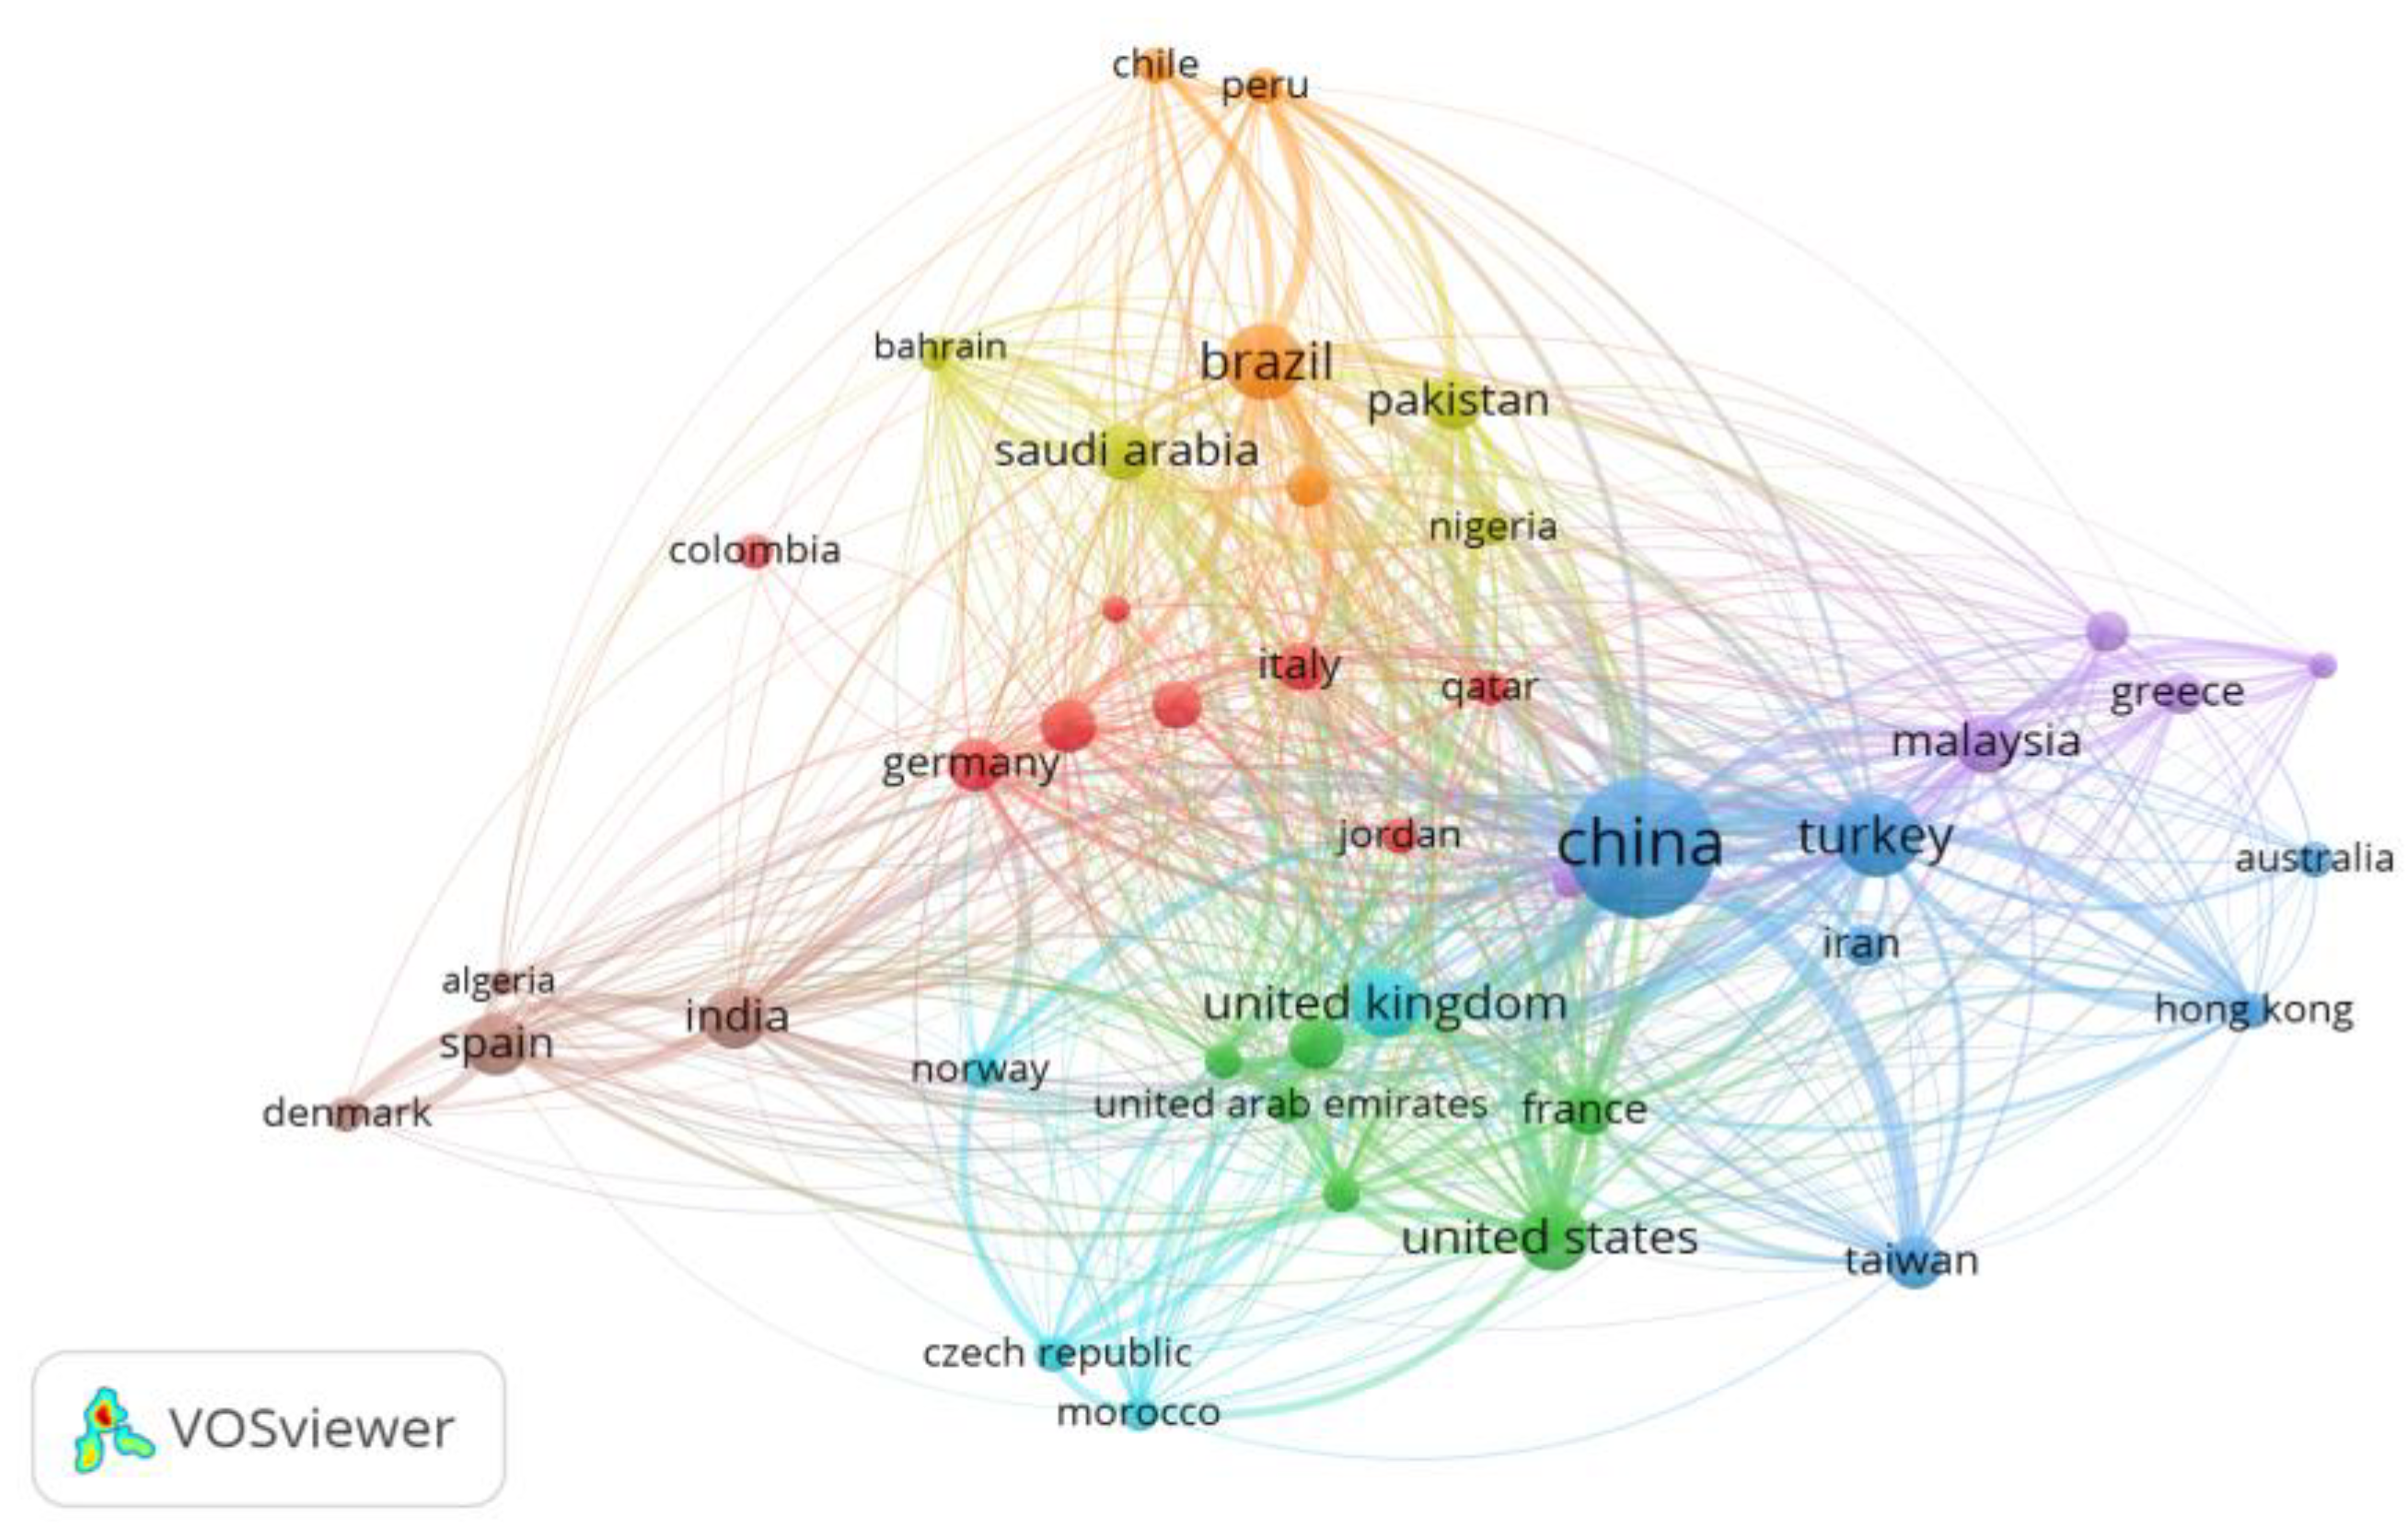
Figure A9 shows the bibliographic coupling for countries. The study selected at least one document and ten citations, and the results depict that 42 countries are strongly connected.
Figure A10 depicts the authors whose documents are highly cited.
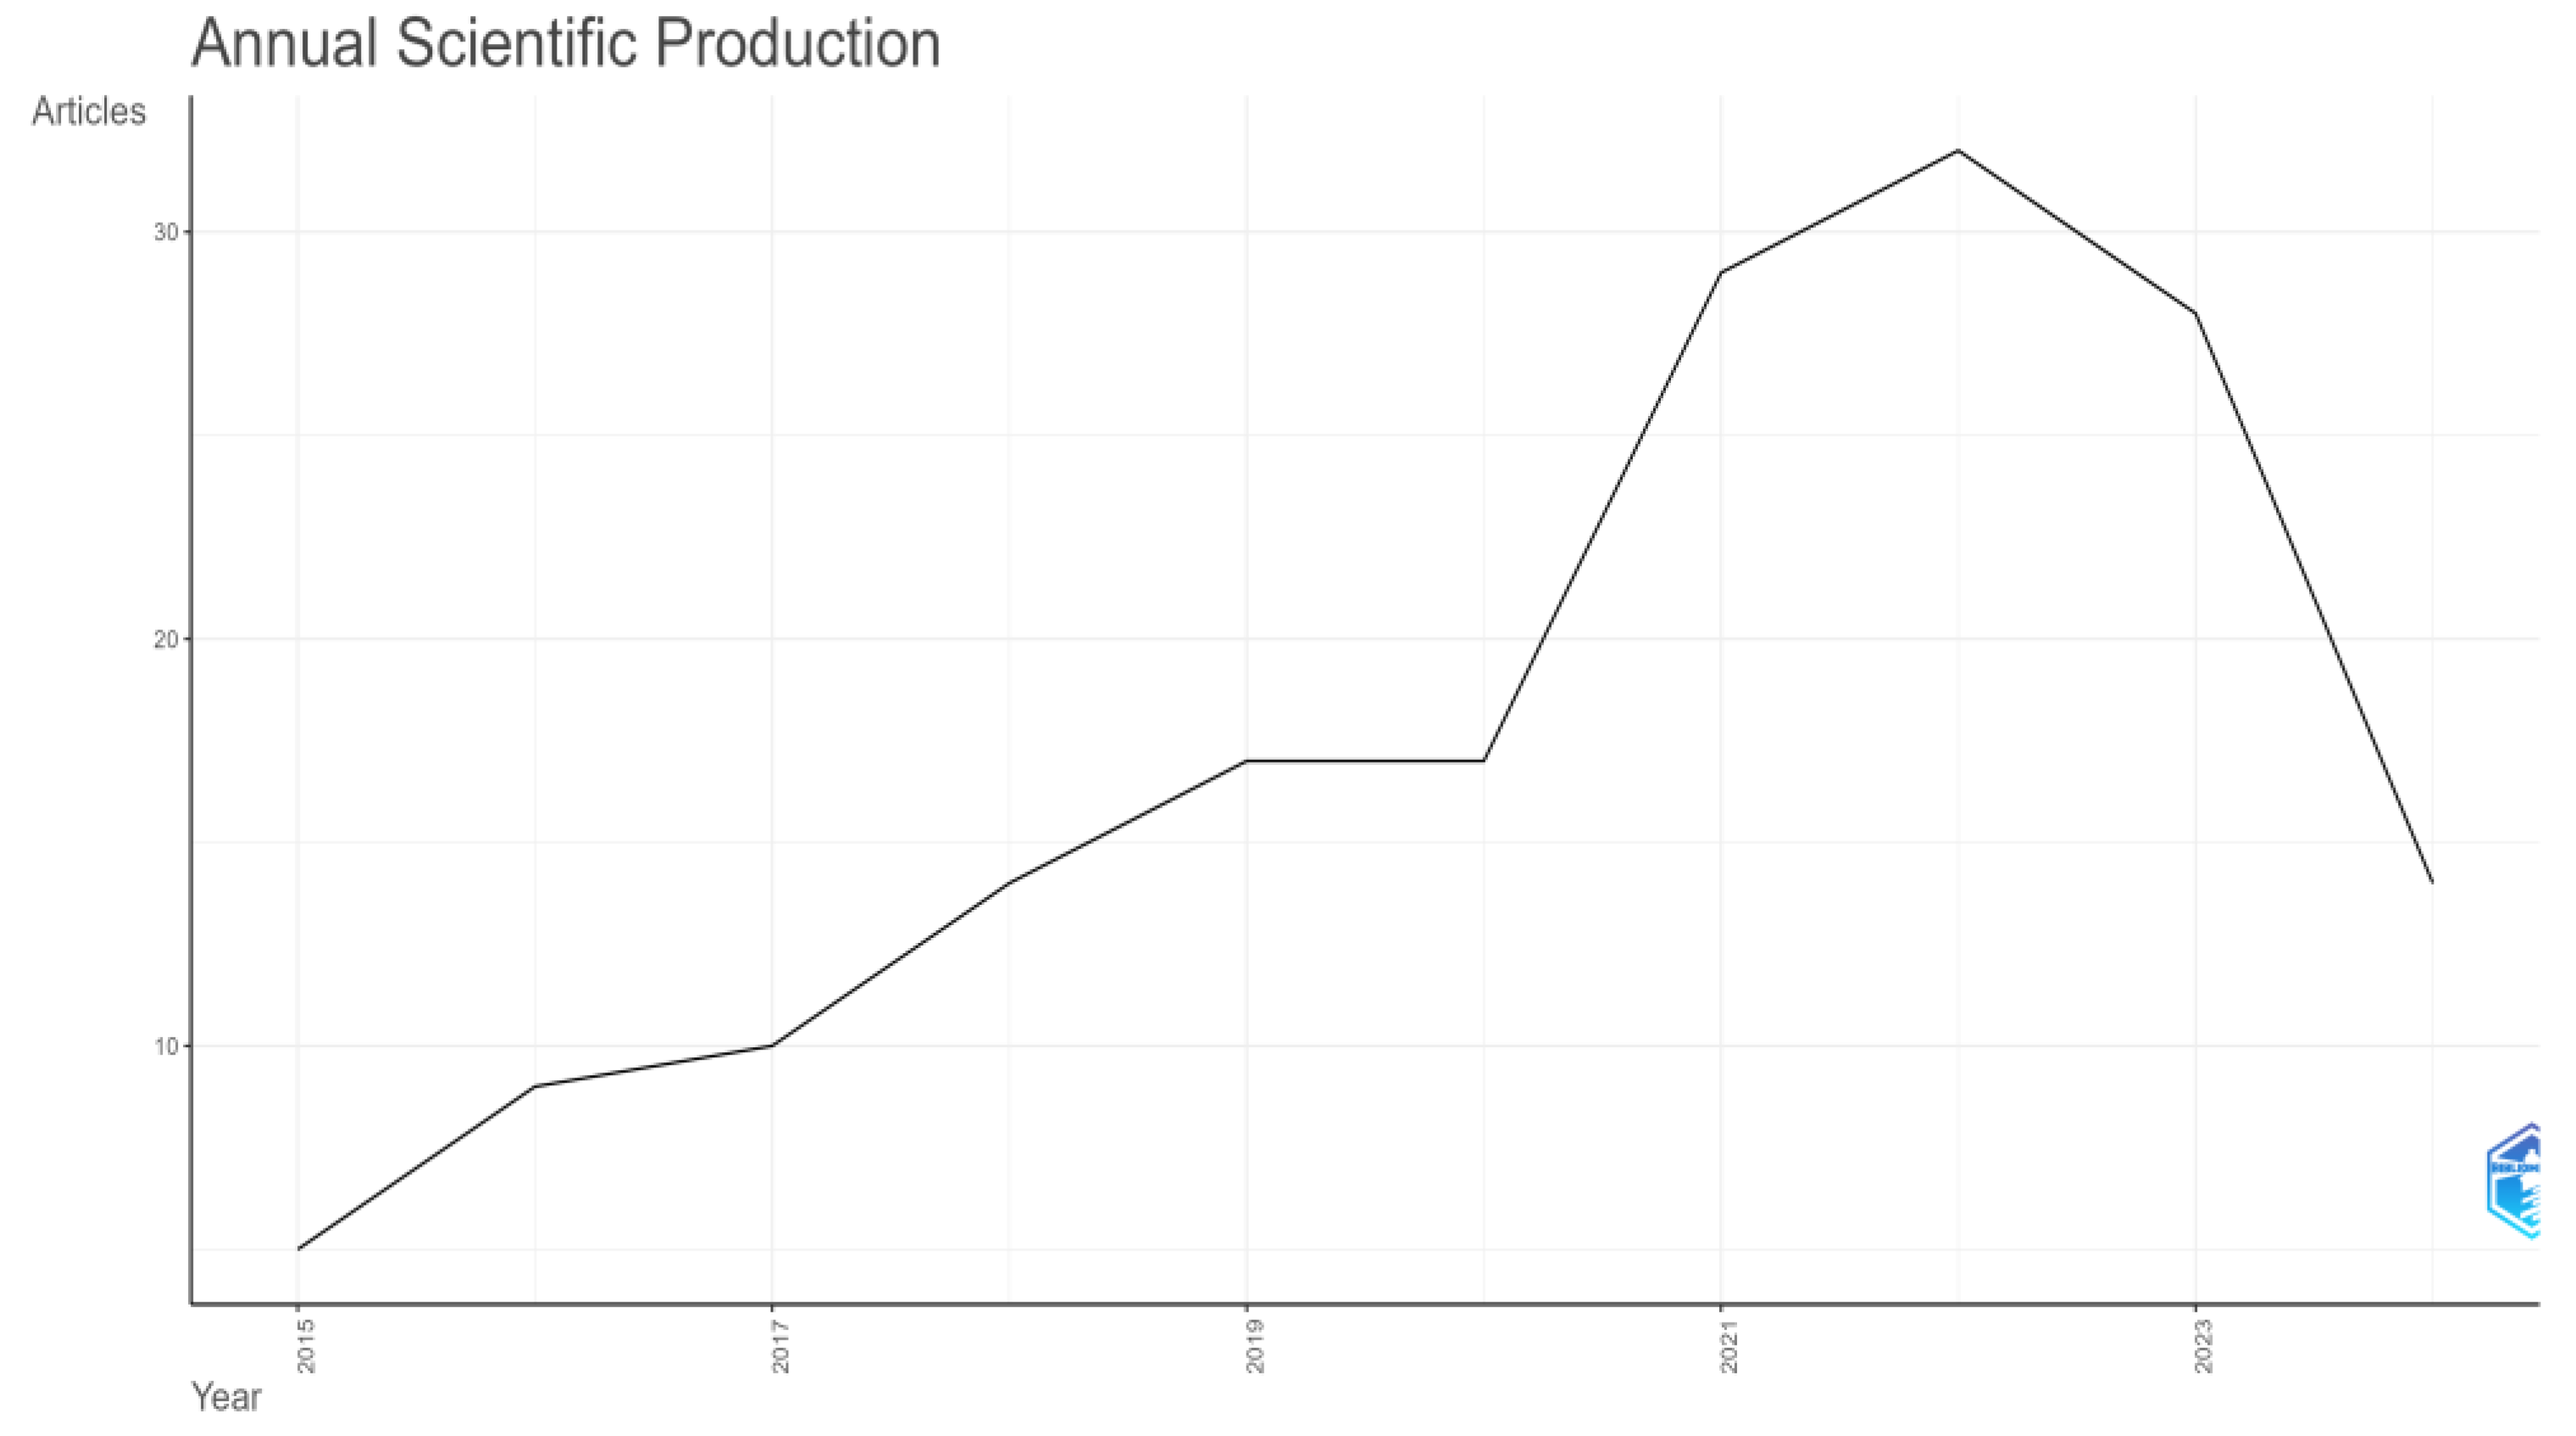
Figure A11 presents the number of scientific articles produced annually from 2015 to 2024. After an initial steady growth, there is a sharp increase starting in 2020, leading to peak production in 2022. Subsequently, the number of articles produced decreases substantially.
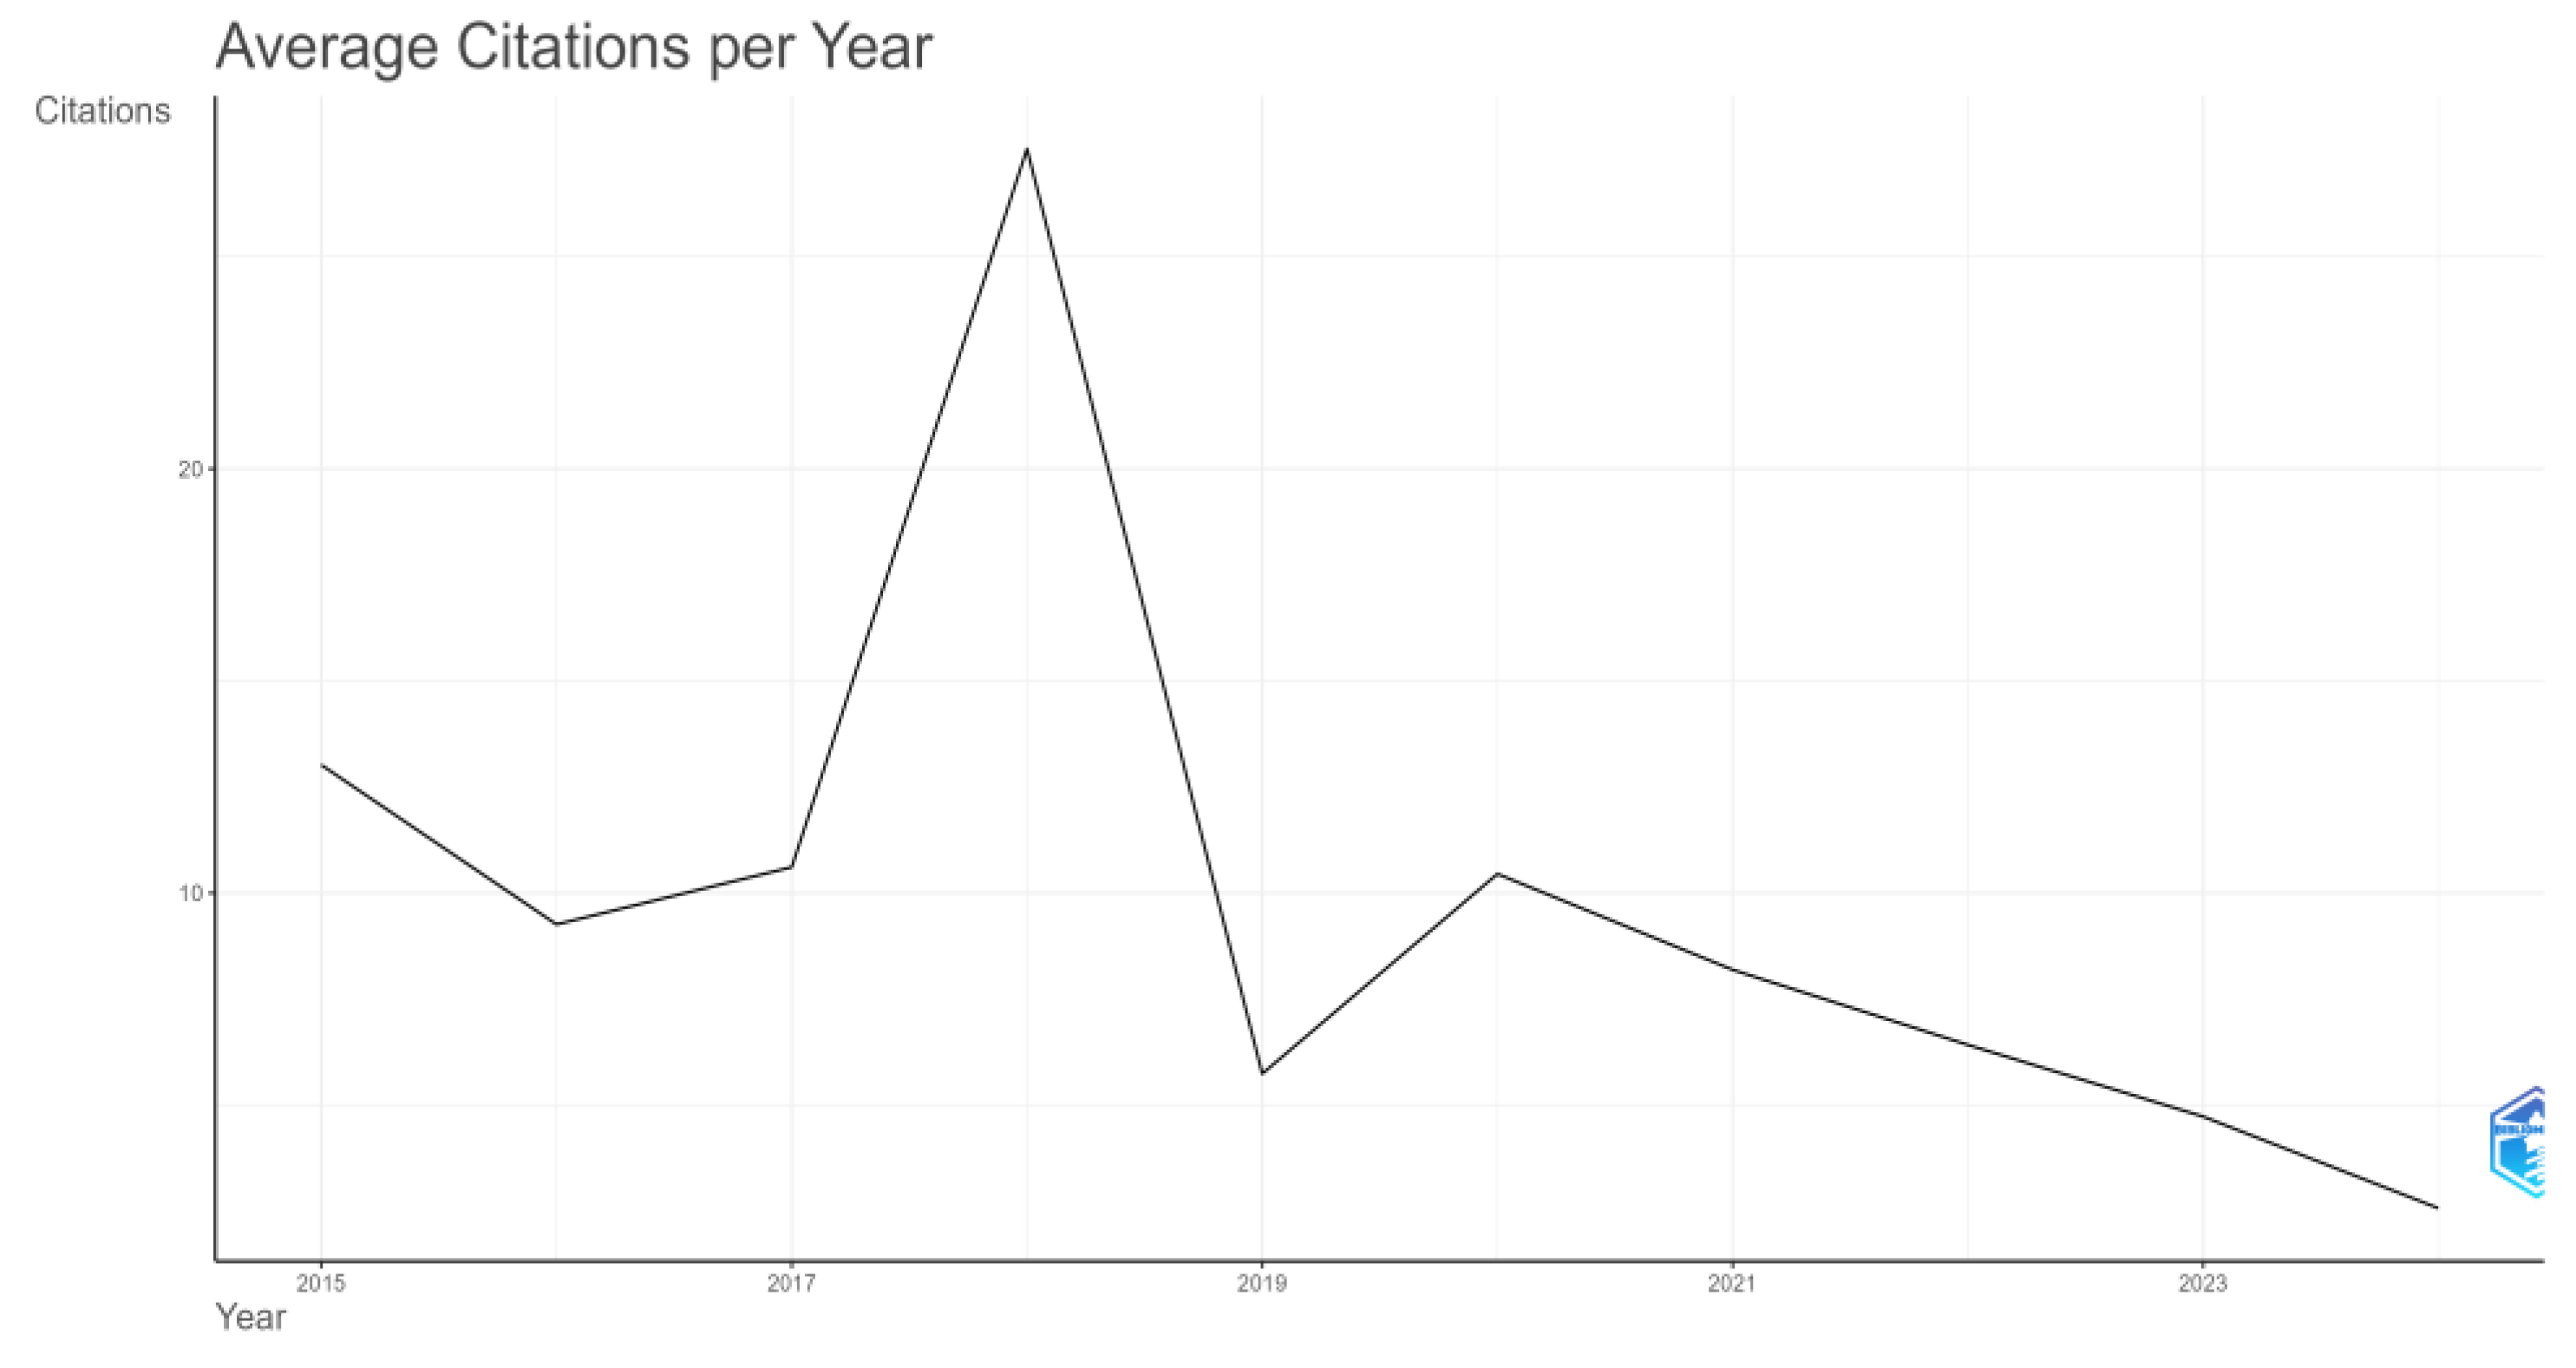
Figure A12 shows the average number of citations per year for scientific articles from 2015 to 2023. One can note a notable peak in average citations in 2017, followed by a substantial drop and a continued decline in the following years.
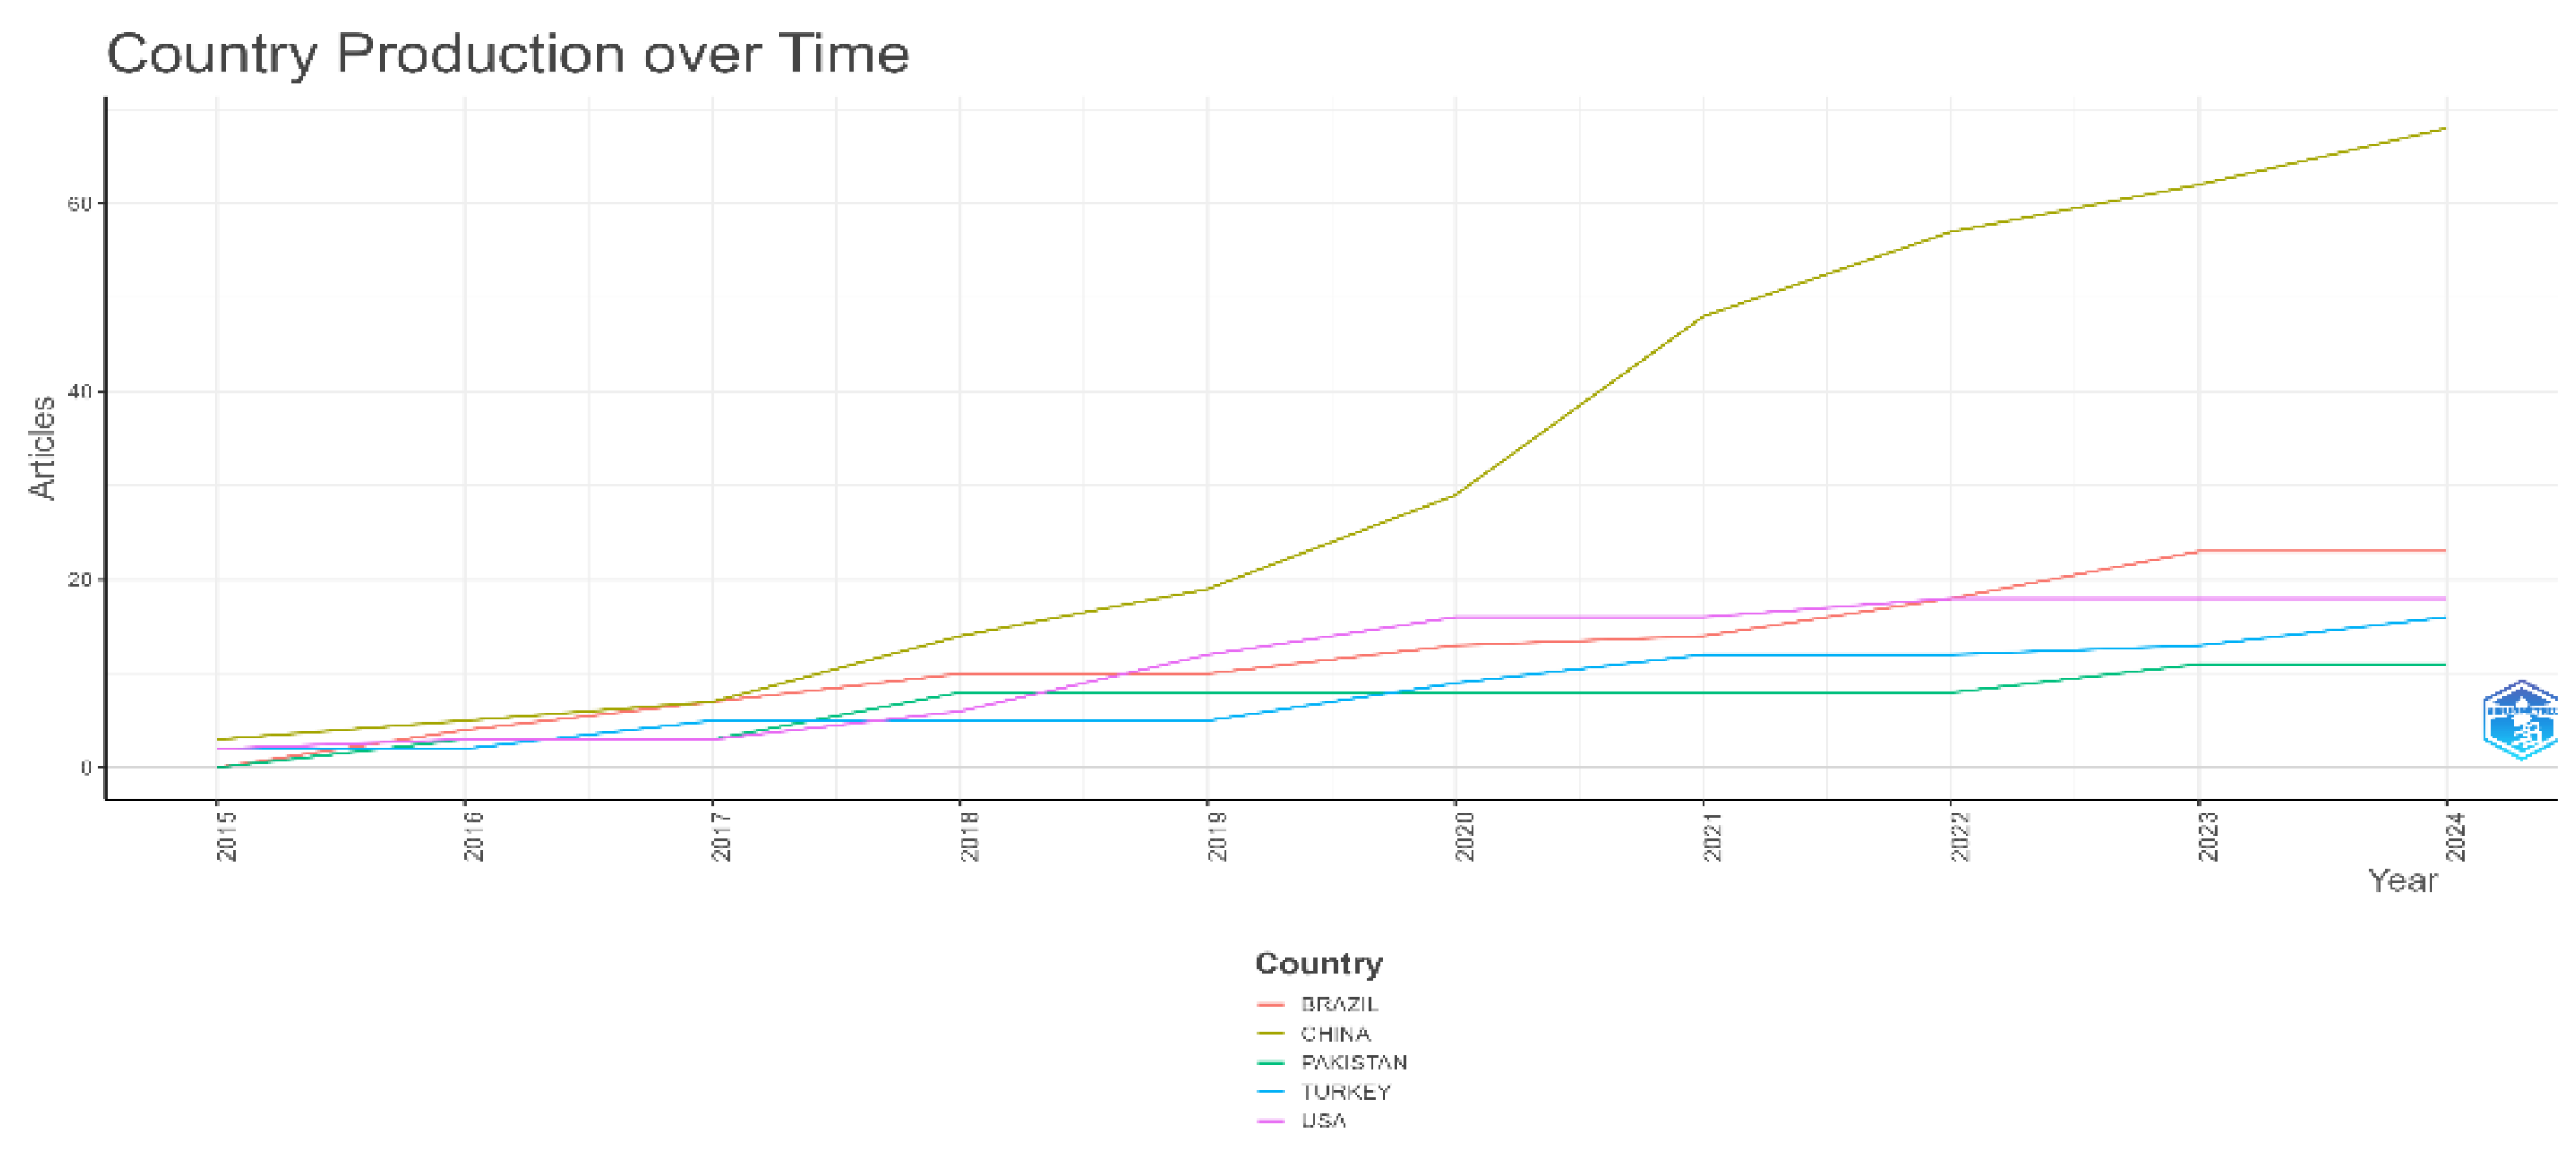
Figure A13 shows the number of articles produced by various countries from 2015 to 2024. China has demonstrated a significant increase in article production over the years, especially after 2020, reaching the highest count among all the countries by 2024. Brazil and the USA have a steady increase in article production but at a slower rate compared to China. Turkey and Pakistan have relatively lower and more stable production rates, with minor increases over the observed period.
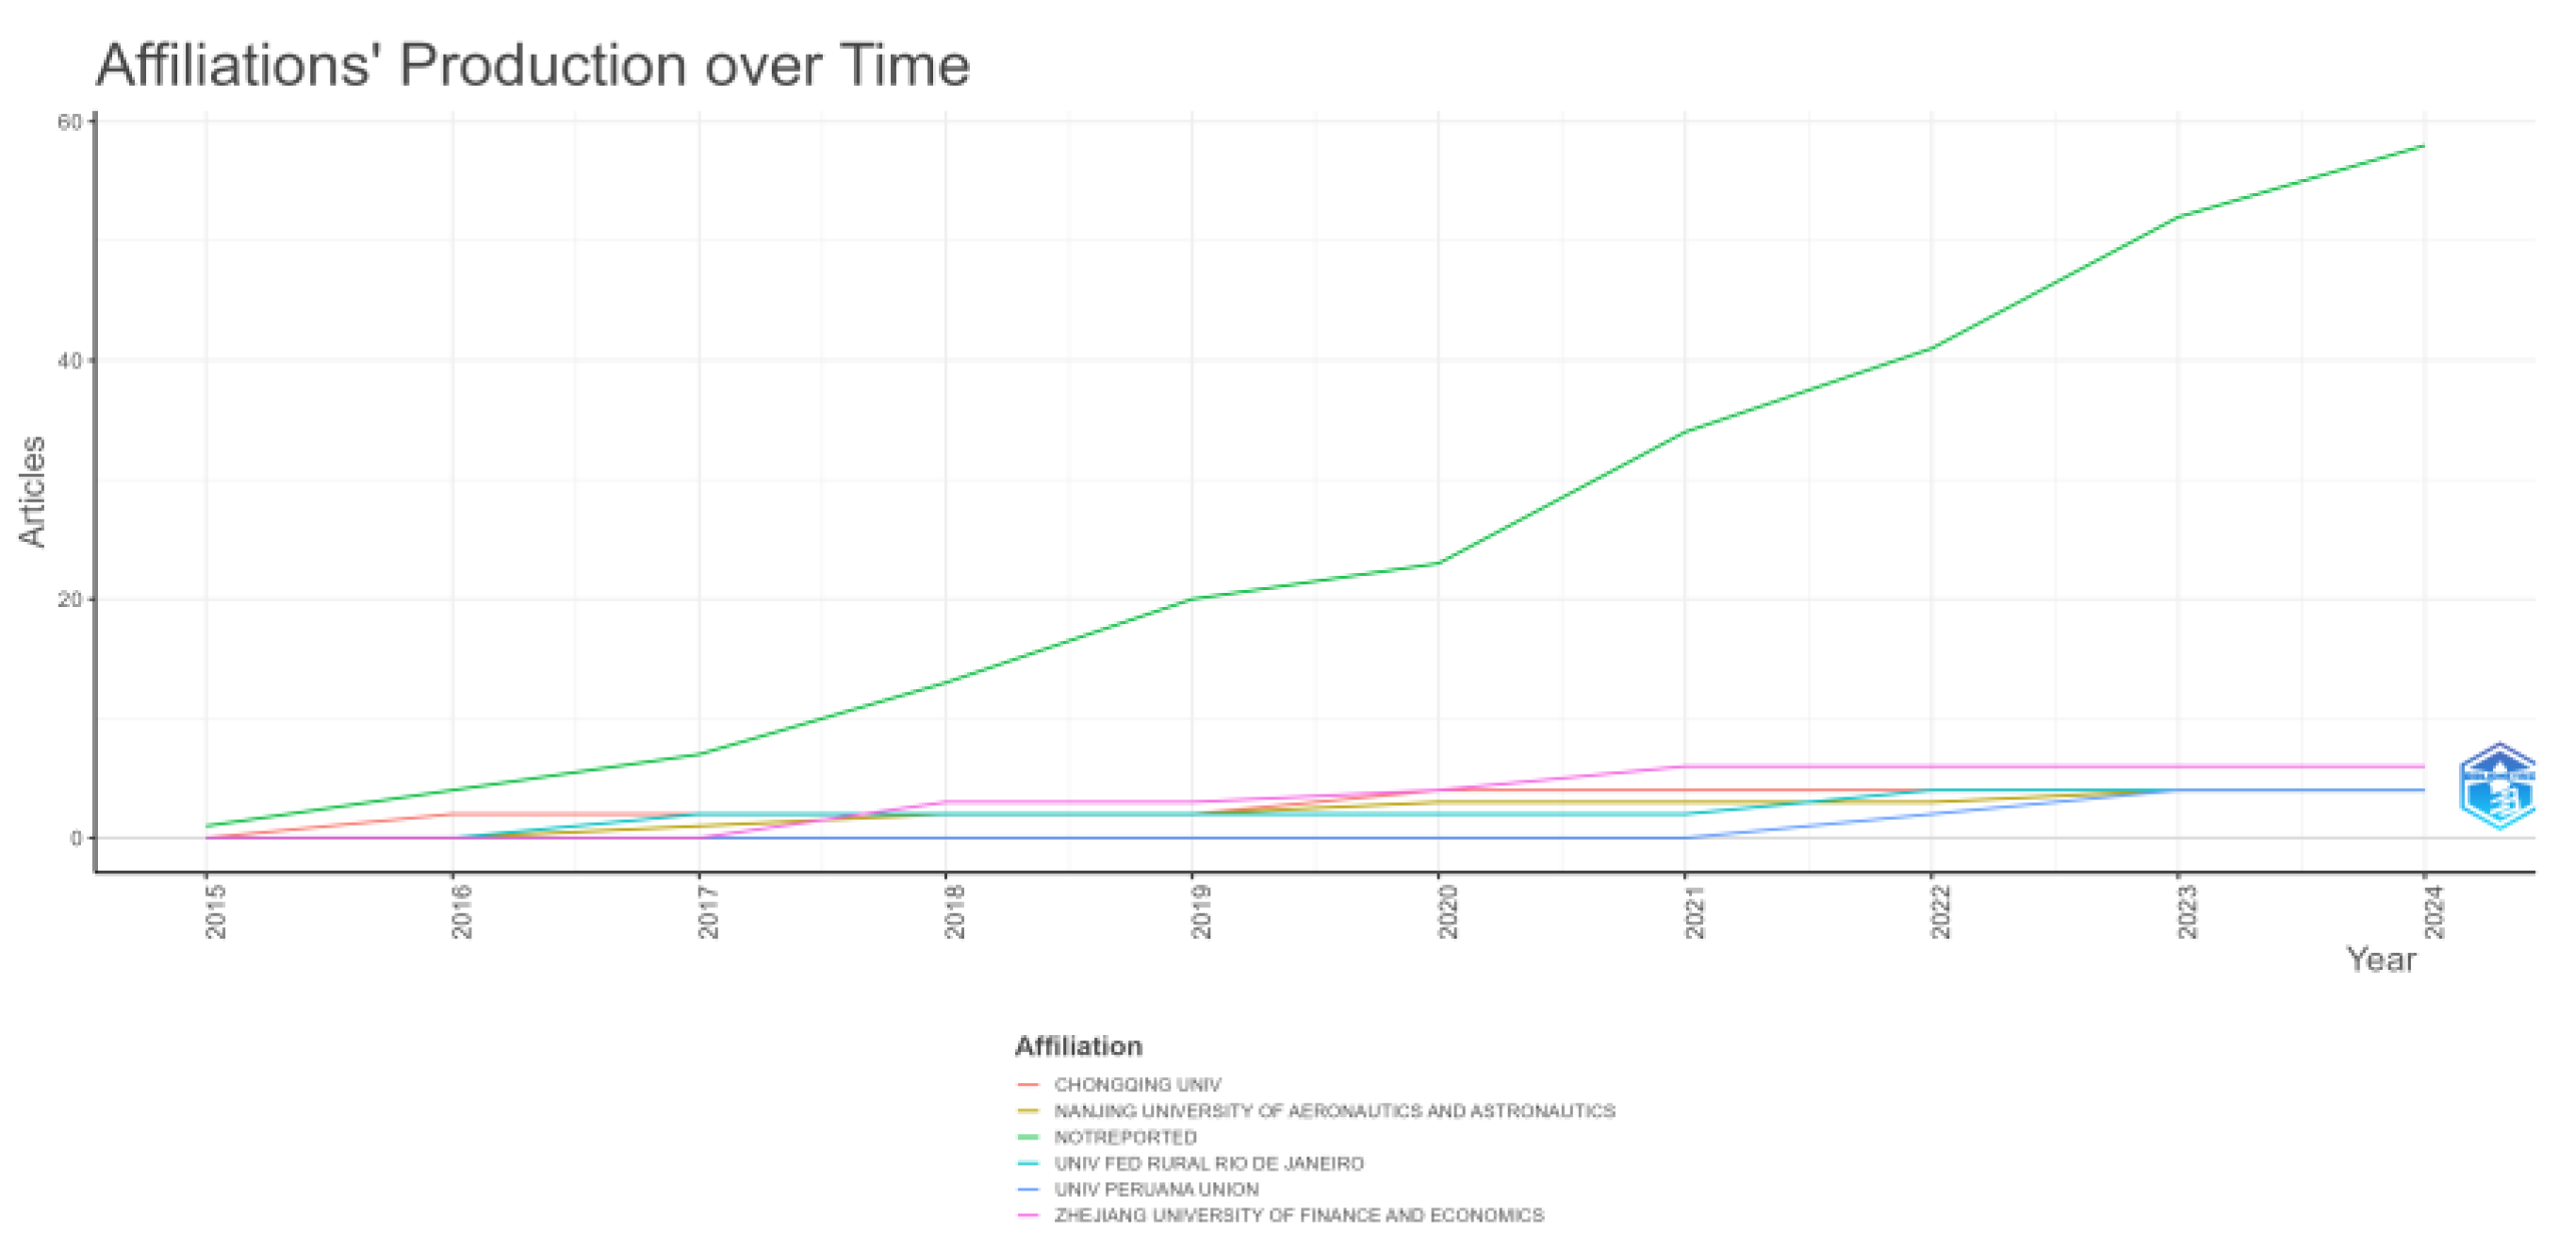
Figure A14 depicts the number of articles produced by various academic affiliations from 2015 to 2024. The top 6 affiliations included in the figure are Chongqing University, Nanjing University of Aeronautics and Astronautics, Northwestern University, Universidade Federal do Rio de Janeiro, Xinyu Petroleum University, and Zhejiang University of Finance and Economics. Chongqing University exhibits the most significant growth in article production, while the other affiliations show more stable and moderate increases.
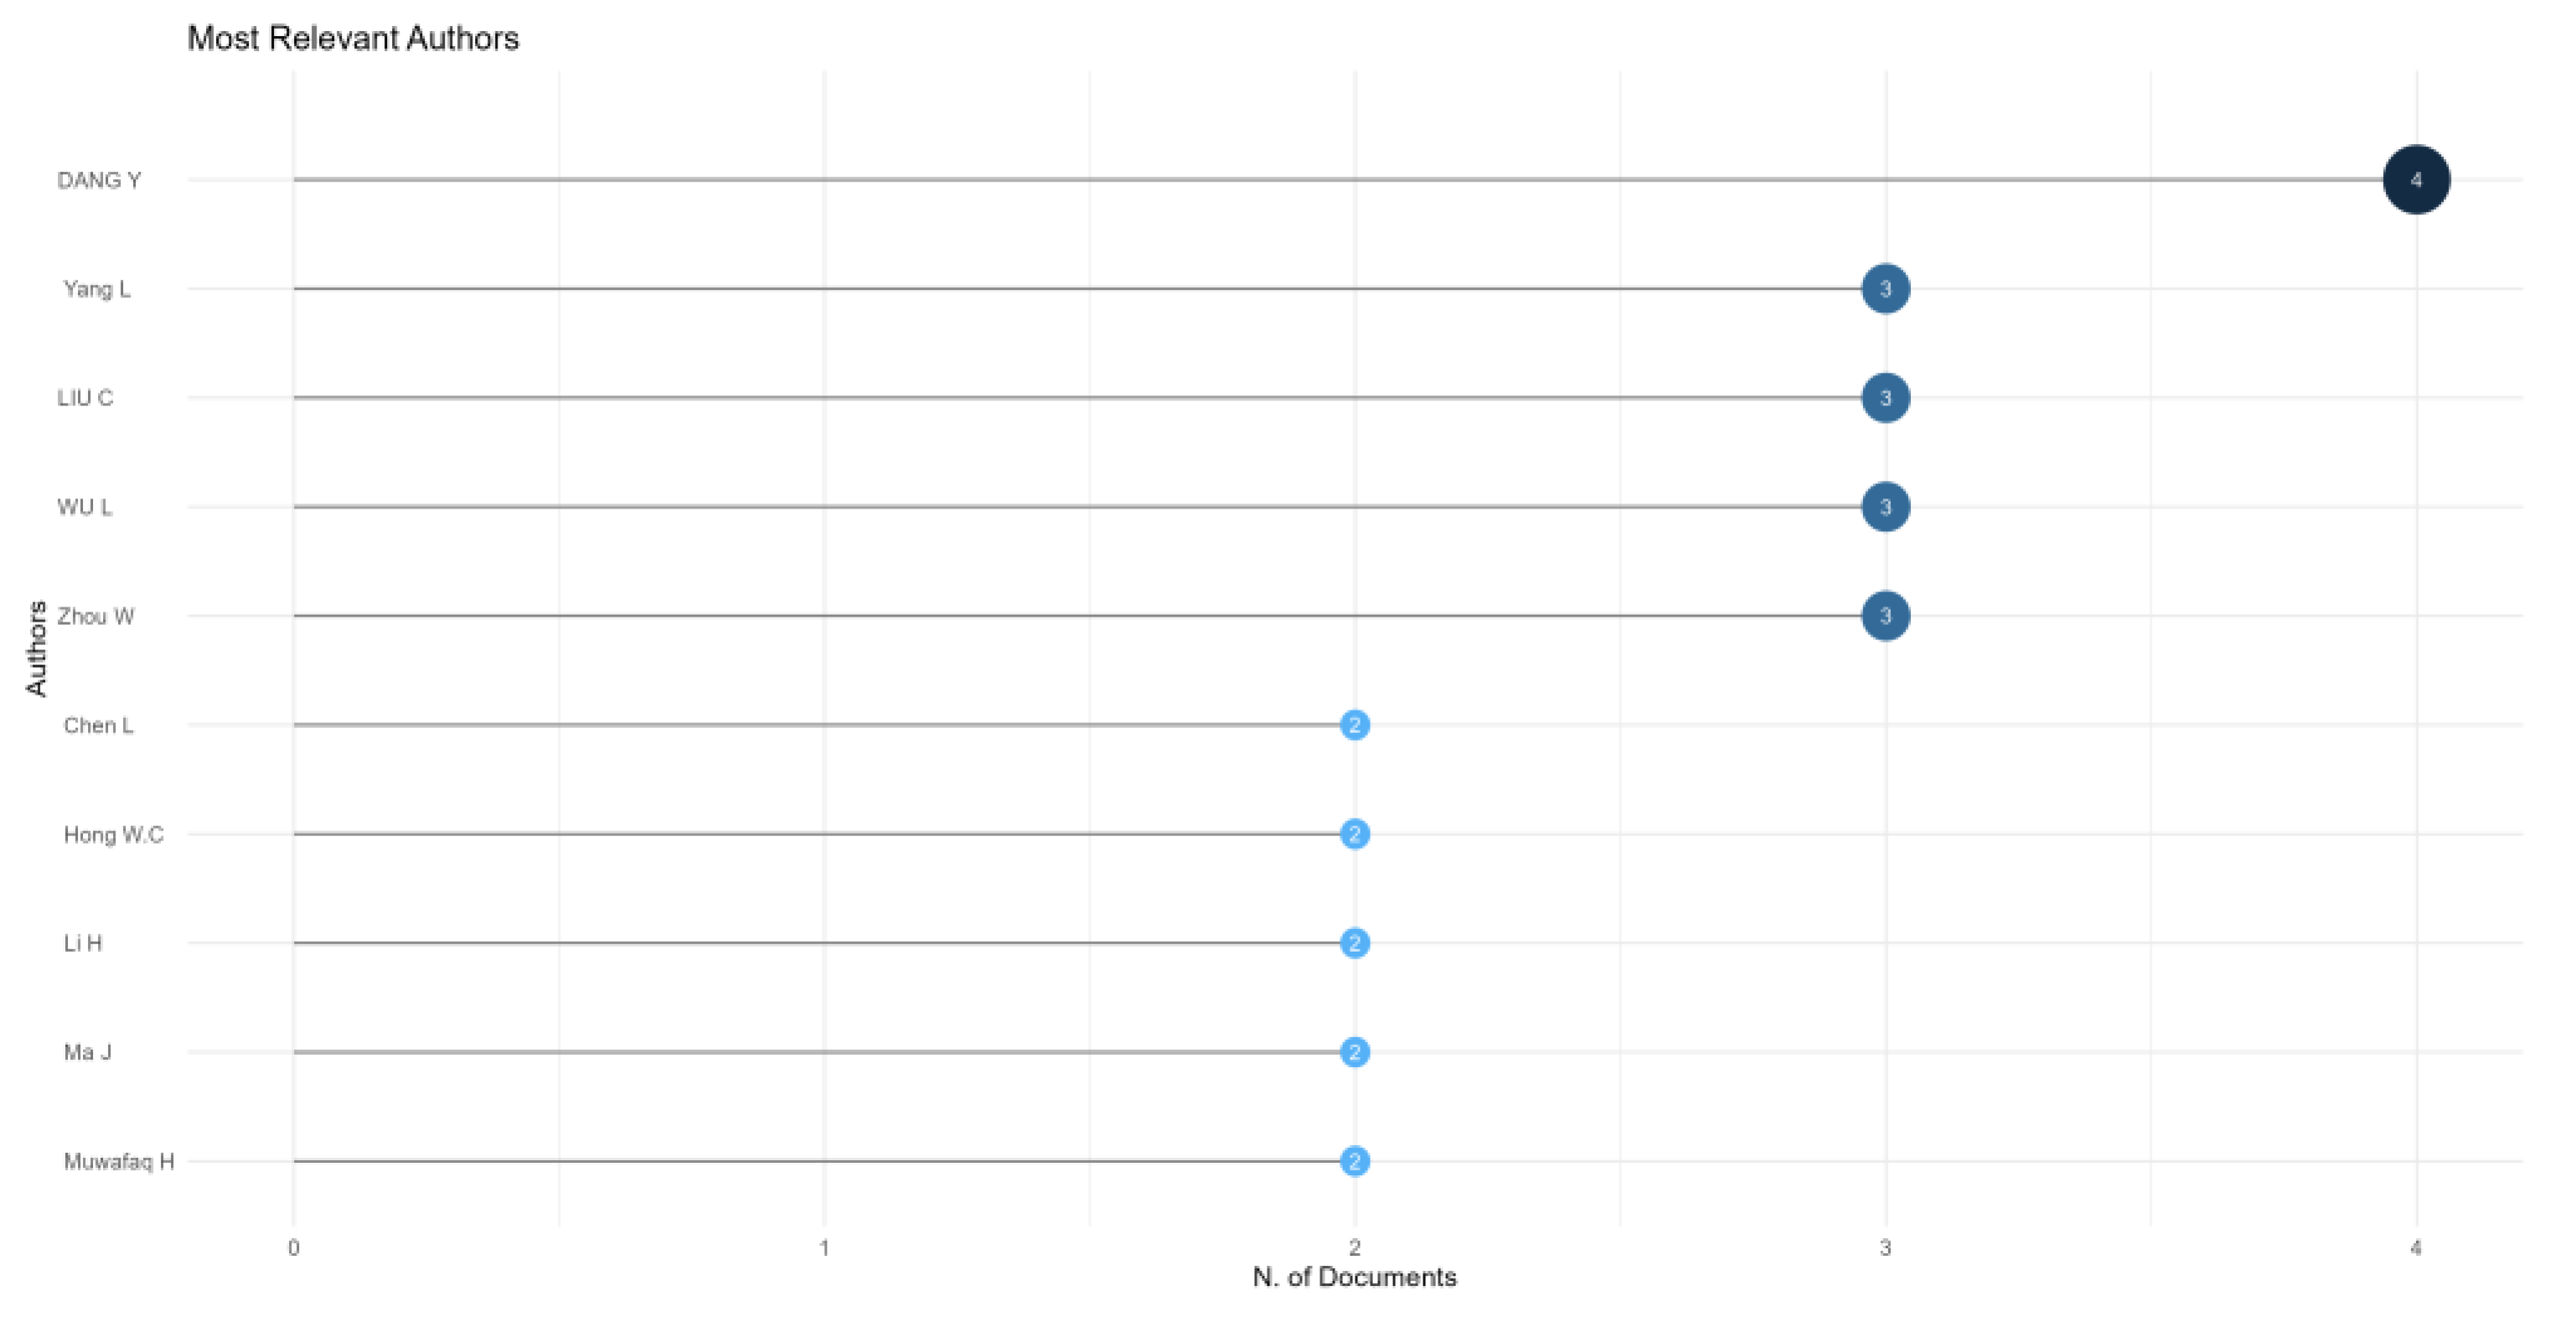
Figure A15 shows the number of documents authored by the most prolific researchers. DANG Y, with a total of 4 articles, stands out as the leading author, followed by four authors with three articles each and five authors with two articles each.
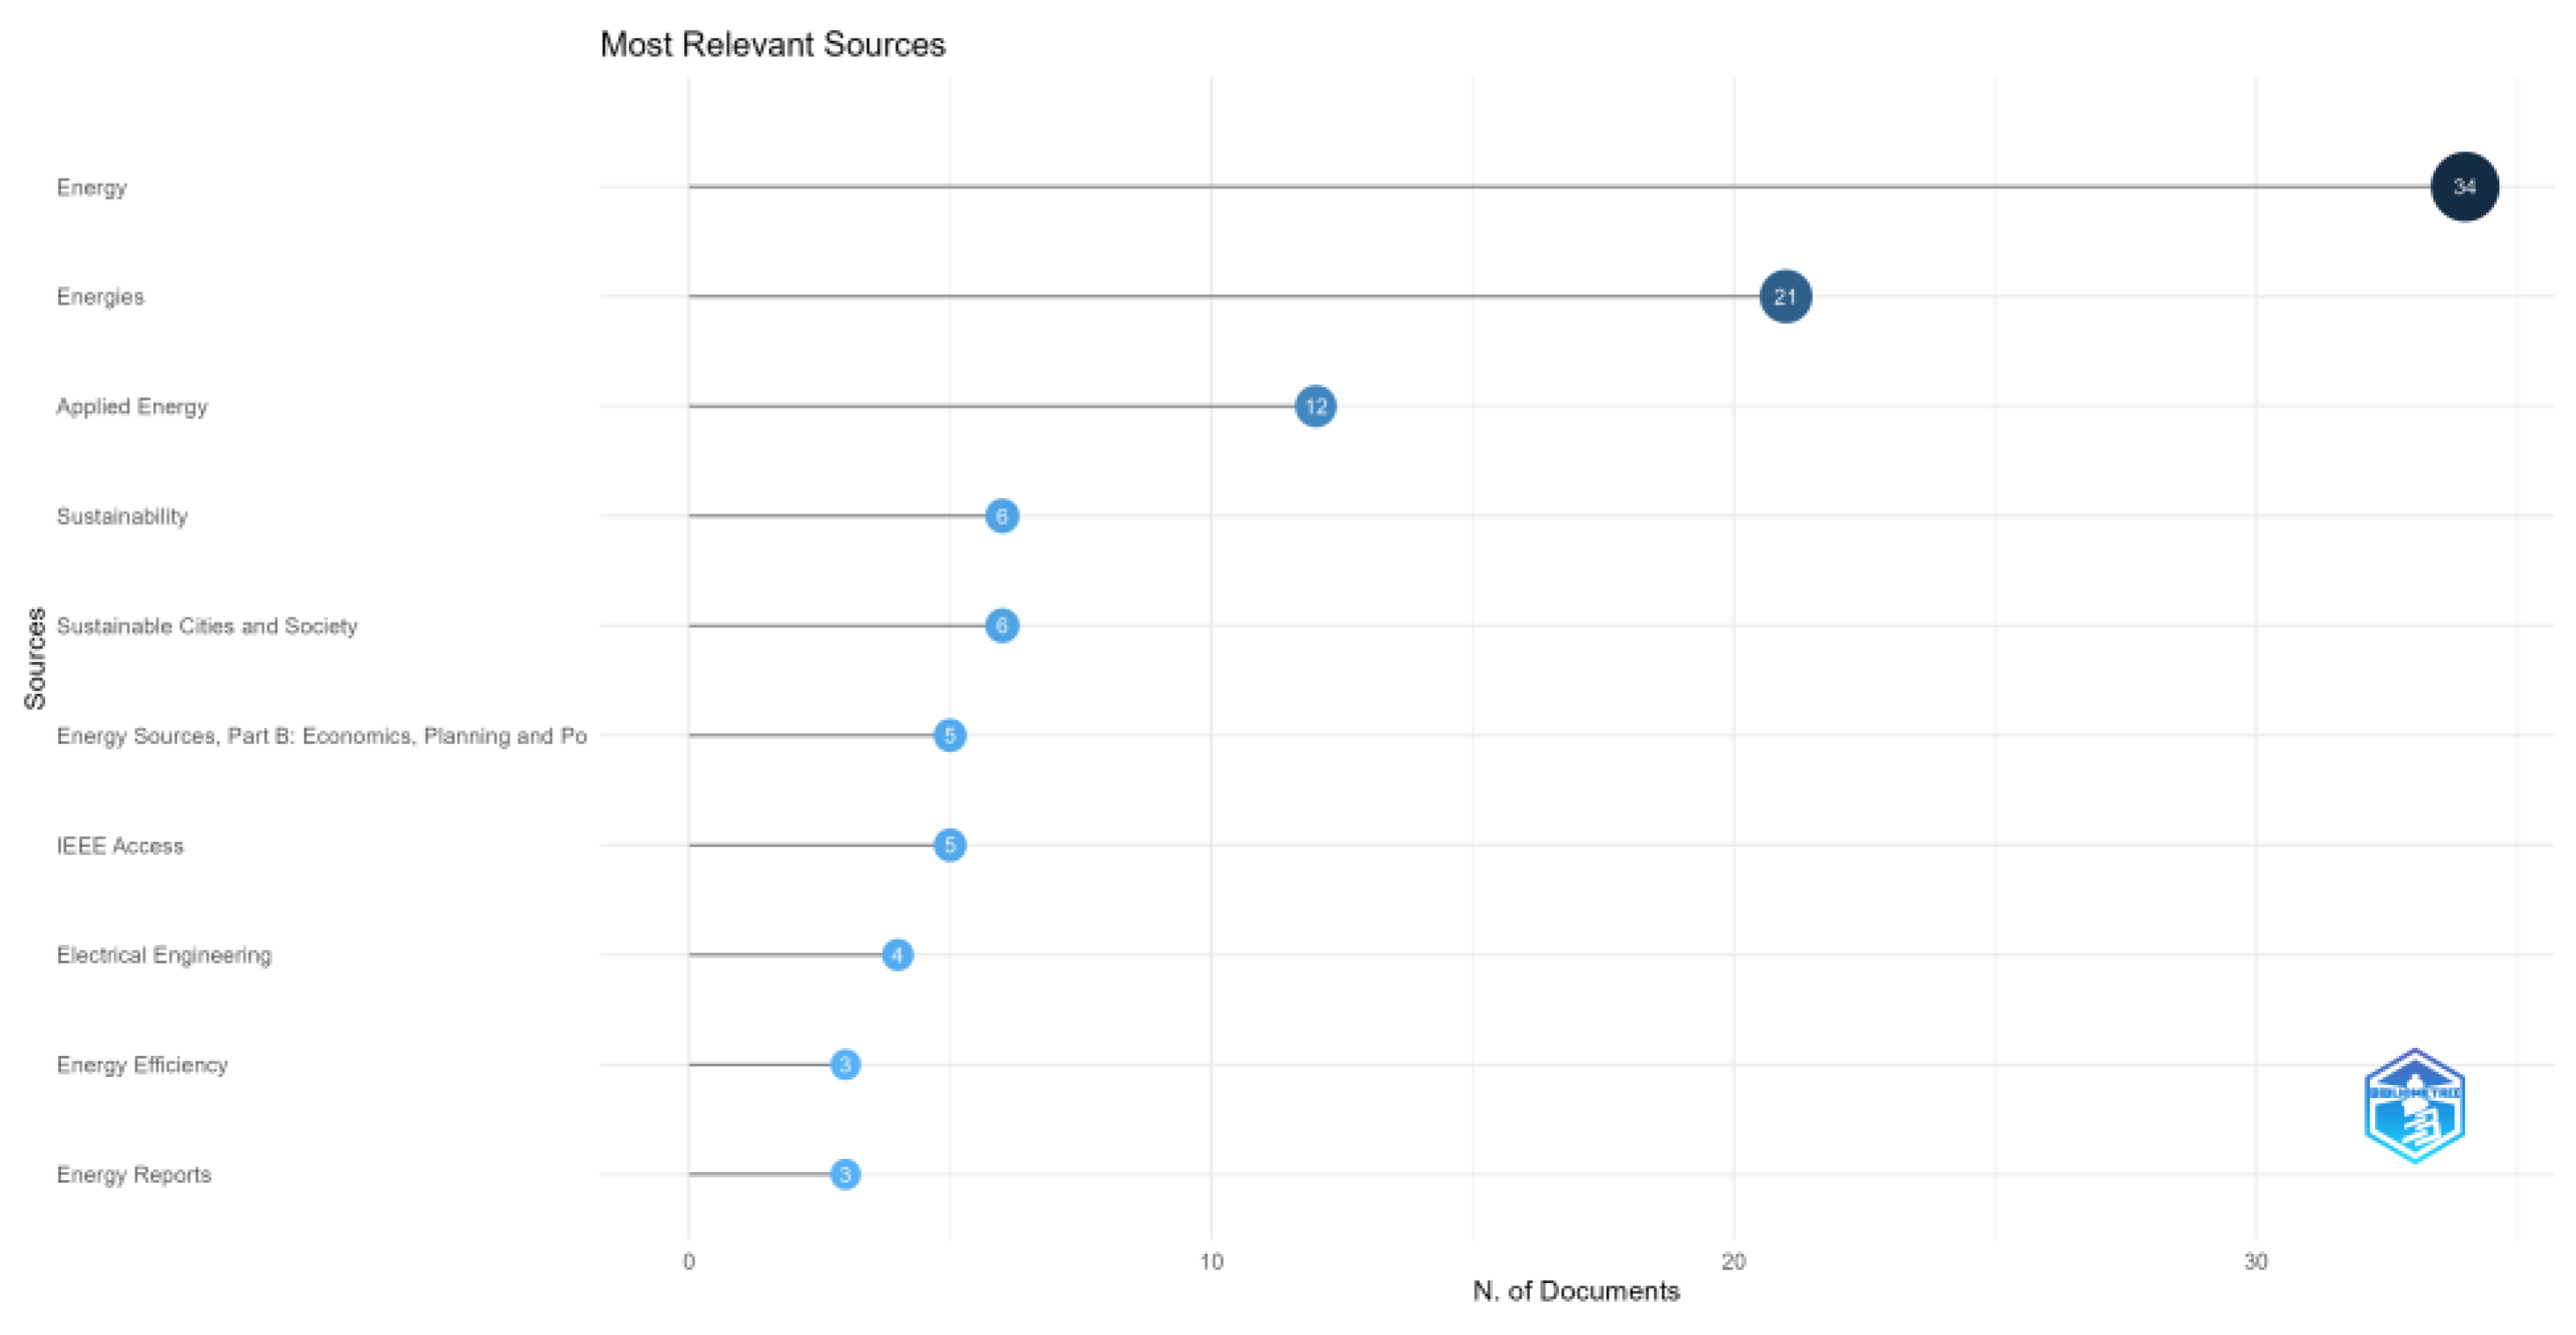
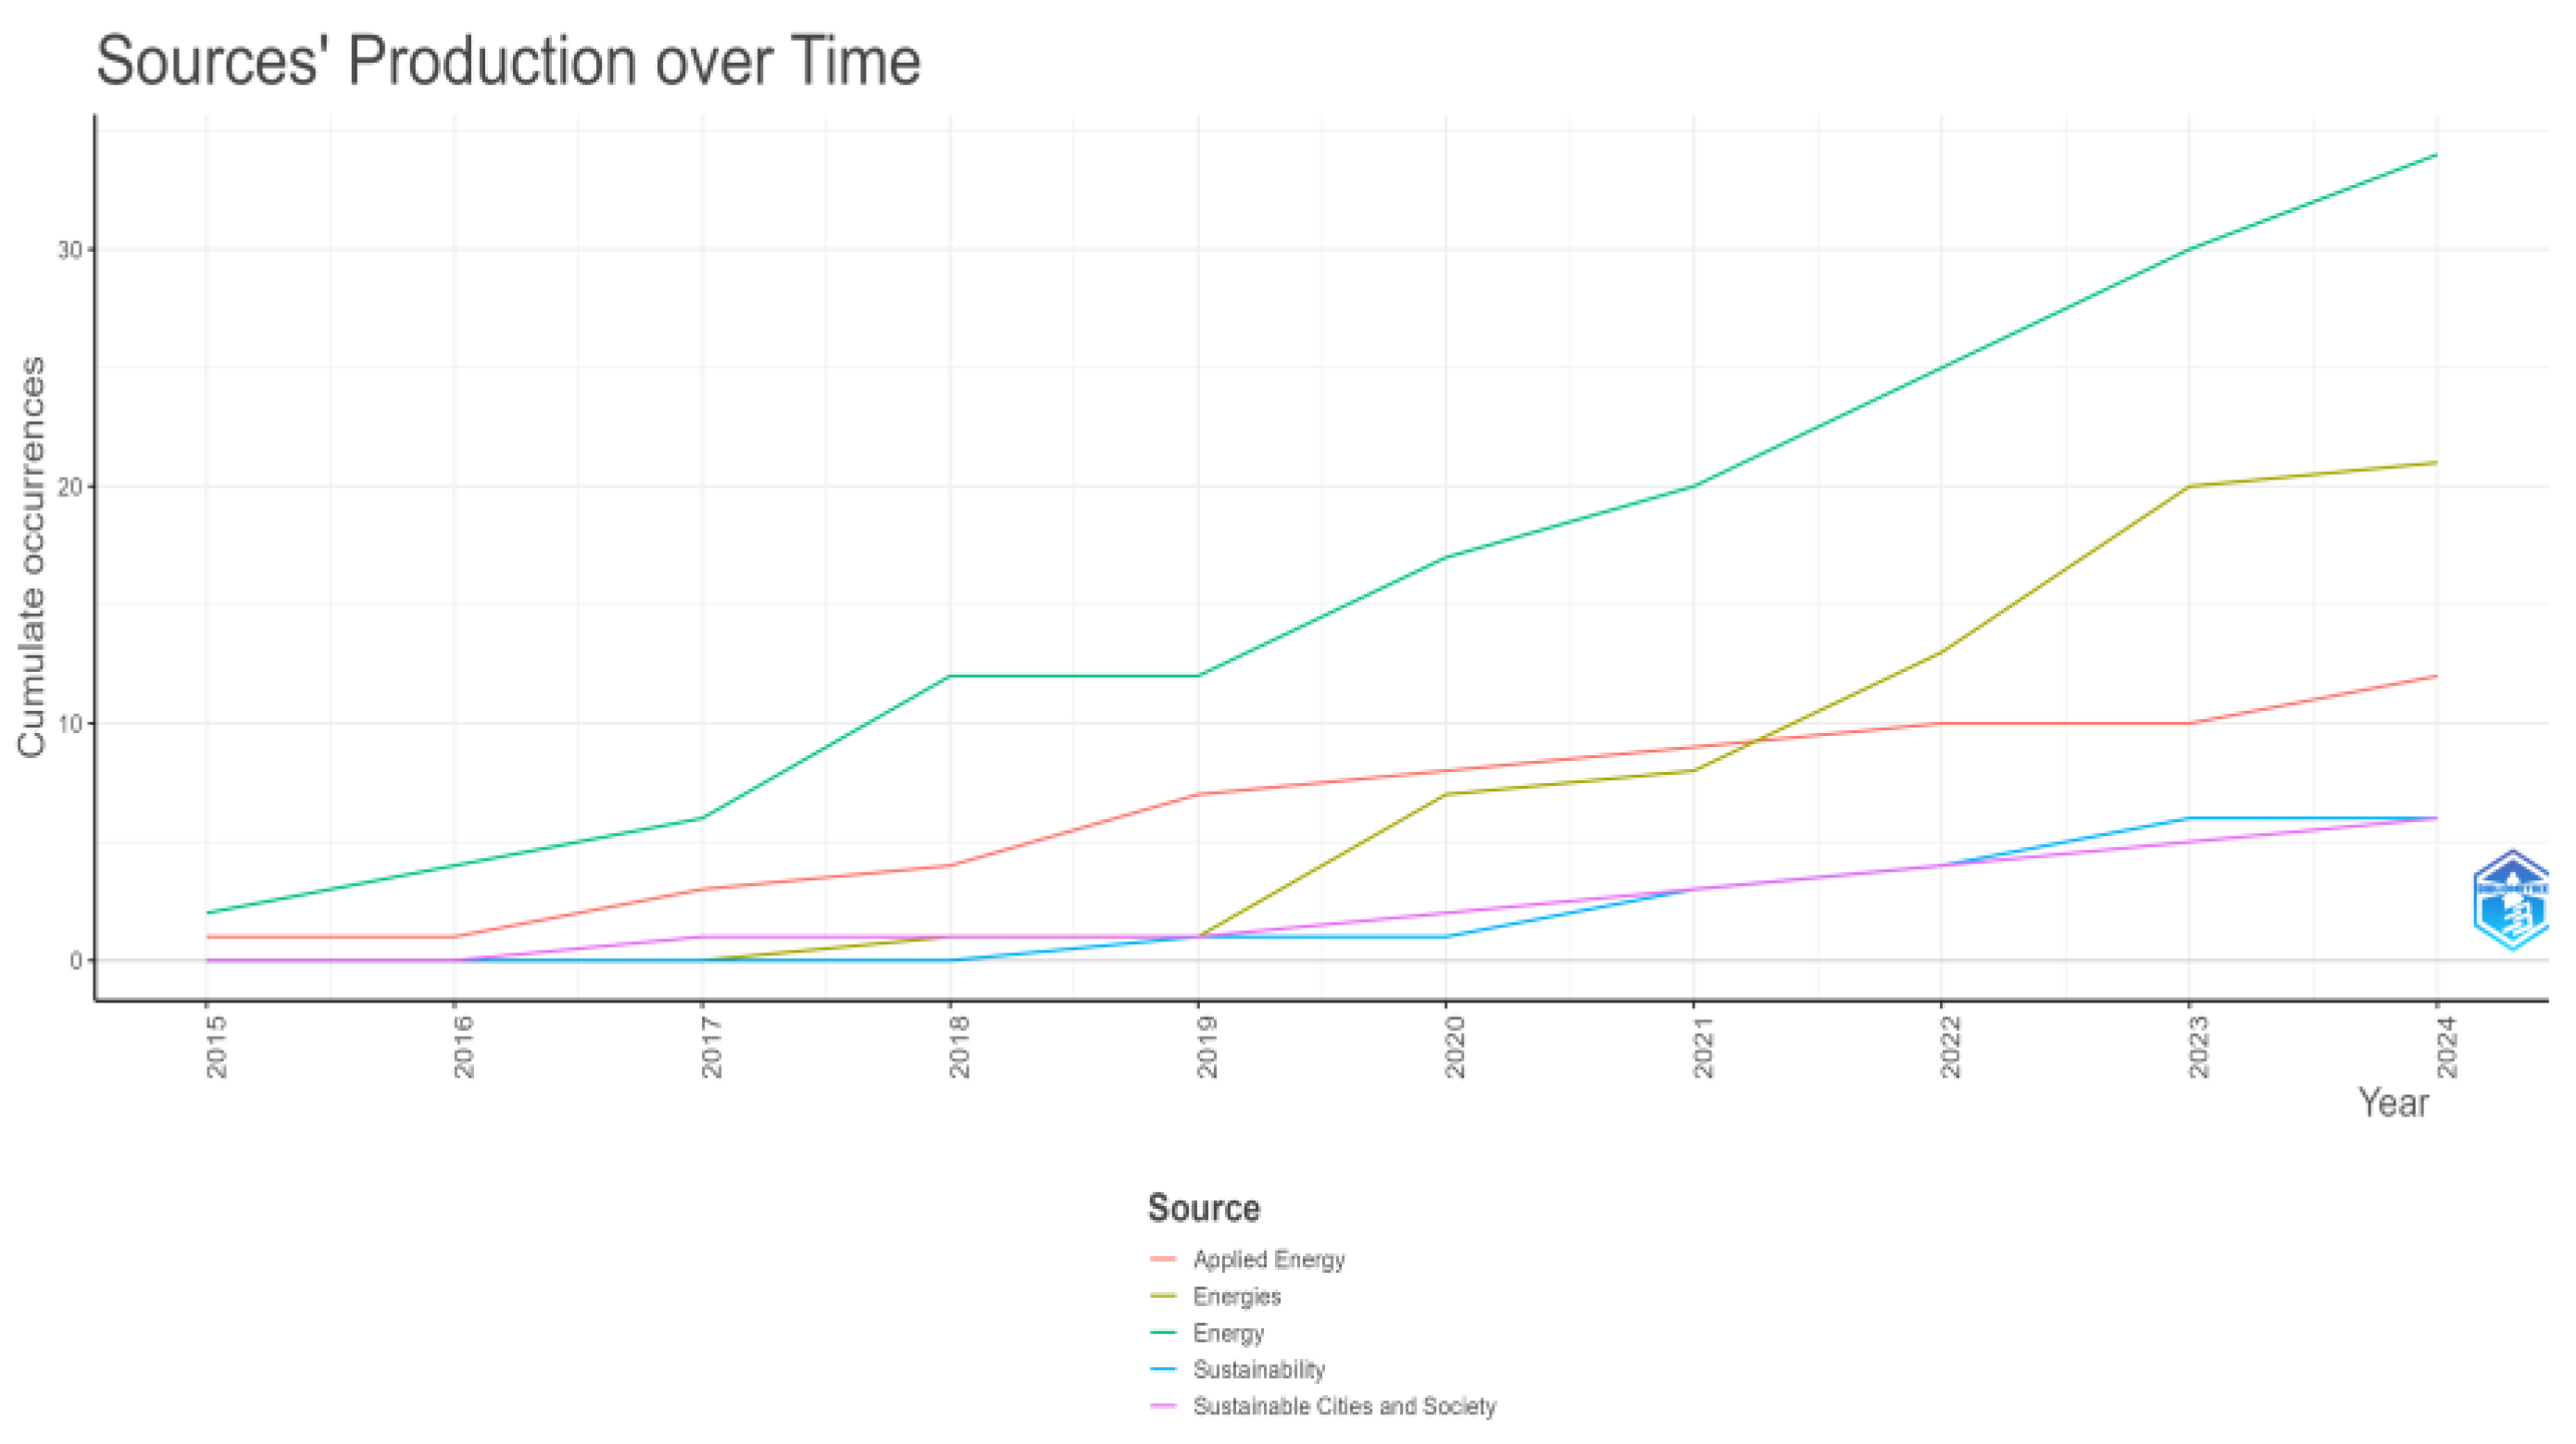
Figure A16 illustrates the distribution of papers published across various scientific journals. The journal "Energy" leads with 34 papers, while "Energies" also has a substantial number of publications, amounting to 21. "Applied Energy" is notable, with 12 published papers. The number of publications in other journals is significantly lower. When examining the production of articles over time (
Figure A17), "Energy" shows a significant and consistent increase in publications over the years, reaching the highest count among all sources by 2024. "Energies" also demonstrates a notable increase, particularly after 2019. "Applied Energy" exhibits a steady increase in publications, maintaining a moderate growth rate. In contrast, the number of publications in other journals remains relatively low and stable.
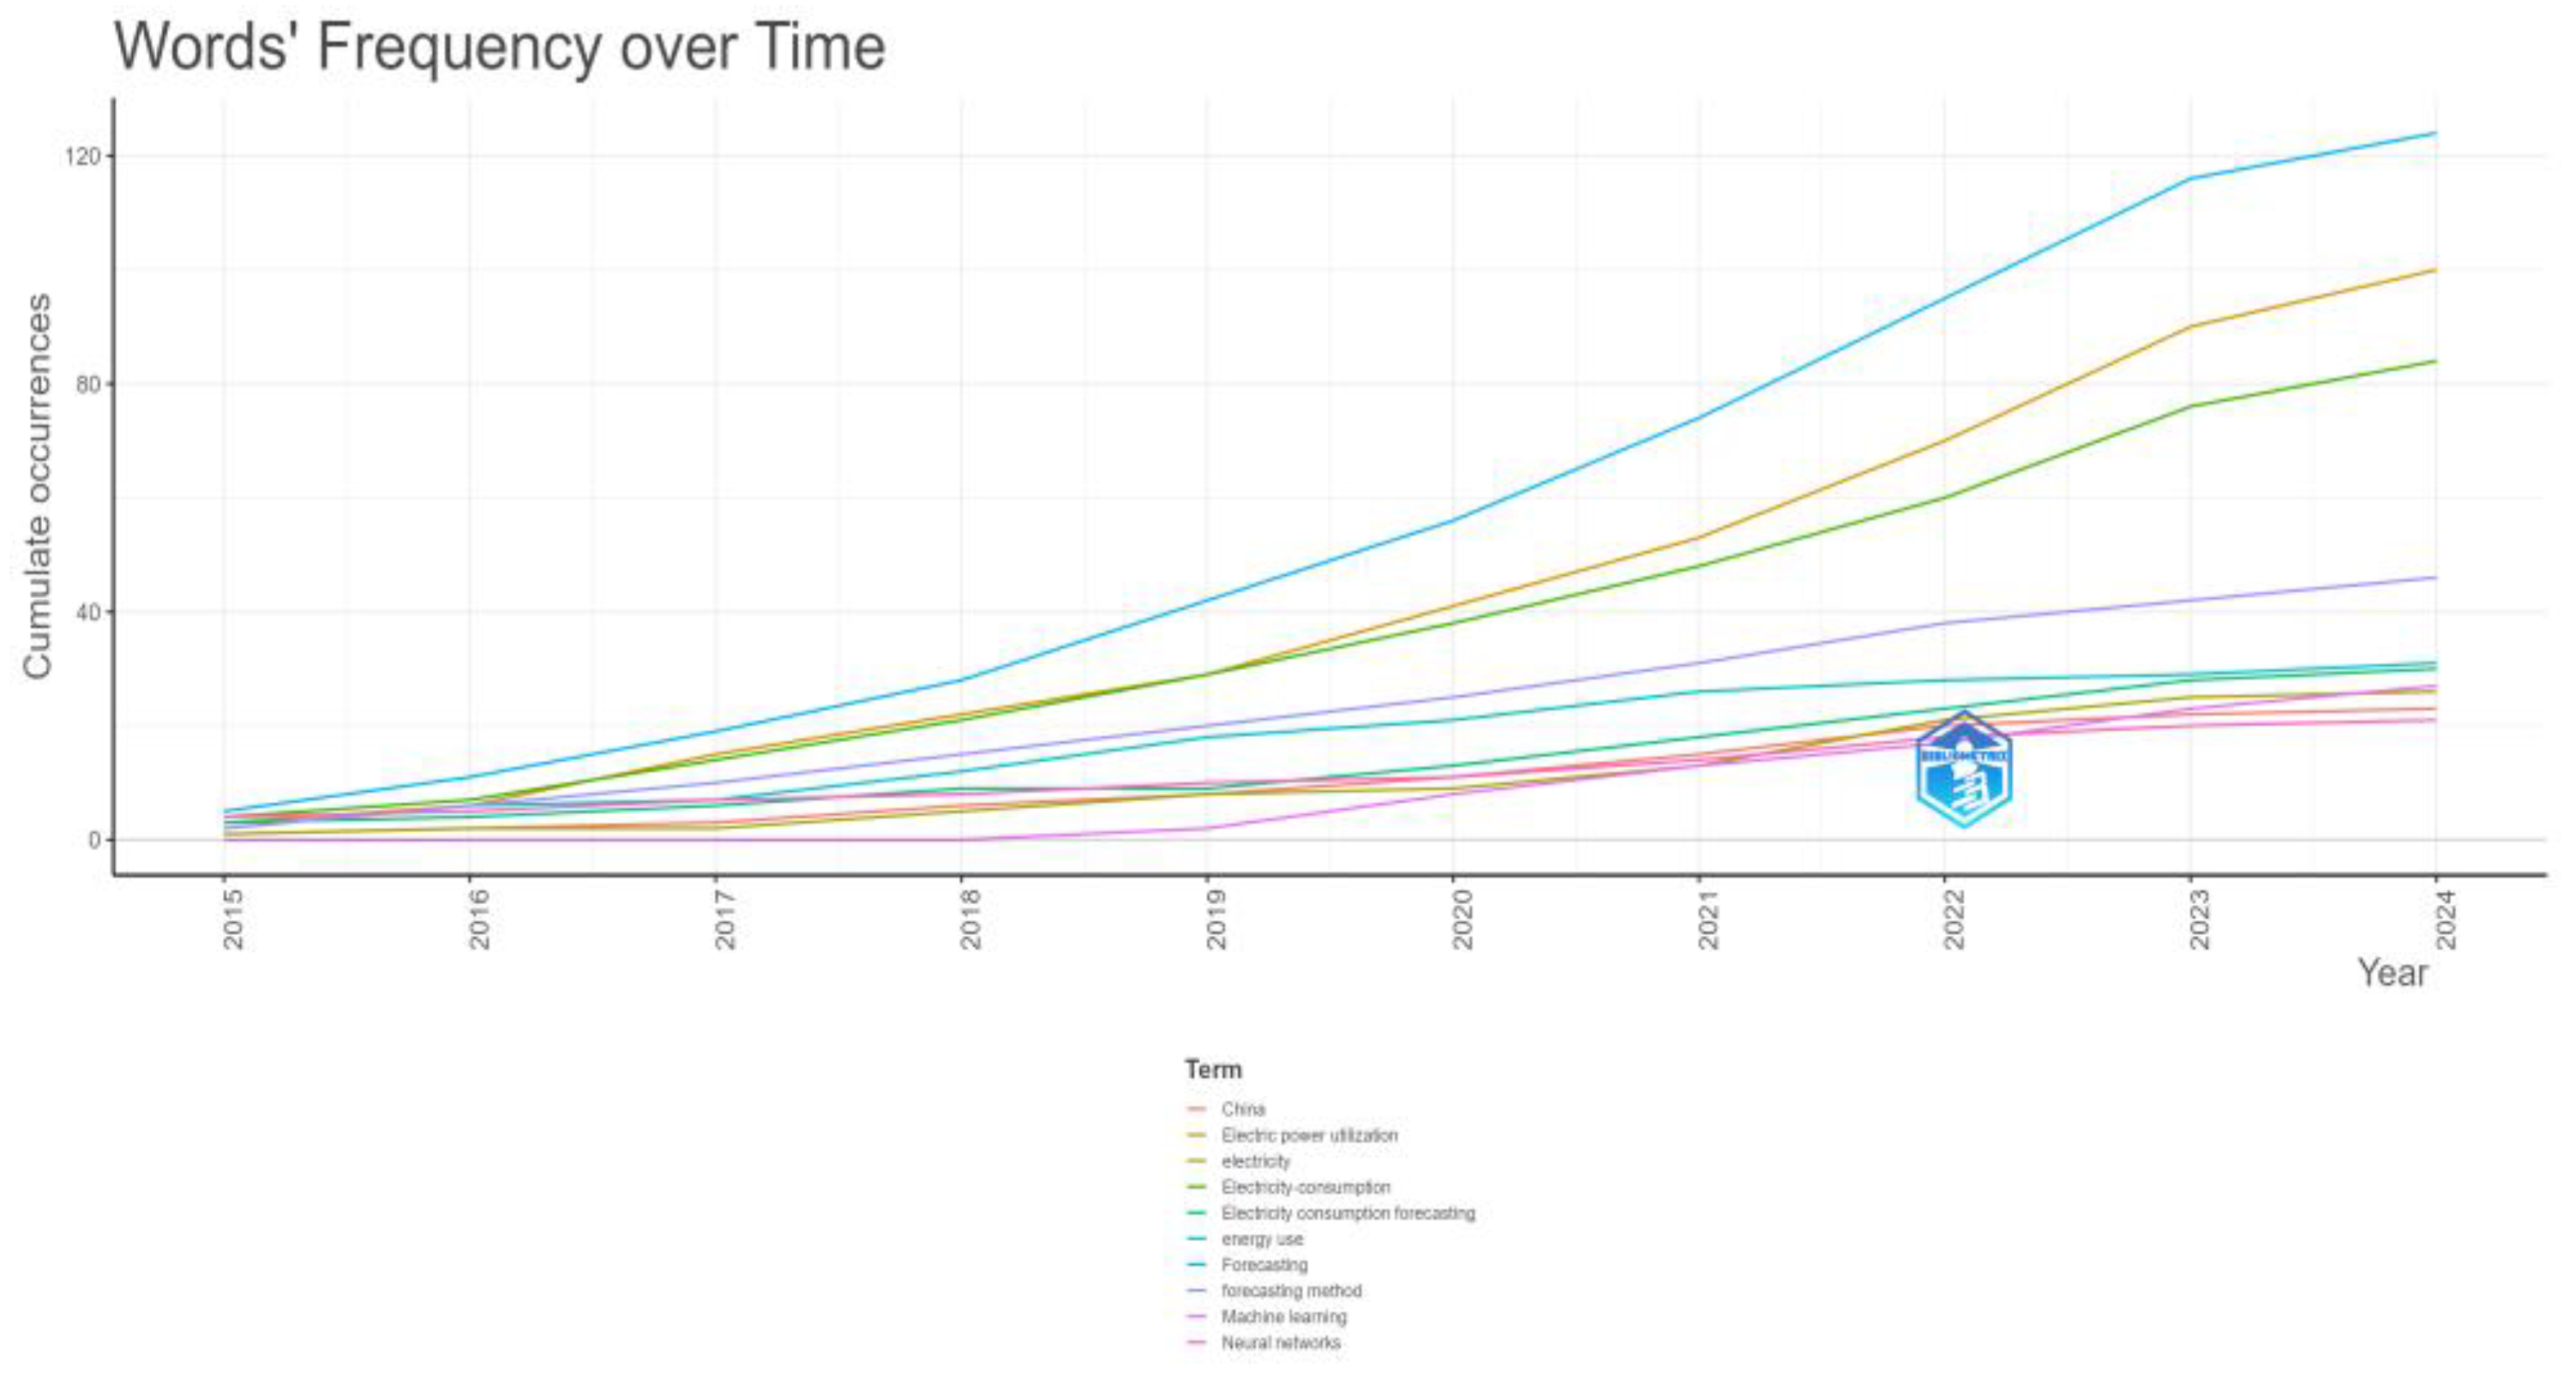
Figure A18 presents the cumulative occurrences of specific terms found in the papers. The most commonly used term is "China," with a significant increase over the years. "Electric power utilization" and "Electricity" also demonstrate notable increases in frequency, especially after 2019. Other terms, such as "Electricity consumption," "Electricity consumption forecasting," and "Energy saving," show steady increases but at a lower rate. "Forecasting method," "Machine learning," and "Neural networks" have relatively lower and more stable occurrences over the observed period.
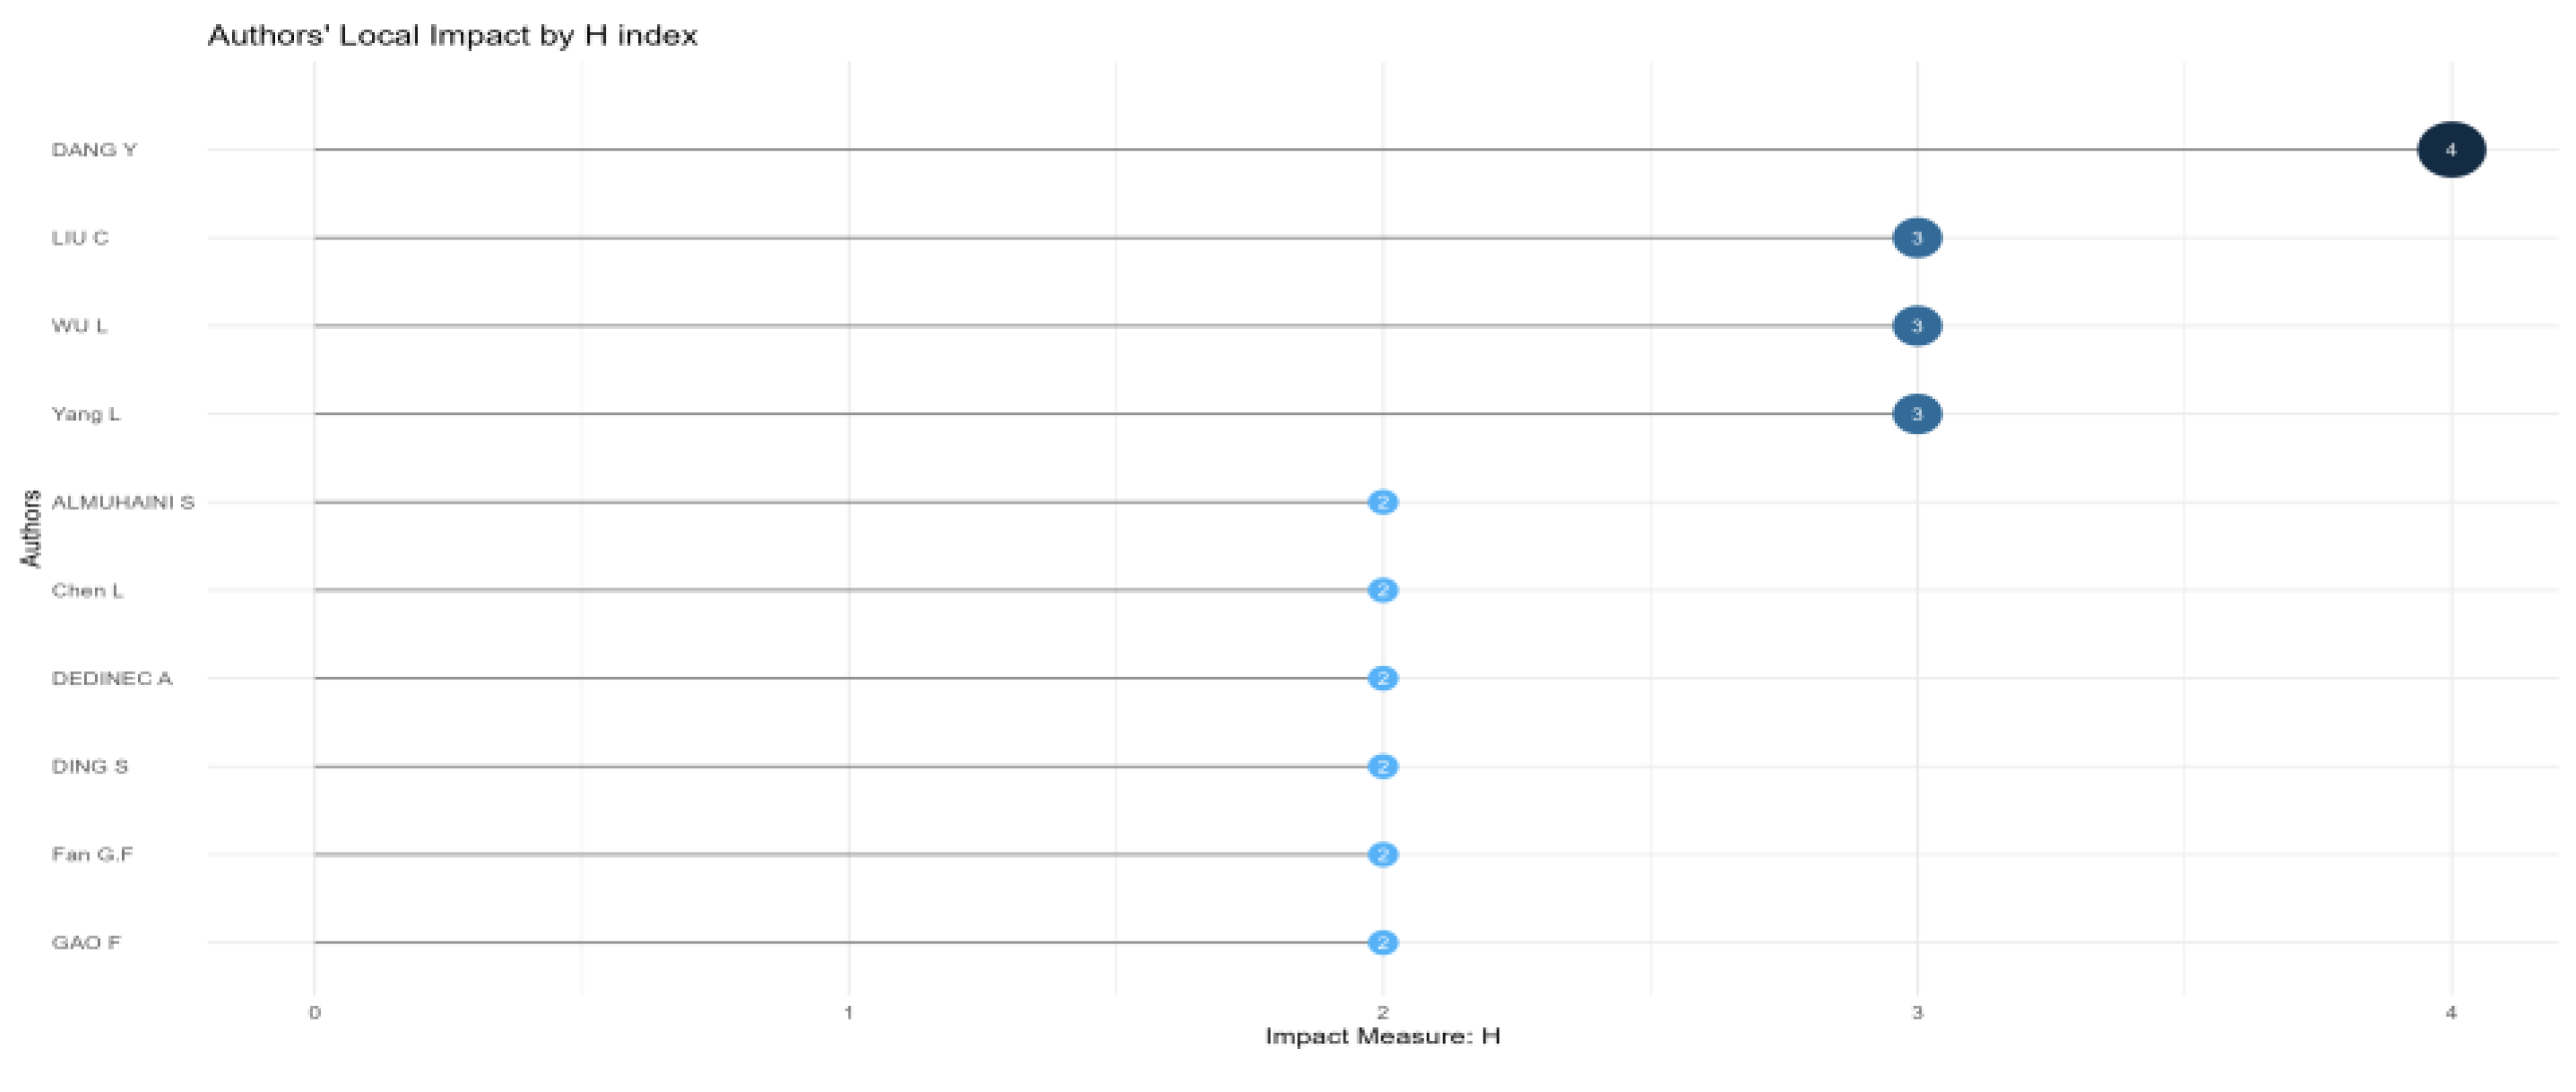
Figure A19 shows the Authors' Local Impact measured by the H index. DANG Y has the highest H index of 4, indicating the highest impact among the listed authors. LIU C, WU L, and Yang L each have an H index of 3, while the remaining authors have lower impact scores 2.
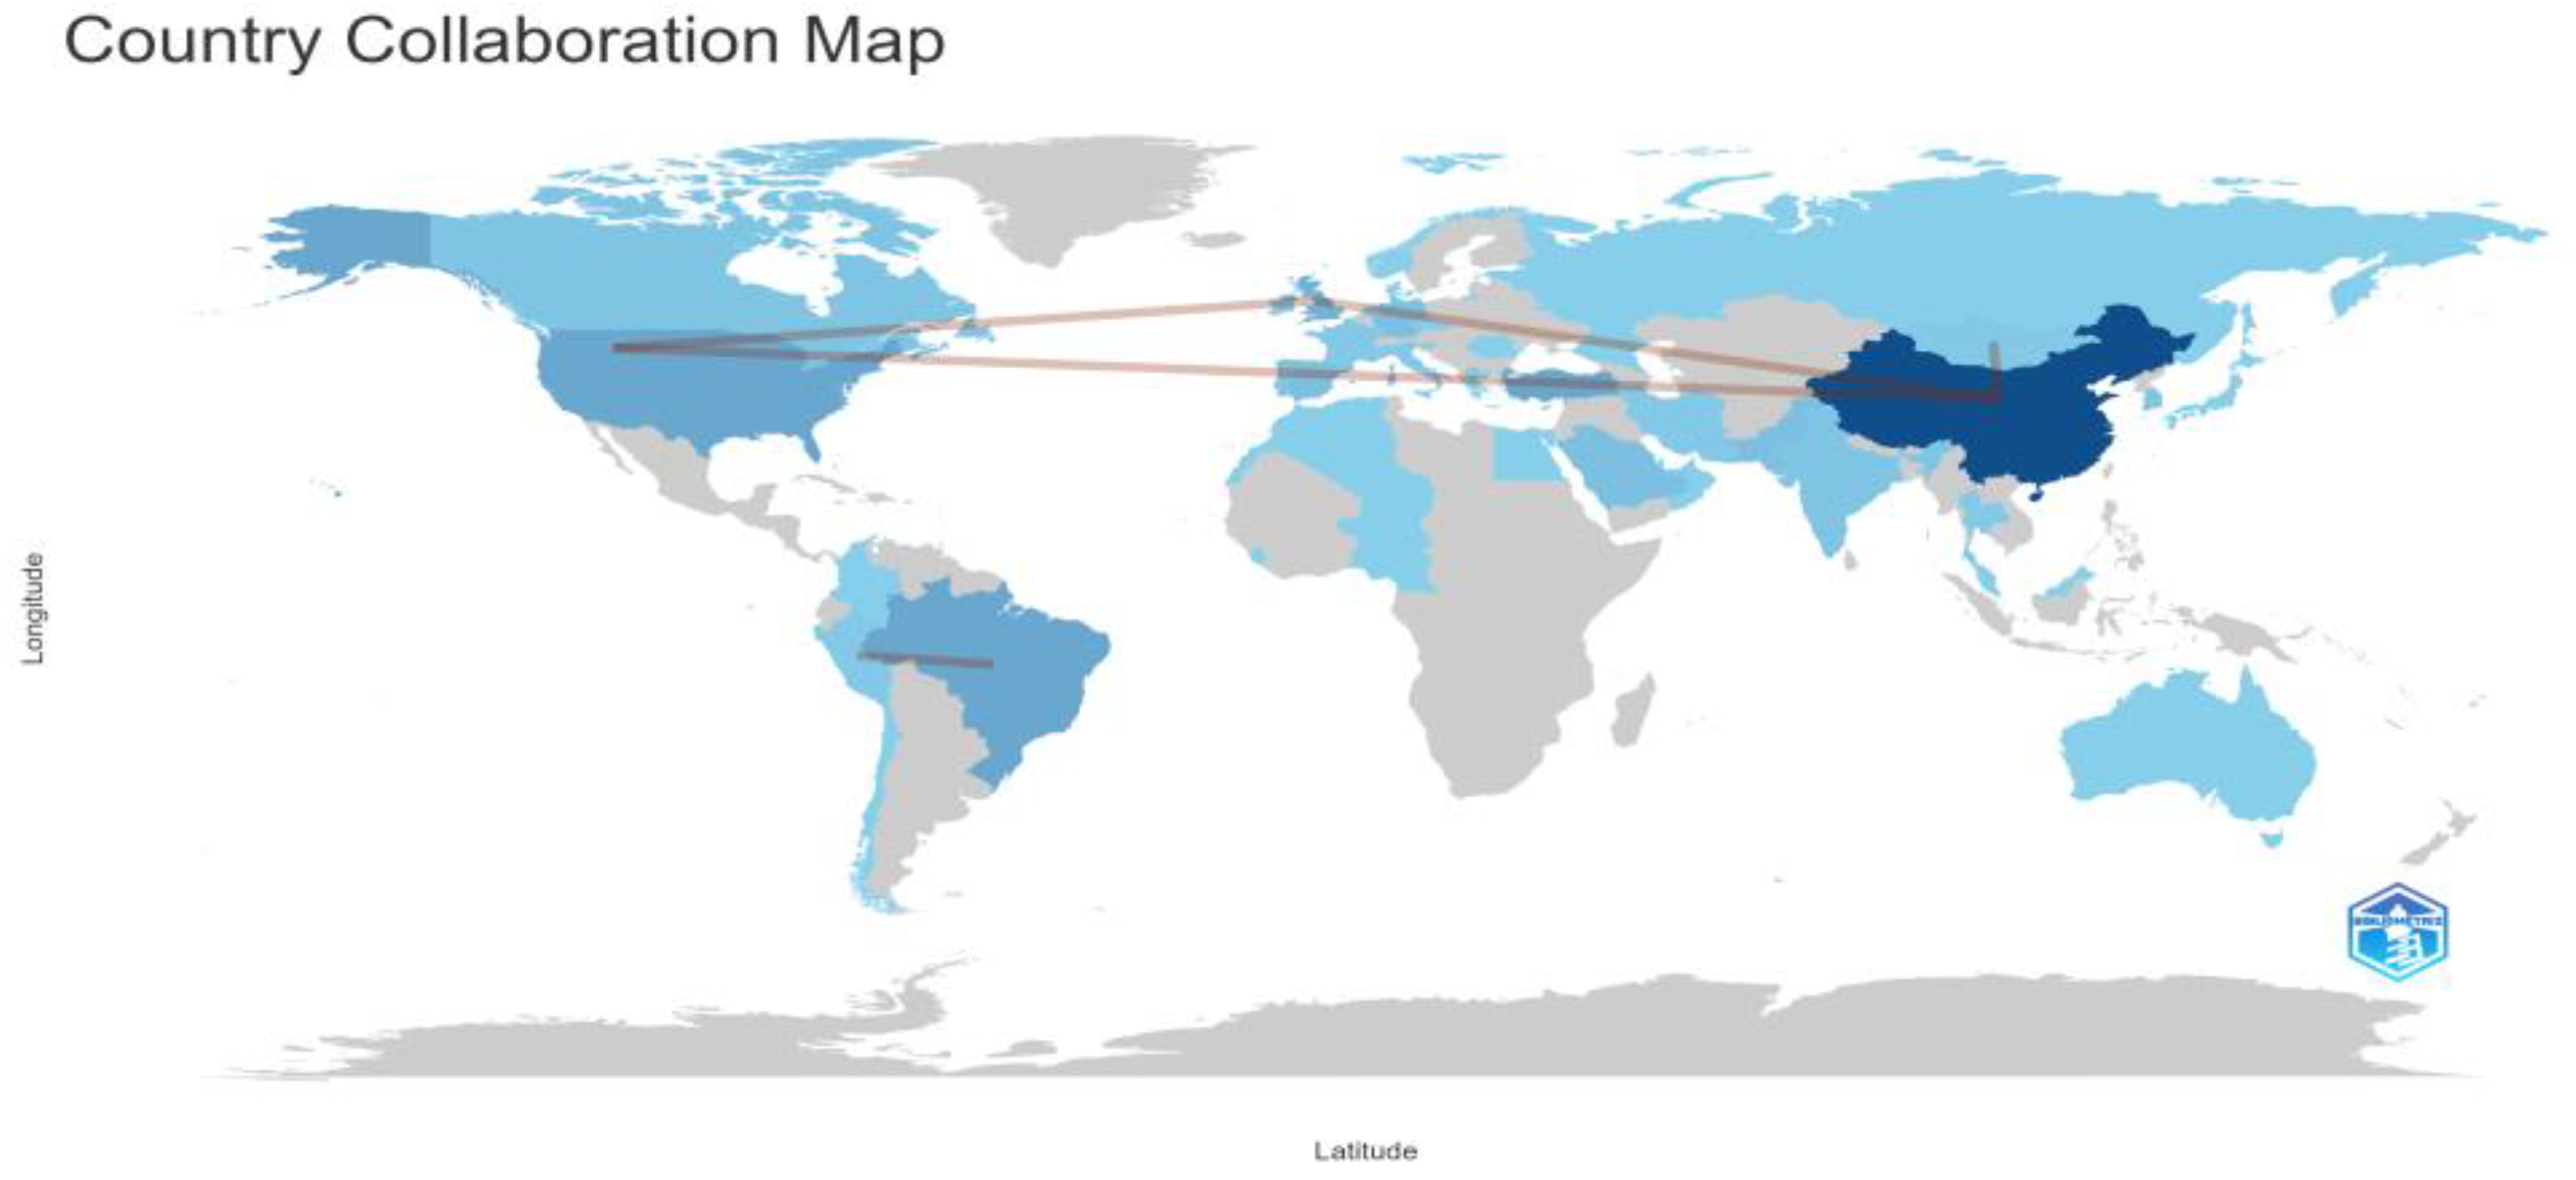
Figure A20 reveals the geographical collaboration between countries based on scientific research. The highest level of collaboration is observed in China (indicated by a darker shade) and the United States. Other countries with significant collaboration include those in Europe, Brazil in South America, and some regions in Asia. Lines connecting the countries highlight key collaborative relationships between the United States, China, and countries in Europe.
5. Conclusions
This study has provided a comprehensive bibliometric analysis of electricity consumption forecasting research conducted from 2015 to 2024. By analyzing 175 documents from the Scopus and Web of Science databases, we have highlighted the significant trends, compared different methodologies, revealed their strengths and weaknesses, and identified which models perform best under specific conditions. There has been a steady increase in publications on electricity consumption forecasting over the past decade. This growth reflects the rising importance of accurate electricity consumption forecasting in planning the power system operation and expansion. Short-term forecasting is crucial, especially for DSOs, energy communities, clusters, industry, and VPPs. The increasing introduction of dynamic tariffs in many countries is also gaining significant importance for energy consumers and the commercial sector. It also helps to reduce GHG emissions by optimizing the use of generation and storage assets since natural gas-fired units are most commonly used to balance deviations from planned consumption. Mid- and long-term forecasting is critical for elaborating investment strategies to expand energy infrastructure. It helps policymakers, TSOs, and energy utilities make informed decisions regarding future electricity needs and optimize resource allocation to ensure the adequacy and reliability of the electricity supply. There is a growing focus on forecasting models that support the integration of renewable energy sources.
The study indicates that no single method consistently outperforms others across all contexts. Traditional statistical methods such as ARIMA and SARIMA remain commonly used due to their robustness and simplicity. However, machine learning (ML) and deep learning (DL) models have gained significant traction. These models, including XGBoost, LSTM, and hybrid approaches, have demonstrated superior accuracy in handling large and complex datasets. The shift towards ML and DL approaches signifies a broader towards leveraging advanced computational techniques to improve forecasting accuracy. Hybrid models are found to be more robust and reliable for long-term forecasting.
The choice of model often depends on the specific characteristics of the data and the forecasting horizon.
Electricity consumption forecasting is particularly important for countries such as China, Brazil, the USA, Pakistan, Turkey, and various European nations. Most of the articles on this topic are produced in these countries. China has shown a significant increase in article production post-2020, which aligns with its broader economic and industrial growth. Although China dominates, significant international collaboration is essential for advancing research and sharing diverse perspectives. Countries like the United States and China have strong collaborative networks, which contribute to the high impact of their research outputs.
The analysis identified several emerging trends, including the use of big data analytics, the incorporation of socioeconomic factors, and the application of advanced optimization algorithms. Future research should continue to explore these areas, with a particular emphasis on improving the accuracy and scalability of forecasting models.
Author Contributions
Conceptualization, A.M.K., and A.W.; methodology, A.M.K., and A.W.; software, A.M.K.; validation, A.M.K., and A.W.; formal analysis, A.M.K., and A.W.; investigation, A.M.K., and A.W.; resources, A.M.K.; data curation, A.M.K.; writing—original draft preparation, A.M.K., and A.W.; writing—review and editing, A.M.K., and AW.; visualization, A.M.K., and A.W. All authors have read and agreed to the published version of the manuscript.
Funding
This research received no external funding.
Institutional Review Board Statement
Not applicable.
Informed Consent Statement
Not applicable.
Data Availability Statement
Not applicable.
Acknowledgments
We would like to thank.
Conflicts of Interest
The authors declare no conflict of interest.
Appendix A
Figure A1.
Network visualization map of Coauthors' association.
Figure A1.
Network visualization map of Coauthors' association.
Figure A2.
Network visualization map of Organization association.
Figure A2.
Network visualization map of Organization association.
Figure A3.
Network visualization map of documentation and citation to countries
Figure A3.
Network visualization map of documentation and citation to countries
Figure A4.
Network visualization map of Authors to citation and documents.
Figure A4.
Network visualization map of Authors to citation and documents.
Figure A5.
Network visualization map of countries association
Figure A5.
Network visualization map of countries association
Figure A6.
Network visualization map of co-occurrence of Authors Keywords.
Figure A6.
Network visualization map of co-occurrence of Authors Keywords.
Figure A7.
Network visualization map of publication sources
Figure A7.
Network visualization map of publication sources
Figure A8.
Network visualization map of bibliographic coupling for Authors.
Figure A8.
Network visualization map of bibliographic coupling for Authors.
Figure A9.
Network visualization map of bibliographic coupling for Countries
Figure A9.
Network visualization map of bibliographic coupling for Countries
Figure A10.
Network visualization map of Authors have highly cited documents.
Figure A10.
Network visualization map of Authors have highly cited documents.
Figure A11.
Total number of documents over time
Figure A11.
Total number of documents over time
Figure A12.
Average number of citations per year.
Figure A12.
Average number of citations per year.
Figure A13.
Countries' publication production over time
Figure A13.
Countries' publication production over time
Figure A14.
Affiliations’ publication production over time.
Figure A14.
Affiliations’ publication production over time.
Figure A15.
Most relevant Authors to publication
Figure A15.
Most relevant Authors to publication
Figure A16.
Most relevant Source to publication.
Figure A16.
Most relevant Source to publication.
Figure A17.
Publication sources production over time
Figure A17.
Publication sources production over time
Figure A18.
Word’s Frequency over time.
Figure A18.
Word’s Frequency over time.
Figure A19.
View of Author’s Local Impact by H index
Figure A19.
View of Author’s Local Impact by H index
Figure A20.
View of Country Collaboration Map.
Figure A20.
View of Country Collaboration Map.
References
- Global Energy Trends. 2024.
- Lee, M.H.L.; Ser, Y.C.; Selvachandran, G.; Thong, P.H.; Cuong, L.; Son, L.H.; Tuan, N.T.; Gerogiannis, V.C. A Comparative Study of Forecasting Electricity Consumption Using Machine Learning Models. Mathematics 2022, 10. [Google Scholar] [CrossRef]
- Bilgili, M.; Pinar, E. Gross Electricity Consumption Forecasting Using LSTM and SARIMA Approaches: A Case Study of Türkiye. Energy 2023, 284. [Google Scholar] [CrossRef]
- Kaytez, F.; Taplamacioglu, M.C.; Cam, E.; Hardalac, F. Forecasting Electricity Consumption: A Comparison of Regression Analysis, Neural Networks and Least Squares Support Vector Machines. Int. J. Electr. Power Energy Syst. 2015, 67, 431–438. [Google Scholar] [CrossRef]
- Pannakkong, W.; Harncharnchai, T.; Buddhakulsomsiri, J. Forecasting Daily Electricity Consumption in Thailand Using Regression, Artificial Neural Network, Support Vector Machine, and Hybrid Models. ENERGIES 2022, 15. [Google Scholar] [CrossRef]
- Tutun, S.; Chou, C.-A.; Caniyilmaz, E. A New Forecasting Framework for Volatile Behavior in Net Electricity Consumption: A Case Study in Turkey. Energy 2015, 93, 2406–2422. [Google Scholar] [CrossRef]
- Luzia, R.; Rubio, L.; Velasquez, C.E. Sensitivity Analysis for Forecasting Brazilian Electricity Demand Using Artificial Neural Networks and Hybrid Models Based on Autoregressive Integrated Moving Average. Energy 2023, 274, 127365. [Google Scholar] [CrossRef]
- Filgueiras, D.B.; Coelho da Silva, F.L. A Study on the Prediction of Electricity Consumption Considering the Energy Efficiency Measures—Applied in Case of the Brazilian Public Sector. Energy Effic. 2023, 16. [Google Scholar] [CrossRef]
- Fallahpour, A.; Wong, K.Y.; Rajoo, S.; Tian, G. An Evolutionary-Based Predictive Soft Computing Model for the Prediction of Electricity Consumption Using Multi Expression Programming. J. Clean. Prod. 2021, 283. [Google Scholar] [CrossRef]
- Krstev, S.; Forcan, J.; Krneta, D. An Overview of Forecasting Methods for Monthly Electricity Consumption. Teh. Vjesn. 2023, 30, 993–1001. [Google Scholar]
- Tutun, S.; Tosyali, A.; Sangrody, H.; Khasawneh, M.; Johnson, M.; Albizri, A.; Harfouche, A. Artificial Intelligence in Energy Industry: Forecasting Electricity Consumption through Cohort Intelligence & Adaptive Neural Fuzzy Inference System. J. Bus. Anal. 2023, 6, 59–76. [Google Scholar]
- Petrosanu, D.-M. Designing, Developing and Validating a Forecasting Method for the Month Ahead Hourly Electricity Consumption in the Case of Medium Industrial Consumers. PROCESSES 2019, 7. [Google Scholar] [CrossRef]
- Almaleck, P.; Massucco, S.; Mosaico, G.; Saviozzi, M.; Serra, P.; Silvestro, F. Electrical Consumption Forecasting in Sports Venues: A Proposed Approach Based on Neural Networks and ARIMAX Models. Sustain. Cities Soc. 2024, 100. [Google Scholar] [CrossRef]
- Kuster, C.; Rezgui, Y.; Mourshed, M. Electrical Load Forecasting Models: A Critical Systematic Review. Sustain. Cities Soc. 2017, 35, 257–270. [Google Scholar] [CrossRef]
- Panklib, K.; Prakasvudhisarn, C.; Khummongkol, D. Electricity Consumption Forecasting in Thailand Using an Artificial Neural Network and Multiple Linear Regression. Energy Sources Part B Econ. Plan. Policy 2015, 10, 427–434. [Google Scholar] [CrossRef]
- Hadjout, D.; Sebaa, A.; Torres, J.F.; Martínez-Álvarez, F. Electricity Consumption Forecasting with Outliers Handling Based on Clustering and Deep Learning with Application to the Algerian Market. Expert Syst. Appl. 2023, 227. [Google Scholar] [CrossRef]
- Guefano, S.; Tamba, J.G.; Azong, T.E.W.; Monkam, L. Forecast of Electricity Consumption in the Cameroonian Residential Sector by Grey and Vector Autoregressive Models. ENERGY 2021, 214. [Google Scholar] [CrossRef]
- Yukseltan, E.; Yucekaya, A.; Bilge, A.H. Forecasting Electricity Demand for Turkey: Modeling Periodic Variations and Demand Segregation. Appl. Energy 2017, 193, 287–296. [Google Scholar] [CrossRef]
- Alasali, F.; Nusair, K.; Alhmoud, L.; Zarour, E. Impact of the Covid-19 Pandemic on Electricity Demand and Load Forecasting. Sustain. Switz. 2021, 13, 1–22. [Google Scholar] [CrossRef]
- Amber, K.P.; Ahmad, R.; Aslam, M.W.; Kousar, A.; Usman, M.; Khan, M.S. Intelligent Techniques for Forecasting Electricity Consumption of Buildings. Energy 2018, 157, 886–893. [Google Scholar] [CrossRef]
- Klyuev, R.V.; Morgoev, I.D.; Morgoeva, A.D.; Gavrina, O.A.; Martyushev, N.V.; Efremenkov, E.A.; Mengxu, Q. Methods of Forecasting Electric Energy Consumption: A Literature Review. Energies 2022, 15. [Google Scholar] [CrossRef]
- Kumar Dubey, A.; Kumar, A.; García-Díaz, V.; Kumar Sharma, A.; Kanhaiya, K. Study and Analysis of SARIMA and LSTM in Forecasting Time Series Data. Sustain. Energy Technol. Assess. 2021, 47. [Google Scholar] [CrossRef]
- Wibowo, W.; Dwijantari, S.; Hartati, A. Time Series Machine Learning: Implementing ARIMA and Hybrid ARIMA-ANN for Electricity Forecasting Modeling. In Soft Computing in Data Science; Communications in Computer and Information Science; Springer Singapore: Singapore, 2017; Vol. 788, pp. 126–139. ISBN 978-981-10-7241-3. [Google Scholar]
- Yiğit, S.; Turgay, S.; Cebeci, Ç.; Kara, E.S. Time-Stratified Analysis of Electricity Consumption: A Regression and Neural Network Approach in the Context of Turkey. WSEAS Trans. Power Syst. 2024, 19, 96–104. [Google Scholar] [CrossRef]
- Sakkas, N.; Yfanti, S.; Shah, P.; Sakkas, N.; Chaniotakis, C.; Daskalakis, C.; Barbu, E.; Domnich, M. Explainable Approaches for Forecasting Building Electricity Consumption. Energies 2023, 16. [Google Scholar] [CrossRef]
- Wei, M.; Wen, M.; Luo, J. A Short-Term Electricity Consumption Forecasting Approach Based on Feature Processing and Hybrid Modelling. IET Gener. Transm. Distrib. 2022, 16, 2003–2015. [Google Scholar] [CrossRef]
- Guo, N.; Chen, W.; Wang, M.; Tian, Z.; Jin, H. Appling an Improved Method Based on ARIMA Model to Predict the Short-Term Electricity Consumption Transmitted by the Internet of Things (IoT). Wirel. Commun. Mob. Comput. 2021, 2021. [Google Scholar] [CrossRef]
- Sultana, N.; Hossain, S.M.Z.; Almuhaini, S.; Düştegör, D. Bayesian Optimization Algorithm-Based Statistical and Machine Learning Approaches for Forecasting Short-Term Electricity Demand. Energies 2022, 15. [Google Scholar] [CrossRef]
- Ullah, F.U.M.; Khan, N.; Hussain, T.; Lee, M.Y.; Baik, S.W. Diving Deep into Short-term Electricity Load Forecasting: Comparative Analysis and a Novel Framework. Mathematics 2021, 9. [Google Scholar] [CrossRef]
- Azeem, A.; Ismail, I.; Jameel, S.M.; Harindran, V.R. Electrical Load Forecasting Models for Different Generation Modalities: A Review. IEEE Access 2021, 9, 142239–142263. [Google Scholar] [CrossRef]
- Ahajjam, M.A.; Bonilla Licea, D.; Ghogho, M.; Kobbane, A. Experimental Investigation of Variational Mode Decomposition and Deep Learning for Short-Term Multi-Horizon Residential Electric Load Forecasting. Appl. Energy 2022, 326. [Google Scholar] [CrossRef]
- Chang, C.-J.; Lin, J.-Y.; Chang, M.-J. Extended Modeling Procedure Based on the Projected Sample for Forecasting Short-Term Electricity Consumption. Adv. Eng. Inform. 2016, 30, 211–217. [Google Scholar] [CrossRef]
- Fan, G.-F.; Yu, M.; Dong, S.-Q.; Yeh, Y.-H.; Hong, W.-C. Forecasting Short-Term Electricity Load Using Hybrid Support Vector Regression with Grey Catastrophe and Random Forest Modeling. Util. Policy 2021, 73. [Google Scholar] [CrossRef]
- Farsi, B.; Amayri, M.; Bouguila, N.; Eicker, U. On Short-Term Load Forecasting Using Machine Learning Techniques and a Novel Parallel Deep LSTM-CNN Approach. IEEE Access 2021, 9, 31191–31212. [Google Scholar] [CrossRef]
- Zhu, G.; Peng, S.; Lao, Y.; Su, Q.; Sun, Q. Short-Term Electricity Consumption Forecasting Based on the EMD-Fbprophet-LSTM Method. Math. Probl. Eng. 2021, 2021. [Google Scholar] [CrossRef]
- Zapirain, I.; Etxegarai, G.; Hernández, J.; Boussaada, Z.; Aginako, N.; Camblong, H. Short-Term Electricity Consumption Forecasting with NARX, LSTM, and SVR for a Single Building: Small Data Set Approach. Energy Sources Part Recovery Util. Environ. Eff. 2022, 44, 6898–6908. [Google Scholar] [CrossRef]
- El khantach, A.; Hamlich, M.; Belbounaguia, N. eddine Short-Term Load Forecasting Using Machine Learning and Periodicity Decomposition. AIMS Energy 2019, 7, 382–394. [Google Scholar] [CrossRef]
- Torres, J.F.; Martinez-Alvarez, F.; Troncoso, A. A Deep LSTM Network for the Spanish Electricity Consumption Forecasting. NEURAL Comput. Appl. 2022, 34, 10533–10545. [Google Scholar] [CrossRef]
- Khan, A.; Chiroma, H.; Imran, M.; khan, A.; Bangash, J.I.; Asim, M.; Hamza, M.F.; Aljuaid, H. Forecasting Electricity Consumption Based on Machine Learning to Improve Performance: A Case Study for the Organization of Petroleum Exporting Countries (OPEC). Comput. Electr. Eng. 2020, 86. [Google Scholar] [CrossRef]
- Iftikhar, H.; Bibi, N.; Canas Rodrigues, P.; López-Gonzales, J.L. Multiple Novel Decomposition Techniques for Time Series Forecasting: Application to Monthly Forecasting of Electricity Consumption in Pakistan. Energies 2023, 16. [Google Scholar] [CrossRef]
- Zhou, X.; Wang, J. Panel Quantile Regression Neural Network for Electricity Consumption Forecasting in China: A New Framework. Energy Sources Part B Econ. Plan. Policy 2021, 16, 420–442. [Google Scholar] [CrossRef]
- da Silva, F.L.C.; da Costa, K.; Rodrigues, P.C.; Salas, R.; López-Gonzales, J.L. Statistical and Artificial Neural Networks Models for Electricity Consumption Forecasting in the Brazilian Industrial Sector. Energies 2022, 15. [Google Scholar]
- Abulibdeh, A.; Zaidan, E.; Jabbar, R. The Impact of COVID-19 Pandemic on Electricity Consumption and Electricity Demand Forecasting Accuracy: Empirical Evidence from the State of Qatar. Energy Strategy Rev. 2022, 44. [Google Scholar] [CrossRef]
- Ali, Md.H.; Rubel, R.I.; Alam, Md.A. Time Series Long-Term Forecasting of per Capita Electricity Consumption for Bangladesh. ASM Sci. J. 2021, 16, 1–16. [Google Scholar]
- Guo, H.; Chen, Q.; Xia, Q.; Kang, C.; Zhang, X. A Monthly Electricity Consumption Forecasting Method Based on Vector Error Correction Model and Self-Adaptive Screening Method. Int. J. Electr. Power Energy Syst. 2018, 95, 427–439. [Google Scholar] [CrossRef]
- Mburamatare, D.; Gboney, W.K.; Hakizimana, J.D.D.; Mutemberezi, F. Analyzing and Forecasting Electricity Consumption in Energy-Intensive Industries in Rwanda. Int. J. Energy Econ. Policy 2022, 12, 483–493. [Google Scholar] [CrossRef]
- Liu, Y.; Li, J. Annual Electricity and Energy Consumption Forecasting for the UK Based on Back Propagation Neural Network, Multiple Linear Regression, and Least Square Support Vector Machine. PROCESSES 2023, 11. [Google Scholar] [CrossRef]
- Cabral, J. de A.; Legey, L.F.L.; Freitas Cabral, M.V. de Electricity Consumption Forecasting in Brazil: A Spatial Econometrics Approach. Energy 2017, 126, 124–131. [Google Scholar] [CrossRef]
- Gao, F.; Chi, H.; Shao, X. Forecasting Residential Electricity Consumption Using a Hybrid Machine Learning Model with Online Search Data. Appl. Energy 2021, 300. [Google Scholar] [CrossRef]
- Liu, X.; Li, S.; Gao, M. A Discrete Time-Varying Grey Fourier Model with Fractional Order Terms for Electricity Consumption Forecast. ENERGY 2024, 296. [Google Scholar] [CrossRef]
- Kaytez, F. A Hybrid Approach Based on Autoregressive Integrated Moving Average and Least-Square Support Vector Machine for Long-Term Forecasting of Net Electricity Consumption. Energy 2020, 197. [Google Scholar] [CrossRef]
- Çağlayan-Akay, E.; Topal, K.H. Forecasting Turkish Electricity Consumption: A Critical Analysis of Single and Hybrid Models. Energy 2024, 305. [Google Scholar] [CrossRef]
- Cao, G.; Wu, L. Support Vector Regression with Fruit Fly Optimization Algorithm for Seasonal Electricity Consumption Forecasting. Energy 2016, 115, 734–745. [Google Scholar] [CrossRef]
- Xu, N.; Dang, Y.; Gong, Y. Novel Grey Prediction Model with Nonlinear Optimized Time Response Method for Forecasting of Electricity Consumption in China. ENERGY 2017, 118, 473–480. [Google Scholar] [CrossRef]
- Fahmi, F.; Sofyan, H. Forecasting Household Electricity Consumption in the Province of Aceh Using Combination Time Series Model. In Proceedings of the 2017 International Conference on Electrical Engineering and Informatics (ICELTICs); IEEE: Banda Aceh, October, 2017; pp. 97–102. [Google Scholar]
- Suksawang, P.; Suphachan, S.; Kaewnuch, K. Electricity Consumption Forecasting in Thailand Using Hybrid Model SARIMA and Gaussian Process with Combine Kernel Function Technique. Int. J. Energy Econ. Policy 2018, 8, 98–109. [Google Scholar]
- Han, X.; Chang, J. A Hybrid Prediction Model Based on Improved Multivariable Grey Model for Long-Term Electricity Consumption. Electr. Eng. 2021, 103, 1031–1043. [Google Scholar] [CrossRef]
- Jiang, W.; Wu, X.; Gong, Y.; Yu, W.; Zhong, X. Holt-Winters Smoothing Enhanced by Fruit Fly Optimization Algorithm to Forecast Monthly Electricity Consumption. ENERGY 2020, 193, 807–814. [Google Scholar] [CrossRef]
- Xie, W.; Wu, W.-Z.; Liu, C.; Zhao, J. Forecasting Annual Electricity Consumption in China by Employing a Conformable Fractional Grey Model in Opposite Direction. Energy 2020, 202. [Google Scholar] [CrossRef]
- Velasquez, C.E.; Zocatelli, M.; Estanislau, F.B.G.L.; Castro, V.F. Analysis of Time Series Models for Brazilian Electricity Demand Forecasting. Energy 2022, 247, 123483. [Google Scholar] [CrossRef]
- Du, X.; Wu, D.; Yan, Y. Prediction of Electricity Consumption Based on GM(1,Nr) Model in Jiangsu Province, China. Energy 2023, 262. [Google Scholar] [CrossRef]
- González Grandón, T.; Schwenzer, J.; Steens, T.; Breuing, J. Electricity Demand Forecasting with Hybrid Classical Statistical and Machine Learning Algorithms: Case Study of Ukraine. Appl. Energy 2024, 355. [Google Scholar] [CrossRef]
- Li, X.; Wang, Z.; Yang, C.; Bozkurt, A. An Advanced Framework for Net Electricity Consumption Prediction: Incorporating Novel Machine Learning Models and Optimization Algorithms. Energy 2024, 296. [Google Scholar] [CrossRef]
- Li, C.; Qi, Q. A Novel Hybrid Grey System Forecasting Model Based on Seasonal Fluctuation Characteristics for Electricity Consumption in Primary Industry. Energy 2024, 287. [Google Scholar] [CrossRef]
- Alharbi, F.R.; Csala, D. A Seasonal Autoregressive Integrated Moving Average with Exogenous Factors (SARIMAX) Forecasting Model-Based Time Series Approach. Inventions 2022, 7. [Google Scholar] [CrossRef]
- Zyoud, S.H. Global Scientific Trends on Aflatoxin Research during 1998–2017: A Bibliometric and Visualized Study. J. Occup. Med. Toxicol. 2019, 14, 27. [Google Scholar] [CrossRef] [PubMed]
- Moher, D.; Shamseer, L.; Clarke, M.; Ghersi, D.; Alessandro, L.; Petticrew, M.; Shekelle, P.; A Stewart, L. Preferred Reporting Items for Systematic Review and Meta-Analysis Protocols (PRISMA-P) 2015 Statement. Syst. Rev. 2015, 4, 1. [Google Scholar] [CrossRef] [PubMed]
- Zakaria, R.; Ahmi, A.; Ahmad, A.H.; Othman, Z. Worldwide Melatonin Research: A Bibliometric Analysis of the Published Literature between 2015 and 2019. Chronobiol. Int. 2021, 38, 27–37. [Google Scholar] [CrossRef] [PubMed]
- Shirzadi, N.; Nizami, A.; Khazen, M.; Nik-Bakht, M. Medium-Term Regional Electricity Load Forecasting through Machine Learning and Deep Learning. Designs 2021, 5. [Google Scholar] [CrossRef]
- Son, N.; Shin, Y. Short- and Medium-Term Electricity Consumption Forecasting Using Prophet and GRU. SUSTAINABILITY 2023, 15. [Google Scholar] [CrossRef]
- Yin, C.; Liu, K.; Zhang, Q.; Hu, K.; Yang, Z.; Yang, L.; Zhao, N. SARIMA-Based Medium- and Long-Term Load Forecasting. Strateg. Plan. Energy Environ. 2023, 42, 283–306. [Google Scholar] [CrossRef]
- Fields, N.; Collier, W.; Kiley, F.; Caulker, D.; Blyth, W.; Howells, M.; Brown, E. Long-Term Forecasting: A MAED Application for Sierra Leone’s Electricity Demand (2023–2050). Energies 2024, 17, 2878. [Google Scholar] [CrossRef]
- Liu, S.; Zeng, A.; Lau, K.; Ren, C.; Chan, P.; Ng, E. Predicting Long-Term Monthly Electricity Demand under Future Climatic and Socioeconomic Changes Using Data-Driven Methods: A Case Study of Hong Kong. Sustain. Cities Soc. 2021, 70. [Google Scholar] [CrossRef]
- Fields, N.; Collier, W.; Kiley, F.; Caulker, D.; Blyth, W.; Howells, M.; Brown, E. Long-Term Forecasting: A MAED Application for Sierra Leone’s Electricity Demand (2023–2050). Energies 2024, 17. [Google Scholar] [CrossRef]
- Delima, A.J.P. Application of Time Series Analysis in Projecting Philippines’ Electric Consumption. Int. J. Mach. Learn. Comput. 2019, 9, 694–699. [Google Scholar] [CrossRef]
- Sarkodie, S.A. Estimating Ghana’s Electricity Consumption by 2030: An ARIMA Forecast. Energy Sources Part B Econ. Plan. Policy 2017, 12, 936–944. [Google Scholar] [CrossRef]
- de Oliveira, E.M.; Cyrino Oliveira, F.L. Forecasting Mid-Long Term Electric Energy Consumption through Bagging ARIMA and Exponential Smoothing Methods. Energy 2018, 144, 776–788. [Google Scholar] [CrossRef]
- Hussain, A.; Rahman, M.; Memon, J.A. Forecasting Electricity Consumption in Pakistan: The Way Forward. Energy Policy 2016, 90, 73–80. [Google Scholar] [CrossRef]
- Kadri, R.; Kahoui, H.; Sahed, A. Electricity Consumption Forecasting in Algeria: A Comparison of ARIMA and GM (1,1) Models. Glob. Bus. 2023, 8, 15–24. [Google Scholar] [CrossRef]
- Jamil, R. Hydroelectricity Consumption Forecast for Pakistan Using ARIMA Modeling and Supply-Demand Analysis for the Year 2030. Renew. Energy 2020, 154, 1–10. [Google Scholar] [CrossRef]
- Adedokun, A. Nigeria Electricity Forecast and Vision 20: 2020: Evidence from ARIMA Model. Energy Sources Part B Econ. Plan. Policy 2016, 11, 1027–1034. [Google Scholar] [CrossRef]
- Fahmy, M.S. Eid.; Ahmed, F.; Durani, F.; Bojnec, Š.; Ghareeb, M.M. Predicting Electricity Consumption in the Kingdom of Saudi Arabia. Energies 2023, 16. [Google Scholar]
- Hu, Z.; Ma, J.; Yang, L.; Li, X.; Pang, M. Decomposition-Based Dynamic Adaptive Combination Forecasting for Monthly Electricity Demand. Sustain. Switz. 2019, 11. [Google Scholar] [CrossRef]
- Sim, S.E.; Tay, K.G.; Huong, A.; Tiong, W.K. Forecasting Electricity Consumption Using SARIMA Method in IBM SPSS Software. Univers. J. Electr. Electron. Eng. 2019, 6, 103–114. [Google Scholar] [CrossRef]
- Mansor, R.; Zaini, B.J.; Yee, C.S. Forecasting of Electricity Consumption and Supply for Campus University Using Time Series Models. Int. J. Supply Chain Manag. 2019, 8, 467–472. [Google Scholar]
- Zhou, X.; Gao, Y.; Yao, W.; Yu, N. A Robust Segmented Mixed Effect Regression Model for Baseline Electricity Consumption Forecasting. J. Mod. POWER Syst. CLEAN ENERGY 2022, 10, 71–80. [Google Scholar] [CrossRef]
- Rekhade, R.; Sakhare, D.K. Forecasting Sector-Wise Electricity Consumption for India Using Various Regression Models. Curr. Sci. 2021, 121, 365–371. [Google Scholar] [CrossRef]
- Yang, H.; Ran, M.; Zhuang, C. Prediction of Building Electricity Consumption Based on Joinpoint−Multiple Linear Regression. Energies 2022, 15. [Google Scholar] [CrossRef]
- Kavaklioglu, K. Principal Components Based Robust Vector Autoregression Prediction of Turkey’s Electricity Consumption. Energy Syst. 2019, 10, 889–910. [Google Scholar] [CrossRef]
- Zeng, L.; Liu, C.; Wu, W.-Z. A Novel Discrete GM(2,1) Model with a Polynomial Term for Forecasting Electricity Consumption. Electr. Power Syst. Res. 2023, 214. [Google Scholar] [CrossRef]
- Sun, L.; Yang, Y.; Ning, T.; Zhu, J. A Novel Grey Power-Markov Model for the Prediction of China’s Electricity Consumption. Environ. Sci. Pollut. Res. 2022, 29, 21717–21738. [Google Scholar] [CrossRef] [PubMed]
- Zhou, W.; Jiang, R.; Ding, S.; Cheng, Y.; Li, Y.; Tao, H. A Novel Grey Prediction Model for Seasonal Time Series. Knowl.-Based Syst. 2021; 229. [Google Scholar]
- Dang, Y.; Zhang, Y.; Wang, J. A Novel Multivariate Grey Model for Forecasting Periodic Oscillation Time Series. Expert Syst. Appl. 2023, 211. [Google Scholar] [CrossRef]
- Zhou, W.; Li, H.; Zhang, Z. A Novel Rolling and Fractional-Ordered Grey System Model and Its Application for Predicting Industrial Electricity Consumption. J. Syst. Sci. Syst. Eng. 2024, 33, 207–231. [Google Scholar] [CrossRef]
- Du, P.; Guo, J.; Sun, S.; Wang, S.; Wu, J. A Novel Two-Stage Seasonal Grey Model for Residential Electricity Consumption Forecasting. Energy 2022, 258. [Google Scholar] [CrossRef]
- Wang, Z.-X.; Li, Q.; Pei, L.-L. A Seasonal GM(1,1) Model for Forecasting the Electricity Consumption of the Primary Economic Sectors. Energy 2018, 154, 522–534. [Google Scholar] [CrossRef]
- Wang, J.; Du, P.; Lu, H.; Yang, W.; Niu, T. An Improved Grey Model Optimized by Multi-Objective Ant Lion Optimization Algorithm for Annual Electricity Consumption Forecasting. Appl. SOFT Comput. 2018, 72, 321–337. [Google Scholar] [CrossRef]
- Ayvaz, B.; Kusakci, A.O. Electricity Consumption Forecasting for Turkey with Nonhomogeneous Discrete Grey Model. Energy Sources Part B Econ. Plan. Policy 2017, 12, 260–267. [Google Scholar] [CrossRef]
- Hu, Y.-C. Electricity Consumption Prediction Using a Neural-Network-Based Grey Forecasting Approach. J. Oper. Res. Soc. 2017, 68, 1259–1264. [Google Scholar] [CrossRef]
- Verma, A. Empowering Tomorrow: Innovative Forecasting for UAE’s Electricity Consumption. Int. J. Inf. Manag. Sci. 2024, 35, 1–20. [Google Scholar]
- Ding, S.; Hipel, K.W.; Dang, Y. Forecasting China’s Electricity Consumption Using a New Grey Prediction Model. ENERGY 2018, 149, 314–328. [Google Scholar] [CrossRef]
- Zhou, W.; Tao, H.; Chang, J.; Jiang, H.; Chen, L. Forecasting Chinese Electricity Consumption Based on Grey Seasonal Model with New Information Priority. Sustain. Switz. 2023, 15. [Google Scholar] [CrossRef]
- Li, K.; Zhang, T. Forecasting Electricity Consumption Using an Improved Grey Prediction Model. INFORMATION 2018, 9. [Google Scholar] [CrossRef]
- Zeng, B.; Tan, Y.; Xu, H.; Quan, J.; Wang, L.; Zhou, X. Forecasting the Electricity Consumption of Commercial Sector in Hong Kong Using a Novel Grey Dynamic Prediction Model. J. Grey Syst. 2018, 30, 159–174. [Google Scholar]
- Tang, T.; Jiang, W.; Zhang, H.; Nie, J.; Xiong, Z.; Wu, X.; Feng, W. GM(1,1) Based Improved Seasonal Index Model for Monthly Electricity Consumption Forecasting. Energy 2022, 252. [Google Scholar] [CrossRef]
- Wang, C.-N.; Nguyen, N.-T.; Tran, T.-T. Integrated DEA Models and Grey System Theory to Evaluate Past-to-Future Performance: A Case of Indian Electricity Industry. Sci. World J. 2015, 2015. [Google Scholar] [CrossRef]
- Wu, W.-Z.; Pang, H.; Zheng, C.; Xie, W.; Liu, C. Predictive Analysis of Quarterly Electricity Consumption via a Novel Seasonal Fractional Nonhomogeneous Discrete Grey Model: A Case of Hubei in China. Energy 2021, 229. [Google Scholar] [CrossRef]
- Mi, C.; Gou, X.; Ren, Y.; Zeng, B.; Khalid, J.; Ma, Y. Seasonal Electricity Consumption Forecasting: An Approach with Novel Weakening Buffer Operator and Fractional Order Accumulation Grey Model. Grey Syst. 2024, 14, 414–428. [Google Scholar] [CrossRef]
- Pu, B.; Nan, F.; Zhu, N.; Yuan, Y.; Xie, W. UFNGBM (1,1): A Novel Unbiased Fractional Grey Bernoulli Model with Whale Optimization Algorithm and Its Application to Electricity Consumption Forecasting in China. Energy Rep. 2021, 7, 7405–7423. [Google Scholar] [CrossRef]
- Wu, L.; Gao, X.; Xiao, Y.; Yang, Y.; Chen, X. Using a Novel Multi-Variable Grey Model to Forecast the Electricity Consumption of Shandong Province in China. Energy 2018, 157, 327–335. [Google Scholar] [CrossRef]
- Zhu, X.; Dang, Y.; Ding, S. Using a Self-Adaptive Grey Fractional Weighted Model to Forecast Jiangsu’s Electricity Consumption in China. ENERGY 2020, 190. [Google Scholar] [CrossRef]
- Zhou, C.; Shen, Y.; Wu, H.; Wang, J. Using Fractional Discrete Verhulst Model to Forecast Fujian’s Electricity Consumption in China. Energy 2022, 255. [Google Scholar]
- Zhao, H.; Zhao, H.; Guo, S. Using GM (1,1) Optimized by MFO with Rolling Mechanism to Forecast the Electricity Consumption of Inner Mongolia. Appl. Sci.-BASEL, 2016; 6. [Google Scholar]
- Almuhaini, S.H.; Sultana, N. Forecasting Long-Term Electricity Consumption in Saudi Arabia Based on Statistical and Machine Learning Algorithms to Enhance Electric Power Supply Management. Energies 2023, 16. [Google Scholar] [CrossRef]
- Shine, P.; Scully, T.; Upton, J.; Murphy, M.D. Annual Electricity Consumption Prediction and Future Expansion Analysis on Dairy Farms Using a Support Vector Machine. Appl. Energy 2019, 250, 1110–1119. [Google Scholar] [CrossRef]
- Fan, G.-F.; Zhang, R.-T.; Cao, C.-C.; Yeh, Y.-H.; Hong, W.-C. Applications of Empirical Wavelet Decomposition, Statistical Feature Extraction, and Antlion Algorithm with Support Vector Regression for Resident Electricity Consumption Forecasting. NONLINEAR Dyn. 2023, 111, 20139–20163. [Google Scholar] [CrossRef]
- Rubio-León, J.; Rubio-Cienfuegos, J.; Vidal-Silva, C.; Cárdenas-Cobo, J.; Duarte, V. Applying Fuzzy Time Series for Developing Forecasting Electricity Demand Models. Mathematics 2023, 11. [Google Scholar] [CrossRef]
- Pang, X.; Luan, C.; Liu, L.; Liu, W.; Zhu, Y. Data-Driven Random Forest Forecasting Method of Monthly Electricity Consumption. Electr. Eng. 2022, 104, 2045–2059. [Google Scholar] [CrossRef]
- Sun, L.; Lin, Y.; Pan, N.; Fu, Q.; Chen, L.; Yang, J. Demand-Side Electricity Load Forecasting Based on Time-Series Decomposition Combined with Kernel Extreme Learning Machine Improved by Sparrow Algorithm. Energies 2023, 16. [Google Scholar] [CrossRef]
- Laurinec, P.; Loderer, M.; Lucka, M.; Rozinajova, V. Density-Based Unsupervised Ensemble Learning Methods for Time Series Forecasting of Aggregated or Clustered Electricity Consumption. J. IN℡LIGENT Inf. Syst. 2019, 53, 219–239. [Google Scholar] [CrossRef]
- Rathod, R.R.; Garg, R.D. Design of Electricity Tariff Plans Using Gap Statistic for K-Means Clustering Based on Consumers Monthly Electricity Consumption Data. Int. J. Energy Sect. Manag. 2017, 11, 295–310. [Google Scholar] [CrossRef]
- Paikaray, B.K.; Jena, S.P.; Mondal, J.; Van Thuan, N.; Tung, N.T.; Mallick, C. Electricity Consumption Classification Using Various Machine Learning Models. EAI Endorsed Trans. Energy Web 2024, 11, 1–6. [Google Scholar] [CrossRef]
- Tay, K.G.; Muwafaq, H.; Tiong, W.K.; Choy, Y.Y. Electricity Consumption Forecasting Using Adaptive Neuro-Fuzzy Inference System (ANFIS). Univers. J. Electr. Electron. Eng. 2019, 6, 37–48. [Google Scholar] [CrossRef]
- Baur, L.; Ditschuneit, K.; Schambach, M.; Kaymakci, C.; Wollmann, T.; Sauer, A. Explainability and Interpretability in Electric Load Forecasting Using Machine Learning Techniques – A Review. Energy AI 2024, 16. [Google Scholar] [CrossRef]
- Hwang, J.; Suh, D.; Otto, M.-O. Forecasting Electricity Consumption in Commercial Buildings Using a Machine Learning Approach. Energies 2020, 13. [Google Scholar] [CrossRef]
- Sen, D.; Tunc, K.M.M.; Gunay, M.E. Forecasting Electricity Consumption of OECD Countries: A Global Machine Learning Modeling Approach. Util. POLICY 2021, 70. [Google Scholar] [CrossRef]
- Jurado, S.; Nebot, À.; Mugica, F.; Avellana, N. Hybrid Methodologies for Electricity Load Forecasting: Entropy-Based Feature Selection with Machine Learning and Soft Computing Techniques. Energy 2015, 86, 276–291. [Google Scholar] [CrossRef]
- Gómez-Omella, M.; Esnaola-Gonzalez, I.; Ferreiro, S.; Sierra, B. K-Nearest Patterns for Electrical Demand Forecasting in Residential and Small Commercial Buildings. Energy Build. 2021, 253. [Google Scholar] [CrossRef]
- Torrini, F.C.; Souza, R.C.; Cyrino Oliveira, F.L.; Moreira Pessanha, J.F. Long Term Electricity Consumption Forecast in Brazil: A Fuzzy Logic Approach. Socioecon. Plann. Sci. 2016, 54, 18–27. [Google Scholar] [CrossRef]
- Elkamel, M.; Schleider, L.; Pasiliao, E.L.; Diabat, A.; Zheng, Q.P. Long-Term Electricity Demand Prediction via Socioeconomic Factors-a Machine Learning Approach with Florida as a Case Study. Energies 2020, 13. [Google Scholar] [CrossRef]
- Hosseini, S.; Fard, R.H. Machine Learning Algorithms for Predicting Electricity Consumption of Buildings. Wirel. Pers. Commun. 2021, 121, 3329–3341. [Google Scholar] [CrossRef]
- Al Metrik, M.A.; Musleh, D.A. Machine Learning Empowered Electricity Consumption Prediction. Comput. Mater. Contin. 2022, 72, 1427–1444. [Google Scholar] [CrossRef]
- Albuquerque, P.C.; Cajueiro, D.O.; Rossi, M.D.C. Machine Learning Models for Forecasting Power Electricity Consumption Using a High Dimensional Dataset. EXPERT Syst. Appl. 2022, 187. [Google Scholar] [CrossRef]
- Chen, Y.-T.; Sun, E.W.; Lin, Y.-B. Machine Learning with Parallel Neural Networks for Analyzing and Forecasting Electricity Demand. Comput. Econ. 2020, 56, 569–597. [Google Scholar] [CrossRef]
- Zini, M.; Carcasci, C. Machine Learning-Based Monitoring Method for the Electricity Consumption of a Healthcare Facility in Italy. Energy 2023, 262. [Google Scholar] [CrossRef]
- Charfeddine, L.; Zaidan, E.; Alban, A.Q.; Bennasr, H.; Abulibdeh, A. Modeling and Forecasting Electricity Consumption amid the COVID-19 Pandemic: Machine Learning vs. Nonlinear Econometric Time Series Models. Sustain. Cities Soc. 2023, 98. [Google Scholar] [CrossRef]
- Banik, R.; Das, P.; Ray, S.; Biswas, A. Prediction of Electrical Energy Consumption Based on Machine Learning Technique. Electr. Eng. 2021, 103, 909–920. [Google Scholar] [CrossRef]
- Liang, M.; Guo, R.; Li, H.; Wu, J.; Sun, X. T-LGBKS: An Interpretable Machine Learning Framework for Electricity Consumption Forecasting. Energies 2023, 16. [Google Scholar] [CrossRef]
- Lazzari, F.; Mor, G.; Cipriano, J.; Gabaldon, E.; Grillone, B.; Chemisana, D.; Solsona, F. User Behaviour Models to Forecast Electricity Consumption of Residential Customers Based on Smart Metering Data. Energy Rep. 2022, 8, 3680–3691. [Google Scholar] [CrossRef]
- Neo, H.Y.R.; Wong, N.H.; Ignatius, M.; Cao, K. A Hybrid Machine Learning Approach for Forecasting Residential Electricity Consumption: A Case Study in Singapore. ENERGY Environ. 2023. [CrossRef]
- Ramos, D.; Faria, P.; Gomes, L.; Vale, Z. A Contextual Reinforcement Learning Approach for Electricity Consumption Forecasting in Buildings. IEEE Access 2022, 10, 61366–61374. [Google Scholar] [CrossRef]
- Balaji, A.J.; Harish Ram, D.S.; Nair, B.B. A Deep Learning Approach to Electric Energy Consumption Modeling. J. Intell. Fuzzy Syst. 2019, 36, 4049–4055. [Google Scholar] [CrossRef]
- Atik, I. A New CNN-Based Method for Short-Term Forecasting of Electrical Energy Consumption in the Covid-19 Period: The Case of Turkey. IEEE Access 2022, 10, 22586–22598. [Google Scholar] [CrossRef]
- Tian, M.-W.; Alattas, K.; El-Sousy, F.; Alanazi, A.; Mohammadzadeh, A.; Tavoosi, J.; Mobayen, S.; Skruch, P. A New Short Term Electrical Load Forecasting by Type-2 Fuzzy Neural Networks. Energies 2022, 15. [Google Scholar] [CrossRef]
- Shao, X.; Kim, C.-S.; Sontakke, P. Accurate Deep Model for Electricity Consumption Forecasting Using Multi-Channel and Multi-Scale Feature Fusion CNN-LSTM. Energies 2020, 13. [Google Scholar] [CrossRef]
- Chung, J.; Jang, B. Accurate Prediction of Electricity Consumption Using a Hybrid CNN-LSTM Model Based on Multivariable Data. PLoS ONE 2022, 17. [Google Scholar] [CrossRef] [PubMed]
- Dedinec, A.; Filiposka, S.; Dedinec, A.; Kocarev, L. Deep Belief Network Based Electricity Load Forecasting: An Analysis of Macedonian Case. Energy 2016, 115, 1688–1700. [Google Scholar] [CrossRef]
- Bedi, J.; Toshniwal, D. Deep Learning Framework to Forecast Electricity Demand. Appl. Energy 2019, 238, 1312–1326. [Google Scholar] [CrossRef]
- Qureshi, M.; Arbab, M.A.; Rehman, S. ur Deep Learning-Based Forecasting of Electricity Consumption. Sci. Rep. 2024, 14. [Google Scholar] [CrossRef]
- Oprea, S.-V.; Pirjan, A.; Carutasu, G.; Petrosanu, D.-M.; Bara, A.; Stanica, J.-L.; Coculescu, C. Developing a Mixed Neural Network Approach to Forecast the Residential Electricity Consumption Based on Sensor Recorded Data. SENSORS 2018, 18. [Google Scholar] [CrossRef]
- Machado, E.; Pinto, T.; Guedes, V.; Morais, H. Electrical Load Demand Forecasting Using Feed-Forward Neural Networks. Energies 2021, 14. [Google Scholar] [CrossRef]
- Petroșanu, D.-M.; Pîrjan, A. Electricity Consumption Forecasting Based on a Bidirectional Long-Short-Term Memory Artificial Neural Network. Sustain. Switz. 2021, 13, 1–31. [Google Scholar] [CrossRef]
- Tay, K.G.; Muwafaq, H.; Ismail, S.B.; Ong, P. Electricity Consumption Forecasting Using Nonlinear Autoregressive with External (Exogeneous) Input Neural Network. Univers. J. Electr. Electron. Eng. 2019, 6, 26–36. [Google Scholar] [CrossRef]
- Deina, C.; dos Santos, J.L.F.; Biuk, L.H.; Lizot, M.; Converti, A.; Siqueira, H.V.; Trojan, F. Forecasting Electricity Demand by Neural Networks and Definition of Inputs by Multi-Criteria Analysis. Energies 2023, 16. [Google Scholar] [CrossRef]
- Thangavel, A.; Govindaraj, V. Forecasting Energy Demand Using Conditional Random Field and Convolution Neural Network. Elektron. Ir Elektrotechnika 2022, 28, 12–22. [Google Scholar] [CrossRef]
- Kiprijanovska, I.; Stankoski, S.; Ilievski, I.; Jovanovski, S.; Gams, M.; Gjoreski, H. HousEEC: Day-Ahead Household Electrical Energy Consumption Forecasting Using Deep Learning. Energies 2020, 13. [Google Scholar] [CrossRef]
- Ramos, D.; Faria, P.; Vale, Z.; Mourinho, J.; Correia, R. Industrial Facility Electricity Consumption Forecast Using Artificial Neural Networks and Incremental Learning. Energies 2020, 13. [Google Scholar] [CrossRef]
- Bandyopadhyay, A.; Sarkar, B.D.; Hossain, Md.E.; Rej, S.; Mallick, M.A. Modelling and Forecasting India’s Electricity Consumption Using Artificial Neural Networks. OPEC ENERGY Rev. 2024, 48, 65–77. [Google Scholar] [CrossRef]
- Li, Z.; Li, K.; Wang, F.; Xuan, Z.; Mi, Z.; Li, W.; Dehghanian, P.; Fotuhi-Firuzabad, M. Monthly Electricity Consumption Forecasting: A Step-Reduction Strategy and Autoencoder Neural Network. IEEE Ind. Appl. Mag. 2021, 27, 90–102. [Google Scholar] [CrossRef]
- Bouktif, S.; Fiaz, A.; Ouni, A.; Serhani, M.A. Optimal Deep Learning LSTM Model for Electric Load Forecasting Using Feature Selection and Genetic Algorithm: Comparison with Machine Learning Approaches. Energies 2018, 11. [Google Scholar] [CrossRef]
- Zhou, X.; Wang, J.; Wang, H.; Lin, J. Panel Semiparametric Quantile Regression Neural Network for Electricity Consumption Forecasting. Ecol. Inform. 2022, 67. [Google Scholar] [CrossRef]
- Rahman, A.; Srikumar, V.; Smith, A.D. Predicting Electricity Consumption for Commercial and Residential Buildings Using Deep Recurrent Neural Networks. Appl. Energy 2018, 212, 372–385. [Google Scholar] [CrossRef]
- Zhou, Y.; Zhang, S.; Wu, L.; Tian, Y. Predicting Sectoral Electricity Consumption Based on Complex Network Analysis. Appl. Energy 2019, 255. [Google Scholar] [CrossRef]
- Lu, S.; Xu, Q.; Jiang, C.; Liu, Y.; Kusiak, A. Probabilistic Load Forecasting with a Non-Crossing Sparse-Group Lasso-Quantile Regression Deep Neural Network. Energy 2022, 242. [Google Scholar] [CrossRef]
- Dianwei, C. Research on Electricity Consumption Forecasting Model Based on Wavelet Transform and Multi-Layer LSTM Model. ENERGY Rep. 2022, 8, 220–228. [Google Scholar]
- Zolfaghari, M.; Sahabi, B. A Hybrid Approach to Model and Forecast the Electricity Consumption by NeuroWavelet and ARIMAX-GARCH Models. Energy Effic. 2019, 12, 2099–2122. [Google Scholar] [CrossRef]
- Kaur, H.; Ahuja, S. A Hybrid Arima and Discrete Wavelet Transform Model for Predicting the Electricity Consumption of Punjab. Int. J. Innov. Technol. Explor. Eng. 2019, 8, 1915–1919. [Google Scholar] [CrossRef]
- Jiang, P.; Liu, F.; Song, Y. A Hybrid Forecasting Model Based on Date-Framework Strategy and Improved Feature Selection Technology for Short-Term Load Forecasting. Energy 2017, 119, 694–709. [Google Scholar] [CrossRef]
- Liu, C.; Sun, B.; Zhang, C.; Li, F. A Hybrid Prediction Model for Residential Electricity Consumption Using Holt-Winters and Extreme Learning Machine. Appl. Energy 2020, 275. [Google Scholar] [CrossRef]
- Meng, M.; Fu, Y.; Shi, H.; Wang, X. A Small-Sample Adaptive Hybrid Model for Annual Electricity Consumption Forecasting. Math. Probl. Eng. 2017, 2017. [Google Scholar] [CrossRef]
- Deb, M.; Chakrabarty, T.K. A Wavelet Based Hybrid SARIMA-ETS Model to Forecast Electricity Consumption. Oct. 2017 10, 408–430.
- Oladipo, S.O.; Sun, Y.; Amole, A.O. Analysis of the Impact of Clustering Techniques and Parameters on Evolutionary-Based Hybrid Models for Forecasting Electricity Consumption. IEEE ACCESS 2023, 11, 82838–82856. [Google Scholar] [CrossRef]
- Li, C.; Ding, Z.; Yi, J.; Lv, Y.; Zhang, G. Deep Belief Network Based Hybrid Model for Building Energy Consumption Prediction. Energies 2018, 11, 242. [Google Scholar] [CrossRef]
- Fan, G.-F.; Wei, X.; Li, Y.-T.; Hong, W.-C. Forecasting Electricity Consumption Using a Novel Hybrid Model. Sustain. Cities Soc. 2020, 61. [Google Scholar] [CrossRef]
- Fan, G.-F.; Zheng, Y.; Gao, W.-J.; Peng, L.-L.; Yeh, Y.-H.; Hong, W.-C. Forecasting Residential Electricity Consumption Using the Novel Hybrid Model. ENERGY Build. 2023, 290. [Google Scholar] [CrossRef]
- Sekhar, C.; Dahiya, R. Robust Framework Based on Hybrid Deep Learning Approach for Short Term Load Forecasting of Building Electricity Demand. Energy 2023, 268. [Google Scholar] [CrossRef]
- Saranj, A.; Zolfaghari, M. The Electricity Consumption Forecast: Adopting a Hybrid Approach by Deep Learning and ARIMAX-GARCH Models. Energy Rep. 2022, 8, 7657–7679. [Google Scholar] [CrossRef]
- Aria, M.; Cuccurullo, C. Bibliometrix : An R-Tool for Comprehensive Science Mapping Analysis. J. Informetr. 2017, 11, 959–975. [Google Scholar] [CrossRef]
|
Disclaimer/Publisher’s Note: The statements, opinions and data contained in all publications are solely those of the individual author(s) and contributor(s) and not of MDPI and/or the editor(s). MDPI and/or the editor(s) disclaim responsibility for any injury to people or property resulting from any ideas, methods, instructions or products referred to in the content. |
© 2024 by the authors. Licensee MDPI, Basel, Switzerland. This article is an open access article distributed under the terms and conditions of the Creative Commons Attribution (CC BY) license (https://creativecommons.org/licenses/by/4.0/).
