Submitted:
31 July 2024
Posted:
02 August 2024
You are already at the latest version
Abstract
Keywords:
1. Introduction
The Penrose Property with a Cosmological Constant
- ꓥ = 0; n = 3, 4 and m > 0
- ꓥ > 0; n > 3 and m > 0
2. Kerr-Newman Black Hole
2.1. Boyer-Lindquist metric


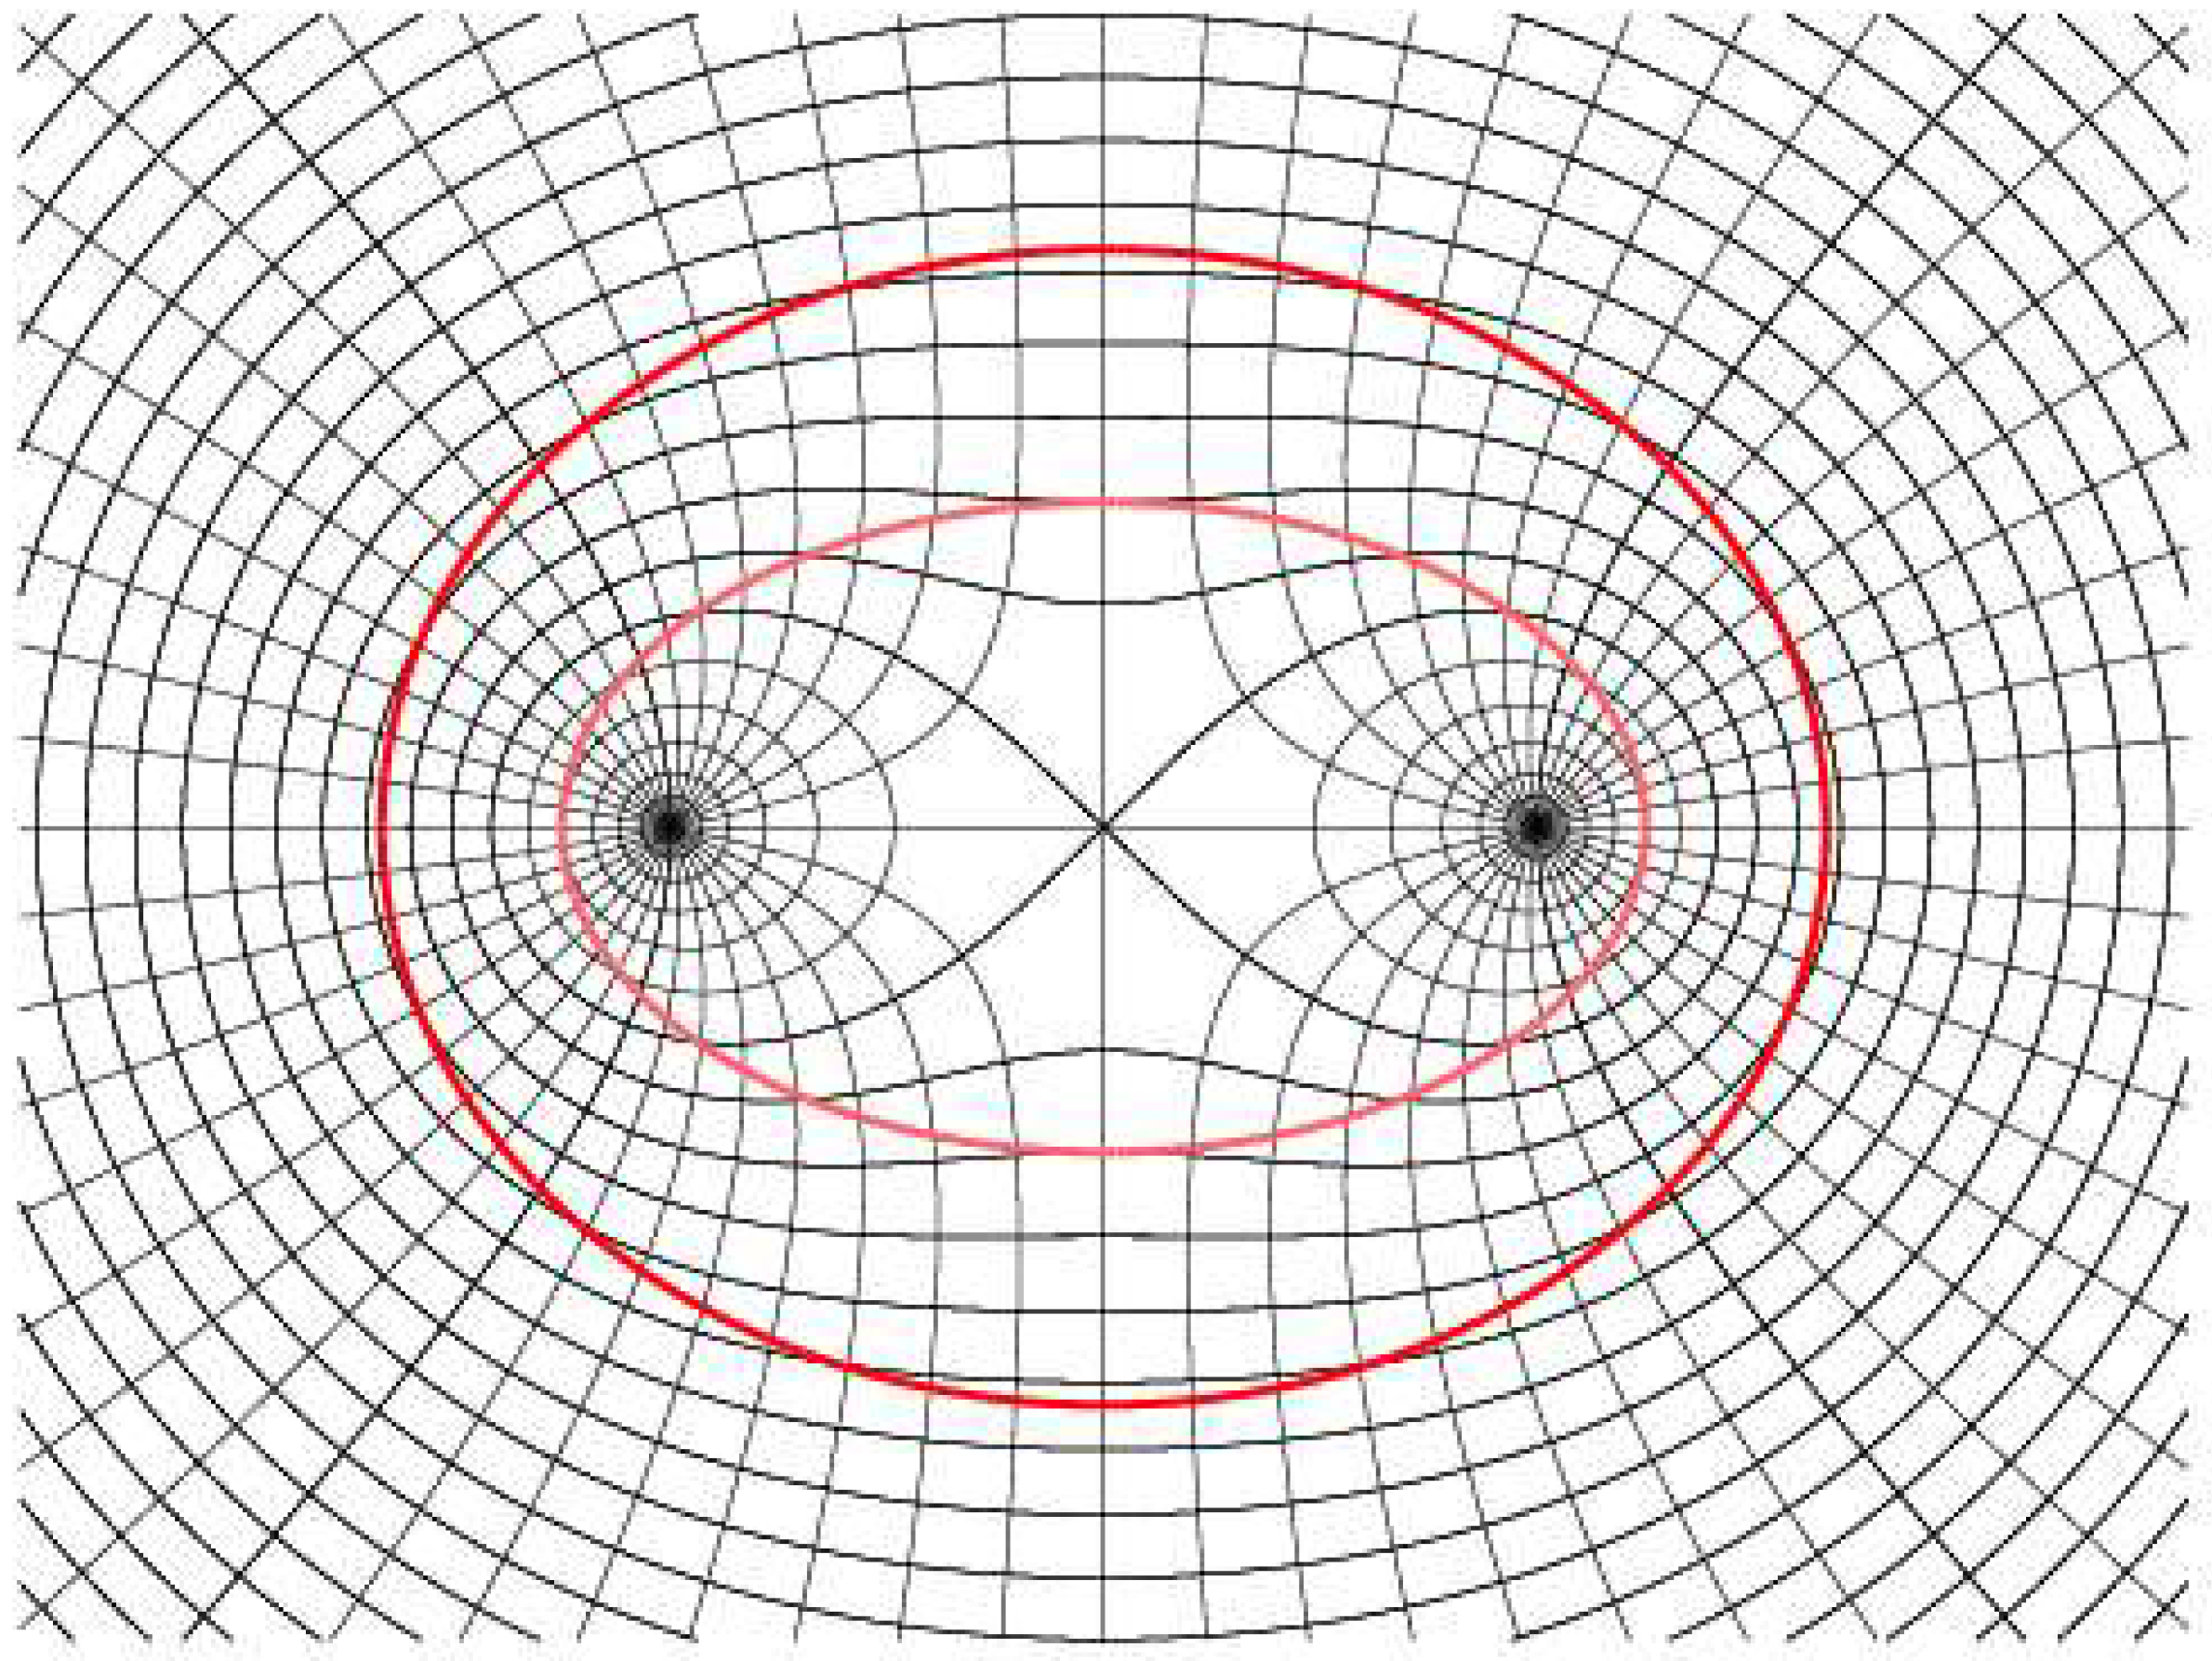
2.2. Oblate Spheroidal Coordinates


2.3. Time and Rotation Symmetries

2.4. Ring Singularity

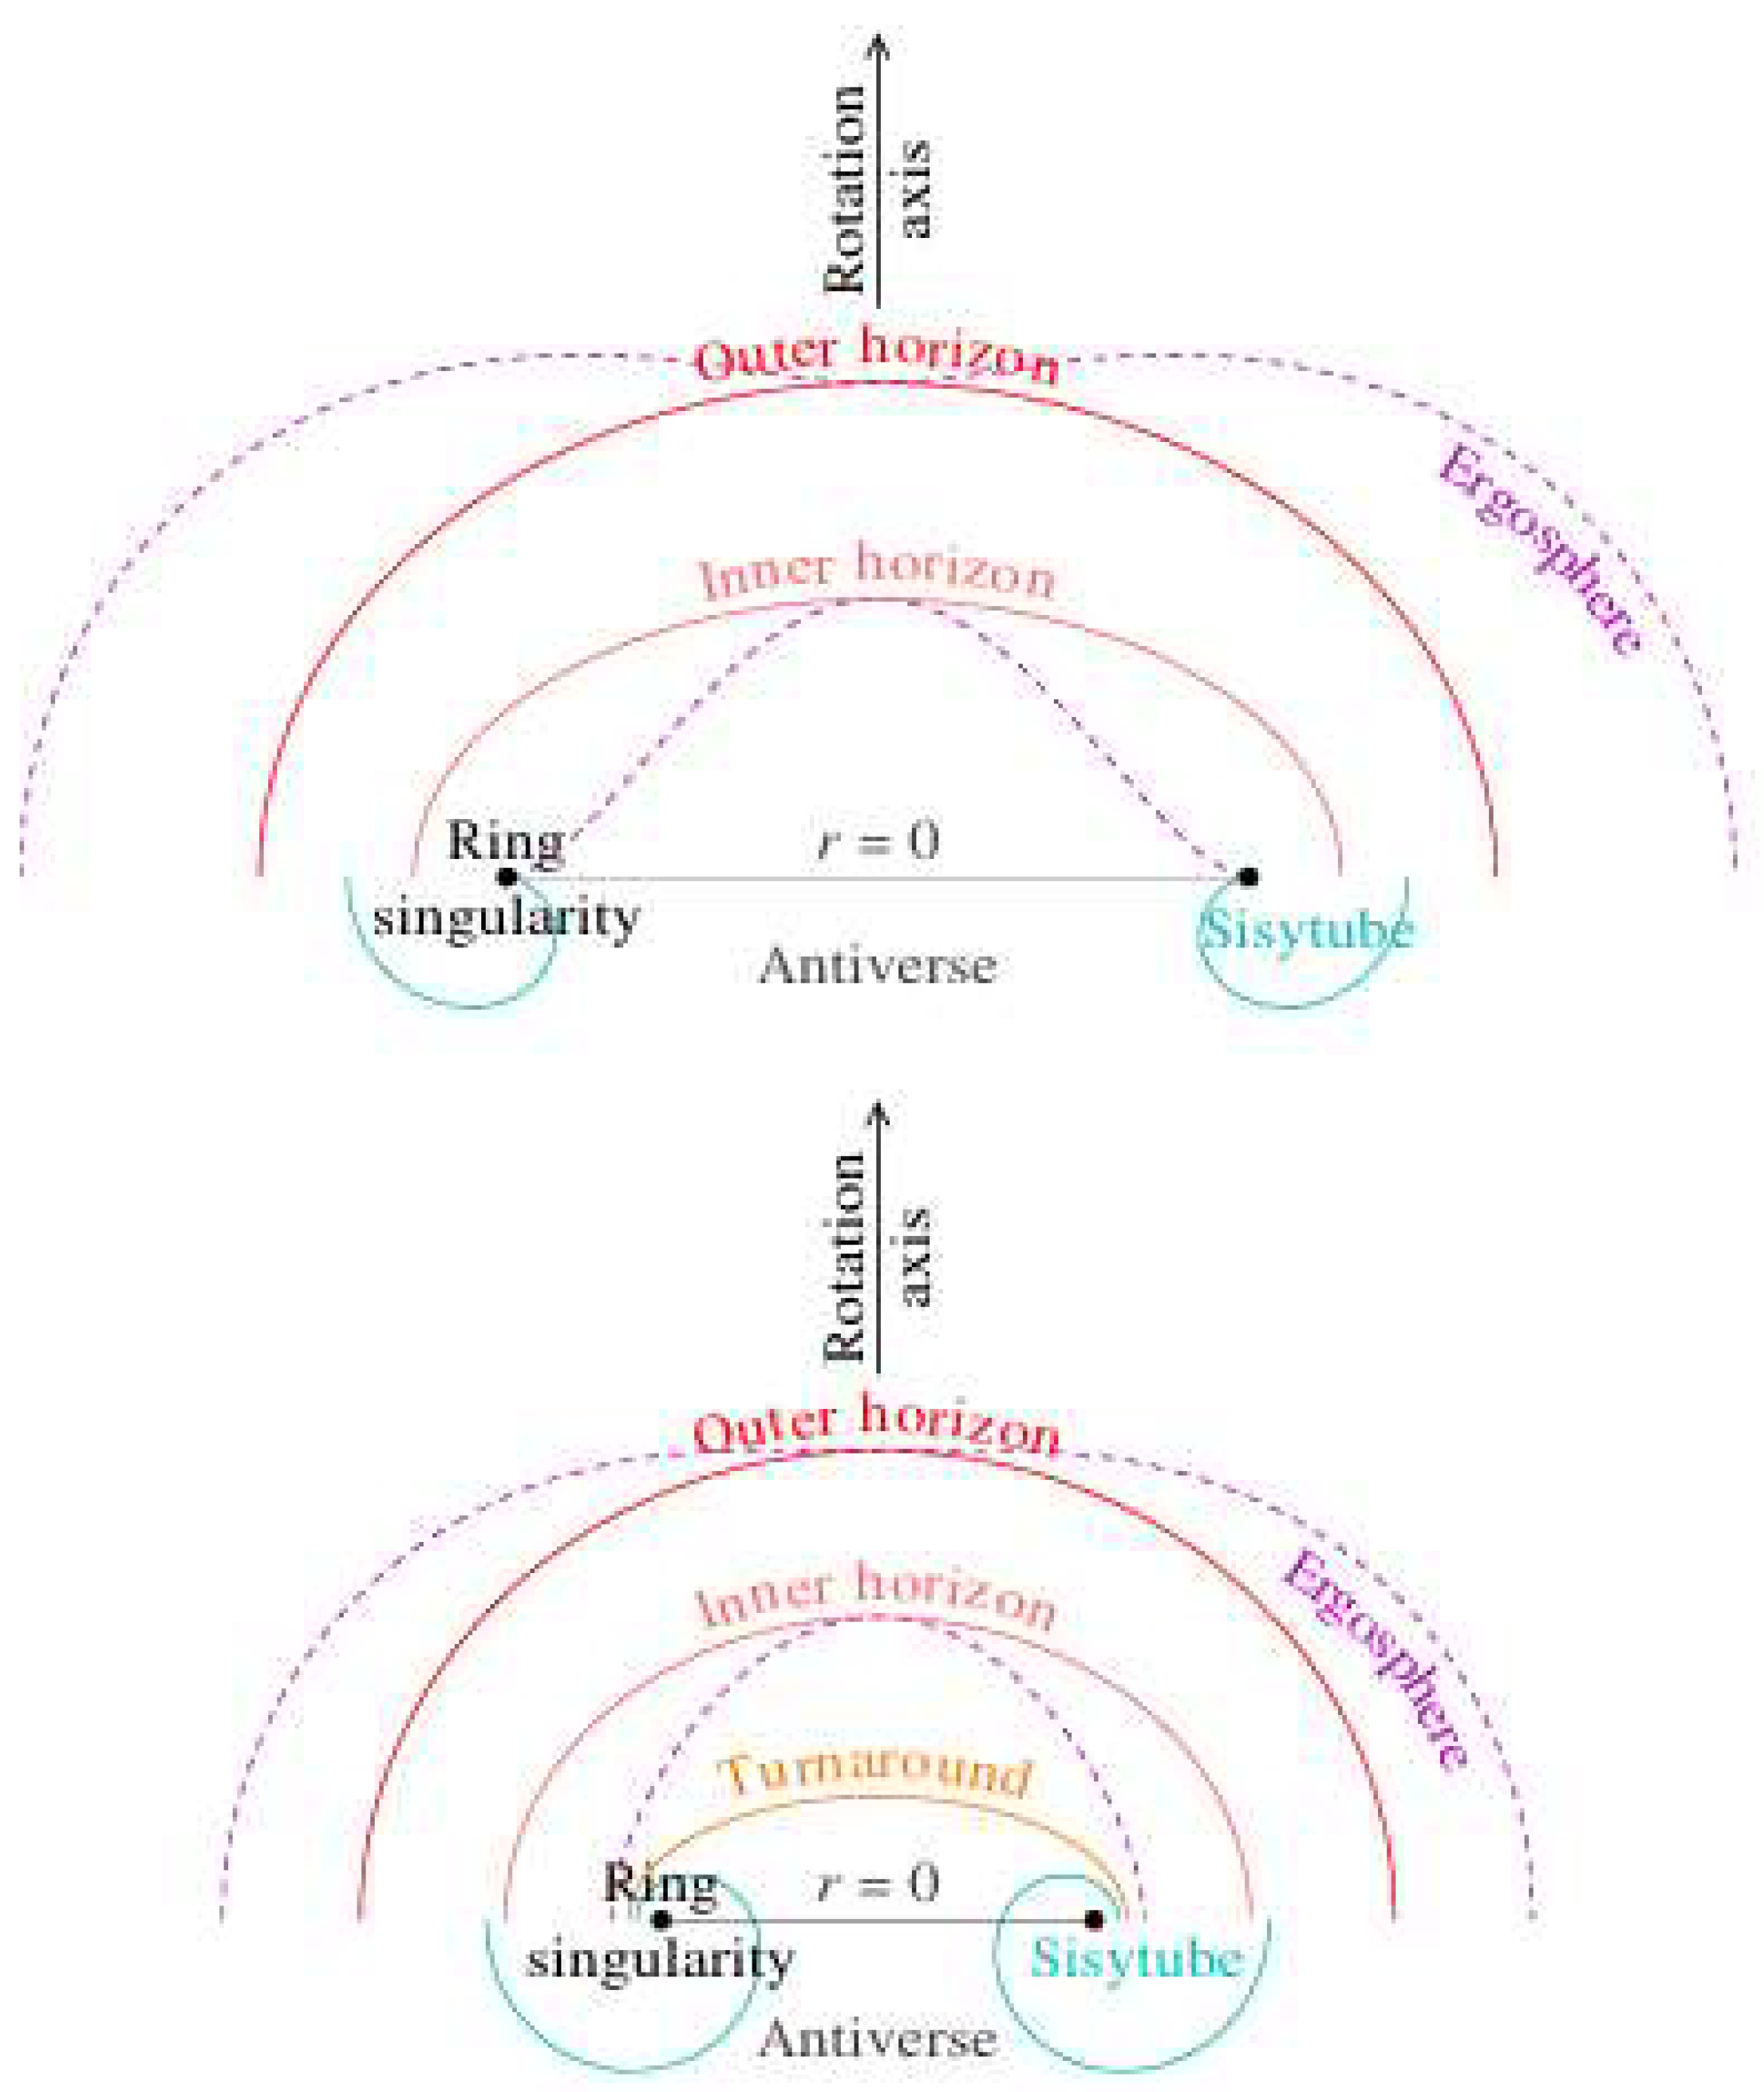
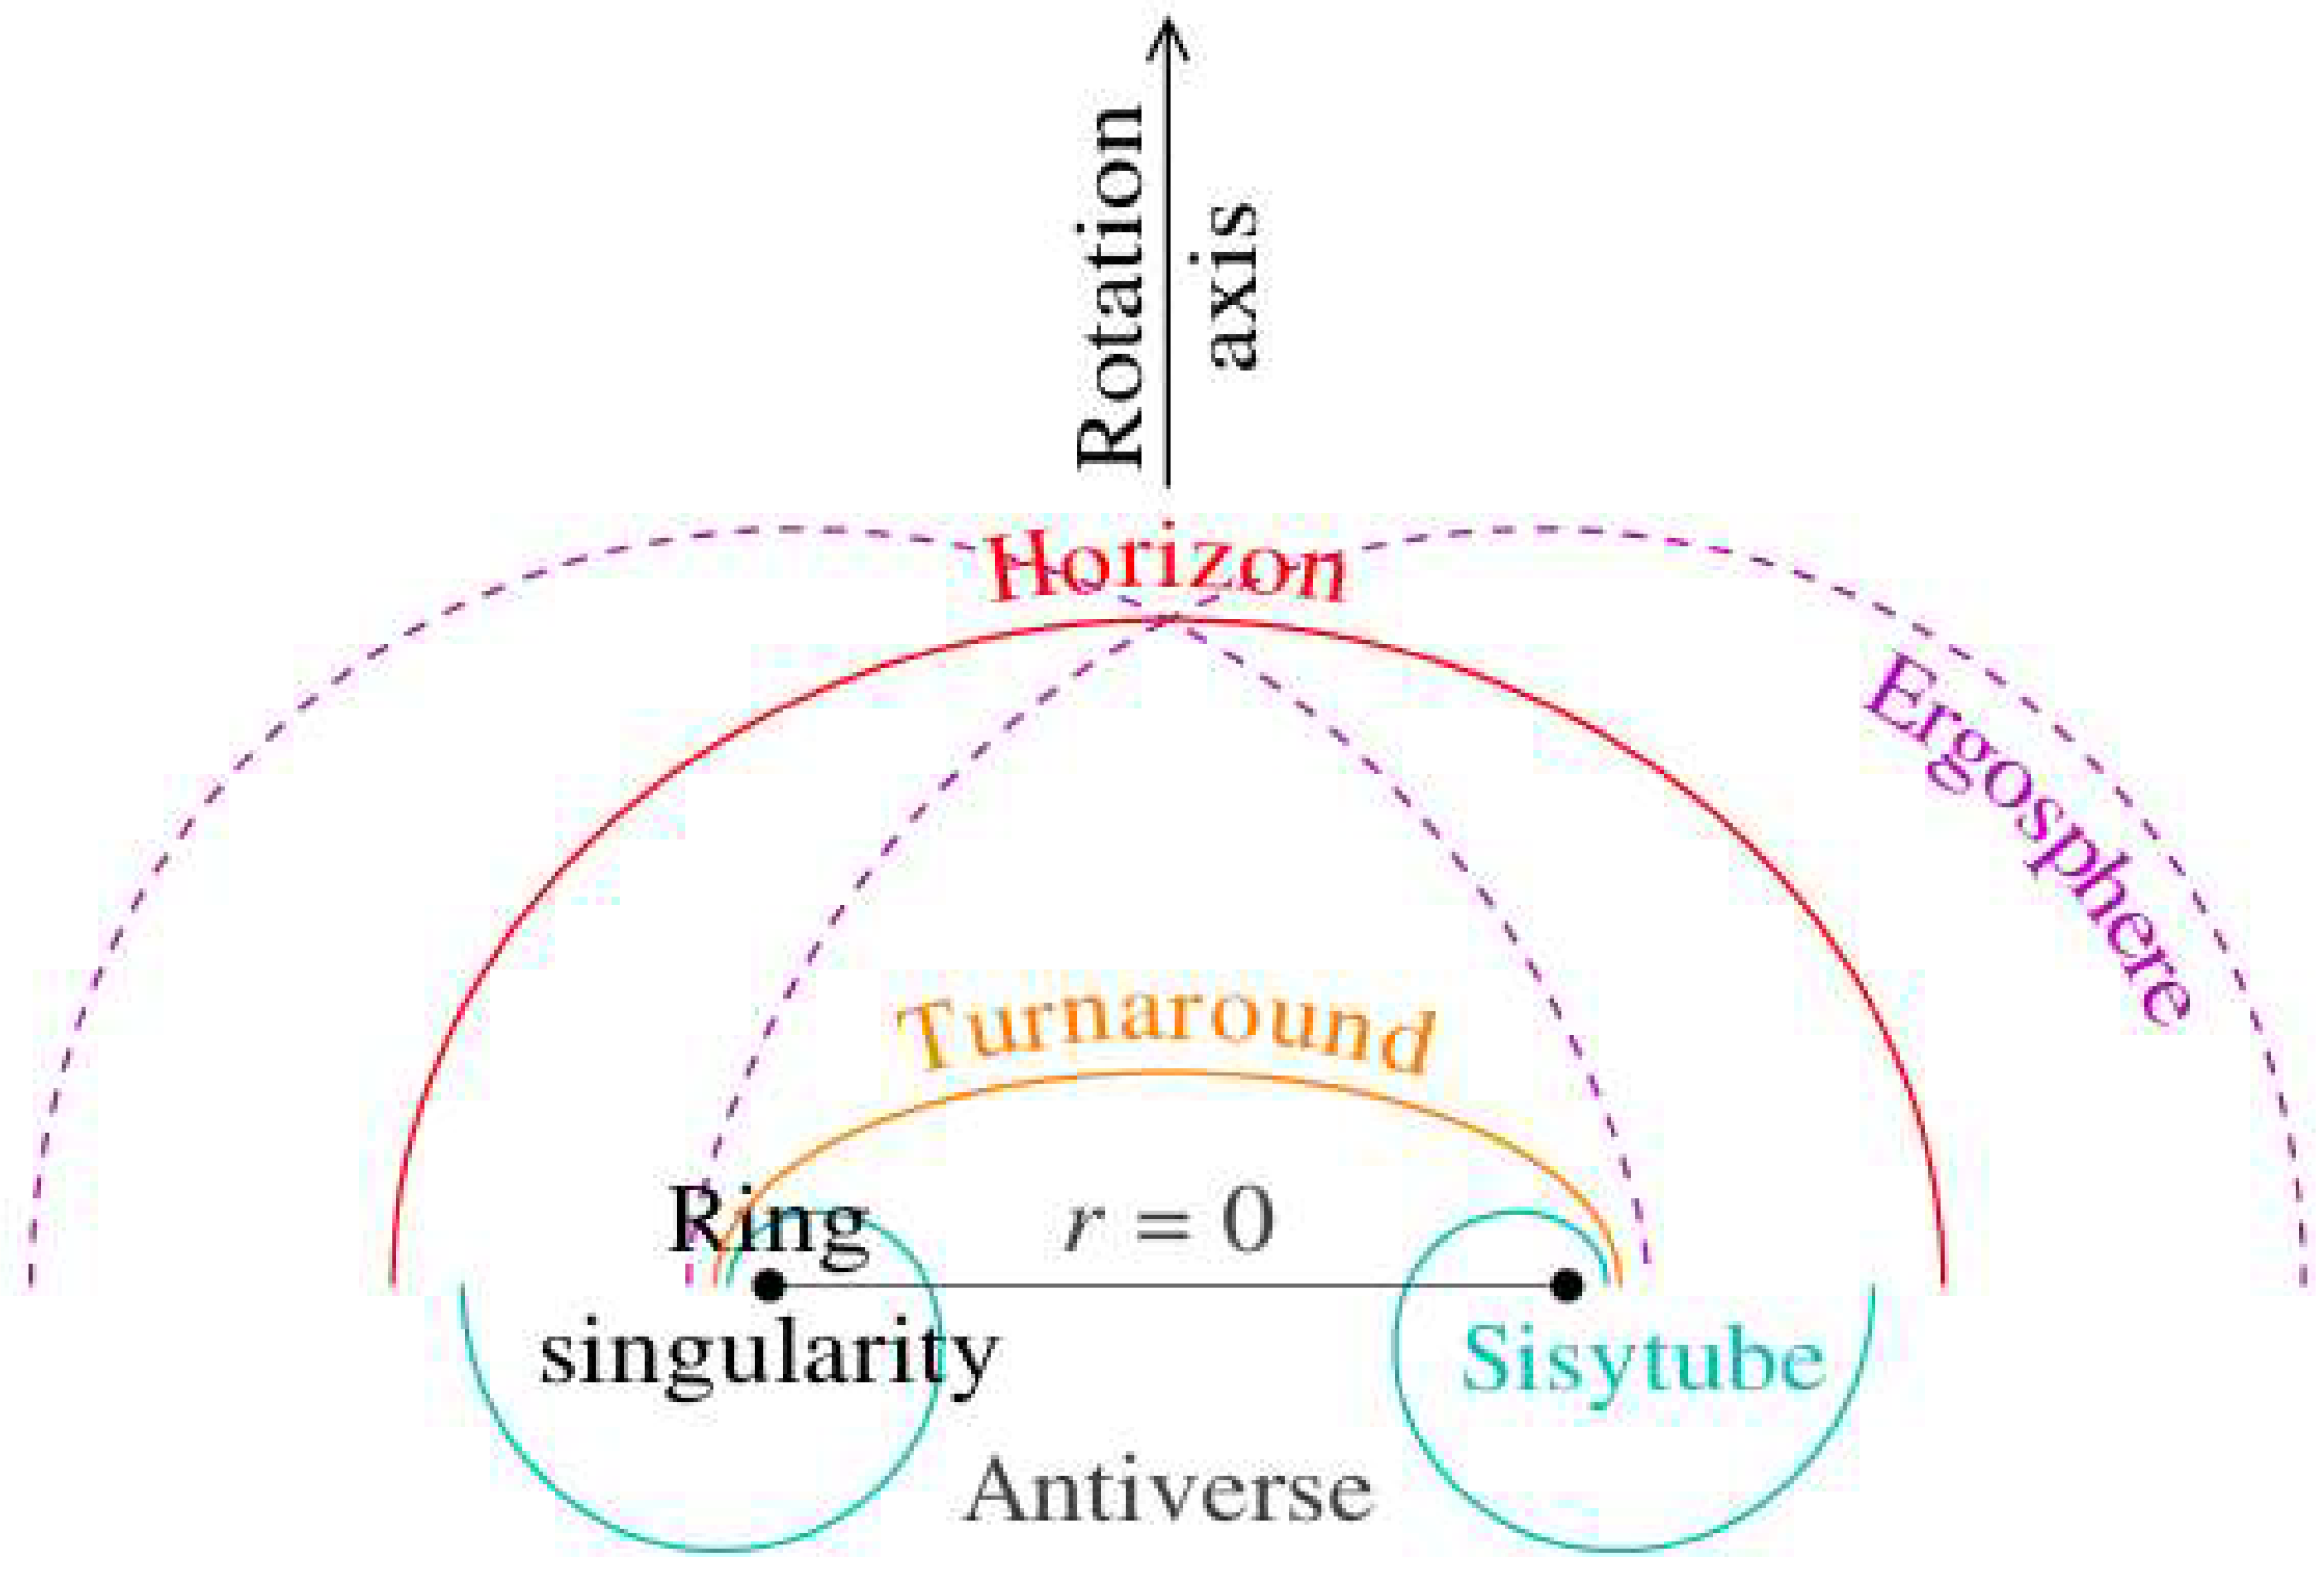
2.5. Horizons
 , and the condition that it is on a null geodesic is:


2.6. Angular Velocity of the Horizon

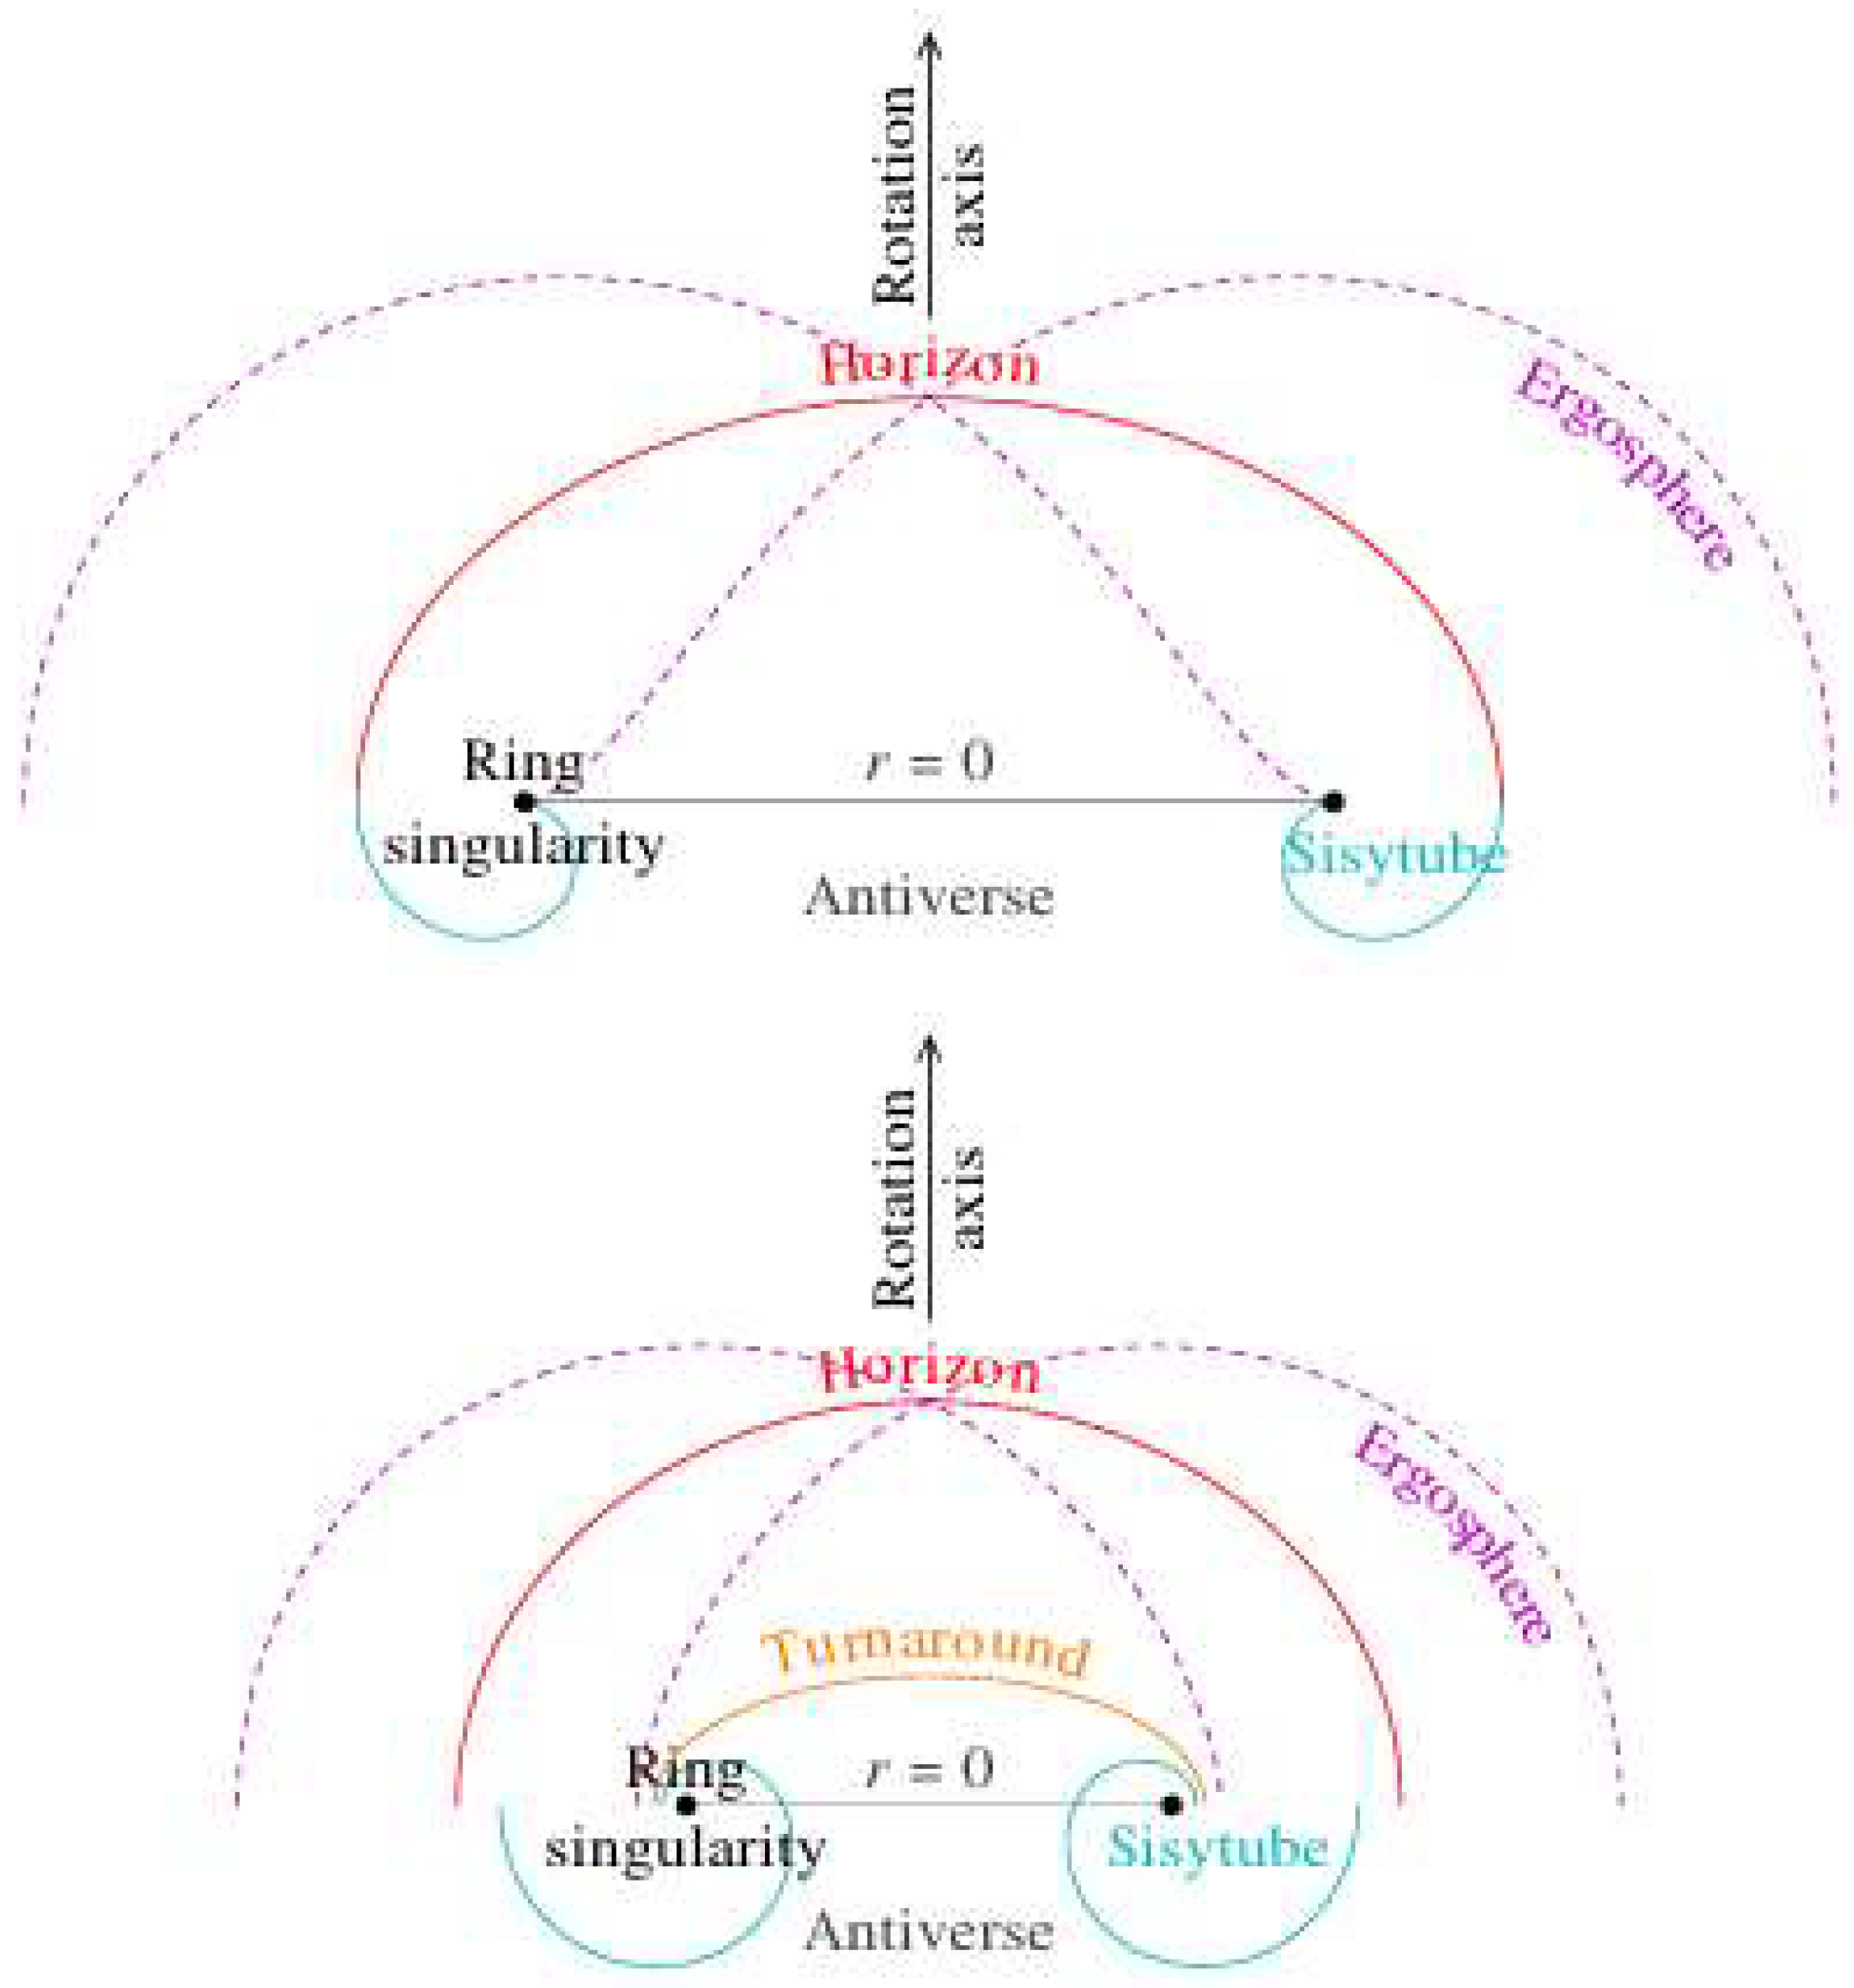
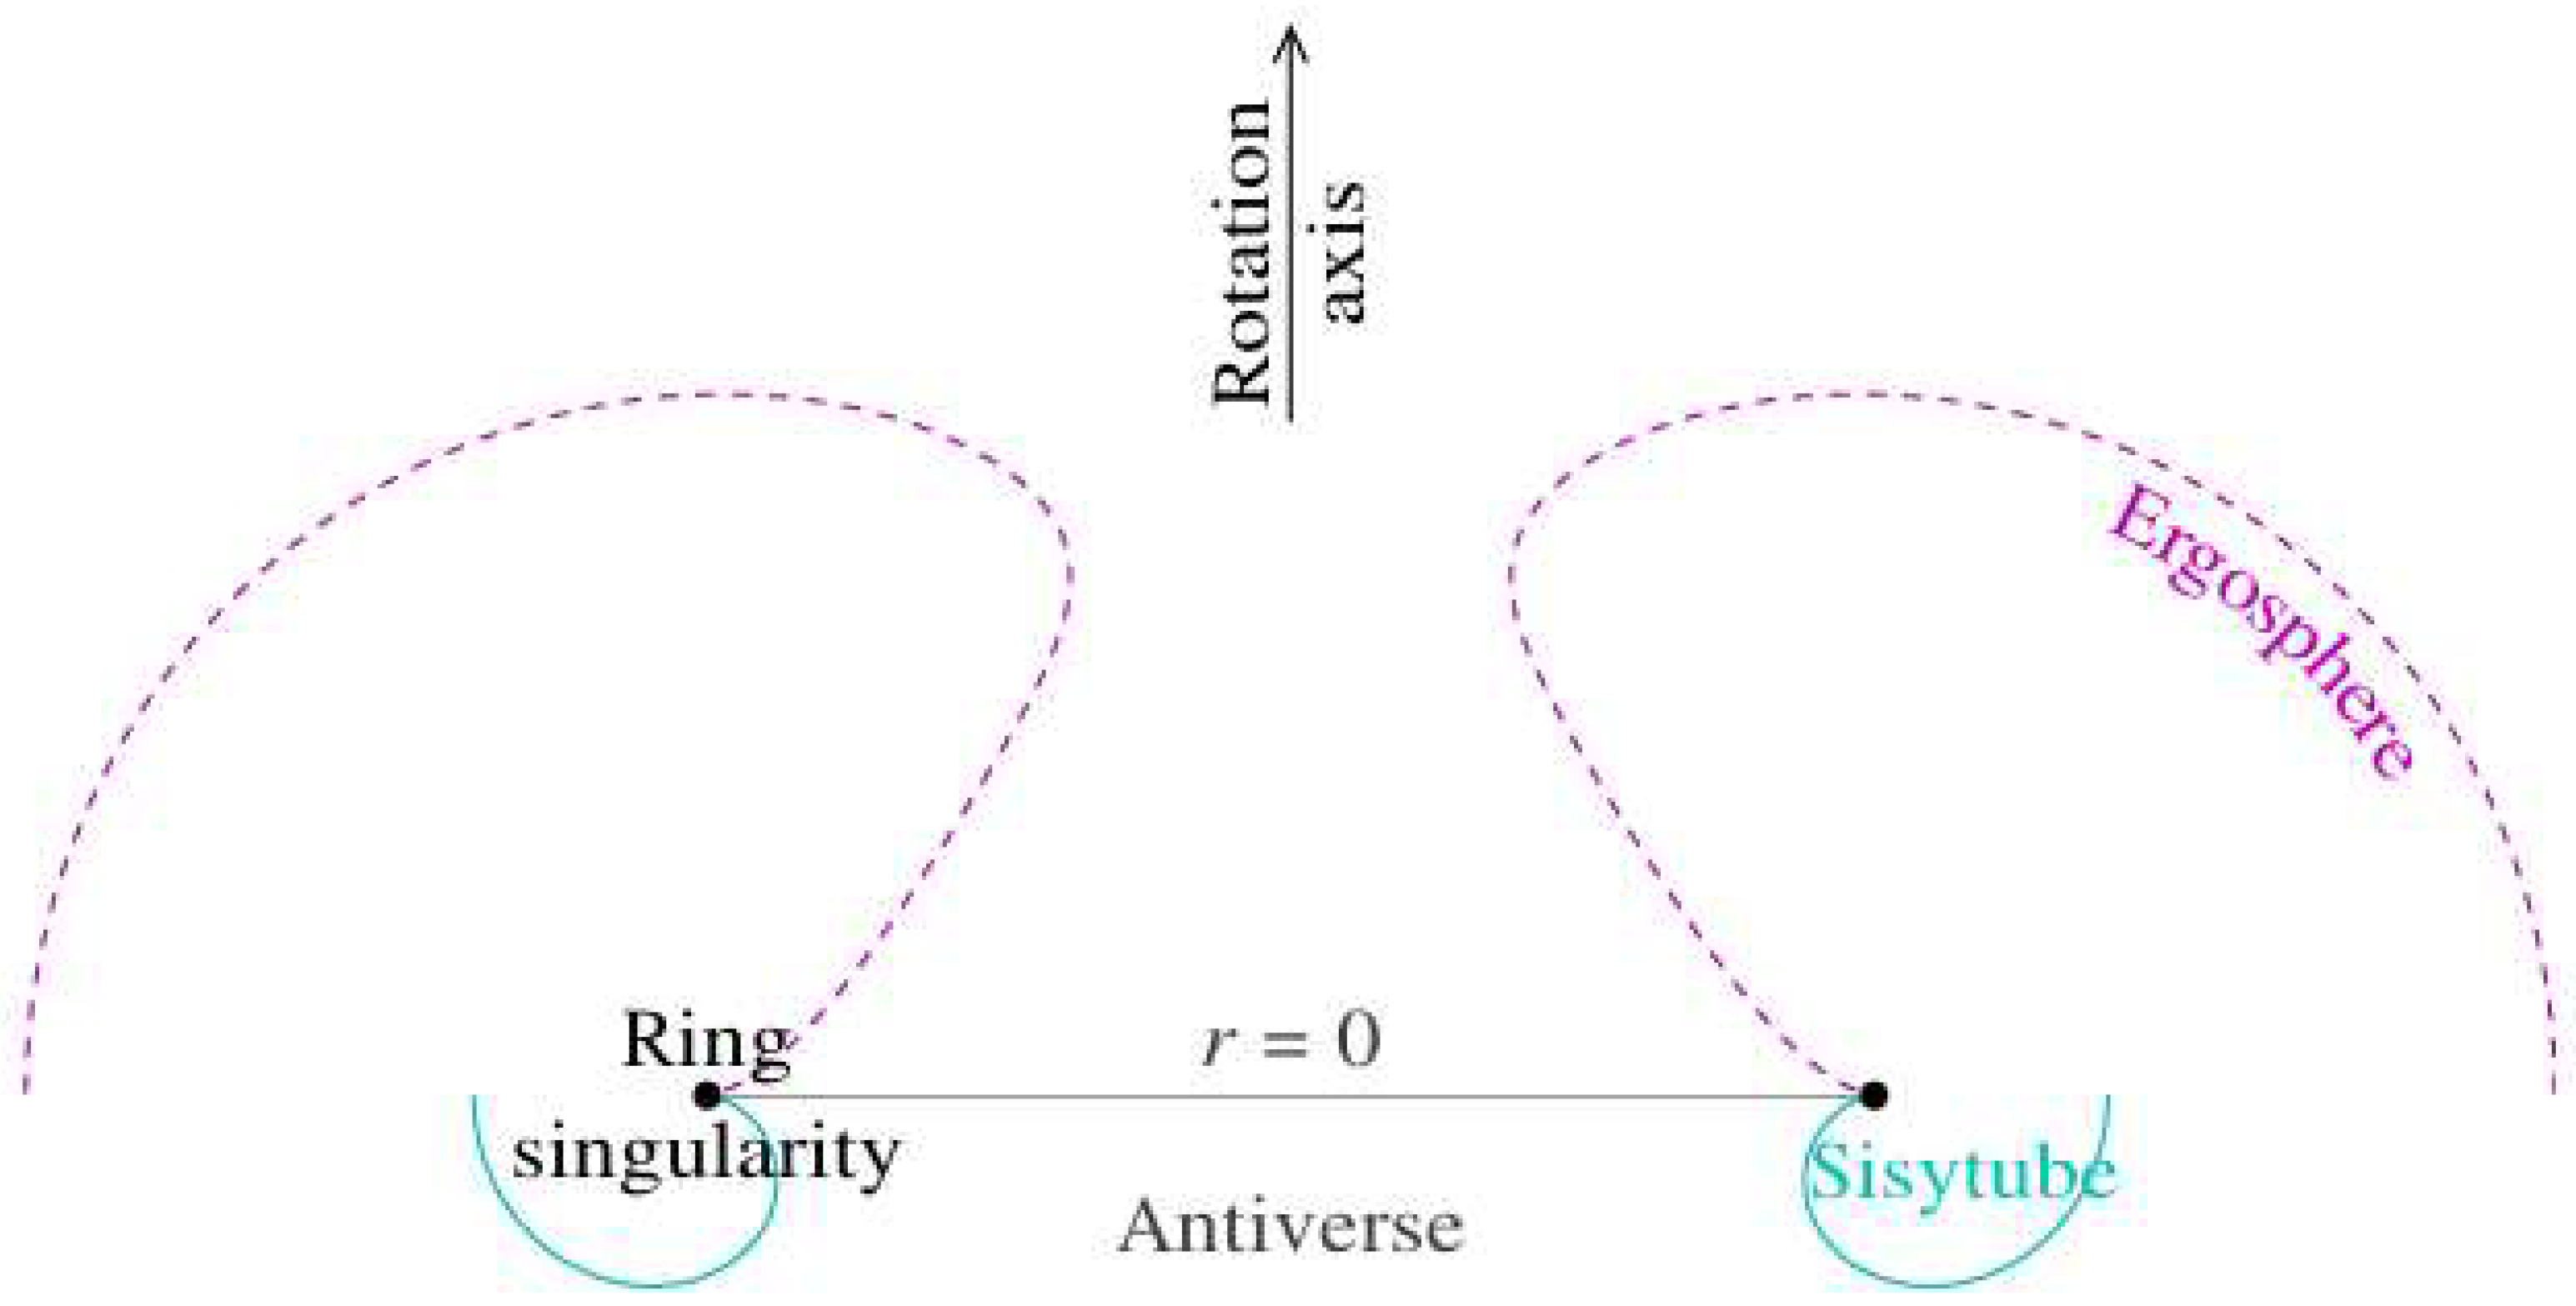
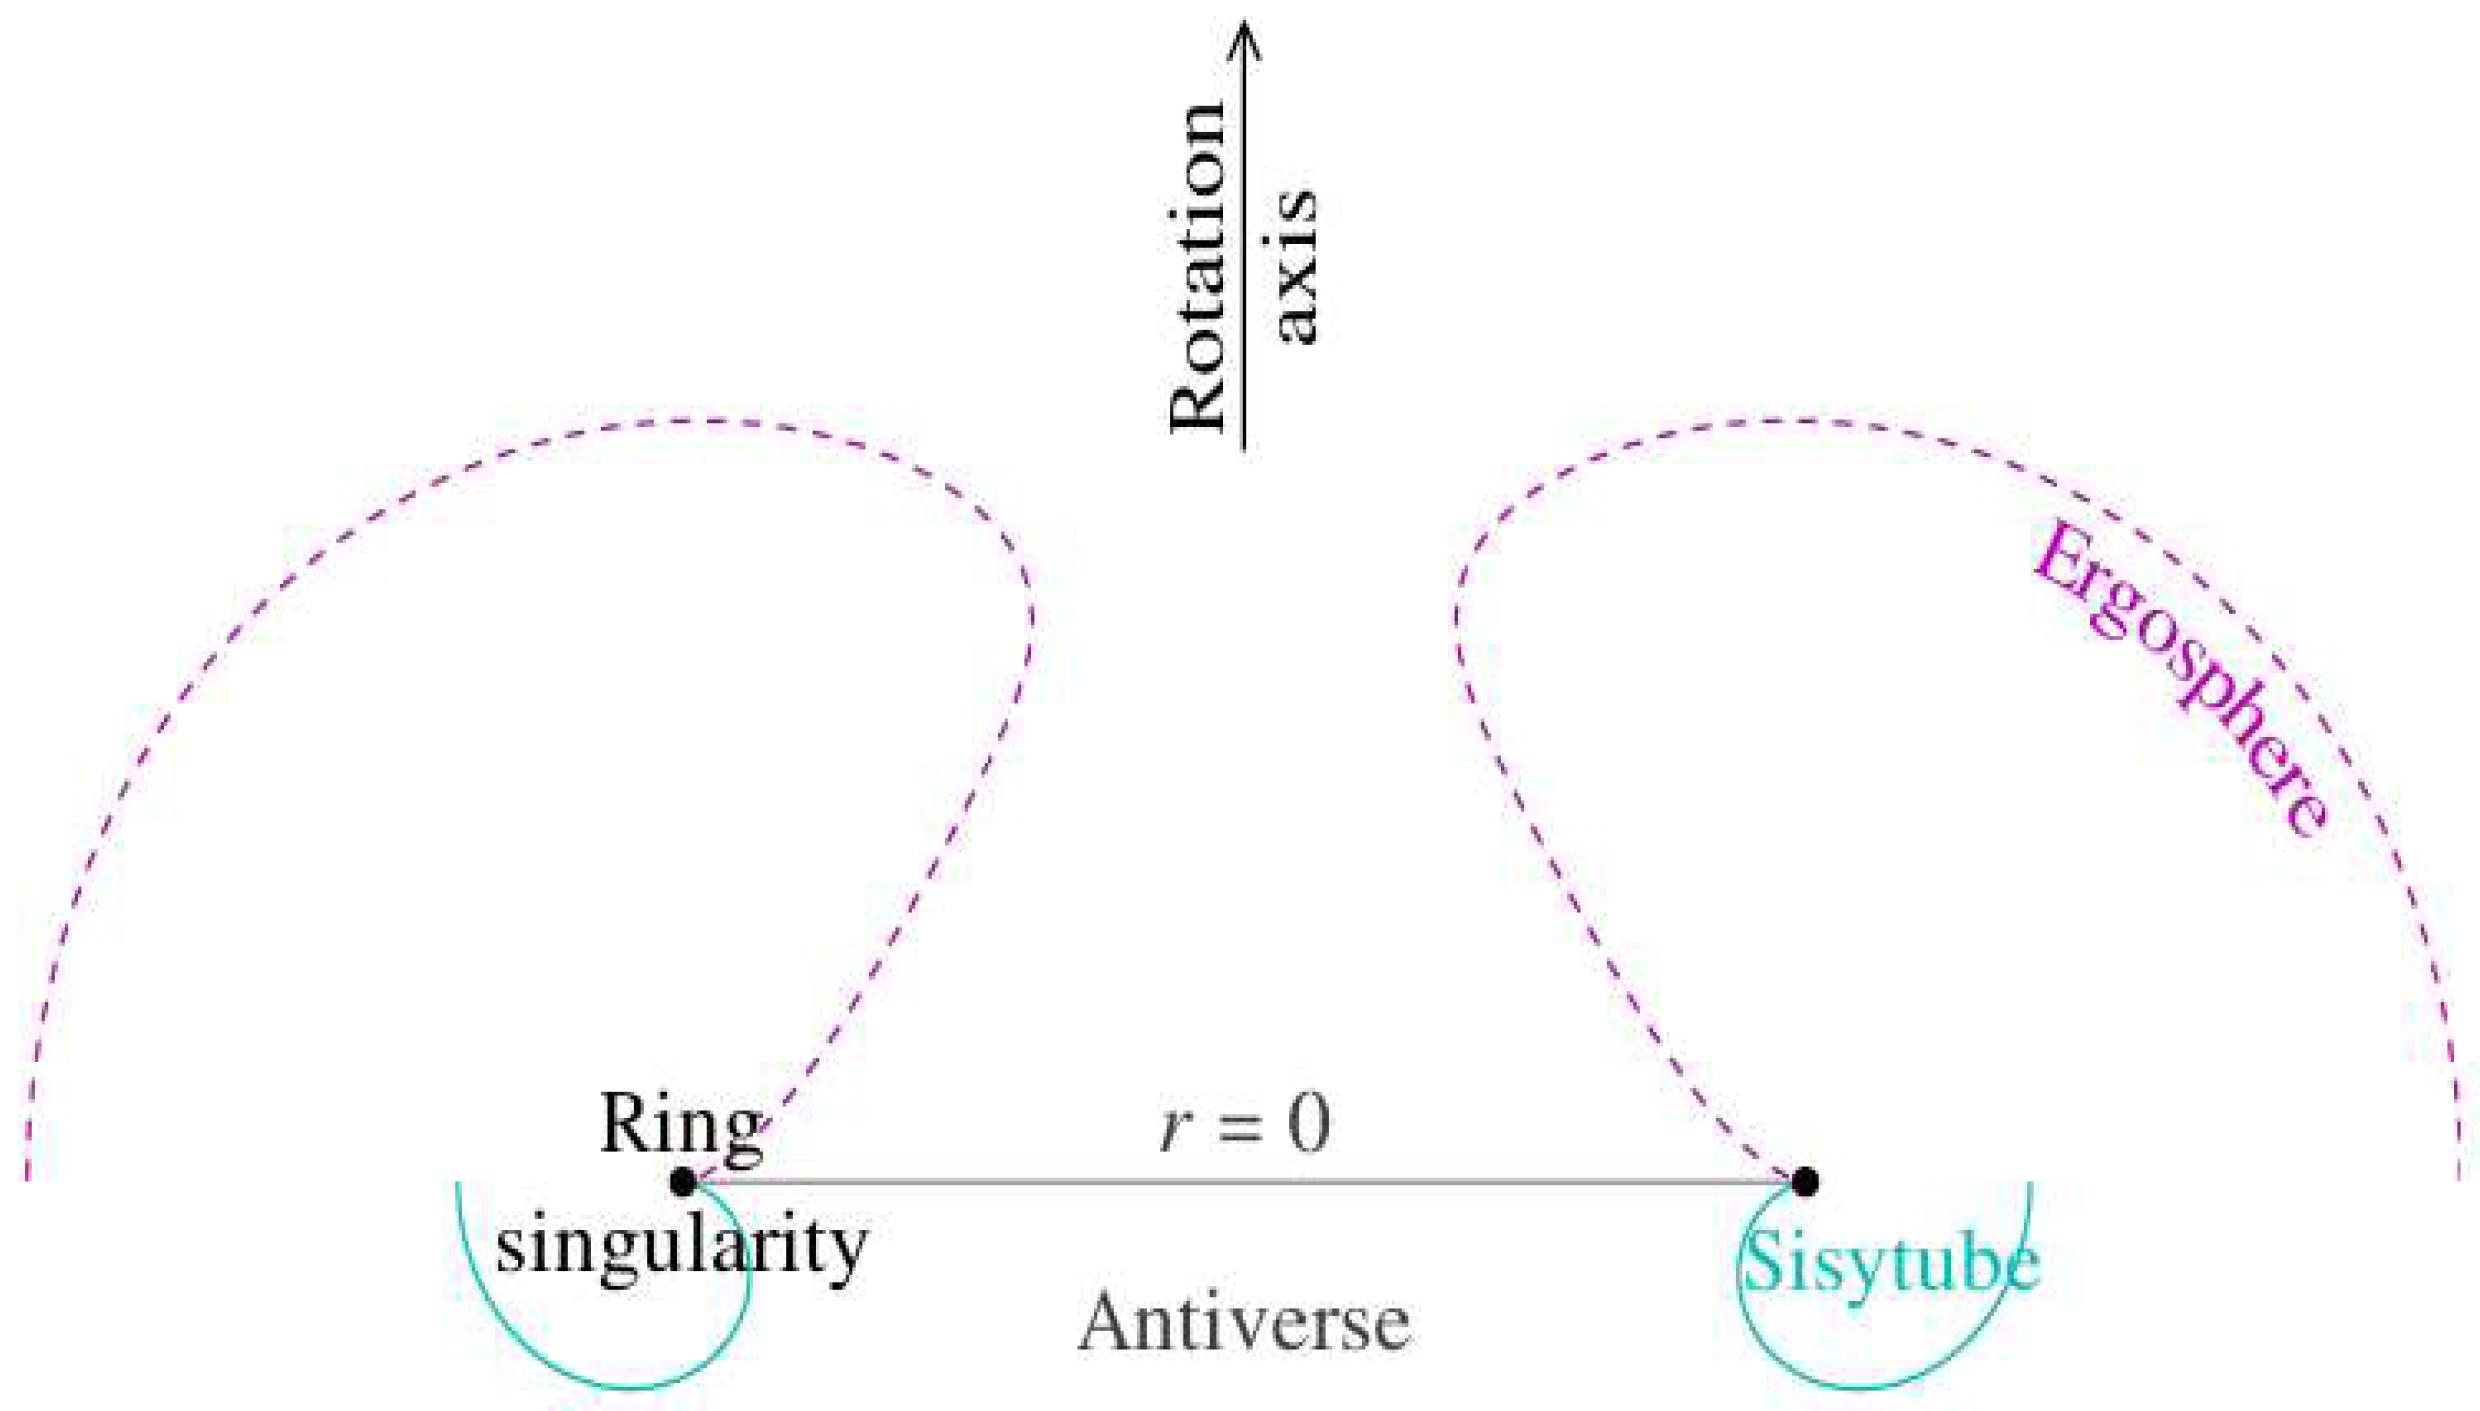
2.7. Ergospheres


2.8. Turnaround Radius


2.9. Antiverse

2.10. Sisytube


2.11. Extremal Kerr-Newman Geometry

2.12. Super-extremal Kerr-Newman Geometry
2.13. Energy-Momentum Tensor

2.14. Weyl Tensor

2.15. Electromagnetic Field

2.16. Principal Null Congruences

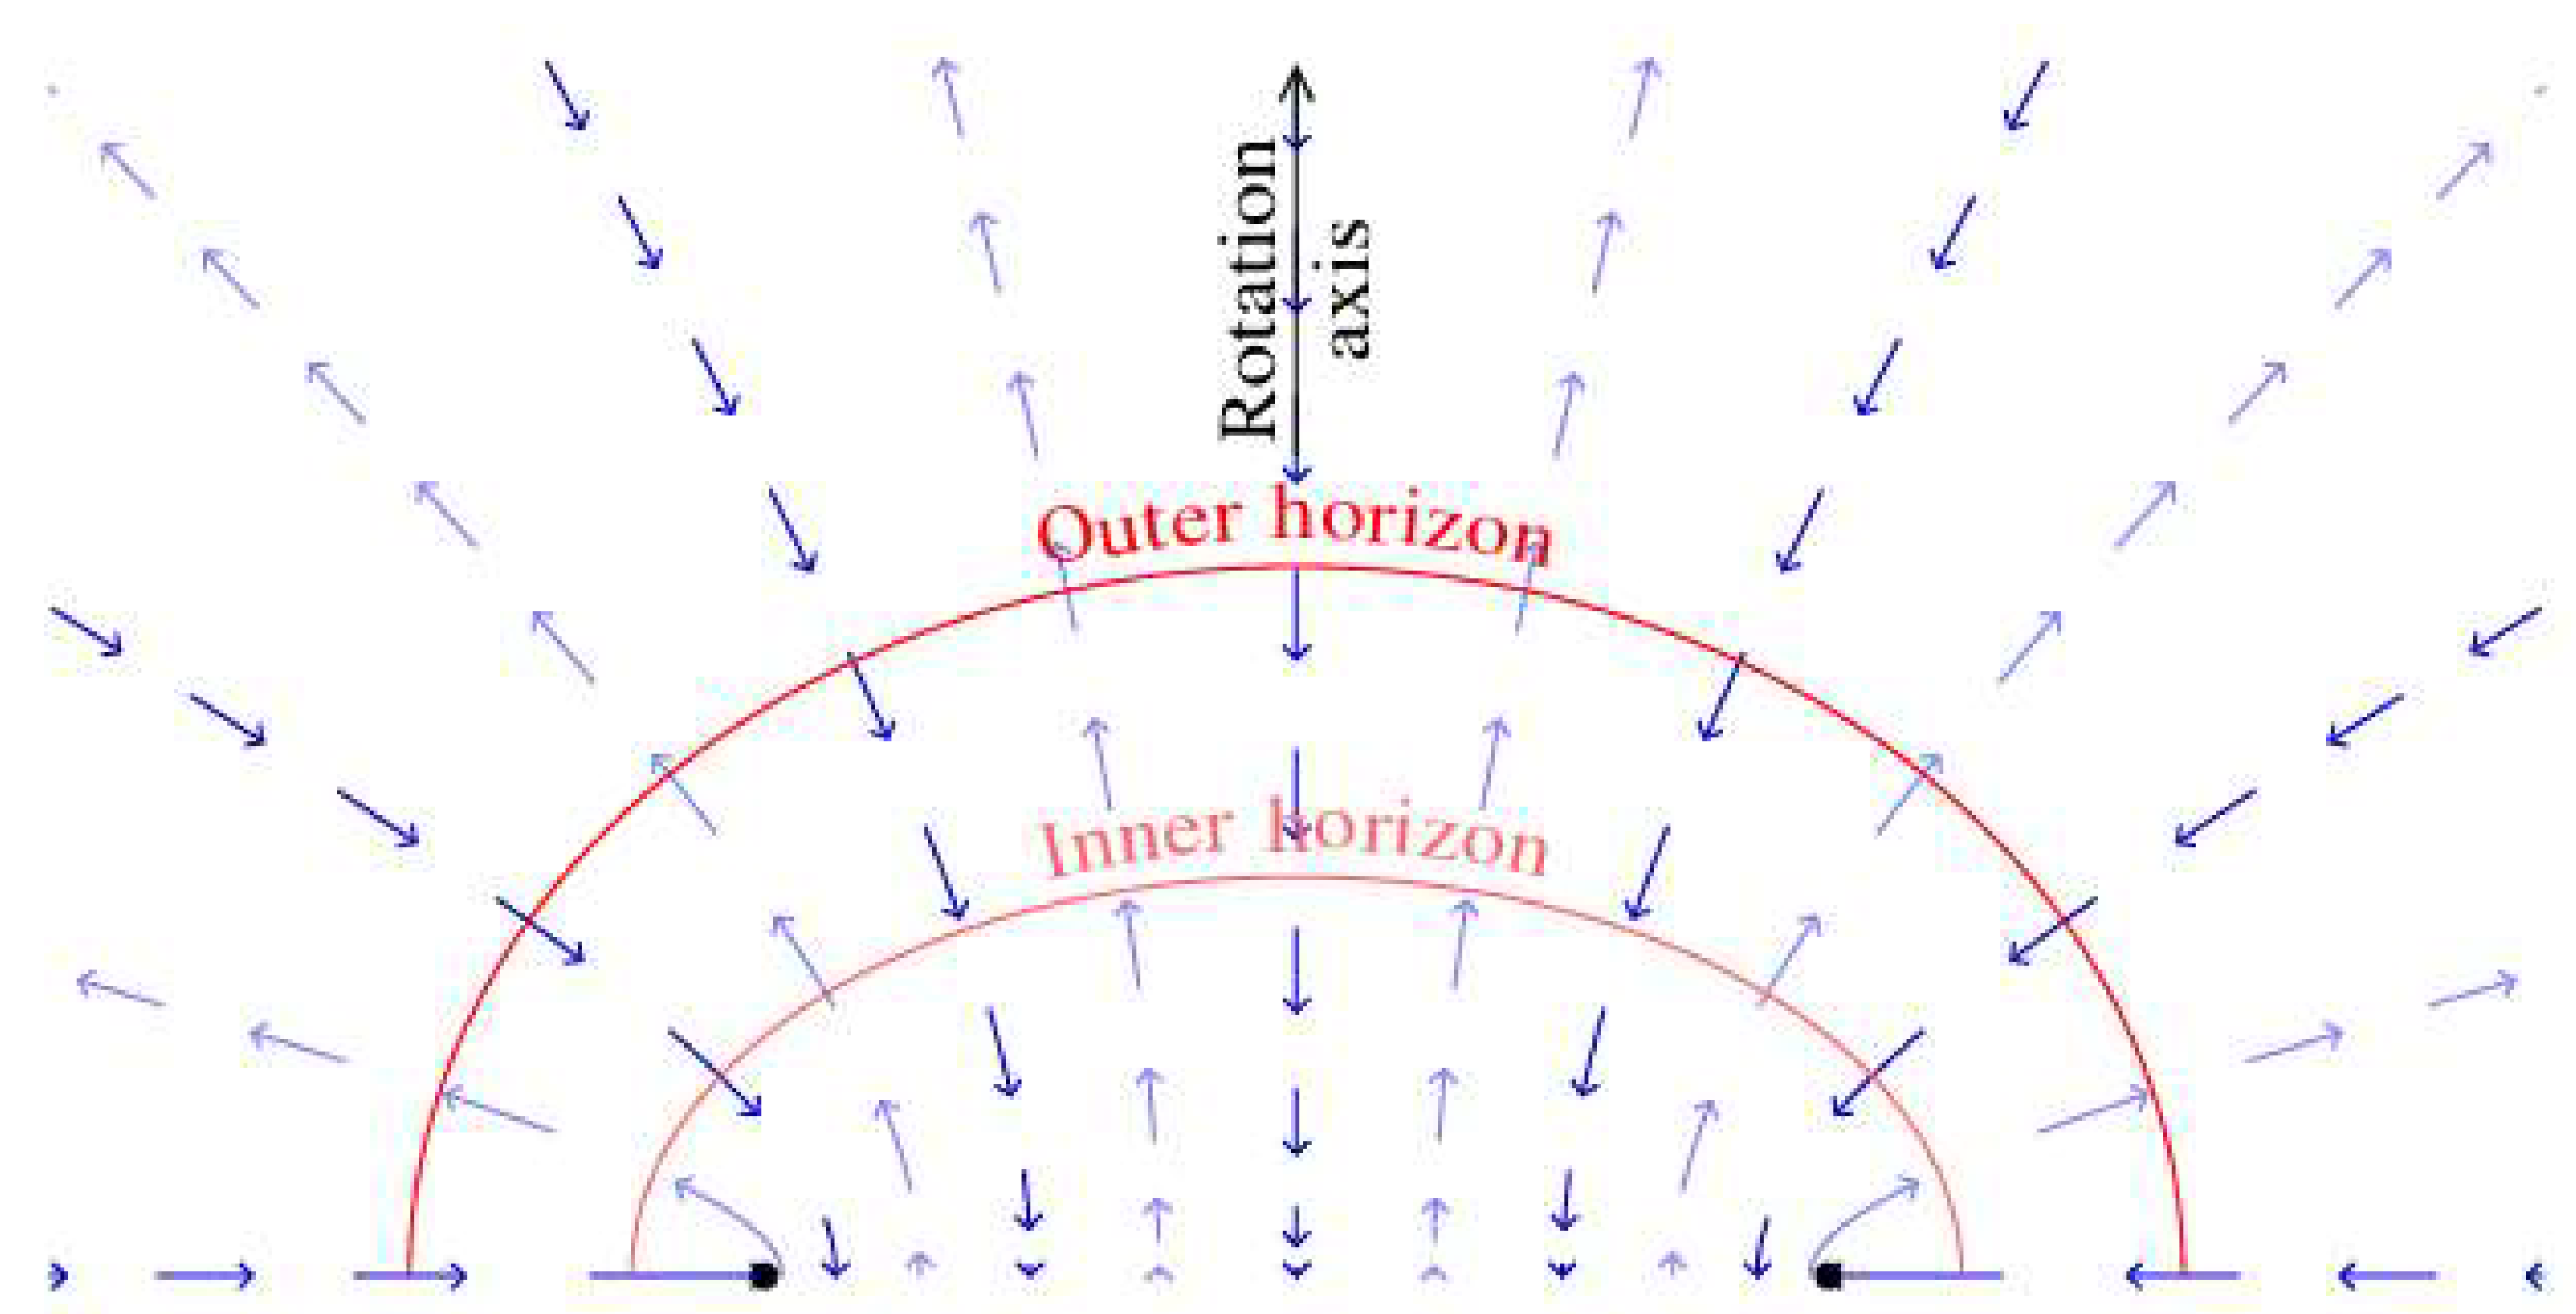
2.17. Finkelstein Coordinates


2.18. Doran Coordinates


 of such free-falling observers is:


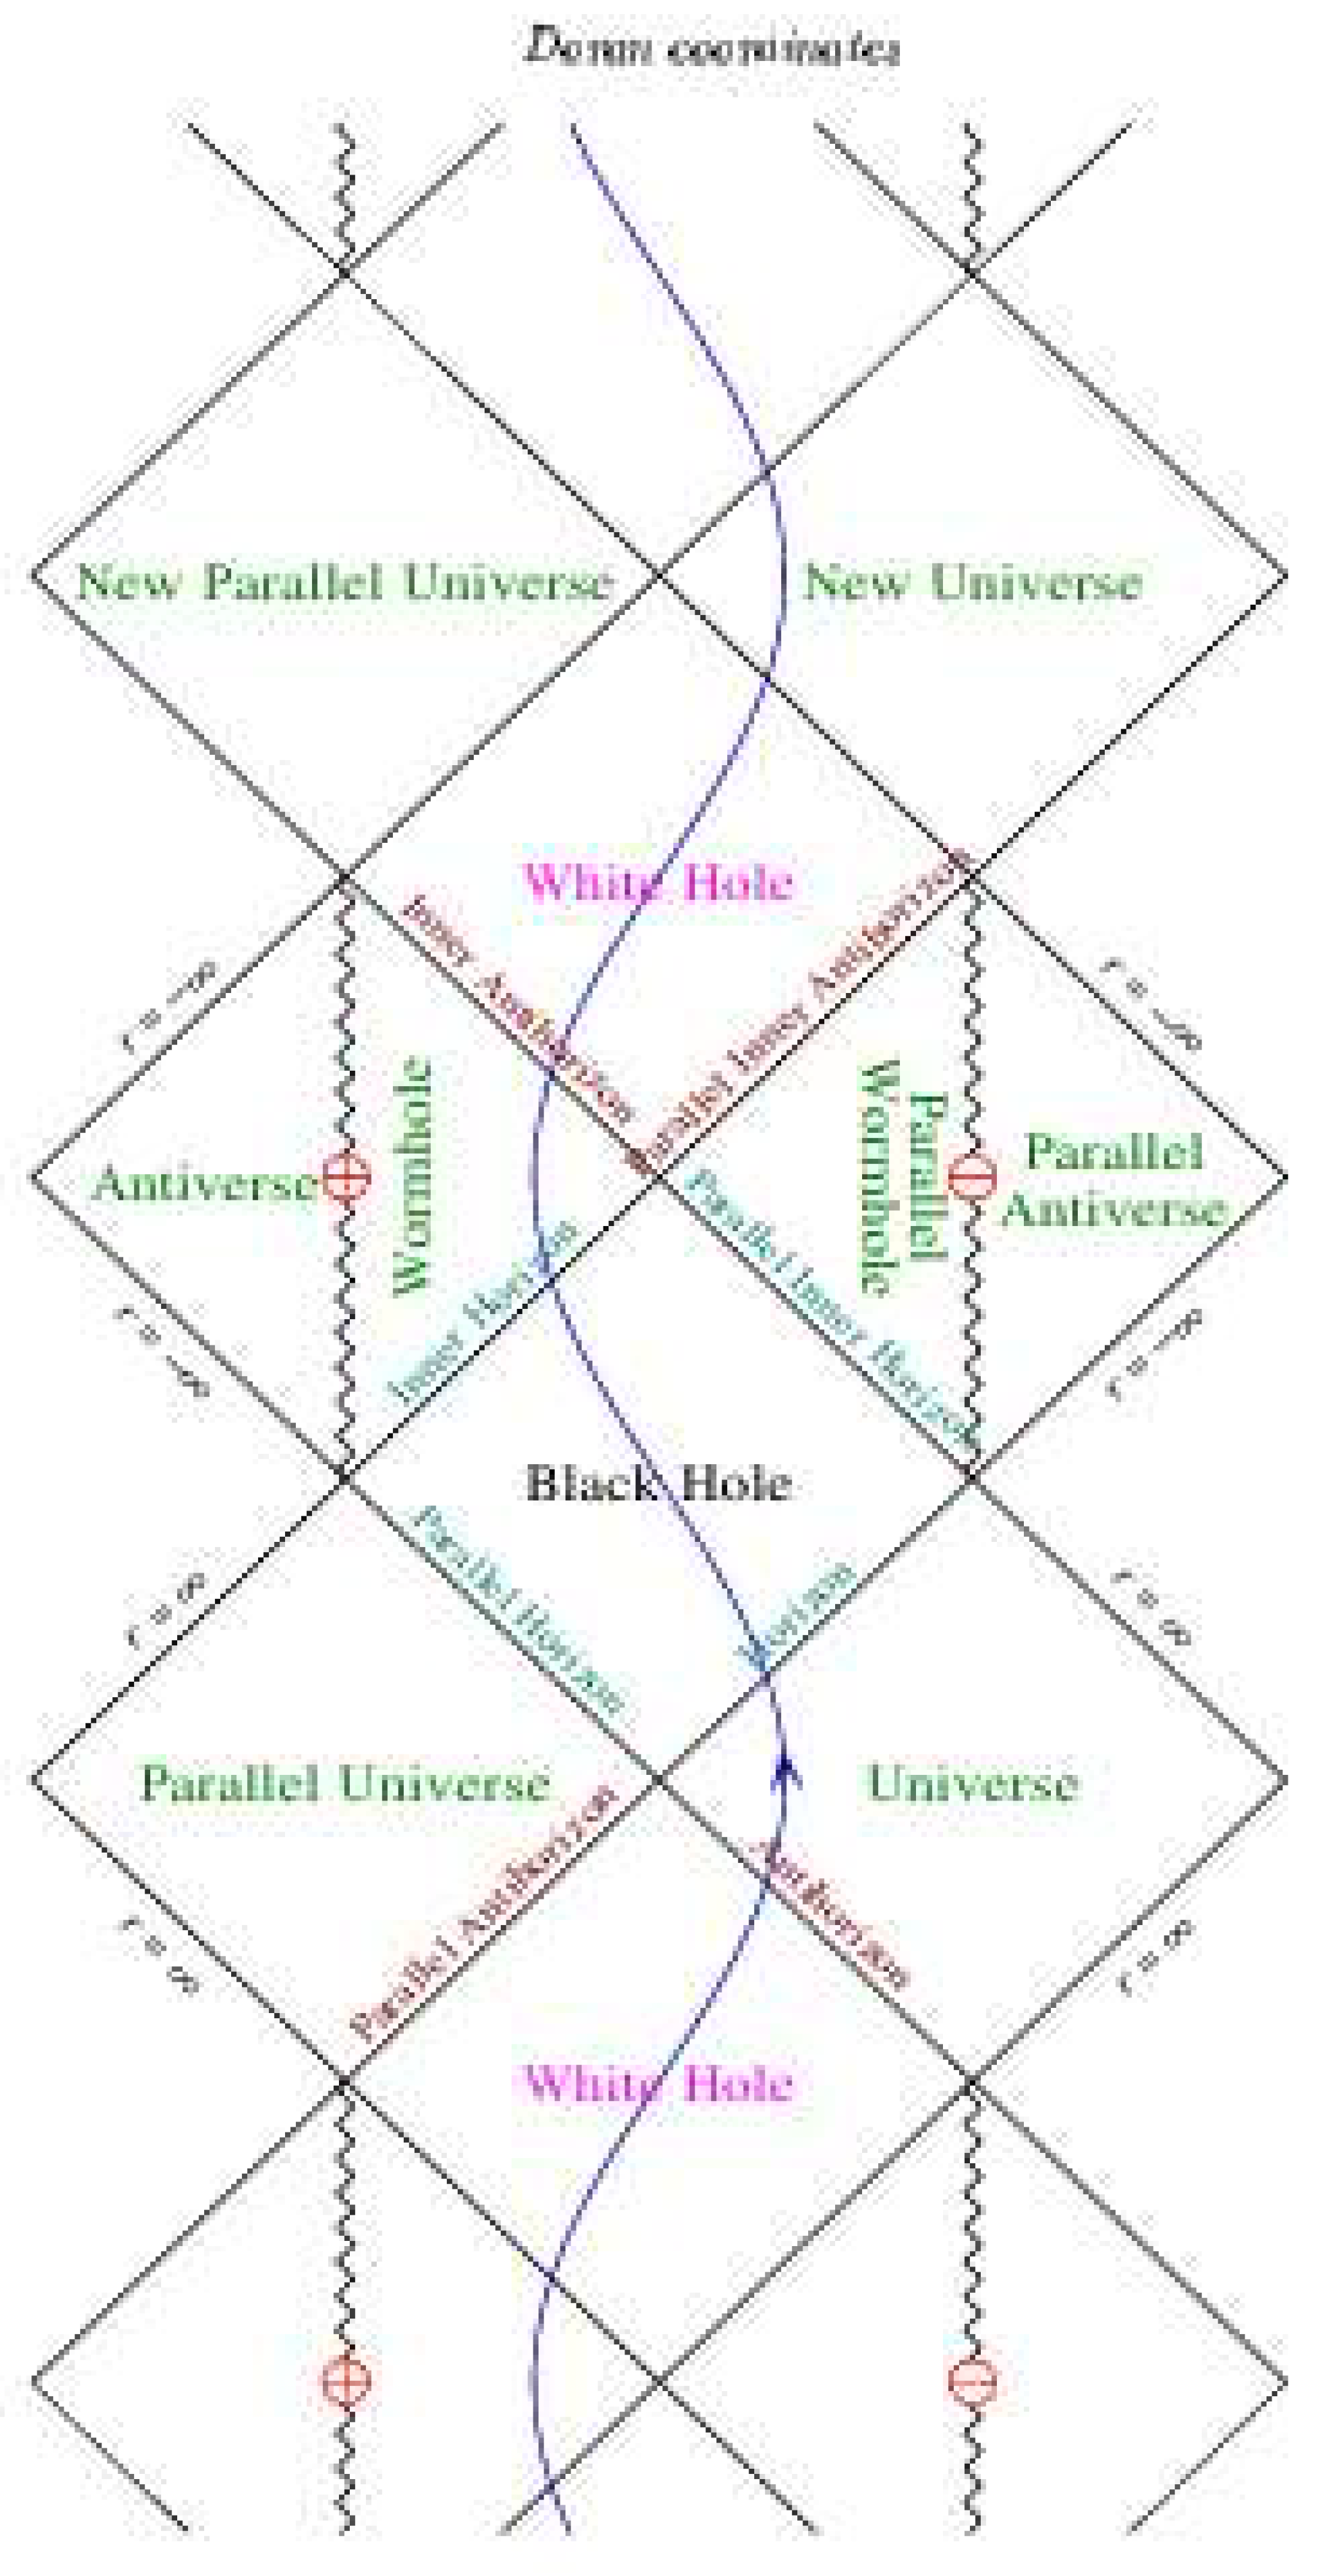
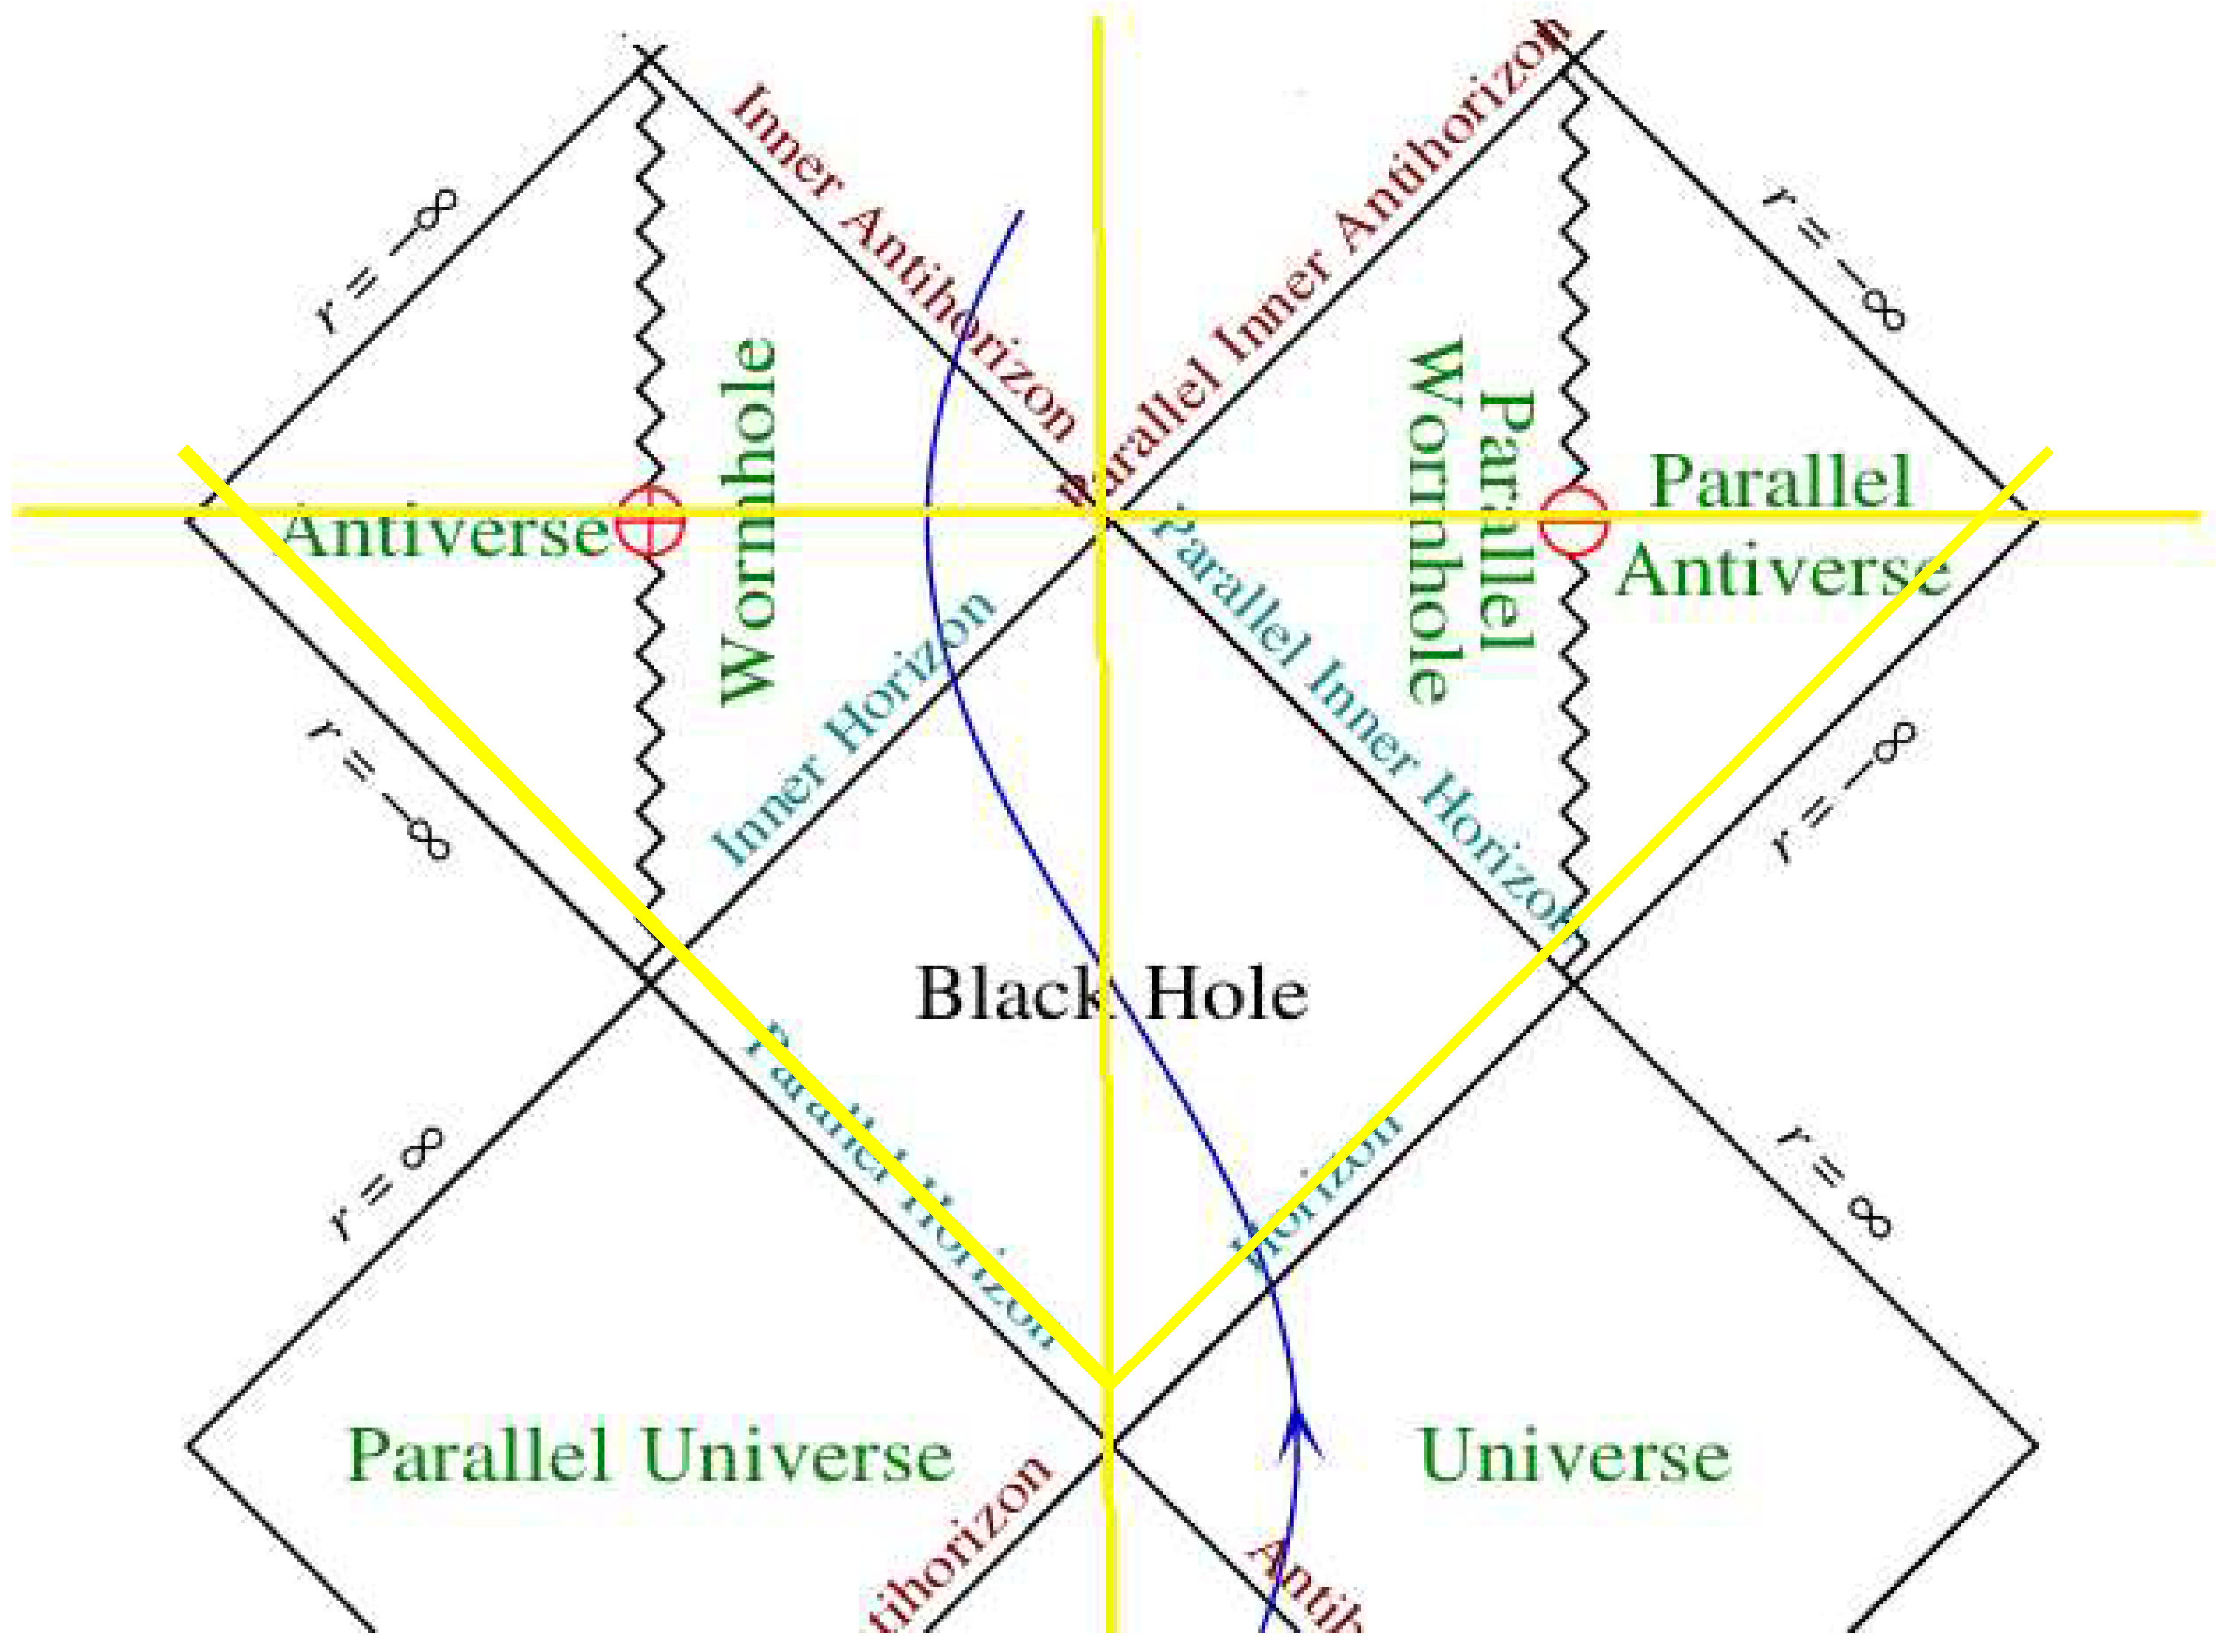
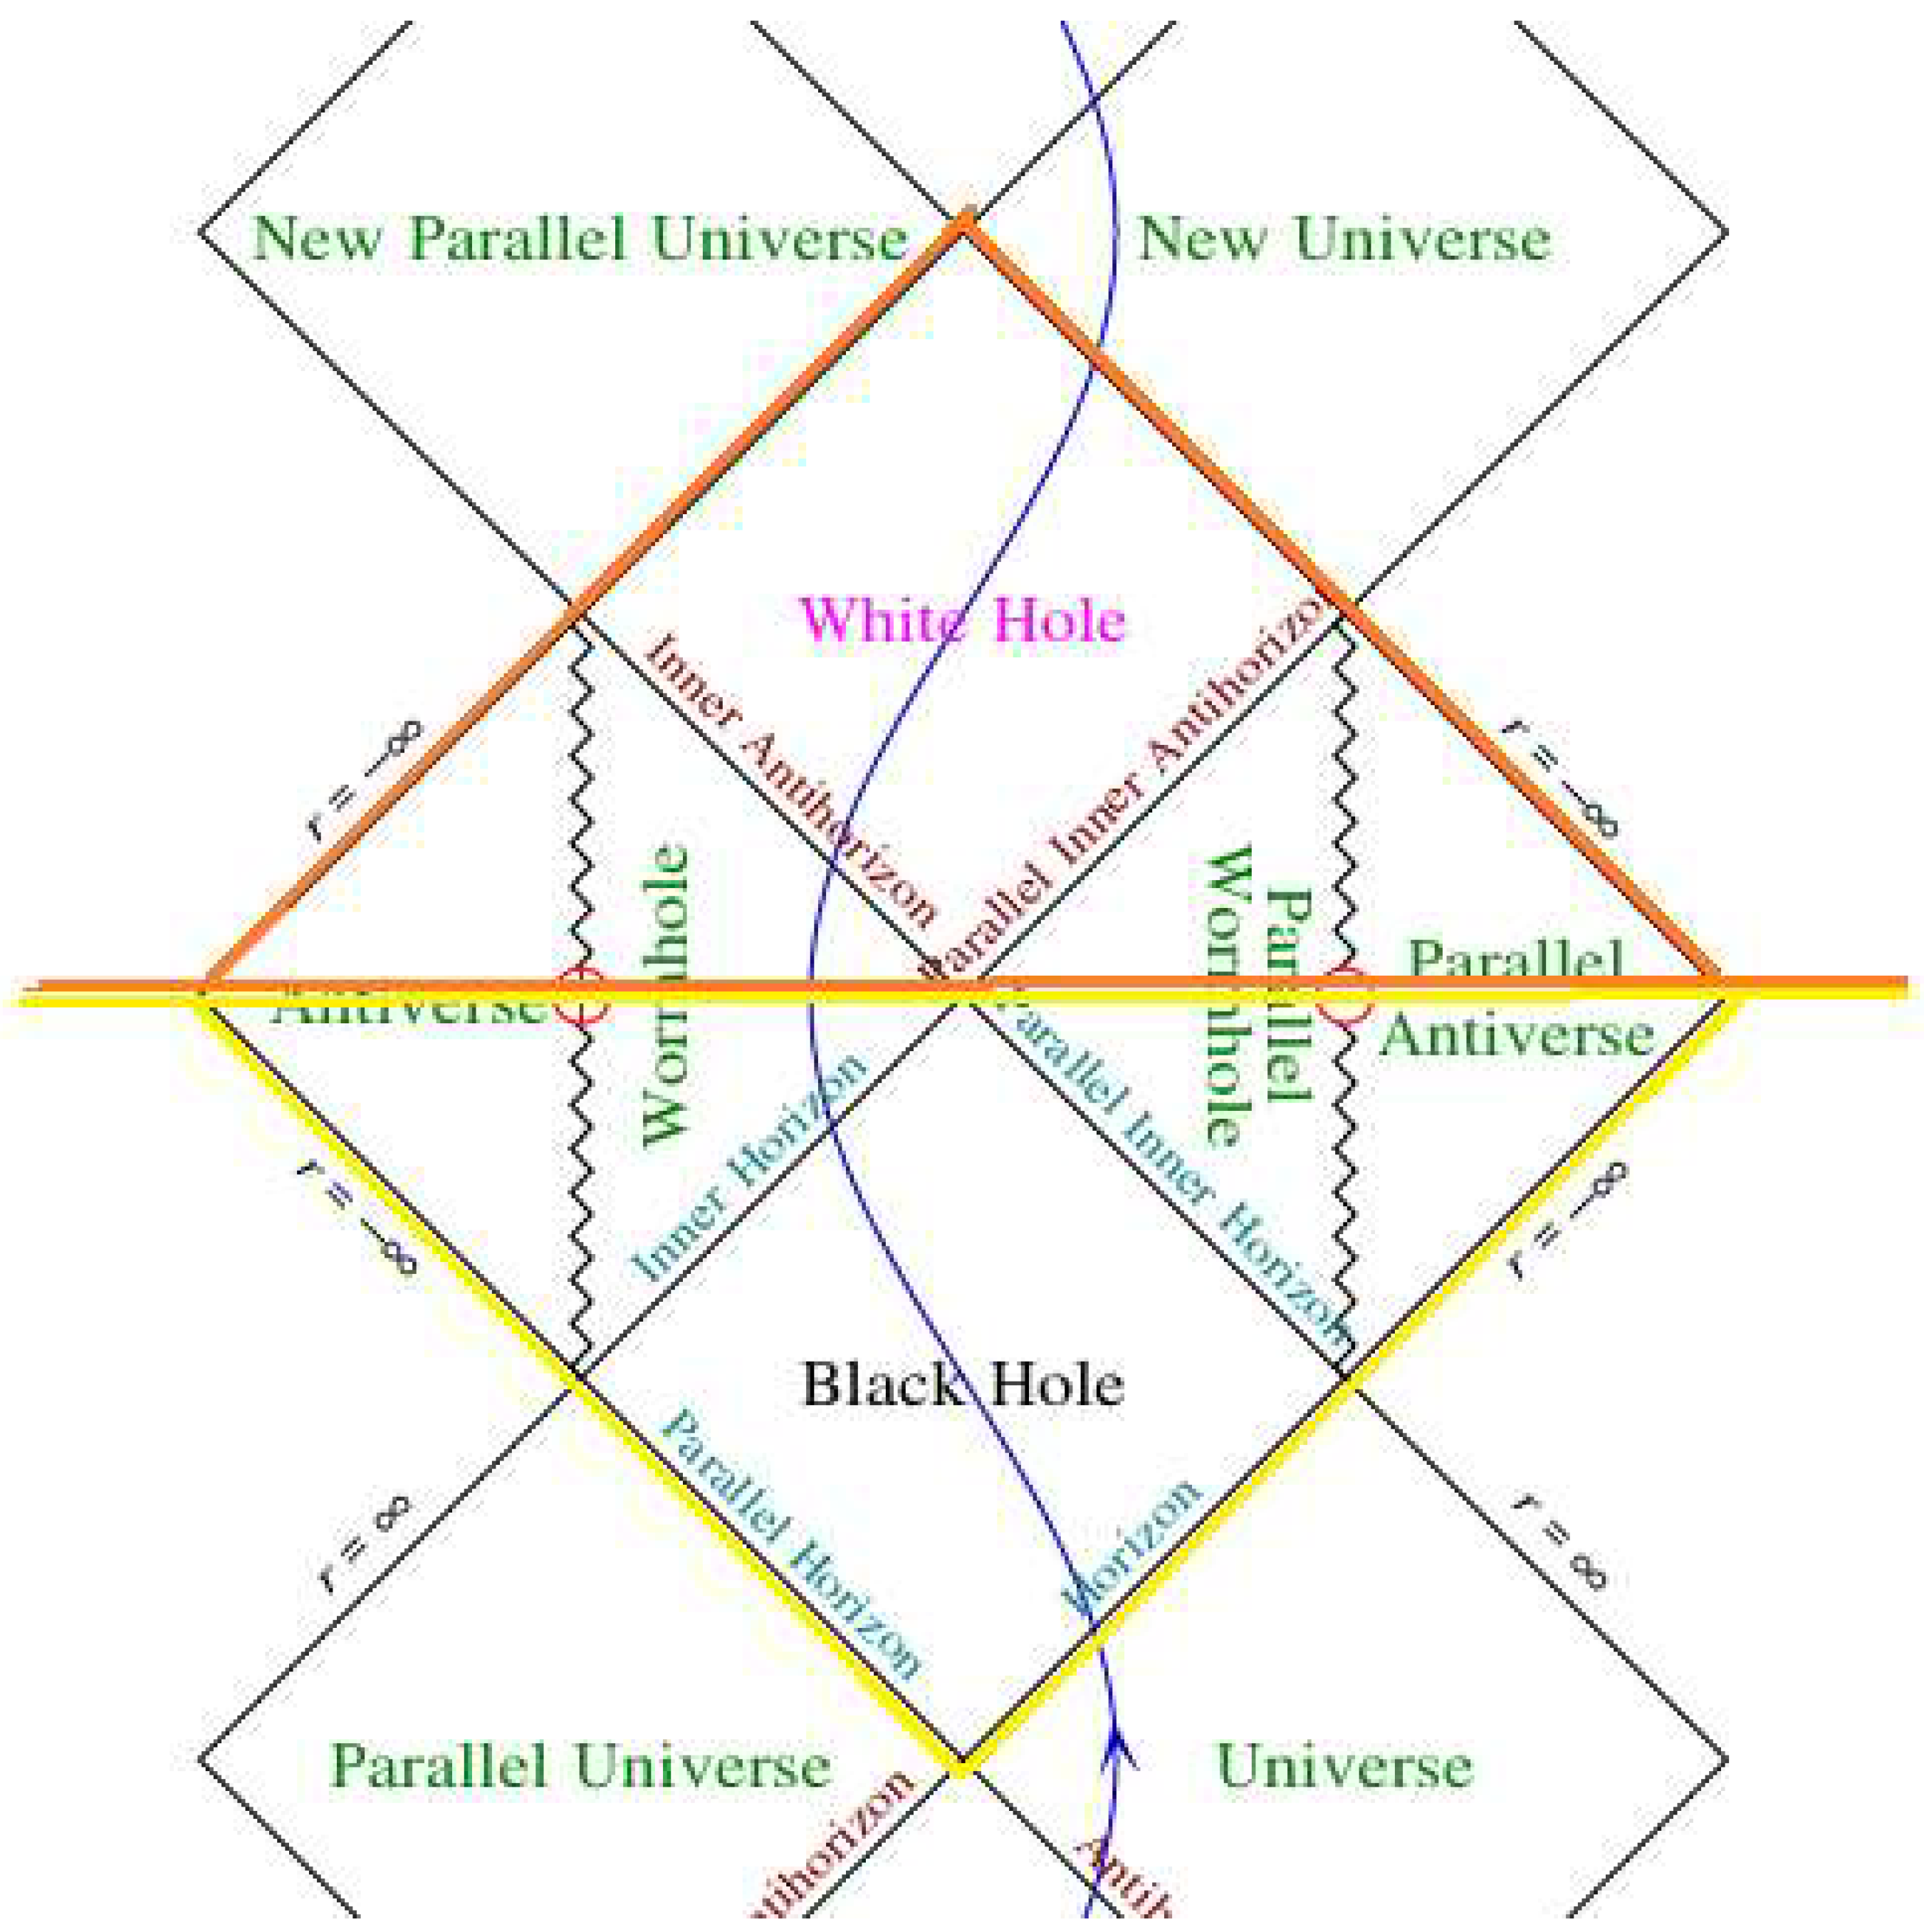
2.19. Penrose Diagram
3. Modelling of a Black Hole
4. Application of the Model And Results
4.1. Correlation between Kerr-Newman Black Hole vs. RLC Electrical Modelling of a Black Hole
- 1. We are going to perform an analysis for the condition: M² > Q² + a²

- 2.
- >2. We are going to perform an analysis for the condition: M² = Q² + a²
- 3.
- We are going to perform an analysis for the condition: M² < Q² + a²
- 4.
- We are going to perform an analysis for the condition: M = Mc
- a)
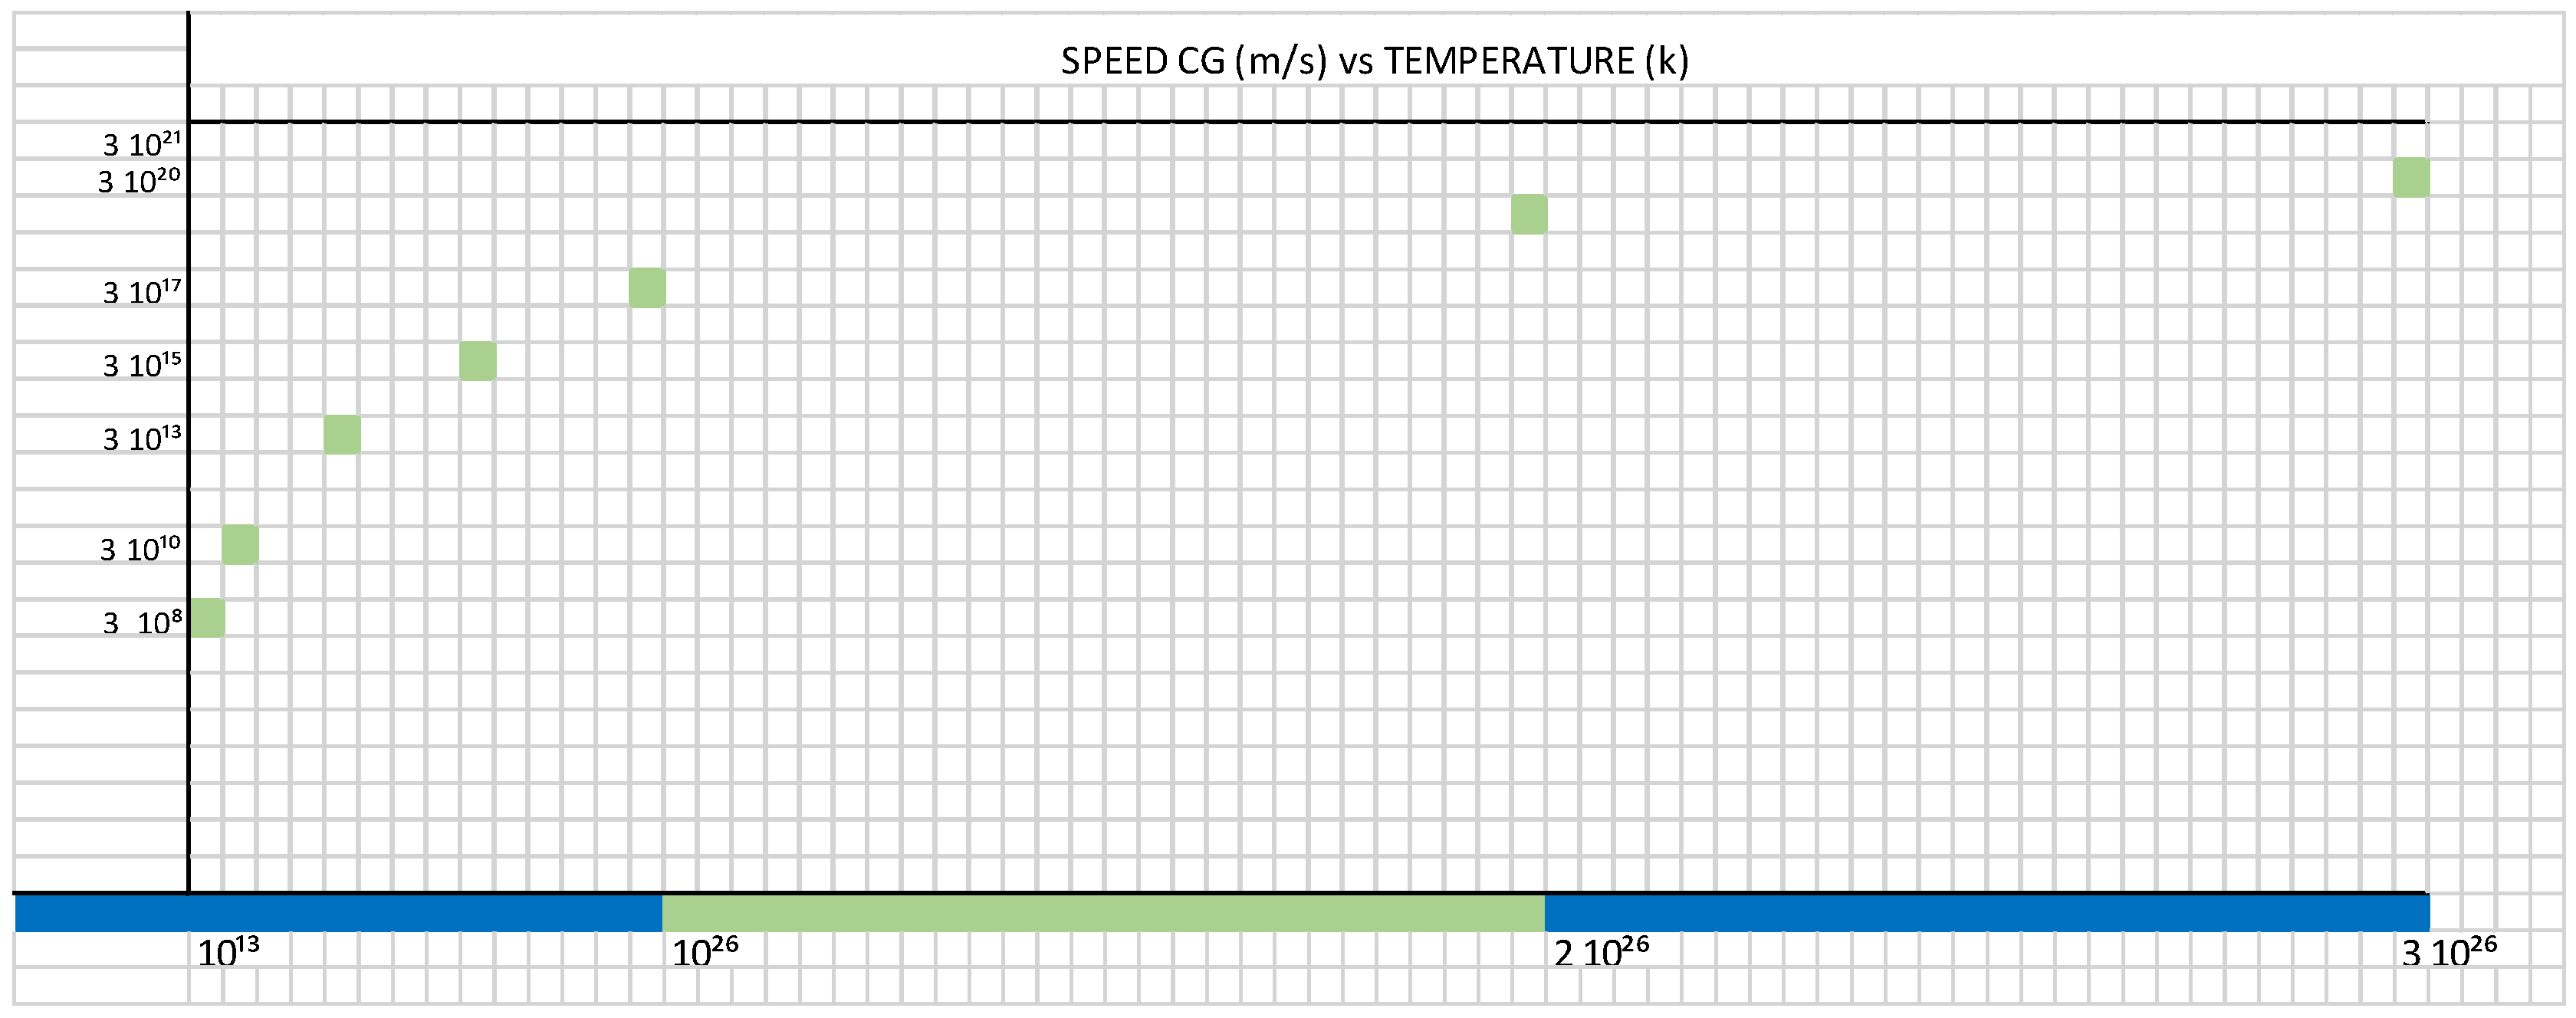
- In item 1 of the Table 1, for the following parameters, T = 10¹³ K, Cɢ = C = 310⁸ m/s, calculating we get the following values:
- b) In item 9 of the Table 1, for the following parameters, T = 5 10²⁶ K, Cɢ = 3 10²¹ m/s, C = 310⁸ m/s, calculating we get the following values:
4.2. Inside a Black Hole
- Dproton
- Protoniu
- Dneutron
- Neutroniumd
4.3. Generalization: Neutron Stars
- Dproton
- Protoniu
- Dneutron
- Neutroniumd
5. Conclusions
Conflicts of Interest
References
- Flores, H. G. RLC electrical modelling of black hole and early universe. Generalization of Boltzmann's constant in curved spacetime. J Mod Appl Phys. 2023; 6(4):1-6. https://www.pulsus.com/scholarly-articles/rlc-electrical-modelling-of-black-hole-and-early-universe-generalization-of-boltzmanns-constant-in-curved-spacetime.pdf https://sites.ifi.unicamp.br/sobreira/files/2018/07/mestrado-tanderson.pdf.
- Peter Cameron The Penrose Property with a Cosmological Constant Department of Applied Mathematics and Theoretical Physics, University of Cambridge. https://arxiv.org/abs/2106.02536.
- Roy. P. Kerr, Do Black Holes have Singularities? University of Canterbury, Christchurch; Lifschitz Prof. ICRANet, Pescara. December 5, 2023 https://arxiv.org/pdf/2312.00841.pdf.
- J C Schindler, A Aguirre Algorithms for the explicit computation of Penrose diagrams Department of Physics, University of California Santa Cruz, Santa Cruz, CA, USA https://arxiv.org/pdf/1802.02263.
- Andrew Strominger Les Houches Lectures on Black Holes Department of Physics, University of California, Santa Barbara, CA 93106-9530 https://arxiv.org/pdf/hep-th/9501071.
- Black Holes University of Cambridge https://www.damtp.cam.ac.uk/user/tong/gr/six.pdf.
- Chapter 21. Inside the Spinning Black Hole Edwin F. Taylor https://www.eftaylor.com/exploringblackholes/Ch21TravelThroughTheSpinningBH170831v1.pdf.
- Andrew J., S. Hamilton General Relativity, Black Holes, and Cosmology University of Colorado Boulder https://jila.colorado.edu/~ajsh/astr3740_17/grbook.pdf.
- Steven, B. Giddings The Black Hole Information Paradox Department of Physics, University of California, Santa Barbara, CA 93106-9530 https://www.nevis.columbia.edu/~zajc/acad/W3072/9508151.pdf.
- V.M. Khatsymovsky On the discrete version of the Kerr–Newman solution Budker Institute of Nuclear Physics of Siberian Branch Russian Academy of Sciences, Novosibirsk, 630090, Russia https://arxiv.org/pdf/2212.13547v2.
- Tim Adamo (a) and E. T. Newman (b) The Kerr-Newman metric: A Review Department of Applied Mathematics & Theoretical Physics, University of Cambridge. Department of Physics & Astronomy, University of Pittsburgh. https://arxiv.org/pdf/1410.6626.
- Alexander Shatskiy Analysis of the Topology of the Kerr Metric https://arxiv.org/pdf/2004.14156.
- Ashok B. Joshi,1, ∗ Divya Tahelyani,1, † Dipanjan Dey,2, ‡ and Pankaj S. Joshi3, 1, Observational aspects of a class of Dark matter spacetimes 1 International Centre for Cosmology, Charusat University, Anand, GUJ 388421, India 2Department of Mathematics and Statistics, Dalhousie University, Halifax, Nova Scotia, Canada, B3H 3J5 3Cosmology Centre, Ahmedabad University, Ahmedabad, GUJ 380009, India https://arxiv.org/pdf/2212.03042.
- Rohan Kulkarni Black Holes, Singularity Theorems & The Global Structure of Spacetimein General Relativity Elementary Particle Theory, Institute of Theoretical Physics, University of Leipzig https://arxiv.org/pdf/1911.06608.
- Eugene Terry Tatum Black Hole Complementarity in Terms of the Outsider and Insider Perspectives Independent Researcher, Bowling Green, Kentucky, USA https://www.scirp.org/pdf/jmp_2024020815045386.pdf.
- Andrew Walcott Beckwith Penrose Suggestion as to Pre Planck-Era-Black Holes Showing Up in Present Universe Data Sets Discussed, with a Possible Candidate as to GW Radiation Which May Provide Initial CMBR Data. Physics Department, Chongqing University, Chongqing, China https://www.scirp.org/pdf/jhepgc_2021082709305290.pdf.
- W. Y. Ai, Non-singular black hole in two-dimensional asymptotically flat spacetime, Phys. Rev. D 104 (2021), no. 4, 044064. [CrossRef]
- Carter, B. The complete analytic extension of the Reissner-Nordström metric in the special case e2 = m2. Phys. Lett. 1966, 21, 423–424. [Google Scholar] [CrossRef]
- Frolov, V.P.; Zelnikov, A. Introduction to Black Hole Physics; Oxford University Press (OUP): Oxford, Oxfordshire, United Kingdom, 2011. [Google Scholar]
- S. W. Hawking and G. F. R. Ellis, The large-scale structure of space-time, Cambridge Monographs on Mathematical Physics, No. 1, Cambridge University Press, London-New York, 1973.
- J. M. Maldacena, The Large N limit of super conformal field theories and supergravity, Adv. Theor. Math. Phys. 2 (1998), 231–252. [CrossRef]
- A. S. Wright, The Advantages of Bringing Infinity to a Finite Place: Penrose Diagrams as Objects of Intuition, Historical Studies in the Natural Sciences 44 (2014), no. 2, 99–139. [CrossRef]
- JEFF STEIHAUER. Observation of quantum Hawking radiation and its entanglement in an analogue black hole. https://arxiv.org/abs/1510.00621.
- JEFF STEIHAUER. Spontaneous Hawking radiation and beyond: Observing the time evolution of an analogue black hole https://arxiv.org/abs/1910.09363.
- J.S.Farnes A Unifying Theory of Dark Energy and Dark Matter: Negative Masses and Matter Creation within a Modified ΛCDM Framework. https://arxiv.org/abs/1712.07962.
- Alberto Casas, Profesor de Investigación IFT, CSIC/UAM. La luz y el origen de la materia. https://www.youtube.com/watch?v=CTrX_JBNEnU.
- Iván García Brao. Ecuación de campo de Einstein, Universidad de Murcia, Facultad de Matemáticas. Trabajo de grado año 2018. https://www.um.es/documents/118351/9850492/Garc%C3%ADa+Brao+TF_77837970.pdf/debaa03b-605b-420d-b3ac-85549b6622c0.
- Luis Felipe de Oliveira Guimarães, Orientadora Maria Emilia Xavier Guimarães. Soluciones de buracos negros na relatividade general, Universidad federal Fluminense, Bacherelado em Física. Trabajo de grado 2015. https://app.uff.br/riuff/bitstream/handle/1/5977/Luiz%20Filipe%20Guimaraes.pdf;jsessionid=4EAAF6CB7A4B776D04C9E6E6573D5919?sequence=1.
- Kostas kokkotas, Field Theory.
- Hartle, J.B.; Dray, T. Gravity: An Introduction to Einstein’s General Relativity. Am. J. Phys. 2003, 71, 1086–1087. [Google Scholar] [CrossRef]
- Charles, W. Misner, Kip S. Thorne and Jhon Archibald Wheelher, Gravitation.
- Benito Marcote, Cosmologia Cuantica y creacion del universe.
- Carlos Rovelli, Quantum Gravity.
- Vinicius Miranda Bragança, Singularidades em teorias f(r) da gravitação. http://arcos.if.ufrj.br/teses/mestrado_vinicius_miranda.pdf.
- Laurent Pitre ∗, Mark D. Plimmer, Fernando Sparasci, Marc E. Himbert; 2019. Determinations of the Boltzmann constant. https://hal.science/hal-02166573/file/1-s2.0-S1631070518301348-main.pdf.
- Turkot, O. ; ZEUS Collaboration Limits on the effective quark radius from inclusive ep scattering at HERA. The European Physical Society Conference on High Energy Physics. LOCATION OF CONFERENCE, ItalyDATE OF CONFERENCE; p. 346.
- Flores, H. G.; Gonçalvez de Souza, M. I. Theory of the Generalization of the Boltzmann’s Constant in Curved Space-Time. Shannon-Boltzmann Gibbs Entropy Relation and the Effective Boltzmann’s Constant. Preprints 2023, 2023090301. [CrossRef]
- Carr, B.; Kühnel, F. Primordial Black Holes as Dark Matter: Recent Developments. Annu. Rev. Nucl. Part. Sci. 2020, 70, 355–394. [Google Scholar] [CrossRef]
- D. T. Son - University of Washington. AdS/CFT correspondence and the Quark-Gluon Plasma https://www.phenix.bnl.gov/WWW/publish/jfrantz/ou_nucl_lunch/DamTSon_lectures.pdf.
- Marc Kamionkowski and Adam G. Riess. The Hubble tension and Early Dark Energy https://arxiv.org/pdf/2211.04492.pdf.
- Luis Anchordoqui, Carlos Nuñez and Kasper Olsen Quantum cosmology and AdS/CFT https://arxiv.org/abs/hep-th/0007064.
- Jefferson Londoño and Eduardo Velasquez. Agujeros Negros de Kerr Escuela de Fsica, Universidad Nacional de Colombia https://www.researchgate.net/publication/328380970_Agujeros_Negros_de_Kerr.
- Flores, H. G.; Gonçalves de Souza, M. I. RC Electrical Modelling of Black Hole. New Method to Calculate the Amount of Dark Matter and the Rotation Speed Curves in Galaxies. Preprints 2023, 2023092017. [Google Scholar] [CrossRef]
- Roger Penrose THE ROAD TO REALITY. A Complete Guide to the Laws of the Universe First published in Great Britain in 2004 by Jonathan Cape https://chaosbook.org/library/Penr04.pdf.
- Edmund Bertschinger & Edwin, F. Taylor Inside the Spinning Black Hole, CHAPTER 21 https://www.eftaylor.com/exploringblackholes/Ch21TravelThroughTheSpinningBH170831v1.
- Nagakura, H.; Yamada, S. THE STANDING ACCRETION SHOCK INSTABILITY IN THE DISK AROUND THE KERR BLACK HOLE. Astrophys. J. 2009, 696, 2026–2035. [Google Scholar] [CrossRef]
- Tarafdar, P.; Maity, S.; Das, T.K. Influence of flow thickness on general relativistic low angular momentum accretion around spinning black holes. Phys. Rev. D 2021, 103, 023023. [Google Scholar] [CrossRef]
- Moncrief, V. Stability of stationary, spherical accretion onto a Schwarzschild black hole. Astrophys. J. 1980, 235, 1038–1046. [Google Scholar] [CrossRef]
- Tarafdar, P.; Das, T.K. Influence of the geometric configuration of accretion flow on the black hole spin dependence of relativistic acoustic geometry. Int. J. Mod. Phys. D 2018, 27. [Google Scholar] [CrossRef]
- M. A. Shaikh and T. K. Das, Linear perturbations of low angular momentum accretion flow in the Kerr metric and the corresponding emergent gravity phenomena, Phys. Rev. D 98, 123022 (2018). [CrossRef]
- Carter, B. Complete Analytic Extension of the Symmetry Axis of Kerr's Solution of Einstein's Equations. Phys. Rev. B 1966, 141, 1242–1247. [Google Scholar] [CrossRef]
- Carter, B. Global Structure of the Kerr Family of Gravitational Fields. Phys. Rev. B 1968, 174, 1559–1571. [Google Scholar] [CrossRef]
- Tarafdar, P.; Bollimpalli, D.A.; Nag, S.; Das, T.K. Influence of geometrical configuration on low angular momentum relativistic accretion around rotating black holes. Phys. Rev. D 2019, 100, 043024. [Google Scholar] [CrossRef]
- Abramowicz, M.A.; Lanza, A.; Percival, M.J. Accretion Disks around Kerr Black Holes: Vertical Equilibrium Revisited. Astrophys. J. 1997, 479, 179–183. [Google Scholar] [CrossRef]
- S. W. Hawking, “Breakdown of predictability in gravitational collapse,” Phys. Rev. D 14, 2460 (1976). [CrossRef]
- Susskind, L.; Thorlacius, L.; Uglum, J. The stretched horizon and black hole complementarity. Phys. Rev. D 1993, 48, 3743–3761. [Google Scholar] [CrossRef]
- Marolf, D.; Polchinski, J. Gauge-Gravity Duality and the Black Hole Interior. Phys. Rev. Lett. 2013, 111, 171301. [Google Scholar] [CrossRef]
- Maldacena, J.; Susskind, L. Cool horizons for entangled black holes. Fortschritte der Phys. 2013, 61, 781–811. [Google Scholar] [CrossRef]
- M. R. Mbonye and D. Kazanas, “Non-singular black hole model as a possible end product of gravitational collapse,” Phys. Rev. D 72, 024016 (2005); “Can Gravitational Collapse Sustain Singularity-Free Trapped Surfaces?” Int. J. Mod. Phys. 2008; 17.
- V. P. Frolov, “Notes on non-singular models of black holes,” Phys. Rev. D 94, no. 1040; 10, arXiv:1609.01758 [gr-qc]].
- V. P. Frolov and A. Zelnikov, “Quantum radiation from an evaporating non-singular black hole,” Phys. Rev. D 95, no. 1240; 12, arXiv:1704.03043 [hep-th]].
- Hartle, J.B. Tidal Friction in Slowly Rotating Black Holes. Phys. Rev. D 1973, 8, 1010–1024. [Google Scholar] [CrossRef]
- Brustein, R.; Medved, A.J.M.; Yagi, K. When black holes collide: Probing the interior composition by the spectrum of ringdown modes and emitted gravitational waves. Phys. Rev. D 2017, 96, 064033. [Google Scholar] [CrossRef]
- Carballo-Rubio, R.; Carballo-Rubio, R.; Di Filippo, F.; Di Filippo, F.; Liberati, S.; Liberati, S.; Visser, M.; Visser, M. Phenomenological aspects of black holes beyond general relativity. Phys. Rev. D 2018, 98, 124009. [Google Scholar] [CrossRef]
- Richard A. Matzner, Texas Cosmology Centre, University of Texas at Austin The Kerr-de Sitter Universe https://arxiv.org/pdf/1011.0479.
- Middleton, M.: Black hole spin: theory and observation, Chapter 3. In: Bambi, C. (ed.) Astrophysics of Black Holes: From Fundamental Aspects to Latest Developments, pp. 99–151. Springer, Berlin (2016).
- Gou, L.; McClintock, J.E.; Reid, M.J.; Orosz, J.A.; Steiner, J.F.; Narayan, R.; Xiang, J.; Remillard, R.A.; Arnaud, K.A.; Davis, S.W. THE EXTREME SPIN OF THE BLACK HOLE IN CYGNUS X-1. Astrophys. J. 2011, 742. [Google Scholar] [CrossRef]
- Stuchlík, Z.; Slaný, P. Equatorial circular orbits in the Kerr–de Sitter spacetimes. Phys. Rev. D 2004, 69, 064001. [Google Scholar] [CrossRef]
- de Felice, F.; Calvani, M. Causality violation in the Kerr metric. Gen. Relativ. Gravit. 1979, 10, 335–342. [Google Scholar] [CrossRef]
- Hackmann, E.; Lämmerzahl, C.; Kagramanova, V.; Kunz, J. Analytical solution of the geodesic equation in Kerr-(anti-) de Sitter space-times. Phys. Rev. D 2010, 81. [Google Scholar] [CrossRef]
- Stuchlík, Z.; Hledík, S. Some properties of the Schwarzschild–de Sitter and Schwarzschild–anti-de Sitter spacetimes. Phys. Rev. D 1999, 60, 044006. [Google Scholar] [CrossRef]
- Gerardo Flores, H.; Jain, H.; Gonçalves de Souza, M. I. Proton Decay and Inverse Neutron Decay. Preprints 2024, 2024050023. [Google Scholar] [CrossRef]
- Flores, H. G.; Jain, H.; Gonçalves de Souza, M. I. Origin of the Dark Energy. Preprints 2024, 2024051639. [Google Scholar] [CrossRef]
- Gerardo Flores, H.; Gonçalves de Souza, M. I. Electrical-Quantum Modelling of the Neutron and Proton as a Three-Phase Alternating Current Electrical Generator. Determination of the Number of Quarks-Antiquarks-Gluons and Gravitons, Inside a Neutron. Preprints 2023, 2023102076. [CrossRef]



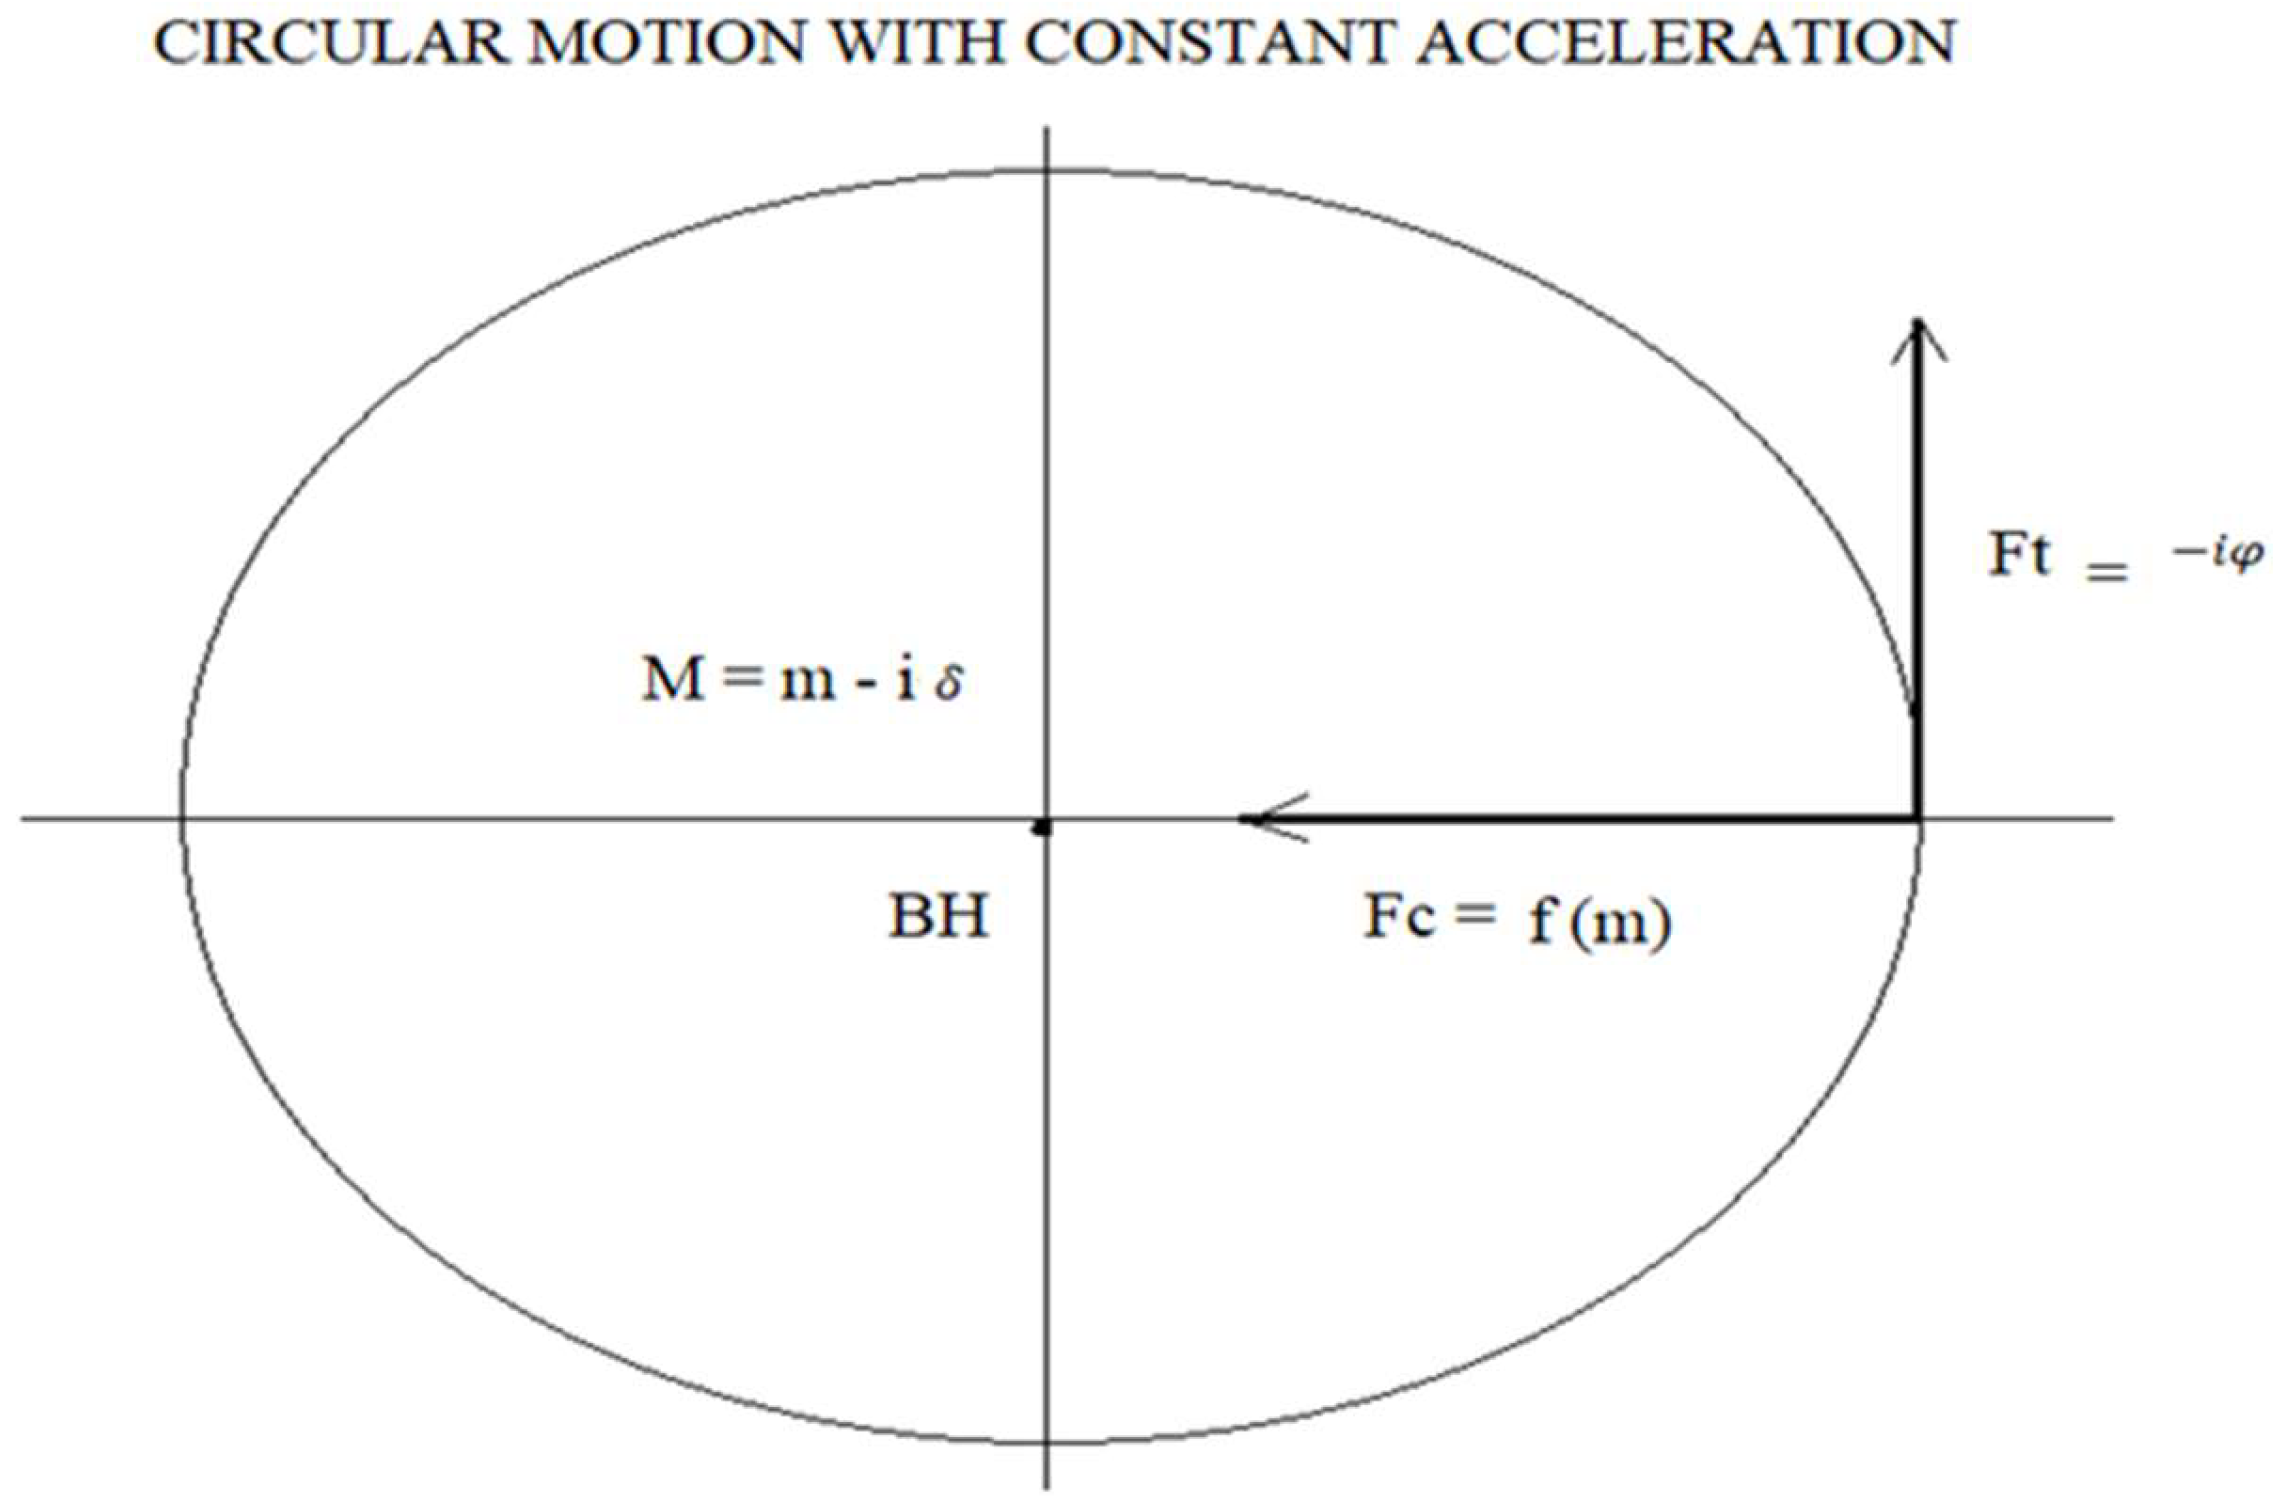
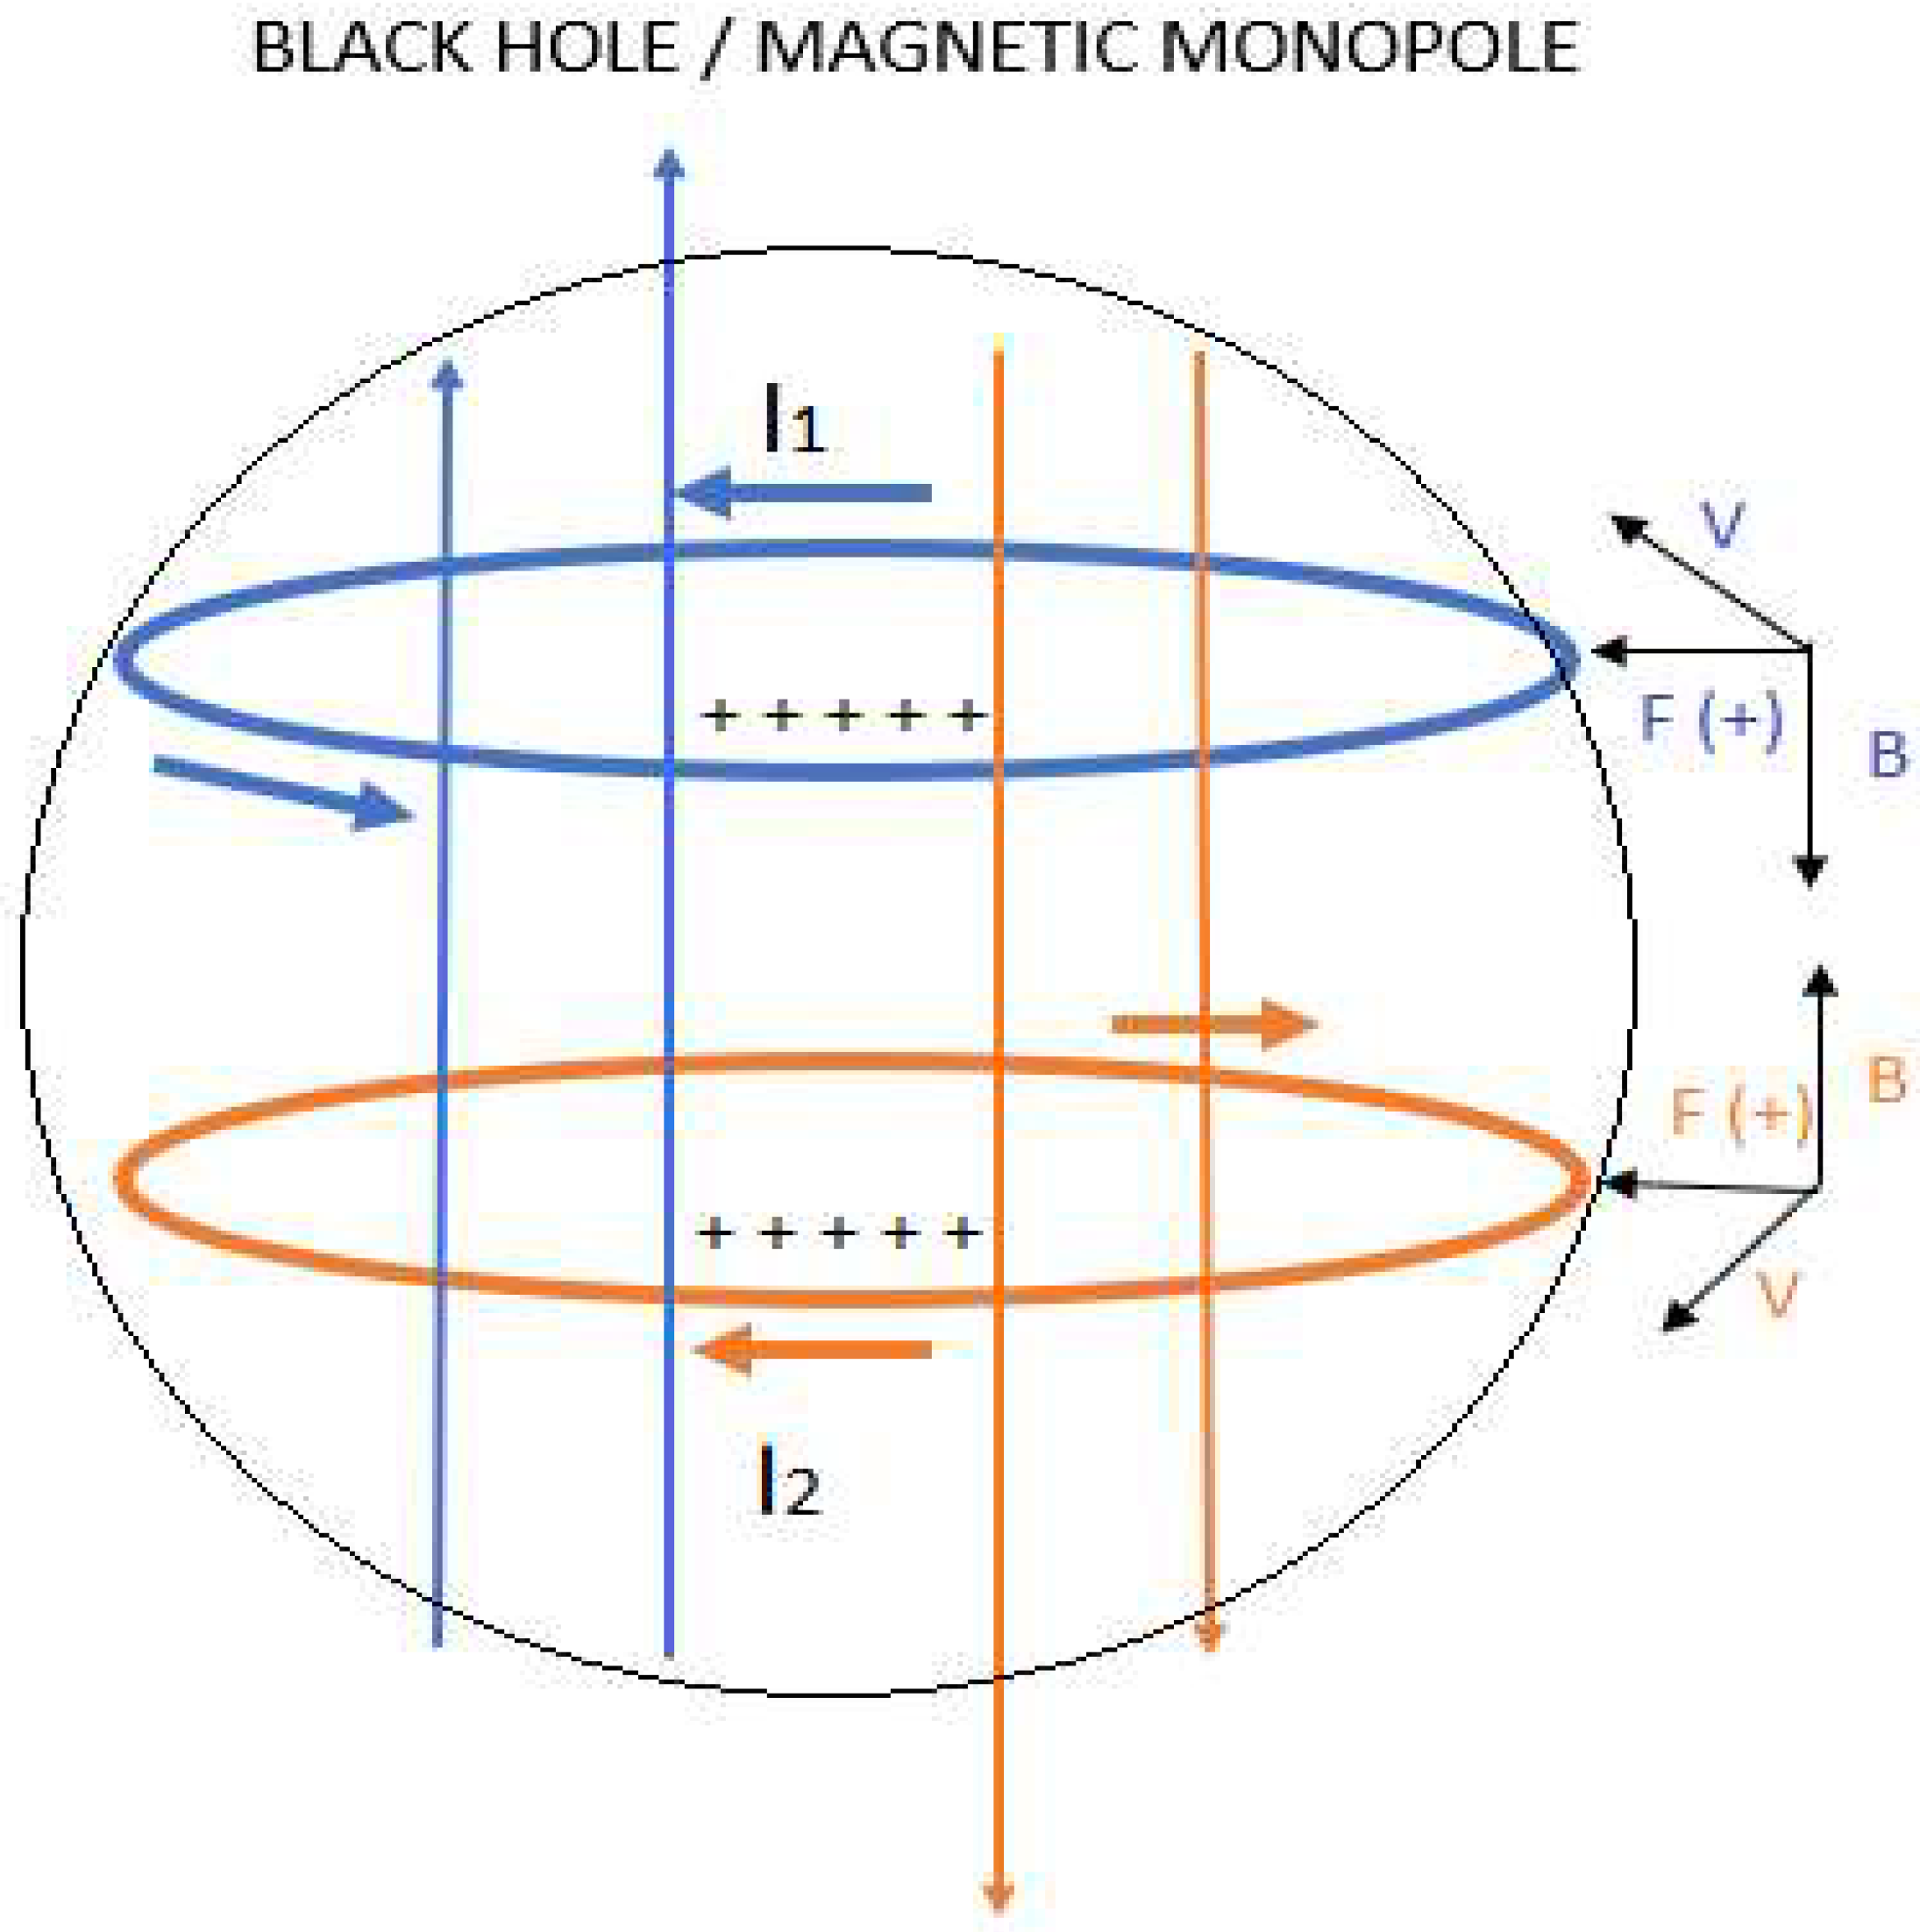
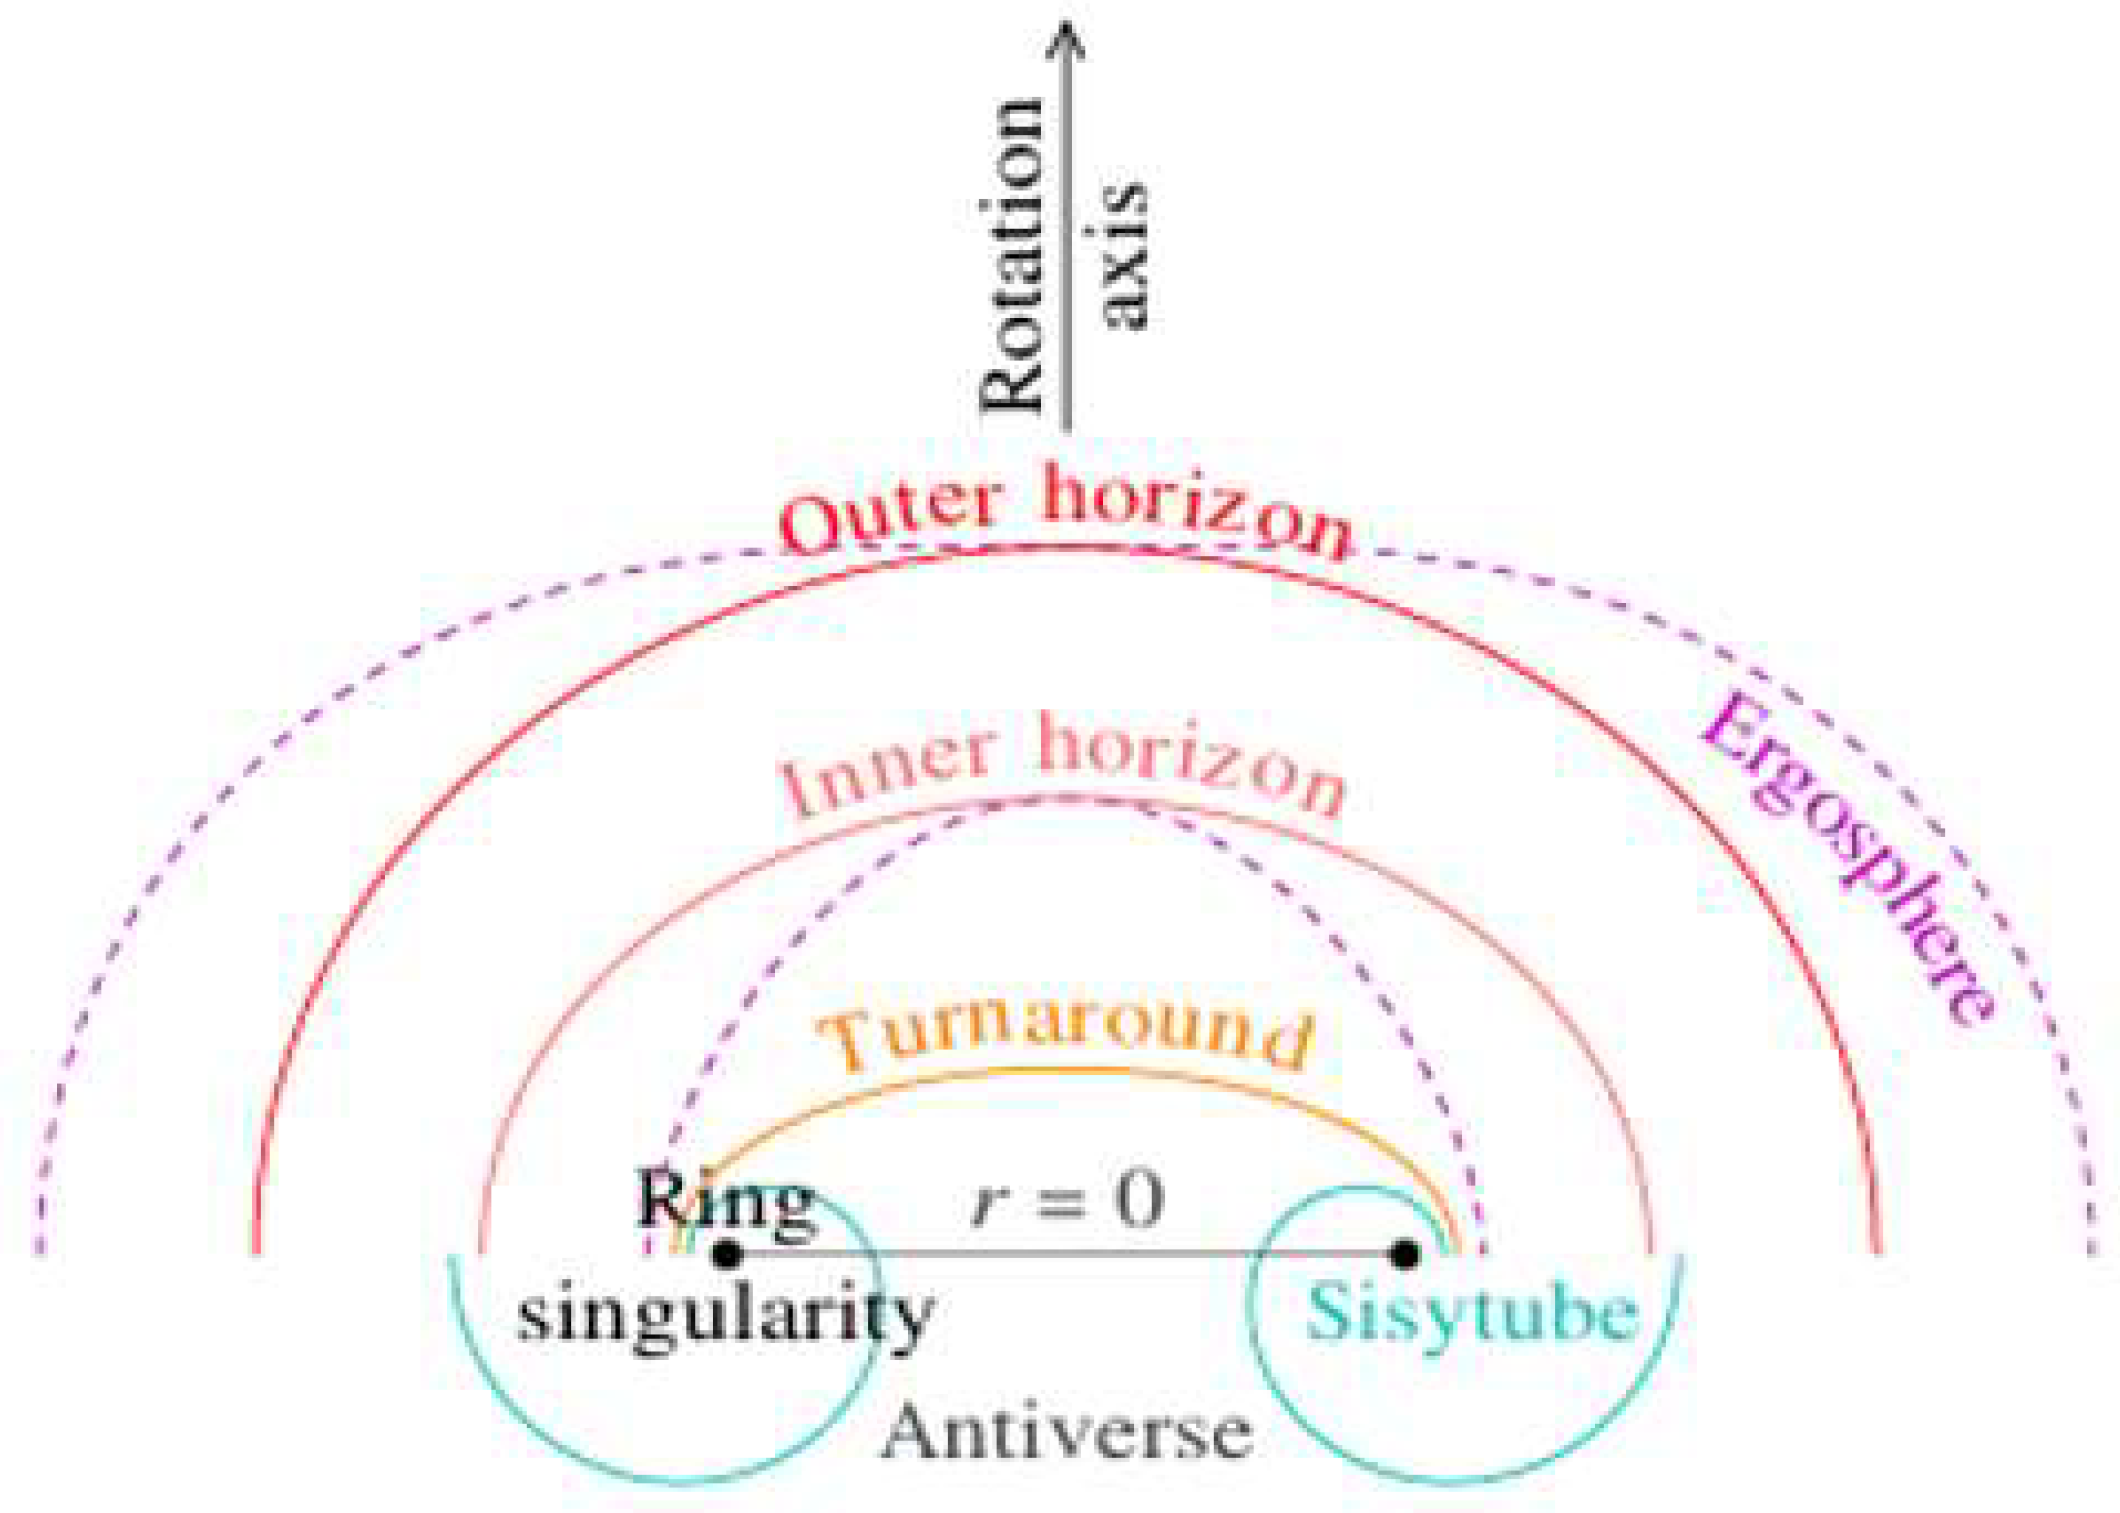





 |
 |
 |
| INVERSE NEUTRON DECAY | |||
| NEUTRON | DNEUTRON | INTERACTION | INTERACTION (MeV/c²) |
| R(DD)R | R(DD)R | E1 = 0 | E1 = 0 |
| B(DD)B | B(DD)B | E2 = 4.6 | E2 = 45.29 |
| G(UU)G | G(DD)G | E3 = 4.6 | E3 = 45.29 (-) |
| R(DD)B | R(DD)B | E4 = 10 | E4 = 98.47 |
| R(DU)G | R(DD)G | E5 = 10 | E5 = 98.47 (+) |
| B(DD)R | B(DD)R | E6 = 4.7 | E6 = 46.28 |
| B(DU)G | B(DD)G | E7 = 4.7 | E7 = 46.28 (+) |
| G(UD)R | G(DD)R | E8 = 5.0 | E8 = 49.23 (-) |
| G(UD)B | G(DD)B | E9 = 5.0 | E9 = 49.23 (-) |
| TOTAL INTERACTION | IEtI = 478.54 MeV/c² | ||
| (W⁺)e⁺ INTERACTION | IEeI = W⁺ = 1.00 MeV/c² | ||
| (Z⁰)n INTERACTION | IEnI = 52.19 MeV/c² | ||
| (Z⁰)p INTERACTION | IEpI = 45.29 MeV/c² | ||
| (Z⁰) INTERACTION | IZ⁰I = 6.90 MeV/c² | ||
| Θ angle, Θ = arc cos W⁺/Z⁰ | Θ = 82⁰ | ||
Disclaimer/Publisher’s Note: The statements, opinions and data contained in all publications are solely those of the individual author(s) and contributor(s) and not of MDPI and/or the editor(s). MDPI and/or the editor(s) disclaim responsibility for any injury to people or property resulting from any ideas, methods, instructions or products referred to in the content. |
© 2024 by the authors. Licensee MDPI, Basel, Switzerland. This article is an open access article distributed under the terms and conditions of the Creative Commons Attribution (CC BY) license (https://creativecommons.org/licenses/by/4.0/).


