1. Introduction
In recent years, the exponential growth of digital content has necessitated effective techniques for extracting and analyzing information from diverse document sources [
1]. Among the multitude of document elements, tables play a crucial role in organizing and presenting structured data [
2]. Their prevalence in domains such as scientific papers, financial reports, and medical records highlights the need for automated approaches to detect and recognize tables within image-based documents.
Traditional methods for table detection and recognition heavily relied on handcrafted features and rule-based algorithms. However, these approaches often struggled to handle the complexity and variability inherent in document images [
3]. With the advancement in the deep learning (DL) approaches and their architecture, Convolutional Neural Networks (CNNs) have emerged as a strong ML algorithm for visual recognition tasks, demonstrating remarkable performance in object detection, image classification, and semantic segmentation with an application in multiple disciplines of search i.e., OCR [
1], skin lesion [
4], and many more [
5,
6,
7].
Motivated by the potential of CNNs, we propose a novel methodology for the detection and recognition of table in image-based documents. Our approach leverages the ability of CNNs to learn complex features from raw pixel data, enabling accurate identification of tables with varying layouts, sizes, and orientations. By combining the strengths of CNNs with additional processing steps, the research focuses in providing an overwhelming and effective solution to address the challenges associated with table extraction from diverse document images.
Our proposed methodology comprises several key steps. Initially, we preprocess the input images by grayscale conversion simplify the subsequent analysis and eliminate color-based variations. We then apply a Gaussian blur filter to reduce noise and enhance the quality of the images. Subsequently, we employ the Canny edge detection technique to identify regions of interest that potentially contain tables, based on the presence of prominent edges [
8].
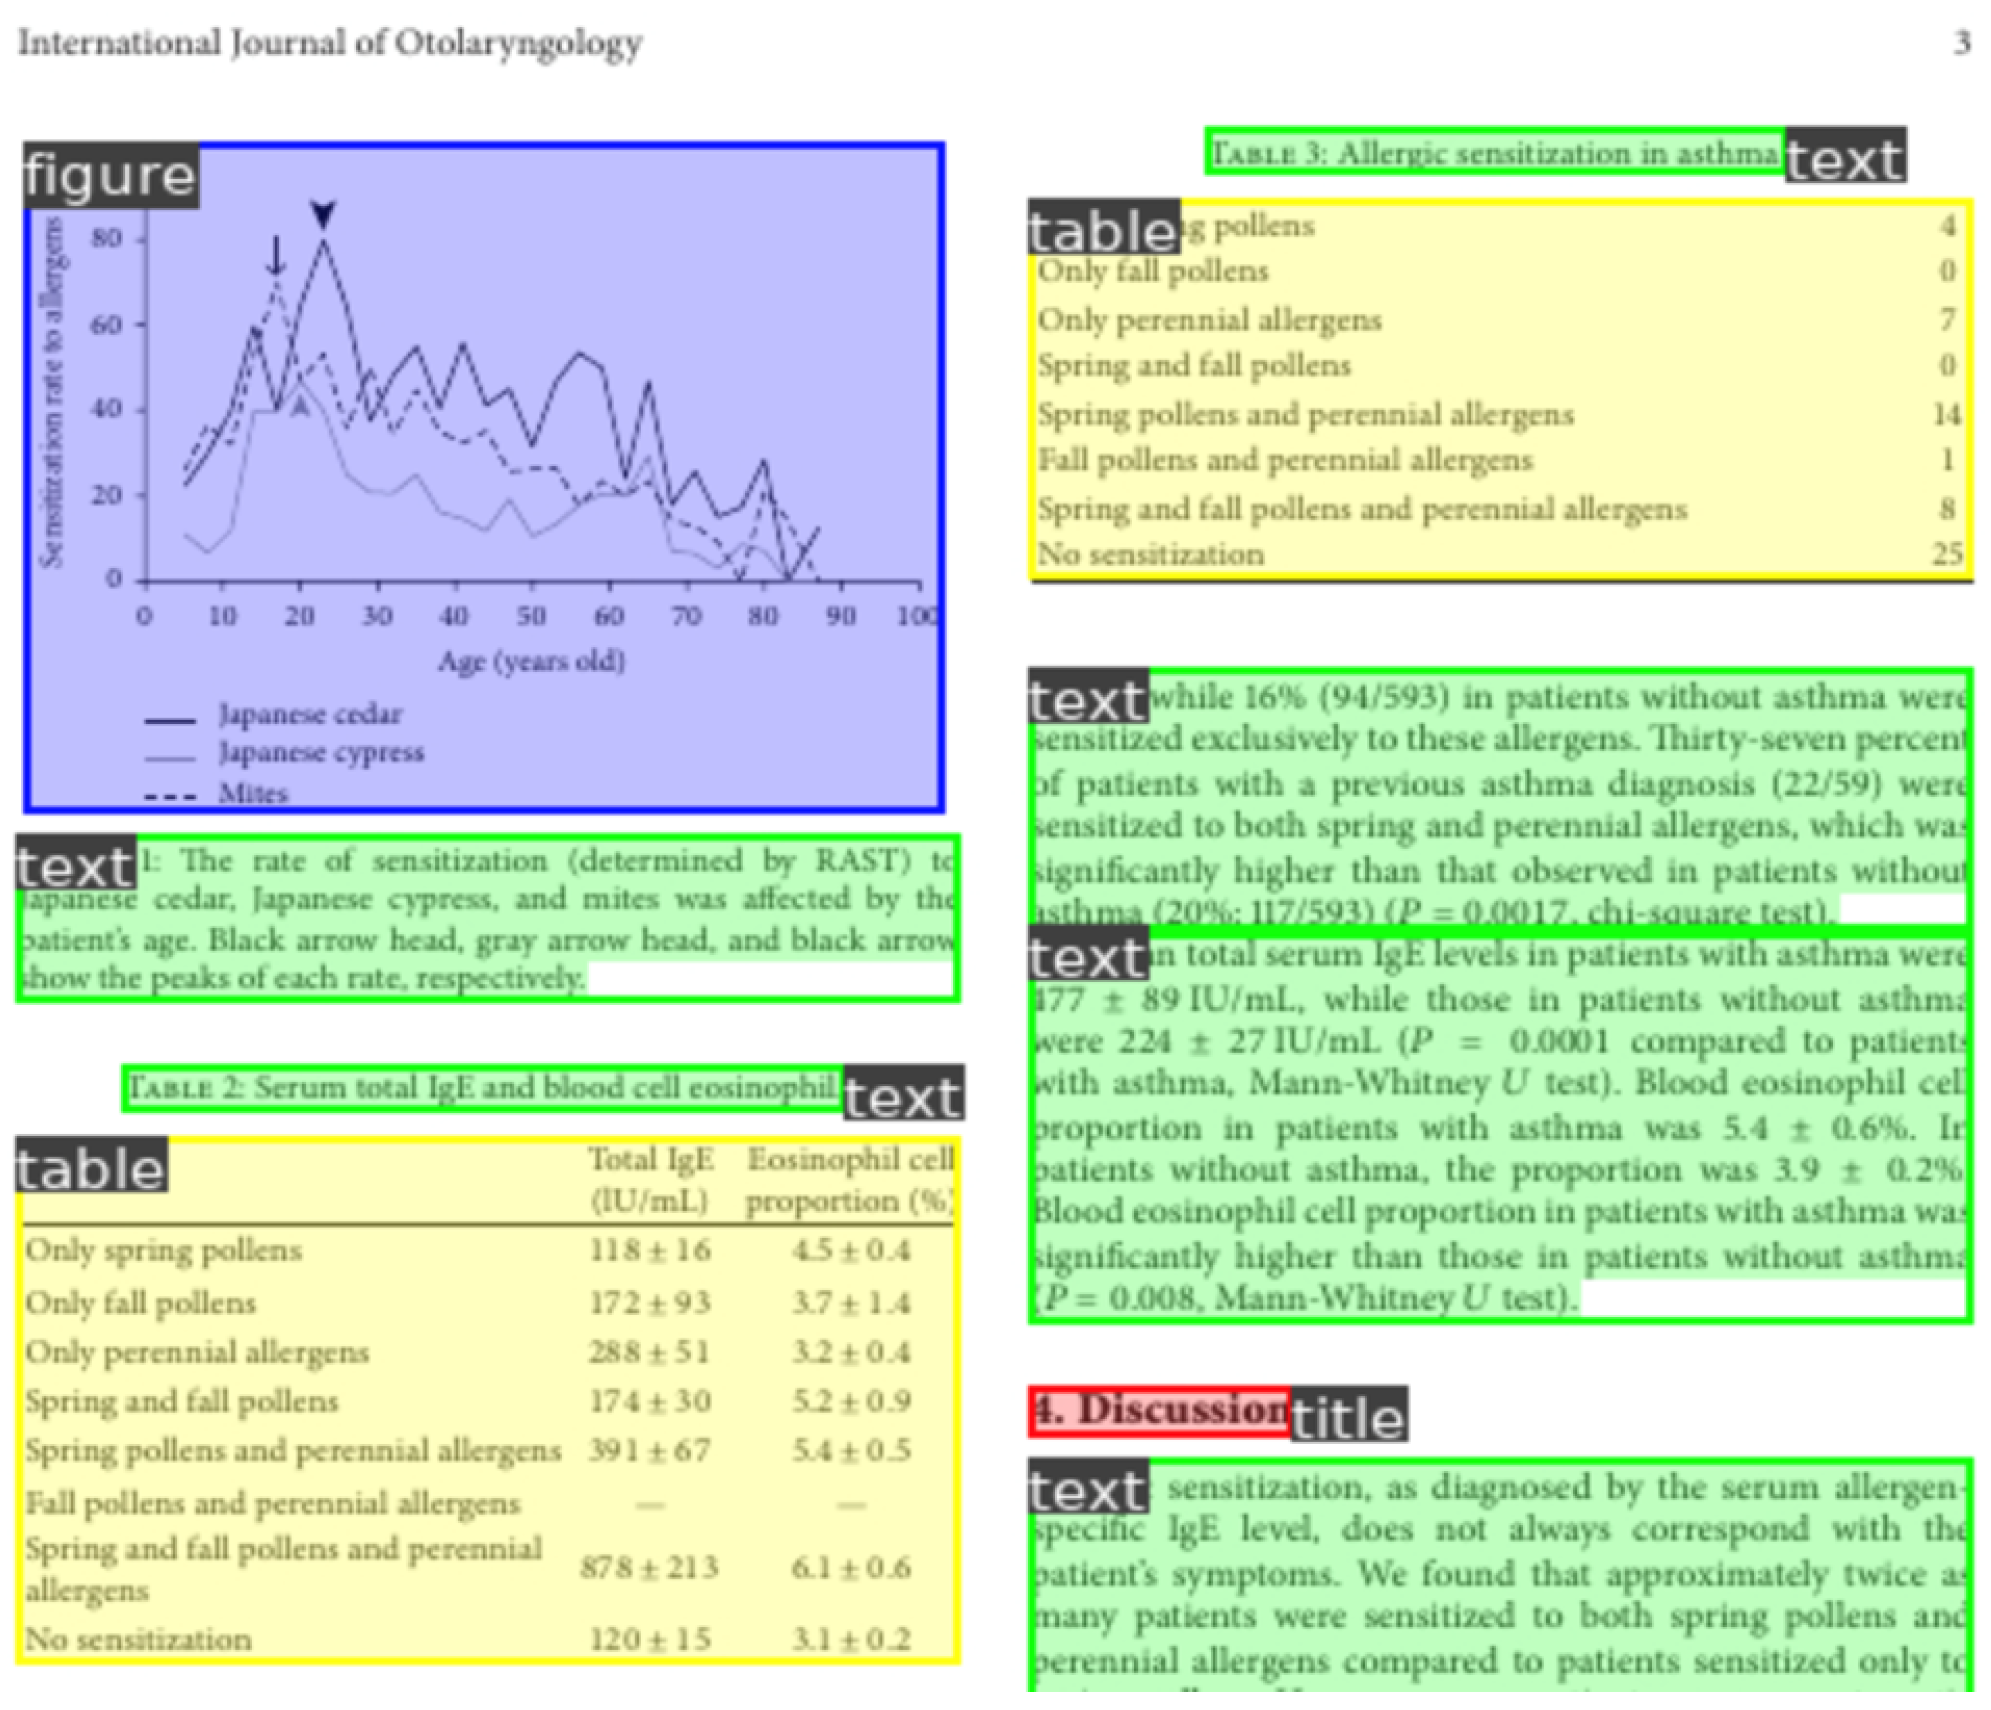
To refine the search for tables, we employ filters that consider region size, aspect ratio, and rectangularity, effectively eliminating false positives and enhancing the accuracy of table detection. Moreover, by leveraging Extensible Markup Language XML nodes representation and predefined annotations, we label the identified table regions within the image document. These annotations serve as critical reference points for subsequent text extraction.
Utilizing EDD architecture, we focus on extracting the textual content from table cells, enabling the acquisition of machine-readable data in a structured format. Furthermore,we use VSM based language modeling to retrieve tabular data against query search.we evaluate the accuracy of our results by analyzing the spatial relationships between the extracted cells and comparing them against a pre-defined table structure. This evaluation allows us to assess the alignment and coherence of the recognized tables.
In conclusion, our proposed methodology for table detection and recognition in image-based documents provides a holistic approach that leverages the power of CNNs to address the challenges associated with table extraction. Through this research, we aim to contribute to the field of document analysis and enable automated processing and understanding of tabular information within diverse document images. The subsequent sections will present the technical details of our methodology, experimental results, potential applications along-with the future research directions in this domain.
2. Literature Review
Tables are a good source to get information related to a topic in a quick way by scanning information presented in tabular form, however, due to non availability of structured information in portable document format (PDF), information extraction and document understanding becomes a challenging issue. Hao, Leipeng, et al. [
9] proposed a three step solution for table detection in PDF documents. The proposed methodology consists of three steps, 1) at a preprocessing step, table like areas consisting horizontal and vertical cross lines, horizontal rule lines and tables with no rule lines are detected and highlighted. To start the process of proposing table-like areas, we first inspect both the horizontal and vertical lines present on the page, starting from the top and going down. To retrieve these lines from the PDF file, we utilize a PDF parser that creates graphic objects for every instruction in the PDF. Each of these objects is assigned specific coordinates and attributes to accurately represent the lines on the page. 2) at the second step, a convolution neural network(CNN) architecture with 7 layers has been trained on the input data to classify whether this content is a table or not. The CNN architecture used in this research consists of 3 convolutional layers, two sub-sampling layers and two fully connected layers 3) and finally at third step the paper presents a method for processing PDF pages that involves transforming text and graphic objects into line vectors. These line vectors are used in either input or output layer of a convolutional neural network. The paper explores both approaches and finds that adding the vector to the input layer produces better results. The researchers trained their model on a self generated dataset of 7000 tables, and the test results are produced using a dataset of table competition of ICDAR 2013 [
10] that consists of 156 tables. Evaluation metrics used in this research are precision, recall and f-score.
Important information regarding a topic is usually stored in tabular format for information retrieval and related tasks. However, it is difficult to parse unstructured tabular data in PDF or image format into machine readable format. By considering this problem Zhong, Xu et al.[
11] proposed a novel attention based architecture having one encoder and two decoders Encoder-Dual-Decoder (EDD) that converts image based tables into hyper text markup language (HTML) format. The encoder proposed in the EDD method is a convolutional neural network that takes visual features of tables as input. To reconstruct a table from an image, they proposed two important components: the structure decoder and the cell decoder. The structure decoder’s role is to identify the table’s layout and structure, while the cell decoder generates the content for each cell. These two components work hand in hand, with the structure decoder guiding the cell decoder to create accurate content. After both decoders complete their tasks, their outputs are combined to create the final result, an HTML representation of the original table image. In this research, they created a dataset of 568k table images and named this publicly available dataset as PubTabNet [
11]. And finally researchers also proposed an evaluation metric Tree-Edit-Distance-Based Similarity (TEDS) metric for table recognition.
Table detection and content extraction are two sub problems in scanned document images. Paliwal, Shubham Singh, et al.[
12] proposed TableNet, a novel deep learning architecture based solution for both table recognition and information extraction. The proposed research uses deep learning architecture VGG-19, pretrained on imageNet dataset. To recognise a table in a scanned image document, the proposed model uses two decoder branches: one to locate the table as a whole and another to identify its individual columns. Once the columns are located, the system applies a set of rules to extract data from each cell in the table.The fully connected layers of VGG-19 are replaced with a convolution layer with ReLu activation function and a dropout layer. They use two datasets ICDAR 2013 and Marmot table dataset for evaluation process and precision,recall and f-score as evaluation metric.
In order to extract information from document images, the first step is to locate page elements such as tables, figures, and equations. The researchers [
13] have come up with a new approach called CDeC-Net, which is a deep network that can be trained end-to-end. Its main purpose is to detect tables in documents.The CDeC-Net uses a multistage extension of Mask Recurrent Convolutional Neural Network(R-CNN), which has a dual backbone with deformable convolution to accurately detect tables of different sizes. They tested the CDeC-Net on several benchmark datasets such as ICDAR release 2013, 2017 and 2019, UNLV, PubLayNet, Marmot and TableBank, and found that it performed well in all of them.
The proposed model has three key features. Firstly, CDeC-Net; a single model, can work well for all benchmark datasets. Secondly, table detection in a document image’s accuracy is excellent even at higher intersection over union(IoU) thresholds. Finally, this approach consistently outperformed recent papers that followed the same benchmark protocols. A pretrained ResNeXt-101 on MS-COCO has been used as the underlying deep learning architecture.The evaluation metrics used in this research to prove their accuracy are precision, mean average precision (MAP), f-score and recall.
In image based documents, table detection and table structure recognition were considered two different problems. However,Prasad, Devashish, et al. [
14] proposed CascadeTabNet: a Cascade mask Region-based CNN High-Resolution Network (Cascade mask R-CNN HRNet) based model that perform both tasks of tables region detection and recognizes the structural body cells from the detected tables with one single model. Evaluation of their model is performed on ICDAR 2013, ICDAR 2019 and TableBank public datasets. They also use Marmot dataset for evaluation of their proposed model. The proposed CascadeTabNet model further classifies the detected tables as bordered (ruling-based) and border-less (no ruling based) based tables. Evaluation metrics used for both table detection and structure recognition are precision, recall and F1 score with IoU threshold of 0.6,0.7,0.8and 0.9 respectively.
By considering the foreground and background features of the table in an image document, Arif, Saman, and Faisal Shafait.[
15] proposed a solution for table detection in image based documents. Their solution is based on the following observation :Data in tabular form contains more numeric values as compared to normal text area, hence their proposed model applies color coding as a signal to classify numeric and textual data. They use an efficient Convolutional Neural Network which is faster (Faster R-CNN) as a base model for the problem of table detection in document images. They evaluated their proposed model on publicly available UNLV dataset using multiple evaluation metrics including correct detection, partial detection, over-segmented tables, under-segmented tables, missed detections, false positives, precision, recall and F1 score. The proposed research methodology consists of two parts, first is the preprocessing step divided into two sub steps of coloration that aims at exploiting foreground features of image document and the second sub step is transformation, where distance transformation is applied to get background features on image document. The second part of proposed research is a table detection model based on Faster R-CNN, originally used VGG-16 deep learning architecture pretrained on ImageNet dataset.
In contrast to typical tables and objects in documents, those presented in image format possess distinct characteristics that pose challenges for deep learning models. These challenges arise from the considerable variation in size and aspect ratio, as well as the local similarities among different components within the document, making it difficult for deep learning structures to precisely locate them. TableSegNet [
16] addresses these challenges by using a fully convolutional network with a deep convolution path for learning global table region features and a shallower path for learning local features that help separate nearby tables and fine-tune table location in high resolution. TableSegNet incorporates convolution blocks with wide kernel sizes to enhance its ability to detect and separate tables. It also introduces an extra table-border class to refine the final prediction mask. With a relatively compact architecture comprising just 8.1 million parameters, TableSegNet attained state-of-the-art results on the ICDAR2019 table detection dataset and achieved the highest count of accurately detected tables on the ICDAR2013 table detection dataset. Moreover, all the TableSegNet models were trained purely on public document images without transfer learning from other domains. Evaluation parameters used in this research are F1 score with IoU value 0.9.
Siddiqui, Shoaib Ahmed, et al. [
17] proposes a new method for analyzing tabular structures in document images using deep learning models called deformable convolutional networks. The researchers also created a new dataset of 1081 tables, called TabStructDB2, which is densely labeled with row and column information. The proposed approach was evaluated on both the new dataset and an existing dataset, ICDAR-13, achieving state-of-the-art results on ICDAR-13 and baseline results on TabStructDB2. However, the authors note that there is still room for improvement in recognizing the structure of tables with arbitrary layouts. They suggest possible future directions, such as directly regressing for cells along with row/column span information or generating textual descriptions of tabular regions instead of detecting cells independently.
Researchers[
18] discuss the problem of inaccurate table boundary locating in document images and propose a solution using a Faster R-CNN based table detection method combined with corner locating. The proposed method involves using a Faster R-CNN network for coarse table detection and corner locating, followed by grouping the corners belonging to the same table using coordinate matching and filtering unreliable corners. Finally, table boundaries are adjusted and refined using the corresponding corner group. The proposed method has been shown to improve the precision of table boundary locating at pixel-level and achieve an F-measure of 94.9% on the ICDAR2017 POD dataset. Compared to traditional Faster R-CNN methods, this new method increases F-measure by 2.8% and pixel-level localization by 2.1%. This research model introduces the concept of table corners and explains the two-step process used for table detection and boundary refinement. The proposed method is superior to the widely used Faster R-CNN and SSD method, as shown by experimental results on a standard layout analysis dataset.
A novel approach for detecting tables in document images using deep neural networks and deformable convolution has been presented by Siddiqui, Shoaib Ahmed, et al. [
19]. The proposed method automatically discovers features useful for detecting tables, eliminating the need for custom heuristics. The approach is applicable to all types of documents, including born-digital PDFs and scanned images. The dataset used to train the network is a combination of different datasets, resulting in a significantly larger dataset. The model’s hyper-parameters are optimized to achieve the best results, and transfer learning is used with pretrained deep networks on ImageNet as the backbone. The proposed method achieves state-of-the-art performance on two well-known table detection datasets: ICDAR-2013 and 2017 POD, with F-measures of 0.99 and 0.97. The effectiveness and superiority of the proposed method for table detection is demonstrated, highlighting the generalization capabilities of the system in the real world.
In order to detect tables in both document and website images, Kim, Jihu, and Hyoseok Hwang. [
20] proposed a rule-based approach. The proposed method consists of two stages: feature extraction and grid pattern recognition. In the first stage, the features of the table contents are extracted using an image processing method. In the second stage, a tree structure is built to identify the grid pattern of the features. The proposed method outperforms previous methods for website table detection and achieves the fastest processing time. Although deep learning methods have shown success in table detection for document images, they are not applicable to website images due to variability and large datasets. The proposed method allows for the easy reconstruction of the contents of the table and has potential for future investigation in complicated image detection. The experimental results show the precision, recall, and F1-measure to be 84.5%, 72%, and 0.778, respectively, which are improvements over previous methods. Evaluation has been made on two datasets ICDAR 2013 and TOW image datasets.
The paper [
21] proposes a new method for detecting tables in documents using Generative Adversarial Networks (GAN). This method generates layout features for less-ruled tables, which are challenging to recognize due to the lack of table line features. The method consists of a feature generator and a discriminator, where the generator creates the layout feature from both real and fake images, and the discriminator differentiates between real and fake features. The proposed technique is evaluated while employing ICDAR-2017 Page Object Detection Competition dataset and a closed dataset of documents with less-ruled tables. The network is integrated with two common object detection and semantic segmentation models, U-Net and Mask R-CNN. The primary experimental results show that the proposed GAN-based feature generator is helpful for less-ruled table detection, and the whole model performs well on the datasets. The feature generator and discriminator models use binary cross-entropy as the loss function. The precision, recall, and F1 are used to evaluate the model’s performance, and the proposed method shows a significant improvement on both models in terms of accuracy and robustness. The model can be seen as the combination of a feature generator and a general table detection network, taking document images as input and outputting the accurate coordinates of detected tables.
TableBank [
22] is a new dataset for image-based table detection and recognition. Unlike existing methods that rely on pre-trained models and a few thousand labeled examples, TableBank uses a novel weak supervision approach to automatically create a dataset of 417,234 high-quality labeled tables by adding bounding boxes using mark-up tags from Word and Latex documents on the internet. TableBank is diverse and robust, containing documents in different languages and domains. The dataset is publicly available and can be used to develop deep learning approaches for table analysis tasks. Strong baselines are built using state-of-the-art models with deep neural networks. The experiment results show that layout and format variations have a great impact on the accuracy of table analysis tasks, and models trained on one specific domain do not perform well on others. TableBank’s effectiveness is evaluated by sampling 2,000 document images from Word and Latex documents, and 500 tables for table structure recognition. The training and testing data are publicly available, and evaluation is done using precision, recall, and F1 score.
The cTDaR (ICDAR 2019) [
23] competition is focused on evaluating state-of-the-art methods for table detection and recognition, specifically investigating and comparing methods that can identify table regions within a document image as well as the table structure. The competition seeks to maintain robustness in the face of different noise conditions, disruptive annotations, and variations in table structures, including hand-drawn tables and handwritten text. To test these methods, two new datasets were created consisting of modern and archival documents, the latter containing historical documents with handwritten and printed tables. The evaluation framework is derived from the methodology employed in the ICDAR 2013 Table competition, with Track A focusing on table detection and Track B on table recognition. There are two subtracks in Track B, one providing table region information and the other providing no a priori information. The historical dataset includes a wide variety of tables, from hand-drawn accounting books to stock exchange lists and train timetables, while the modern dataset comes from different kinds of PDF documents such as scientific journals, forms, financial statements, etc. The annotated contents contain the table entities and cell entities in a document, while nested tables are not considered. The annotation of the dataset follows a similar notation derived from the ICDAR 2013 Table Competition format, using a single XML file to store the structures.
3. Proposed Methodology
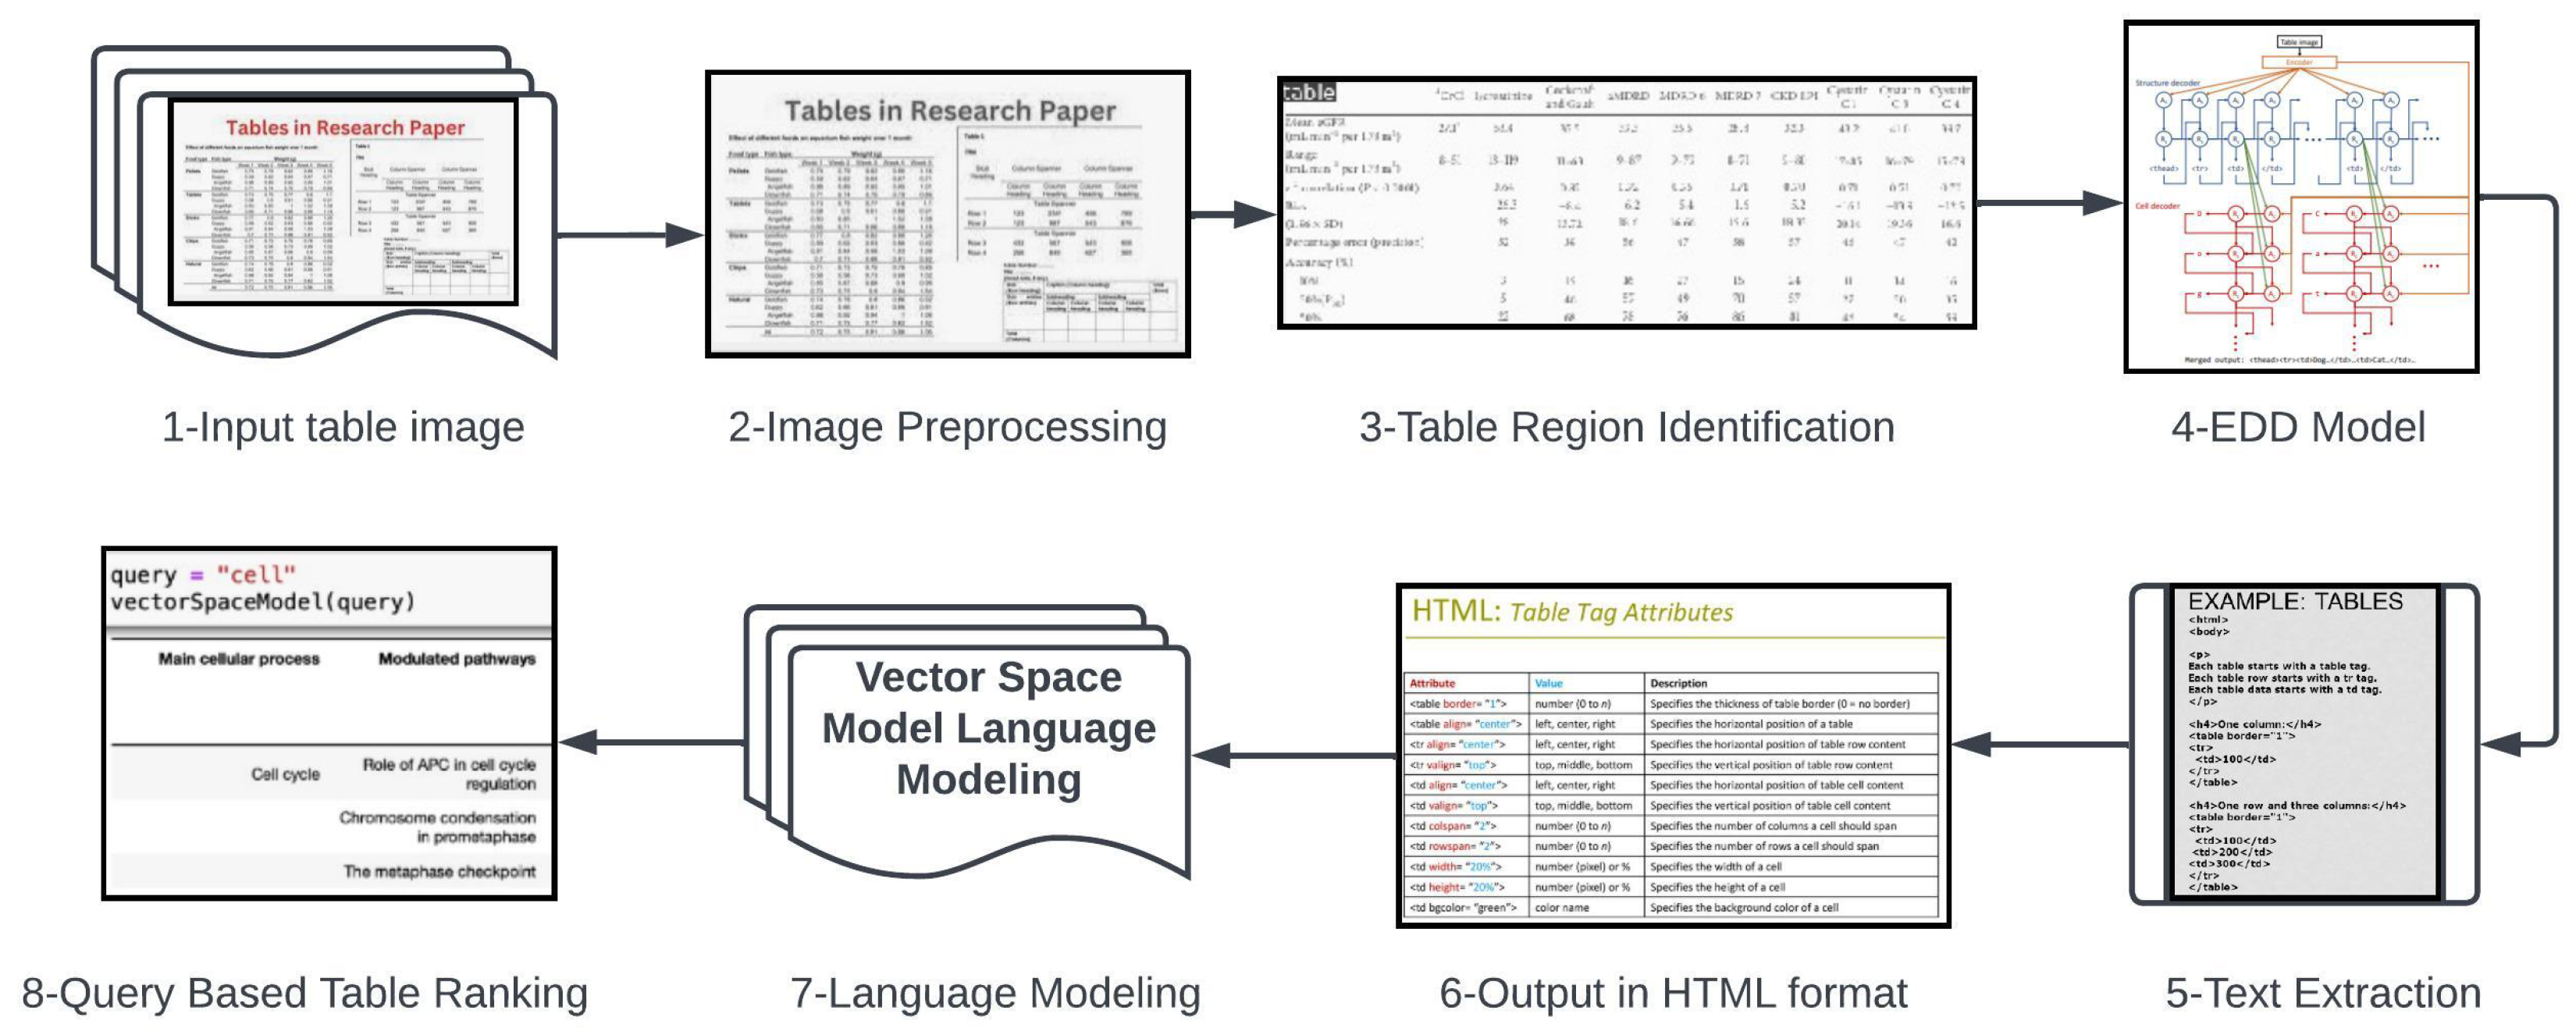
In this research study, we present a comprehensive methodology for the detection and recognition of tables in image-based documents
Figure 1. Our proposed approach involves a series of steps aimed at accurately identifying and extracting tables from images while considering their structural properties and textual content.
Figure 1.
Architecture Diagram of Proposed Methodology.
Figure 1.
Architecture Diagram of Proposed Methodology.
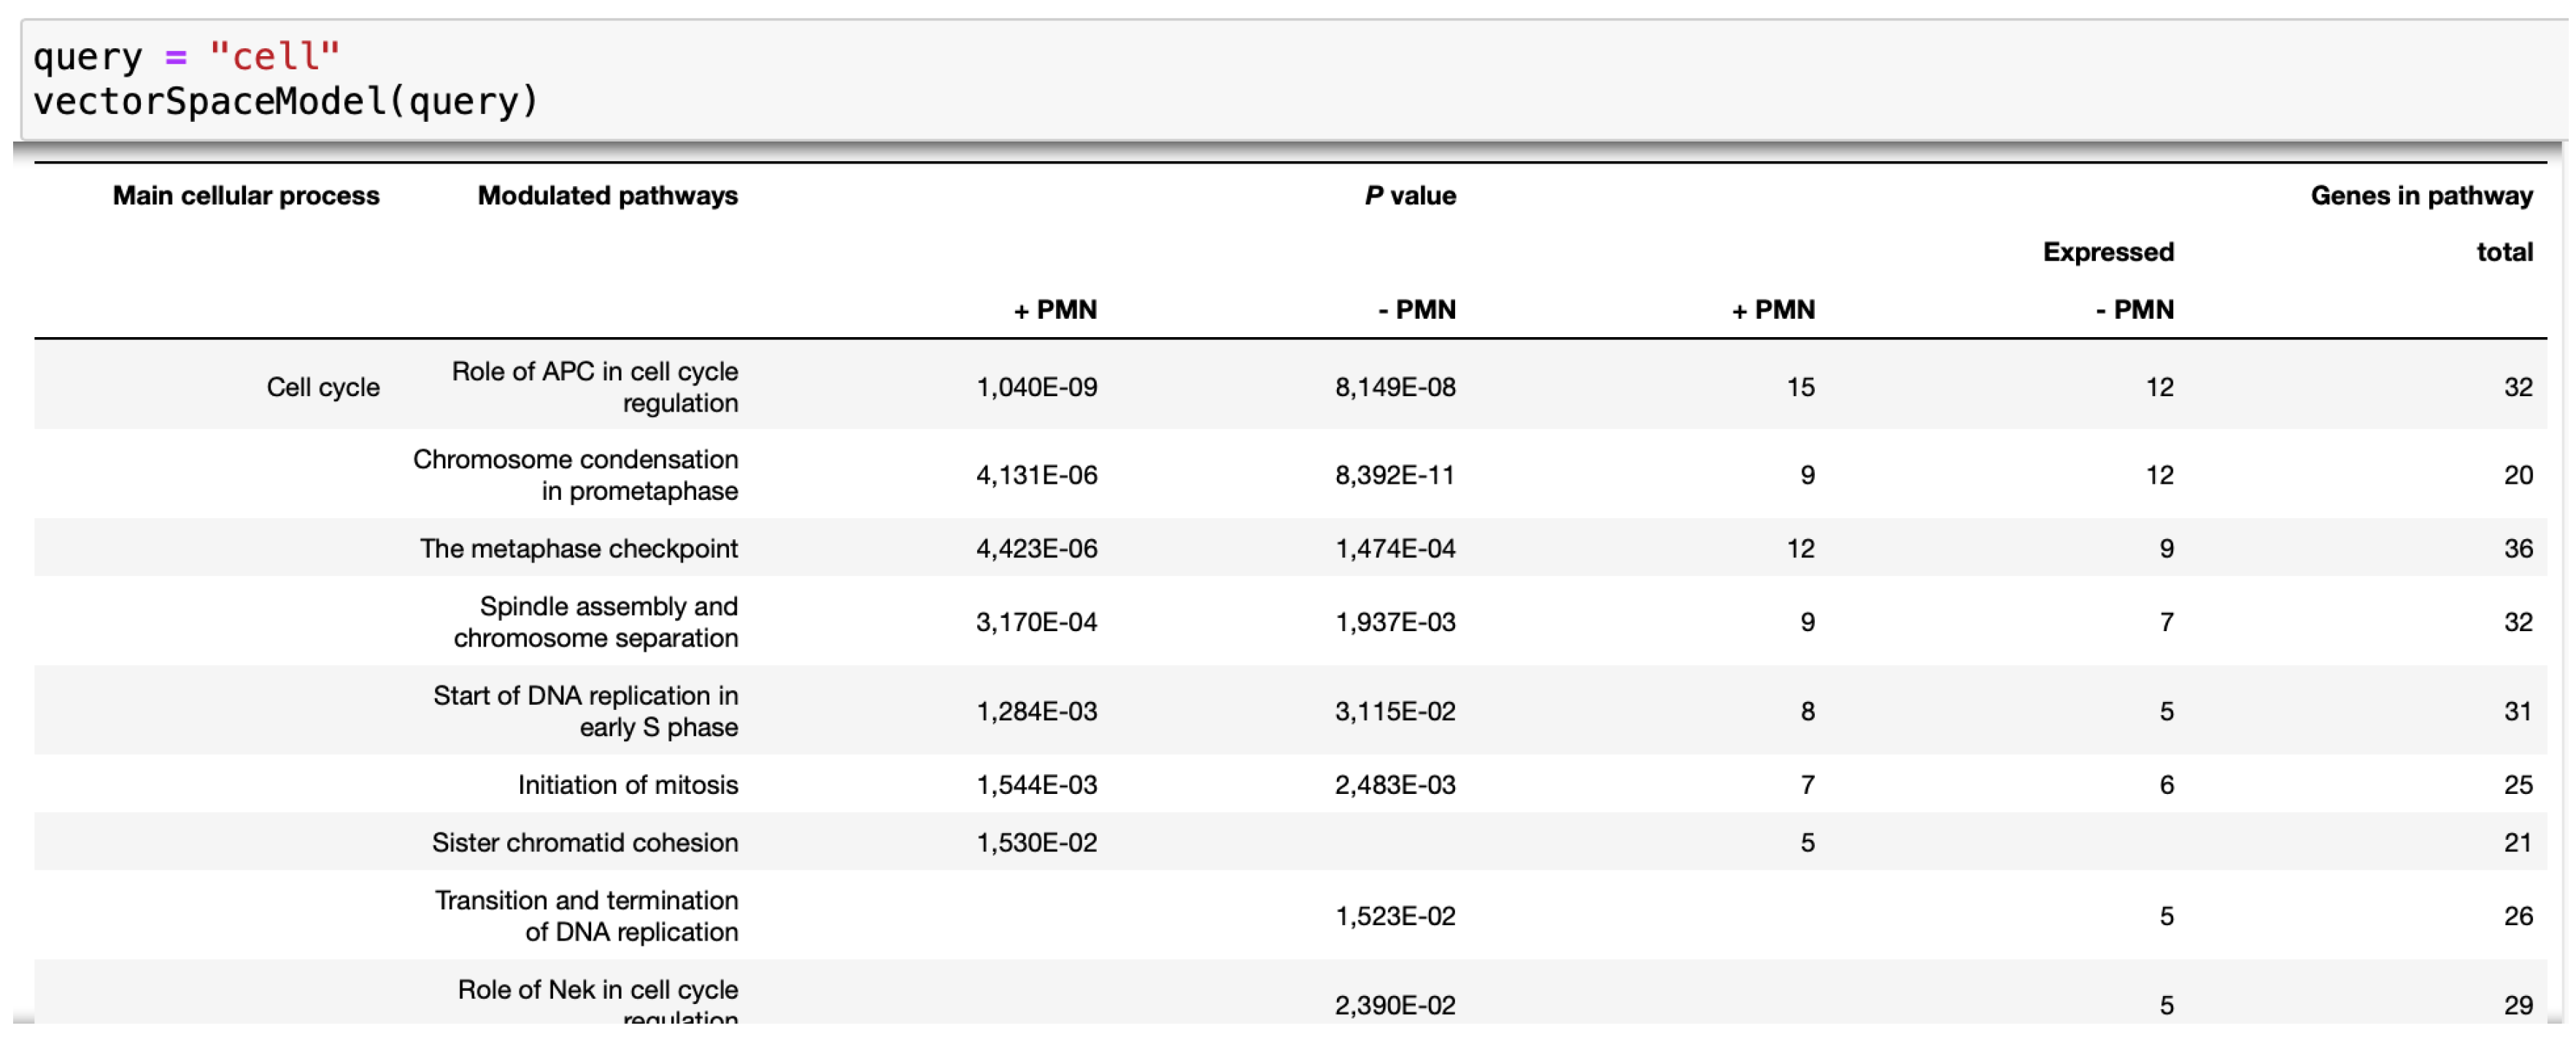
Figure 2.
Resultant table against query search.
Figure 2.
Resultant table against query search.
-
Image Preprocessing:
To simplify the input image and eliminate color information, we begin by converting it into a gray scale representation.
-
Noise Reduction:
A Gaussian blur filter is applied to the gray scale image in order to effectively reduce noise and enhance the quality of the subsequent processing steps.
-
Candidate Table Region Identification:
Using the Canny edge detection technique on the smoothed image, we identify regions that exhibit prominent edges, which are indicative of potential table boundaries. These identified regions are referred to as "candidate table regions."
-
Refinement of Candidate Regions:
To refine the search for tables, we apply filters based on region size, aspect ratio, and rectangular shape. By considering these geometric characteristics, we aim to eliminate false positives and improve the accuracy of table detection.
-
Tabular Region Labeling:
By leveraging XML nodes representation and predefined annotations, we label the identified tabular regions within the image document
Figure 3. These annotations serve as crucial reference points for subsequent text extraction steps.
-
Text Extraction Using Encoder-Dual Decoder (EDD) Architecture:
Upon successfully identifying the table regions, we employ an advanced Encoder-Dual Decoder (EDD) architecture to extract the textual content contained within the individual cells of the tables. This process enables us to obtain machine-readable data in a structured format.
-
Structural Evaluation:
To evaluate the accuracy of our results, we conduct an analysis of the spatial relationships between the table cells. By comparing these relationships against a predefined table structure, we assess the alignment and coherence of the extracted tables.
-
Output Generation:
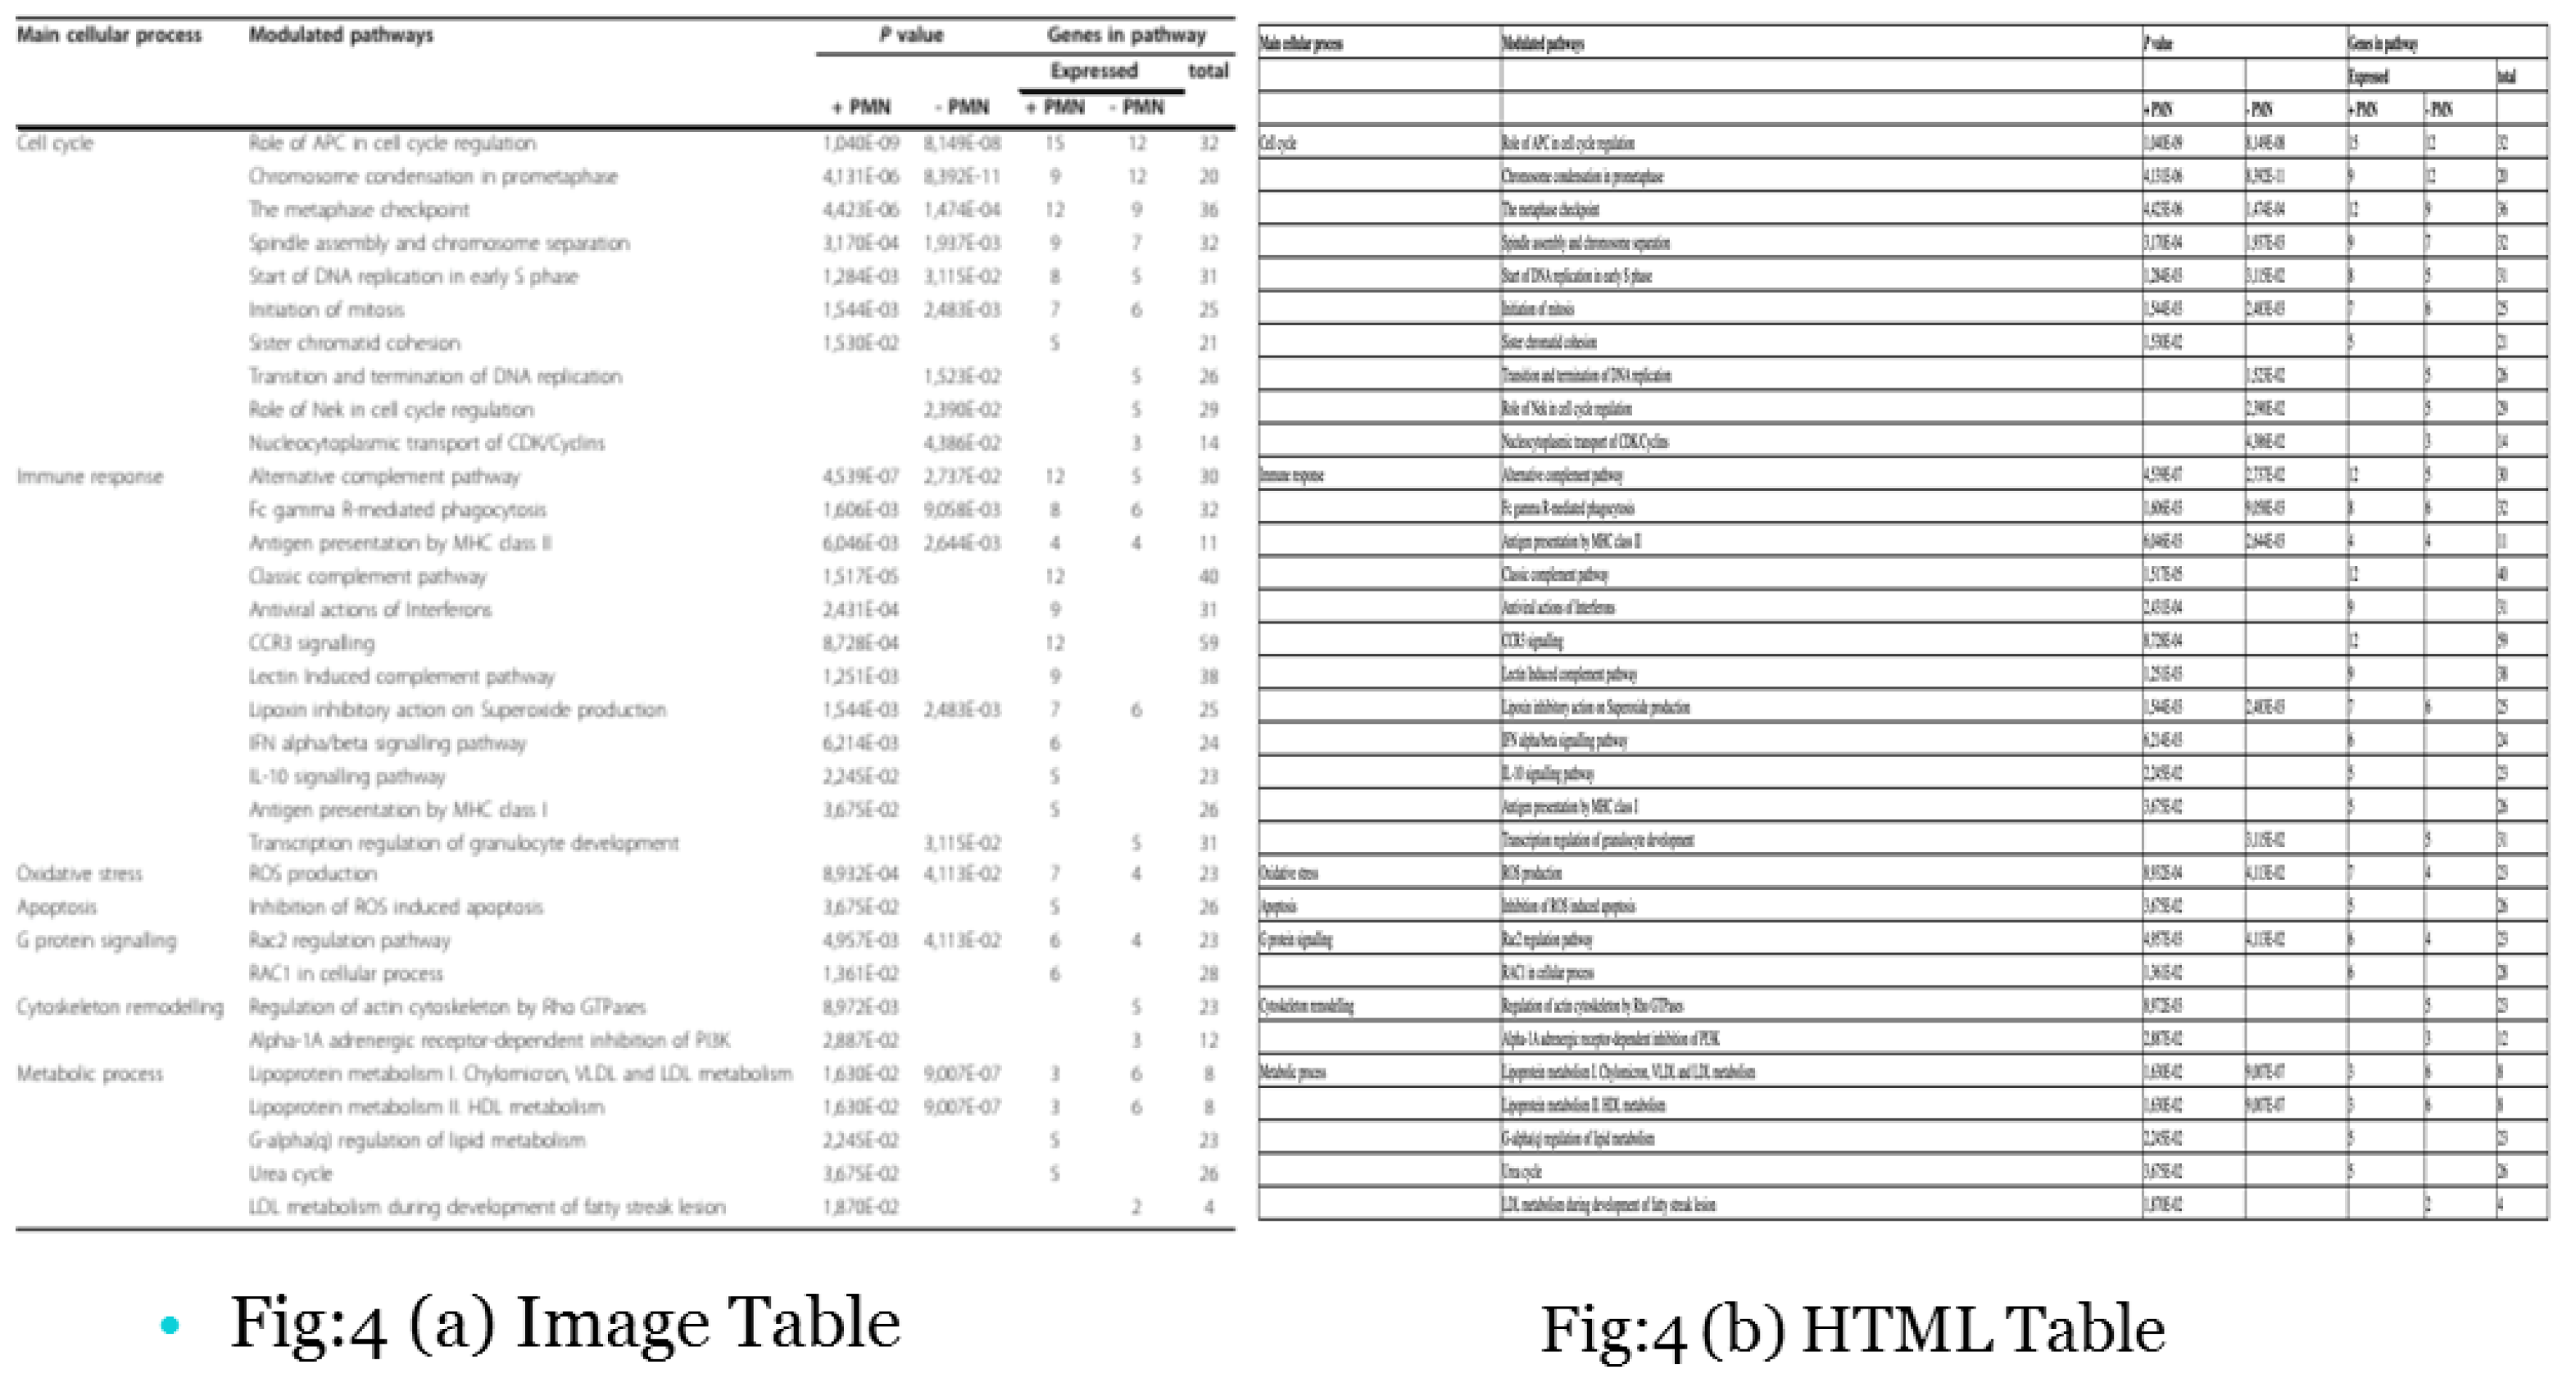
In the final step, we generate the output in HTML format, providing a user-friendly representation of the recognized tables that can be easily viewed and further processed.
-
Language Modeling:
Finally, we use Vector Space Model (VSM) for language modeling using HTML dataset of tables. By using VSM, we get resultant tables against query of any word.
Through the execution of these steps, our proposed methodology offers a comprehensive solution for table detection and recognition in documents with image format. The combination of preprocessing, region identification, text extraction, and structural evaluation ensures accurate and reliable table extraction from diverse document images. We further extend our methodology by adding language model (VSM) for searching tabular data against any query.
3.1. Dataset Details
PubTabNet is a publicly available dataset that focuses on table recognition and understanding in scientific articles. It is designed to facilitate research and development in the field of document analysis, particularly in the context of table detection, structure recognition, and table-to-text extraction.The PubTabNet dataset consists of approximately 500,000 high-resolution images extracted from scientific articles. These images contain a diverse range of tables with various layouts, formats, and complexities. The dataset covers a wide range of domains, including computer science, biology, physics, and more.
Each image in PubTabNet is accompanied by ground truth annotations, providing precise information about the table structure, cell contents, and associated textual context. The annotations include the coordinates of table cells, cell spans, and cell text content.
3.2. Encoder-Dual Decoder (EDD) Architecture
The attention-based Encoder-DualDecoder (EDD) architecture is a powerful deep learning model designed specifically for analyzing table images. It comprises three key components: an encoder, a structure decoder, and a cell decoder.
The encoder plays a crucial role in capturing the visual characteristics of the input table images. By processing the table image through convolutional and pooling layers, the encoder extracts important features and reduces the image’s dimensionality. The result is a condensed representation known as the encoding or feature vector, which captures the essential visual information from the table image.
The structure decoder is responsible for reconstructing the table’s structure. It takes the encoding generated by the encoder and repeats it multiple times, aligning the repeated encoding with the desired table structure size determined by the number of rows and columns. This repeated encoding is then fed into a recurrent LSTM layer, which processes the information and generates a probability distribution over the possible structure elements. By doing so, the structure decoder helps the model understand the organization and layout of the table.
The cell decoder works alongside the structure decoder to recognize the content of each table cell. It takes the encoding from the encoder and combines it with the output of the structure decoder. This concatenated information is then passed through another LSTM layer, which generates a probability distribution over the potential cell content for each cell in the table. The cell decoder benefits from the reconstructed structure to accurately guide the recognition of cell content.
The EDD network can compute two types of loss functions:
i) The first one is the cross-entropy loss associated with generating the structural tokens, which is referred to as .
ii) The second loss function is the cross-entropy loss related to generating the cell tokens, known as .
To determine the overall loss
of the EDD network, we calculate it using the following formula:
where
is a hyper-parameter.
3.3. Vector Space Model
The vector space model is a method used in information retrieval to find relevant information based on a given query [
24]. In this scenario, we have a dataset of HTML tables as input.
HTML tables are commonly used on the web to organize and present structured data. They consist of rows and columns containing various types of information. Our dataset contains multiple tables, each with its own unique content.
When we perform a text query search, the vector space model analyzes both the query and the content of the tables in the dataset. It represents the query and tables as vectors in a high-dimensional space. Each dimension in this space corresponds to a specific feature or characteristic.
By employing mathematical techniques such as cosine similarity, the vector space model calculates the similarity between the query vector and the table vectors [
25]. This similarity score indicates how relevant each table is to the query. Tables with higher similarity scores are considered more relevant.
Based on these similarity scores, the vector space model ranks the tables and presents the most relevant ones as search results shown in
Figure 2. This enables users to search for and find specific information within the dataset by using text queries.
