Submitted:
01 August 2024
Posted:
02 August 2024
You are already at the latest version
Abstract

Keywords:
1. Introduction
2. Material and Methods
2.1. General Introduction of Indonesia
2.2. Emission Inventory
2.3. Emission Factors
2.4. Activity Data
2.5. Grey Model
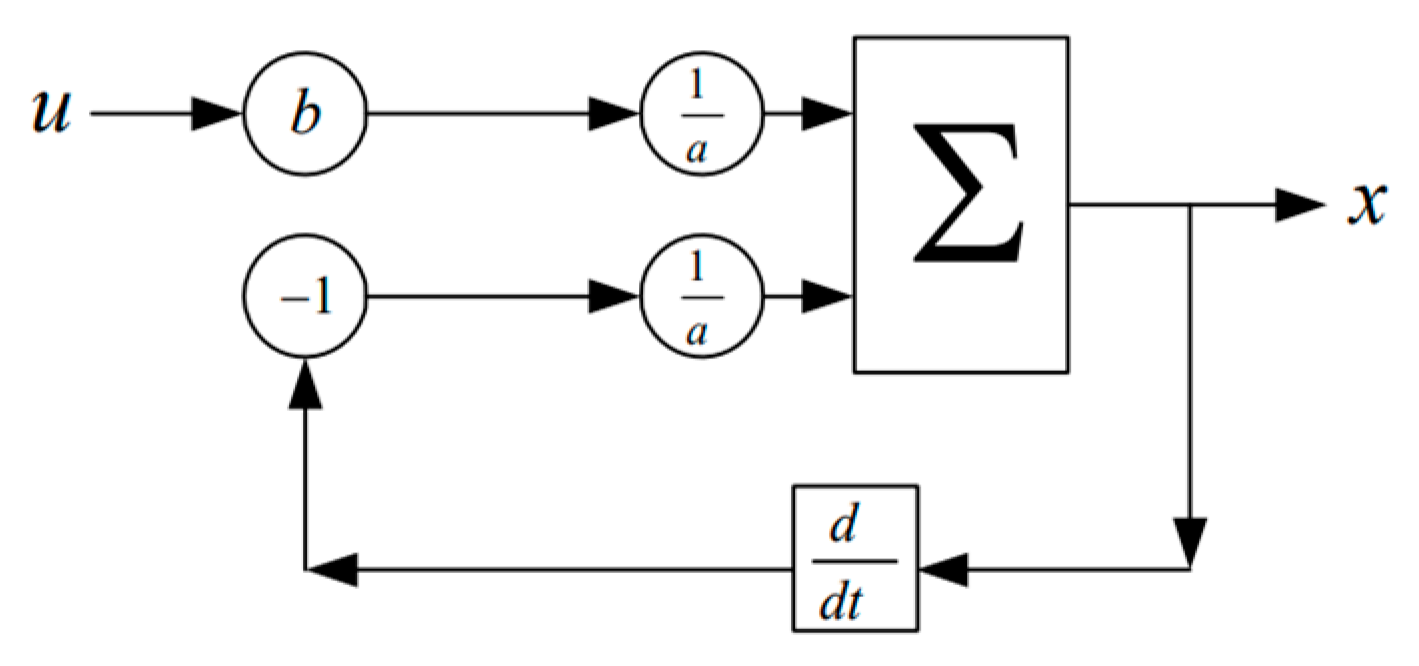
3. Results and Discussion
3.1. Annual Emission and Geographical Distribution
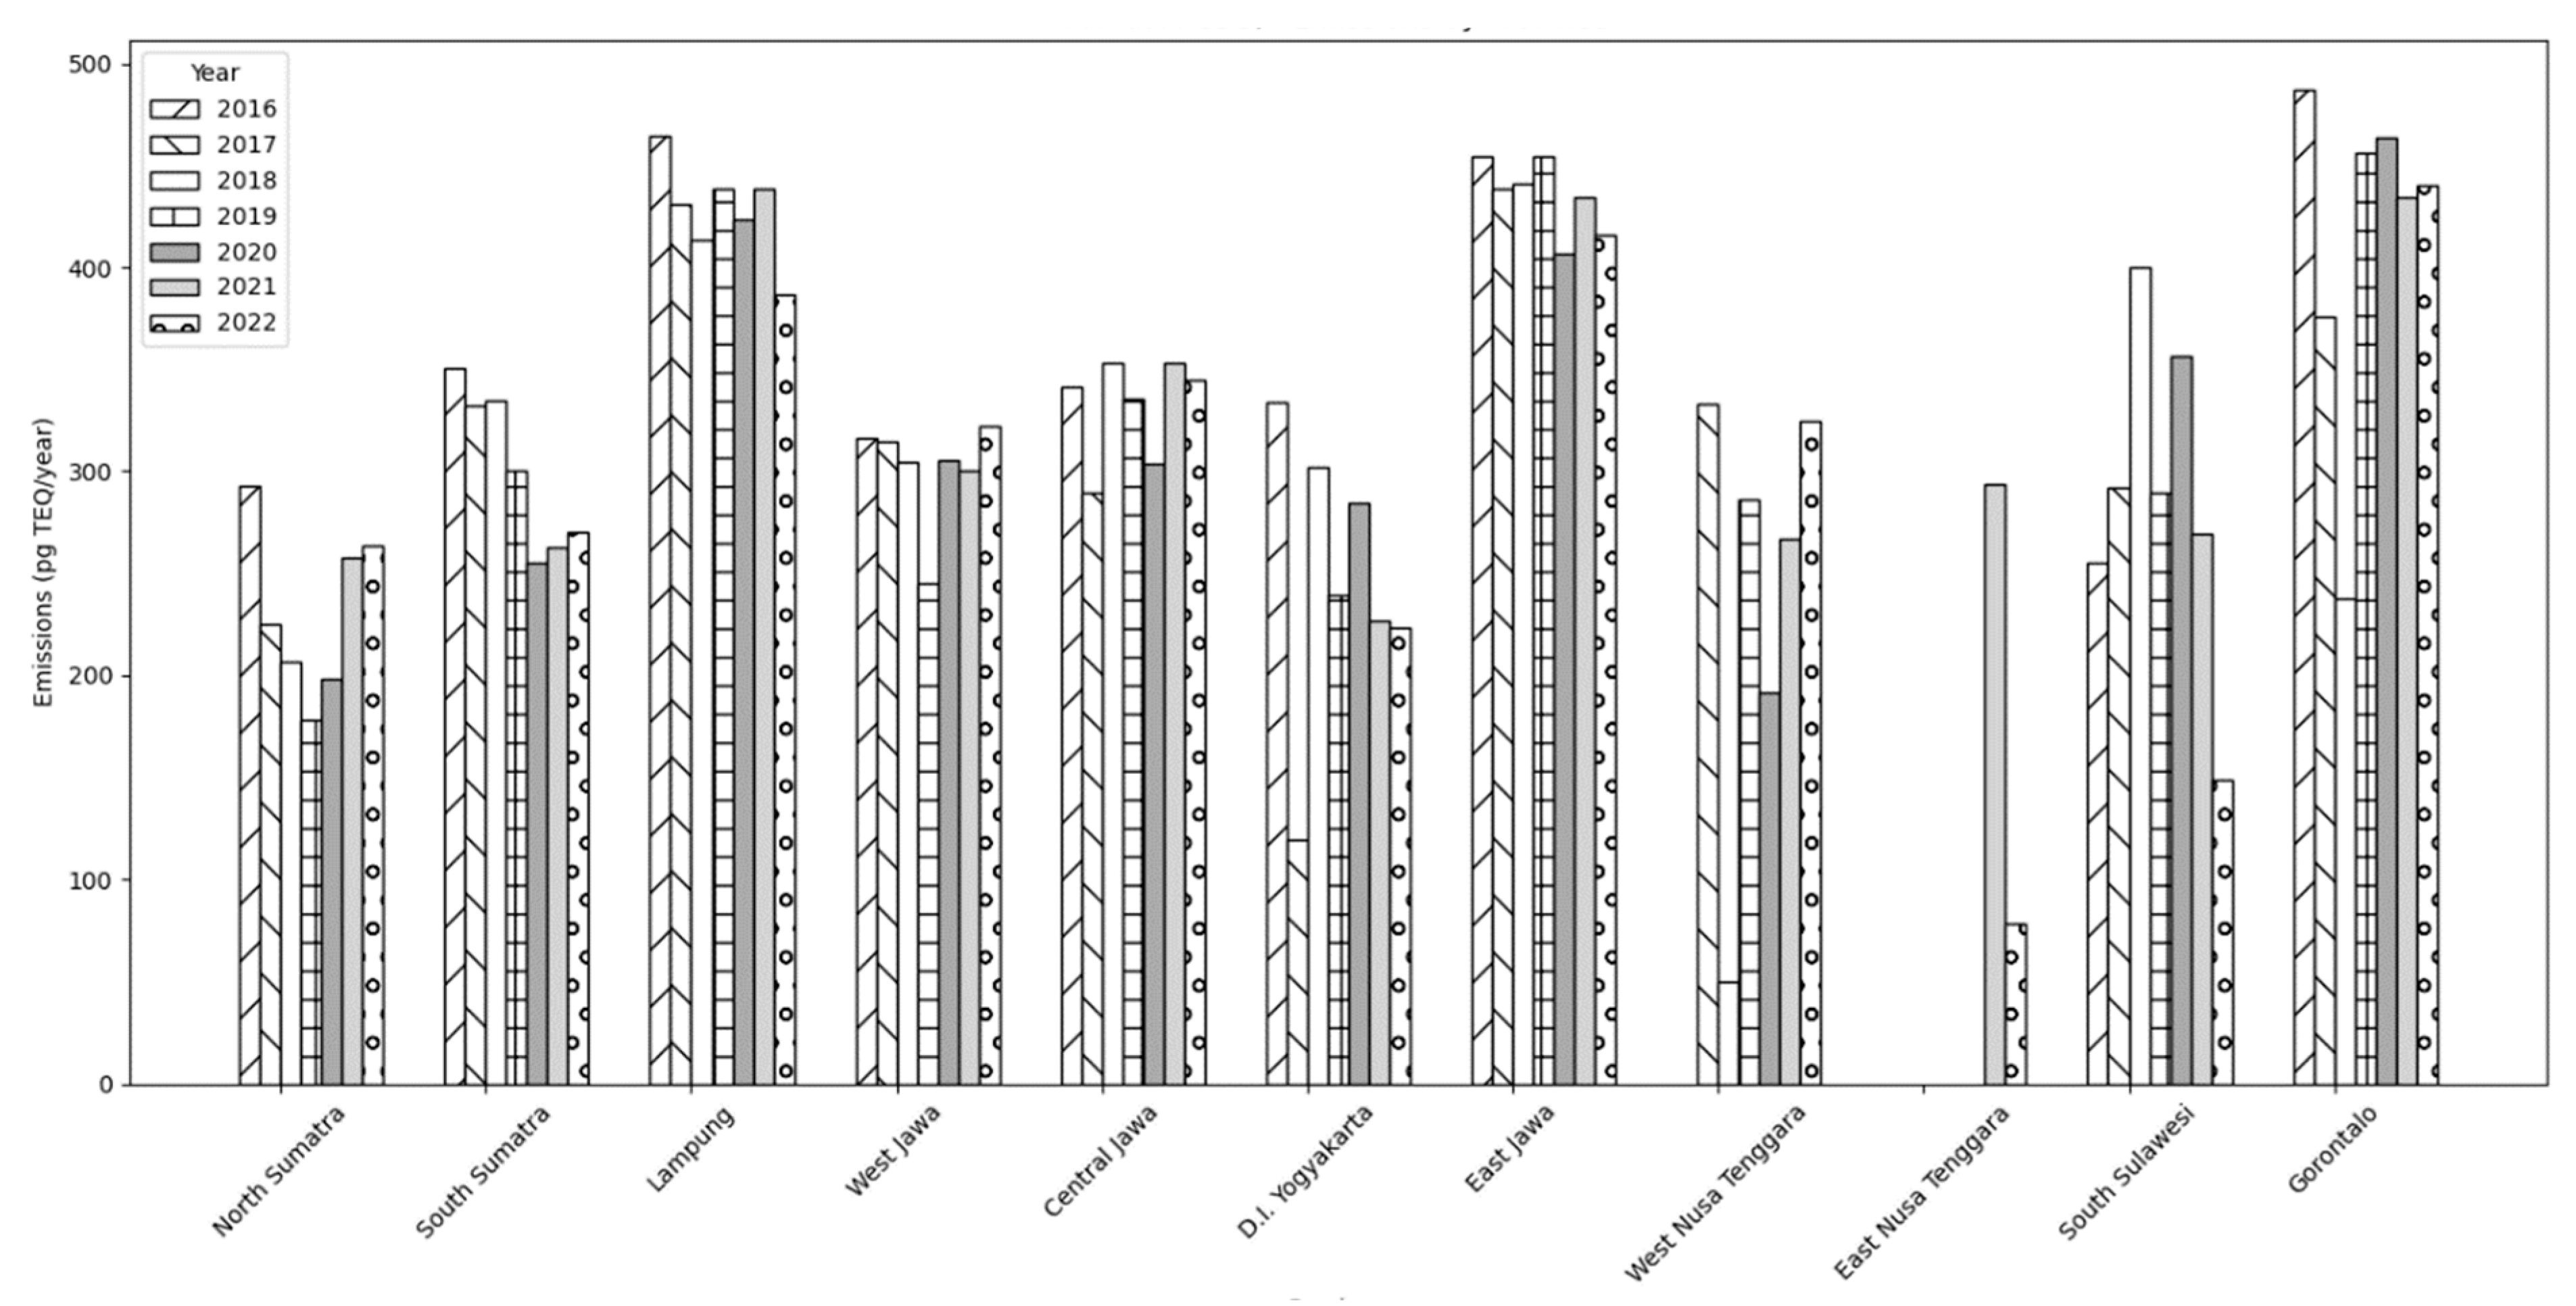
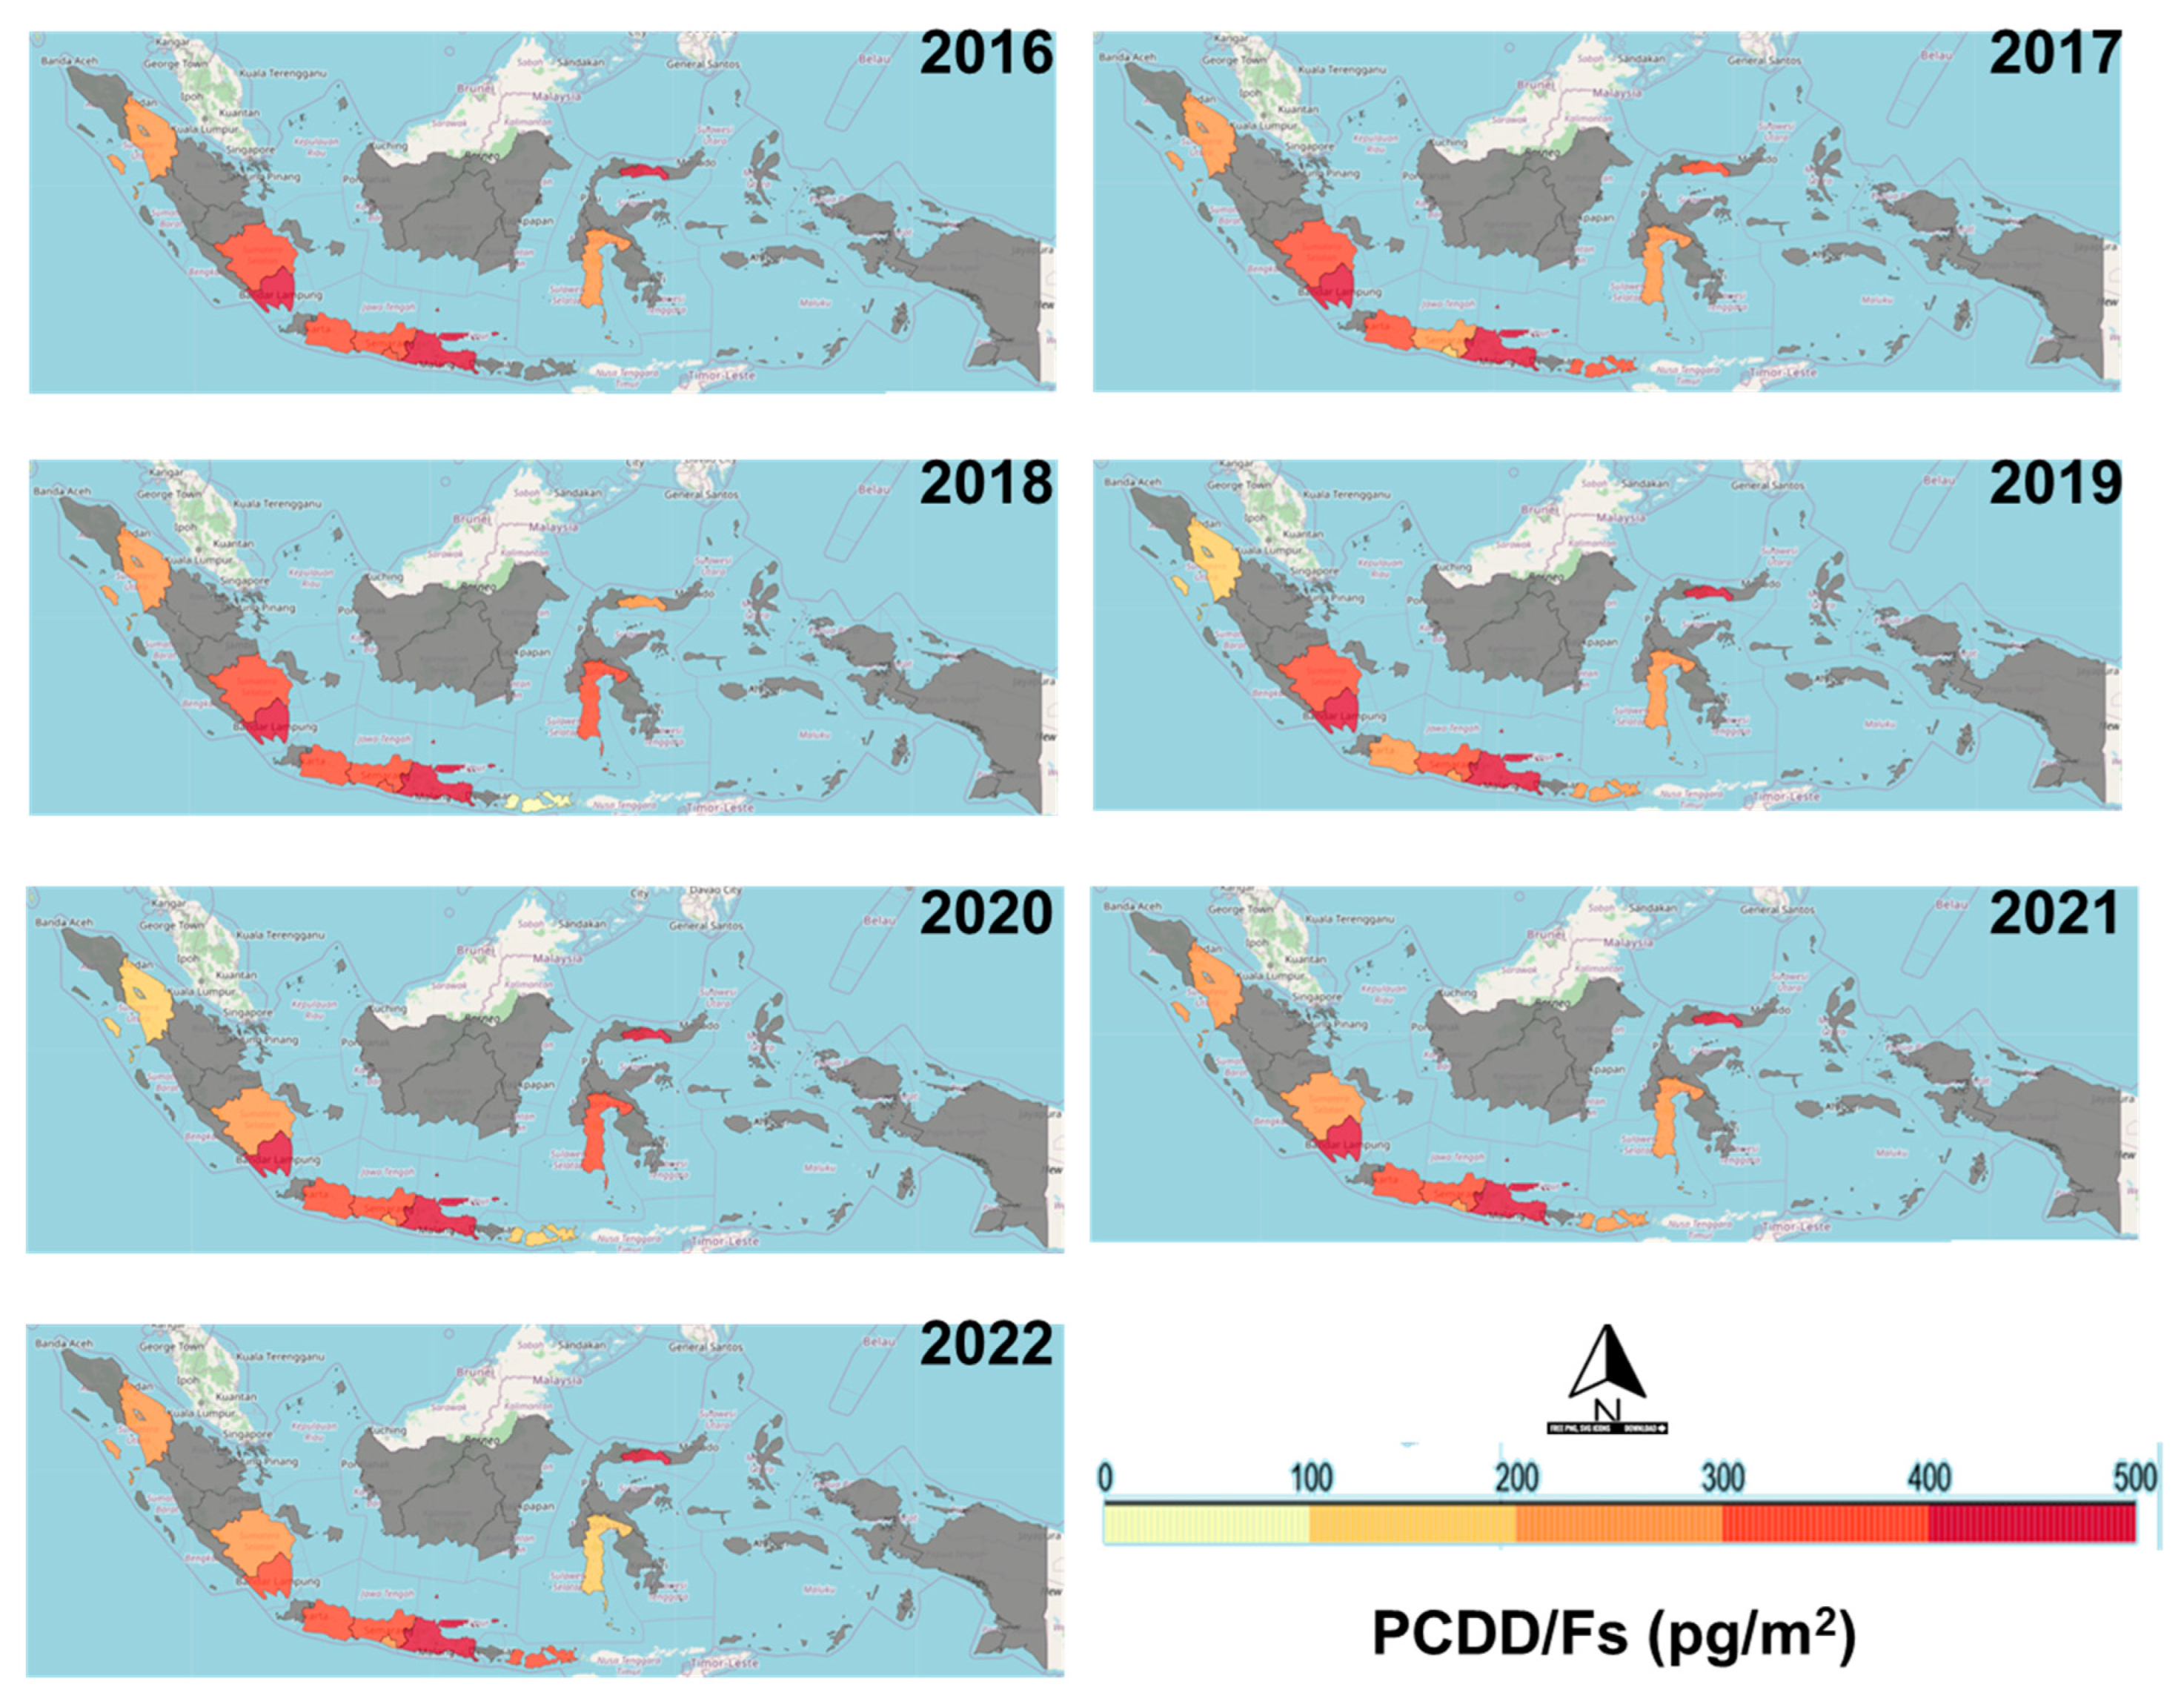
3.2. Uncertainty
3.3. Emission Prediction
| MAPE (%) | MAE | |
|---|---|---|
| North Sumatra | 36 | 95 |
| South Sumatra | 9 | 27 |
| Lampung | 6 | 26 |
| West Jawa | 18 | 58 |
| Central Jawa | 3 | 12 |
| D.I. Yogyakarta | 78 | 177 |
| East Jawa | 1.4 | 6 |
| West Nusa Tenggara | 42 | 140 |
| East Nusa Tenggara | 100 | 186 |
| South Sulawesi | 83 | 143 |
| Gorontalo | 29 | 129 |
4. Conclusions
Supplementary Information
References
- Directorate of Food Crops, H., and Estate Crops Statistics. Indonesia - Sugar cane production quantity. Available online: https://knoema.com/atlas/Indonesia/topics/Agriculture/Crops-Production-Quantity-tonnes/Sugar-cane-production (accessed on.
- Isele Silva de Aquino; and, a.C.d.C.M.; and, A.C.B.C.; and, D.A.O.K.; Moreira, A. Vegetative Waste Management on Sugarcane Yield and Industrial Quality. Communications in Soil Science and Plant Analysis 2019, 50, 132–140. [CrossRef]
- Souza, G.S.d.; and Souza, Z.M.d.; and Silva, R.B.d.; and Barbosa, R.S.; and Araújo, F.S. Effects of traffic control on the soil physical quality and the cultivation of sugarcane. Revista Brasileira De Ciência Do Solo 2014, 38, 135–146. [Google Scholar] [CrossRef]
- Riajaya, P.D.; and Djumali, D.; and Heliyanto, B. Yields of Promising Sugarcane Clones under Three Different Planting Arrangements. AGRIVITA Journal of Agricultural Science 2022, 44, 119–129. [Google Scholar] [CrossRef]
- Gupta, S.K.; Kohli, a.A.; Choudhury, a.S.R.; Dutta, a.S.; Pathak, a.S.K.; Sohane, a.R.K.; Sharma, a.R. Impact of Open Crop Residue Burning and Alternate Options for Mitigation: A Review. Current Journal of Applied Science and Technology 2019, 1–10. [Google Scholar] [CrossRef]
- Nowell, H.K.; Wirks, C.; Maria Val Martin, A.v.D. , Randall V. Martin, Christopher K. Uejio, Christopher D. Holmes. Impacts of Sugarcane Fires on Air Quality and Public Health in South Florida. Environmental Health Perspectives 2022, 130. [Google Scholar] [CrossRef] [PubMed]
- Rose Luiza Moraes Tavares; Kurt A. Spokas; Kate Hall; Edward C. Colosky; Zigomar Menezes de Souza; Scala, N.L. Sugarcane residue management impact soil greenhouse gas. Ciência E Agrotecnologia 2018, 42, 195–203. [CrossRef]
- Shikwambana, L.; Ncipha, X.; Sangeetha, S.; Sivakumar, V.; Mhangara, P. Qualitative study on the observations of emissions, transport, and the influence of climatic factors from sugarcane burning: a south african perspective. International Journal of Environmental Research and Public Health 2021, 18, 7672. [Google Scholar] [CrossRef] [PubMed]
- Gullett, B.K.; Touati, A.; Huwe, J.; Hakk, H. PCDD and PCDF emissions from simulated sugarcane field burning. Environmental Science and Technology 2006, 40, 6228–6234. [Google Scholar] [CrossRef] [PubMed]
- Meyer, C.; Beer, T.; Müller, J.; Gillett, R.; Weeks, I.; Powell, J.; Tolhurst, K.; McCaw, L.; Cook, G.; Marney; et al. Dioxin Emissions from Bushfires in Australia. National Dioxins Program Technical Report No. 1. Australian Government 2004.
- Zain, S.M.S.M.a.; Latif, M.T.a.; Baharudin, N.H.a.; Anual, Z.F.a.; Hanif, N.M.a.; Khan, F. Atmospheric pcdds/pcdfs levels and occurrences in southeast asia: a review. 2021, 783, 146929. [CrossRef]
- Oanh, N.T.K.; Permadia, D.A.; Philip K., Hopke; Kirk, R. Smith; Nguyen Phan Dong; Dang, A.N. Annual emissions of air toxics emitted from crop residue open burning in Southeast Asia over the period of 2010–2015. Atmospheric Environment 2018, 187, 163–173. [Google Scholar] [CrossRef]
- EPA., U.S. Update to An Inventory of Sources and Environmental Releases of Dioxin-Like Compounds in the United States for the Years 1987, 1995, and 2000 (2013, External Review Draft); U.S. Environmental Protection Agency: Washington, DC, 2013.
- Henri Dwyer, N.J.T. Inventory of U.S. 2012 dioxin emissions to atmosphere. Waste Management 2015, 46, 242–246. [Google Scholar] [CrossRef]
- H. Relvas; M. Lopes; Coutinho, N. Portuguese inventory of dioxins and furans atmospheric emissions. Chemosphere 2015, 93, 1569–1577. [CrossRef]
- Chen, P.; Gong, a.W.; Yu, a.G.; Fiedler, a.H. Preliminary release inventories of unintentionally generated dl-PCB and HCB from sources in China: Base year 2015. Chemosphere 2019, 219, 875–881. [Google Scholar] [CrossRef]
- Zhang, M.; Buekens, A.; Li, X. Dioxins from Biomass Combustion: An Overview. Waste and Biomass Valorization 2017, 8, 1–20. [Google Scholar] [CrossRef]
- Wilaiwan Sornpoon; Poonpipope Kasemsap; P. Prasertsak; Garivait, S. Estimation of emissions from sugarcane field burning in thailand using bottom-up country-specific activity data. Atmosphere 2014, 5, 669–685. [CrossRef]
- Pan, S.Y.; Liou, Y.T.; Chang, M.B.; al., e. Characteristics of PCDD/Fs in PM2.5 from emission stacks and the nearby ambient air in Taiwan. Sci Rep 2021, 8093. [CrossRef]
- Natalija Marinković; Daria Pašalić; Goran Ferenčak; Branka Gršković; Rukavina, A.S. Dioxins and Human Toxicity. Archives of Industrial Hygiene and Toxicology 2010, 61, 445–453. [CrossRef]
- Du, C.a.; Kulay, L.a.; Cavalett, O.; and Dias, L.C.; and Freire, F. Life cycle assessment addressing health effects of particulate matter of mechanical versus manual sugarcane harvesting in brazil. The International Journal of Life Cycle Assessment 2017, 23, 787–799. [Google Scholar] [CrossRef]
- Huang, X.; al, e.; ccccc; cccc. Applications of Grey Prediction Theory in Various Fields. Applied Sciences 2023, 14, 1219.
- Hsin, Y.-C.; Chen, Y.-L. Linear Properties and Applications of Grey Prediction Models. Journal of Grey System 2016, 28, 53–65. [Google Scholar]
- Li, X.; Zhang, H. Improved GM(1,1) Model Based on Simpson Formula and Its Applications. Journal of Grey System 2018, 31(4), 33–46. [Google Scholar]
- and, Y.Z.; Li, H. Research on Data Analysis Method Based on Multiple Linear Regression Model and Grey Model. In Proceedings of the 10th International Conference on Information Systems and Computing Technology (ISCTech), Guilin, China; 2022; pp. 324–327. [Google Scholar]
- Ming-Quan, L. Research on the Application of Grey Modeling Theory in the Prediction of Future Epidemic Trend of Infectious Diseases. European Journal of Preventive Medicine 2023. [Google Scholar] [CrossRef]
- Hamzaçebi, Ç.; Karakurt, İ. Forecasting the energy-related co2emissions of turkey using a grey prediction model. Energy Sources, Part A: Recovery, Utilization, and Environmental Effects 2015, 37, 1023–1031. [Google Scholar] [CrossRef]
- Dai, S.a.; Niu, D.a.; Han, Y. Forecasting of energy-related co2 emissions in china based on gm(1,1) and least squares support vector machine optimized by modified shuffled frog leaping algorithm for sustainability. Sustainability 2018, 10, 958. [Google Scholar] [CrossRef]
- Zhu, P.; Xie, W.a.; Shi, Y.a.; Pang, M.; and Shi, Y. Forecasting CO2 Emissions Using A Novel Conformable Fractional Order Discrete Grey Model. 2021. [CrossRef]
- Chang, C.a.; Li, G.a.; Zhang, S.a.; Yu, K. Employing a fuzzy-based grey modeling procedure to forecast china’s sulfur dioxide emissions. 2019, 16, 2504. [CrossRef]
- Black, R.R.; Meyer, C.P.; Touati, A.; Gullett, B.K.; F., H.; Mueller, J.F. Emissions of PCDD and PCDF from combustion of forest fuels and sugarcane: a comparison between field measurements and simulations in a laboratory burn facility. Chemosphere 2011, 83, 1331e1338. [Google Scholar] [CrossRef]
- UNEP. UNEP: Toolkit for Identification and Quantification of Releases of Dioxins, Furans and Other Unintentional POPs Under Article 5 of the Stockholm Convention. 2012.
- Directorate of Food Crops, H., and Estate Crops Statistics. Indonesian Sugar Cane Statistics 2016; 2016.
- (MoA), M.o.A. Tree Crop Estate Statistics Of Indonesia 2018-2020; Secretariate of Directorate General of Estates: 2019.
- Directorate of Food Crops, H., and Estate Crops Statistics. Indonesian Sugar Cane Statistics 2017; 2017.
- Directorate of Food Crops, H., and Estate Crops Statistics. Indonesian Sugar Cane Statistics 2021; 2021.
- Agriculture, U.D.o. Sugar Annual; 2022.
- Sulaiman, A.A.a.; Sulaeman, Y.a.; Mustikasari, N.a.; Nursyamsi, D.a.; Syakir, A.M. Increasing sugar production in indonesia through land suitability analysis and sugar mill restructuring. Land 2919, 8, 61. [Google Scholar] [CrossRef]
- Milojković; Jelena and Litovski; Vaneo. ANN versus Grey theory based forecasting methods implemented on short time series. In Proceedings of the 10th Symposium on Neural Network Applications in Electrical Engineering, 2010; pp. 117–122.
- Tan, X.a.X.; J. and Li; F. and Wu; M. and Chen; D. and Liang, Y. A new gm (1,1) model suitable for short-term prediction of satellite clock bias. IET Radar, Sonar &Amp; Navigation 2022, 16, 2040–2052. [CrossRef]
- Spaunhorst, D.J.; Orgeron, a.A.J.; White, a.P.M. Burning postharvest sugarcane residue for control of surface-deposited divine nightshade (Solanum nigrescens) and itchgrass (Rottboellia cochinchinensis) seed. Weed Technology 2019, 33, 693–700. [Google Scholar] [CrossRef]
- Shijie Song; Kaijie Chen; Tao Huang; Jianmin Ma; Jiaxin Wang; Xiaoxuan Mao; Hong Gao; Yuan Zhao; Zhou, Z. New emission inventory reveals termination of global dioxin declining trend. Journal of Hazardous Materials 2023, 443, 130357. [CrossRef]
- Wahyu K Sugandi; I Nengah Suastawa; Wiyono, J. The Sugar Cane Plantation Of Land Condition After Harvesting And Mechanics And Physical Characteristics. Journal of Agricultural Engineering 2018, 3, 133–140. [CrossRef]
- S. Bhuvaneshwari; and, H.H.; Meegoda, J.N. Crop Residue Burning in India: Policy Challenges and Potential Solutions. International Journal of Environmental Research and Public Health 2019, 16, 832. [CrossRef]
- Haider, M.Z. Benefit of rice residue burning in the field. International Journal of Agriculture, Environment and Biotechnology 2013, 6, 145–155. [Google Scholar]
- Yu, K.B.; and, a.K.M.H.; and, H.-S.K.; and, H.-M.Y.; and, M.-K.S.; Bae, M.-S. Estimation of Fuel Loadings of Domestic Agricultural Crop Residues to Determine the Air Pollutants Emissions. Journal of Korean Society for Atmospheric Environment 2022, 38, 451–469. [CrossRef]
- Sharifah Mazrah Sayed Mohamed Zain; Mohd Talib Latif; Nor Hafizah Baharudin; Zurahanim Fasha Anual; Norfazrin Mohd Hanif; Khan, M.F. Atmospheric PCDDs/PCDFs levels and occurrences in Southeast Asia: A review. Science of The Total Environment 2021, 783, 146929.
- Matthias, V.; Arndt, a.J.; a, a.A.A.; Bieser, n.J.; Quante, a.M. Modelling the Temporal and Spatial Allocation of Emission Data. Springer, Cham: 2018; pp. 193–198.
- Plejdrup, M.S.; Nielsen, a.O.-K.; Bruun, a.H.G. Influence of improved methodology and increased spatial resolution on gridded emissions. 2019, 2, 161–173.
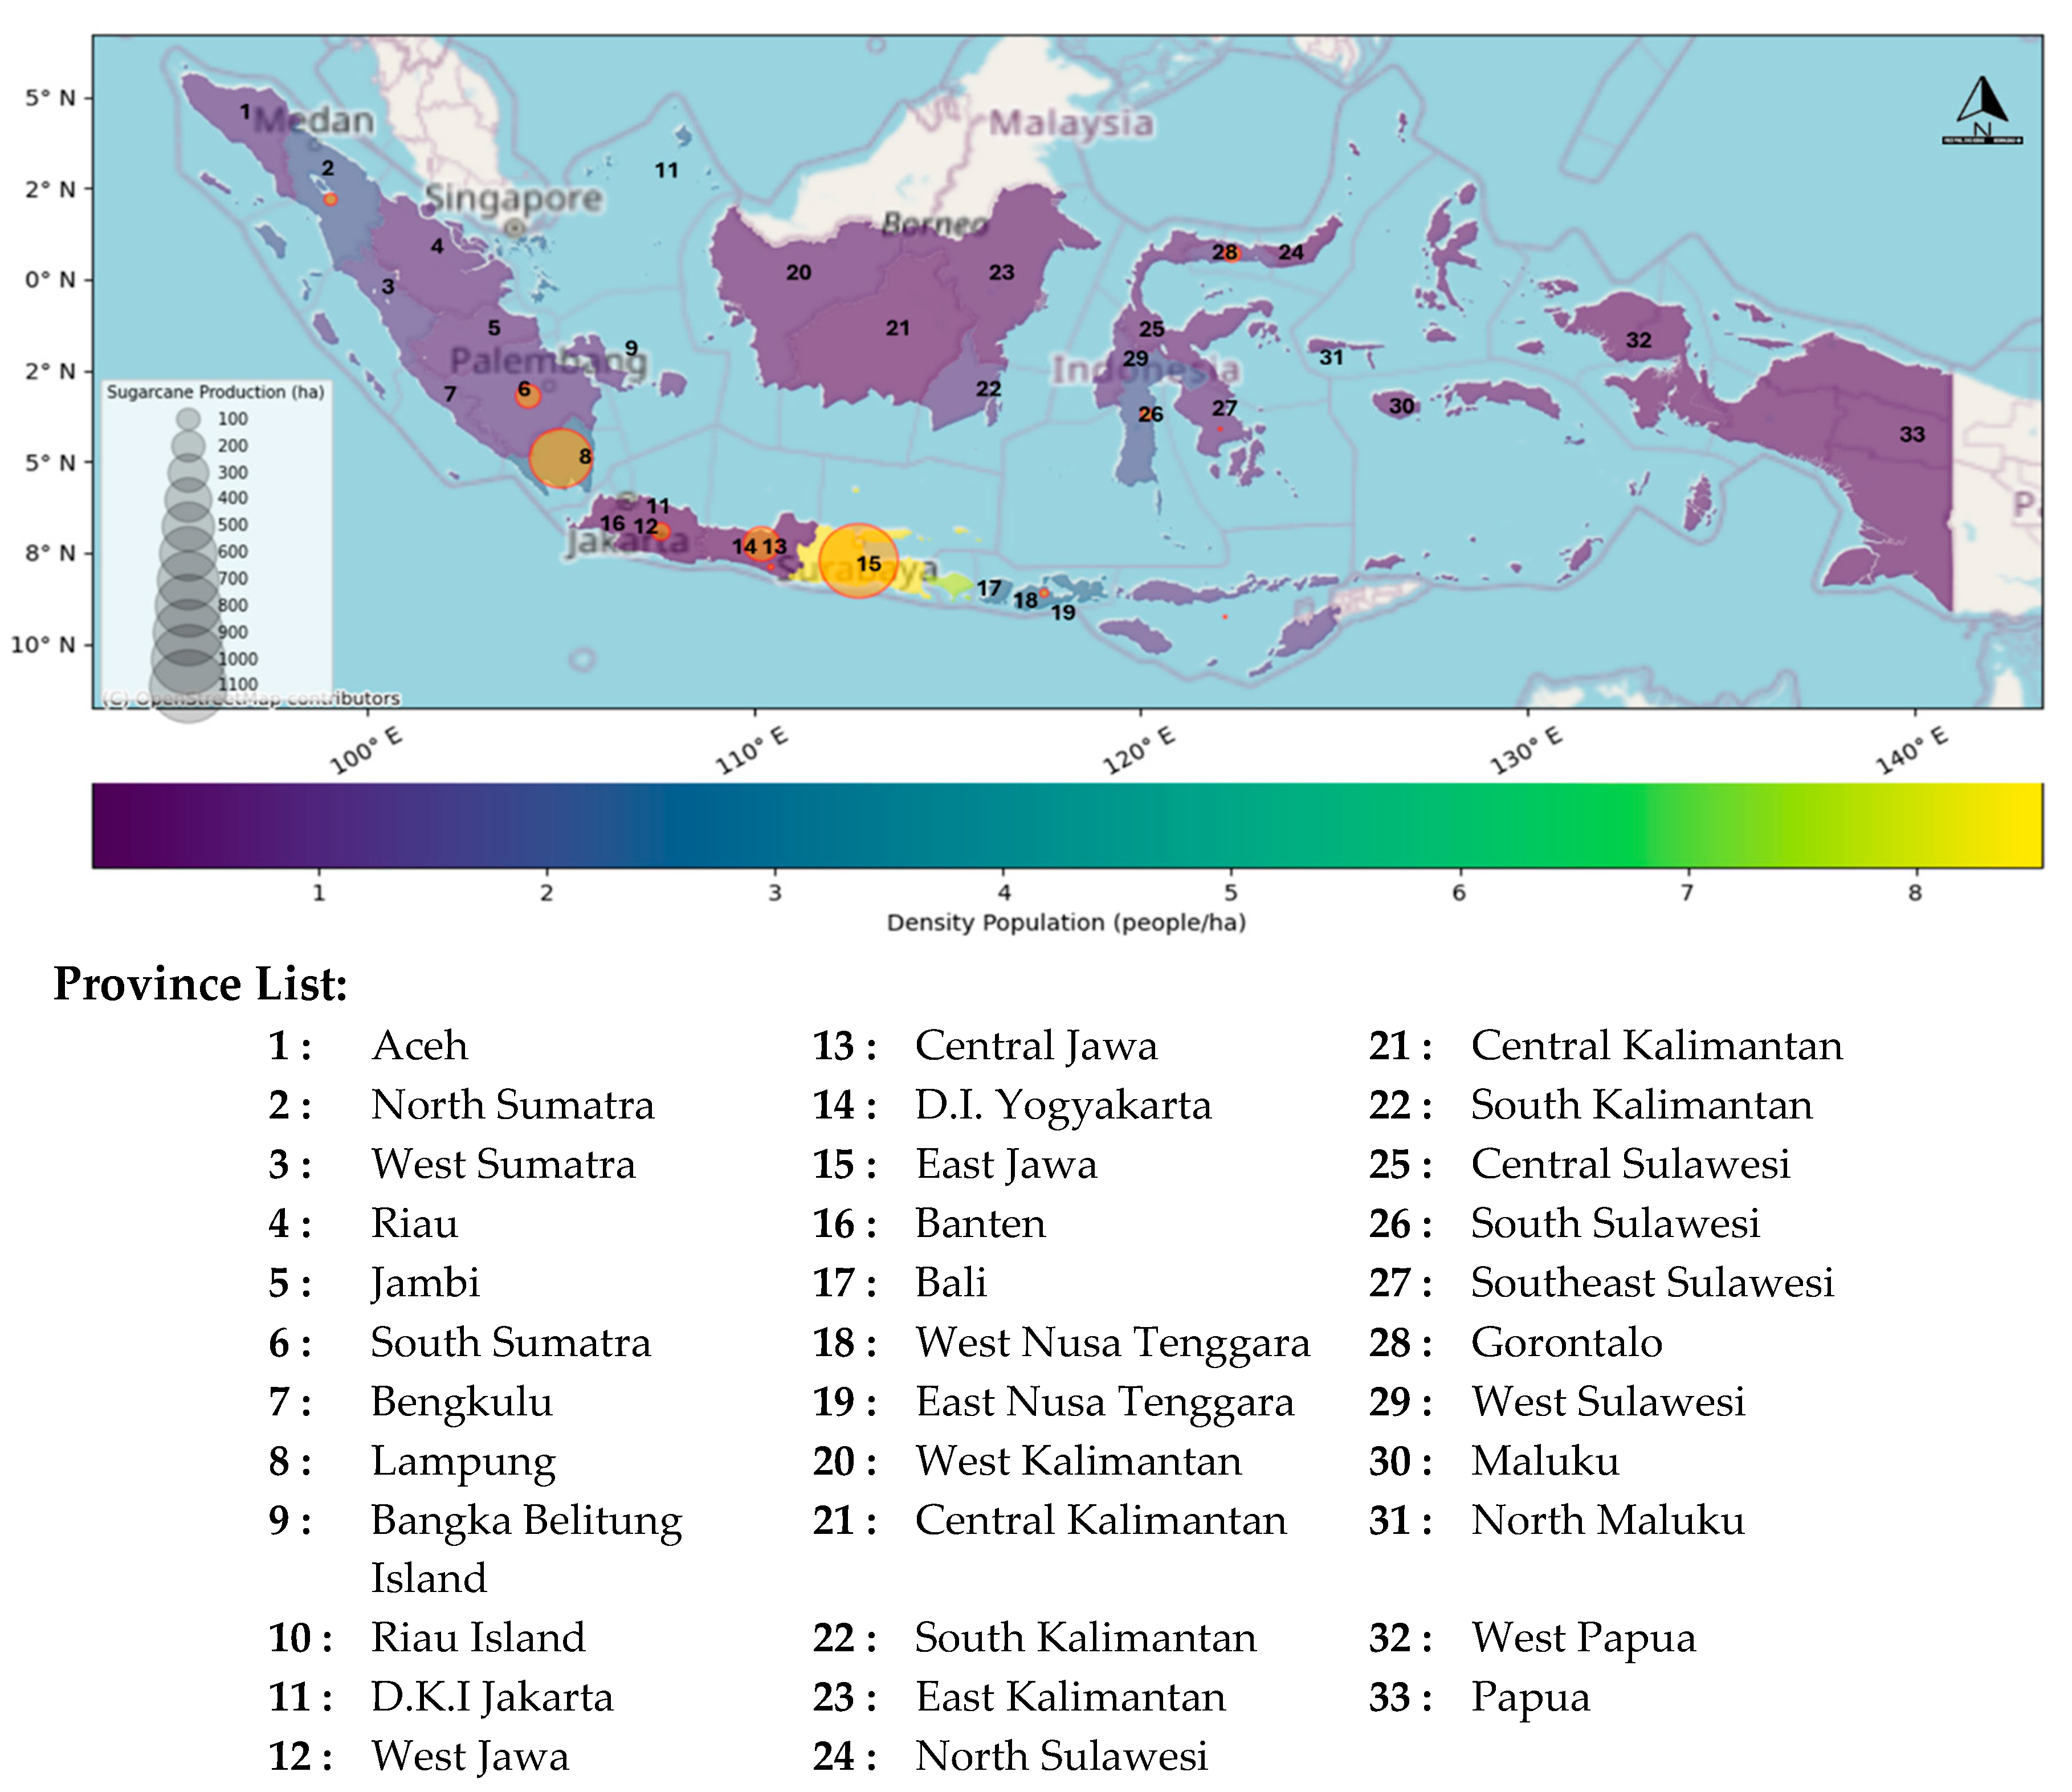
| Country | Exp approach | Mean EF ug TEQ/ (t fuel) | Range | stdv | Ref. |
|---|---|---|---|---|---|
| UNEP | Field | 4 | - | - | [32] |
| Sugarcane QLD, Australia | Field | 0.95 | 0.52-1.4 | - | [9] |
| Sugarcane QLD, Australia | Lab burn tunnel | 4.4 | 1.6-9.6 | 3.7 | [10] |
| Sugarcane HI, USA | Burn Facility | 126 | 98-148 | - | |
| Sugarcane FL, USA | Burn Facility | 6.9 | 4-9.8 | - | |
| Sugarcane standing FL, USA | Burn Facility | 2.3 | 1.6-4.4 | - | [9] |
| Sugarcane pile FL, USA | Burn Facility | 0.34 | - | - | |
| Sugarcane FL, USA | Field | 1.39 | 0.85–2.3 | 0.57 | [9,10] |
| Sugarcane FL, USA | Field | 1.9 | 0.96–2.8 | - | [9] |
| North Sumatra | South Sumatra | Lampung | West Jawa | East Jawa | D.I Yogyakarta | East Jawa | West Nusa Tenggara | East Nusa Tenggara | South Sulawesi | Gorontalo | |
|---|---|---|---|---|---|---|---|---|---|---|---|
| N (years) | 7 | 7 | 7 | 7 | 7 | 7 | 7 | 6 | 2 | 7 | 7 |
| mean | 232 | 301 | 428 | 301 | 331 | 247 | 435 | 242 | 187 | 287 | 414 |
| stDev | 41 | 39 | 24 | 26 | 25 | 70 | 18 | 107 | 153 | 80 | 85 |
| min | 178 | 255 | 387 | 245 | 290 | 120 | 407 | 50 | 78 | 149 | 237 |
| 25% | 202 | 266.5 | 418 | 302.5 | 319.5 | 225.5 | 425 | 210 | 132 | 262 | 405 |
| 50% | 225 | 301 | 431 | 305 | 341 | 239 | 439 | 276.5 | 186 | 289 | 441 |
| 75% | 261 | 333 | 438 | 316 | 349 | 294 | 448 | 315 | 240 | 325 | 460 |
| max | 293 | 351 | 464 | 322 | 353 | 334 | 455 | 333 | 294 | 400 | 487 |
|
Year |
UNEP | USA | Australia |
|---|---|---|---|
| (4µg TEQ/t material burned) | (1.39µg TEQ/t fuel) | (0.95µg TEQ/t fuel) | |
| 2016 | 5311 | 1883 | 1644 |
| 2017 | 4836 | 1095 | 749 |
| 2018 | 5010 | 1057 | 723 |
| 2019 | 4955 | 1686 | 1152 |
| 2020 | 5018 | 1108 | 757 |
| 2021 | 4998 | 1229 | 840 |
| 2022 | 4838 | 1119 | 765 |
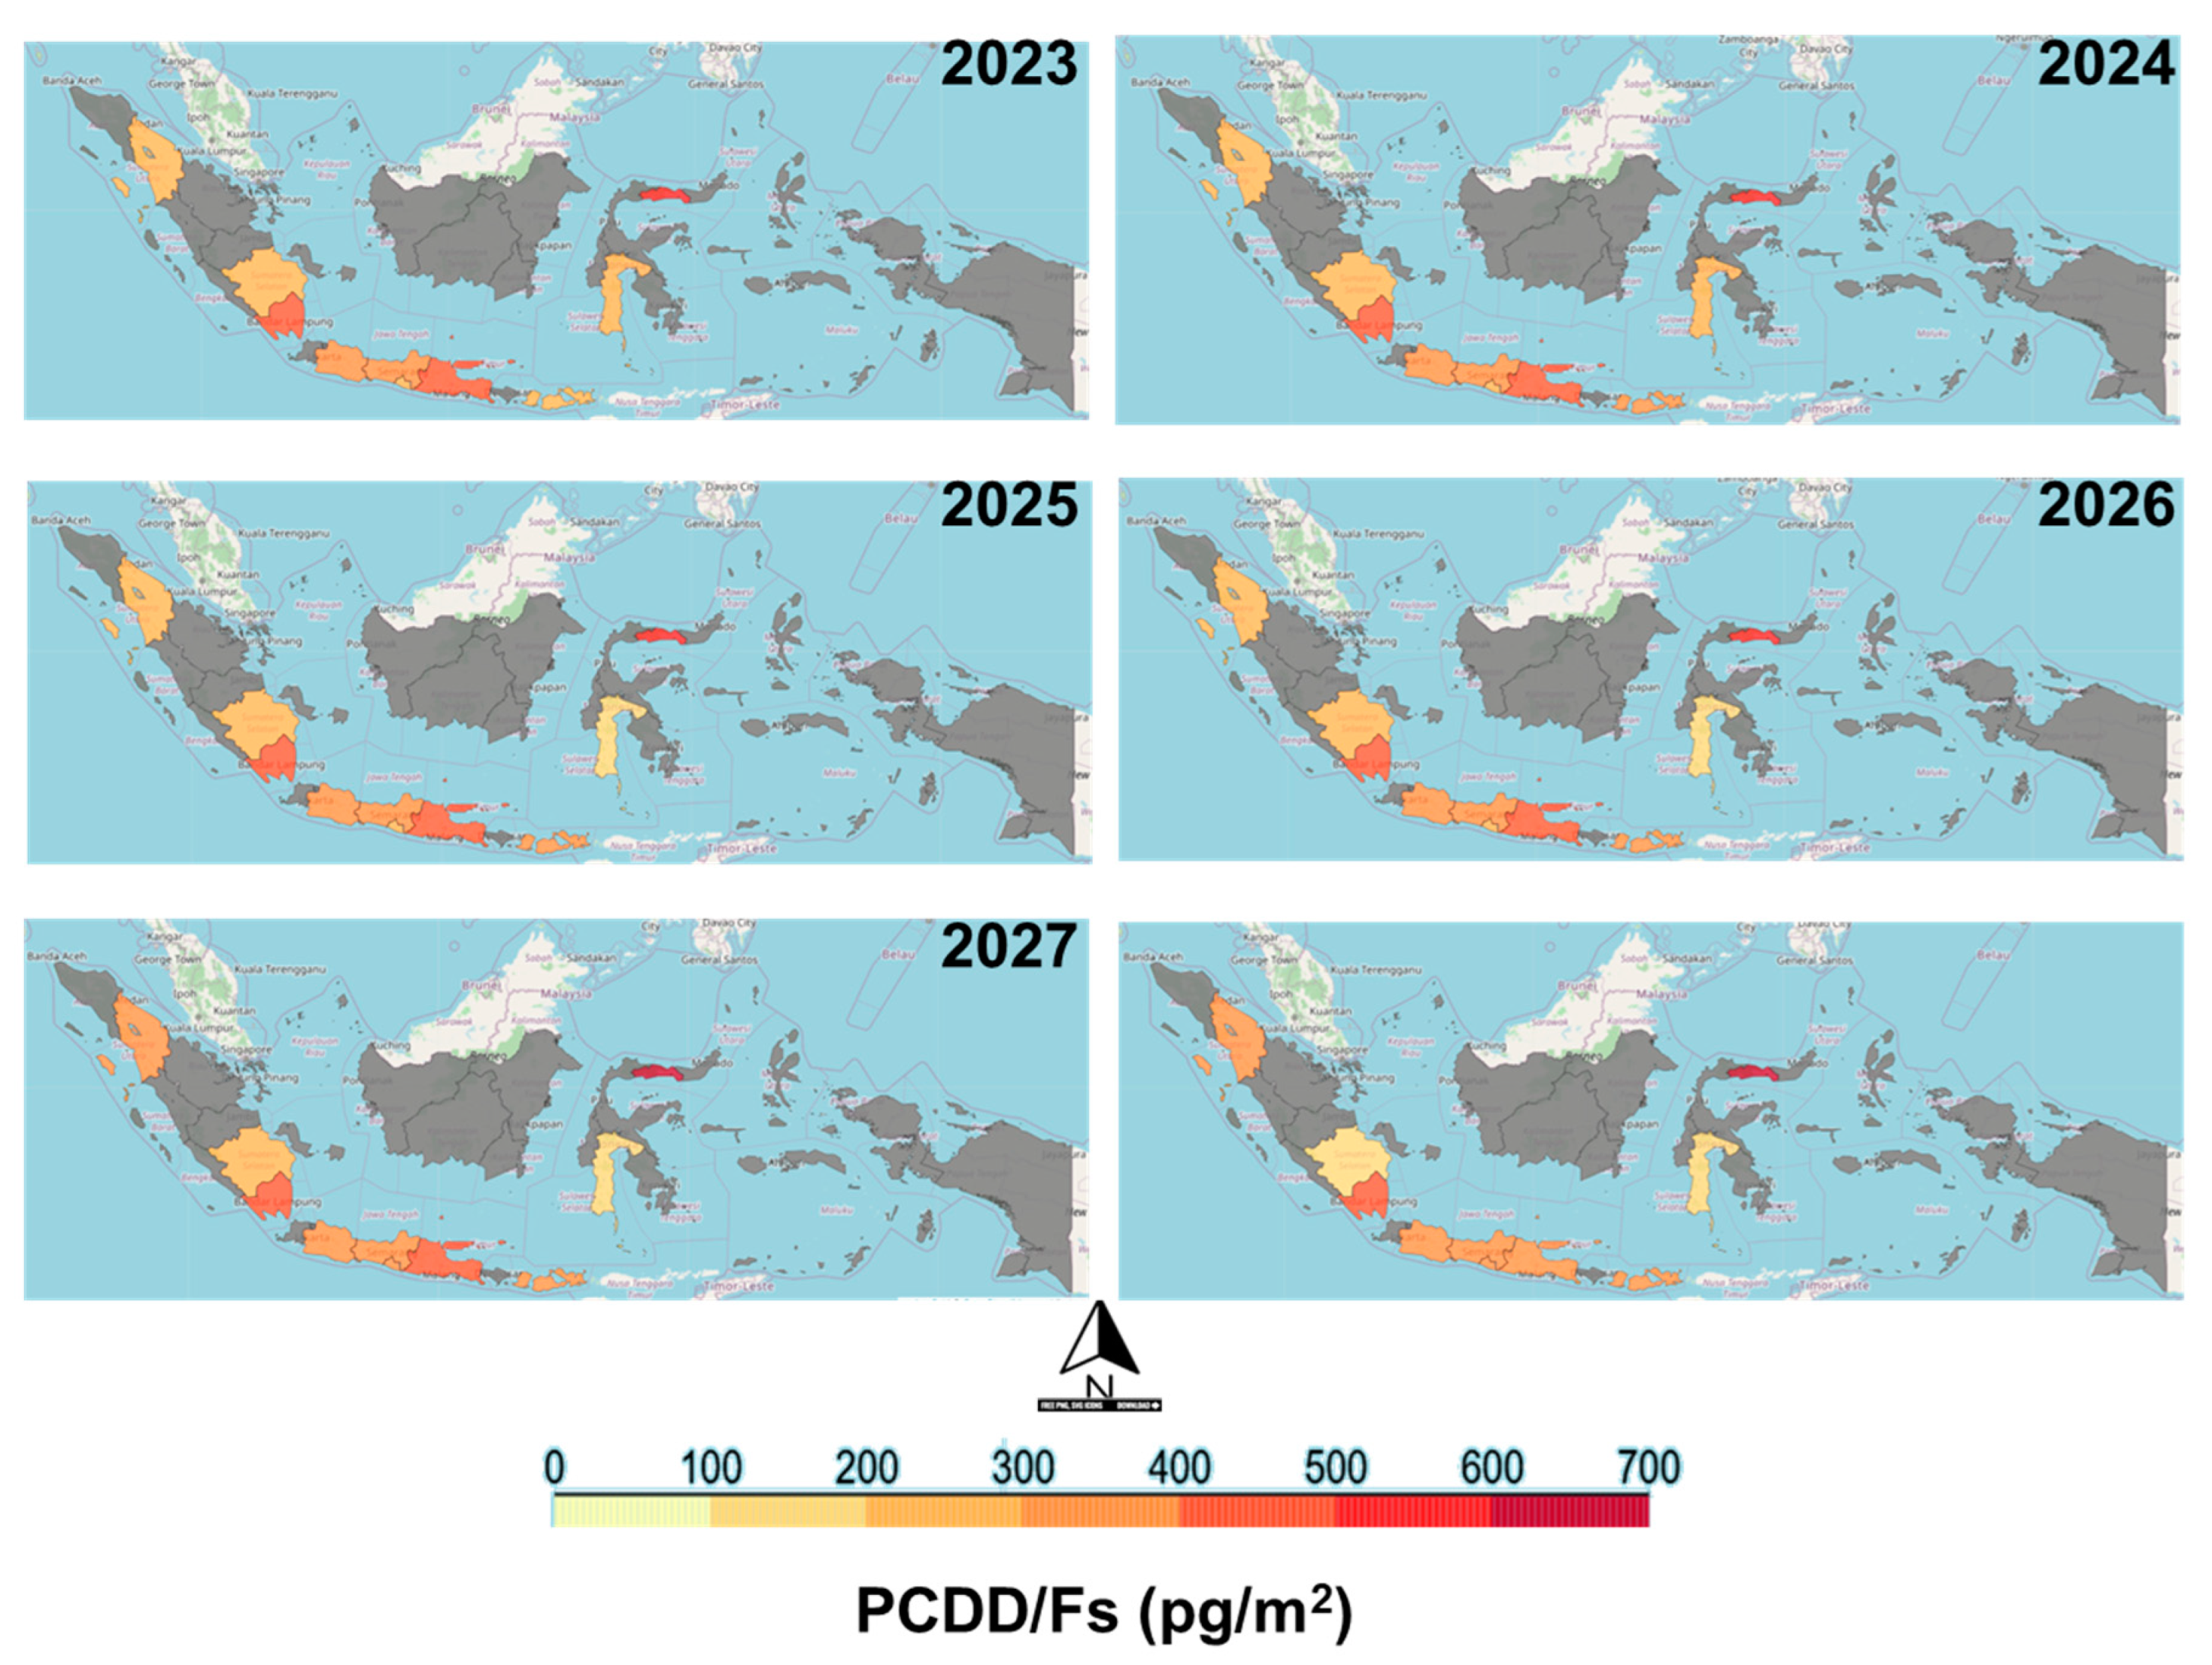
| 2023 | 2024 | 2025 | 2026 | 2027 | 2028 | |
|---|---|---|---|---|---|---|
| North Sumatra | 260 | 271 | 282 | 293 | 305 | 317 |
| South Sumatra | 242 | 232 | 222 | 213 | 204 | 195 |
| Lampung | 413 | 411 | 409 | 407 | 405 | 402 |
| West Jawa | 306 | 308 | 310 | 312 | 314 | 316 |
| Central Jawa | 351 | 356 | 362 | 367 | 372 | 378 |
| D.I. Yogyakarta | 270 | 279 | 288 | 298 | 307 | 318 |
| East Jawa | 416 | 412 | 408 | 405 | 401 | 397 |
| West Nusa Tenggara | 296 | 311 | 327 | 344 | 362 | 381 |
| East Nusa Tenggara | 180 | 178 | 176 | 174 | 172 | 170 |
| South Sulawesi | 216 | 201 | 187 | 173 | 161 | 150 |
| Gorontalo | 505 | 534 | 564 | 595 | 629 | 664 |
Disclaimer/Publisher’s Note: The statements, opinions and data contained in all publications are solely those of the individual author(s) and contributor(s) and not of MDPI and/or the editor(s). MDPI and/or the editor(s) disclaim responsibility for any injury to people or property resulting from any ideas, methods, instructions or products referred to in the content. |
© 2024 by the authors. Licensee MDPI, Basel, Switzerland. This article is an open access article distributed under the terms and conditions of the Creative Commons Attribution (CC BY) license (http://creativecommons.org/licenses/by/4.0/).


