Preprint
Article

Understanding Customer Satisfaction Based on Experience with Subscription Video on Demand (SVoD)

Altmetrics

Downloads

172

Views

113

Comments

0

Submitted:

02 August 2024

Posted:

02 August 2024

You are already at the latest version

Alerts
Abstract
This research aimed to discover how to create a customer experience that includes FEEL, SENSE, THINK, ACT, and RELATE to increase satisfaction with the Subscription Video on Demand (SVoD) application. A descriptive quantitative method was used, and the sample was 423 respondents in Indonesia who had used the application for at least 1 month. Furthermore, this research used probability sampling using a technique for random sampling. Based on the data available, experience accounted for 0.509, or 50.9%, of the application satisfaction. With a beta value of 0.295, the FEEL variable was the only one in this study to significantly and positively affect customer satisfaction; the other variables, SENSE, THINK, ACT, and RELATE, had no discernible effects. It is anticipated that the theoretical foundation provided by this research will be beneficial to the entertainment industry, particularly the SVoD application sector. This includes the product and service development division that focuses on customer inner feelings and emotions.
Keywords: 
Subject: Business, Economics and Management  -   Marketing

1. Introduction

Subscription Video on Demand (SVoD) has changed viewing habits from waiting for broadcast schedule of a program on television to freely controlled schedule [1]. Therefore, different subscription-based services offer a choice of interesting titles based on customer preferences, and individuals no longer need to wait for a television show. Viewers prefer to control what is watched at the end of work to relax and relieve boredom, with viewing sessions lasting an average of 2 hours and 10 minutes [2]. The ease and flexibility of accessing online films facilitate individuals to use digital platforms [3]. In this context, viewing habits in Southeast Asia are shifting from watching antenna television to online. The number of active SVoD customer cumulatively reached 24.2 million in 2022, which facilitated entrepreneurs to start the business. Currently, various applications are actively used, such as Disney+, Viu, AIS Play, Netflix, Vidio, WeTV, Vision+, IQIYI, and others [4].
The development of various SVoD applications and changes in viewing behavior cannot be separated from the cultural alterations that occurred after the pandemic, when most companies experienced crisis. Additionally, businesses that improved their agility and flexibility through the use of digital technologies were resilient in moments of crisis. [5]. Customer expectations and behavior have gone through a fundamental shift due to digital revolution and innovative business models. [6]. Therefore, customer behavior in digital transformation has become more active, as evidenced by the quicker online purchasing decisions. This behavior is based on increased awareness and experience in the age of technological revolution [7].
The increasing focus on customer experience promotes companies to enhance business by leveraging technological advancements like the Internet of Things and cellular technology [8]. Moreover, the rise of digital technology in the SVoD application can be observed from improvement in the quality of service provided by each application. Companies compete to be the best, reaching a point where customer feel satisfied with the services provided [9]. Considering this perspective, Customer satisfaction positively affects the emotional connection that companies have with their customers., which leads to cooperation between the two parties [10]. Furthermore, SVoD satisfaction can integrate customer into companies. Receiving preferential treatment from companies will affect customer trust, promote repurchases, as well as facilitate information spread by word of mouth [11]. The customer tends to share best experiences in using the application.
SVoD application is a rapidly growing multi-site market [12], and causes traditional pay TV to fall behind. Also, the entry of multinational SVoD applications into the local market has caused the decline of traditional pay TV [13]. In this case, intense competition occurred in SVoD services globally between local and multinational products. Each product competes by upgrading to become better [1]. This also occurs in Mexico and Australia, where existing local applications face competitions from international ones [14]. This happened because individuals interest in watching continues to increase. A large jump can be seen in the number of box office films often watched in the SVoD application compared to the cinemas. Allocating films to SVoD led to a 192% increase in the number of viewings [15]. The experience of watching and determining the right SVoD application that can satisfy customer is still unknown.
Customer experience in a business applies five aspects, namely SENSE, FEEL, THINK, ACT, and RELATE. Through these aspects, products can be created to suit customer desires [16]. Therefore, this research analyzed customer experience using SVoD, which was measured in terms of effect on satisfaction. In addition to measuring effect, factor analysis was carried out to find the most dominant ones, and analysis of SVoD customer characteristics was also carried out. The results served as indicators for improving the quality of SVoD applications in the future.

2. Literatur Review

Customer Experience Subscription Video on Demand (Svod)

SVoD is a type of service that allows customer to access an entire video library with the convenience and flexibility of viewing using a personal computer, tablet, or smartphone. Some prefer this option because of unlimited viewing as long as the subscription remains active. For the entertainment industry, this is a proven model to generate consistent income from each customer [17]. Therefore, to improve the SVoD experience, companies need to facilitate business improvements. This encompasses the rise in technological advancements in the digital space, including blockchain, Internet of Things, mobile, cloud computing, and artificial intelligence. [8]. In this context, the developing technology can create interactive communication between customer and the portable devices used, It has the power to change the experience landscape and develop into a brand-new kind of hybrid encounter. [18]. Consumer experience is viewed as an interactive, holistic process that is mediated by surrounding factors and aided by cognitive and emotional cues, creating memorable experiences that can be either pleasant or unpleasant. [19]. This showed that experience is an important factor in a business.
Gender information is significant in customer experience, and the findings have substantial management implications for how to create exceptional experiences using mobile applications as a medium for service delivery. [20]. Therefore, the impact of experience on behavioral intentions increases as customer ages [21]. Based on these aspects, respondent characteristics also need to be considered when analyzing experience.
Several ways to provide experience will lead to higher satisfaction. This has the effect of producing a mutually beneficial exchange of value between the seller and the customer [22]. Meanwhile, in order to generate contentment, value, loyalty, distinction, and competitive advantage, experience must be taken into account and managed as a strategic process. [19]. Satisfaction at low-cost hotels is greatly enhanced by the guest experience. [23]. Companies should also realize the crucial role of satisfaction, by designing policies that increase the ability and motivation of front-line employees to provide a satisfying experience [24]. In light of this, it is recommended that banks and mobile application developers create plans to enhance customer satisfaction, perceived value, and experience. [25].
The five components of customer experience that make up the travel agency industry are FEEL, SENSE, THINK, ACT, and RELATE. Only the THINK and FEEL elements, however, can be demonstrated to be crucial elements that improve the quality of relationships with clients. [26]. Apart from the travel agency sector, the five aspects of customer experience are used in the food service industry to increase value, the quality of the food, and the intention to revisit [27]. In the meantime, the hotel service sector came to the conclusion that the five elements of FEEL, SENSE, THINK, ACT, and RELATE can be used to demonstrate the connection between environmental sustainability and customer experience. [28]. The length of time guests spend at the theme park, the quantity of times they have visited, and the FEEL experience are the main drivers for customer to revisit the destination [29]. In addition, various business sectors, including travel agencies, food services, and hotels apply the five aspects of customer experience to meet customer needs.
SENSE (sensitive customer experience)
SENSE marketing focuses on creating experiences for humans through sight, sound, touch, taste, and smell. In this context, it can be used to add value and motivate customer to use the product. Based on this understanding, marketing is more focused on the sensory effect on humans [30]. To give a sensory experience, this interesting stimuli through the five senses of the customer, including visual such as attractive sight and a sense of security for SVoD viewers.
The appearance of an online shopping application that attracts potential customer can be among the factors driving online satisfaction [31]. Apart from an attractive design on applications and the web, there are other aspects that companies managements need to prioritize to increase satisfaction and loyalty, such as providing information that is easy to understand and follows a format, as well as a sense of security to complete transactions [32]. Based on this theory, the following hypothesis was proposed:
H1: SENSE has a positive and significant effect on customer satisfaction in the SVoD application.
FEEL (effective customer experience)
A mildly positive mood associated with the brand (a non-complex, non-perishable the store brand, service, or industrial good) to intense feelings of happiness and satisfaction (customer durables, technology, or social marketing campaigns) are all examples of how clients' inner feelings and emotions are appealed to through FEEL marketing to create an effective experience. Since most connection happens during consumption, traditional emotional advertising frequently fails to target feelings at the time of consumption. Effective FEEL marketing necessitates a deep comprehension of the factors that elicit particular emotions in addition to the customer's readiness to exercise empathy and perspective-taking. (Schmitt, 1999). In this regard, a factor that can attract inner emotions from customer is the speed of service and better transaction costs, which can provide positive effects on the mood.
In general, when companies improve the quality and speed of service, it can create satisfaction and also have a direct effect on customer loyalty [33]. However, to further increase customer satisfaction, besides improving service quality, companies also need to pay attention to credibility, usability, and better transaction costs [34]. Consequently, the subsequent conjecture was put forth:
H2: FEEL has a positive and significant effect on customer satisfaction in the SVoD application.
THINK (creative/cognitive customer experience)
In order to stimulate customers' creativity hrough encounters with cognition and problem-solving, THINK marketing makes intelligent appeals. Furthermore, it uses provocation, surprise, and intrigue to pique customers' interest in both divergent and convergent thinking. Although the promotion is mainly focused on high-tech products, a general THINK campaign was employed for new technology products. THINK marketing has also been applied in numerous other areas, including as communications, retail, and product design. [30]. It is about the value of intellectual experiences that appeal to the intellect. Moreover, aspects included in this marketing are bundle package offers, package prices, customer service, customer needs, responsiveness, and quality of information that can provide cognitive experiences and problem-solving according to customer needs.
Offering bundle packages within the products offered can create greater possibilities for satisfaction and good behavioral intentions from customer [35]. Apart from the product, promotion, place, the price of the package also need to be considered to positively affect aspects of satisfaction among customer [36]. Customer service, tracking, returns, and delivery are no less important in the online shopping environment to satisfy and attract customer [37]. Consequently, service providers ought to understand customer needs and expectations to ensure satisfaction [38]. Customer satisfaction will increase when staff members respond more quickly and speak in plainer terms [39]. Information quality also needs to be considered because it can predict source credibility, customer satisfaction, and the quality of a website/application [40]. This explanation led to the proposition of the following theory:
H3: THINK has a positive and significant effect on customer satisfaction in the SVoD application.
ACT (physical customer experience)
The goal of ACT marketing is to influence interactions, lifestyles, and physical experiences. Through improving tangible experiences, demonstrating alternate methods of operation (in business-to-business and industrial markets), alternative lifestyles, and interactions, marketing enhances lives. ACT's analytical and logical approach to behavior modification is frequently enlivened by role models, such as well-known actors or sports figures, and is motivating, inspirational, and impulsive. [30]. In this context, aspects of customer experience, such as obtaining interesting information through social media promotions, attractive discount offers, and better customer knowledge are part of this marketing [41]. Apart from good knowledge management, customer satisfaction can also be increased through discount offers, ordering convenience, product quality, and availability of reviews [42]. Furthermore, the availability of online reviews shows the importance of companies in encouraging social media marketing. Brand loyalty can be impacted by social media through the medium of consumer satisfaction. [43]. The marketing provides new experiences to customer. In addition, there are two kinds of experiences, namely cognitive and affective. Out of the two experiences, the affective experience has a higher effect on satisfaction [44]. The hypothesis was then proposed as follows:
H4: ACT has a positive and significant effect on customer satisfaction in the SVoD application.
RELATE (social identity customer experience)
SENSE, FEEL, THINK, and ACT marketing components are all included in RELATE marketing. But it goes beyond emotions, enhancing the "individual experience" and fostering relationships with one's ideal self, other people, or culture. [30]. RELATE is the relative experiential values of interest of the self-realizing individual. Moreover, aspects of long-term partnerships with SVoD applications, special treatment received during subscription, and consistent service come into this marketing aspect.
Companies that combine product and service innovation, offer a range of value-added product and service offers, and establish tight, long-term partnerships can make a greater effort to improve consumer perceptions such as loyalty and satisfaction. [45]. To create better partnerships with customer, special treatment is needed. True brand loyalty is influenced by the benefits of exceptional treatment, trust, and brand legitimacy through customer satisfaction. [46]. In order to maintain satisfaction, it was necessary to implement consistent service, which only requires a small increase in operational costs for companies [47]. These results led to the following hypothesis to be made:
H5: RELATE has a positive and significant effect on customer satisfaction in the SVoD application.

3. Research Methods

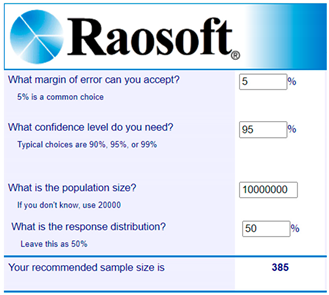
One of the selection criteria's was being an SVoD customer. Raosoft was utilized in this study's sample size calculator to calculate the population size, with a minimum of 385 respondents being advised.Preprints 114119 i001
This was a quantitative research that used a field survey method, and the questionnaire was adopted and adapted from previous surveys. The following are the data and discussion of previous research:
Table 3.1. Previous research.
Author Title Research Method Result
Se Ran Yoo, Suk Won Lee & Hyeon Mo Jeon (2020) The Role of Customer Experience, Food Healthiness, and Value for Revisit Intention in GROCERANT Quantitative Research Methods with Frequency Analysis Hedonistic and utilitarian ideals were found to be associated with food health and shopping experiences. It was demonstrated that these values significantly impacted the intention to return. This study deviated from earlier customer experience surveys conducted in the food service sector, which downplayed the significance of food safety. The research model that was given demonstrated the significance of food health as well as the role of the five strategic experience modules in improving consumers' opinions of value and plans to visit a grocery store again.
Miguel Ángel Moliner, Diego Monferrer, Marta Estrada & Rosa M. Rodríguez (2019) Environmental Sustainability and the Hospitality Customer Experience: A Study in Tourist Accommodation Quantitative Methods It was evident that there was a connection between environmental sustainability and guest satisfaction in the hotel sector. This study validated the assessment scale based on the parts of the construct that are most often recognized: cognitive (thinking), affective (feeling), behavioral (doing), sensory (feeling), and social (relating).
Lova Rajaobelina (2018) The Impact of Customer Experience on Relationship Quality with Travel Agencies in a Multichannel Environment Quantitative Research Methods The findings demonstrated that The aspects of THINK and FEEL were significant factors that improved the quality of relationships. It was also discovered that the SENSE (online) and ACT (in-store) dimensions had a beneficial impact on relationship quality.
Shin’ya Nagasawa (2008) Customer experience managementInfluencing on human Kansei to management of technology Qualitative Research Methods From the standpoint of establishing a customer experience, All of the items in the analysis INAX "SATIS," NISSAN "X-TRAIL," Canvas Bags by "Ichizawa Hampu," and Albirex Niigata—meet rigorous requirements for each of the following values: FEEL, SENSE, THINK, ACT, and RELATE. Put differently, they served as a variety of customer experiences. By employing the MOT strategy, they improved the customer experience in addition to offering practical benefits.
Ady Milman, Asli D.A. Tasci (2018) Exploring the experiential and sociodemographic drivers of satisfaction and loyalty in the theme park context Quantitative Research Methods The results showed that if overnight visitors grasped people who connected with the FEEL aspect of experience consumerism and thought their visit was worth the cost were more likely to be happy with it than those who didn't. Furthermore, the length of a visitor's visit to a theme park, the quantity of previous excursions, and the quality of their FEEL experience were significant predictors of the likelihood of their return (loyalty).
Questionnaires from previous literature were used as reference in determining the question items. In this research, the questionnaire consisted of 24 items covering several constructs related to customer experience and satisfaction. The Likert scale was 5 points, with 1 denoting strong disagreement and 5 denoting strong agreement. Google Forms was used to distribute questionnaires to responders online, targeting a selected sample using probability with random sampling method. The target population consisted of individuals who had used the SVoD application for at least one month. The questionnaire was distributed from January to July 2023. The research was conducted in five areas considered metropolitan cities in Indonesia, namely, Jakarta, Bandung, Semarang, Surabaya, and Makassar. The sample size, determined using probability with random sampling, included 423 respondents. Then, SPSS version 26 was used to analyze the data.

4. Result

4.1. Respondent Profile

Table 1 summarizes the demographic characteristics of the sample. The results showed that the sample was dominated by female respondents at 60%, while the remaining 40% were male. The largest age group was 20-44 years, comprising 89% of the sample.
Table 4.1. Respondent Description.
Gender Man
Woman
169 (40%)
254 (60%)
Age 10 to 19 years old
20 to 44 years old
45 to 70 years old
34 (8%)
380 (89%)
9 (2%)
Ocupation Students/students
Official
Entrepreneurial
Housewives
196 (46%)
197 (47%)
25 (6%)
5 (1%)
Region Jakarta
Bandung
Semarang
Surabaya
Makassar
148 (35%)
68 (16%)
42 (10%)
131 (31%)
34 (8%)
Subscribed SvoD Netflix
WeTV
Viu
HBO GO
Disney+ Hotstar
Vision+
97 (23%)
34 (8%)
47 (11%)
13 (3%)
148 (35%)
84 (20%)
Viewing frequency in 1 month Under 15 hour
Between 16 to 30 hour
Between 31 to 45 hour
More than 45 hour
110 (26%)
216 (51%)
59 (14%)
38 (9%)

4.2. Validity Test

The purpose of the validity test was to compare r-table values with computed r-values in order to ascertain the correctness of the data measurement level. Version 26 of the SPSS calculating program was utilized in this study to perform the validity test. The formula df = n-2 with a two-way test was used to determine the acceptable level of significance, which was 10% or 0.1. Given that there were 30 responders in total at the time of the test (n), df = 30-2, or 28, is the outcome. Based on the r-table, the value was 0.4226. As a result, when r-calculated > r table and when r-calculated < r-table, it was regarded as valid. The test's findings demonstrated the validity of each questionnaire item, with computed r-values higher than the r-table value of 0.4629.
Table 4.2. Validity Test Results.
Variable Item
Questionnaire
R Table R Calculate Information
Customer Experience (X) 1 0.4226 0.744 VALID
2 0.4226 0.735 VALID
3 0.4226 0.770 VALID
4 0.4226 0.694 VALID
5 0.4226 0.755 VALID
6 0.4226 0.773 VALID
7 0.4226 0.758 VALID
8 0.4226 0.799 VALID
9 0.4226 0.801 VALID
10 0.4226 0.849 VALID
11 0.4226 0.755 VALID
12 0.4226 0.807 VALID
13 0.4226 0.746 VALID
14 0.4226 0.791 VALID
15 0.4226 0.848 VALID
16 0.4226 0.836 VALID
17 0.4226 0.860 VALID
18 0.4226 0.854 VALID
19 0.4226 0.823 VALID
20 0.4226 0.866 VALID
21 0.4226 0.778 VALID
Customer Satisfaction (Y) 22 0.4226 0.867 VALID
23 0.4226 0.908 VALID
24 0.4226 0.860 VALID
Source: Data processed on SPSS v26, 2023.

4.3. Reliability Test

The reliability test aimed to determine whether the questions were reliable, and Cronbach Alpha was used in the reliability test. Therefore, when the calculated value was <0.6, the data were considered unreliable, and when the calculation showed >0.6 the data were considered reliable.
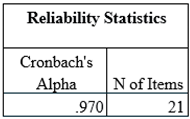
Table 4.3. Customer Experience Reliability Test Results (X).
Preprints 114119 i002
The reliability test in Table 4.3, using the Cronbach Alpha technique, showed that the Customer Experience (X) had a value of 0.970 > 0.6. Therefore, the reliability test for Customer Experience (X) in the questionnaire was declared reliable.
Table 4.4. Customer Satisfaction Reliability Test Results (Y).
Preprints 114119 i003
The reliability test in Table 4.4, using the Cronbach Alpha technique, showed that Customer Satisfaction (Y) had a value of 0.945 > 0.6. Therefore, the Reliability Test for Customer Satisfaction (Y) in the questionnaire was declared reliable.

4.4. Normality Test

The normality test aimed to determine whether the distribution of data followed a normal magnitude. The technique used the Kolmogorov Smirnov (K – S) test, to analyze the significance value within the results.
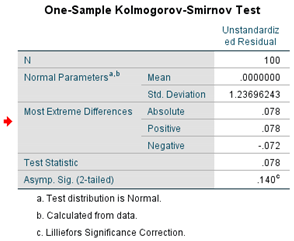
Table 4.5. Normality Test Results.
Preprints 114119 i004
Based on the findings of the normality test, the asymptotic significance (2-tailed) value was 0.140 > 0.05. This demonstrated that the normalcy assumption was satisfied and that the data were normally distributed. According to the significance value (Sig.) of >0.05, the study's data were distributed normally.

4.5. Multicollinearity Test

Finding out if the regression model in this study showed a strong degree of correlation (or link) between the independent variables was the goal of the multicollinearity test.
Table 4.6. Multicollinearity Test Results.
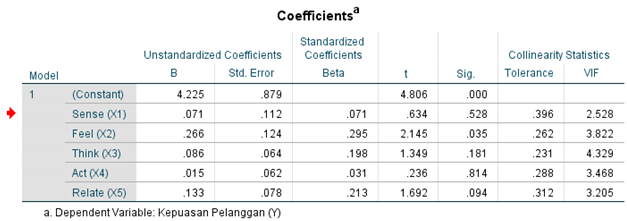
Preprints 114119 i005
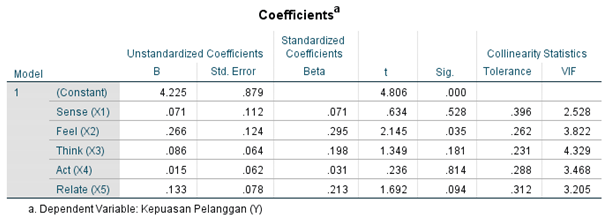
In the multicollinearity test results, it was observed that the VIF values for the SENSE, FEEL, THINK, ACT, and RELATE variables were all <10.00. Therefore, based on the decision-making criteria for the classic assumption test, these variables did not exhibit multicollinearity in the regression model.

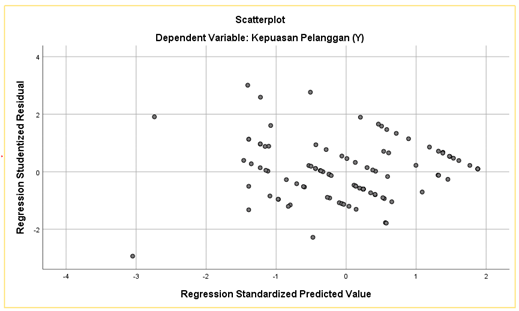
4.6. Heteroskedasticity Test

The purpose of the heteroscedasticity test was to ascertain whether the residuals in the regression showed unequal variance between observations. The predicted value of the dependent variable (ZPRED) was plotted against the residuals (SRESID) in an SPSS-processed graph plot. Therefore, when the points are randomly distributed above and below 0 on the Y-axis, heteroscedasticity is absent.
Table 4.7. Heteroscedasticity Test Results.
Preprints 114119 i006

4.7. T-Test

The SENSE variable (X1) had a significance value (Sig.) of 0.528. The first hypothesis, or H1, was rejected since the likelihood of 0.05 was less than the Sig value of 0.528, there was no appreciable effect of SENSE (X1) on customer happiness (Y).
The FEEL variable (X2) had a significance value (Sig.) of 0.035. The second hypothesis, or H2, was accepted since the Sig value of 0.035 was higher than the probability of 0.05, suggesting that FEEL (X2) had a substantial impact on customer satisfaction (Y).
Table 4.8. Results of T Test Analysis.
Preprints 114119 i007
The THINK variable (X3) had a significance value (Sig.) of 0.181. The third hypothesis, or H3, was rejected since the Sig value of 0.181 was higher than the probability of 0.05, showing that Think (X3) had no discernible impact on Customer Satisfaction (Y).
The ACT variable (X4) had a significance value (Sig.) of 0.814. The fourth hypothesis, or H4, was rejected since the Sig value of 0.814 was higher than the probability of 0.05, showing that ACT (X4) had no discernible impact on customer satisfaction (Y).
The RELATE variable (X5) has a significance value (Sig.) of 0.094. The fifth hypothesis, or H5, was rejected since the Sig value of 0.094 was higher than the probability of 0.05, showing that RELATE (X5) had no discernible impact on customer satisfaction (Y).
Nearly all independent factors had no discernible impact on the dependent variable, based on the results of an investigation using multiple linear regression. The FEEL variable alone substantially and favorably affected consumer satisfaction in this study. Concurrently, there was no discernible impact of the variables SENSE, FEEL, THINK, and RELATE on customer happiness. With a significance value of 0.035, the FEEL value was 0.295.

4.8. Determination Coefficient Test

The Coefficient of Determination Test was the following step, and its goal was to quantify the impact that the independent variable (X) had on the dependent variable (Y).
Table 4.9. Determinant Coefficient Test Results.
Preprints 114119 i008
The Adjusted R Square, which was based on the Coefficient of Determination Test, was 0.509, meaning that the dependent variable (consumer happiness) was impacted by the independent variables (FEEL, SENSE, THINK, ACT, and RELATE) by 50.9%. as shown in the Adjusted R Square table. Meanwhile, 49.1% was affected by variables other than customer experience.

4.9. F Test

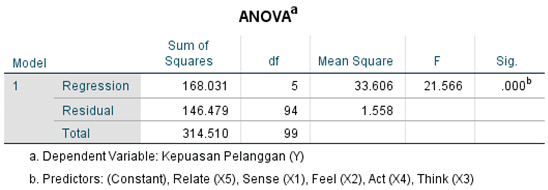
Table 4.10. Results of Test Analysis F.
Preprints 114119 i009
Based on the output table, the Sig. was 0.000. Since the Sig value. 0.000 < 0.05, which was an appropriate basis for decision-making in the F test, therefore the hypothesis was accepted and the Customer Experience variables (FEEL, SENSE, THINK, ACT, and RELATE) affected the Customer Satisfaction variable (Y).
In the analysis of the Customer Experience and Satisfaction variables, this research had an independent variable, namely Customer Experience. Table 4.11 presents and describes the answers to the questionnaire provided by 423 respondents:
Table 4.11. Results of Analysis of Customer Experience (X) and Customer Satisfaction (Y) Variables.
Variable Dimension No Indicator Average score
Customer Experience (X) SENSE (X1) 1 Ease of transactions. 3.73
2 Attractive application appearance. 3.98
3 Feel safe and comfortable. 4.17
FEEL (X2) 4 Fast and precise service. 3.78
5 Provide fast impressions. 4.03
6 Transaction fees. 3.68
THINK (X3) 7 Website and Social Media information. 3.88
8 24 Hour Customer Care Service. 3.81
9 Customer Needs. 3.81
10 Fast and responsive. 3.65
11 Affordable package prices. 3.76
12 Provide bundling of certain (special) packages. 3.97
ACT (X4) 13 Lifestyle resulting from experiences attached to products. 4.03
14 Knowledge for customer regarding packages or services. 3.7
15 Advertising and Social Media Promotion. 3.98
16 Promotion. 3.72
17 Discounts or Price Reductions. 3.36
RELATE (X5) 18 There is special treatment for regular customer. 3.72
19 Service Consistency. 3.96
20 Cooperation. 3.98
21 Partnerships. 3.8
Customer satisfaction (Y) Customer satisfaction 22 Application Usage. 4
23 Feel satisfied and comfortable using the application. 4.04
24 Find it easy to use the application. 4

5. Discussion

Based on the obtained demographics, customer characteristics were divided into several categories, starting with gender. Out of 423 respondents, the sample was predominately female with 254 respondents or 60%. This research also showed a predominance of respondents aged 20-40 years, with 380 respondents (89.6%). Students and employees dominated the sample, with a total of 393 (196 students and 197 employees) which accounted for 93%. As customer ages, the behavioral intentions to obtain a better experience increase [21]. This showed that companies need to prioritize retaining the majority of customer by addressing specific characteristics.
Based on the data processing results, companies need to maintain a customer experience that meets expectation, starting from ease of transactions, available displays, presented features, fast and precise service, up-to-date impressions, incurred costs, presented information, customer care services, fast and responsive management of needs and complaints, affordable packages, bundling of certain packages, practicality, presentation of packages, promotions, promos, special treatment, consistency in all services, collaboration, as well as persuasive promotions. The Discount indicator was included in the neutral category with a score of 2.61 – 3.40, hence companies should continue to offer discounts to maintain experience and satisfaction. Customer satisfaction can be increased by offering early discounts [48]. Furthermore, the satisfaction question indicator (Y) falls into the agreed category with a score of 3.41 – 4.20, for items 22, 23, 24. This means that companies should prioritize maintaining satisfaction with the application. A superior experience leads to higher satisfaction and increased profits for companies [22].
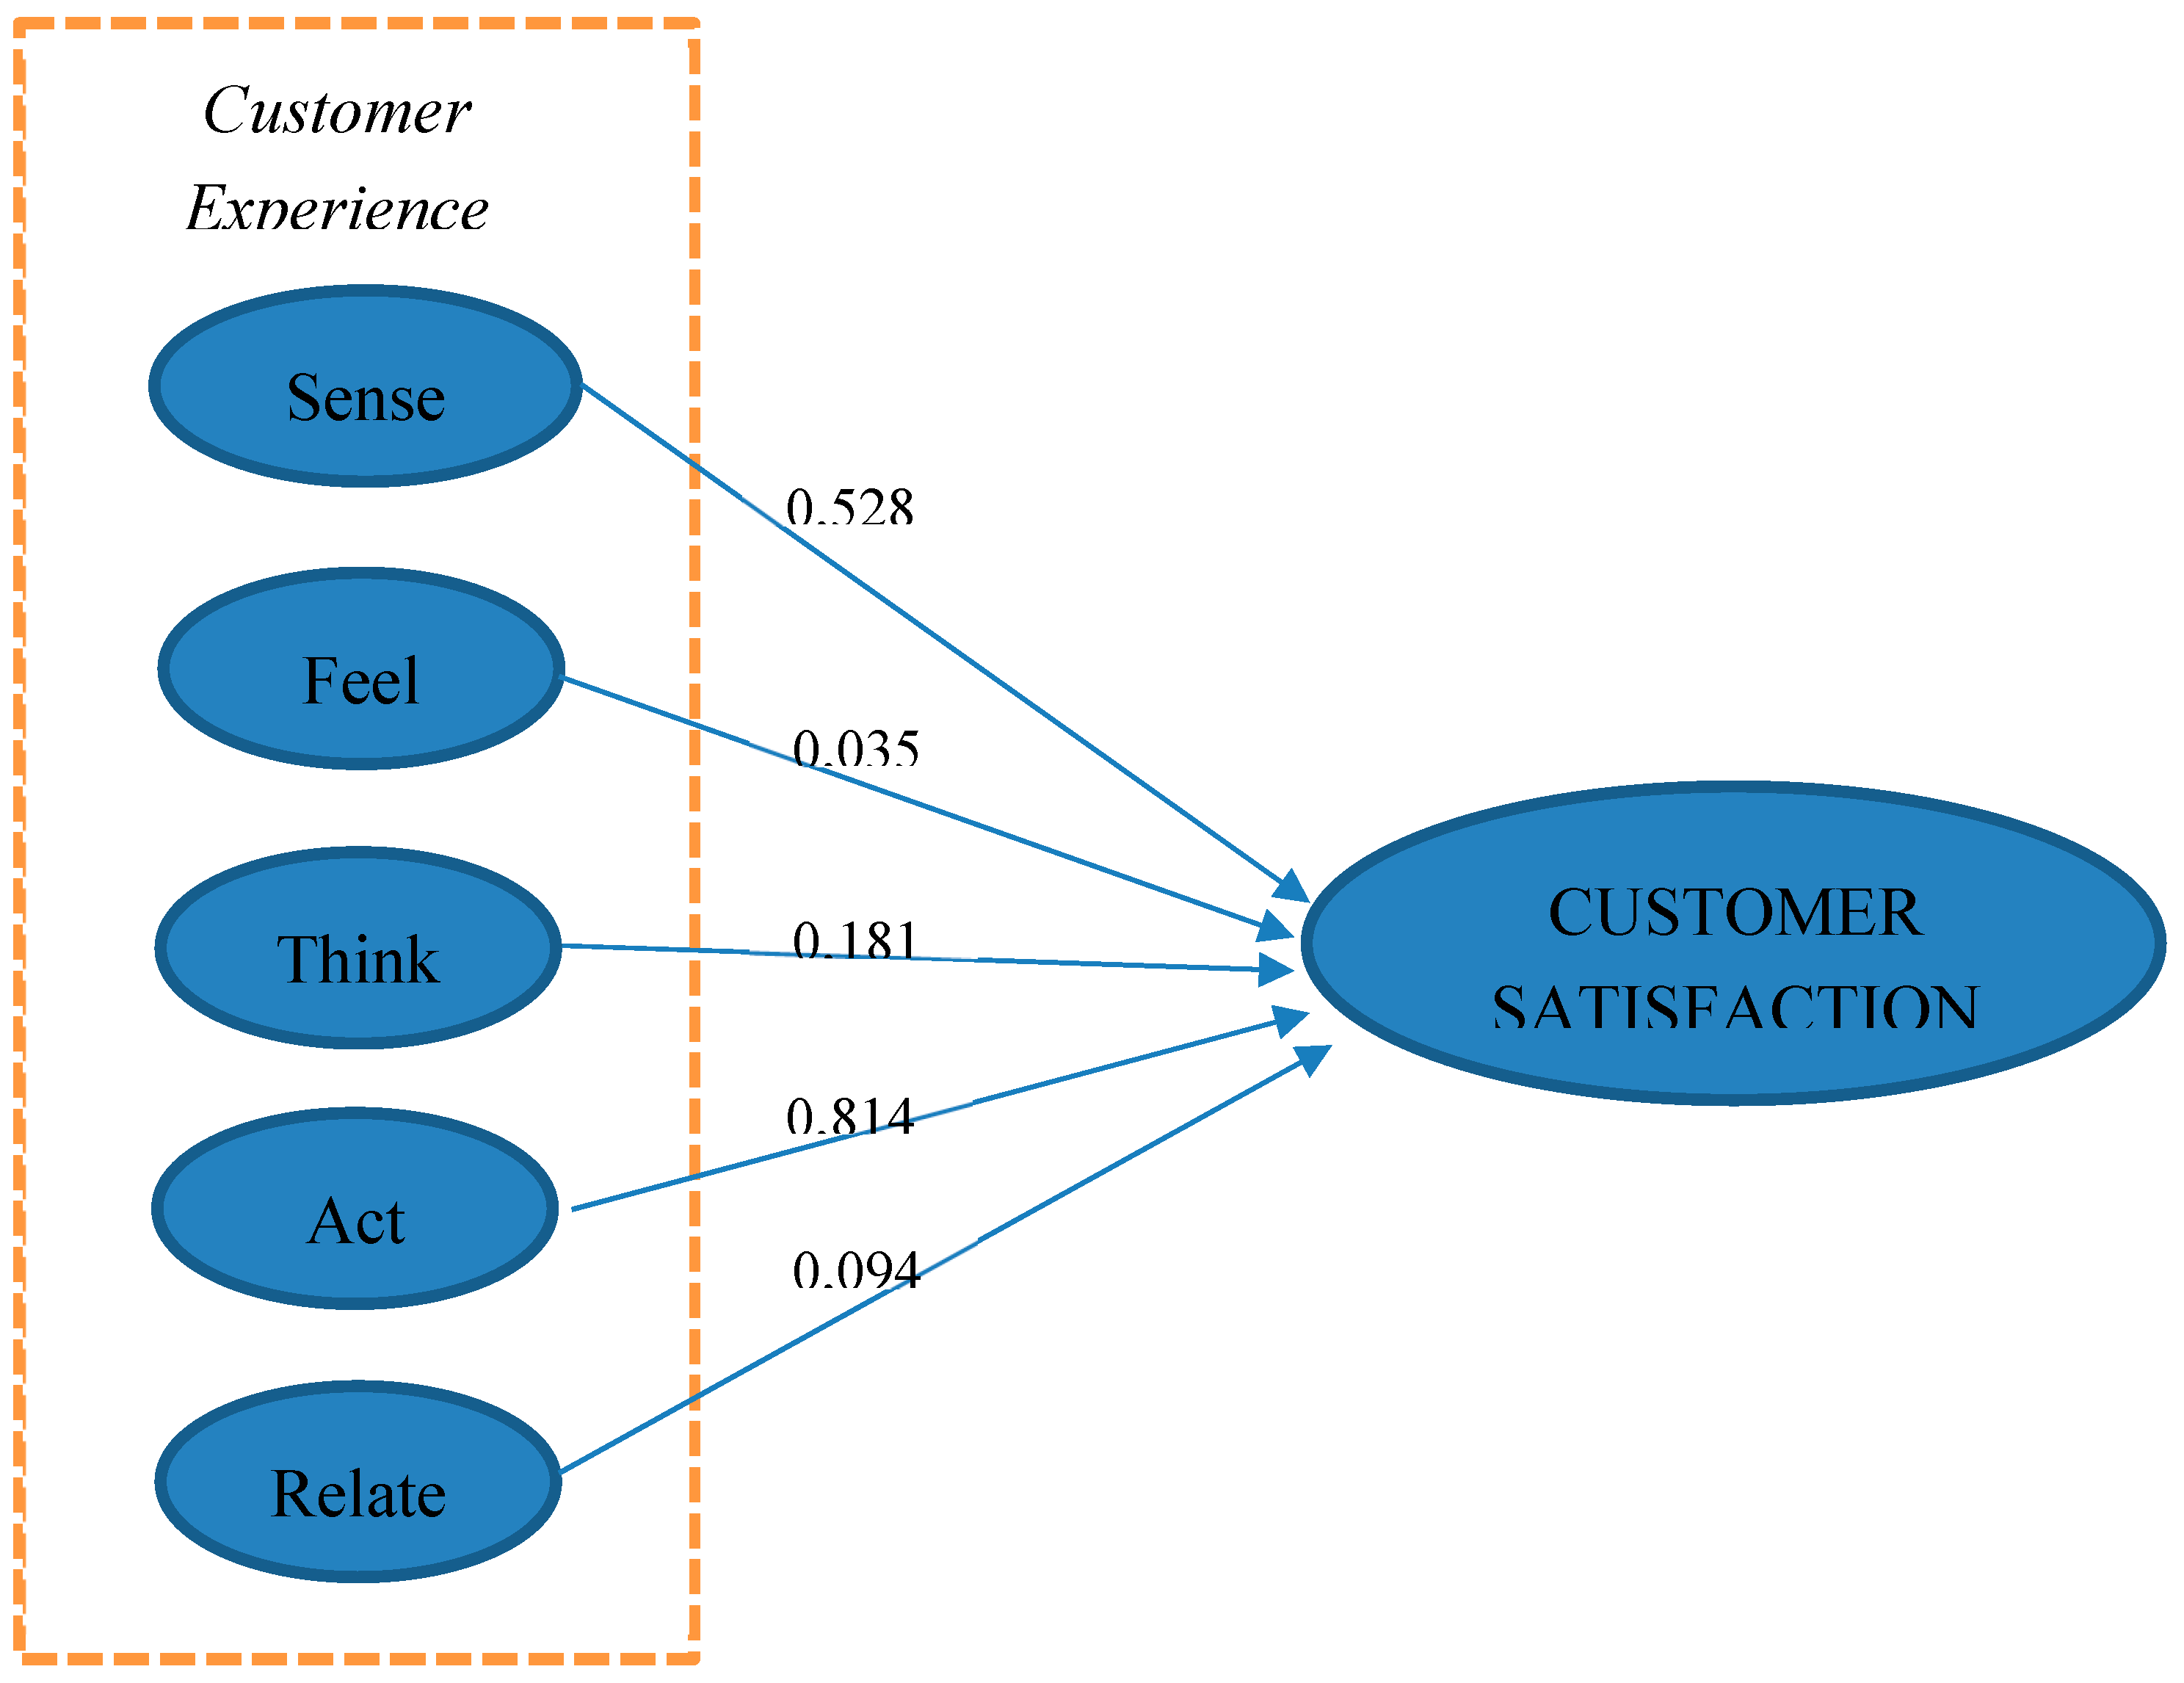
Figure 1. Summary of Findings.
Preprints 114119 g001
According to the study's findings, only the FEEL variable significantly and favorably affected customer satisfaction. In the meantime, there was no positive and substantial impact from the remaining variables, which are SENSE, THINK, ACT, and RELATE. This corresponded with findings from social media users that FEEL and SENSE were positively related to satisfaction [49]. Therefore, companies should pay more attention to develop the SENSE, THINK, ACT, and RELATE variables to enhance customer satisfaction.

6. Conclusions, Limitation and Future Research

In conclusion, to determine customer satisfaction for SVoD, FEEL was identified as the main aspect with a significant effect. This aspect was based on several indicators, namely (1) fast service, where quality is one of the important values, therefore it affects satisfaction [50], (2) presenting fast/latest shows, as customer often look forward to the latest shows and even want to enjoy different content features in new films [51], and (3) adequate transaction costs, which affect online customer satisfaction [52]. Therefore, to maintain satisfaction and continuous use of the application, companies should prioritize other variables, including SENSE, THINK, ACT, and RELATE. The efforts should include providing convenience in transactions and an attractive display, improving and developing the features, offering more effective and efficient information, providing better customer care services, responding promptly to needs, and increasing promotions to create better customer satisfaction. Therefore, it is expected that this research will provide a useful theoretical basis for entertainment companies, such as those in the SVoD industry, especially in the product and service development division. Companies can use these insights to develop better strategies, increase customer satisfaction, as well as maintain and enhance application. However, this research did not consider customer habits, such as the media used (smartphone/television/laptop), viewing locations, the number of videos watched (marathons/singles), and viewing distance related to body health. In addition, future research should focus on these aspects to provide additional benefits and education to viewers.

References

  1. Raats, T.; Evens, T. “If you can’t beat them, be them”: A critical analysis of the local streaming platform and Netflix alternative Streamz. MedieKultur 2021, 37, 50–65. [Google Scholar] [CrossRef]
  2. Castro, D.; Rigby, J.M.; Cabral, D.; Nisi, V. The binge-watcher’s journey: Investigating motivations, contexts, and affective states surrounding Netflix viewing. Convergence 2021, 27, 3–20. [Google Scholar] [CrossRef]
  3. Basuki, R.; Tarigan, Z.J.H.; Siagian, H.; Limanta, L.S.; Setiawan, D.; Mochtar, J. The effects of perceived ease of use, usefulness, enjoyment and intention to use online platforms on behavioral intention in online movie watching during the pandemic era. Int. J. Data Netw. Sci. 2022, 6, 253–262. [Google Scholar] [CrossRef]
  4. Digital TV news Premium video captures 10% of video streaming minutes in SE Asia.
  5. Dubey, R.; Bryde, D.J.; Blome, C.; Dwivedi, Y.K.; Childe, S.J.; Foropon, C. Alliances and digital transformation are crucial for benefiting from dynamic supply chain capabilities during times of crisis: A multi-method study. Int. J. Prod. Econ. 2024, 269, 109166. [Google Scholar] [CrossRef]
  6. Verhoef, P.C.; Broekhuizen, T.; Bart, Y.; Bhattacharya, A.; Qi Dong, J.; Fabian, N.; Haenlein, M. Digital transformation: A multidisciplinary reflection and research agenda. J. Bus. Res. 2021, 122, 889–901. [Google Scholar] [CrossRef]
  7. Gu, S.; Ślusarczyk, B.; Hajizada, S.; Kovalyova, I.; Sakhbieva, A. Impact of the covid-19 pandemic on online consumer purchasing behavior. J. Theor. Appl. Electron. Commer. Res. 2021, 16, 2263–2281. [Google Scholar] [CrossRef]
  8. Warner, K.S.R.; Wäger, M. Building dynamic capabilities for digital transformation: An ongoing process of strategic renewal. Long Range Plann. 2019, 52, 326–349. [Google Scholar] [CrossRef]
  9. Carissa, N.E.; Erlangga, M.; Evik, C.S.; Handayani, P.W. The Influence of Perceived Usefulness, Satisfaction, and Personalization on Subscription Video on Demand Continuance Intentions. CommIT J. 2023, 17, 169–184. [Google Scholar] [CrossRef]
  10. Iglesias, O.; Markovic, S.; Rialp, J. How does sensory brand experience influence brand equity? Considering the roles of customer satisfaction, customer affective commitment, and employee empathy. J. Bus. Res. 2019, 96, 343–354. [Google Scholar] [CrossRef]
  11. Rita, P.; Oliveira, T.; Farisa, A. The impact of e-service quality and customer satisfaction on customer behavior in online shopping. Heliyon 2019, 5, e02690. [Google Scholar] [CrossRef] [PubMed]
  12. Sanson, K.; Steirer, G. Hulu, streaming, and the contemporary television ecosystem. Media, Cult. Soc. 2019, 41, 1210–1227. [Google Scholar] [CrossRef]
  13. Lee, S.; Lee, S.; Joo, H.; Nam, Y. Examining factors influencing early paid over-the-top video streaming market growth: A cross-country empirical study. Sustain. 2021, 13. [Google Scholar] [CrossRef]
  14. Rios, S.; Scarlata, A. Locating SVOD in Australia and Mexico: Stan and Blim contend with Netflix. Crit. Stud. Telev. 2018, 13, 475–490. [Google Scholar] [CrossRef]
  15. Baek, H.; Jang, M.; Kim, S. Strategies to mitigate the cannibalization effect between subscription video-on-demand and transactional video-on-demand. Digit. Bus. 2024, 4, 100073. [Google Scholar] [CrossRef]
  16. Nagasawa, S. Customer experience management: Influencing on human Kansei to management of technology. TQM J. 2008, 20, 312–323. [Google Scholar] [CrossRef]
  17. Mulla, T. Assessing the factors influencing the adoption of over-the-top streaming platforms: A literature review from 2007 to 2021. Telemat. Informatics 2022, 69, 101797. [Google Scholar] [CrossRef]
  18. Flavián, C.; Ibáñez-Sánchez, S.; Orús, C. The impact of virtual, augmented and mixed reality technologies on the customer experience. J. Bus. Res. 2019, 100, 547–560. [Google Scholar] [CrossRef]
  19. Jain, R.; Aagja, J.; Bagdare, S. Customer experience – a review and research agenda. J. Serv. Theory Pract. 2017, 27, 642–662. [Google Scholar] [CrossRef]
  20. McLean, G.; Al-Nabhani, K.; Wilson, A. Developing a Mobile Applications Customer Experience Model (MACE)- Implications for Retailers. J. Bus. Res. 2018, 85, 325–336. [Google Scholar] [CrossRef]
  21. Rather, R.A.; Hollebeek, L.D. Customers’ service-related engagement, experience, and behavioral intent: Moderating role of age. J. Retail. Consum. Serv. 2021, 60, 102453. [Google Scholar] [CrossRef]
  22. Grewal, D.; Levy, M.; Kumar, V. Customer Experience Management in Retailing : An Organizing Framework. 2009, 85, 1–14. [Google Scholar] [CrossRef]
  23. Ren, L.; Qiu, H.; Wang, P.; Lin, P.M.C. International Journal of Hospitality Management Exploring customer experience with budget hotels : Dimensionality and satisfaction. Int. J. Hosp. Manag. 2016, 52, 13–23. [Google Scholar] [CrossRef]
  24. Jha, S.; Deitz, G.D.; Babakus, E.; Yavas, U. The Role of Corporate Image for Quality in the Formation of Attitudinal Service Loyalty. J. Serv. Res. 2013, 16, 155–170. [Google Scholar] [CrossRef]
  25. De Leon, M. V.; Atienza, R.P.; Susilo, D. Influence of self-service technology (SST) service quality dimensions as a second-order factor on perceived value and customer satisfaction in a mobile banking application. Cogent Bus. Manag. 2020, 7. [Google Scholar] [CrossRef]
  26. Rajaobelina, L. The Impact of Customer Experience on Relationship Quality with Travel Agencies in a Multichannel Environment. J. Travel Res. 2018, 57, 206–217. [Google Scholar] [CrossRef]
  27. Yoo, S.R.; Lee, S.W.; Jeon, H.M. The role of customer experience, food healthiness, and value for revisit intention in GROCERANT. Sustain. 2020, 12. [Google Scholar] [CrossRef]
  28. Moliner, M.Á.; Monferrer, D.; Estrada, M.; Rodríguez, R.M. Environmental sustainability and the hospitality customer experience: A study in tourist accommodation. Sustain. 2019, 11. [Google Scholar] [CrossRef]
  29. Milman, A.; Tasci, A.D.A. Exploring the experiential and sociodemographic drivers of satisfaction and loyalty in the theme park context. J. Destin. Mark. Manag. 2018, 8, 385–395. [Google Scholar] [CrossRef]
  30. Schmitt, B.H. Experiential marketing : how to get customers to sense, feel, think, act, and relate to your company and brands; New York : Free Press: New York, 1999. [Google Scholar]
  31. Puengwattanapong, P.; Leelasantitham, A. A Holistic Perspective Model of Plenary Online Consumer Behaviors for Sustainable Guidelines of the Electronic Business Platforms. Sustain. 2022, 14. [Google Scholar] [CrossRef]
  32. Wijaya, I.G.N.S.; Triandini, E.; Kabnani, E.T.G.; Arifin, S. E-commerce website service quality and customer loyalty using WebQual 4.0 with importance performances analysis, and structural equation model: An empirical study in shopee. Regist. J. Ilm. Teknol. Sist. Inf. 2021, 7, 107–124. [Google Scholar] [CrossRef]
  33. Tontini, G.; da Silva, J.C.; Beduschi, E.F.S.; Zanin, E.R.M.; Marcon, M. de F. Nonlinear impact of online retail characteristics on customer satisfaction and loyalty. Int. J. Qual. Serv. Sci. 2015, 7, 152–169. [Google Scholar] [CrossRef]
  34. Lim, Y.S.; Heng, P.C.; Ng, T.H.; Cheah, C.S. Customers’ online website satisfaction in online apparel purchase: A study of Generation Y in Malaysia. Asia Pacific Manag. Rev. 2016, 21, 74–78. [Google Scholar] [CrossRef]
  35. Hall, E.; Binney, W.; Vieceli, J. Increasing loyalty in the arts by bundling consumer benefits. Arts Mark. 2016, 6, 141–165. [Google Scholar] [CrossRef]
  36. Sudari, S.A.; Tarofder, A.K.; Khatibi, A.; Tham, J. Measuring the critical effect of marketing mix on customer loyalty through customer satisfaction in food and beverage products. Manag. Sci. Lett. 2019, 9, 1385–1396. [Google Scholar] [CrossRef]
  37. Cao, Y.; Ajjan, H.; Hong, P. Post-purchase shipping and customer service experiences in online shopping and their impact on customer satisfaction: An empirical study with comparison. Asia Pacific J. Mark. Logist. 2018, 30, 400–416. [Google Scholar] [CrossRef]
  38. Solomon, J; Day, C; Worrall, A; Thompson, P. International Journal of Health Care Quality Assurance Article information : Int. J. Healthc. Qual. Assur. 2015, 28, 228–233.
  39. Gloor, P.; Fronzetti Colladon, A.; Giacomelli, G.; Saran, T.; Grippa, F. The impact of virtual mirroring on customer satisfaction. J. Bus. Res. 2017, 75, 67–76. [Google Scholar] [CrossRef]
  40. Filieri, R.; Alguezaui, S.; McLeay, F. Why do travelers trust TripAdvisor? Antecedents of trust towards consumer-generated media and its influence on recommendation adoption and word of mouth. Tour. Manag. 2015, 51, 174–185. [Google Scholar] [CrossRef]
  41. Sofi, M.R.; Bashir, I.; Parry, M.A.; Dar, A. The effect of customer relationship management (CRM) dimensions on hotel customer’s satisfaction in Kashmir. Int. J. Tour. Cities 2020, 6, 601–620. [Google Scholar] [CrossRef]
  42. Vinish, P.; Pinto, P.; Hawaldar, I.T.; Pinto, S. Antecedents of behavioral intention to use online food delivery services: An empirical investigation. Innov. Mark. 2021, 17, 1–15. [Google Scholar] [CrossRef]
  43. Al-Dmour, R.; Alkhatib, O.H.; Al-Dmour, H.; Basheer Amin, E. The Influence of Social Marketing Drives on Brand Loyalty via the Customer Satisfaction as a Mediating Factor in Travel and Tourism Offices. SAGE Open 2023, 13, 1–13. [Google Scholar] [CrossRef]
  44. Barari, M.; Ross, M.; Surachartkumtonkun, J. Negative and positive customer shopping experience in an online context. J. Retail. Consum. Serv. 2020, 53, 101985. [Google Scholar] [CrossRef]
  45. Pan, J.N.; Nguyen, H.T.N. Achieving customer satisfaction through product-service systems. Eur. J. Oper. Res. 2015, 247, 179–190. [Google Scholar] [CrossRef]
  46. Dandis, A.O.; Al Haj Eid, M.B. Customer lifetime value: investigating the factors affecting attitudinal and behavioural brand loyalty. TQM J. 2022, 34, 476–493. [Google Scholar] [CrossRef]
  47. Luo, Z.; Qin, H.; Che, C.; Lim, A. On service consistency in multi-period vehicle routing. Eur. J. Oper. Res. 2015, 243, 731–744. [Google Scholar] [CrossRef]
  48. Chung, J.; Li, D. The prospective impact of a multi-period pricing strategy on consumer perceptions for perishable foods. Br. Food J. 2013, 115, 377–393. [Google Scholar] [CrossRef]
  49. Alkilani, K.; Ling, K.C.; Abzakh, A.A. The impact of experiential marketing and customer satisfaction on customer commitment in the world of social networks. Asian Soc. Sci. 2012, 9, 262–270. [Google Scholar] [CrossRef]
  50. Uzir, M.U.H.; Al Halbusi, H.; Thurasamy, R.; Thiam Hock, R.L.; Aljaberi, M.A.; Hasan, N.; Hamid, M. The effects of service quality, perceived value and trust in home delivery service personnel on customer satisfaction: Evidence from a developing country. J. Retail. Consum. Serv. 2021, 63, 102721. [Google Scholar] [CrossRef]
  51. Moon, S.; Jalali, N.; Song, R. Green-lighting scripts in the movie pre-production stage: An application of consumption experience carryover theory. J. Bus. Res. 2022, 140, 332–345. [Google Scholar] [CrossRef]
  52. Prasetyo, Y.T.; Tanto, H.; Mariyanto, M.; Hanjaya, C.; Young, M.N.; Persada, S.F.; Miraja, B.A.; Redi, A.A.N.P. Factors affecting customer satisfaction and loyalty in online food delivery service during the COVID-19 pandemic: Its relation with open innovation. J. Open Innov. Technol. Mark. Complex. 2021, 7, 1–17. [Google Scholar] [CrossRef]
Disclaimer/Publisher’s Note: The statements, opinions and data contained in all publications are solely those of the individual author(s) and contributor(s) and not of MDPI and/or the editor(s). MDPI and/or the editor(s) disclaim responsibility for any injury to people or property resulting from any ideas, methods, instructions or products referred to in the content.
Copyright: This open access article is published under a Creative Commons CC BY 4.0 license, which permit the free download, distribution, and reuse, provided that the author and preprint are cited in any reuse.
Prerpints.org logo

Preprints.org is a free preprint server supported by MDPI in Basel, Switzerland.

Subscribe

© 2024 MDPI (Basel, Switzerland) unless otherwise stated