
Submitted:
31 July 2024
Posted:
05 August 2024
You are already at the latest version
Abstract
This pioneering study explores the geospatial and temporal patterns of natural and human-induced disasters from 1900 to 2024, providing essential insights into their global distribution and impacts. Utilizing the comprehensive international EM-DAT database, our analysis reveals significant trends and disparities in disaster occurrences and their widespread consequences. Results showed a dramatic escalation in both natural and man-made (technological) disasters over the decades, with notable surges in the 1991-2000 and 2001-2010 periods. A total of 25,836 disasters were recorded worldwide, of which 69.41% were natural disasters (16,567) and 30.59% were man-made (technological) disasters (9,269). The most significant increase in natural disasters occurred from 1961-1970, while man-made (technological) disasters surged substantially from 1981-1990. Seasonal trends reveal that floods peak in January and July, while storms are most frequent in June and October. Droughts and floods are the most devastating in terms of human lives, while storms and earthquakes cause the highest economic losses. The most substantial economic losses were reported during the 2001-2010 period, driven by catastrophic natural disasters in Asia and North America. Our research highlights Asia as the most disaster-prone continent, accounting for 41.75% of global events, with natural disasters making up 61.89% of these events. Oceania, despite experiencing fewer total disasters, shows a remarkable 91.51% of these as natural disasters. Africa is notable for its high incidence of man-made (technological) disasters, which constitute 43.79% of the continent's disaster events. Europe, representing 11.96% of total disasters, exhibits a balanced distribution but tends towards natural disasters at 64.54%. Examining specific countries, China, India, and the United States emerged as the most frequently affected by both natural and man-made (technological) disasters. The impact of these disasters has been immense, with economic losses reaching their highest during the decade of 2010-2020, largely due to natural disasters. The human toll has been equally significant, with Asia recording the most fatalities and Africa the most injuries. Particularly, the decade from 2001 to 2010 experienced the greatest economic losses, primarily driven by natural disasters in Asia and North America. These insights highlight the urgent need for tailored disaster risk management strategies that address the distinct challenges and impacts in various regions. By understanding historical disaster patterns, policymakers and stakeholders can better anticipate and manage future risks, ultimately safeguarding lives and economies.
Keywords:
hazards
; emergencies
; natural disasters
; man-made (technological) disasters
; disaster risk management
; economic impact
; human impact
; em-dat database
; geospatial analysis
; temporal analysis
1. Introduction
In our increasingly interconnected world, grasping disasters' geospatial and temporal patterns has become vital for effective disaster management and resilience planning [1,2]. Disasters, whether natural or human-induced, can have profound impacts on communities, economies, and the environment [3,4,5,6]. The risk of a disaster occurring is always a combination of vulnerability and exposure due to inadequate preparation or coping capacity [7]. This underscores the necessity of delving into the complex dynamics that influence their occurrence and distribution.
Environmental events like earthquakes, floods, hurricanes, and wildfires are driven by natural and climatic forces [8,9,10,11,12,13,14,15,16,17,18,19,20,21]. The patterns of these disasters, including their frequency, intensity, and locations, have evolved over time due to shifts in climate, land usage, and population growth [22,23,24,25,26,27]. Analyzing past data helps us uncover trends and identify high-risk areas, improving our ability to forecast and respond to future events [28]. In contrast, technological disasters arise from human activities such as industrial mishaps, nuclear accidents, and oil spills. These incidents often occur due to equipment failures, human and organizational mistakes [29] or weak regulatory measures. Failures can occur during the design, construction, operation or maintenance phases [30]. By examining when and where these disasters happen, we can gain insights into industrial operations and regulatory practices, leading to better safety protocols and emergency response strategies [31].
Recent research has shed light on significant advancements and methodologies for understanding the geospatial and temporal patterns of natural disasters. Han et al. [32], for instance, use textual records to uncover spatial-temporal patterns of natural disasters in China. Their findings highlight critical intervals and interactions between events, offering valuable guidance for disaster prevention efforts [32]. Ghosh [33] explores the integration of various geospatial technologies and data sources in disaster management. Also, he emphasizes how AI and big data can enhance emergency responses and decision-making processes. On the other hand, Wang [34] delves into the historical patterns of marine disasters in China, providing a multiscalar analysis of their temporal changes and spatial evolution. This research helps in understanding long-term trends and impacts (Wang, 2020). Additionally, Wei et al. [35] conduct a comprehensive study on the spatial-temporal evolution and prediction of flood disasters in China over the past 500 years, highlighting critical trends and future risks. Together, these studies deepen our understanding of disaster patterns and offer valuable insights for effective disaster management and mitigation strategies.
The wealth of existing research on this subject provides crucial insights into the factors shaping these disaster patterns [5,34,35,36,37,38,39,40,41,42,43]. Geospatial analyses have revealed that some areas are particularly at risk for specific types of disasters. Factors such as the terrain, local climate, and how densely populated an area are significantly influence where these disasters occur [17]. Moreover, by studying temporal patterns, researchers can identify seasonal or cyclical trends and assess how climate change might be altering the frequency and severity of these events [44,45]. Besides that, some study highlights the significant toll natural disasters can take on mental health, stressing the importance of comprehensive post-disaster intervention strategies to tackle the behavioral and psychological symptoms that follow such events [46].
Regarding that, the aim of this study is to provide a scientific description and comprehensive understanding of the patterns and impacts of natural and man-made (technological) disasters over more than a century. By analyzing the geospatial and temporal distribution of these events, the study aims to offer valuable insights that can inform future disaster risk management strategies, enhance preparedness, and ultimately contribute to the reduction of disaster-related losses. This research highlights the urgent need for tailored disaster risk management strategies that address the distinct challenges and impacts in various regions, thereby promoting resilience and sustainable development.
1.1. Literature Review Geospatial and Temporal Patterns of Disasters
Understanding and managing the effects of natural and man-made (technological) disasters have been significantly improved through geospatial analysis [47,48,49]. Analyzing historical data through geospatial techniques unveils patterns in the frequency and distribution of natural disasters worldwide [50]. This type of analysis is essential for grasping the temporal and spatial behaviors of these events, which in turn is critical for making accurate future predictions and improving disaster preparedness efforts [51,52,53,54,55]. Utilizing tools like remote sensing and GIS, researchers can now map out affected areas, predict potential damage, and evaluate the aftermath of these events [56]. This technological approach greatly supports efforts in disaster preparedness, effective response, and efficient recovery [4,23]. Geospatial technologies, including GIS and remote sensing, have proven to be highly effective tools for mapping and predicting natural disasters such as earthquakes, landslides, floods, and cyclones [49,56,57,58,59]. By utilizing these advanced technologies, researchers can accurately identify areas that are at high risk for such events [5,60,61,62].
Moreover, these tools play a vital role in developing early warning systems that can help mitigate the impact of disasters by providing timely alerts and enabling better preparedness [37,38,42,63,64,65,66,67,68]. Remote sensing and geospatial analyses play a crucial role in evaluating damage and monitoring recovery efforts following disasters [43,69]. For example, the use of medium-resolution imagery alongside indices like NDVI and UI has been particularly effective in assessing recovery rates after tornadoes, where severely damaged areas tend to recover more slowly [69]. Satellite-based geospatial techniques offer a dependable alternative to traditional ground-based surveys, which are often hindered by hazardous conditions and logistical difficulties [50]. These technologies enable a comprehensive assessment of disaster impacts and facilitate more efficient recovery planning [56].
Understanding the patterns, predicting future occurrences, and mitigating the impacts of natural and man-made (technological) disasters hinge significantly on temporal analysis [70,71,72]. Andersen et al. [73] provide comprehensive guidance on conducting time-to-event analysis in observational studies, with a particular focus on hazard models and the Cox proportional hazards regression model. Their paper includes practical examples and computational implementation using R. In another study, Tian et al. [41] introduce a framework for evaluating community resilience to multiple hazards in the Anning River basin, underscoring the significance of socio-economic factors in enhancing adaptive risk management. Melkov et al. [74] analyze geophysical data in North Ossetia, Russia, and develop a complex hazard map aimed at improving risk assessments in the region. Also, Chen et al. [75]examine the temporal assessment of disaster risk, using case studies from China to demonstrate how risk varies over time and proposing long-term mitigation strategies.
Over the past century, studies have shown a general uptick in both the frequency and intensity of natural disasters, with pronounced peaks in recent decades [39,76,77]. Chen et al. [78] explored the occurrence of rainstorms and floods in the Tarim Basin from 1980 to 2019. Their findings show a notable rise in these events, especially between April and September. The western and northern regions of the basin are particularly vulnerable, with severe incidents significantly impacting the damage index. Similarly, Buszta et al. [47] conducted a geospatial analysis of 9962 natural disasters from 1960 to 2018, examining their frequency and impact across different continents. This study also provides a predictive outlook on future trends, highlighting the influence of climatic factors on disaster patterns. Besides that, Summers et al. [40] investigated changes in the frequency, intensity, and spatial distribution of hazards like hurricanes, tropical storms, and droughts. Their research connects these variations to climate change, using empirical data to bolster previous theories. Furthermore, Herrera and Aristizábal [79] examined the relationship between precipitation patterns and landslides in the Aburrá Valley. Their study revealed that rainfall-induced landslides are affected by macroclimatic phenomena such as ENSO, with specific hotspots identified in the valley's eastern hills.
There's strong evidence pointing to a sharp rise in economic damages from extreme natural events, especially in temperate regions, driven by their increasing severity [76]. Patterns of droughts and floods reveal alternating positive and negative correlations over time, with a notable lag effect where floods tend to follow droughts by about 4-5 years [80]. The number of people affected by natural disasters has surged, leading to more fatalities, injuries, and property damage [48,80]. People's information-seeking behavior during disasters shifts across different phases, underscoring the need for varied communication strategies before, during, and after such events [36]. To analyze the temporal and spatial distribution of disasters, researchers are increasingly turning to advanced methods like time series analysis, spatial statistics, and big data techniques [81,82].
2. Methods
The subject of this research encompasses an extensive analysis of both natural and man-made (technological) disasters from 1900 to 2024. The primary objective is to identify geospatial and temporal patterns of these disasters, examining their frequency, distribution, and impact across various geographic regions and periods. Utilizing the EM-DAT database, the study aims to uncover significant trends and disparities in disaster occurrences and their widespread consequences on a global scale.
In a narrower sense, this research delves into the historical data of natural and man-made disasters, categorizing them by type, region, and period. It explores specific trends such as the escalation of natural disasters from 1960-1970 and man-made (technological) disasters from 1981-1990. Furthermore, it identifies seasonal trends, assesses the economic and human impacts of these disasters, and examines the specific vulnerabilities of different continents and countries.
2.1. Hypothetical Framework
This study is based on the general hypothesis that the geospatial and temporal patterns of natural and man-made (technological) disasters exhibit significant variations in frequency, distribution, and impact across different geographic regions and periods, reflecting changes in natural conditions and socio-economic factors. The specific hypotheses include:
H1.
Natural disasters occur more frequently and have a greater impact on human and economic resources compared to technological disasters.
H2.
The frequency and distribution of disasters differ between continents, with certain regions experiencing higher frequencies of specific types of disasters.
H3.
There are significant temporal changes in the frequency of natural and technological disasters, with particular periods showing notable increases or decreases in the number of events.
H4.
Certain natural disasters show seasonal variations in frequency, reflecting climatic and weather patterns.
H5.
Different types of disasters have varying impacts on economic losses and human resources, with some disasters causing more severe consequences than others.
2.2. Data Collection and Preparation
Data for this study were sourced from the international EM-DAT (Emergency Events Database). EM-DAT is a comprehensive global database that tracks and records all types of natural and human-induced (technological) disasters. It is maintained and regularly updated by the Centre for Research on the Epidemiology of Disasters (CRED) at the University of Louvain, Belgium.
The database contains information on disasters that have occurred worldwide since 1900 and meet at least one of the following criteria: 10 fatalities, 100 people affected, declaration of a state of emergency and an international request for assistance. Each entry in EM-DAT includes detailed information about the disaster type, the number of affected individuals, economic losses, geographical distribution, and other relevant parameters. For this study, a total of 25,836 disasters from 1900 to 2024 were analyzed. After downloading the data, it was cleaned and prepared for analysis using the Statistical Package for the Social Sciences (SPSS) software.
The data preparation process included several key steps: a) identifying and removing duplicates and missing values to ensure data accuracy and consistency; b) converting all data into a uniform format to facilitate easier analysis and interpretation; classifying disasters by type, intensity, geographical area, and period.
2.2. Analyses
Statistical analyses were performed using a two-tailed approach with a significance level set at p < 0.05, utilizing IBM SPSS Statistics (Version 26, New York, NY, USA). The data were analyzed using descriptive statistics to identify the geospatial and temporal patterns of natural and technological disasters. The statistical analysis included the following steps:
- Analysis of the geographical distribution of disasters by continents for the period from 1900 to 2024. This included calculating the total number and percentage of different types of disasters on each continent. The geographical distribution was analyzed to identify regions with the highest frequency of disasters and to determine the specific characteristics of disasters in those regions.
- Detailed analysis of the frequency of disasters by countries, including the identification of countries most affected by different types of disasters. The analysis included quantifying the number of events by country and assessing their impact on human and economic resources.
- Analysis of temporal trends in the frequency of natural and technological disasters in 10- and 5-year intervals. This analysis enabled the identification of changes in the frequency and types of disasters over time, as well as the identification of periods with the highest disaster frequency.
The results were presented in tables and charts illustrating the spatial and temporal patterns of disasters. The graphical representations included: a) visualization of the geographical patterns of natural and technological disasters by continents and countries; b) display of changes in the frequency of different types of disasters over time, with a particular focus on decadal and five-year intervals. The results of the analysis were validated using multiple data sources to ensure the accuracy and reliability of the findings. This included comparison with similar studies and literature. Additionally, cross-validation methods were used to verify the consistency and reliability of the results obtained.
3. Results
The results of this study encompass a comprehensive overview of the geospatial and temporal patterns of natural and technological disasters, revealing key trends in their frequency, distribution, and impact across different geographic regions and periods. These findings provide valuable insights into the variations and dynamics of disaster events, contributing to a better understanding of their historical patterns and informing future disaster risk management strategies.
Based on the methodological framework and study design above, the results were divided into two main sections, each with two subsections: a) geographical distribution of natural and man-made (technological) disasters (in-depth analysis of disaster distribution by continent and country with comprehensive supporting data); b) temporal distribution of natural and man-made (technological) disasters (yearly and monthly trends in occurrences and consequences of natural and man-made (technological) disasters).
3.1. Geographical Distribution of Natural and Man-Made (Technological) Disasters
3.1.1. In-Depth Analysis of Disaster Distribution by Continent with Comprehensive Supporting Data
The geospatial distribution of both natural and man-made (technological) disasters across continents from 1900 to 2024 reveals significant trends and patterns in the frequency and spread of various disaster types (Table 1 and Figure 1). A total of 25,836 disasters were recorded worldwide, of which 69.41% were natural disasters (16,567) and 30.59% were man-made (technological) disasters (9,269). By examining this data, we can discern key trends and patterns in the frequency and spread of various disaster types. Asia experienced the highest number of disasters, with 10,786 events, representing 41.75% of all recorded events. Following Asia, Africa encountered 5,540 disasters (21.44%), and North America had 3,575 events (13.84%). Oceania reported the fewest disasters, with 730 events, accounting for just 2.83%.
Natural disasters predominantly occurred in Oceania, where they comprised 91.51% of all recorded disasters. In North America, natural disasters constituted 75.75% of the total, while Asia and Europe had slightly lower percentages, at 61.89% and 64.54% respectively. Africa had the smallest proportion of natural disasters at 56.21%.
In contrast, man-made (technological) disasters were most prevalent in Africa, accounting for 43.79% of all disasters on the continent. Asia followed with 38.11%, while Europe and South America reported 35.46% and 33.44% respectively. Oceania had the lowest percentage of man-made (technological) disasters, at just 8.49%. From the comprehensive data, it's evident that natural disasters dominate most continents, particularly in Oceania and North America. Despite Asia having the highest total number of disasters, it also has a significant proportion of man-made (technological) disasters (38.11%), highlighting the presence of technological accidents in the region. Africa’s notable percentage of man-made (technological) disasters (43.79%) may reflect various socio-economic factors and levels of infrastructure development (Table 1 and Figure 1).
An analysis of the geospatial distribution of both natural and man-made (technological) disasters across continents from 1900 to 2024 reveals significant insights into regional vulnerabilities and disaster management challenges.
Natural disasters vary widely across continents, each facing unique challenges and frequencies. Here is a detailed look at the occurrences of different natural disasters (Table 2 and Figure 2):
- a)
- Earthquakes: Asia recorded the highest number of earthquake events with 951 events (3.68% of the total), followed by Europe with 163 events (0.63%) and North America with 167 events (0.65%). Oceania experienced the fewest earthquakes, with 57 events (0.22%);
- b)
- Volcanic activity: volcanic activity was most prevalent in Asia with 112 events (0.43%), while North America and South America each reported 45 events (0.17%). Europe had the least volcanic activity, with 11 events (0.04%);
- c)
- Floods: most frequent were in Asia, accounting for 2,429 events (9.40%), with significant occurrences in Africa (1,240 events, 4.80%) and North America (688 events, 2.66%). Oceania had the fewest flood events, with 160 events (0.62%);
- d)
- Water-related disasters1: these disasters were predominantly seen in Asia with 703 events (2.72%), followed by Africa with 561 events (2.17%) and North America with 99 events (0.38%). Oceania experienced the least, with 14 events (0.05%);
- e)
- Mass movement (wet): Asia experienced the most mass movement (wet) events, with 440 events (1.70%), followed by South America with 155 events (0.60%) and Africa with 68 events (0.26%). Oceania had the fewest, with 18 events (0.07%);
- f)
- Drought: Africa reported the highest number of droughts with 361 events (1.40%), while Asia had 179 events (0.69%) and North America had 102 events (0.39%). Oceania recorded the least, with 34 events (0.13%);
- g)
- Extreme temperature: Europe led in extreme temperature events with 297 events (1.15%), followed by Asia with 200 events (0.77%) and North America with 70 events (0.27%). Oceania had the fewest events, with 8 events (0.03%);
- h)
- Storms: North America experienced the most storms with 1,338 events (5.18%), followed by Asia with 1,899 events (7.35%) and Europe with 576 events (2.23%). South America reported the least, with 105 events (0.41%);
- i)
- Epidemics: most common were in Africa with 899 events (3.48%), followed by Asia with 361 events (1.40%) and North America with 100 events (0.39%). Oceania recorded the fewest, with 24 events (0.09%);
- j)
- Wildfires: North America led in wildfire events with 145 events (0.56%), followed by Europe with 123 events (0.48%) and South America with 49 events (0.19%). Asia had the fewest wildfires, with 69 events (0.27%).
Man-made (technological) disasters, resulting from human activities, also show distinct patterns across continents (Table 2 and Figure 2):
- a)
- Air disasters: Asia reported the highest number of air disaster events with 312 events (1.21%), followed by Europe with 233 events (0.90%) and North America with 187 events (0.72%). Oceania had the fewest, with 21 events (0.08%);
- b)
- Chemical spills: North America recorded the most chemical spill events with 47 events (0.18%), while Asia reported 20 events (0.08%). Oceania had the least, with 1 incident (0.00%);
- c)
- Industrial and miscellaneous collapses: Asia led in industrial collapses with 88 events (0.34%) and miscellaneous collapses with 156 events (0.60%). Africa followed with 70 industrial collapses (0.27%) and 61 miscellaneous collapses (0.24%);
- d)
- Explosions: industrial explosions were most frequent in Asia with 509 events (1.97%), while miscellaneous explosions were also highest in Asia with 118 events (0.46%). Oceania had the fewest events in both categories, with 4 industrial explosions and 0 miscellaneous explosions;
- e)
- Fires (industrial and miscellaneous): North America recorded the most industrial fire events with 22 events (0.09%) and miscellaneous fire events with 111 events (0.43%). Oceania had the fewest events in both categories, with 0 industrial fires and 7 miscellaneous fires;
- f)
- Gas leaks and oil spills: gas leaks were most common in Asia with 38 events (0.15%), while oil spills were rare globally, with North America and Asia each reporting only a few events (3 and 2, respectively);
- g)
- Poisoning and radiation events: Poisoning events were highest in Asia with 50 events (0.19%), and radiation events were minimal worldwide, with North America and Asia each reporting only a few events (1 and 4, respectively);
- h)
- Rail and road disasters: road disasters were highly prevalent in Asia with 1,073 events (4.15%) and in Africa with 1,129 events (4.37%). Rail disasters were more common in Asia with 288 events (1.11%) and in Europe with 122 events (0.47%).
These detailed distributions reveal specific regional vulnerabilities and can inform targeted disaster risk reduction strategies. For instance, Asia's high frequency of both natural and man-made (technological) disasters highlights the need for comprehensive disaster management plans. Similarly, Africa's significant number of man-made (technological) disasters indicates a need for improved technological safety and infrastructure development (Table 2 and Figure 2).
3.1.2. In-Depth Analysis of Disaster Distribution by Country with Comprehensive Supporting Data
A comprehensive overview of the distribution of total, natural, and man-made (technological) disasters by country from 1900 to 2024 highlights the most disaster-prone nations and the types of disasters they frequently encounter. Total disasters encompass all recorded events, both natural and man-made, that have occurred within a given country. This measure provides insight into the overall disaster burden each country faces and helps identify areas that may require enhanced disaster preparedness and mitigation efforts (Table 3 and Figure 3):
- 1)
- China ranks first with a total of 1,996 disaster events, comprising 7.54% of the global total. Natural disasters make up 50.70% (1,012 events) of China's total, while man-made (technological) disasters account for 49.30% (984 events). The top five disasters in China include Industrial Accidents (15.08%), Storms (14.73%), Floods (14.53%), Droughts (14.28%), and Epidemics (14.23%);
- 2)
- India follows with 1,581 disaster events (5.97% of the global total). Natural disasters represent 49.08% (776 events), and man-made (technological) disasters 50.92% (805 events). The most frequent disasters are Epidemics (15.50%), Industrial Accidents (14.86%), Droughts (14.80%), Floods (14.29%), and Epidemics again (14.17%);
- 3)
- The USA is third with 1,513 disaster events (5.72% of the global total). Natural disasters dominate with 76.14% (1,152 events), and man-made (technological) disasters constitute 23.86% (361 events). The top disasters include Epidemics (15.27%), Industrial Accidents (14.87%), Droughts (14.47%), Floods (14.41%), and Wildfires (13.88%);
- 4)
- The Philippines ranks fourth with 938 disaster events (3.54% of the global total). Natural disasters account for 74.41% (698 events), and man-made (technological) disasters 25.59% (240 events). The leading disasters are Industrial Accidents (16.10%), Storms (14.71%), Droughts (14.50%), Epidemics (14.39%), and Wildfires (14.18%);
- 5)
- Indonesia is fifth with 878 disaster events (3.32% of the global total). Natural disasters make up 70.73% (621 events), while man-made (technological) disasters account for 29.27% (257 events). The most common disasters are Floods (16.40%), Earthquakes (15.15%), Droughts (15.03%), Epidemics (14.81%), and Wildfires (13.44%);
- 6)
- Bangladesh ranks sixth with 588 disaster events (2.22% of the global total). Natural disasters constitute 61.73% (363 events), and man-made (technological) disasters 38.27% (225 events). The top disasters include Floods (15.99%), Droughts (15.14%), Industrial Accidents (15.14%), Epidemics (14.97%), and Storms (13.27%);
- 7)
- Nigeria is seventh with 523 disaster events (1.98% of the global total). Man-made disasters are prevalent, accounting for 72.66% (380 events), while natural disasters make up 27.34% (143 events). The leading disasters are Wildfires (16.63%), Storms (16.44%), Industrial Accidents (14.72%), Epidemics (14.53%), and Droughts (13.38%);
- 8)
- Pakistan is eighth with 504 disaster events (1.90% of the global total). Natural disasters represent 50.40% (254 events), and man-made (technological) disasters 49.60% (250 events). The most frequent disasters include Floods (15.08%), Wildfires (15.08%), Storms (14.88%), Industrial Accidents (14.29%), and Epidemics (13.89%);
- 9)
- Mexico ranks ninth with 481 disaster events (1.82% of the global total). Natural disasters make up 63.20% (304 events), and man-made (technological) disasters 36.80% (177 events). The top disasters are Wildfires (17.88%), Epidemics (15.59%), Floods (15.18%), Droughts (13.51%), and Epidemics again (12.89%);
- 10)
- Japan is tenth with 464 disaster events (1.75% of the global total). Natural disasters are dominant, comprising 83.84% (389 events), while man-made (technological) disasters account for 16.16% (75 events). The leading disasters include Wildfires (17.24%), Earthquakes (15.73%), Storms (15.09%), Droughts (14.44%), and Industrial Accidents (13.79%).
Natural disasters include events such as earthquakes, floods, droughts, storms, and other environmental phenomena (Table 3 and Figure 3). These events are often influenced by geographical and climatic factors unique to each country. China ranks first in natural disasters with 1,012 events (50.70% of its total), primarily including Floods, Storms, and Droughts. The USA has the second-highest number of natural disaster events with 1,152 (76.14% of its total), with major events being Epidemics, Storms, and Floods. India follows with 776 natural disaster events (49.08% of its total), with frequent occurrences of Epidemics, Floods, and Droughts. The Philippines reports 698 natural disaster events (74.41% of its total), dominated by Storms, Floods, and Droughts. Indonesia has 621 natural disaster events (70.73% of its total), primarily Floods, Earthquakes, and Droughts. Bangladesh experiences 363 natural disaster events (61.73% of its total), with Floods, Droughts, and Storms being the most common. Japan reports 389 natural disaster events (83.84% of its total), with Wildfires, Earthquakes, and Storms as the leading types. Mexico has 304 natural disaster events (63.20% of its total), with Wildfires, Floods, and Epidemics being the most prevalent. Pakistan has 254 natural disaster events (50.40% of its total), mainly Floods, Wildfires, and Storms. Brazil reports 283 natural disaster events (61.26% of its total), with the most common being Epidemics, Wildfires, and Droughts (Table 3 and Figure 3).
Man-made (technological) disasters refer to events caused by human activity, such as industrial accidents, chemical spills, and other incidents related to technological failures or human error (Table 3 and Figure 3). Regarding that, China ranks first in man-made (technological) disasters with 984 events (49.30% of its total), dominated by Industrial Accidents and Chemical Spills. India has 805 man-made disaster events (50.92% of its total), with leading types being Industrial Accidents and Chemical Spills. Nigeria experiences 380 man-made disaster events (72.66% of its total), with the most common being Industrial Accidents and Fires. The USA reports 361 man-made disaster events (23.86% of its total), primarily Industrial Accidents and Chemical Spills. Indonesia has 257 man-made disaster events (29.27% of its total), mainly Industrial Accidents and Fires. Bangladesh records 225 man-made disaster events (38.27% of its total), with the top events being Industrial Accidents and Chemical Spills. Russia has 239 man-made disaster events (57.31% of its total), with common types including Industrial Accidents and Fires. Japan reports 75 man-made disaster events (16.16% of its total), primarily Industrial Accidents and Chemical Spills. Mexico experiences 177 man-made disaster events (36.80% of its total), dominated by Industrial Accidents and Fires. Pakistan has 250 man-made disaster events (49.60% of its total), with the leading types being Industrial Accidents and Fires (Table 3 and Figure 3).
These insights emphasize the importance of tailoring disaster risk reduction strategies to the specific needs and vulnerabilities of each country. For instance, countries with high natural disaster frequencies, such as Japan and Australia, may prioritize early warning systems and infrastructure resilience, while those with a higher prevalence of man-made (technological) disasters, like Nigeria and Egypt, may focus on industrial safety and emergency response protocols (Table 3 and Figure 3).
3.2. Temporal Distribution of Natural and Man-Made (Technological) Disasters
3.2.1. Yearly and Monthly Trends in Occurrences of Natural and Man-Made Disasters
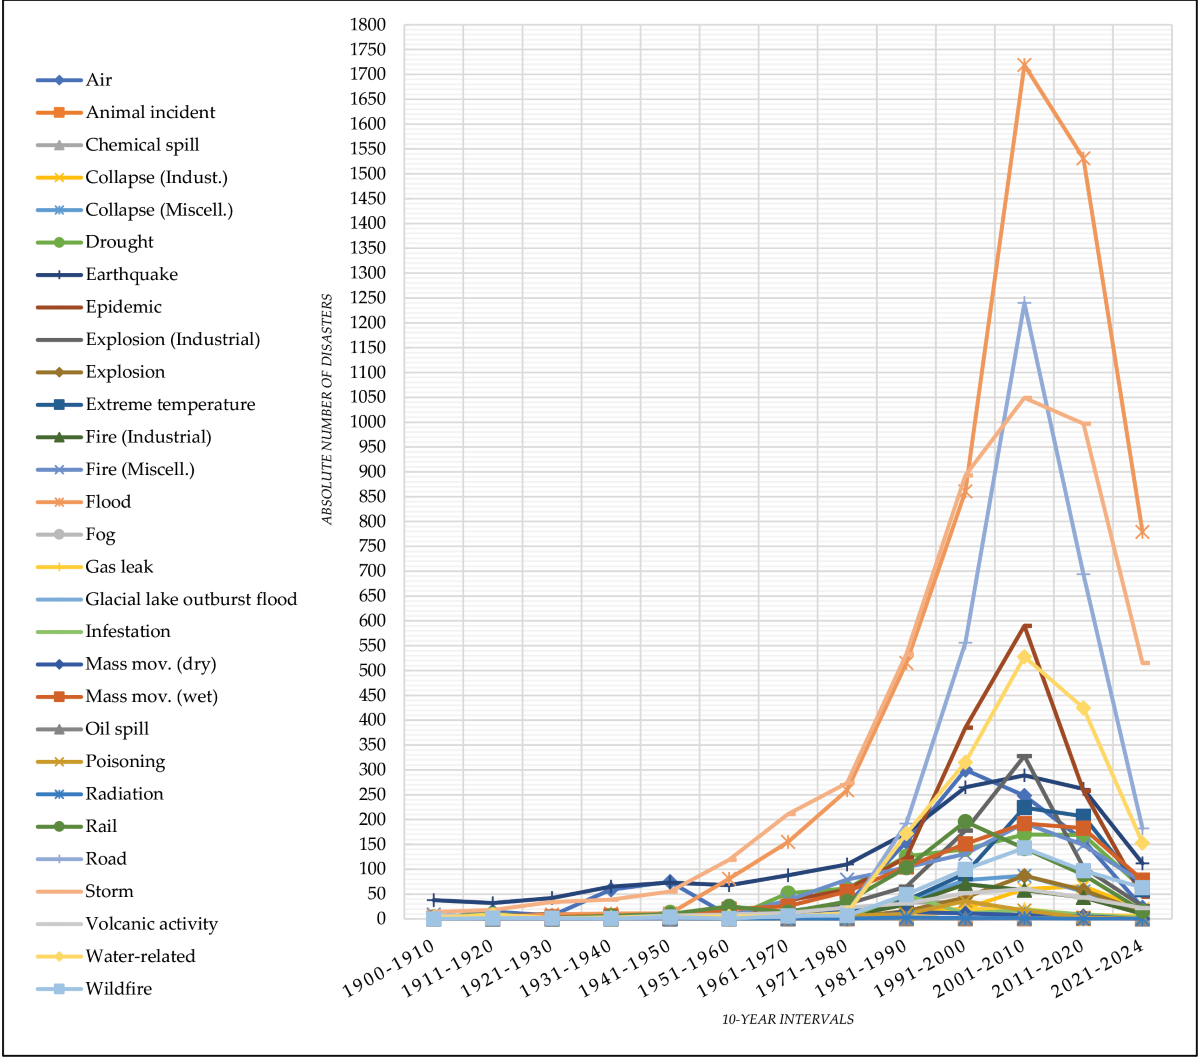
A temporal analysis of natural and man-made (technological) disasters over 10-year intervals from 1900 to 2024 highlights trends and changes in the frequency and distribution of disasters over time (Table 4 and Figure 4). This analysis offers insights into how disaster patterns have evolved and what factors may influence these trends:
- a)
- From 1900-1910, there were 101 total disaster events, with natural disasters comprising 78.22% (79 events) and man-made (technological) disasters 21.78% (22 events). The overall trend was stable, with no significant change in the rate of disasters;
- b)
- Between 1911-1920, a total of 121 disaster events were recorded, showing an increase of 19.57% from the previous decade. Natural disasters made up 64.46% (78 events), while man-made (technological) disasters accounted for 35.54% (43 events). This decade marks the beginning of an upward trend in disaster events;
- c)
- During the 1921-1930 period, the number of disaster events increased to 132, a 7.40% rise from the previous decade. Natural disasters constituted 80.30% (106 events), and man-made (technological) disasters 19.70% (26 events). The upward trend continued;
- d)
- From 1931-1940, there were 217 disaster events, representing a significant increase of 42.20%. Natural disasters made up 61.29% (133 events), while man-made (technological) disasters accounted for 38.71% (84 events). This decade saw a substantial rise in the number of disasters;
- e)
- In the 1941-1950 decade, the number of disasters increased to 281, an 11.73% rise from the previous decade. Natural disasters comprised 60.85% (171 events), and man-made (technological) disasters 39.15% (110 events). The trend of increasing disaster events persisted;
- f)
- From 1950-1960, there were 378 disaster events, marking a 10.05% increase. Natural disasters accounted for 82.01% (310 events), while man-made (technological) disasters were 17.99% (68 events). This decade continued the upward trend;
- g)
- The 1961-1970 period saw the number of disasters rise to 690, a 13.59% increase. Natural disasters constituted 86.09% (594 events), and man-made (technological) disasters 13.91% (96 events). The trend of increasing disasters continued;
- h)
- Between 1970-1980, a total of 1,144 disaster events were recorded, a 6.10% rise from the previous decade. Natural disasters made up 76.14% (871 events), while man-made (technological) disasters accounted for 23.86% (273 events). The upward trend in disaster frequency persisted;
- i)
- From 1981-1990, the number of disasters significantly increased to 2,718, a 5.33% rise from the previous decade. Natural disasters constituted 64.57% (1,755 events), and man-made (technological) disasters 35.43% (963 events). This decade saw a substantial rise in disaster events;
- j)
- In the 1991-2000 period, there were 4,995 disaster events, a 1.71% increase. Natural disasters made up 59.20% (2,957 events), while man-made (technological) disasters were 40.80% (2,038 events). The trend of increasing disasters continued;
- k)
- From 2001-2010, the number of disasters rose to 7,651, a 0.70% increase. Natural disasters accounted for 58.35% (4,464 events), while man-made (technological) disasters were 41.65% (3,187 events). This decade continued the upward trend;
- l)
- Between 2011-2020, the number of disasters decreased to 5,713, marking a decrease of 0.44%. Natural disasters made up 65.78% (3,758 events), and man-made (technological) disasters 34.22% (1,955 events). This decade saw the beginning of a downward trend;
- m)
The early 20th century (1900-1940) experienced relatively fewer disaster events with a stable but gradually increasing trend. The increase in man-made (technological) disasters began to become more noticeable during these periods. In addition, the mid-20th century (1940-1970) saw a significant rise in disaster events, with both natural and man-made (technological) disasters contributing to the increase.
Technological advancements and industrial activities likely influenced the rise in man-made (technological) disasters. Likewise, the late 20th century (1970-2000) experienced the highest increases in disaster events, particularly in the 1980s and 1990s. This period saw a peak in both natural and man-made (technological) disasters, indicating heightened vulnerability and exposure to disasters (Table 4 and Figure 4).
The early 21st century (2000-2020) continued the trend of increasing disaster events, although the rate of increase began to slow down by 2010. There was a noticeable shift with a higher proportion of man-made (technological) disasters. Conversely, the most recent decade (2021-2024) shows a decreasing trend in the number of disaster events, with a significant reduction in both natural and man-made (technological) disasters. This decrease may be attributed to improved disaster management practices, early warning systems, and increased global awareness of disaster risks (Table 4 and Figure 4).
Overall, the temporal analysis reveals a dynamic pattern of disaster occurrences, with significant increases in the mid to late 20th century followed by a gradual decline in recent years. These trends underscore the importance of continuous improvement in disaster risk reduction and management strategies to mitigate the impact of both natural and man-made (technological) disasters (Table 4 and Figure 4).
A temporal analysis of natural and man-made (technological) disasters over 5-year intervals from 1900 to 2024 reveals trends and changes in the frequency and distribution of disasters over shorter periods (Table 5 and Figure 5). This analysis offers more granular insights into how disaster patterns have evolved and what factors may influence these trends.
From 1900 to 1905, there were 43 total disaster events, with natural disasters comprising 81.40% (35 events) and man-made (technological) disasters 18.60% (8 events). The overall trend was stable, with no significant change in the rate of disasters. Moving into the next five years, a total of 58 disaster events were recorded between 1905 and 1910, showing a 34.88% increase from the previous period. Natural disasters made up 75.86% (44 events), while man-made (technological) disasters accounted for 24.14% (14 events). From 1910 to 1915, the number of disaster events rose to 61, a 5.17% rise from the previous period. Natural disasters constituted 77.05% (47 events), and man-made (technological) disasters 22.95% (14 events). The period from 1915 to 1920 saw a slight decrease to 60 disaster events, representing a 1.64% decline. Natural disasters made up 51.67% (31 events), while man-made (technological) disasters accounted for 48.33% (29 events).
From 1920 to 1925, the number of disaster events increased again to 61, a 1.67% rise from the previous period. Natural disasters comprised 77.05% (47 events), and man-made (technological) disasters 22.95% (14 events). Between 1925 and 1930, the number of disaster events rose to 71, marking a 16.39% increase. Natural disasters accounted for 83.10% (59 events), while man-made (technological) disasters were 16.90% (12 events). The period from 1930 to 1935 saw the number of disasters increase to 88, a 23.94% rise. Natural disasters constituted 77.27% (68 events), and man-made (technological) disasters 22.73% (20 events). From 1935 to 1940, a significant increase to 129 disaster events was recorded, a 46.59% rise. Natural disasters made up 50.39% (65 events), while man-made (technological) disasters accounted for 49.61% (64 events). Between 1940 and 1945, there were 160 disaster events, representing a 24.03% increase. Natural disasters comprised 48.12% (77 events), and man-made (technological) disasters 51.88% (83 events).
The period from 1945 to 1950 saw a decrease to 121 disaster events, marking a 24.38% decline. Natural disasters accounted for 77.69% (94 events), while man-made (technological) disasters were 22.31% (27 events). Between 1950 and 1955, there were 192 disaster events, a 58.68% increase. Natural disasters made up 81.77% (157 events), and man-made (technological) disasters 18.23% (35 events). From 1955 to 1960, the number of disasters slightly decreased to 186, a 3.12% decline. Natural disasters comprised 82.26% (153 events), and man-made (technological) disasters 17.74% (33 events). Between 1960 and 1965, the number of disasters increased to 238, a 27.96% rise. Natural disasters accounted for 85.71% (204 events), while man-made (technological) disasters were 14.29% (34 events). From 1965 to 1970, there were 452 disaster events, a significant 89.92% increase. Natural disasters made up 86.28% (390 events), and man-made (technological) disasters 13.72% (62 events).
The period from 1970 to 1975 saw a slight decrease to 435 disaster events, a 3.76% decline. Natural disasters constituted 77.24% (336 events), and man-made (technological) disasters 22.76% (99 events). From 1975 to 1980, there were 709 disaster events, marking a 62.99% increase. Natural disasters accounted for 75.46% (535 events), while man-made (technological) disasters were 24.54% (174 events). Between 1980 and 1985, the number of disasters increased to 1,009, a 42.31% rise. Natural disasters comprised 76.71% (774 events), and man-made (technological) disasters 23.29% (235 events). From 1985 to 1990, there were 1,709 disaster events, a significant 69.38% increase. Natural disasters made up 57.40% (981 events), and man-made (technological) disasters were 42.60% (728 events). Between 1990 and 1995, the number of disasters increased to 2,245, a 31.36% rise. Natural disasters constituted 58.53% (1,314 events), while man-made (technological) disasters were 41.47% (931 events).
The period from 1995 to 2000 saw a total of 2,750 disaster events, a 22.49% increase. Natural disasters accounted for 59.75% (1,643 events), and man-made (technological) disasters 40.25% (1,107 events). Between 2000 and 2005, the number of disasters rose to 4,039, marking a 46.87% increase. Natural disasters made up 56.72% (2,291 events), while man-made (technological) disasters were 43.28% (1,748 events). From 2005 to 2010, the number of disasters slightly decreased to 3,612, a 10.57% decline. Natural disasters constituted 60.16% (2,173 events), and man-made (technological) disasters 39.84% (1,439 events). Between 2010 and 2015, there were 2,928 disaster events, an 18.94% decrease. Natural disasters comprised 63.66% (1,864 events), and man-made (technological) disasters 36.34% (1,064 events). From 2015 to 2020, the number of disasters slightly decreased to 2,785, a 4.88% decline. Natural disasters made up 68.01% (1,894 events), while man-made (technological) disasters were 31.99% (891 events). Between 2020 and 2025, there were 2,323 disaster events, marking a 16.59% decline. Natural disasters constituted 75.20% (1,747 events), and man-made (technological) disasters 24.80% (576 events) (Table 5 and Figure 5).
As we mentioned before, the early 20th century experienced a steady increase in disaster events, with natural disasters predominating and the rise in man-made (technological) disasters becoming more noticeable. Significant increases during 1930-1945 highlight the impact of technological advancements and urbanization. Following this, the post-World War II period saw a significant rise in disaster events, peaking around 1940-1945, followed by a slight decline likely due to post-war recovery efforts and improvements in infrastructure and disaster management (Table 5 and Figure 5).
From 1965 to 1985, there was a rapid increase in the number of disaster events, especially natural disasters. This growth was driven by factors such as population growth, urbanization, and increased industrial activity, leading to heightened exposure and vulnerability to disasters. The period between 1985 and 2005 marked the peak and subsequent stabilization of disaster events. Both natural and man-made (technological) disasters saw significant increases, reflecting the complexities of modern societal and environmental challenges.
In recent years, specifically from 2005 to 2025, there has been a gradual decline in the number of disaster events, with notable decreases in both natural and man-made (technological) disasters. This trend may be attributed to improved disaster risk reduction strategies, advancements in early warning systems, and increased global awareness and preparedness for disaster risks (Table 5 and Figure 5). These insights highlight the dynamic nature of disaster occurrences over time, emphasizing the need for continuous adaptation and improvement in disaster management practices to address both natural and man-made challenges. The periods of significant increase and subsequent decline underscore the importance of sustained efforts in building resilient communities and mitigating disaster impacts.
In addition to the observed trends, several interesting insights and considerations can be drawn from the temporal analysis of natural and man-made (technological) disasters from 1900 to 2024. The mid-20th century saw a sharp increase in man-made (technological) disasters, particularly from 1940-1945 and 1985-2005, corresponding with significant technological and industrial advancements (Table 5 and Figure 5). This period indicates that rapid industrialization and technological development can contribute to a higher incidence of man-made (technological) disasters. The gradual decline in disaster events post-2005 suggests the effectiveness of global policies, international cooperation, and enhanced disaster risk reduction (DRR) frameworks, such as the Sendai Framework for Disaster Risk Reduction adopted in 2015.
Table 6 provides a detailed look at the total number of various natural and man-made (technological) disasters recorded each decade from 1900 to 2020. This analysis sheds light on the types and frequency of different disasters over time, offering insights into how disaster patterns have evolved and revealing trends in specific types of disasters.
Earthquakes were consistently reported, with the highest number in the 2000s at 289 events, likely due to increased seismic activity or better reporting. Also, epidemics saw a sharp increase in the 1990s with 385 events and peaked in the 2000s with 590 events, reflecting global health challenges. Industrial explosions peaked in the 2000s with 328 events, while miscellaneous explosions rose to 87 events in the same decade. Extreme temperatures saw a significant rise in the 2000s with 224 events, underscoring the effects of climate change. Industrial fires peaked in the 1990s with 70 events, whereas miscellaneous fires increased steadily, peaking in the 2000s with 193 events. Floods showed a dramatic rise, peaking in the 2000s with 1,719 events, indicating greater rainfall variability and extreme weather events.
Air disasters first appeared in the 1910s with 15 events, gradually increasing and peaking in the 1990s with 300 events. This trend reflects significant technological advancements and increased air traffic during that period. However, a noticeable decline occurred in the 2010s, with 158 events. Animal incidents were rarely recorded, with only one incident noted in the 2010s. Chemical spills were first documented in the 1960s with one event, rising to a peak in the 1990s with 34 events, then declining to 7 events in the 2010s. Industrial collapses began in the 1950s, reaching a peak in the 2000s with 60 events, while miscellaneous collapses steadily increased, peaking in the 2000s with 87 events. Droughts were consistently recorded across decades, peaking in the 2000s with 170 events, highlighting the impact of climate change.
Fog, gas leaks, and oil spills were rarely recorded but saw notable increases in certain decades, with gas leaks peaking in the 2000s with 20 events. Glacial lake outburst floods were infrequent, with a few incidents noted in recent years, pointing to climate change impacts. Infestations peaked in the 1980s with 48 events, showing occasional spikes due to ecological changes. Wet mass movements steadily increased, peaking in the 2000s with 192 events, reflecting more rainfall and landslide activity. Poisonings and radiation incidents were seldom recorded, with spikes such as poisoning incidents peaking in the 1990s with 36 events.
Road disasters significantly increased, peaking in the 2000s with 1,240 events due to more vehicular traffic, while rail disasters remained steady, peaking in the 1990s with 196 events. Storms consistently increased, peaking in the 2000s with 1,049 events, reflecting more frequent and intense storm activity due to climate change. Volcanic activity remained relatively stable with slight increases, peaking in the 2000s with 60 events. Water-related disasters rose significantly, peaking in the 2000s with 528 events, highlighting issues such as flooding and water scarcity. Wildfires showed a gradual rise, peaking in the 2000s with 143 events, reflecting higher temperatures and drier conditions (Table 6 and Figure 6).
The mid to late 20th century saw a sharp rise in industrial and technological disasters, reflecting industrial growth, urbanization, and increased technological activities. A noticeable increase in climate-related disasters such as floods, droughts, extreme temperatures, and wildfires in recent decades underscores the impact of climate change. The significant rise in the number of recorded disasters, particularly from the 1960s onwards, may also be due to improved reporting mechanisms, greater global awareness, and better disaster monitoring systems. The spike in epidemics and chemical spills in the late 20th and early 21st centuries highlights ongoing health and environmental challenges (Table 6 and Figure 6). Additionally, the recent decline in certain disasters, such as air disasters and some industrial incidents, suggests improvements in disaster management, safety protocols, and preparedness measures.
Table 7 provides a detailed breakdown of the total number of different natural and man-made (technological) disasters recorded in 5-year intervals from 1900 to 2024. Air disasters began to be recorded from 1910-1914 with one event, peaking in the 1985-1989 period with 128 events. This trend shows significant technological advancements and increased air traffic contributing to these numbers. There is a noticeable decline in recent periods, with 23 events recorded in 2021-2024. Animal incidents are rarely recorded, with only one incident noted in the 2010-2014 period (Figure 7).
Chemical spills were first recorded in the 1965-1969 period with one event, peaking in the 1995-1999 period with 23 events. A decline is observed in recent periods, with no events recorded in 2020-2024. Industrial collapses began in the 1950-1954 period, peaking in the 2000-2004 period with 20 events. Miscellaneous collapses show a steady increase, peaking in the 1995-1999 period with 45 events.
Droughts were recorded consistently across periods, peaking in the 2000-2004 period with 96 events, showing the impact of climate change and variability. Earthquakes were consistently recorded, with the highest number in the 2000-2004 period at 174 events, reflecting increased seismic activity or improved reporting. Epidemics saw a sharp increase in the 1990-1994 period with 103 events and peaking in the 2000-2004 period with 360 events, reflecting global health challenges.
Industrial explosions peaked in the 2000-2004 period with 175 events, while miscellaneous explosions rose in the 2000-2004 period with 55 events. Extreme temperatures saw a significant rise in the 2000-2004 period with 109 events, highlighting the effects of climate change. Industrial fires peaked in the 1995-1999 period with 37 events, while miscellaneous fires increased consistently, peaking in the 2000-2004 period with 107 events.
Floods experienced a dramatic increase, peaking in the 2000-2004 period with 769 events, indicating higher rainfall variability and extreme weather events. Fog, gas leaks, and oil spills were rarely recorded, with notable increases in specific periods, such as gas leaks peaking in the 1995-1999 period with 10 events. Glacial lake outburst floods were rarely recorded, with a few incidents noted in the 2020-2024 period, indicating climate change impacts.
Infestations peaked in the 1985-1989 period with 48 events, showing occasional spikes due to ecological changes. Wet mass movements showed a steady increase, peaking in the 1995-1999 period with 93 events, reflecting increased rainfall and landslide activity. Poisonings and radiation incidents were rarely recorded, with occasional spikes such as poisoning incidents peaking in the 1990-1994 period with 22 events (Table 7 and Figure 7).
Road disasters showed a significant rise, peaking in the 2000-2004 period with 725 events, reflecting increased vehicular traffic. Rail disasters showed a steady number with a peak in the 1990-1994 period at 93 events. Storms consistently increased, peaking in the 2000-2004 period with 540 events, reflecting more frequent and intense storm activity due to climate change. Volcanic activity had a relatively stable number of events with slight increases, peaking in the 2005-2009 period with 35 events.
Water-related disasters saw a significant increase, peaking in the 2000-2004 period with 254 events, highlighting water-related issues such as flooding and water scarcity. Wildfires showed a gradual increase with a peak in the 2000-2004 period at 88 events, reflecting increased temperatures and dry conditions (Table 7 and Figure 7).
Table 8 offers a detailed seasonality analysis, showcasing the number of occurrences of various disaster types by month. This analysis highlights the monthly distribution and trends of different disasters, providing insights into how these events fluctuate throughout the year (Table 8 and Figure 8). Air disasters reach their peak in July with 744 events, suggesting increased air traffic or weather-related factors during this month. Overall, the trend is above average, with a total of 1,091 events, accounting for 4.123% of all recorded disasters. Conversely, animal incidents are rarely recorded, with only one incident noted in November, resulting in a below average trend. Chemical spills also peak in July with 86 events, possibly due to seasonal industrial activities or increased transportation, but the overall trend remains below average with 108 events, making up 0.408% of all recorded disasters. Industrial collapses peak in November with 21 events, while miscellaneous collapses hit their highest point in July with 181 events, both showing a below average trend.
Earthquakes peak in March with 316 events, likely due to seasonal tectonic activity, with an above average (AA) trend totaling 1,617 events, which represent 6.11% of all disasters. Droughts are most frequent in February, peaking at 326 events and reflecting seasonal climatic patterns, yet their overall trend is below average (BA) with a total of 813 events, or 3.072% of all recorded disasters. Epidemics also show a significant peak in July with 701 events, pointing to seasonal health challenges. This results in an above average trend with 1,526 events, making up 5.766% of all recorded disasters (Table 8 and Figure 8).
Industrial explosions are most frequent in July, peaking at 411 events, while miscellaneous explosions also see increased activity during the summer months, both maintaining a below average trend. Extreme temperatures peak in July with 280 events, highlighting the impact of summer heatwaves. Despite this, the overall trend is below average, with 652 events constituting 2.464% of all disasters. Fires, both industrial and miscellaneous, also peak in July, with 121 and 440 events respectively, yet both trends are below average. Floods show a dramatic increase in July with 2,072 events, coinciding with monsoon and heavy rainfall periods. This results in an above average trend, totaling 5,941 events, or 22.449% of all recorded disasters (Table 8 and Figure 8).
Fog, gas leaks, and oil spills are infrequent, with specific peaks in certain months but generally below average trends. Glacial lake outburst floods are rarely recorded, with isolated incidents in January, April, and October. Infestations peak in July with 71 events, indicating seasonal ecological changes, yet the overall trend remains below average. Wet mass movements are most common in July, peaking at 427 events, which reflects seasonal rainfall and landslide activities, whereas dry mass movements are rarely recorded, showing no clear seasonal trend. Poisonings and radiation incidents are also rare, with peaks in specific months but generally below average trends.
Road disasters peak in July with 1,326 events, reflecting increased summer travel, while rail disasters also reach their highest point in July with 453 events. The trend for road disasters is above average, whereas rail disasters trend below average.
Storms peak in July with 2,146 events, indicating seasonal storm activity, resulting in an above-average trend with a total of 4,751 events, or 17.953% of all recorded disasters. Volcanic activity peaks in July with 120 events, showing a slight seasonal trend but remaining below average.
Water-related disasters peaked in July with 718 events, highlighting issues like floods and water scarcity. This results in an above-average trend, totalling 1,635 events, which represent 6.178% of all recorded disasters.
Wildfires also peak in July with 239 events, reflecting dry and hot summer conditions. However, the overall trend is below average, with a total of 475 events, making up 1.795% of all recorded disasters.
The seasonality analysis reveals how climate and weather patterns significantly influence disaster occurrences, with many events peaking during the summer months due to extreme weather conditions. Disasters such as air incidents, earthquakes, epidemics, road accidents, storms, and water-related disasters tend to be more frequent during certain times of the year, showing above-average trends.
For instance, many disaster types, including floods, storms, and fires, reach their highest numbers in July. This pattern reflects the impact of summer weather conditions like monsoon rains, heat waves, and dry spells. The peaks in industrial and miscellaneous disasters during the summer months suggest that increased industrial activities, travel, and other human activities contribute to higher disaster frequencies during this period.
According to the monthly analysis, the highest number of disasters is recorded in July with 9,135 incidents. This month is particularly prone to disasters due to significant spikes in air disasters (744), floods (2,072), storms (2,146), and road disasters (1,326). The heightened summer activities and extreme weather conditions contribute to the high frequency of disasters during this period. Increased travel, intense heat, and seasonal storms make July especially disaster-prone (Table 8 and Figure 8).
Following July, March records a total of 1,921 disasters. This month is notable for the high number of earthquake occurrences (316) and floods (390). Seasonal weather changes, including the transition from winter to spring, likely contribute to these numbers. Shifting temperatures can lead to increased seismic activity and the onset of spring floods.
January ranks next with 1,819 disasters. This month is characterized by a high number of flood occurrences (592), alongside significant events like earthquakes (197) and extreme temperatures (98). Winter conditions and the start of the year contribute to these disaster occurrences, with heavy rainfall and cold temperatures playing a major role.
In August, 1,702 disasters were recorded, with notable numbers of floods (400), storms (217), and wildfires (239). The continuation of summer conditions, including heatwaves and droughts, contributes to this high disaster rate. Hot and dry conditions often lead to wildfires, while summer storms can cause severe flooding.
February sees 1,158 disasters, with significant occurrences of floods (304), earthquakes (92), and extreme temperatures (81). The winter season and its associated weather patterns, including heavy rains and cold snaps, are likely causes of these disasters. The month is also characterized by winter storms and potential flooding from snowmelt.
In June, there are 1,048 disasters, with high numbers of floods (192), storms (95), and road disasters (135). The beginning of summer brings increased human activities and changing weather conditions, contributing to the disaster frequency. The month also marks the onset of hurricane season in some regions, leading to an increase in storm-related events.
October records 1,029 disasters, with notable flood events (374) and storms (218). The transitional weather of autumn, including increased rainfall and the tail end of hurricane season, contributes to the high number of disasters. Cooler temperatures and changing atmospheric conditions also play a role (Table 8 and Figure 8).
September has 878 disasters, marked by significant flood events (403) and storm occurrences (191). This reflects the continued impact of summer weather and the height of hurricane season. The end of summer often brings severe storms and heavy rains, leading to widespread flooding. In April, there are 876 disasters, with high earthquake occurrences (190) and significant flood numbers (306). The seasonal transition from winter to spring brings increased rainfall and seismic activity. Melting snow and spring rains can lead to flooding, while the earth's tectonic movements are influenced by temperature changes.
November sees 858 disasters, with considerable numbers of floods (356) and road disasters (166). The late autumn weather, including heavy rains and early winter storms, contributes to the disaster frequency. The month also marks the beginning of winter travel, increasing the risk of road accidents. December records 742 disasters, with notable flood occurrences (262) and significant earthquake numbers (145). Winter conditions, including heavy rainfall and seismic activity, contribute to these disasters. The holiday season also sees increased travel and associated risks.
The seasonality analysis reveals that July is the most disaster-prone month, driven by summer-related weather conditions and increased human activities. March and January also show high disaster occurrences, reflecting the impact of seasonal transitions. Floods and storms are the most common disasters across all months, with significant peaks during the summer and transitional seasons. By understanding these seasonal disaster patterns, we can improve preparedness and mitigation strategies. Focusing efforts during peak months can help reduce the impact of these events and enhance response capabilities. This knowledge about the timing and frequency of various disasters can guide resource allocation, emergency planning, and public awareness campaigns, ensuring that communities are better equipped to handle the increased risk during critical periods of the year (Table 8 and Figure 8).
3.2.2. Yearly and Monthly Trends in Consequences of Natural and Man-Made Disasters
Providing a comprehensive analysis, Table 9 examines the impacts of natural and man-made (technological) disasters across decades, detailing fatalities, injuries, and economic losses. This examination underscores the evolving human and economic effects of these disasters, highlighting significant trends over time.
In the early 20th century, particularly from 1900 to 1910, natural disasters caused a staggering number of fatalities, totalling 4,472,477, while injuries and economic losses were minimal. Man-made disasters during this period resulted in 5,766 fatalities but had negligible economic impact.
Moving into the 1910-1920 decade, fatalities from natural disasters slightly decreased to 3,334,004, with injuries and economic losses remaining relatively low. However, man-made (technological) disasters began to show a more significant impact, with 10,752 fatalities and 9,306 injuries (Table 9 and Figure 9).
The period from 1920 to 1930 saw a dramatic increase in fatalities from natural disasters, reaching 8,561,918, alongside a rise in injuries and economic losses. Man-made disasters, although still less impactful than natural ones, contributed to 7,139 fatalities and 1,596 injuries. The following decade, 1930-1940, saw a reduction in natural disaster fatalities to 4,629,968 but an increase in economic losses to $3,342,000. Man-made disasters continued to cause fatalities, albeit at a lower rate.
During the mid-20th century, from 1940 to 1950, natural disasters resulted in 3,878,897 fatalities and 69,329 injuries, with economic losses continuing to rise. Man-made disasters showed a notable increase in fatalities and injuries, reflecting the growing industrialization and technological advancements of the time. The 1950-1960 decade witnessed a further increase in economic losses from natural disasters to $6,090,480, although fatalities decreased to 2,127,944. Man-made disasters remained a significant cause of fatalities and injuries (Table 9 and Figure 9).
The late 20th century, particularly from 1960 to 1990, experienced significant increases in economic losses due to natural disasters. The 1960-1970 period saw $18,793,072 in economic losses, which further escalated to $183,523,629 in the 1980-1990 period. This era also marked substantial fatalities and injuries from both natural and man-made (technological) disasters. For instance, the 1980-1990 decade recorded 58,382 fatalities and 159,620 injuries from man-made (technological) disasters, indicating the increasing severity of industrial accidents (Table 9 and Figure 9).
Entering the early 21st century, the period from 2000 to 2020 witnessed the highest economic losses due to natural disasters, peaking at $1,706,627,174 in the 2010-2020 decade. This period also saw high numbers of fatalities and injuries, reflecting the intensified impact of disasters. Man-made disasters continued to significantly contribute to fatalities and injuries, with 97,166 fatalities and 89,617 injuries recorded in the 2000-2010 period. Recent trends from 2020 to 2030 show a significant reduction in fatalities from natural disasters compared to earlier periods, dropping to 199,314. However, economic losses remain substantial, amounting to $861,127,190. Man-made disasters continue to contribute significantly to fatalities and injuries, with 15,132 fatalities and 24,593 injuries recorded in this period, highlighting the persistent risk from technological and industrial activities (Table 9 and Figure 9).
Table 10 provides an in-depth look at the impacts of natural and man-made (technological) disasters over 5-year periods, detailing fatalities, injuries, and economic losses. In the early 20th century, particularly from 1900 to 1905, natural disasters resulted in significant fatalities, totaling 1,523,244, with minimal injuries and economic losses. This trend persisted into subsequent periods, with notable spikes in fatalities during 1905-1910 (2,949,233) and 1915-1920 (3,022,829). Despite these high death tolls, economic losses remained relatively low during these years.
As we move into the mid-20th century, there were fluctuations in fatalities and economic losses. The 1920-1925 period recorded the highest fatalities of this era, with 5,065,612 lives lost due to natural disasters. Economic losses began to rise significantly during 1930-1935, reaching $1,629,000. During this time, man-made (technological) disasters also began to show a more substantial impact, particularly in the 1945-1950 period, which saw 5,957 fatalities. The late 20th century experienced a dramatic increase in economic losses from natural disasters, peaking at $264,087,752 in the 1990-1995 period. This era also saw substantial fatalities and injuries from both natural and man-made (technological) disasters. The increasing industrialization and urbanization during these years contributed to the heightened impact of such events (Table 10 and Figure 10).
Entering the early 21st century, we observed the highest economic losses due to natural disasters, with the 2011-2015 period reaching $871,742,990. This time frame also saw a significant number of fatalities and injuries, reflecting the intensified impact of disasters. Technological advancements and population growth likely contributed to these escalating figures. Recent trends from 2021 to 2024 show a notable reduction in fatalities from natural disasters compared to earlier periods, although economic losses remain high at $861,127,190. Man-made disasters continue to have a significant impact, with 15,132 fatalities and 24,593 injuries recorded in this period. These insights emphasize the persistent financial and human toll of disasters, underscoring the importance of improving disaster risk reduction strategies to mitigate these impacts (Table 10 and Figure 10).
Table 11 offers a detailed summary of the consequences of different types of natural and man-made (technological) disasters from 1900 to 2024. Regarding that, air disasters resulted in 50,689 deaths (0.154%), 7,620 injuries (0.068%), and $144.1 million in economic losses (0.003%). While these disasters had a significant human impact, the economic consequences were relatively minimal. Chemical spills, though responsible for fewer deaths (610 or 0.002%), led to substantial injuries (8,773 or 0.078%) and affected over 652,981 people (0.008%), causing significant economic losses amounting to nearly $1.2 billion (0.027%). Industrial and miscellaneous collapses had notable impacts as well, with industrial collapses resulting in 7,099 deaths (0.022%) and $1.335 billion in economic losses (0.03%), and miscellaneous collapses causing 14,830 deaths (0.045%) and $283.8 million in economic losses (0.006%).
Droughts emerged as the deadliest disaster type, accounting for 11,734,272 deaths (35.54%) and affecting nearly 3 billion individuals (34.146%), with economic losses totalling $257.58 billion (5.728%). Earthquakes also had a substantial impact, causing 2,407,717 deaths (7.293%) and $975.79 billion in economic losses (21.701%), along with 2,945,052 injuries (26.35%) and 228 million people affected (2.628%). Epidemics were significant as well, resulting in 9,622,343 deaths (29.14%) and 2,836,719 injuries (25.38%), though they had minimal economic impact.
Extreme temperatures led to 256,413 deaths (0.777%), 2,066,936 injuries (18.49%), and $69.47 billion in economic losses (1.545%). Fires, both industrial and miscellaneous, had considerable impacts, with miscellaneous fires causing 36,590 deaths (0.111%) and $3.49 billion in economic losses (0.078%), while industrial fires led to $2.61 billion in economic losses (0.058%). Floods were highly impactful, causing 7,011,404 deaths (21.23%), 1,398,042 injuries (12.50%), and affecting nearly 4 billion people (46.039%), with economic losses totalling $1.01 trillion (22.415%).
Mass movements, both dry and wet, varied in impact. Wet mass movements caused 68,636 deaths (0.208%) and $11.35 billion in economic losses (0.252%), while dry mass movements had a smaller impact. Miscellaneous accidents had notable consequences, causing 14,279 deaths (0.043%) and 40,666 injuries (0.364%). Oil spills had minimal impact, whereas poisoning incidents led to 3,578 deaths (0.011%) and 54,442 injuries (0.487%). Although radiation incidents were rare, they caused significant economic losses ($2.8 billion or 0.062%).
Storms were another major disaster type, causing 1,418,647 deaths (4.297%), 1,411,425 injuries (12.62%), and $1.97 trillion in economic losses (43.748%), reflecting their widespread and severe impact. Volcanic activity led to 86,935 deaths (0.263%) and $6.33 billion in economic losses (0.141%), affecting over 10 million individuals (0.116%). Water-related disasters caused 111,237 deaths (0.337%) and $77.9 million in economic losses (0.002%), while wildfires resulted in 5,366 deaths (0.016%), 15,989 injuries (0.143%), and significant economic losses totaling $136.37 billion (3.033%) (Table 11 and Figure 11).
When ranking the impact of disasters by fatalities, droughts emerge as the deadliest, causing the highest number of deaths at 11,734,272, which accounts for 35.54% of all disaster-related fatalities. Following closely are epidemics, responsible for 9,622,343 deaths or 29.14%. Floods come in third, resulting in 7,011,404 deaths (21.23%), while earthquakes are fourth, causing 2,407,717 deaths (7.293%). Rounding out the top five, storms contribute to 1,418,647 deaths, making up 4.297% of the total (Table 11 and Figure 11).
In terms of injuries, earthquakes lead with the highest number, causing 2,945,052 injuries, representing 26.35% of all disaster-related injuries. Epidemics follow closely with 2,836,719 injuries (25.38%). Extreme temperatures rank third, causing 2,066,936 injuries (18.49%). Floods result in 1,398,042 injuries (12.50%), and storms cause 1,411,425 injuries, making up 12.62% of the total.
Looking at the number of people affected by disasters, floods have the most significant impact, affecting nearly 4 billion individuals (3,997,629,671), which is 46.039% of the total affected population. Droughts come in second, impacting almost 3 billion people (2,964,996,768), or 34.146%. Storms affect over 1.27 billion people (1,277,565,968; 14.713%), making them the third most impactful. Earthquakes are fourth, affecting over 228 million individuals (228,214,673; 2.628%), while extreme temperatures affect over 107 million people (107,678,810; 1.24%).
Regarding economic losses, storms cause the most significant financial damage, with total losses amounting to approximately $1.97 trillion (43.748%). Floods rank second, causing over $1 trillion in economic losses (1,007,889,805,000; 22.415%). Earthquakes follow, with losses of approximately $975.79 billion (21.701%). Droughts come in fourth, with financial damages totalling around $257.58 billion (5.728%), and wildfires are fifth, causing economic losses of about $136.37 billion (3.033%). Table 11 and Figure 11).
This analysis underscores the profound impact of various disaster types, with droughts and floods being the most devastating in terms of human lives, while storms and earthquakes cause the highest economic losses.
4. Discussion
The analysis of the distribution of natural and man-made (technological) disasters across continents from 1900 to 2024 reveals notable trends and patterns. Asia has experienced the highest number of disasters, accounting for 41.75% of all recorded events. This is due to the continent's vast and diverse geography, high population density, and rapid industrialization. These factors contribute to both the frequency and impact of disasters in the region. For example, Asia's high rate of earthquakes and floods necessitates robust mitigation strategies focusing on seismic resilience and flood management [83]. Additionally, the significant proportion of man-made (technological) disasters (38.11%) highlights the need for improved industrial safety and infrastructure development in rapidly urbanizing areas [84].
Africa, with 21.44% of the total disasters, has the highest proportion of man-made (technological) disasters (43.79%). This high percentage is linked to socio-economic factors such as inadequate infrastructure, governance challenges, and political instability, which exacerbate the risks and impacts of technological accidents and conflicts [85]. Natural disasters in Africa, such as droughts, also reflect the continent's vulnerability to climate change, underscoring the necessity for integrated approaches addressing both natural and man-made (technological) hazards [86]. Furthermore, North America, which accounts for 13.84% of the total events, shows a predominance of natural disasters (75.75%), particularly storms and wildfires. This pattern is consistent with the region's exposure to climatic extremes and varied topography, making it susceptible to a range of natural hazards [87]. The data suggests that strengthening early warning systems and enhancing community resilience to natural disasters should be priorities for North American disaster management strategies [88].
Oceania, despite having the fewest total disasters (2.83%), has the highest proportion of natural disasters (91.51%). This reflects the region's unique geographical features, including numerous islands and coastal areas, which are highly vulnerable to natural events such as cyclones and tsunamis [89]. The low incidence of man-made (technological) disasters (8.49%) suggests that existing technological and industrial activities are relatively well-managed, though continued vigilance and regulation are necessary [90]. Europe's balanced distribution of natural (64.54%) and man-made (35.46%) disasters reflects its diverse risk profile, influenced by both environmental factors and high levels of industrialization. The region's experience with extreme temperatures and floods highlights the importance of adapting to climate change impacts while maintaining stringent safety standards for technological and industrial operations [91]. South America's disaster profile, with 66.56% natural disasters and 33.44% man-made (technological) disasters, highlights the continent's exposure to natural hazards such as floods and storms, alongside challenges related to industrial safety and urban infrastructure. The findings suggest a dual focus on environmental sustainability and industrial risk management to mitigate disaster impacts in the region [92].
The temporal analysis reveals an increasing trend in disaster occurrences until the 2000s, followed by a decline in the recent decade. This pattern may be attributed to advancements in disaster risk management practices, improved early warning systems, and greater global awareness of disaster risks [93]. However, the continuing high frequency of certain disaster types, such as floods and technological accidents, indicates the need for sustained efforts in these areas [94].
The examination of disaster distribution—both natural and man-made (technological)—across countries from 1900 to 2024 offers critical insights into the varying disaster profiles and vulnerabilities faced by different nations. This understanding is essential for developing disaster risk reduction strategies tailored to the specific needs and challenges of each country [95]. Countries such as China and India are at the top of the list for disaster-prone nations, a reflection of their vast geographic areas, large populations, and rapid industrial growth [96]. The significant occurrence of both natural and man-made (technological) disasters in these countries highlights the critical need to integrate disaster risk reduction into national development plans [97]. Additionally, this issue extends beyond national borders, presenting a global international challenge and responsibility [98]. Disasters do not stop at national borders, making this a substantial political, economic, and diplomatic challenge [99].
Natural disasters are particularly prevalent in countries like the USA, the Philippines, and Japan due to their geographical and climatic conditions [100]. The USA's high frequency of natural disasters, dominated by events such as storms and wildfires, reflects the country's exposure to extreme weather patterns and varied topography [101]. Similarly, the Philippines and Japan, located in seismically active regions and frequently hit by typhoons, face significant natural disaster risks [102]. These findings emphasize the need for robust early warning systems, resilient infrastructure, and effective emergency response mechanisms [103].
Countries with a high proportion of man-made (technological) disasters, such as Nigeria and Egypt, often face these events due to factors like industrialization, inadequate regulatory frameworks, and socio-economic challenges[104]. The high incidence of industrial accidents and chemical spills in these regions highlights the urgent need to improve industrial safety standards and enhance regulatory oversight [104], as well as to assess safety culture - the way we actually do things - e.g. by using maturity models [105]. Additionally, the socio-economic context, including political instability and lack of infrastructure, exacerbates the risk and impact of technological disasters [106].
The varied disaster profiles across different countries indicate the necessity for region-specific disaster management strategies [107]. For instance, countries with a high frequency of natural disasters should focus on enhancing climate resilience and investing in disaster-resilient infrastructure. In contrast, nations with a significant number of technological disasters should prioritize industrial safety measures, regulatory reforms, and capacity building in emergency response [108].
The temporal analysis shows an increasing trend in disaster occurrences until the early 2000s, followed by a decline, suggesting improvements in global disaster management practices [109]. However, the continuing high frequency of certain disaster types, such as floods and industrial accidents, indicates that ongoing efforts are necessary to address these persistent risks [110].
The temporal analysis of natural and man-made (technological) disasters over 10-year intervals from 1900 to 2024 reveals significant trends and shifts in the frequency and distribution of disasters, providing valuable insights into how these patterns have evolved over time. During the early 20th century (1900-1940), disaster events were relatively few, with a stable yet gradually increasing trend. From 1900 to 1910, the rate of disaster occurrences remained stable, predominantly driven by natural disasters. However, the period from 1910 to 1920 saw a noticeable increase in total disaster events, marking the onset of an upward trend. This trend persisted through the 1920s and 1930s, with both natural and man-made (technological) disasters contributing to the rise. Technological advancements and increased industrial activities during these decades likely played a role in the rise of man-made (technological) disasters [111].
Rapid urbanization and population growth, especially in the latter half of the 20th century, have increased the exposure and vulnerability of populations to disasters [112]. Urban areas, with dense populations and critical infrastructure, often face higher risks, leading to the observed peaks in disaster events during these periods [113]. The improvement in early warning systems and communication technologies has likely contributed to the decrease in disaster events post-2005, enabling better preparedness, timely evacuations, and effective disaster response, thus reducing the overall impact and frequency of disasters [114]. The changing communication strategies for warnings (e.g. impact warning) also attempt to achieve more adequate prevention measures by their target group [115]. In the meantime, great efforts are being made to make warnings comprehensible and to for-mulate vulnerabilities and recommendations for action [116,117,118,119].
The mid-20th century (1940-1970) experienced a significant surge in disaster events. The decade from 1940 to 1950 witnessed a substantial rise in both natural and man-made (technological) disasters. This increase is attributed to the rapid industrialization and urbanization that characterized the post-World War II era. The growth of industrial activities and technological development led to higher incidences of industrial accidents and other man-made (technological) disasters [120,121]. However, they also lead to new risks and the need to redefine socially accepted risk [122]. Additionally, the rise in natural disasters could be linked to environmental changes and improved reporting and documentation of such events [123]. The influence of climate change is evident in the increasing frequency and severity of natural disasters such as floods, storms, and extreme temperatures in the late 20th and early 21st centuries [123]. Climate change adaptation and mitigation strategies are crucial to addressing these challenges and reducing future disaster risks [124]. Additionally, different regions experience varying types of disasters, influenced by geographical, climatic, and socio-economic factors [125]. This highlights the importance of localized DRR strategies tailored to specific regional needs and vulnerabilities, rather than a one-size-fits-all approach [126,127].
The late 20th century (1970-2000) marked the highest increases in disaster events, particularly in the 1980s and 1990s. This period saw a peak in both natural and man-made (technological) disasters, indicating heightened vulnerability and exposure to various hazards. The 1980s, in particular, witnessed a dramatic rise in disaster occurrences, reflecting the impact of global environmental changes, increased population density, and further industrialization. The 1990s continued this trend, with significant contributions from both natural events like floods and technological incidents such as industrial explosions.The early 21st century (2000-2020) continued the trend of increasing disaster events, although the rate of increase began to slow down by the 2010s. This period saw a higher proportion of man-made (technological) disasters, reflecting ongoing industrial growth and technological advancements [127].
However, the most recent decade (2020-2030) shows a decreasing trend in the number of disaster events, with a significant reduction in both natural and man-made (technological) disasters. This decline may be attributed to improved disaster management practices, advancements in early warning systems, and increased global awareness of disaster risks. The trend of decreasing disaster events in recent years underscores the importance of building community resilience and capacity [128]. Community-based DRR initiatives, education, and training programs have empowered local populations to better prepare for and respond to disasters [129]. Enhanced data collection, reporting mechanisms, and increased transparency in documenting disaster events have contributed to a more accurate and comprehensive understanding of disaster trends [130]. This improved data availability facilitates better analysis, planning, and decision-making [131].
The analysis of the consequences of natural and man-made (technological) disasters over 5-year intervals from 1900 to 2024 provides significant insights into how the impacts of these events on human lives and economies have evolved. Throughout the 20th century and into the 21st century, natural disasters have consistently caused substantial fatalities [132], with significant fluctuations in the number of deaths over different periods. Economic losses due to natural disasters have also increased markedly over the decades, reflecting the growing complexity and interconnectedness of modern societies [133]. The increased urbanization and industrialization in the mid-20th century contributed to higher economic losses as infrastructure and economic activities expanded [134].
Man-made disasters, while initially causing fewer fatalities and economic losses, began to have a more pronounced impact as industrialization and technological advancements progressed [135]. The mid-20th century marked a period where the consequences of industrial accidents and technological failures became more evident, contributing to a notable increase in fatalities and injuries [136]. This trend continued into the late 20th century, with significant economic impacts arising from these disasters. The late 20th and early 21st centuries saw dramatic increases in economic losses from both natural and man-made (technological) disasters. This period reflects the dual influence of technological advancements and environmental changes [137]. On one hand, industrial growth and technological development introduced new risks and vulnerabilities, leading to severe industrial accidents and technological failures [138]. On the other hand, climate change and environmental degradation have exacerbated the frequency and intensity of natural disasters, resulting in higher economic losses and a greater number of affected individuals [139].
In recent years, there has been a noticeable reduction in fatalities from natural disasters, which can be attributed to improved disaster management practices [132], early warning systems [140], and global initiatives aimed at reducing disaster risk [141]. Despite this progress, economic losses remain substantial, underscoring the ongoing vulnerability of modern societies to both natural and man-made (technological) disasters [142]. Several key factors have influenced these temporal trends: the growth of industries and urban areas has increased the potential for industrial accidents and technological failures, contributing to the rising impact of man-made (technological) disasters [143]; the increasing frequency and severity of climate-related disasters, such as floods, droughts, and extreme temperatures, reflect the broader impacts of climate change[144]; while technological growth has brought numerous benefits, it has also introduced new risks, leading to significant industrial accidents and chemical spills [145].
The increase in recorded disaster impacts from the 1960s onwards can be partly attributed to better reporting mechanisms and increased global awareness of disaster risks [146,147,148]. The decline in fatalities from natural disasters in recent years highlights the effectiveness of global policies and disaster risk reduction frameworks, which have enhanced preparedness and resilience [149,150].
This study acknowledges several limitations that may impact the generalizability and accuracy of its findings: a) while the EM-DAT database is extensive, it may contain inconsistencies or gaps, particularly for earlier periods or less documented regions, which could affect the accuracy of historical trends; b) certain regions, especially those with less robust disaster reporting systems, may have underreported disaster occurrences and impacts, potentially introducing biases in the analysis; c) the broad time span of the analysis, from 1900 to 2024, encompasses changes in data collection methods, reporting standards, and technological advancements, which may result in inconsistencies within the dataset; d) categorizing disasters as either natural or man-made might oversimplify the complex interactions and overlapping nature of some events, such as those exacerbated by human activities like climate change (e.g. the influence of natural hazards/disasters on the occurrence of technological disasters; e) estimating economic losses from disasters involves considerable uncertainties due to varying methodologies, inflation adjustments, and the inherent difficulties in capturing indirect and long-term economic effects; f) measuring the human impact, in terms of fatalities and injuries, is challenging due to differences in reporting standards, cultural perceptions, and the availability of reliable health and demographic data.
5. Recommendations
To effectively tackle the various challenges and impacts identified in this study, the following Table 12 presents a comprehensive set of recommendations aimed at enhancing disaster risk reduction (DRR) strategies. These measures are categorized by their implementation level—national or local—and their short-term and long-term applicability. This structured approach ensures that both immediate and sustainable actions are taken to mitigate the risks and impacts of natural and man-made (technological) disasters.
Table 12 provides a detailed overview of the recommended measures, stressing the importance of integrating these strategies into national development plans, enhancing early warning systems, promoting climate resilience, and strengthening industrial safety. Furthermore, it underscores the significance of community-based disaster management, investment in research and development, and fostering public-private partnerships to build a more resilient society.
6. Conclusions
The analysis of geospatial and temporal patterns of natural and man-made (technological) disasters from 1900 to 2024 provides significant insights into these events' global distribution and impact. The research reveals that Asia is the most affected continent, with the highest number of disasters, indicating the need for robust risk mitigation strategies, particularly concerning seismic resilience and flood management. Africa faces a high percentage of man-made (technological) disasters, emphasizing the need for improved industrial safety and infrastructure, while natural disasters such as droughts are exacerbated by climate change. North America predominantly records natural disasters, particularly storms and wildfires, highlighting the importance of strengthening early warning systems and community resilience. Oceania, despite having the fewest total disasters, reports a high proportion of natural disasters due to its unique geographical characteristics. Europe shows a balanced distribution of natural and man-made (technological) disasters, underscoring the importance of adapting to climate change and maintaining high industrial safety standards. South America faces significant natural disasters such as floods and storms, alongside challenges related to industrial safety.
Temporal analysis indicates an increasing trend in disaster occurrences until the 2000s, followed by a decline in the last decade, possibly due to advancements in disaster risk management practices, improved early warning systems, and greater global awareness of disaster risks. Despite progress, the high frequency of certain disaster types, such as floods and technological accidents, indicates the need for continuous efforts in these areas. A detailed analysis of the consequences of natural and man-made (technological) disasters over five-year intervals provides significant insights into the evolution of these events' impacts on human lives and economies. Natural disasters have consistently caused substantial fatalities and economic losses, while man-made (technological) disasters, initially less significant, have become more pronounced with industrialisation and technological development. Recent trends show a reduction in fatalities from natural disasters, attributed to improved disaster management practices, early warning systems, and global initiatives aimed at reducing disaster risk.
Regarding the testing of hypotheses, the first hypothesis was confirmed, as natural disasters accounted for 69.41% of the total number of disasters, causing greater economic losses and human casualties compared to technical disasters. The second hypothesis was supported by significant geographical differences in the frequency and type of disasters, with Asia being the most affected continent, and Africa having the highest percentage of technical disasters. The third hypothesis was validated through the identification of significant temporal changes in disaster frequency, peaking in the periods 1990-2000 and 2000-2010, while the last decade saw a decline in the total number of events. The fourth hypothesis was proven by seasonal variations, with floods peaking in January and July, and storms being most frequent in June and October. Finally, the fifth hypothesis was confirmed as different types of disasters had varying impacts on economic losses and human resources, with earthquakes and storms causing the greatest economic losses, while droughts and floods were the most deadly for human lives. These findings underscore the need for tailored disaster risk management strategies in different regions.
This study contributes to the understanding of the global distribution and impact of natural and man-made (technological) disasters through a historical context. It provides a foundation for further research in disaster risk reduction (DRR), particularly in the context of climate change and urbanization. Identifying specific geographical and socio-economic factors contributing to the frequency and severity of disasters can help develop theoretical models and predictive tools for risk management. The study's results can serve as a reference point for future quantitative and qualitative analyses exploring the effectiveness of various DRR strategies and policies.
The findings have direct implications for policymakers and practitioners in disaster risk management. It is recommended that countries with high natural disaster risks, such as China, India, and the USA, focus efforts on strengthening infrastructure resilience, improving early warning systems, and enhancing emergency response plans. For regions with high man-made disaster risks, such as Nigeria and Egypt, improving industrial safety, regulatory frameworks, and emergency response capacities is crucial. The study highlights the need for integrated approaches that combine natural and technological risk management. It is recommended to develop comprehensive strategies encompassing prevention, preparedness, response, and recovery, focusing on reducing vulnerabilities and enhancing community resilience to disasters. Additionally, implementing educational programs and raising public awareness about disaster risks can significantly contribute to reducing the negative impacts of these events.
Author Contributions
V.M.C. conceived the original idea for this study and developed the study design. V.M.C. and R.R. contributed to the analyzed and interpreted the data. T.L. made a significant contribution by drafting the introduction. V.M.C., R.R., and B.A. drafted the discussion, and V.M.C., T.L., and R.R. composed the conclusions. V.M.C., T.L., R.R., and B.A. critically reviewed the data analysis and contributed to revising and finalizing the manuscript. All authors have read and agreed to the published version of the manuscript.
Funding
This research was funded by the Scientific–Professional Society for Disaster Risk Management, Belgrade (https://upravljanje-rizicima.com/, accessed on 20 July 2024) and the International Institute for Disaster Research (https://idr.edu.rs/, accessed on 20 July 2024), Belgrade, Serbia.
Data Availability Statement
Data are contained within the article.
Conflicts of Interest
The authors declare no conflicts of interest.
References
- Cvetković, Vladimir, and Vanja Šišović. "Understanding the Sustainable Development of Community (Social) Disaster Resilience in Serbia: Demographic and Socio-Economic Impacts." Sustainability 16, no. 7 (2024): 2620. [CrossRef]
- Cvetković, Vladimir M., Goran Grozdanić, Miško Milanović, Slobodan Marković, and Tin Lukić. "Seismic Hazard Resilience in Montenegro: A Comprehensive Qualitative Analysis of Local Preparedness and Response Mechanisms." (2024).
- Cvetković, Vladimir. "Essential Tactics for Disaster Protection and Resque." Scientific-Professional Society for Disaster Risk Management, Belgrade, 2024.
- Cvetković, Vladimir, Neda Nikolić, and Tin Lukić. "Exploring Students' and Teachers' Insights on School-Based Disaster Risk Reduction and Safety: A Case Study of Western Morava Basin, Serbia." Safety 10, no. 2 (2024): 2024040472. [CrossRef]
- Tanasić, Jasmina, and Vladimir Cvetković. "The Efficiency of Disaster and Crisis Management Policy at the Local Level: Lessons from Serbia." Scientific-Professional Society for Disaster Risk Management, Belgrade, 2024.
- Cvetković, V. Disaster Risk Management. Belgrade: Scientific-Professional Society for Disaster Risk Management.
- UNISDR. "UNISDR, Terminology on Disaster Risk Terminology on Disaster Risk Reduction." 2017.
- Cvetkovic, Vladimir M., Nemanja Boškovic, and Adem Öcal. "Individual Citizens' Resilience to Disasters Caused by Floods: A Case Study of Belgrade." Academic Perspective Procedia 4, no. 2 (2021): 9-20. [CrossRef]
- Perić, Jovana, and Cvetković Vladimir. "Demographic, Socio-Economic and Phycological Perspective of Risk Perception from Disasters Caused by Floods: Case Study Belgrade." International Journal of Disaster Risk Management 1, no. 2 (2019).
- Cvetković, Vladimir, Paolo Tarolli, Giulia Roder, Aleksandar Ivanov, Kevin Ronan, Adem Ocam, and Rana Kutub. "Citizens Education About Floods: A Serbian Case Study." Paper presented at the VII International scientific conference Archibald Reiss days 2017.
- Cvetković, V., G. Roder, A. Öcal, P. Tarolli, and S. Dragićević. "The Role of Gender in Preparedness and Response Behaviors Towards Flood Risk in Serbia." International Journal of Environmental Research and Public Health 15, no. 12 (2018): 2761. [CrossRef]
- Iftikhar, A., and J. Iqbal. "The Factors Responsible for Urban Flooding in Karachi (a Case Study of Dha)." International Journal of Disaster Risk Management 5, no. 1 (2023): 81-103. [CrossRef]
- Starosta, D. "Raised under Bad Stars: Negotiating a Culture of Disaster Preparedness." International Journal of Disaster Risk Management 5, no. 2 (2023): 1-16. [CrossRef]
- Zareian, M. "Social Capitals and Earthquake: A Study of Different Districts of Tehran, Iran." International Journal of Disaster Risk Management 5, no. 2 (2023): 17-28. [CrossRef]
- Islam, F. "Anticipated Role of Bangladesh Police in Disaster Management Based on the Contribution of Bangladesh Police During the Pandemic Covid 19." International Journal of Disaster Risk Management 5, no. 2 (2023): 45-56. [CrossRef]
- Ulal, S. Saha S. Gupta S., and D. Karmakar. "Hazard Risk Evaluation of Covid-19: A Case Study." International Journal of Disaster Risk Management 5, no. 2 (2023): 81-101.
- El-Mougher, M. M., D. S. A. M. Abu Sharekh, M. R. F. Abu Ali, and D. E. A. A. M. Zuhud. "Risk Management of Gas Stations That Urban Expansion Crept into in the Gaza Strip." International Journal of Disaster Risk Management 5, no. 1 (2023): 13-27.
- Cvetković, Vladimir, Saša Romanić, and Hatidža Beriša. "Religion Influence on Disaster Risk Reduction: A Case Study of Serbia." International Journal of Disaster Risk Management 5, no. 1 (2023): 66-81. [CrossRef]
- Cvetković, Vladimir M., Aleksandar Dragašević, Darko Protić, Bojan Janković, Neda Nikolić, and Predrag Milošević. "Fire Safety Behavior Model for Residential Buildings: Implications for Disaster Risk Reduction." International Journal of Disaster Risk Reduction (2022): 102981. [CrossRef]
- Mohammed, El-Mougher, and Jarour Maysaa. "International Experiences in Sheltering the Syrian Refugees in Germany and Turkey." International Journal of Disaster Risk Management 4, no. 1 (2022): 1-15.
- Sergey, Kachanov, and Nigmetov Gennadiy. "Methodology for the Risk Monitoring of Geological Hazards for Buildings and Structures." International Journal of Disaster Risk Management 4, no. 1 (2022): 41-49.
- Dukiya, Jehoshaphat Jaiye, and Oghenah Benjamine. "Building Resilience through Local and International Partnerships, Nigeria Experiences." International Journal of Disaster Risk Management 3, no. 2 (2021): 11-24.
- Cvetković, Vladimir M., Jasmina Tanasić, Adem Ocal, Želimir Kešetović, Neda Nikolić, and Aleksandar Dragašević. "Capacity Development of Local Self-Governments for Disaster Risk Management." International Journal of Environmental Research and Public Health 18, no. 19 (2021): 10406. [CrossRef]
- Thennavan, Edison, Ganapathy Ganapathy, S. Chandrasekaran, and Ajay %J International Journal of Disaster Risk Management Rajawat. "Probabilistic Rainfall Thresholds for Shallow Landslides Initiation – a Case Study from the Nilgiris District, Western Ghats, India." 2, no. 1 (2020).
- Kaur, Baljeet %J International Journal of Disaster Risk Management. "Disasters and Exemplified Vulnerabilities in a Cramped Public Health Infrastructure in India." 2, no. 1 (2020).
- Al-ramlawi, A, M El-Mougher, and M %J International Journal of Disaster Risk Management Al-Agha. "The Role of Al-Shifa Medical Complex Administration in Evacuation & Sheltering Planning." 2, no. 2 (2020).
- Chakma, U. K, A Hossain, K Islam, G. T Hasnat, and Kabir %J International Journal of Disaster Risk Management. "Water Crisis and Adaptation Strategies by Tribal Community: A Case Study in Baghaichari Upazila of Rangamati District in Bangladesh." 2, no. 2 (2020).
- Smith, Keith. Environmental Hazards: Assessing Risk and Reducing Disaster. New York: Routledge, 2013. [CrossRef]
- Mearns, Kathryn. "Chapter Four - Human Factors in the Chemical Process Industries." In Methods in Chemical Process Safety, edited by Faisal Khan, 149–200: Elsevier, 2017.
- Mannan, Sam, ed. Lees' Loss Prevention in the Process Industries (Third Edition). Burlington: Butterworth-Heinemann, 2005.
- Perrow, Charles. Normal Accidents: Living with High Risk Technologies: Princeton University Press, 2011.
- Han, Aiai, Wen Yuan, Wu Yuan, Jianwen Zhou, Xueyan Jian, Rong Wang, and Xinqi Gao. "Mining Spatial-Temporal Frequent Patterns of Natural Disasters in China Based on Textual Records." Information 15, no. 7 (2024): 372. [CrossRef]
- Ghosh, Chandan. "Gis and Geospatial Studies in Disaster Management." In International Handbook of Disaster Research, 701-08: Springer, 2023.
- Wang, Xiaowei. "Temporal Changes and Spatial Pattern Evolution of Marine Disasters in China from 1736 to 1911 Based on Geospatial Models: A Multiscalar Analysis." Journal of Coastal Research 108, no. SI (2020): 83-88. [CrossRef]
- Wei, Cuixia, Bing Guo, Hailing Zhang, Baomin Han, Xiangshen Li, Huihui Zhao, Yuefeng Lu, Chao Meng, Xiangzhi Huang, and Wenqian Zang. "Spatial–Temporal Evolution Pattern and Prediction Analysis of Flood Disasters in China in Recent 500 Years." Earth Science Informatics (2022): 1-15. [CrossRef]
- Rahmi, Rahmi, Hideo Joho, and Tetsuya Shirai. "An Analysis of Natural Disaster-Related Information-Seeking Behavior Using Temporal Stages." Journal of the Association for Information Science and Technology 70, no. 7 (2019): 715-28.
- Ruiz, Itxaso, Sérgio H. Faria, and Marc B. Neumann. "Climate Change Perception: Driving Forces and Their Interactions." Environmental science & policy 108 (2020): 112-20. [CrossRef]
- Sättele, Martina. Quantifying the Reliability and Effectiveness of Early Warning Systems for Natural Hazards. Technische Universität München, 2015.
- Shen, Guoqiang, and Seong Nam Hwang. "Spatial–Temporal Snapshots of Global Natural Disaster Impacts Revealed from Em-Dat for 1900-2015." Geomatics, Natural Hazards and Risk (2019). [CrossRef]
- Summers, J. K., A. Lamper, C. McMillion, and L. C. Harwell. "Observed Changes in the Frequency, Intensity, and Spatial Patterns of Nine Natural Hazards in the United States from 2000 to 2019." Sustainability 14, no. 7 (2022): 4158. [CrossRef]
- Tian, Cong-shan, Yi-ping Fang, Liang Emlyn Yang, and Chen-jia Zhang. "Spatial-Temporal Analysis of Community Resilience to Multi-Hazards in the Anning River Basin, Southwest China." International Journal of Disaster Risk Reduction 39 (2019): 101144. [CrossRef]
- Vibhas, Sukhwani, Adu Gyamfi Bismark, Zhang Ruiyi, Mohammed AlHinai Anwaar, and Shaw %J International Journal of Disaster Risk Management Rajib. "Understanding the Barriers Restraining Effective Operation of Flood Early Warning Systems." 1, no. 2 (2019): In press.
- Wagner, Melissa A., Soe W. Myint, and Randall S. Cerveny. "Geospatial Assessment of Recovery Rates Following a Tornado Disaster." IEEE transactions on geoscience and remote sensing 50, no. 11 (2012): 4313-22. [CrossRef]
- Makwana, Nikunj. "Disaster and Its Impact on Mental Health: A Narrative Review." Journal of family medicine and primary care 8, no. 10 (2019): 3090-95. [CrossRef]
- Augusterfer, Eugene F., Richard F. Mollica, and James Lavelle. "Leveraging Technology in Post-Disaster Settings: The Role of Digital Health/Telemental Health." Current Psychiatry Reports 20 (2018): 1-8. [CrossRef]
- Stanley, Sharon A. R., Susan Bulecza, and Sameer Vali Gopalani. "Psychological Impact of Disasters on Communities." Annual Review of Nursing Research 30, no. 1 (2012): 89-123. [CrossRef]
- Buszta, Julia, Katarzyna Wójcik, Celso Augusto Guimarães Santos, Krystian Kozioł, and Kamil Maciuk. "Historical Analysis and Prediction of the Magnitude and Scale of Natural Disasters Globally." Resources 12, no. 9 (2023): 106. [CrossRef]
- Mijalković, Saša, and V. Cvetković. "Viktimizacija Ljudi Prirodnim Katastrofama: Geoprostorna I Vremenska Distribucija Posledica1." Temida 17, no. 4 (2014): 19-42.
- Neelakantan, R. "Geo-Environment and Related Disasters–a Geo-Spatial Approach." J. Environ. Nanotechnol 8, no. 1 (2019): 01-05.
- Zheng, Zhuo, Yanfei Zhong, Junjue Wang, Ailong Ma, and Liangpei Zhang. "Building Damage Assessment for Rapid Disaster Response with a Deep Object-Based Semantic Change Detection Framework: From Natural Disasters to Man-Made Disasters." Remote Sensing of Environment 265 (2021): 112636. [CrossRef]
- Cvetković, Vladimir., and J. Martinović. "Inovative Solutions for Flood Risk Management." International Journal of Disaster Risk Management 2, no. 2 (2020).
- Nikolić, Neda, Vladimir Cvetković, and Aleksandar Ivanov. "Human Resource Development for Environmental Security and Emergency Management." Scientific-Professional Society for Disaster Risk Management, Belgrade, 2023.
- Cvetković, Vladimir, Milica Čvorović, and Hatidža Beriša. "The Gender Dimension of Vulnerability in Disaster Caused by the Corona Virus (COVID-19)." NBP 28, no. 2 (2023): 32-54.
- Cvetković, V. M., S. Romanić, and H. Beriša. "Religion Influence on Disaster Risk Reduction: A Case Study of Serbia." International Journal of Disaster Risk Management 5, no. 1 (2023): 66-81. [CrossRef]
- Cvetković, Vladimir. "A Predictive Model of Community Disaster Resilience Based on Social Identity Influences (Modersi)." International Journal of Disaster Risk Management 5, no. 2 (2023): 57-80. [CrossRef]
- Cvetković, Vladimir, Boban Milojković, and Dragan Stojković. "Analysis of Geospatial and Temporal Distribution of Earthquakes as Natural Disasters." Vojno delo 66, no. 2 (2014): 166-85. [CrossRef]
- Cvetković, Vladimir M., Jasmina Gačić, and Vladimir Jakovljević. "Geospatial and Temporal Distribution of Forest Fires as Natural Disasters." Vojno delo 68, no. 2 (2016): 108-27. [CrossRef]
- Ivanov, Aleksandar, and Vladimir Cvetković. "Prirodne Katastofe - Geoprostorna i vremenska distribucija (Natural Disasters - Geospatial and Temporal Distribution)." Fakultet za bezbednost, Skopje, 2016.
- Cvetković, V., and D. Stojković. "Analysis of Geospatial and Temporal Distribution of Storms as a Natural Disaster." In International Scientific Conference - Criminalistic Education, Situation and Perspectives 20 Years after Vodinelic. Skopje: Faculty of Security, University St. Kliment Ohridski - Bitola in collaboration with Faculty of detectives and Security, FON University, 2015.
- Cvetković, Vladimir. "Geoprostorna i Vremenska Distribucija Vulkanskih Erupcija." NBP–Žurnal za kriminalistiku i pravo 2, no. 2014 (2014): 150-65.
- Cvetković, Vladimir M., and Vanja Šišović. "Community Disaster Resilience in Serbia." Scientific-Professional Society for Disaster Risk Management, Belgrade, 2024.
- Cvetković, V., & Filipović, M. (2017). Risk management of natural disasters: Concepts and Methods. International Scientific Conference “New directions and challenges in transforming societies through a multidisciplinary approach” 6th June, 2017, MIT University, City Gallery, Skopje, Republic of Macedonia.
- Cvetković, Vladimir "Innovative Solutions for Disaster Early Warning and Alert Systems: A Literary Review." Paper presented at the XI International scientific conference Archibald Reiss days, November 9-10, 2021At: Belgrade, University of Criminal Investigation and Police Studies 2021.
- Cools, Jan, Demetrio Innocenti, and Sarah O’Brien. "Lessons from Flood Early Warning Systems." Environmental science & policy 58 (2016): 117-22.
- Cvetković, Vladimir. "Innovative Solutions for Disaster Early Warning and Alert Systems: A Literary Review." 2021.
- Cvetković, Vladimir, and Marko Nikolić. "The Role of Social Networks in Disaster Risk Reduction: A Case Study Belgrade (Uloga Društvenih Mreža U Smanjenju Rizika Od Katastrofa: Studija Slučaja Beograd)." Bezbednost 61, no. 3 (2021): 25-42.
- Cvetković, Vladimir M., Marina Filipović, Slavoljub Dragićević, and Ivan Novković. "The Role of Social Networks in Disaster Risk Reduction." Eight International Scientific Conference “Archibald Reiss Days” , Belgrade, October 2–3, 2018.
- Cvetković, Vladimir, and Aleksandra Nikolić. "The Role of Social Media in the Process of Informing the Public About Disaster Risks." Preprint (2023): 10-20944. [CrossRef]
- Myint, S. W., M. Yuan, R. S. Cerveny, and C. Giri. "Categorizing Natural Disaster Damage Assessment Using Satellite-Based Geospatial Techniques." Natural Hazards and Earth System Sciences 8, no. 4 (2008): 707-19. [CrossRef]
- Cvetković, Vladimir, Jasmina Tanasić, Adem Ocal, Mirjana Živković-Šulović, Nedeljko Ćurić, Stefan Milojević, and Snežana Knežević. "The Assessment of Public Health Capacities at Local Self-Governments in Serbia." Lex localis - Journal of Local Self Government 21, no. 4 (2023): 1201-34. [CrossRef]
- Cvetković, Vladimir M. "A Predictive Model of Community Disaster Resilience Based on Social Identity Influences (Modersi)." International Journal of Disaster Risk Management 5, no. 2 (2023): 57-80. [CrossRef]
- Cvetković, Vladimir, and Jelena Planić. "Earthquake Risk Perception in Belgrade: Implications for Disaster Risk Management." International Journal of Disaster Risk Management 4, no. 1 (2022): 69-89. [CrossRef]
- Kragh Andersen, Per, Maja Pohar Perme, Hans C. van Houwelingen, Richard J. Cook, Pierre Joly, Torben Martinussen, Jeremy M. G. Taylor, Michal Abrahamowicz, and Terry M. Therneau. "Analysis of Time-to-Event for Observational Studies: Guidance to the Use of Intensity Models." Statistics in medicine 40, no. 1 (2021): 185-211.
- Melkov, Dmitry, Vladislav Zaalishvili, Olga Burdzieva, and Aleksandr Kanukov. "Temporal and Spatial Geophysical Data Analysis in the Issues of Natural Hazards and Risk Assessment (in Example of North Ossetia, Russia)." Applied Sciences 12, no. 6 (2022): 2790. [CrossRef]
- Chen, Ning, Zhige Zhang, Yingchao Ma, An Chen, and Xiaohui Yao. "Assessment and Clustering of Temporal Disaster Risk: Two Case Studies of China." Intelligent Decision Technologies 16, no. 1 (2022): 247-61. [CrossRef]
- Coronese, Matteo, Francesco Lamperti, Klaus Keller, Francesca Chiaromonte, and Andrea Roventini. "Evidence for Sharp Increase in the Economic Damages of Extreme Natural Disasters." Proceedings of the National Academy of Sciences 116, no. 43 (2019): 21450-55. [CrossRef]
- Cvetković, Vladimir, and Slavoljub Dragicević. "Spatial and Temporal Distribution of Natural Disasters." Journal of the Geographical Institute Jovan Cvijic, SASA 64, no. 3 (2014): 293-309. [CrossRef]
- Chen, Baoxin, Kan Chen, Xi Wang, and Xu Wang. "Spatial and Temporal Distribution Characteristics of Rainstorm and Flood Disasters around Tarim Basin." Polish journal of environmental studies 31, no. 3 (2022). [CrossRef]
- Herrera, Daissy, and Edier Aristizábal. "Spatial and Temporal Distribution of Precipitation and Its Relationship with Landslides within the Aburrá Valley, Northern Colombian Andes." Copernicus Meetings, 2024.
- Peng, Yu, Shaofen Long, Jiangwen Ma, Jingyi Song, and Zhengwei Liu. "Temporal-Spatial Variability in Correlations of Drought and Flood During Recent 500 Years in Inner Mongolia, China." Science of the Total Environment 633 (2018): 484-91. [CrossRef]
- Martínez–Álvarez, Francisco, and A. Morales–Esteban. "Big Data and Natural Disasters: New Approaches for Spatial and Temporal Massive Data Analysis." 38-39: Elsevier, 2019. [CrossRef]
- Ge, Xingtong, Yi Yang, Jiahui Chen, Weichao Li, Zhisheng Huang, Wenyue Zhang, and Ling Peng. "Disaster Prediction Knowledge Graph Based on Multi-Source Spatio-Temporal Information." Remote Sensing 14, no. 5 (2022): 1214. [CrossRef]
- Kumar, Amit, Dominik H. Lang, Hasibullah Ziar, and Yogendra Singh. "Seismic Vulnerability Assessment of Non-Structural Components-Methodology, Implementation Approach and Impact Assessment in South and Central Asia." Journal of Earthquake Engineering 26, no. 3 (2022): 1300-24.
- Nawaz, Ahsan, Xing Su, Qaiser Mohi Ud Din, Muhammad Irslan Khalid, Muhammad Bilal, and Syyed Adnan Raheel Shah. "Identification of the H&S (Health and Safety Factors) Involved in Infrastructure Projects in Developing Countries-a Sequential Mixed Method Approach of Olmt-Project." International Journal of Environmental Research and Public Health 17, no. 2 (2020): 635. [CrossRef]
- Eriksson, Per Erik, Stefan Olander, Henrik Szentes, and Kristian Widén. "Managing Short-Term Efficiency and Long-Term Development through Industrialized Construction." Construction management and Economics 32, no. 1-2 (2014): 97-108. [CrossRef]
- Busby, Joshua W., Todd G. Smith, and Nisha Krishnan. "Climate Security Vulnerability in Africa Mapping 3.0." Political Geography 43 (2014): 51-67. [CrossRef]
- Forzieri, Giovanni, Luc Feyen, Simone Russo, Michalis Vousdoukas, Lorenzo Alfieri, Stephen Outten, Mirco Migliavacca, Alessandra Bianchi, Rodrigo Rojas, and Alba Cid. "Multi-Hazard Assessment in Europe under Climate Change." Climatic Change 137 (2016): 105-19. [CrossRef]
- Garcia, Carolina, and Carina J. Fearnley. "Evaluating Critical Links in Early Warning Systems for Natural Hazards." Environmental Hazards 11, no. 2 (2012): 123-37. [CrossRef]
- Satyanarayana, Behara, Tom Van der Stocken, Guillaume Rans, Kodikara Arachchilage Sunanda Kodikara, Gaétane Ronsmans, Loku Pulukkuttige Jayatissa, Mohd-Lokman Husain, Nico Koedam, and Farid Dahdouh-Guebas. "Island-Wide Coastal Vulnerability Assessment of Sri Lanka Reveals That Sand Dunes, Planted Trees and Natural Vegetation May Play a Role as Potential Barriers against Ocean Surges." Global Ecology and Conservation 12 (2017): 144-57. [CrossRef]
- Pidgeon, Nick, and Mike O'Leary. "Man-Made Disasters: Why Technology and Organizations (Sometimes) Fail." Safety Science 34, no. 1-3 (2000): 15-30. [CrossRef]
- Wilby, Robert L., and Rod Keenan. "Adapting to Flood Risk under Climate Change." Progress in physical geography 36, no. 3 (2012): 348-78. [CrossRef]
- Tseng, Chun-Pin, and Cheng-Wu Chen. "Natural Disaster Management Mechanisms for Probabilistic Earthquake Loss." Natural Hazards 60 (2012): 1055-63. [CrossRef]
- Glago, Frank Jerome. "Flood Disaster Hazards; Causes, Impacts and Management: A State-of-the-Art Review." Natural hazards-impacts, adjustments and resilience (2021): 29-37.
- Munawar, Hafiz Suliman, Ahmed W. A. Hammad, and S. Travis Waller. "Remote Sensing Methods for Flood Prediction: A Review." Sensors 22, no. 3 (2022): 960. [CrossRef]
- Raikes, Jonathan, Timothy F. Smith, Claudia Baldwin, and Daniel Henstra. "Disaster Risk Reduction and Climate Policy Implementation Challenges in Canada and Australia." Climate Policy 22, no. 4 (2022): 534-48. [CrossRef]
- Pucher, John, Zhong-ren Peng, Neha Mittal, Yi Zhu, and Nisha Korattyswaroopam. "Urban Transport Trends and Policies in China and India: Impacts of Rapid Economic Growth." Transport reviews 27, no. 4 (2007): 379-410. [CrossRef]
- Carby, Barbara. "Integrating Disaster Risk Reduction in National Development Planning: Experience and Challenges of Jamaica." Environmental Hazards 17, no. 3 (2018): 219-33. [CrossRef]
- Stanganelli, Marialuce. "A New Pattern of Risk Management: The Hyogo Framework for Action and Italian Practise." Socio-Economic Planning Sciences 42, no. 2 (2008): 92-111. [CrossRef]
- Wang, Jieh-Jiuh. "Post-Disaster Cross-Nation Mutual Aid in Natural Hazards: Case Analysis from Sociology of Disaster and Disaster Politics Perspectives." Natural Hazards 66 (2013): 413-38. [CrossRef]
- Yumul Jr, Graciano P., Nathaniel A. Cruz, Nathaniel T. Servando, and Carla B. Dimalanta. "Extreme Weather Events and Related Disasters in the Philippines, 2004–08: A Sign of What Climate Change Will Mean?" Disasters 35, no. 2 (2011): 362-82.
- Rauscher, Natalie, and Welf Werner. "Why Has Catastrophe Mitigation Failed in the Us?" ZPB Zeitschrift für Politikberatung 8, no. 4 (2022): 149-73.
- Iuchi, Kanako, Yasuhito Jibiki, Renato Solidum Jr, and Ramon Santiago. "Natural Hazards Governance in the Philippines." In Oxford Research Encyclopedia of Natural Hazard Science, 2019.
- Ebi, Kristie L., and Jordana K. Schmier. "A Stitch in Time: Improving Public Health Early Warning Systems for Extreme Weather Events." Epidemiologic reviews 27, no. 1 (2005): 115-21. [CrossRef]
- Mashi, Sani Abubakar, Obaro Dominic Oghenejabor, and Amina Ibrahim Inkani. "Disaster Risks and Management Policies and Practices in Nigeria: A Critical Appraisal of the National Emergency Management Agency Act." International Journal of Disaster Risk Reduction 33 (2019): 253-65. [CrossRef]
- Goncalves Filho, Anastacio Pinto, and Patrick Waterson. "Maturity Models and Safety Culture: A Critical Review." Safety Science 105 (2018): 192–211.
- Prothi, Amit, Mona Chhabra Anand, and Ratnesh Kumar. "Adaptive Pathways for Resilient Infrastructure in an Evolving Disasterscape." 3-4: Taylor & Francis, 2023. [CrossRef]
- Buck, Kyle D., Kevin J. Summers, Stephen Hafner, Lisa M. Smith, and Linda C. Harwell. "Development of a Multi-Hazard Landscape for Exposure and Risk Interpretation: The Prism Approach." Current environmental engineering 6, no. 1 (2019): 74-94. [CrossRef]
- Prior, Tim, Michel Herzog, Tabea Kaderli, and Florian Roth. "International Civil Protection: Adapting to New Challenges." ETH Zurich, 2016.
- Cutter, Susan L., and Christina Finch. "Temporal and Spatial Changes in Social Vulnerability to Natural Hazards." Proceedings of the National Academy of Sciences 105, no. 7 (2008): 2301-06.
- Krausmann, Elisabeth, Valerio Cozzani, Ernesto Salzano, and Elisabetta Renni. "Industrial Accidents Triggered by Natural Hazards: An Emerging Risk Issue." Natural Hazards and Earth System Sciences 11, no. 3 (2011): 921-29. [CrossRef]
- Evan, William M., and Mark Manion. Minding the Machines: Preventing Technological Disasters: Prentice Hall Professional, 2002.
- Brauch, Hans Günter. "Urbanization and Natural Disasters in the Mediterranean: Population Growth and Climate Change in the 21st Century." Building safer cities 149 (2003).
- Forzieri, Giovanni, Alessandra Bianchi, Filipe Batista e Silva, Mario A. Marin Herrera, Antoine Leblois, Carlo Lavalle, Jeroen C. J. H. Aerts, and Luc Feyen. "Escalating Impacts of Climate Extremes on Critical Infrastructures in Europe." Global environmental change 48 (2018): 97-107. [CrossRef]
- Harrison, Sara, Sally Potter, Raj Prasanna, Emma H Doyle, and David Johnston. "Identifying the Impact-Related Data Uses and Gaps for Hydrometeorological Impact Forecasts and Warnings." Weather, Climate, and Society 14 (2022): 155–76. [CrossRef]
- Bean, Hamilton, Jeannette Sutton, Brooke F. Liu, Stephanie Madden, Michele M. Wood, and Dennis S. Mileti. "The Study of Mobile Public Warning Messages: A Research Review and Agenda." Review of Communication 15, no. 1 (2015): 60-80. [CrossRef]
- Dengler, Lori, James Goltz, Johanna Fenton, Kevin Miller, and Rick Wilson. "Building Tsunami-Resilient Communities in the United States: An Example from California." TsuInfo Alert 13, no. 2 (2011): 1-14.
- Shahriar, Hossain, and Mohammad Zulkernine. "Mitigating Program Security Vulnerabilities: Approaches and Challenges." ACM Computing Surveys (CSUR) 44, no. 3 (2012): 1-46.
- Waugh, John D. Neighborhood Watch: Early Detection and Rapid Response to Biological Invasion Along Us Trade Pathways: IUCN, 2009.
- Brauch, Hans Günter. "Concepts of Security Threats, Challenges, Vulnerabilities and Risks." In Coping with Global Environmental Change, Disasters and Security: Threats, Challenges, Vulnerabilities and Risks, 61-106: Springer, 2011.
- Coleman, Les. "Frequency of Man-Made Disasters in the 20th Century." Journal of contingencies and crisis management 14, no. 1 (2006): 3-11.
- Granot, Hayim. "The Dark Side of Growth and Industrial Disasters since the Second World War." Disaster Prevention and Management: An International Journal 7, no. 3 (1998): 195-204. [CrossRef]
- Zinn, Jens O. "Towards a Better Understanding of Risk-Taking: Key Concepts, Dimensions and Perspectives." 99-114: Taylor & Francis, 2015.
- Bouwer, Laurens M. "Have Disaster Losses Increased Due to Anthropogenic Climate Change?" Bulletin of the American Meteorological Society 92, no. 1 (2011): 39-46.
- Lei, Yongdeng, and Jing’ai Wang. "A Preliminary Discussion on the Opportunities and Challenges of Linking Climate Change Adaptation with Disaster Risk Reduction." Natural Hazards 71 (2014): 1587-97.
- Mata-Lima, Herlander, Andreilcy Alvino-Borba, Adilson Pinheiro, Abel Mata-Lima, and José António Almeida. "Impacts of Natural Disasters on Environmental and Socio-Economic Systems: What Makes the Difference?" Ambiente & Sociedade 16 (2013): 45-64. [CrossRef]
- Peters, Katie, Laura E. R. Peters, John Twigg, and Colin Walch. "Disaster Risk Reduction Strategies." London: Overseas Development Institute (2019).
- Klein, Julia A., Catherine M. Tucker, Cara E. Steger, Anne Nolin, Robin Reid, Kelly A. Hopping, Emily T. Yeh, Meeta S. Pradhan, Andrew Taber, and David Molden. "An Integrated Community and Ecosystem-Based Approach to Disaster Risk Reduction in Mountain Systems." Environmental science & policy 94 (2019): 143-52.
- Albright, Elizabeth A., and Deserai A. Crow. "Capacity Building toward Resilience: How Communities Recover, Learn, and Change in the Aftermath of Extreme Events." Policy Studies Journal 49, no. 1 (2021): 89-122. [CrossRef]
- Walia, Ajinder. "Community Based Disaster Preparedness: Need for a Standardized Training Module." Australian Journal of Emergency Management, The 23, no. 2 (2008): 68-73.
- Haddow, George, and Kim S. Haddow. Disaster Communications in a Changing Media World: Butterworth-Heinemann, 2013.
- Curtis, Carey, and Jan Scheurer. "Planning for Sustainable Accessibility: Developing Tools to Aid Discussion and Decision-Making." Progress in planning 74, no. 2 (2010): 53-106. [CrossRef]
- Alexander, David. "The Study of Natural Disasters, 1977–97: Some Reflections on a Changing Field of Knowledge." Disasters 21, no. 4 (1997): 284-304.
- Scott, Allen J. A World in Emergence: Cities and Regions in the 21st Century: Edward Elgar Publishing, 2012.
- Brunn, Stanley D., Jack Francis Williams, and Donald J. Zeigler. Cities of the World: World Regional Urban Development: Rowman & Littlefield, 2003.
- Haddad, Edson, Pablo F. Aguilar Alcalá, and Jorge Luiz Nobre Gouveia. "Environmental and Technological Disasters and Emergencies." Luiz Augusto C. Galvão Jacobo Finkelman: 629.
- Duarte Santos, Filipe, and Filipe Duarte Santos. "Anthropocene, Technosphere, Biosphere, and the Contemporary Utopias." Time, Progress, Growth and Technology: How Humans and the Earth are Responding (2021): 381-542.
- Ahmad, Najid, Liu Youjin, Saša Žiković, and Zhanna Belyaeva. "The Effects of Technological Innovation on Sustainable Development and Environmental Degradation: Evidence from China." Technology in Society 72 (2023): 102184. [CrossRef]
- Trautman, Lawrence J., and Peter C. Ormerod. "Industrial Cyber Vulnerabilities: Lessons from Stuxnet and the Internet of Things." U. Miami L. Rev. 72 (2017): 761.
- Keim, Mark E. "The Role of Public Health in Disaster Risk Reduction as a Means for Climate Change Adaptation." Global climate change and human health: From science to practice 35 (2015).
- Quansah, Joseph E., Bernard Engel, and Gilbert L. Rochon. "Early Warning Systems: A Review." Journal of Terrestrial Observation 2, no. 2 (2010): 5.
- Mal, Suraj, R. B. Singh, Christian Huggel, and Aakriti Grover. "Introducing Linkages between Climate Change, Extreme Events, and Disaster Risk Reduction." Climate change, extreme events and disaster risk reduction: Towards sustainable development goals (2018): 1-14.
- Wagner, Philip, and Michael R. Reich. "Technological Hazards." Regions of Risk: A Geographical Introduction to Disasters (2014): 91.
- de Souza Porto, Marcelo Firpo, and Carlos Machado de Freitas. "Major Chemical Accidents in Industrializing Countries: The Socio-Political Amplification of Risk." Risk analysis 16, no. 1 (1996): 19-29.
- Clarke, Ben, Friederike Otto, Rupert Stuart-Smith, and Luke Harrington. "Extreme Weather Impacts of Climate Change: An Attribution Perspective." Environmental Research: Climate 1, no. 1 (2022): 012001. [CrossRef]
- Duffey, Romney, and John Saull. Know the Risk: Learning from Errors and Accidents: Safety and Risk in Today's Technology: Elsevier, 2002.
- Brooks, Nick, and Neil W. Adger. "Country Level Risk Measures of Climate-Related Natural Disasters and Implications for Adaptation to Climate Change." (2003).
- Schipper, Lisa, and Mark Pelling. "Disaster Risk, Climate Change and International Development: Scope for, and Challenges to, Integration." Disasters 30, no. 1 (2006): 19-38. [CrossRef]
- Berg, Monika, and Veronica De Majo. "Understanding the Global Strategy for Disaster Risk Reduction." Risk, Hazards & Crisis in Public Policy 8, no. 2 (2017): 147-67. [CrossRef]
- Bankoff, Greg, Georg Frerks, and Dorothea Hilhorst. Mapping Vulnerability: Disasters, Development and People: Routledge, 2013.
- Hannigan, John. Disasters without Borders: The International Politics of Natural Disasters: John Wiley & Sons, 2013.
| 1. | The category includes a wide range of water-related disasters, not just floods. It also covers incidents like glacial lake outburst floods and coastal erosion. The common thread is that water plays a crucial role in causing these events. |
Figure 1.
Geospatial distribution of natural and man-made (technological) disasters by continent (1900-2024).
Figure 1.
Geospatial distribution of natural and man-made (technological) disasters by continent (1900-2024).
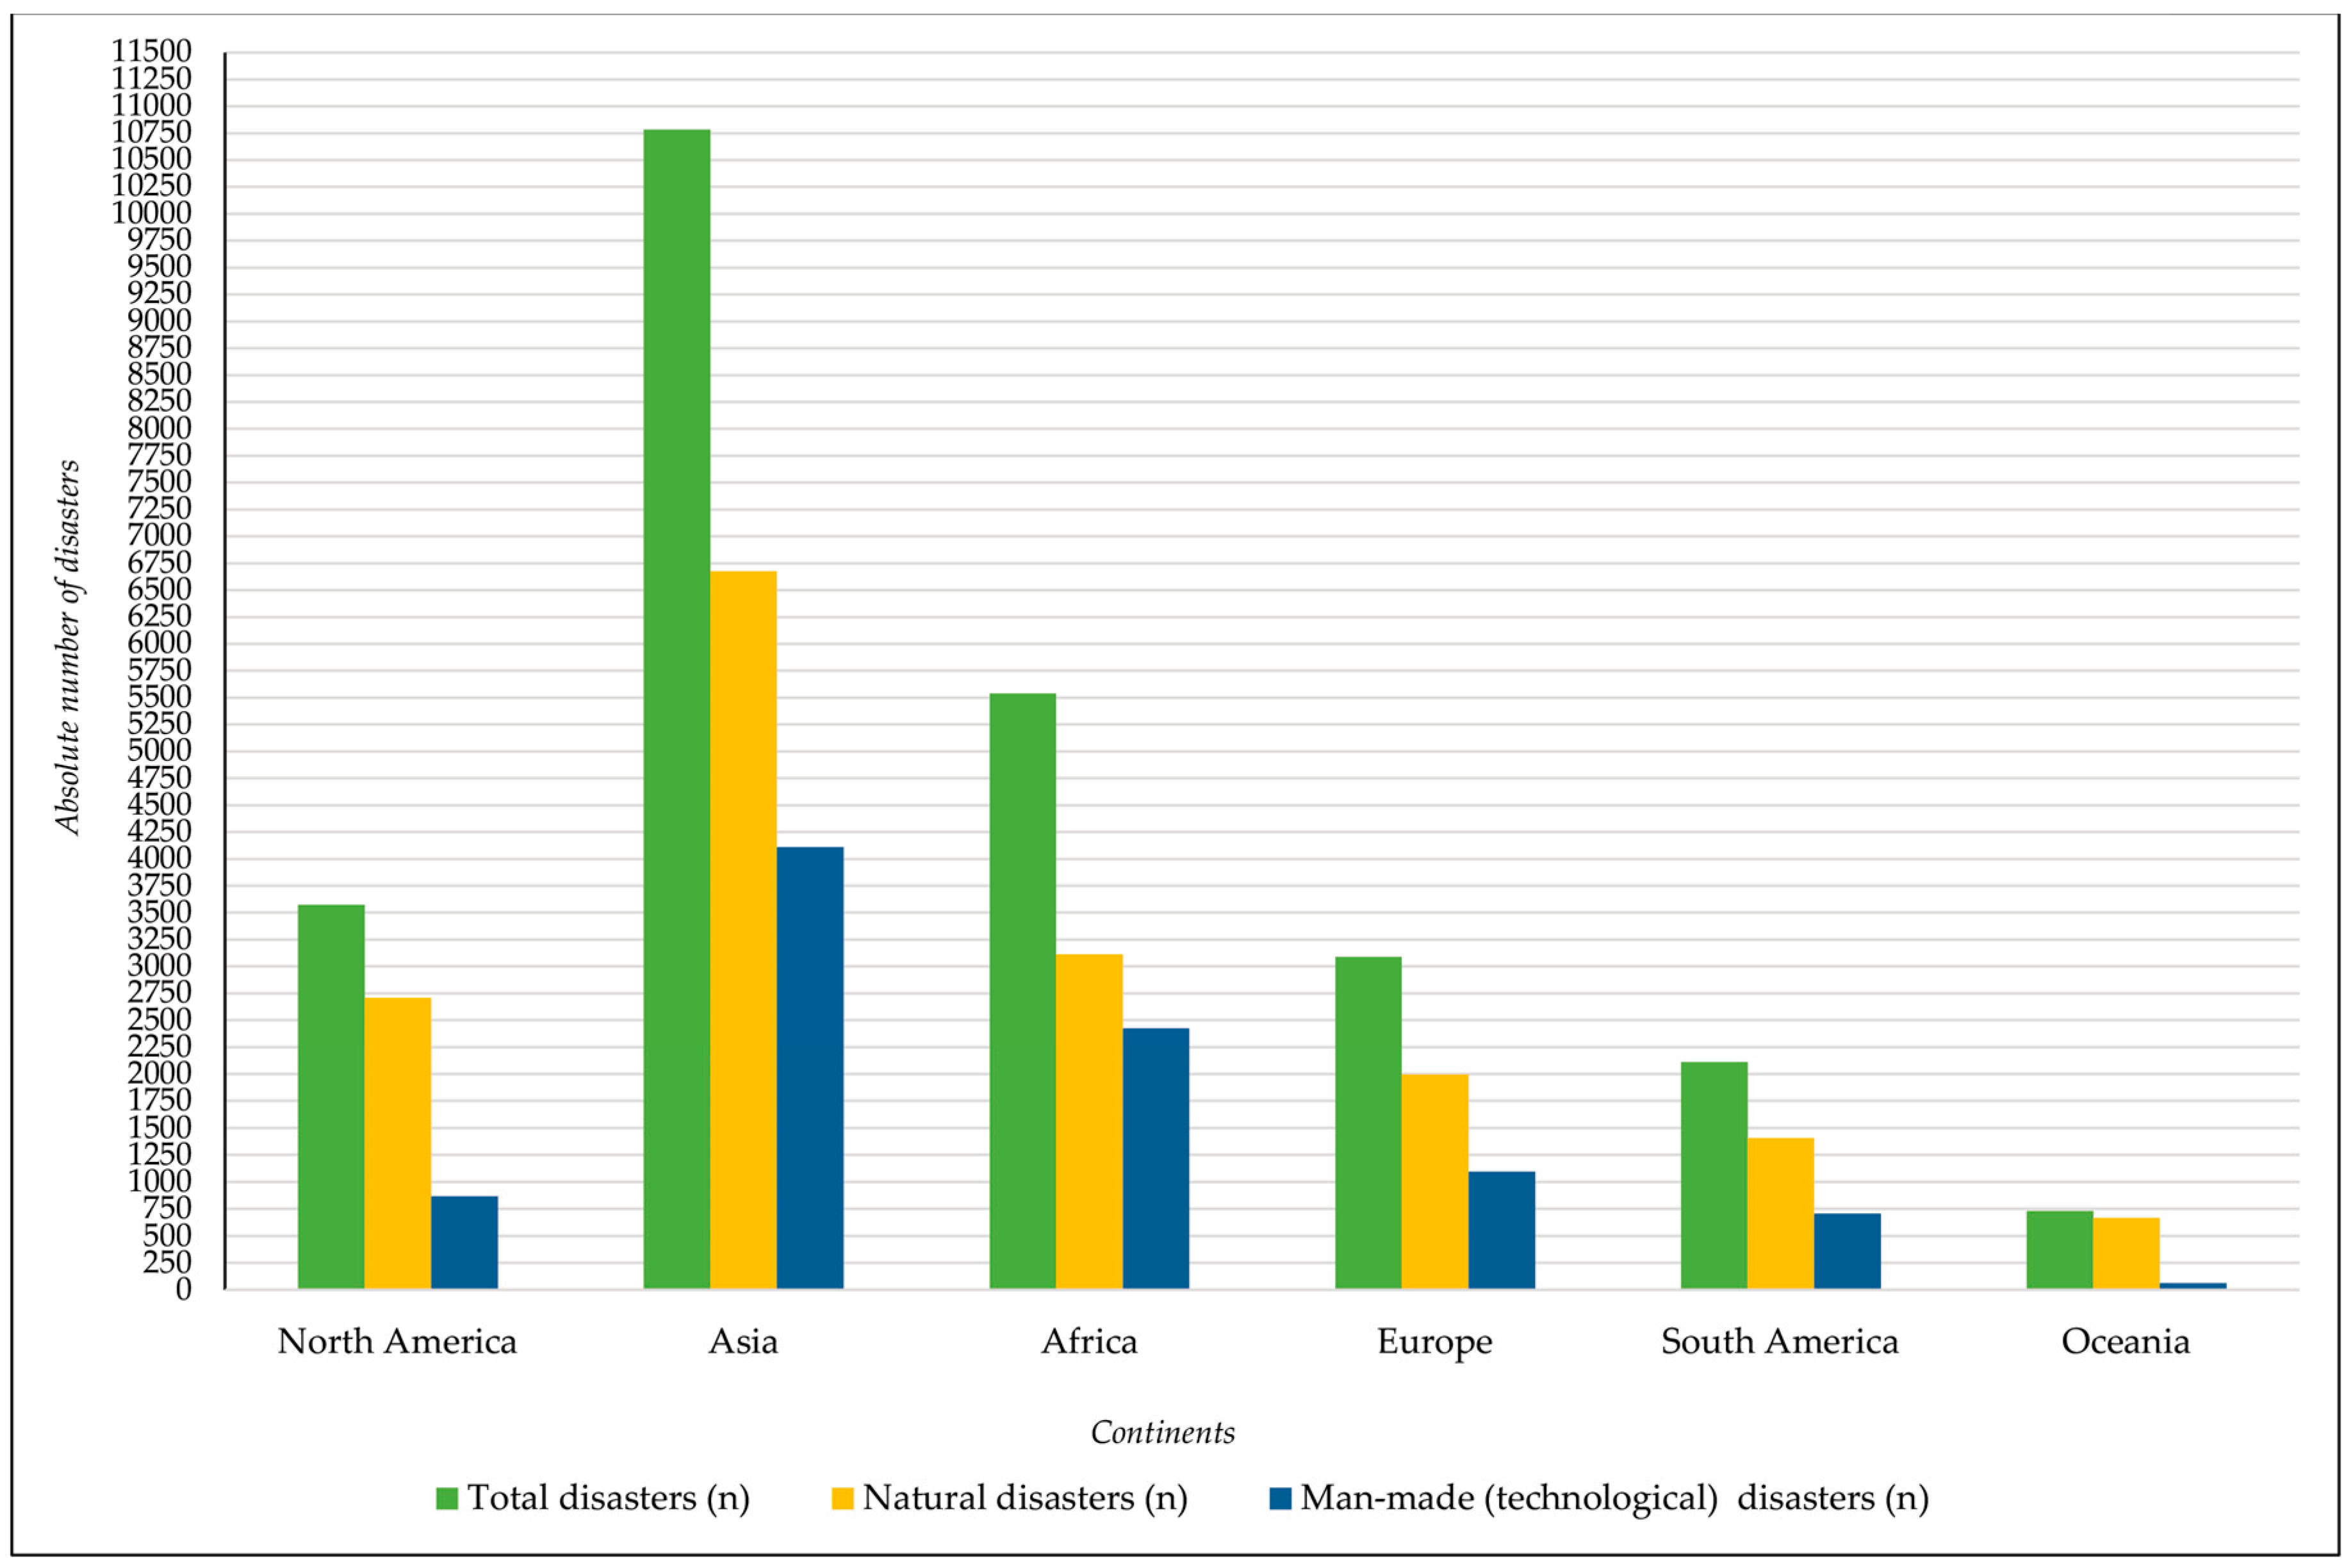
Figure 2.
Distribution of individual natural and man-made (technological) disasters by continent (1900-2024).
Figure 2.
Distribution of individual natural and man-made (technological) disasters by continent (1900-2024).
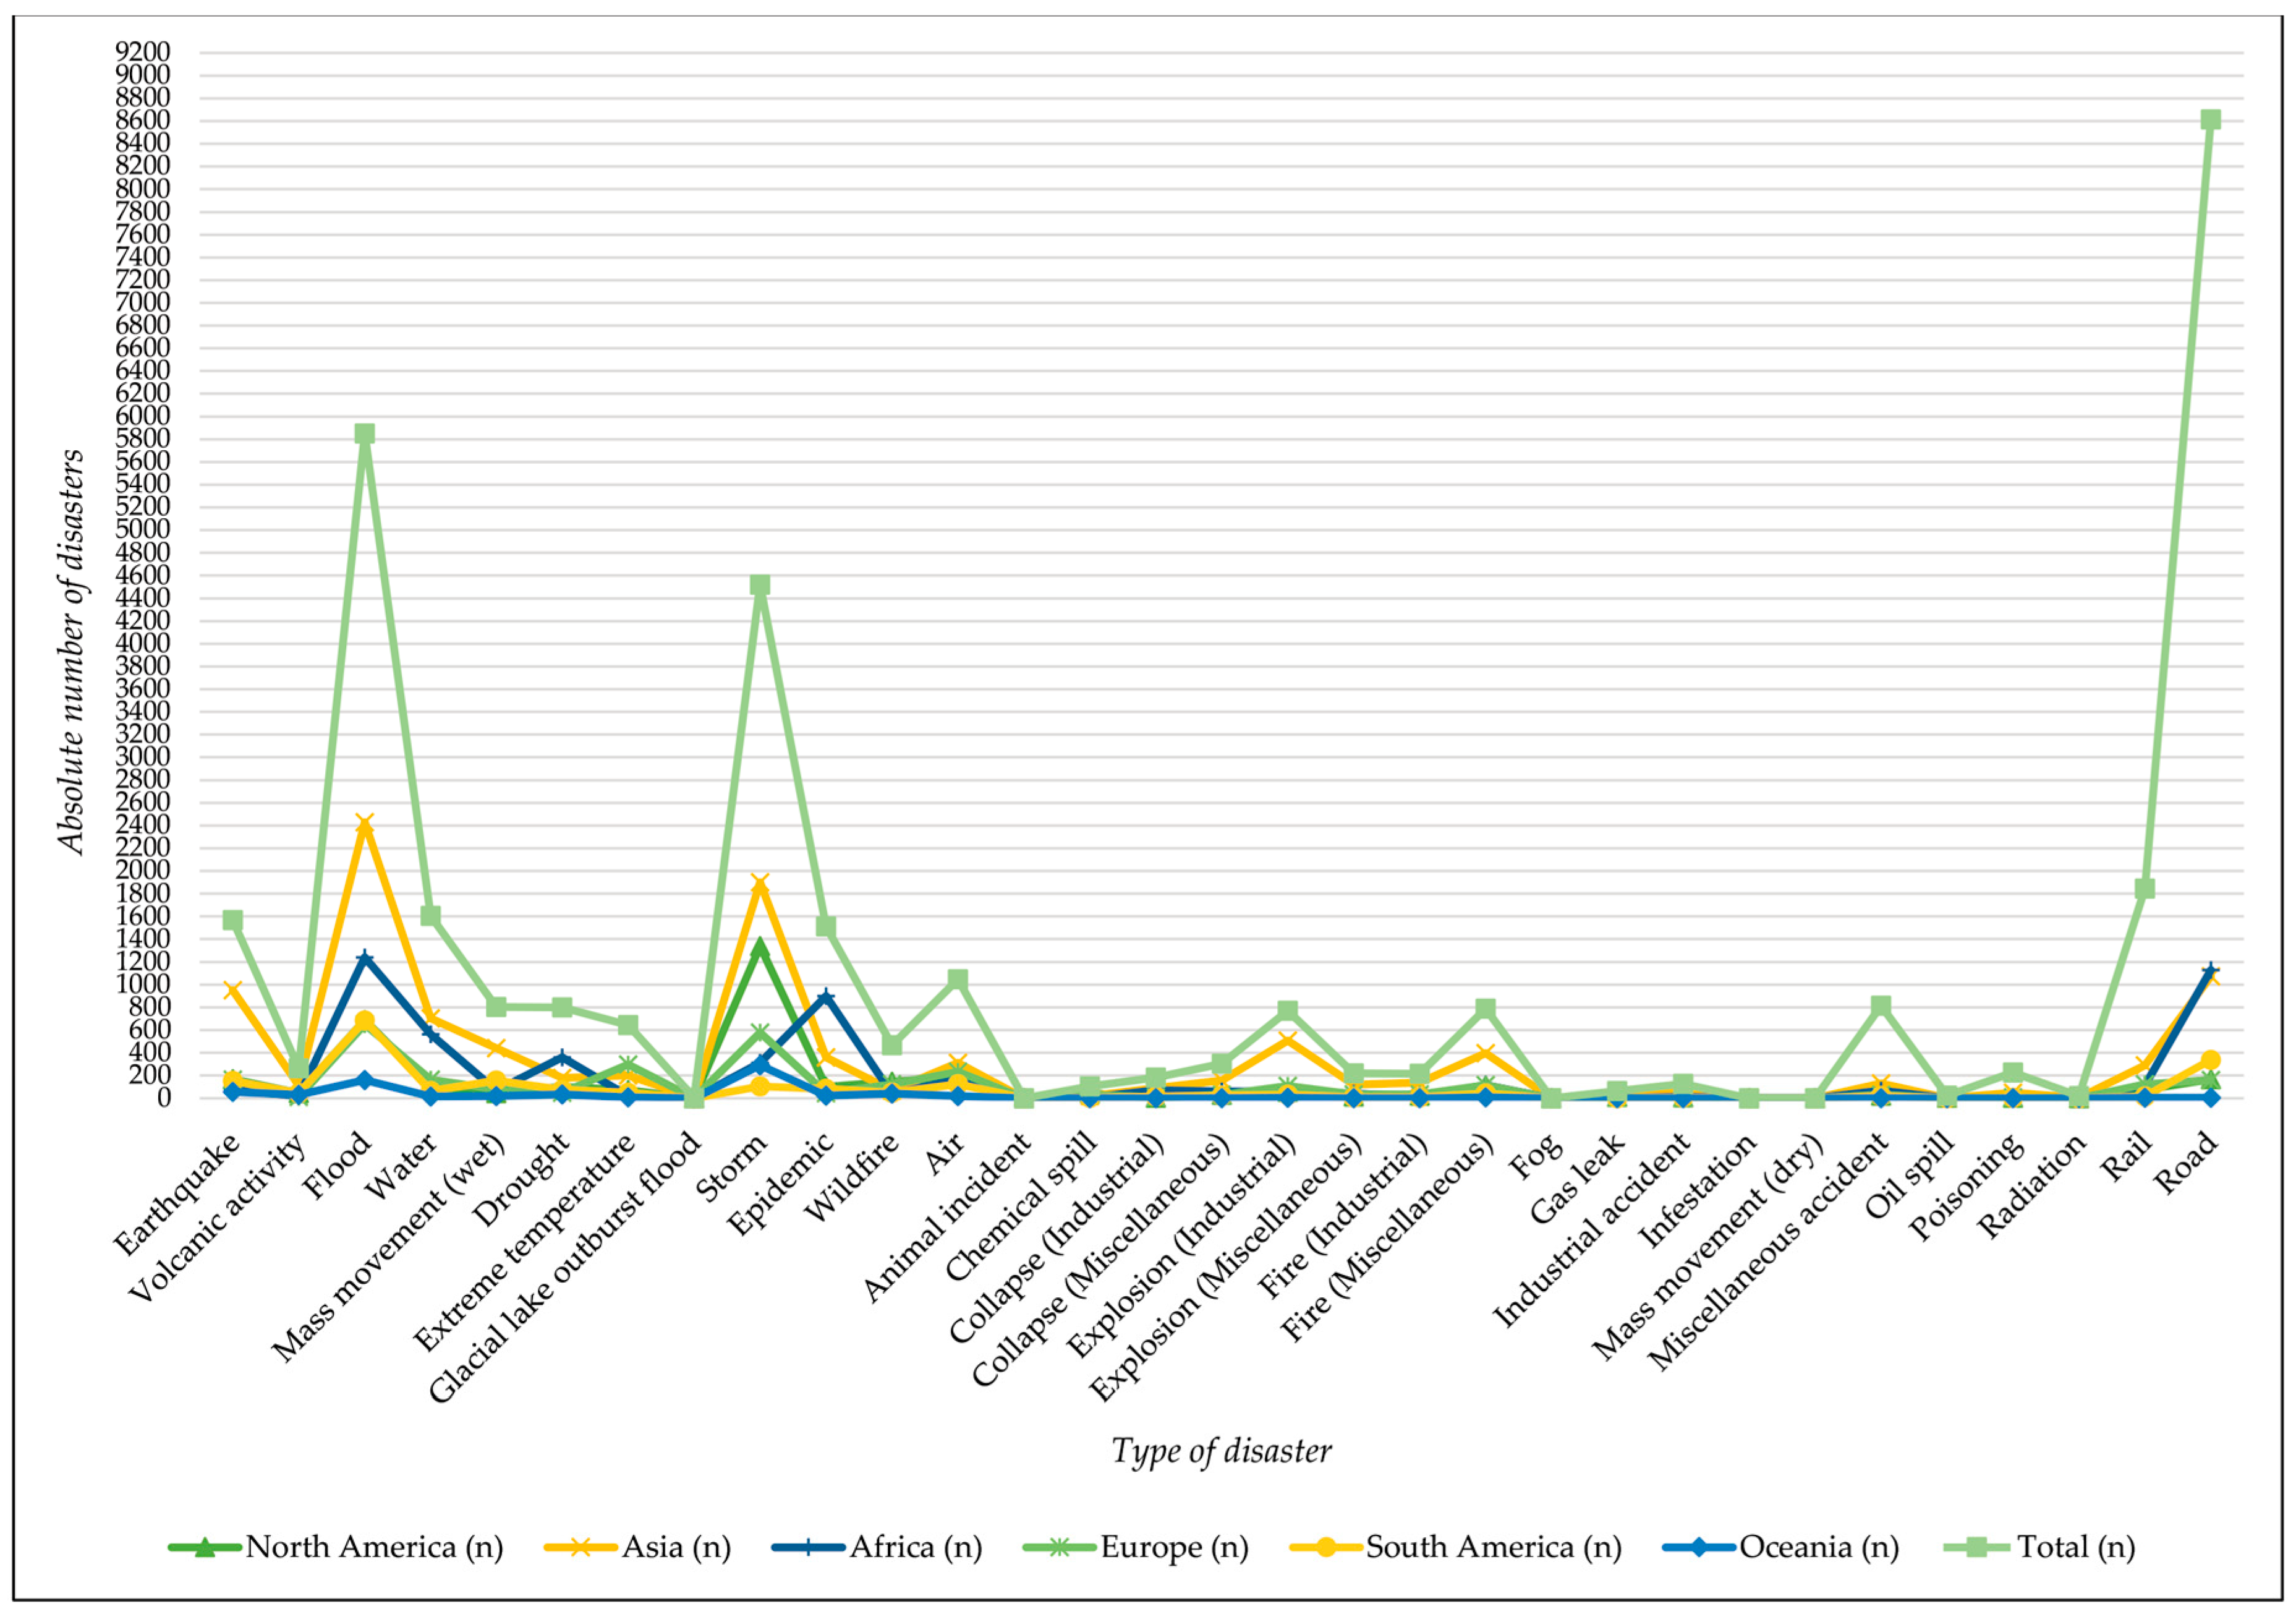
Figure 3.
Distribution of total, natural, and man-made (technological) disasters by country (1900-2024).
Figure 3.
Distribution of total, natural, and man-made (technological) disasters by country (1900-2024).
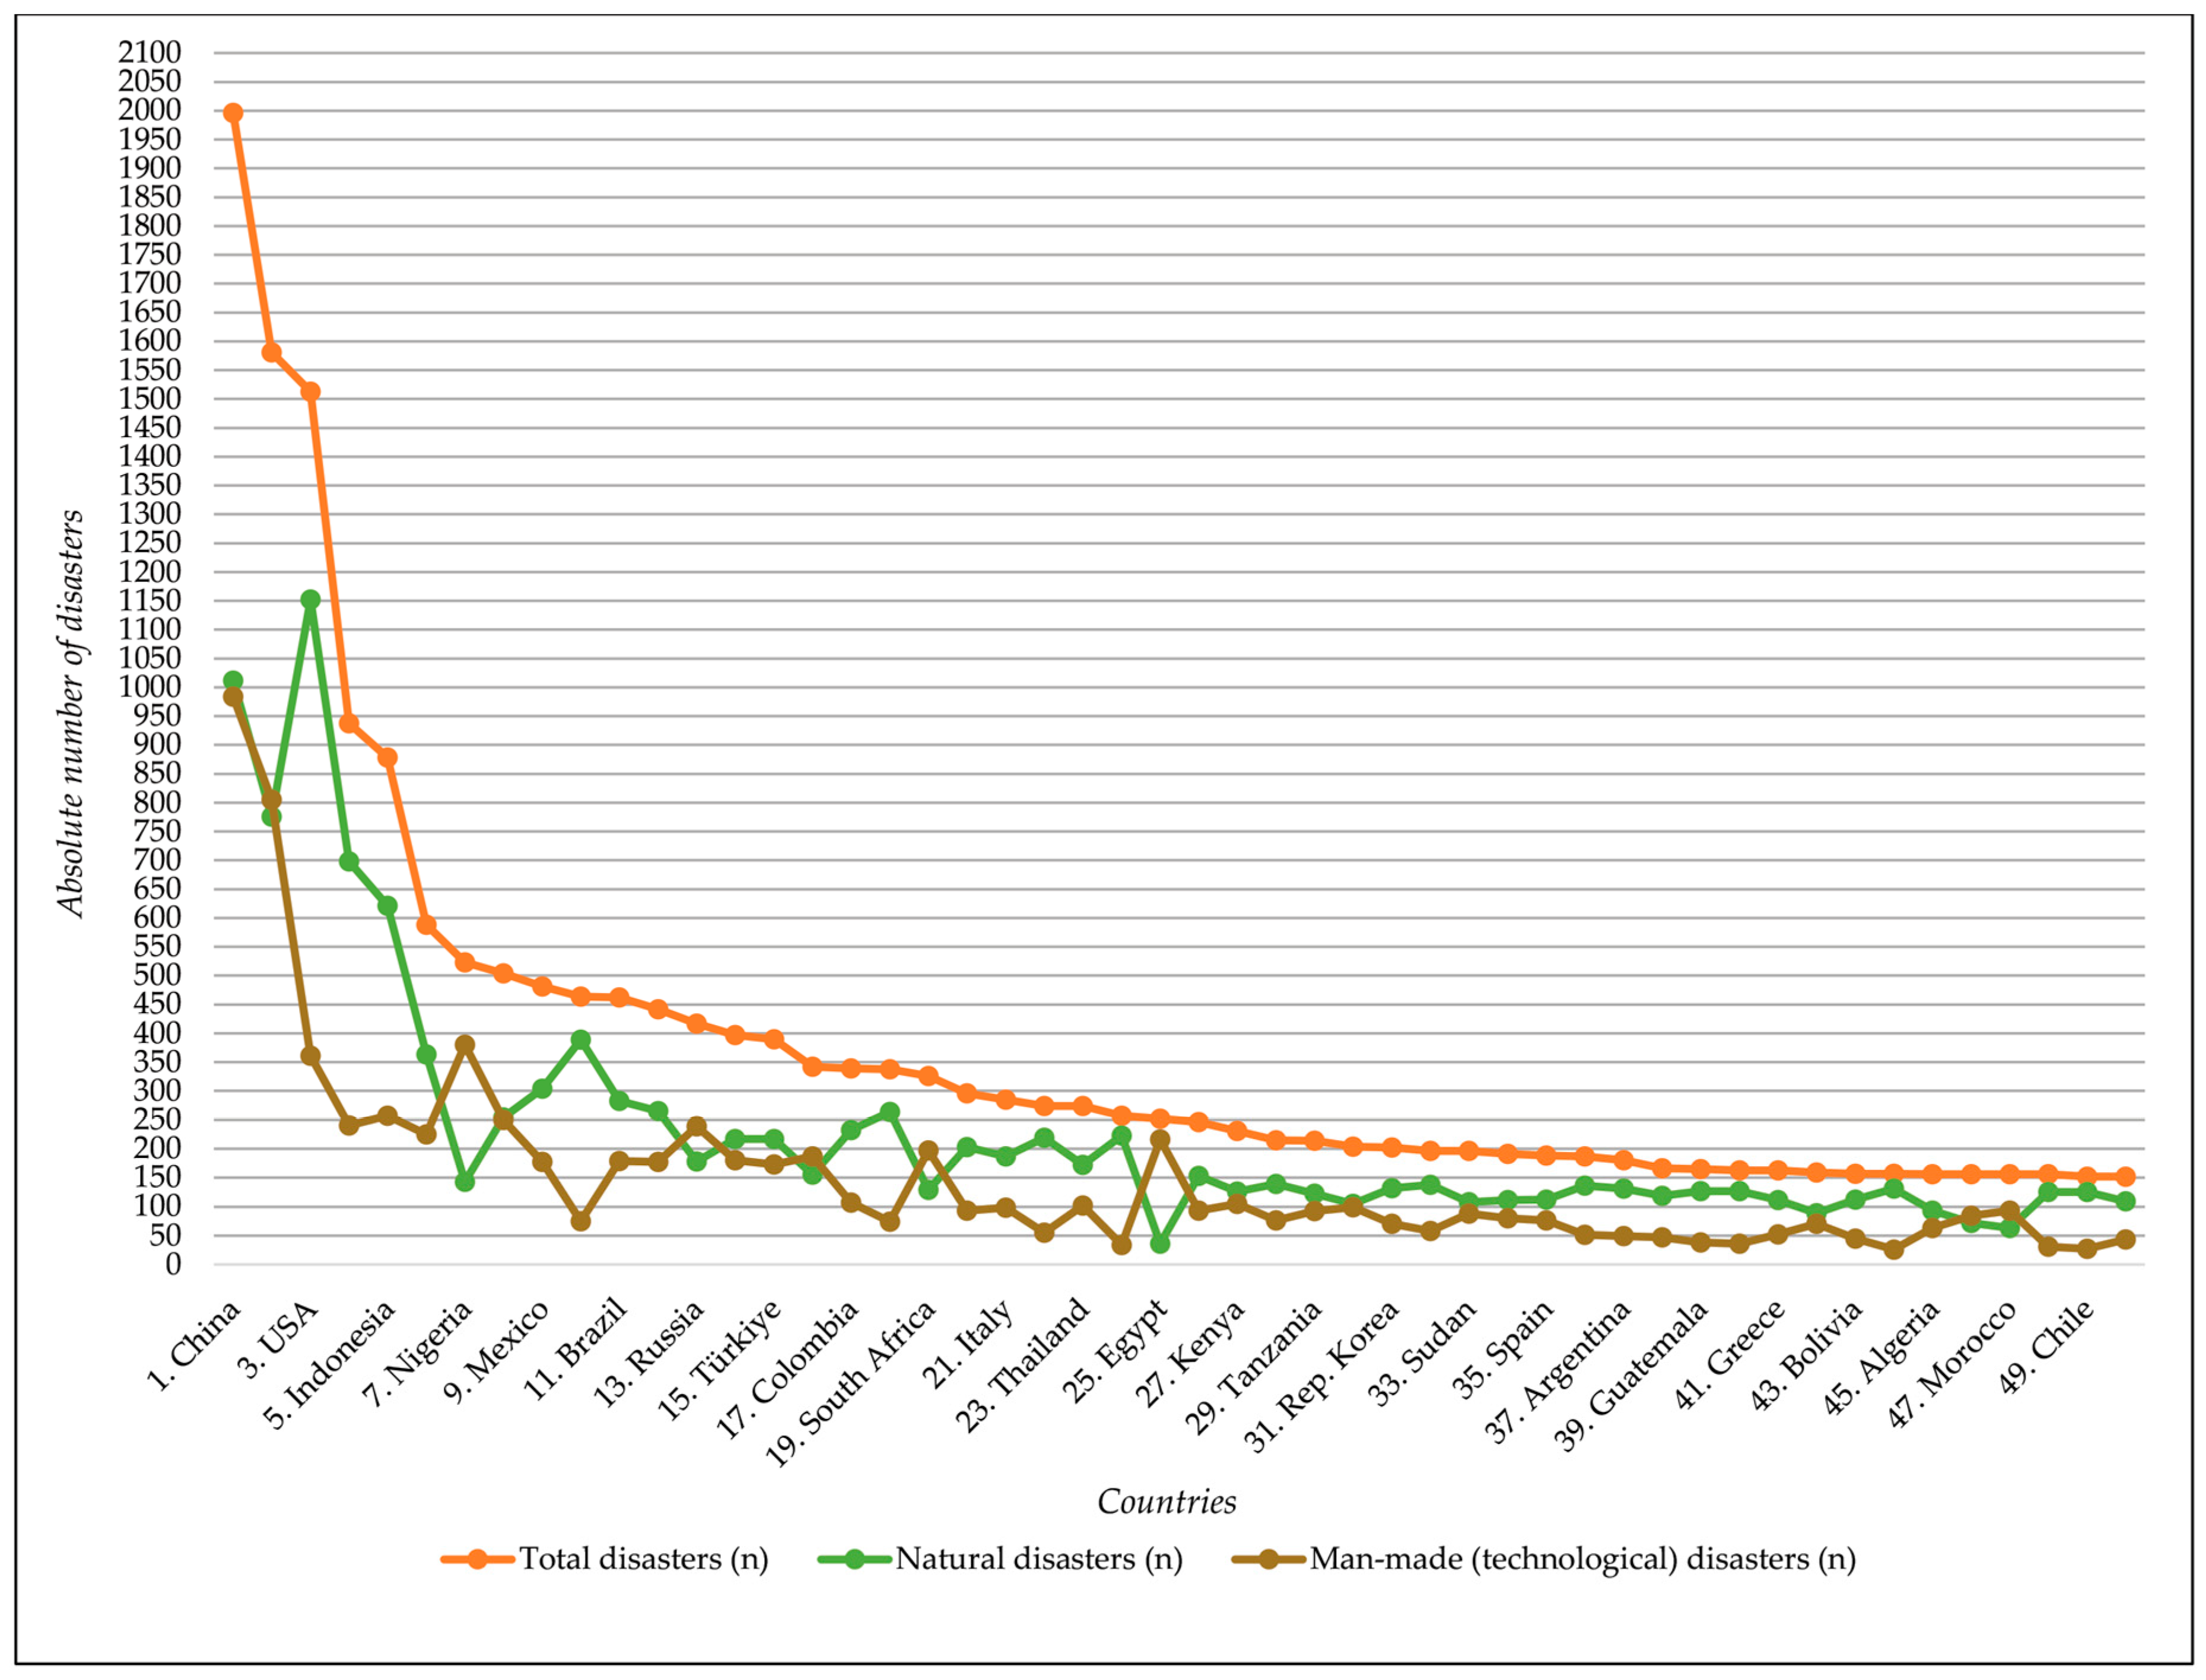
Figure 4.
Temporal analysis of natural and man-made (technological) disasters in 10-year intervals (1900-2024).
Figure 4.
Temporal analysis of natural and man-made (technological) disasters in 10-year intervals (1900-2024).
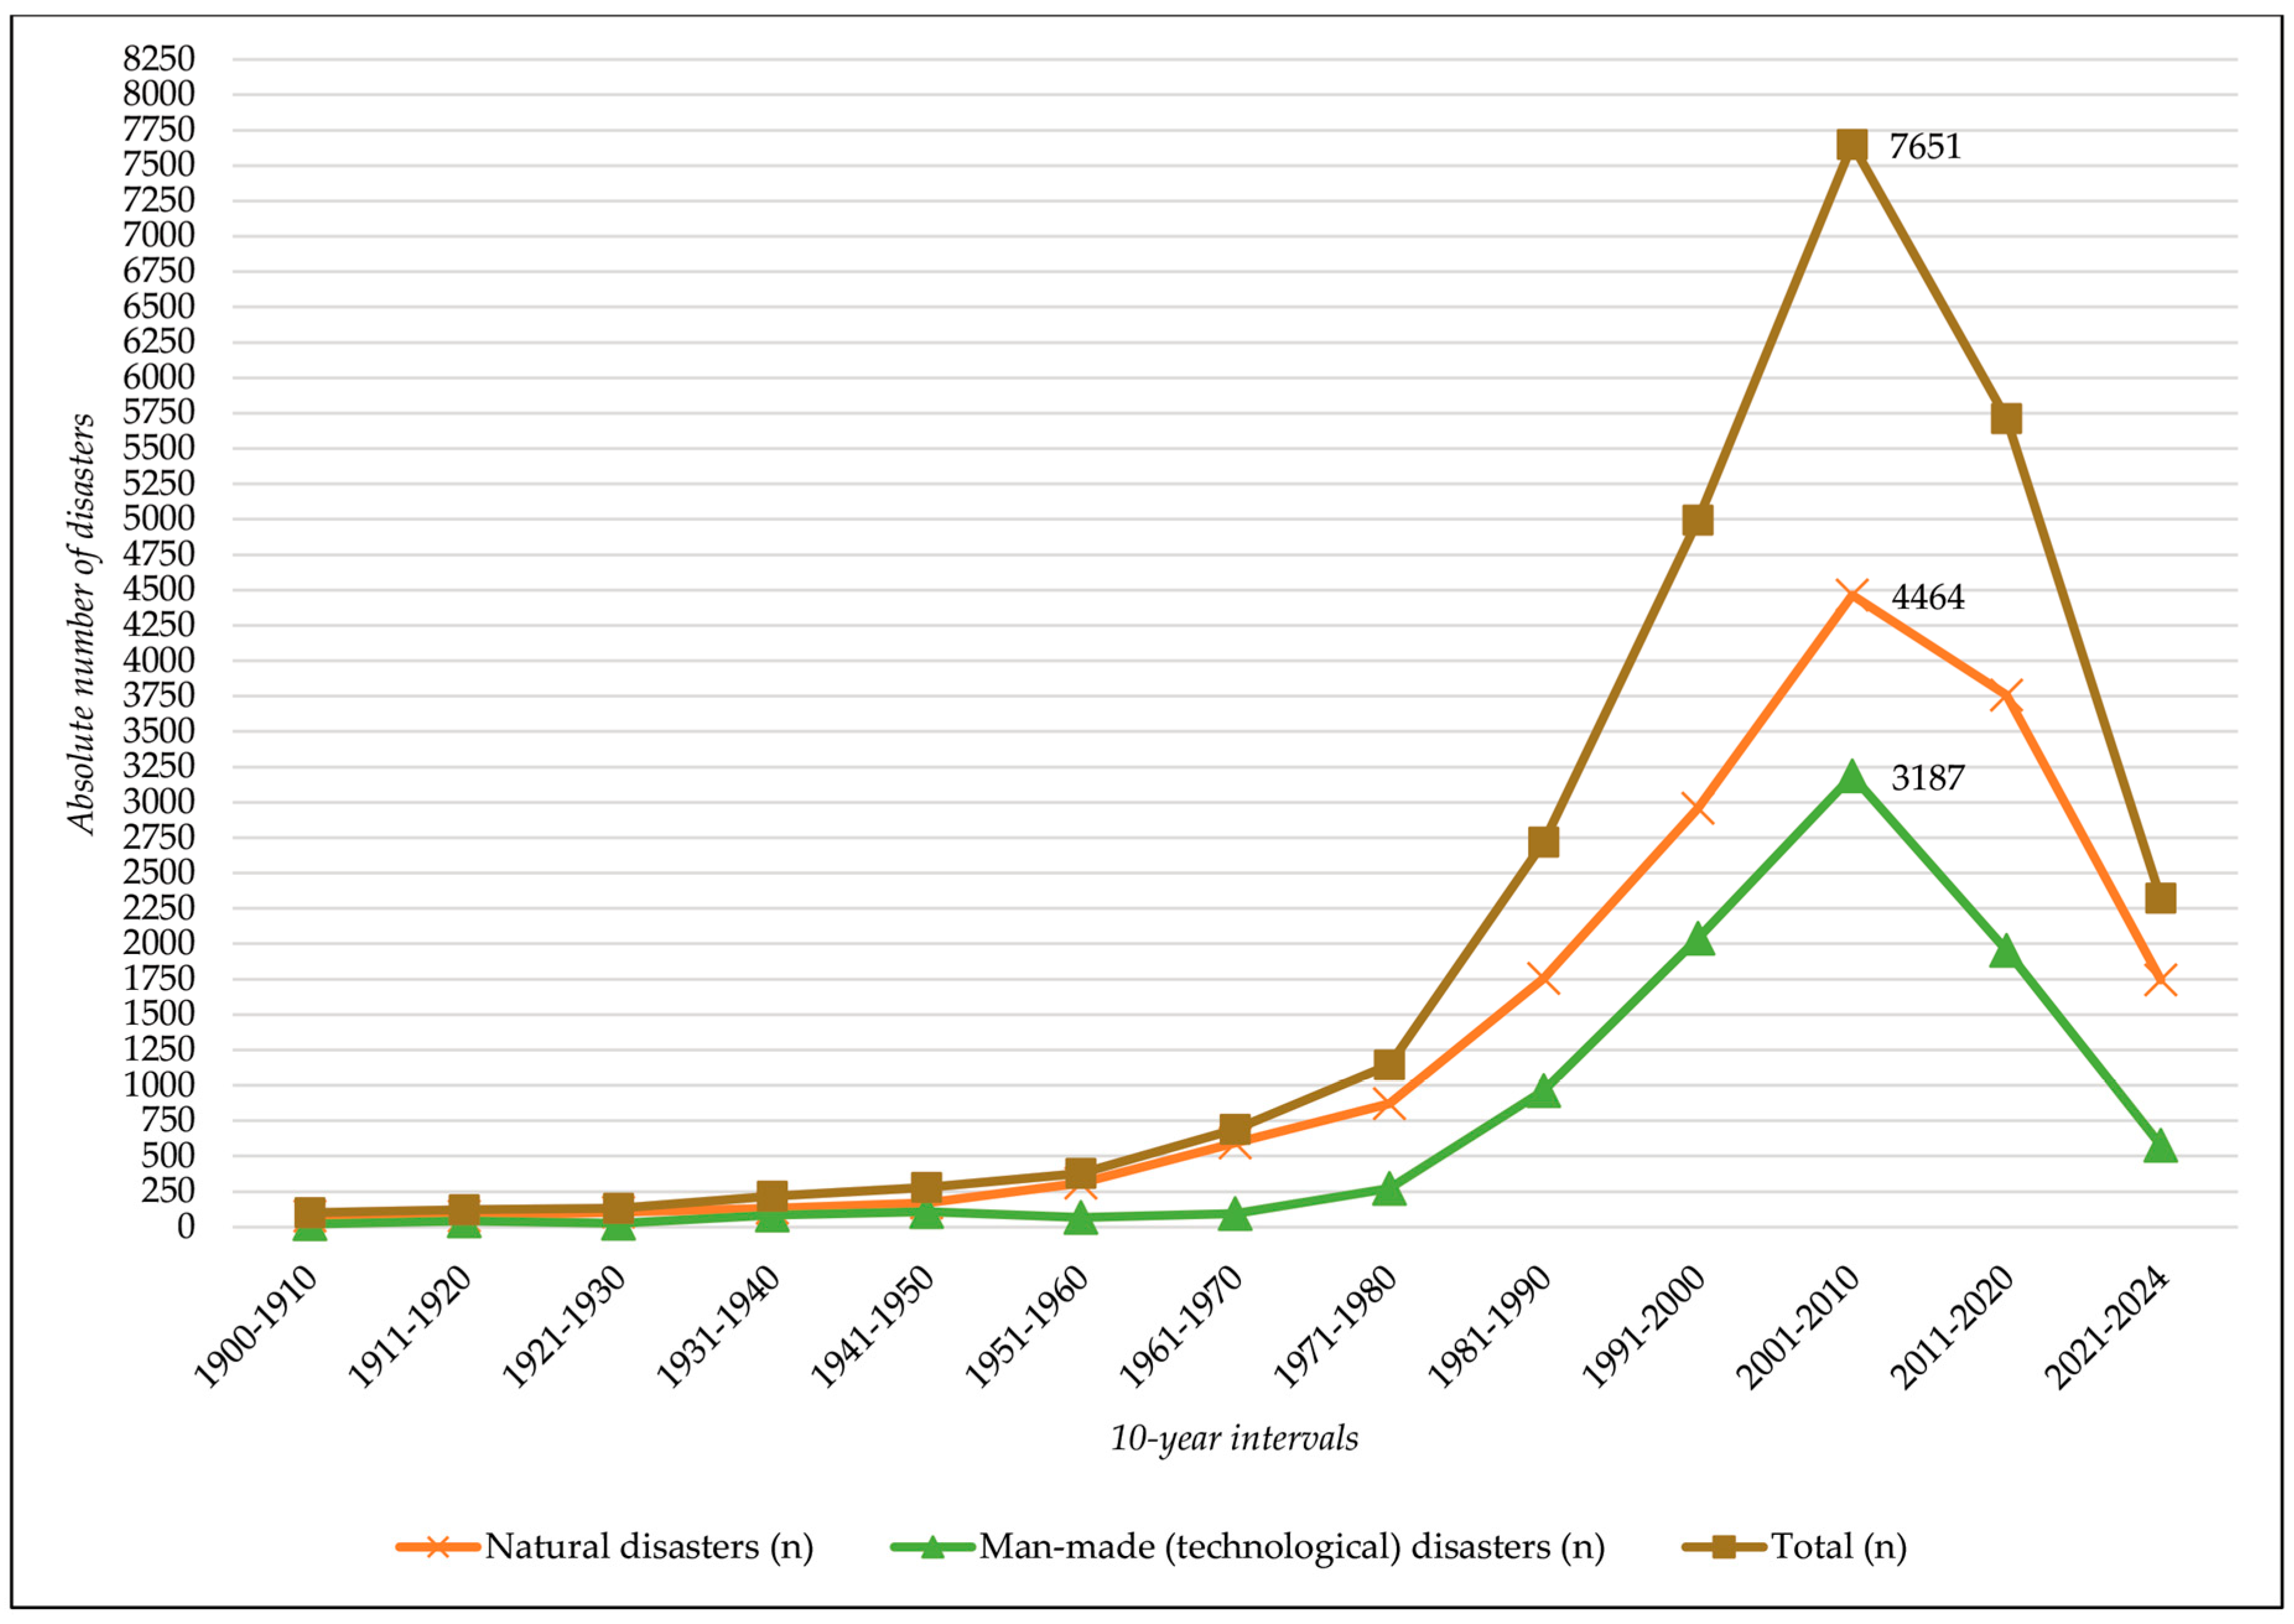
Figure 5.
Temporal analysis of natural and man-made (technological) disasters in 5-year intervals (1900-2024).
Figure 5.
Temporal analysis of natural and man-made (technological) disasters in 5-year intervals (1900-2024).
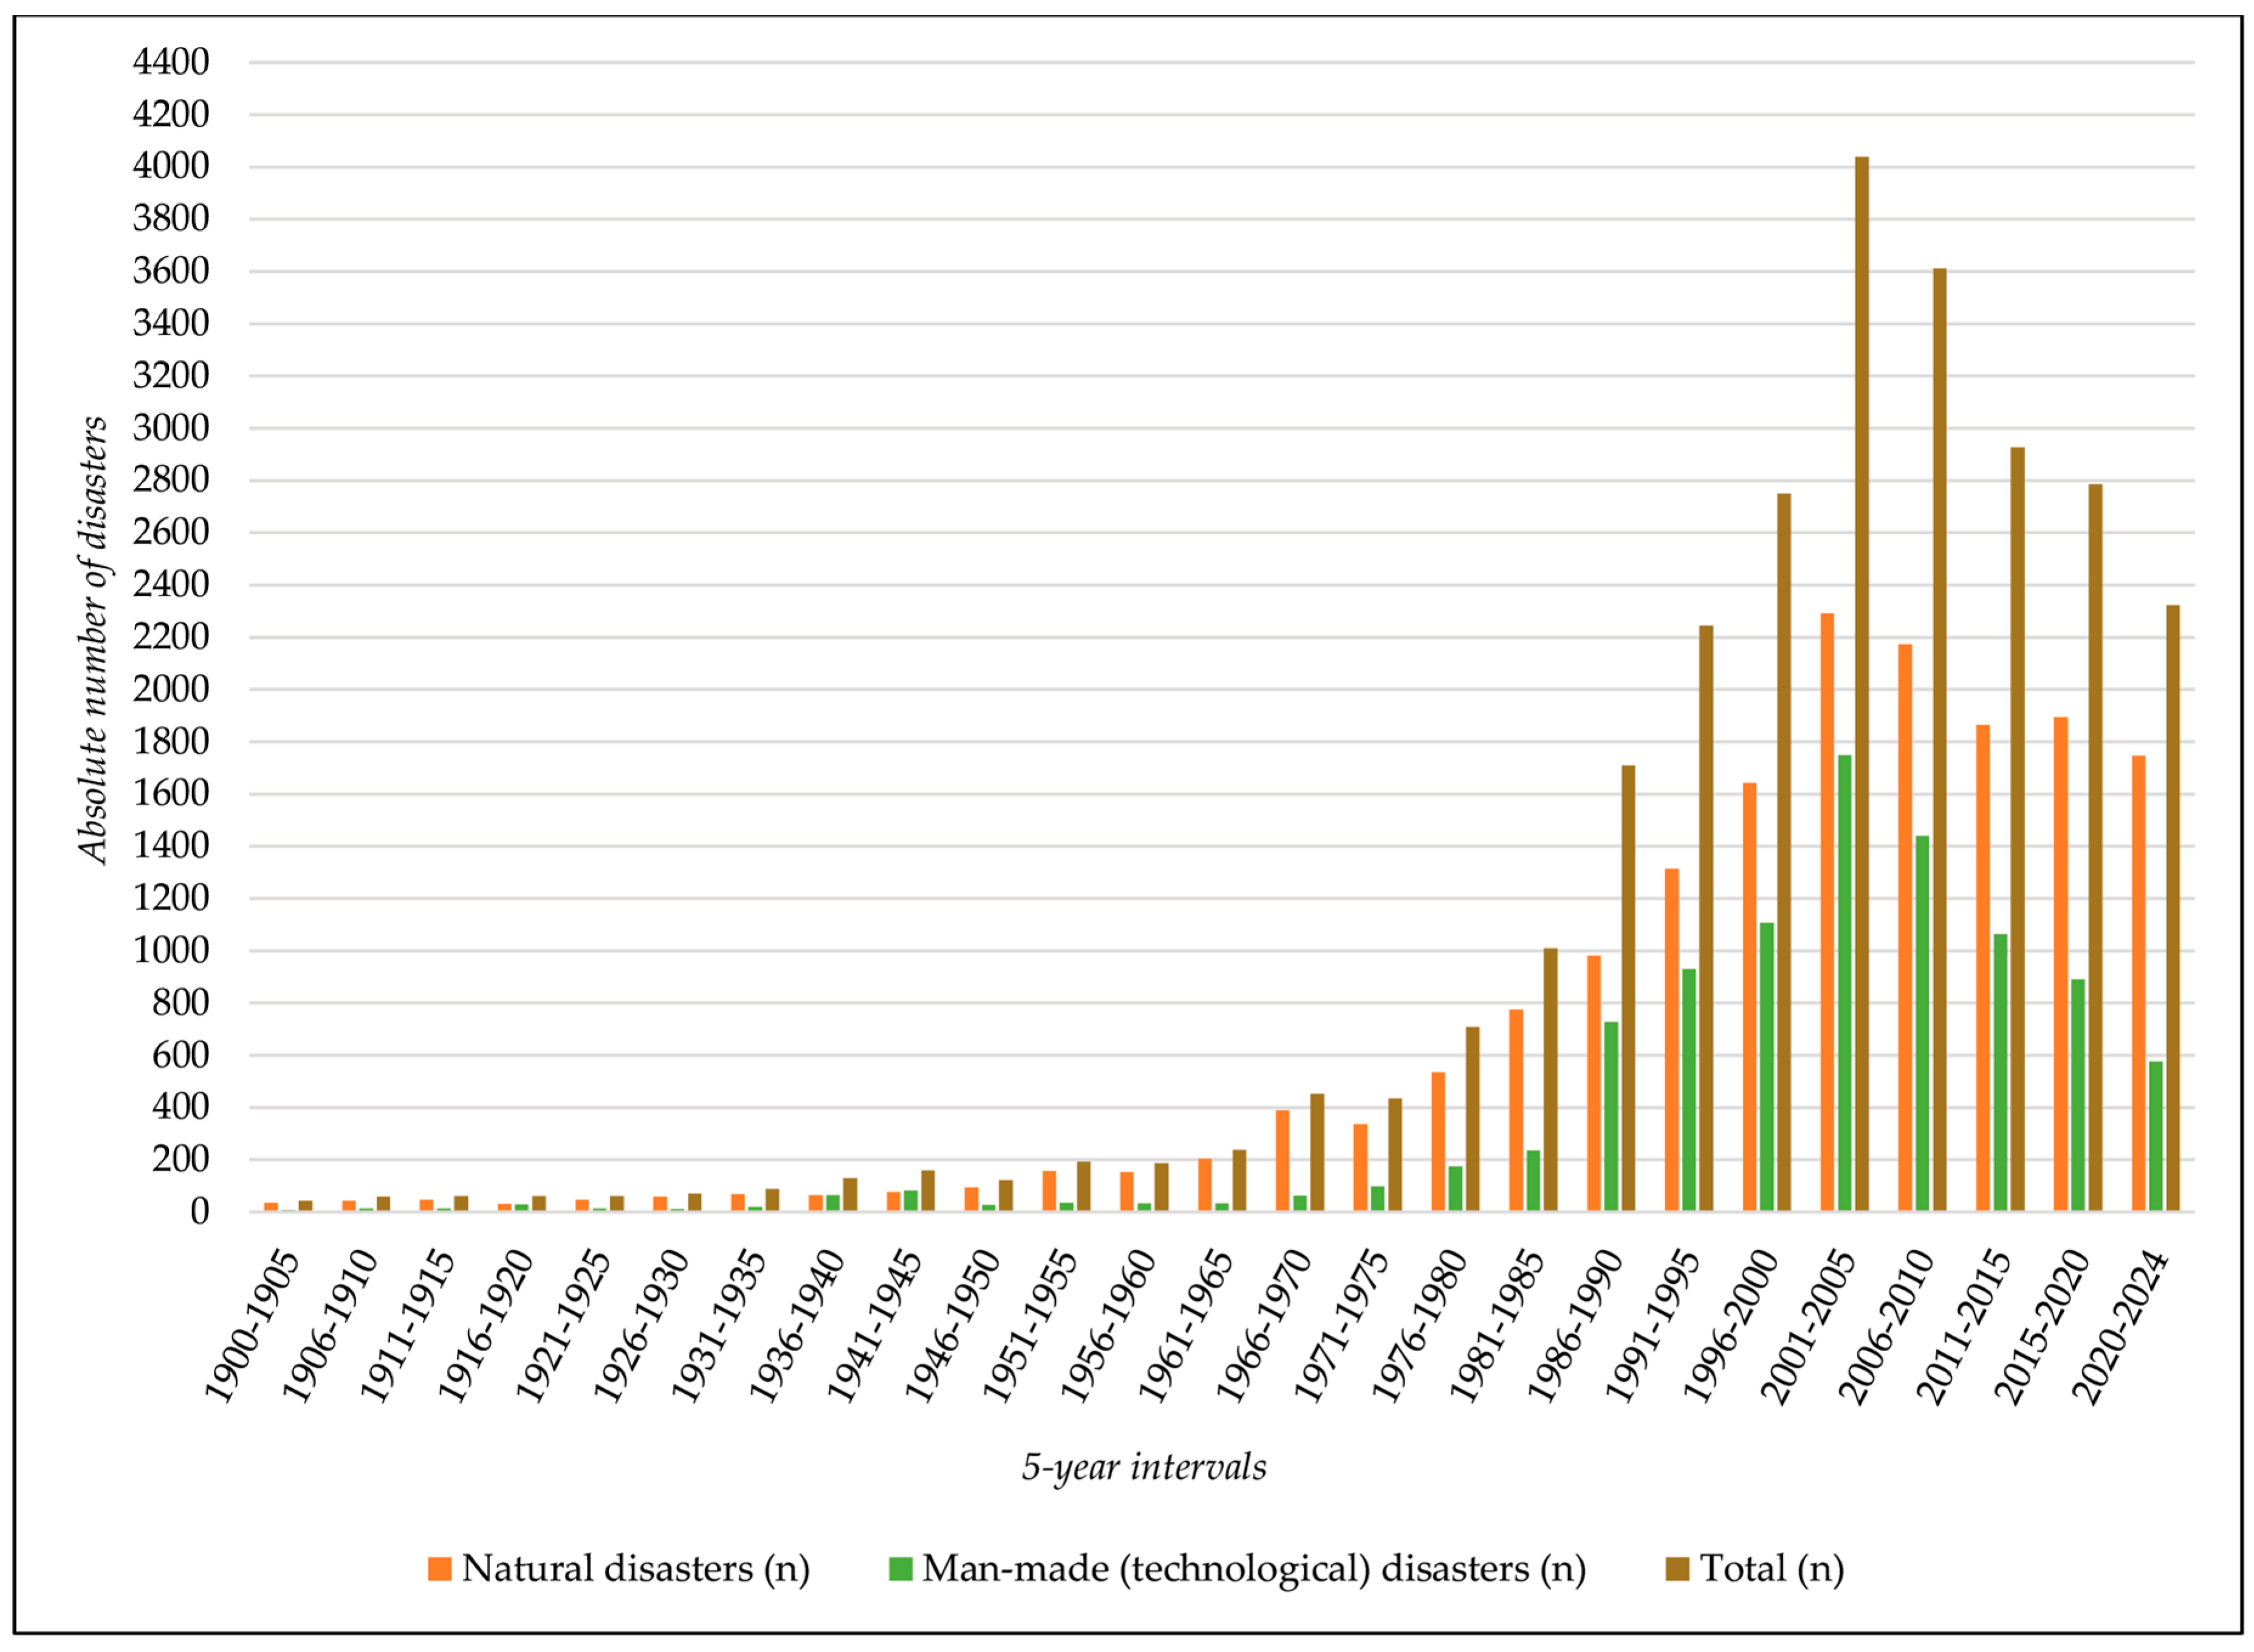
Figure 6.
Total number of different natural and man-made (technological) disasters worldwide by decade (1900-2024).
Figure 6.
Total number of different natural and man-made (technological) disasters worldwide by decade (1900-2024).
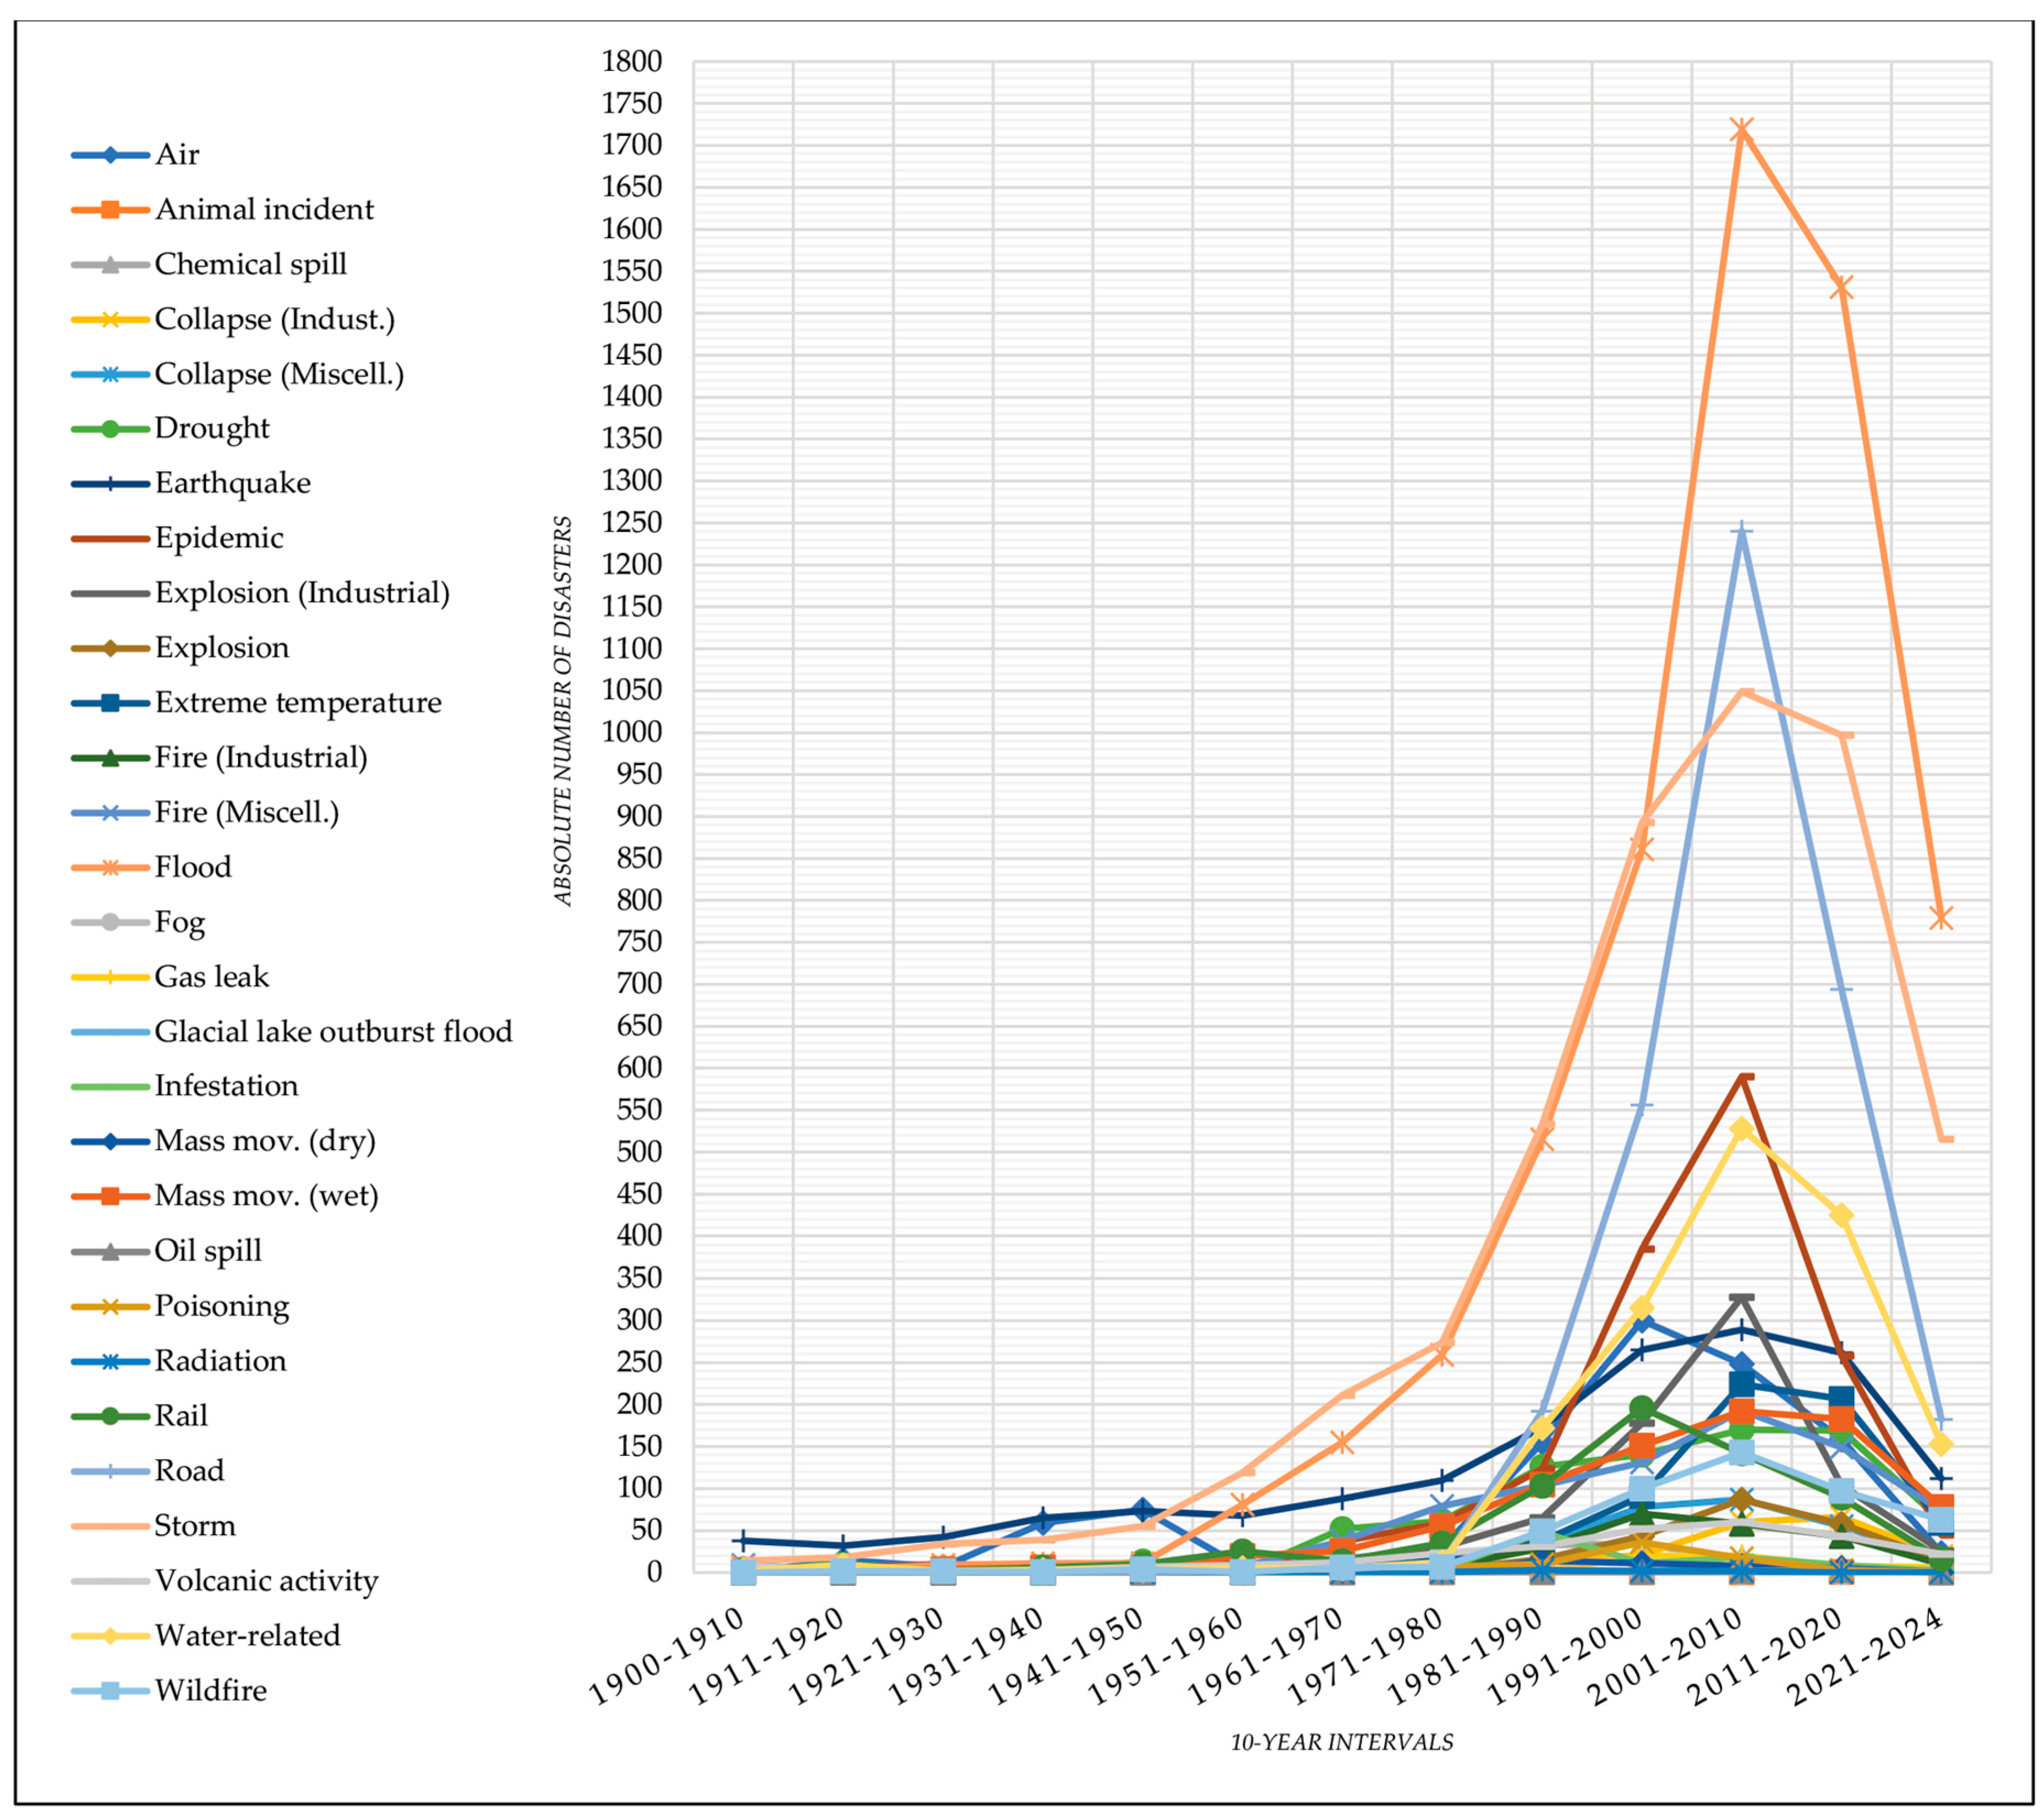
Figure 7.
Total number of diffrent natural and man-made (technological) disasters by 5 years period (1900-2024).
Figure 7.
Total number of diffrent natural and man-made (technological) disasters by 5 years period (1900-2024).
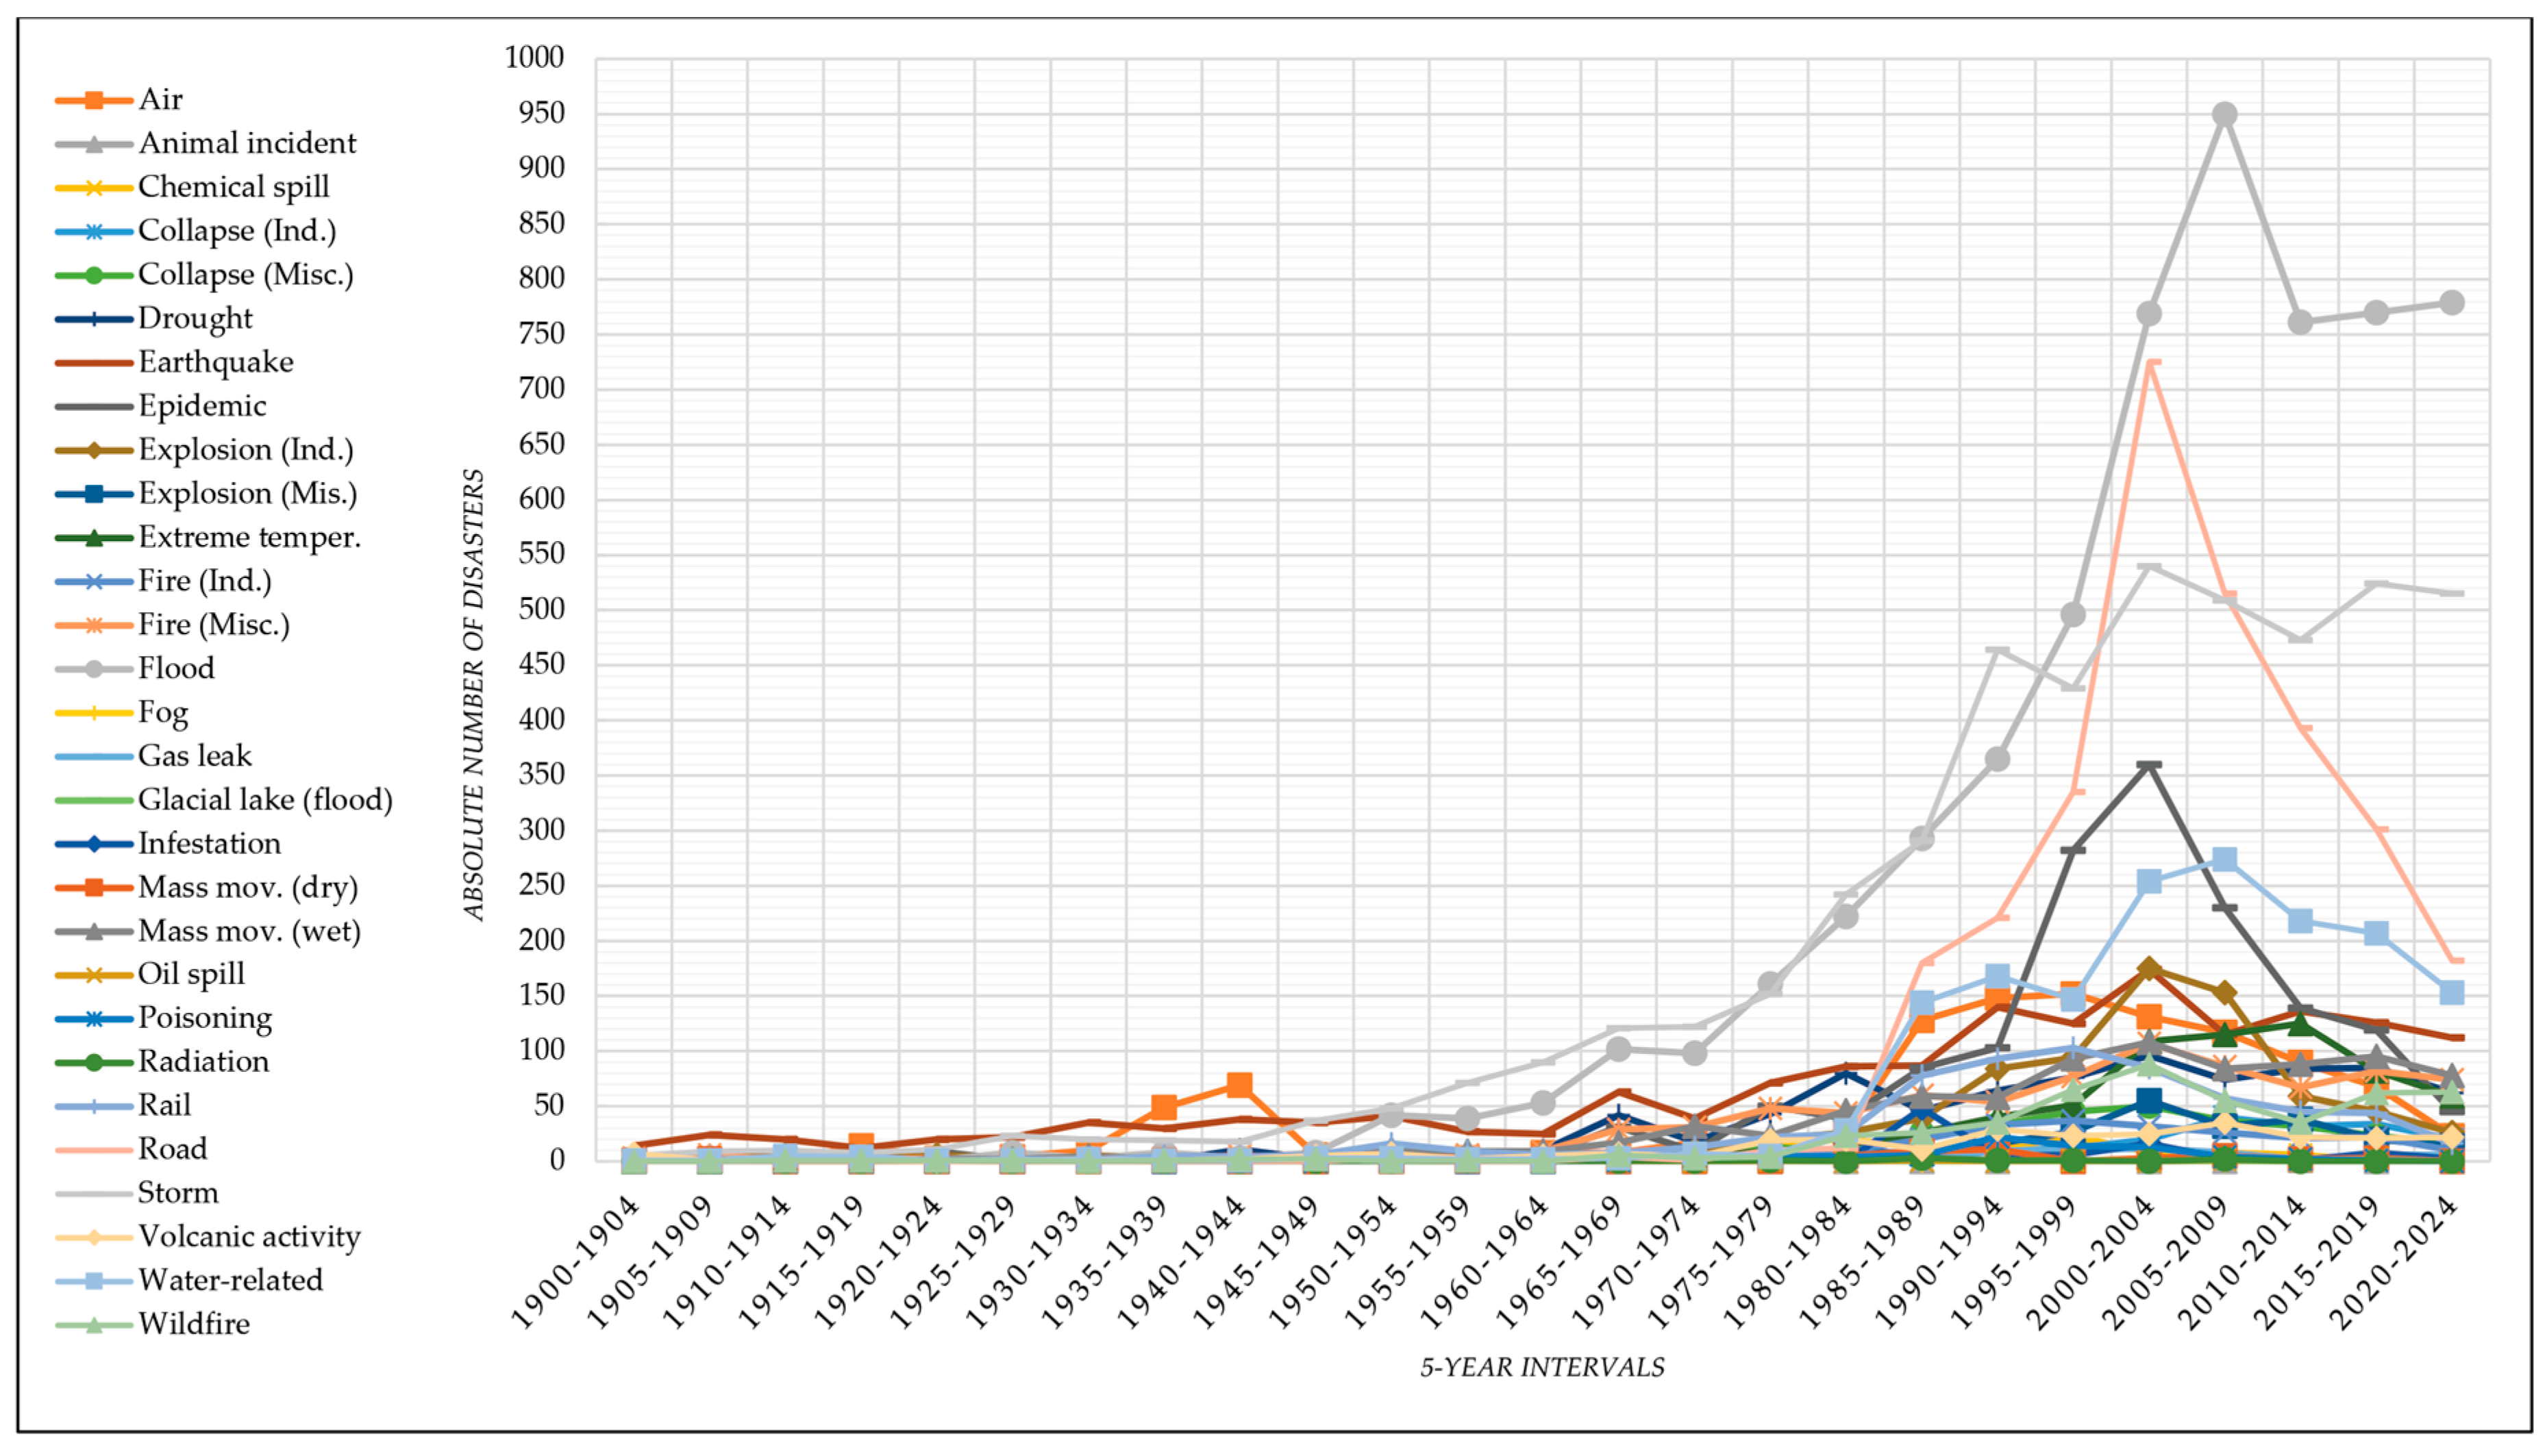
Figure 9.
Consequences of Natural and Man-made (Technological) Disasters by decades (1900-2024).
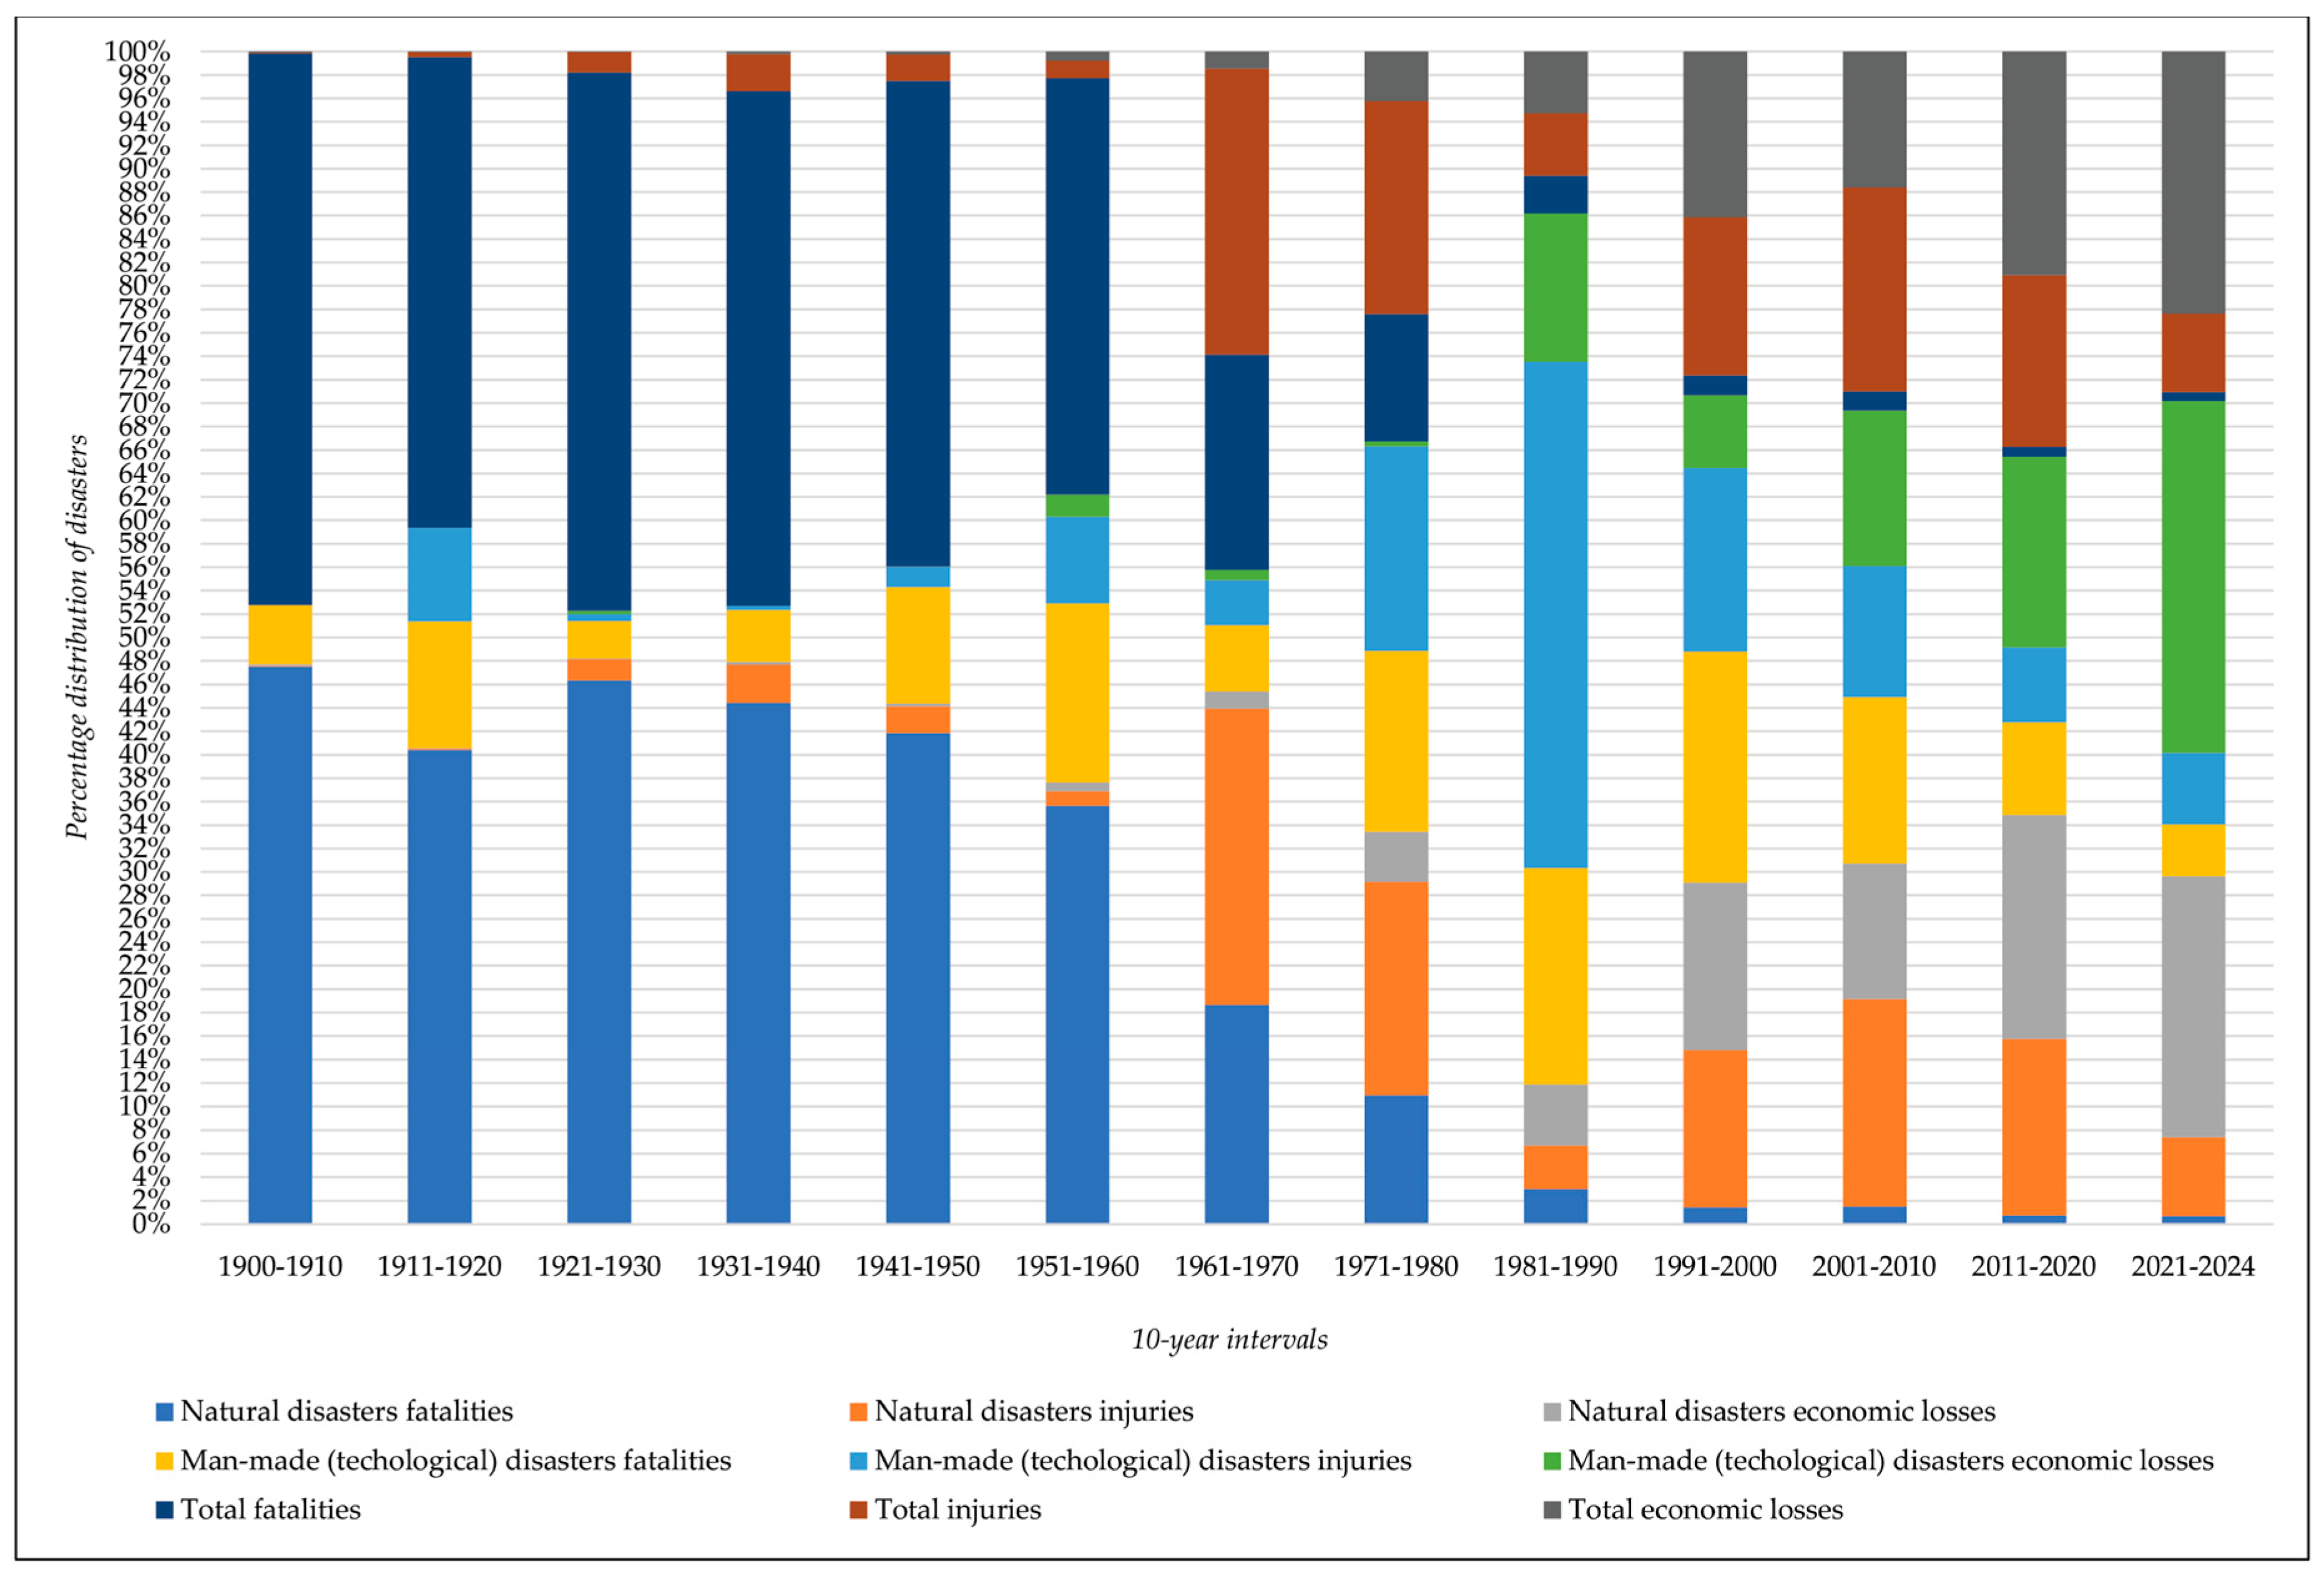
Figure 10.
Consequences of natural and man-made (technological) disasters by 5-years (1900-2024).
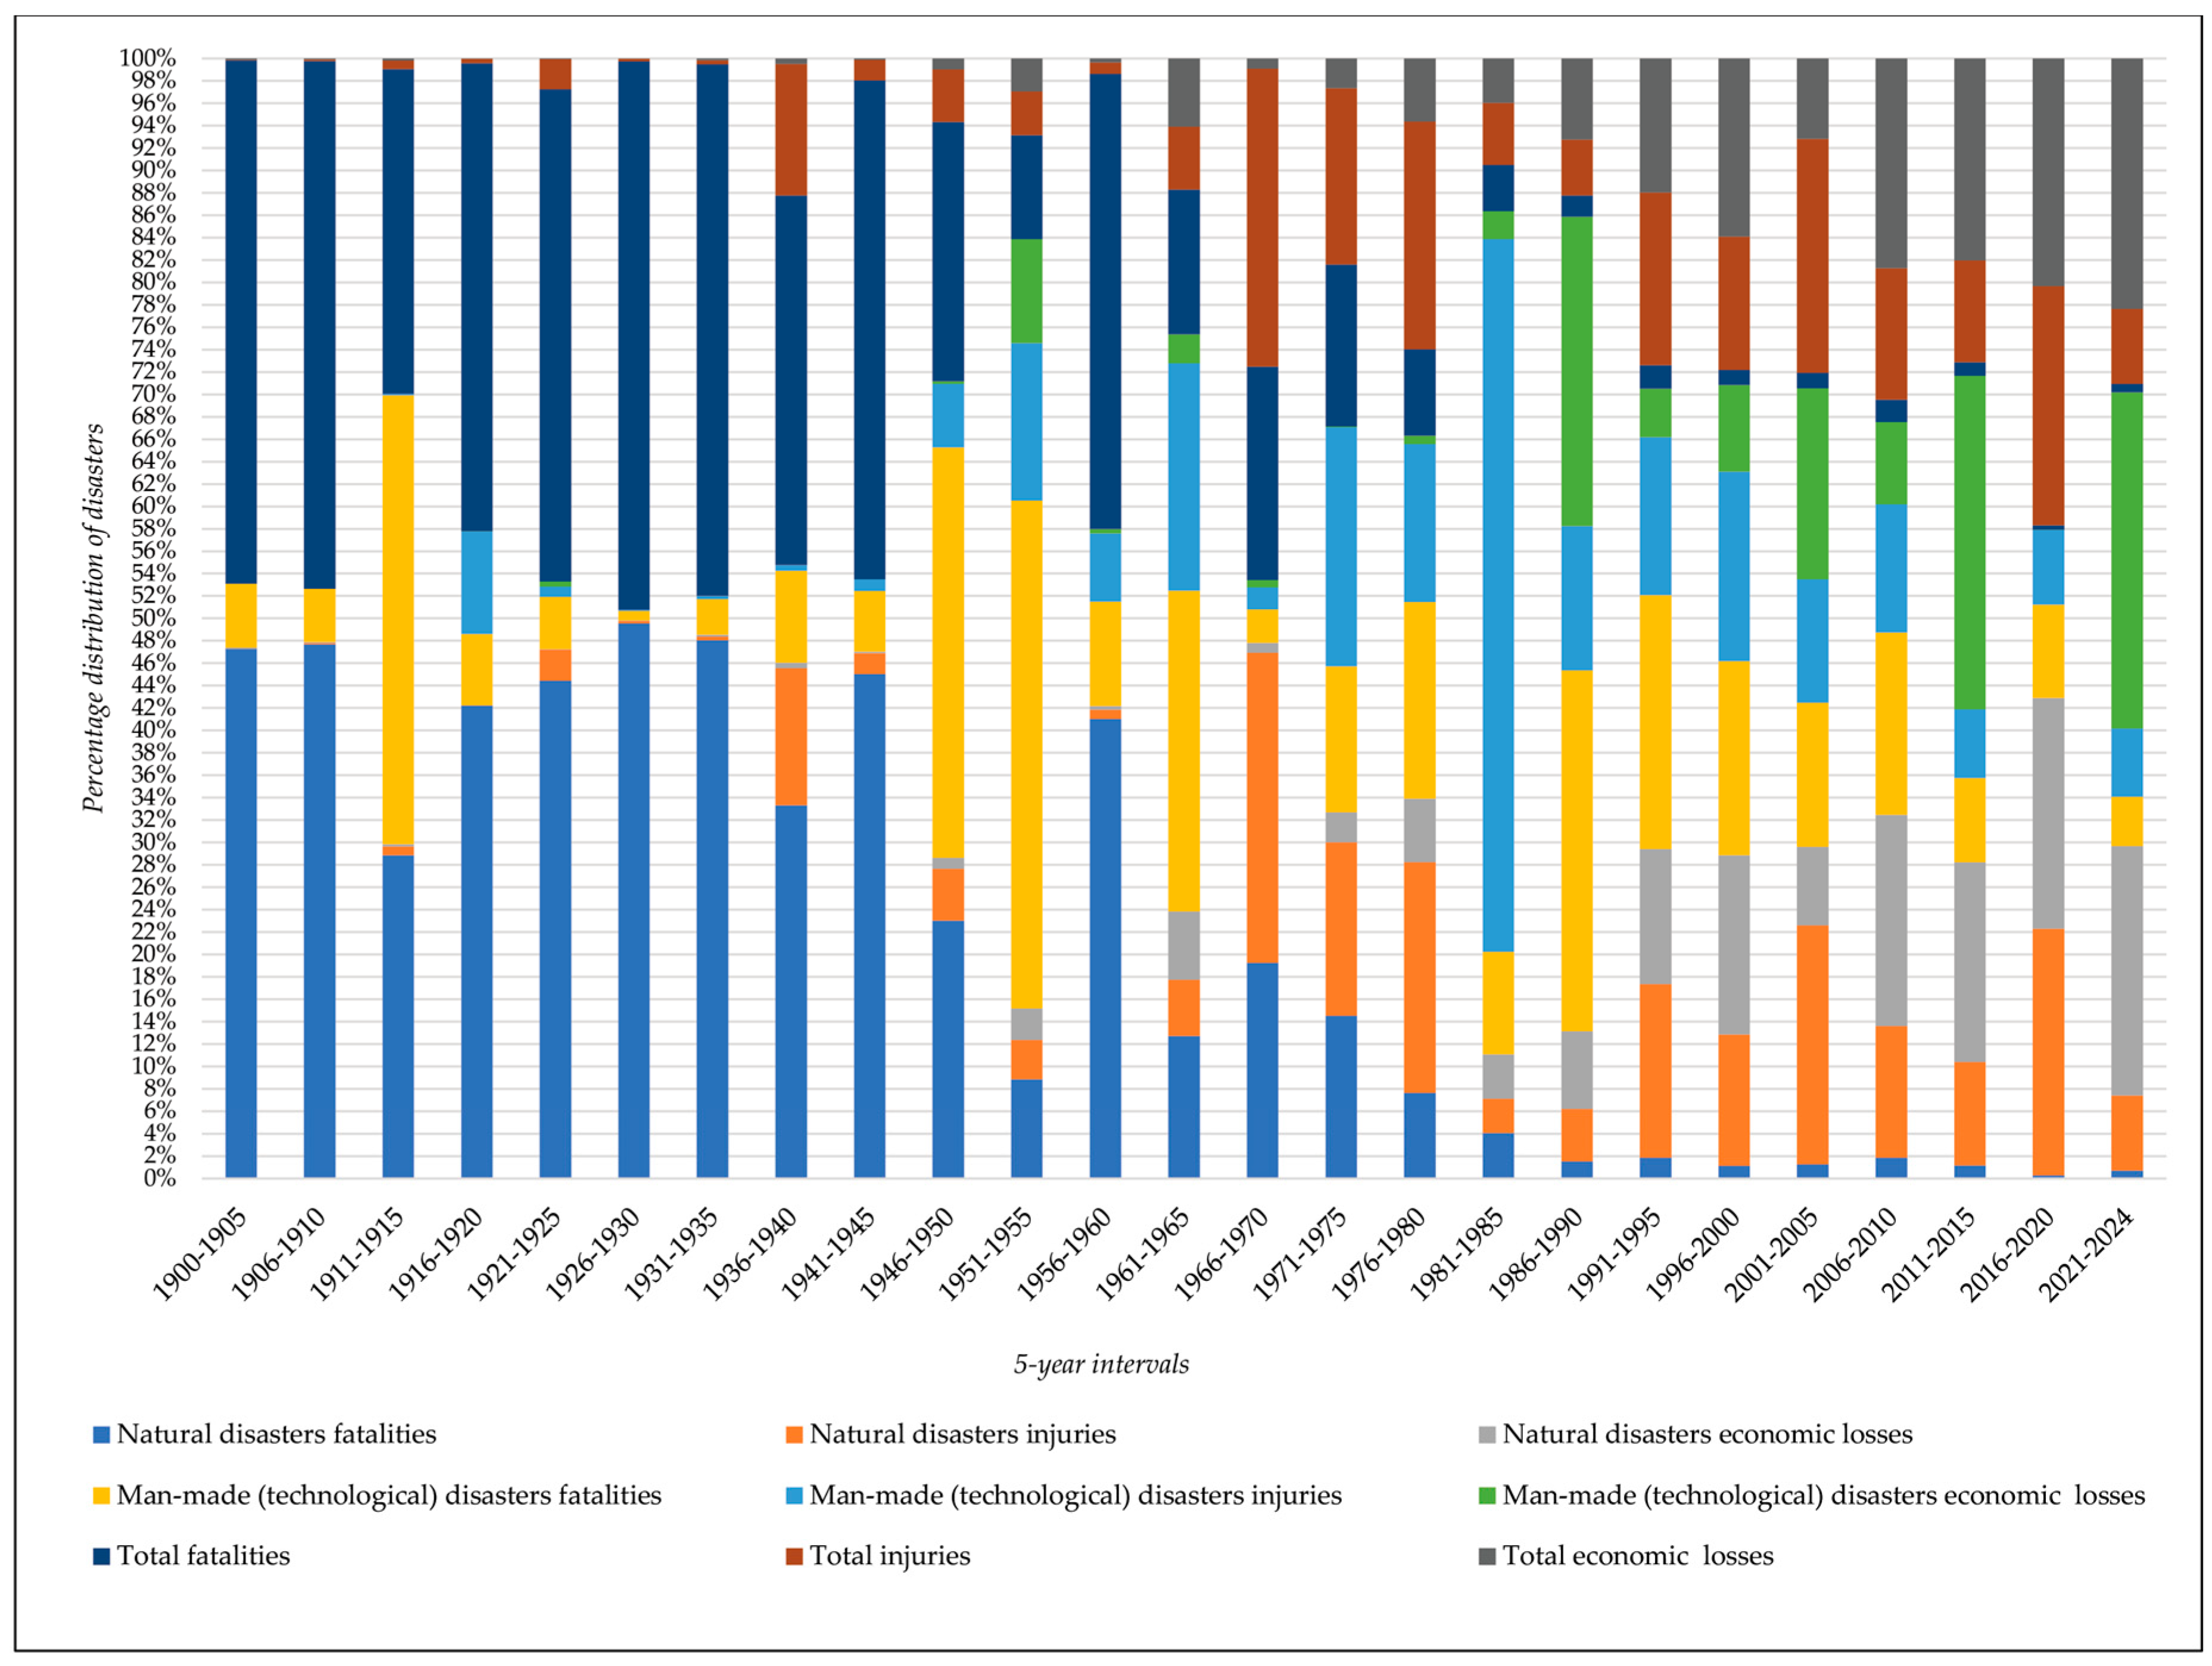
Figure 11.
Percentage distribution of natural and man-made (technological) disaster consequences by type (1900-2024).
Figure 11.
Percentage distribution of natural and man-made (technological) disaster consequences by type (1900-2024).
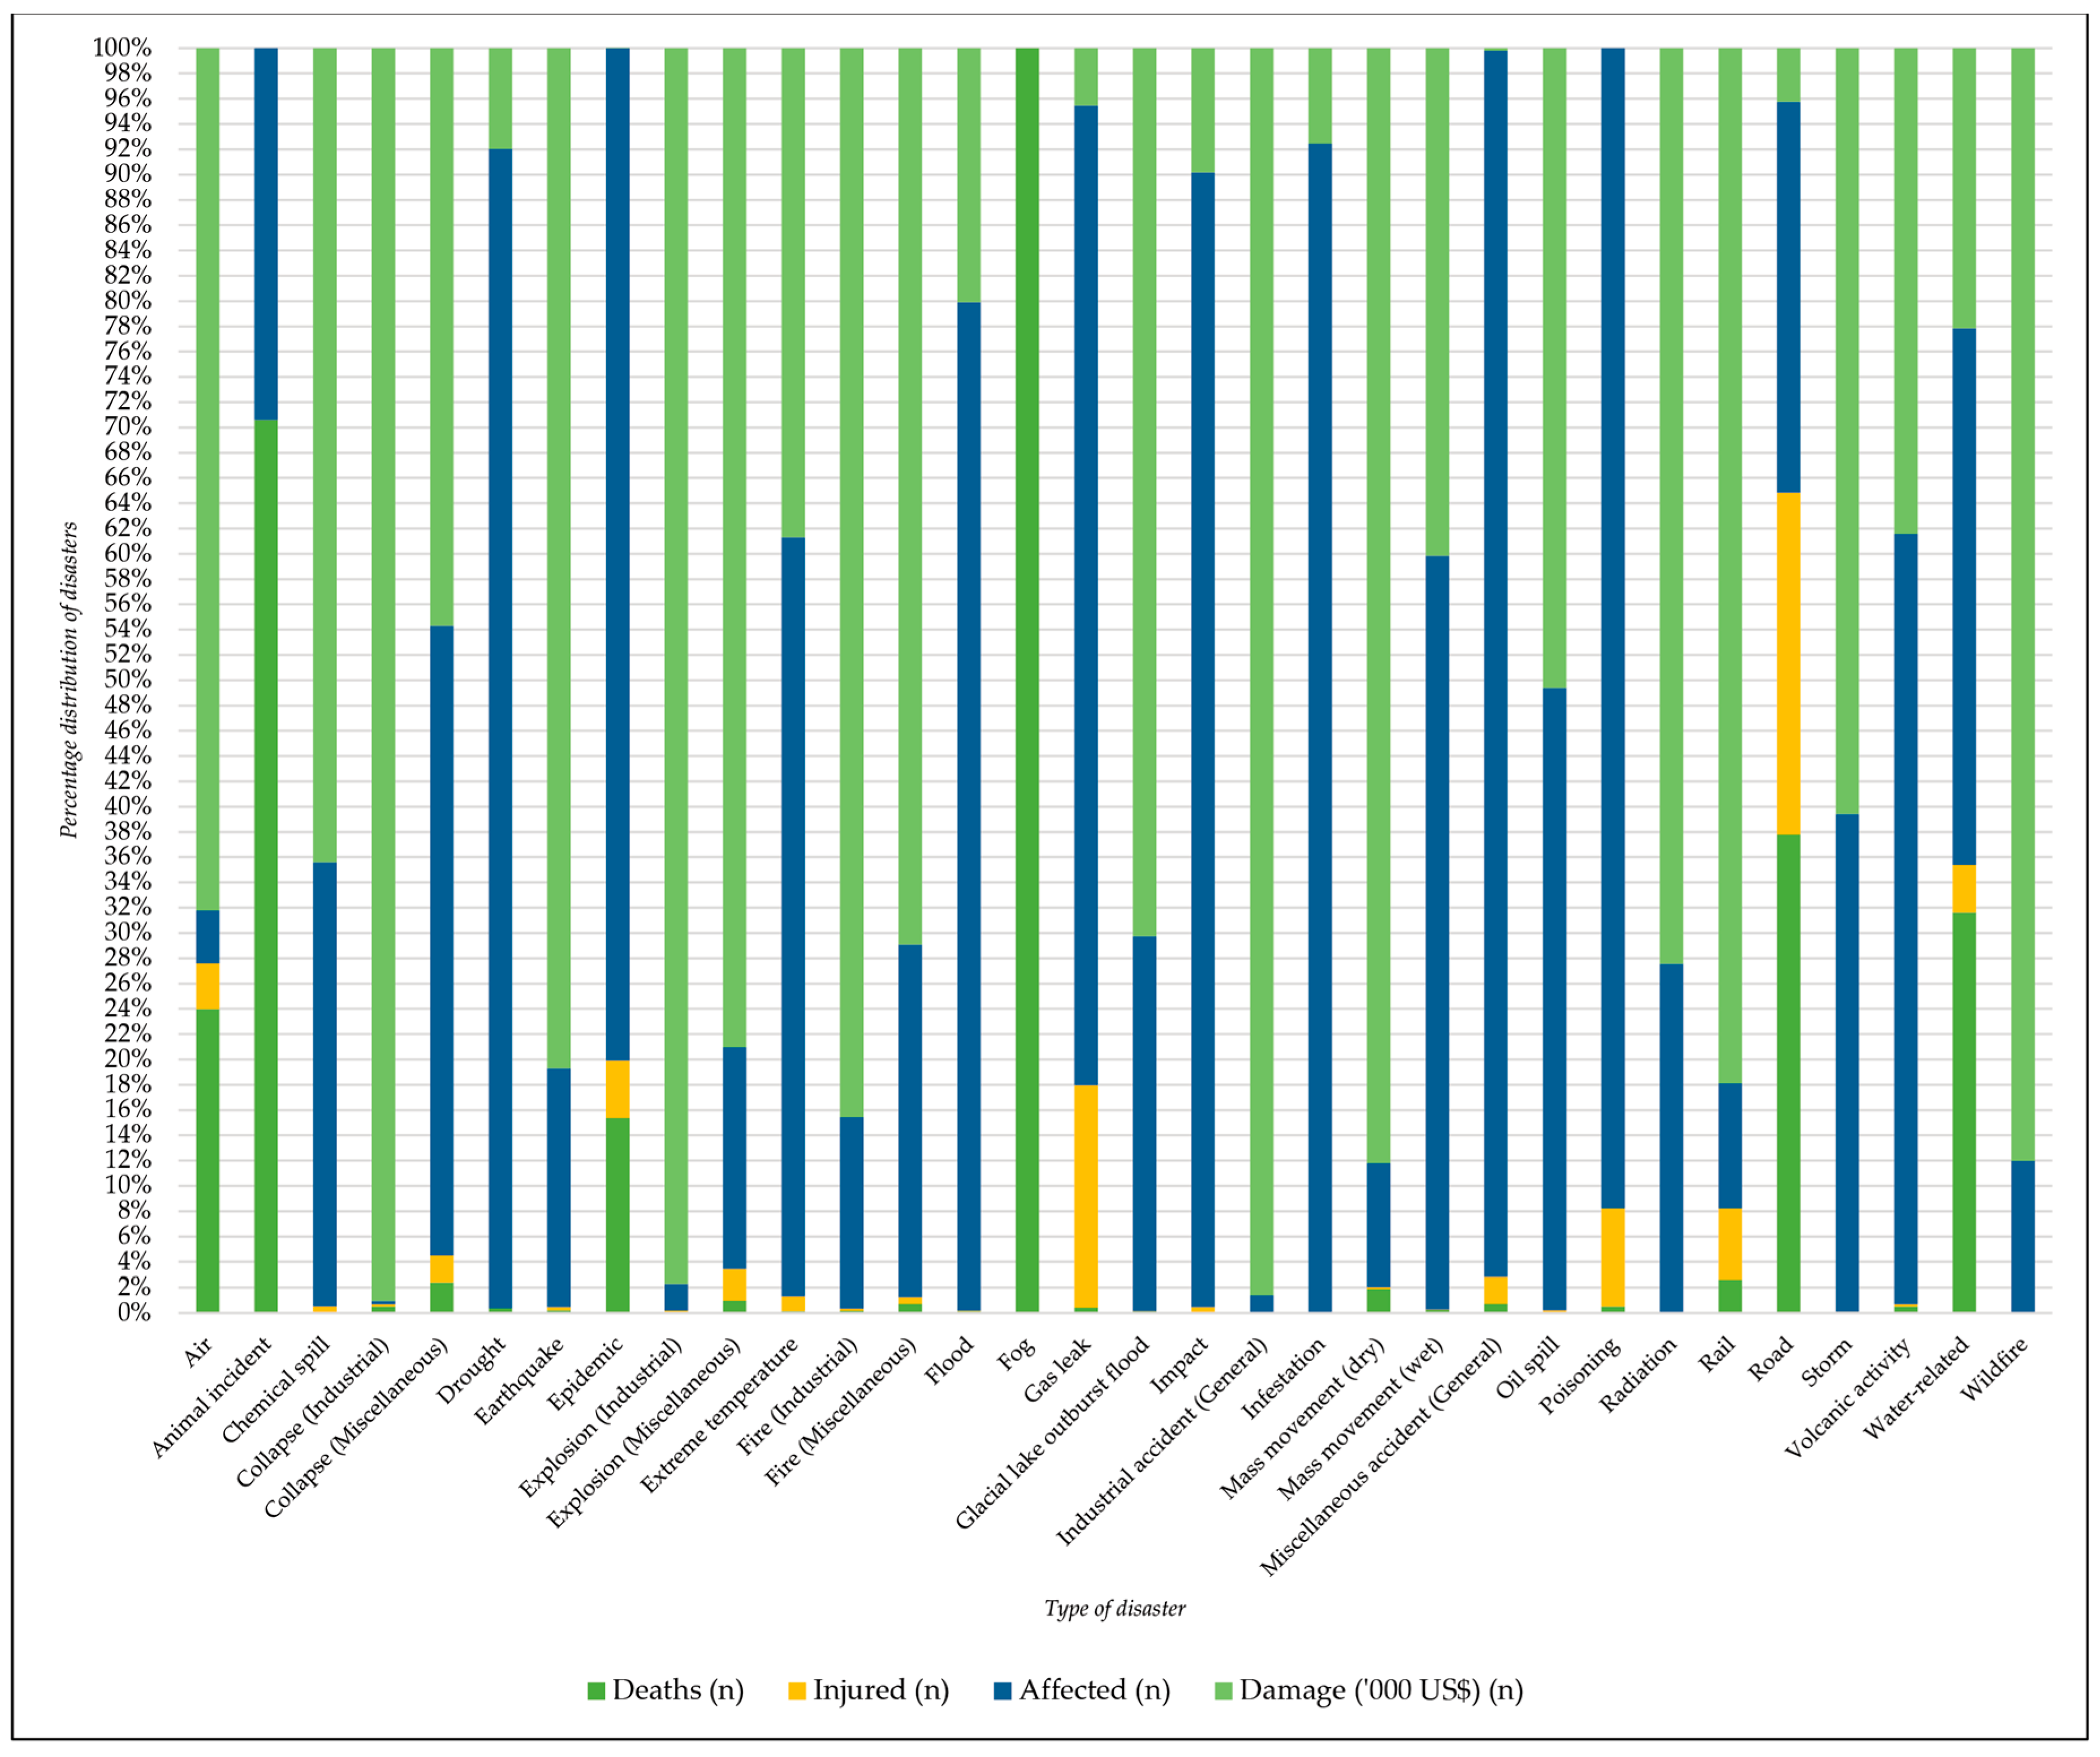

Table 1.
Geospatial distribution of natural and man-made (technological) disasters by continent (1900-2024).
Table 1.
Geospatial distribution of natural and man-made (technological) disasters by continent (1900-2024).
| Continent | Total disasters | Natural disasters | Man-made (tech.) disasters |
|||
|---|---|---|---|---|---|---|
| n | % | n | % | n | % | |
| North America | 3,575 | 13.84 | 2,708 | 75.75 | 867 | 24.25 |
| Asia | 10,786 | 41.75 | 6,675 | 61.89 | 4,111 | 38.11 |
| Africa | 5,540 | 21.44 | 3,114 | 56.21 | 2,426 | 43.79 |
| Europe | 3,091 | 11.96 | 1,995 | 64.54 | 1,096 | 35.46 |
| South America | 2,114 | 8.18 | 1,407 | 66.56 | 707 | 33.44 |
| Oceania | 730 | 2.83 | 668 | 91.51 | 62 | 8.49 |
| Total | 25,836 | 100 | 16,567 | 69.41 | 9,269 | 30.59 |
Table 2.
Distribution of individual natural and man-made (technological) disasters by continent (1900-2024).
Table 2.
Distribution of individual natural and man-made (technological) disasters by continent (1900-2024).
| Disaster type | North America |
Asia | Africa | Europe | South America | Oceania | Total | |||||||
|---|---|---|---|---|---|---|---|---|---|---|---|---|---|---|
| (n) | (%) | (n) | (%) | (n) | (%) | (n) | (%) | (n) | (%) | (n) | (%) | (n) | (%) | |
| Earthquake | 167 | 0.65 | 951 | 3.68 | 75 | 0.29 | 163 | 0.63 | 154 | 0.60 | 57 | 0.22 | 1567 | 6.07 |
| Volcanic activity | 45 | 0.17 | 112 | 0.43 | 19 | 0.07 | 11 | 0.04 | 45 | 0.17 | 32 | 0.12 | 264 | 1.00 |
| Flood | 688 | 2.66 | 2429 | 9.40 | 1240 | 4.80 | 650 | 2.52 | 685 | 2.65 | 160 | 0.62 | 5852 | 22.65 |
| Water-related | 99 | 0.38 | 703 | 2.72 | 561 | 2.17 | 163 | 0.63 | 63 | 0.24 | 14 | 0.05 | 1603 | 6.19 |
| Mass movement (wet) | 45 | 0.17 | 440 | 1.70 | 68 | 0.26 | 77 | 0.30 | 155 | 0.60 | 18 | 0.07 | 803 | 3.10 |
| Drought | 102 | 0.39 | 179 | 0.69 | 361 | 1.40 | 49 | 0.19 | 74 | 0.29 | 34 | 0.13 | 799 | 3.09 |
| Extreme temperature | 70 | 0.27 | 200 | 0.77 | 20 | 0.08 | 297 | 1.15 | 48 | 0.19 | 8 | 0.03 | 643 | 2.49 |
| Glacial lake outburst flood | 0 | 0.00 | 3 | 0.01 | 0 | 0.00 | 1 | 0.00 | 0 | 0.00 | 0 | 0.00 | 4 | 0.01 |
| Storm | 1338 | 5.18 | 1899 | 7.35 | 311 | 1.20 | 576 | 2.23 | 105 | 0.41 | 290 | 1.12 | 4519 | 17.49 |
| Epidemic | 100 | 0.39 | 361 | 1.40 | 899 | 3.48 | 44 | 0.17 | 84 | 0.33 | 24 | 0.09 | 1512 | 5.86 |
| Wildfire | 145 | 0.56 | 69 | 0.27 | 38 | 0.15 | 123 | 0.48 | 49 | 0.19 | 41 | 0.16 | 465 | 1.81 |
| Air | 187 | 0.72 | 312 | 1.21 | 169 | 0.65 | 233 | 0.90 | 124 | 0.48 | 21 | 0.08 | 1046 | 4.04 |
| Animal incident | 0 | 0.00 | 0 | 0.00 | 0 | 0.00 | 0 | 0.00 | 0 | 0.00 | 0 | 0.00 | 0 | 0.00 |
| Chemical spill | 47 | 0.18 | 20 | 0.08 | 4 | 0.02 | 29 | 0.11 | 3 | 0.01 | 1 | 0.00 | 104 | 0.40 |
| Collapse (Industrial) | 3 | 0.01 | 88 | 0.34 | 70 | 0.27 | 7 | 0.03 | 15 | 0.06 | 0 | 0.00 | 183 | 0.71 |
| Collapse (Miscellaneous) | 29 | 0.11 | 156 | 0.60 | 61 | 0.24 | 30 | 0.12 | 25 | 0.10 | 2 | 0.01 | 303 | 1.18 |
| Explosion (Industrial) | 57 | 0.22 | 509 | 1.97 | 59 | 0.23 | 108 | 0.42 | 32 | 0.12 | 4 | 0.02 | 769 | 2.98 |
| Explosion (Miscellaneous) | 17 | 0.07 | 118 | 0.46 | 40 | 0.15 | 35 | 0.14 | 10 | 0.04 | 0 | 0.00 | 220 | 0.86 |
| Fire (Industrial) | 22 | 0.09 | 137 | 0.53 | 15 | 0.06 | 35 | 0.14 | 7 | 0.03 | 0 | 0.00 | 216 | 0.85 |
| Fire (Miscellaneous) | 111 | 0.43 | 395 | 1.53 | 117 | 0.45 | 117 | 0.45 | 42 | 0.16 | 7 | 0.03 | 789 | 3.05 |
| Fog | 0 | 0.00 | 0 | 0.00 | 0 | 0.00 | 0 | 0.00 | 0 | 0.00 | 0 | 0.00 | 0 | 0.00 |
| Gas leak | 13 | 0.05 | 38 | 0.15 | 0 | 0.00 | 10 | 0.04 | 0 | 0.00 | 1 | 0.00 | 62 | 0.24 |
| Industrial accident | 7 | 0.03 | 89 | 0.34 | 16 | 0.06 | 5 | 0.02 | 8 | 0.03 | 1 | 0.00 | 126 | 0.48 |
| Infestation | 0 | 0.00 | 0 | 0.00 | 0 | 0.00 | 0 | 0.00 | 0 | 0.00 | 0 | 0.00 | 0 | 0.00 |
| Mass movement (dry) | 0 | 0.00 | 0 | 0.00 | 0 | 0.00 | 0 | 0.00 | 0 | 0.00 | 0 | 0.00 | 0 | 0.00 |
| Miscellaneous accident | 23 | 0.09 | 129 | 0.50 | 68 | 0.26 | 31 | 0.12 | 19 | 0.07 | 1 | 0.00 | 813 | 2.10 |
| Oil spill | 3 | 0.01 | 2 | 0.01 | 0 | 0.00 | 2 | 0.01 | 1 | 0.00 | 0 | 0.00 | 24 | 0.03 |
| Poisoning | 6 | 0.02 | 50 | 0.19 | 6 | 0.02 | 10 | 0.04 | 4 | 0.02 | 0 | 0.00 | 228 | 0.29 |
| Radiation | 1 | 0.00 | 4 | 0.02 | 0 | 0.00 | 0 | 0.00 | 1 | 0.00 | 0 | 0.00 | 18 | 0.01 |
| Rail | 74 | 0.29 | 288 | 1.11 | 111 | 0.43 | 122 | 0.47 | 15 | 0.06 | 5 | 0.02 | 1845 | 2.38 |
| Road | 168 | 0.65 | 1073 | 4.15 | 1129 | 4.37 | 159 | 0.62 | 338 | 1.31 | 5 | 0.02 | 8616 | 11.21 |
Table 3.
Distribution of total, natural, and man-made (technological) disasters by country (1900-2024).
Table 3.
Distribution of total, natural, and man-made (technological) disasters by country (1900-2024).
| Country (rang) | Total disasters |
Natural disasters |
Man-made (tech.) disasters |
Top 5 disasters by country | |||||||
|---|---|---|---|---|---|---|---|---|---|---|---|
| (n) | (%) | (n) | (%) | (n) | (%) | 1th | 2th | 3th | 4th | 5th | |
| 1. China | 1,996 | 7.54 | 1,012 | 50.70 | 984 | 49.30 | IA (15.08) | S (14.73) | F (14.53) | D (14.28) | E (14.23) |
| 2. India | 1,581 | 5.97 | 776 | 49.08 | 805 | 50.92 | E (15.50) | IA (14.86) | D (14.80) | F (14.29) | E (14.17) |
| 3. USA | 1,513 | 5.72 | 1,152 | 76.14 | 361 | 23.86 | E (15.27) | IA (14.87) | D (14.47) | F (14.41) | W (13.88) |
| 4. Philippines | 938 | 3.54 | 698 | 74.41 | 240 | 25.59 | IA (16.10) | S (14.71) | D (14.50) | E (14.39) | W (14.18) |
| 5. Indonesia | 878 | 3.32 | 621 | 70.73 | 257 | 29.27 | F (16.40) | E (15.15) | D (15.03) | E (14.81) | W (13.44) |
| 6. Bangladesh | 588 | 2.22 | 363 | 61.73 | 225 | 38.27 | F (15.99) | D (15.14) | IA (15.14) | E (14.97) | S (13.27) |
| 7. Nigeria | 523 | 1.98 | 143 | 27.34 | 380 | 72.66 | W (16.63) | S (16.44) | IA (14.72) | E (14.53) | D (13.38) |
| 8. Pakistan | 504 | 1.90 | 254 | 50.40 | 250 | 49.60 | F (15.08) | W (15.08) | S (14.88) | IA (14.29) | E (13.89) |
| 9. Mexico | 481 | 1.82 | 304 | 63.20 | 177 | 36.80 | W (17.88) | E (15.59) | F (15.18) | D (13.51) | E (12.89) |
| 10. Japan | 464 | 1.75 | 389 | 83.84 | 75 | 16.16 | W (17.24) | E (15.73) | S (15.09) | D (14.44) | IA (13.79) |
| 11. Brazil | 462 | 1.75 | 283 | 61.26 | 179 | 38.74 | E (15.15) | IA (15.15) | W (14.94) | D (14.72) | F (14.50) |
| 12. Iran | 442 | 1.67 | 265 | 59.95 | 177 | 40.05 | D (17.87) | E (15.61) | W (15.16) | IA (14.48) | F (13.35) |
| 13. Russia | 417 | 1.58 | 178 | 42.69 | 239 | 57.31 | E (17.27) | W (15.35) | S (15.11) | D (14.63) | IA (13.43) |
| 14. Peru | 397 | 1.50 | 217 | 54.66 | 180 | 45.34 | F (15.87) | E (15.37) | E (14.36) | S (14.11) | IA (13.85) |
| 15. Türkiye | 390 | 1.47 | 217 | 55.64 | 173 | 44.36 | D (16.67) | IA (15.13) | W (15.13) | S (14.36) | F (13.33) |
| 16. Congo | 342 | 1.29 | 155 | 45.32 | 187 | 54.68 | S (17.54) | W (14.91) | D (14.04) | IA (14.04) | E (13.45) |
| 17. Colombia | 339 | 1.28 | 232 | 68.44 | 107 | 31.56 | IA (16.52) | E (16.22) | D (14.45) | E (14.45) | S (14.45) |
| 18. Viet Nam | 338 | 1.28 | 264 | 78.11 | 74 | 21.89 | S (16.86) | E (16.57) | D (15.98) | W (15.38) | F (14.79) |
| 19. South Africa | 326 | 1.23 | 129 | 39.57 | 197 | 60.43 | D (16.56) | S (15.64) | F (14.72) | IA (14.72) | E (14.42) |
| 20. France | 296 | 1.12 | 203 | 68.58 | 93 | 31.42 | W (20.27) | IA (14.53) | E (14.19) | D (13.85) | S (13.51) |
| 21. Italy | 285 | 1.08 | 187 | 65.61 | 98 | 34.39 | F (17.54) | IA (17.54) | S (15.44) | D (13.68) | E (13.33) |
| 22. Afghanistan | 274 | 1.04 | 219 | 79.93 | 55 | 20.07 | E (17.88) | F (16.06) | S (14.60) | D (14.23) | W (13.14) |
| 23. Thailand | 274 | 1.04 | 172 | 62.77 | 102 | 37.23 | E (20.07) | W (17.88) | E (13.50) | S (13.14) | D (12.77) |
| 24. Australia | 257 | 0.97 | 223 | 86.77 | 34 | 13.23 | E (17.51) | D (15.18) | F (14.01) | S (14.01) | E (13.23) |
| 25. Egypt | 252 | 0.95 | 36 | 14.29 | 216 | 85.71 | E (20.24) | E (15.08) | IA (13.89) | W (13.49) | S (12.70) |
| 26. Canada | 246 | 0.93 | 153 | 62.20 | 93 | 37.80 | F (17.89) | D (15.04) | S (14.23) | E (13.82) | IA (13.82) |
| 27. Kenya | 231 | 0.87 | 126 | 54.55 | 105 | 45.45 | IA (17.75) | F (16.88) | E (16.02) | S (13.85) | D (13.42) |
| 28. Nepal | 215 | 0.81 | 139 | 64.65 | 76 | 35.35 | E (18.14) | S (16.74) | D (14.88) | E (14.88) | IA (12.56) |
| 29. Tanzania | 214 | 0.81 | 122 | 57.01 | 92 | 42.99 | W (20.56) | IA (16.36) | E (14.49) | F (14.49) | E (13.08) |
| 30. Great Britain | 204 | 0.77 | 105 | 51.47 | 99 | 48.53 | E (19.12) | E (15.69) | F (15.69) | D (14.22) | W (13.24) |
| 31. Rep. Korea | 202 | 0.76 | 132 | 65.35 | 70 | 34.65 | E (17.82) | F (17.82) | W (14.85) | E (13.86) | IA (13.37) |
| 32. Haiti | 196 | 0.74 | 138 | 70.41 | 58 | 29.59 | W (18.37) | IA (17.35) | E (14.80) | F (13.78) | E (13.27) |
| 33. Sudan | 196 | 0.74 | 108 | 55.10 | 88 | 44.90 | IA (18.88) | S (18.37) | F (15.82) | D (14.29) | E (12.76) |
| 34. Uganda | 191 | 0.72 | 111 | 58.12 | 80 | 41.88 | S (17.80) | F (16.23) | E (15.18) | IA (13.61) | D (12.57) |
| 35. Spain | 188 | 0.71 | 112 | 59.57 | 76 | 40.43 | F (17.55) | E (14.89) | E (14.36) | S (14.36) | W (13.83) |
| 36.Taiwan | 187 | 0.71 | 136 | 72.73 | 51 | 27.27 | IA (18.18) | W (14.97) | F (14.44) | D (13.90) | E (13.37) |
| 37. Argentina | 180 | 0.68 | 131 | 72.78 | 49 | 27.22 | W (19.44) | E (18.33) | D (14.44) | F (13.33) | IA (13.33) |
| 38. Ecuador | 166 | 0.63 | 119 | 71.69 | 47 | 28.31 | E (15.06) | E (15.06) | F (15.06) | W (15.06) | IA (13.86) |
| 39. Guatemala | 165 | 0.62 | 127 | 76.97 | 38 | 23.03 | W (16.97) | D (15.76) | S (15.76) | E (13.94) | E (13.33) |
| 40. Ethiopia | 163 | 0.62 | 127 | 77.91 | 36 | 22.09 | D (20.25) | E (17.18) | E (14.72) | F (14.72) | S (14.11) |
| 41. Greece | 163 | 0.62 | 111 | 68.10 | 52 | 31.90 | S (19.02) | E (16.56) | W (15.95) | E (14.11) | IA (12.27) |
| 42. Myanmar | 159 | 0.60 | 89 | 55.97 | 70 | 44.03 | E (18.24) | D (17.61) | F (15.09) | IA (14.47) | S (13.21) |
| 43. Bolivia | 157 | 0.59 | 112 | 71.34 | 45 | 28.66 | F (15.92) | IA (14.65) | W (14.65) | D (14.01) | E (14.01) |
| 44. Sri Lanka | 157 | 0.59 | 131 | 83.44 | 26 | 16.56 | E (21.02) | W (15.92) | S (14.65) | D (14.01) | E (13.38) |
| 45. Algeria | 156 | 0.59 | 93 | 59.62 | 63 | 40.38 | E (16.03) | W (16.03) | S (15.38) | D (14.74) | F (14.74) |
| 46. Belgium | 156 | 0.59 | 72 | 46.15 | 84 | 53.85 | E (17.31) | IA (17.31) | E (14.74) | D (14.10) | F (14.10) |
| 47. Morocco | 156 | 0.59 | 63 | 40.38 | 93 | 59.62 | W (17.31) | E (16.67) | IA (16.03) | S (16.03) | D (11.54) |
| 48. Mozambique | 156 | 0.59 | 125 | 80.13 | 31 | 19.87 | D (19.23) | E (15.38) | F (15.38) | W (14.74) | S (13.46) |
| 49. Chile | 152 | 0.57 | 125 | 82.24 | 27 | 17.76 | F (18.42) | E (15.79) | D (14.47) | E (14.47) | W (13.16) |
| 50. Malaysia | 152 | 0.57 | 109 | 71.71 | 43 | 28.29 | IA (21.05) | S (19.74) | F (15.79) | D (13.82) | W (13.82) |
Note: Industrial Accident (IA); Storm (S); Flood (F); Drought (D); Epidemic (E); Wildfire (W); Earthquake (E).
Table 4.
Temporal analysis of natural and man-made (technological) disasters in 10-year intervals (1900-2024): trend assessments and insights.
Table 4.
Temporal analysis of natural and man-made (technological) disasters in 10-year intervals (1900-2024): trend assessments and insights.
| Decade | Natural disasters |
Man-made (technological) disasters |
Total | Trend | |||
|---|---|---|---|---|---|---|---|
| (n) | (%) | (n) | (%) | (n) | (%) | Rate (%) | |
| 1900-1910 | 79 | 78.22 | 22 | 21.78 | 101 | 0.38 | Stable (0.00%) |
| 1911-1920 | 78 | 64.46 | 43 | 35.54 | 121 | 0.46 | Increasing (19.57%) |
| 1921-1930 | 106 | 80.30 | 26 | 19.70 | 132 | 0.50 | Increasing (7.40%) |
| 1931-1940 | 133 | 61.29 | 84 | 38.71 | 217 | 0.82 | Increasing (42.20%) |
| 1941-1950 | 171 | 60.85 | 110 | 39.15 | 281 | 1.06 | Increasing (11.73%) |
| 1951-1960 | 310 | 82.01 | 68 | 17.99 | 378 | 1.43 | Increasing (10.05%) |
| 1961-1970 | 594 | 86.09 | 96 | 13.91 | 690 | 2.61 | Increasing (13.59%) |
| 1971-1980 | 871 | 76.14 | 273 | 23.86 | 1144 | 4.32 | Increasing (6.10%) |
| 1981-1990 | 1755 | 64.57 | 963 | 35.43 | 2718 | 10.27 | Increasing (5.33%) |
| 1991-2000 | 2957 | 59.20 | 2038 | 40.80 | 4995 | 18.87 | Increasing (1.71%) |
| 2001-2010 | 4464 | 58.35 | 3187 | 41.65 | 7651 | 28.91 | Increasing (0.70%) |
| 2011-2020 | 3758 | 65.78 | 1955 | 34.22 | 5713 | 21.59 | Decreasing (−0.44%) |
| 2021-2024 | 1747 | 75.20 | 576 | 24.80 | 2323 | 8.78 | Decreasing (−2.49%) |
Table 5.
Temporal analysis of natural and man-made (technological) disasters in 5-year intervals (1900-2024).
Table 5.
Temporal analysis of natural and man-made (technological) disasters in 5-year intervals (1900-2024).
| Period (5-year intervals) |
Natural disasters |
Man-made (technological) disasters |
Total | Trend | |||
|---|---|---|---|---|---|---|---|
| (n) | (%) | (n) | (%) | (n) | (%) | (%) | |
| 1900-1905 | 35 | 81.40 | 8 | 18.60 | 43 | 0.16 | Stable (0.00%) |
| 1906-1910 | 44 | 75.86 | 14 | 24.14 | 58 | 0.22 | Increasing (34.88%) |
| 1911-1915 | 47 | 77.05 | 14 | 22.95 | 61 | 0.23 | Increasing (5.17%) |
| 1916-1920 | 31 | 51.67 | 29 | 48.33 | 60 | 0.23 | Decreasing (−1.64%) |
| 1921-1925 | 47 | 77.05 | 14 | 22.95 | 61 | 0.23 | Increasing (1.67%) |
| 1926-1930 | 59 | 83.10 | 12 | 16.90 | 71 | 0.27 | Increasing (16.39%) |
| 1931-1935 | 68 | 77.27 | 20 | 22.73 | 88 | 0.33 | Increasing (23.94%) |
| 1936-1940 | 65 | 50.39 | 64 | 49.61 | 129 | 0.49 | Increasing (46.59%) |
| 1941-1945 | 77 | 48.12 | 83 | 51.88 | 160 | 0.60 | Increasing (24.03%) |
| 1946-1950 | 94 | 77.69 | 27 | 22.31 | 121 | 0.46 | Decreasing (−24.38%) |
| 1951-1955 | 157 | 81.77 | 35 | 18.23 | 192 | 0.73 | Increasing (58.68%) |
| 1956-1960 | 153 | 82.26 | 33 | 17.74 | 186 | 0.70 | Decreasing (−3.12%) |
| 1961-1965 | 204 | 85.71 | 34 | 14.29 | 238 | 0.90 | Increasing (27.96%) |
| 1966-1970 | 390 | 86.28 | 62 | 13.72 | 452 | 1.71 | Increasing (89.92%) |
| 1971-1975 | 336 | 77.24 | 99 | 22.76 | 435 | 1.64 | Decreasing (−3.76%) |
| 1976-1980 | 535 | 75.46 | 174 | 24.54 | 709 | 2.68 | Increasing (62.99%) |
| 1981-1985 | 774 | 76.71 | 235 | 23.29 | 1009 | 3.81 | Increasing (42.31%) |
| 1986-1990 | 981 | 57.40 | 728 | 42.60 | 1709 | 6.46 | Increasing (69.38%) |
| 1991-1995 | 1314 | 58.53 | 931 | 41.47 | 2245 | 8.48 | Increasing (31.36%) |
| 1996-2000 | 1643 | 59.75 | 1107 | 40.25 | 2750 | 10.39 | Increasing (22.49%) |
| 2001-2005 | 2291 | 56.72 | 1748 | 43.28 | 4039 | 15.26 | Increasing (46.87%) |
| 2006-2010 | 2173 | 60.16 | 1439 | 39.84 | 3612 | 13.65 | Decreasing (−10.57%) |
| 2011-2015 | 1864 | 63.66 | 1064 | 36.34 | 2928 | 11.06 | Decreasing (−18.94%) |
| 2015-2020 | 1894 | 68.01 | 891 | 31.99 | 2785 | 10.52 | Decreasing (−4.88%) |
| 2020-2024 | 1747 | 75.20 | 576 | 24.80 | 2323 | 8.78 | Decreasing (−16.59%) |
Table 6.
Total number of different natural and man-made (technological) disasters worldwide by decade (1900-2024).
Table 6.
Total number of different natural and man-made (technological) disasters worldwide by decade (1900-2024).
| Disaster type | 1900-1910 | 1911-1920 | 1921-1930 | 1931-1940 | 1941-1950 | 1951-1960 | 1961-1970 | 1971-1980 | 1981-1990 | 1991-2000 | 2001-2010 | 2011-2020 | 2021-2024 | Total |
|---|---|---|---|---|---|---|---|---|---|---|---|---|---|---|
| Air | 0 | 15 | 7 | 59 | 75 | 6 | 16 | 29 | 155 | 300 | 248 | 158 | 23 | 1091 |
| Animal incident | 0 | 0 | 0 | 0 | 0 | 0 | 0 | 0 | 0 | 0 | 0 | 1 | 0 | 1 |
| Chemical spill | 0 | 0 | 0 | 0 | 0 | 0 | 1 | 17 | 33 | 34 | 16 | 7 | 0 | 108 |
| Collapse (Indust.) | 0 | 0 | 0 | 0 | 0 | 3 | 0 | 2 | 12 | 21 | 60 | 66 | 20 | 184 |
| Collapse (Miscell.) | 1 | 3 | 2 | 0 | 0 | 4 | 7 | 16 | 36 | 78 | 87 | 55 | 16 | 305 |
| Drought | 4 | 10 | 4 | 2 | 13 | 0 | 52 | 61 | 126 | 140 | 170 | 169 | 62 | 813 |
| Earthquake | 38 | 32 | 42 | 65 | 73 | 68 | 88 | 110 | 173 | 265 | 289 | 262 | 112 | 1617 |
| Epidemic | 5 | 6 | 10 | 2 | 3 | 2 | 37 | 59 | 124 | 385 | 590 | 258 | 45 | 1526 |
| Explosion (Industrial) | 5 | 7 | 9 | 10 | 8 | 11 | 6 | 30 | 65 | 178 | 328 | 104 | 26 | 787 |
| Explosion | 1 | 0 | 0 | 0 | 0 | 0 | 0 | 3 | 16 | 43 | 87 | 58 | 14 | 222 |
| Extreme temperature | 0 | 0 | 0 | 2 | 0 | 8 | 9 | 15 | 37 | 91 | 224 | 207 | 59 | 652 |
| Fire (Industrial) | 1 | 0 | 0 | 0 | 1 | 1 | 1 | 6 | 29 | 70 | 58 | 43 | 10 | 220 |
| Fire (Miscell.) | 9 | 3 | 4 | 5 | 8 | 7 | 38 | 79 | 104 | 131 | 193 | 149 | 74 | 804 |
| Flood | 6 | 4 | 9 | 11 | 11 | 81 | 155 | 259 | 515 | 861 | 1719 | 1531 | 779 | 5941 |
| Fog | 0 | 0 | 0 | 0 | 0 | 1 | 0 | 0 | 0 | 0 | 0 | 0 | 0 | 1 |
| Gas leak | 0 | 0 | 0 | 0 | 1 | 0 | 0 | 5 | 2 | 20 | 20 | 8 | 6 | 62 |
| Glacial lake outburst flood | 0 | 0 | 0 | 0 | 0 | 0 | 0 | 0 | 0 | 0 | 0 | 0 | 4 | 4 |
| Infestation | 0 | 1 | 0 | 1 | 1 | 0 | 0 | 4 | 48 | 11 | 18 | 9 | 2 | 95 |
| Mass mov. (dry) | 3 | 0 | 0 | 1 | 0 | 1 | 2 | 0 | 14 | 11 | 8 | 5 | 0 | 45 |
| Mass mov. (wet) | 1 | 2 | 4 | 6 | 4 | 20 | 26 | 55 | 105 | 151 | 192 | 183 | 78 | 827 |
| Oil spill | 0 | 0 | 0 | 0 | 0 | 0 | 0 | 1 | 1 | 1 | 2 | 3 | 0 | 8 |
| Poisoning | 0 | 0 | 0 | 0 | 0 | 2 | 1 | 7 | 10 | 36 | 17 | 3 | 0 | 76 |
| Radiation | 0 | 0 | 0 | 0 | 0 | 1 | 0 | 1 | 3 | 2 | 2 | 0 | 0 | 9 |
| Rail | 2 | 6 | 2 | 6 | 10 | 25 | 14 | 35 | 103 | 196 | 142 | 89 | 16 | 646 |
| Road | 0 | 0 | 0 | 0 | 0 | 3 | 4 | 11 | 192 | 556 | 1240 | 694 | 182 | 2882 |
| Storm | 14 | 18 | 34 | 39 | 55 | 119 | 211 | 274 | 533 | 893 | 1049 | 997 | 515 | 4751 |
| Volcanic activity | 8 | 3 | 1 | 3 | 7 | 9 | 12 | 23 | 31 | 52 | 60 | 43 | 22 | 274 |
| Water-related | 2 | 9 | 2 | 3 | 4 | 5 | 5 | 12 | 172 | 315 | 528 | 425 | 153 | 1635 |
| Wildfire | 0 | 2 | 2 | 1 | 4 | 1 | 6 | 7 | 49 | 100 | 143 | 97 | 63 | 475 |
| Total | 100 | 121 | 132 | 216 | 278 | 378 | 691 | 1121 | 2688 | 4941 | 7490 | 5624 | 2281 | 26061 |
Table 7.
Total number of different natural and man-made (technological) disasters by 5 years period (1900-2024).
Table 7.
Total number of different natural and man-made (technological) disasters by 5 years period (1900-2024).
| Disaster Type |
1900-1904 | 1905-1909 | 1910-1914 | 1915-1919 | 1920-1924 | 1925-1929 | 1930-1934 | 1935-1939 | 1940-1944 | 1945-1949 | 1950-1954 | 1955-1959 | 1960-1964 | 1965-1969 | 1970-1974 | 1975-1979 | 1980-1984 | 1985-1989 | 1990-1994 | 1995-1999 | 2000-2004 | 2005-2009 | 2010-2014 | 2015-2019 | 2020-2024 |
|---|---|---|---|---|---|---|---|---|---|---|---|---|---|---|---|---|---|---|---|---|---|---|---|---|---|
| Air | 0 | 0 | 1 | 14 | 3 | 4 | 10 | 49 | 69 | 6 | 3 | 3 | 8 | 8 | 17 | 12 | 27 | 128 | 148 | 152 | 131 | 117 | 90 | 68 | 23 |
| Animal incident | 0 | 0 | 0 | 0 | 0 | 0 | 0 | 0 | 0 | 0 | 0 | 0 | 0 | 0 | 0 | 0 | 0 | 0 | 0 | 0 | 0 | 0 | 1 | 0 | 0 |
| Chemical spill | 0 | 0 | 0 | 0 | 0 | 0 | 0 | 0 | 0 | 0 | 0 | 0 | 0 | 1 | 1 | 16 | 20 | 13 | 11 | 23 | 8 | 8 | 6 | 1 | 0 |
| Collapse (Ind.) | 0 | 0 | 0 | 0 | 0 | 0 | 0 | 0 | 0 | 0 | 1 | 2 | 0 | 0 | 0 | 2 | 5 | 7 | 9 | 12 | 20 | 40 | 32 | 34 | 20 |
| Collapse (Misc.) | 0 | 1 | 1 | 2 | 1 | 1 | 0 | 0 | 0 | 0 | 1 | 3 | 4 | 3 | 3 | 13 | 10 | 26 | 33 | 45 | 50 | 37 | 32 | 23 | 16 |
| Drought | 3 | 1 | 9 | 1 | 3 | 1 | 2 | 0 | 11 | 2 | 0 | 0 | 10 | 42 | 18 | 43 | 80 | 46 | 64 | 76 | 96 | 74 | 84 | 85 | 62 |
| Earthquake | 14 | 24 | 20 | 12 | 20 | 22 | 35 | 30 | 38 | 35 | 41 | 27 | 25 | 63 | 39 | 71 | 86 | 87 | 140 | 125 | 174 | 115 | 136 | 126 | 112 |
| Epidemic | 2 | 3 | 1 | 5 | 9 | 1 | 1 | 1 | 1 | 2 | 2 | 0 | 6 | 31 | 9 | 50 | 39 | 85 | 103 | 282 | 360 | 230 | 139 | 119 | 45 |
| Explosion (Ind.) | 1 | 4 | 5 | 2 | 6 | 3 | 5 | 5 | 2 | 6 | 6 | 5 | 3 | 3 | 10 | 20 | 26 | 39 | 84 | 94 | 175 | 153 | 59 | 45 | 26 |
| Explosion (Mis.) | 1 | 0 | 0 | 0 | 0 | 0 | 0 | 0 | 0 | 0 | 0 | 0 | 0 | 0 | 2 | 1 | 9 | 7 | 16 | 27 | 55 | 32 | 38 | 20 | 14 |
| Extreme temper. | 0 | 0 | 0 | 0 | 0 | 0 | 0 | 2 | 0 | 0 | 5 | 3 | 4 | 5 | 6 | 9 | 11 | 26 | 40 | 51 | 109 | 115 | 125 | 82 | 59 |
| Fire (Ind.) | 1 | 0 | 0 | 0 | 0 | 0 | 0 | 0 | 0 | 1 | 0 | 1 | 1 | 0 | 2 | 4 | 9 | 20 | 33 | 37 | 32 | 26 | 21 | 22 | 10 |
| Fire (Misc.) | 3 | 6 | 1 | 2 | 3 | 1 | 2 | 3 | 5 | 3 | 1 | 6 | 9 | 29 | 31 | 48 | 44 | 60 | 54 | 77 | 107 | 86 | 67 | 82 | 74 |
| Flood | 3 | 3 | 2 | 2 | 1 | 8 | 3 | 8 | 3 | 8 | 42 | 39 | 53 | 102 | 98 | 161 | 222 | 293 | 365 | 496 | 769 | 950 | 761 | 770 | 779 |
| Fog | 0 | 0 | 0 | 0 | 0 | 0 | 0 | 0 | 0 | 0 | 1 | 0 | 0 | 0 | 0 | 0 | 0 | 0 | 0 | 0 | 0 | 0 | 0 | 0 | 0 |
| Gas leak | 0 | 0 | 0 | 0 | 0 | 0 | 0 | 0 | 1 | 0 | 0 | 0 | 0 | 0 | 2 | 3 | 2 | 0 | 10 | 10 | 12 | 8 | 2 | 6 | 6 |
| Glacial lake (flood) | 0 | 0 | 0 | 0 | 0 | 0 | 0 | 0 | 0 | 0 | 0 | 0 | 0 | 0 | 0 | 0 | 0 | 0 | 0 | 0 | 0 | 0 | 0 | 0 | 4 |
| Infestation | 0 | 0 | 1 | 0 | 0 | 0 | 1 | 0 | 1 | 0 | 0 | 0 | 0 | 0 | 1 | 3 | 0 | 48 | 5 | 6 | 16 | 2 | 1 | 8 | 2 |
| Mass mov. (dry) | 1 | 2 | 0 | 0 | 0 | 0 | 0 | 1 | 0 | 0 | 0 | 1 | 2 | 0 | 0 | 0 | 5 | 9 | 11 | 0 | 3 | 5 | 2 | 3 | 0 |
| Mass mov. (wet) | 0 | 1 | 1 | 1 | 2 | 2 | 4 | 2 | 1 | 3 | 11 | 9 | 9 | 17 | 32 | 23 | 46 | 59 | 58 | 93 | 108 | 84 | 88 | 95 | 78 |
| Oil spill | 0 | 0 | 0 | 0 | 0 | 0 | 0 | 0 | 0 | 0 | 0 | 0 | 0 | 0 | 0 | 1 | 0 | 1 | 0 | 1 | 0 | 2 | 1 | 2 | 0 |
| Poisoning | 0 | 0 | 0 | 0 | 0 | 0 | 0 | 0 | 0 | 0 | 1 | 1 | 0 | 1 | 3 | 4 | 4 | 6 | 22 | 14 | 13 | 4 | 2 | 1 | 0 |
| Radiation | 0 | 0 | 0 | 0 | 0 | 0 | 0 | 0 | 0 | 0 | 0 | 1 | 0 | 0 | 0 | 1 | 0 | 3 | 1 | 1 | 0 | 2 | 0 | 0 | 0 |
| Rail | 1 | 1 | 1 | 5 | 0 | 2 | 1 | 5 | 4 | 6 | 16 | 9 | 6 | 8 | 13 | 22 | 25 | 78 | 93 | 103 | 85 | 57 | 45 | 44 | 16 |
| Road | 0 | 0 | 0 | 0 | 0 | 0 | 0 | 0 | 0 | 0 | 3 | 0 | 0 | 4 | 1 | 10 | 12 | 180 | 221 | 335 | 725 | 515 | 393 | 301 | 182 |
| Storm | 5 | 9 | 10 | 8 | 11 | 23 | 20 | 19 | 18 | 37 | 48 | 71 | 90 | 121 | 122 | 152 | 242 | 291 | 464 | 429 | 540 | 509 | 473 | 524 | 515 |
| Volcanic activity | 7 | 1 | 2 | 1 | 0 | 1 | 2 | 1 | 2 | 5 | 7 | 2 | 5 | 7 | 4 | 19 | 20 | 11 | 29 | 23 | 25 | 35 | 22 | 21 | 22 |
| Water-related | 1 | 1 | 5 | 4 | 1 | 1 | 2 | 1 | 1 | 3 | 3 | 2 | 2 | 3 | 7 | 5 | 28 | 144 | 168 | 147 | 254 | 274 | 218 | 207 | 153 |
| Wildfire | 0 | 0 | 1 | 1 | 1 | 1 | 0 | 1 | 2 | 2 | 0 | 1 | 0 | 6 | 3 | 4 | 23 | 26 | 35 | 65 | 88 | 55 | 35 | 62 | 63 |
| Total | 86 | 114 | 122 | 120 | 122 | 142 | 176 | 256 | 318 | 238 | 384 | 372 | 474 | 908 | 848 | 1394 | 1990 | 3386 | 4434 | 5448 | 7910 | 7070 | 5746 | 5502 | 4562 |
Table 8.
Seasonality analysis showing the number of occurrences of each disaster type by month.
| Disaster Type | Jan | Feb | Mar | Apr | May | Jun | Jul | Aug | Sep | Oct | Nov | Dec | Total | Trend | |
|---|---|---|---|---|---|---|---|---|---|---|---|---|---|---|---|
| (n) | (%) | ||||||||||||||
| Air | 36 | 20 | 40 | 66 | 26 | 16 | 744 | 39 | 31 | 30 | 24 | 19 | 1091 | 4.123 | AA |
| Animal incident | 0 | 0 | 0 | 0 | 0 | 0 | 0 | 0 | 0 | 0 | 1 | 0 | 1 | 0.004 | BA |
| Chemical spill | 0 | 2 | 1 | 7 | 0 | 0 | 86 | 3 | 3 | 2 | 2 | 2 | 108 | 0.408 | BA |
| Collapse (Industrial) | 7 | 7 | 13 | 18 | 17 | 6 | 62 | 9 | 6 | 9 | 21 | 9 | 184 | 0.695 | BA |
| Collapse (Miscellaneous) | 15 | 12 | 14 | 14 | 7 | 11 | 181 | 15 | 2 | 13 | 13 | 8 | 305 | 1.153 | BA |
| Drought | 44 | 326 | 77 | 34 | 30 | 18 | 46 | 64 | 40 | 43 | 61 | 30 | 813 | 3.072 | BA |
| Earthquake | 197 | 92 | 316 | 190 | 48 | 37 | 201 | 185 | 91 | 32 | 83 | 145 | 1617 | 6.11 | AA |
| Epidemic | 63 | 75 | 75 | 42 | 49 | 220 | 701 | 57 | 38 | 83 | 79 | 44 | 1526 | 5.766 | AA |
| Explosion (Industrial) | 24 | 23 | 32 | 70 | 39 | 30 | 411 | 34 | 26 | 25 | 46 | 27 | 787 | 2.974 | BA |
| Explosion (Miscellaneous) | 12 | 8 | 13 | 13 | 10 | 9 | 99 | 20 | 16 | 7 | 7 | 8 | 222 | 0.839 | BA |
| Extreme temperature | 98 | 81 | 35 | 34 | 10 | 10 | 280 | 49 | 11 | 5 | 6 | 33 | 652 | 2.464 | BA |
| Fire (Industrial) | 7 | 6 | 11 | 16 | 6 | 7 | 121 | 8 | 11 | 9 | 8 | 10 | 220 | 0.831 | BA |
| Fire (Miscellaneous) | 38 | 35 | 44 | 60 | 19 | 20 | 440 | 35 | 24 | 26 | 30 | 33 | 804 | 3.038 | BA |
| Flood | 592 | 304 | 390 | 306 | 290 | 192 | 2072 | 400 | 403 | 374 | 356 | 262 | 5941 | 22.449 | AA |
| Fog | 0 | 0 | 0 | 0 | 0 | 0 | 1 | 0 | 0 | 0 | 0 | 0 | 1 | 0.004 | BA |
| Gas leak | 0 | 2 | 2 | 10 | 2 | 8 | 28 | 6 | 1 | 2 | 1 | 0 | 62 | 0.234 | BA |
| Glacial lake outburst flood | 0 | 1 | 0 | 1 | 0 | 0 | 1 | 0 | 0 | 1 | 0 | 0 | 4 | 0.015 | BA |
| Impact | 0 | 0 | 1 | 0 | 0 | 0 | 0 | 0 | 0 | 0 | 0 | 0 | 1 | 0.004 | BA |
| Industrial accident (General) | 8 | 6 | 4 | 15 | 8 | 6 | 40 | 11 | 6 | 4 | 11 | 7 | 126 | 0.476 | BA |
| Infestation | 0 | 8 | 0 | 2 | 0 | 0 | 71 | 8 | 3 | 1 | 0 | 2 | 95 | 0.359 | BA |
| Mass movement (dry) | 2 | 1 | 0 | 0 | 1 | 0 | 37 | 1 | 0 | 1 | 2 | 0 | 45 | 0.17 | BA |
| Mass movement (wet) | 51 | 61 | 43 | 44 | 34 | 19 | 427 | 41 | 23 | 29 | 24 | 31 | 827 | 3.125 | A |
| Miscellaneous accident | 16 | 21 | 23 | 33 | 5 | 15 | 85 | 15 | 14 | 14 | 20 | 15 | 276 | 1.043 | BA |
| Oil spill | 1 | 0 | 0 | 1 | 0 | 1 | 2 | 0 | 1 | 0 | 2 | 0 | 8 | 0.03 | BA |
| Poisoning | 0 | 5 | 8 | 1 | 0 | 0 | 56 | 0 | 1 | 3 | 1 | 1 | 76 | 0.287 | BA |
| Radiation | 0 | 0 | 0 | 1 | 0 | 0 | 6 | 2 | 0 | 0 | 0 | 0 | 9 | 0.034 | BA |
| Rail | 13 | 13 | 28 | 44 | 13 | 11 | 453 | 24 | 7 | 17 | 19 | 4 | 646 | 2.441 | BA |
| Road | 166 | 95 | 140 | 128 | 109 | 135 | 1326 | 189 | 153 | 158 | 166 | 117 | 2882 | 10.89 | AA |
| Storm | 345 | 184 | 344 | 259 | 349 | 95 | 2146 | 217 | 191 | 218 | 211 | 192 | 4751 | 17.953 | AA |
| Volcanic activity | 17 | 2 | 5 | 11 | 7 | 67 | 120 | 4 | 9 | 3 | 10 | 19 | 274 | 1.035 | BA |
| Water-related | 94 | 72 | 106 | 152 | 62 | 62 | 718 | 75 | 71 | 84 | 89 | 50 | 1635 | 6.178 | AA |
| Wildfire | 26 | 15 | 28 | 21 | 15 | 12 | 239 | 55 | 20 | 20 | 11 | 13 | 475 | 1.795 | BA |
Note: AA − above average; A − average; BA − below average.
Table 9.
Number of consequences of Natural and Man-made (Technological) Disasters by Decade (1900-2024).
Table 9.
Number of consequences of Natural and Man-made (Technological) Disasters by Decade (1900-2024).
| Decade | Natural disasters | Man-made (tech.) disasters | Total | ||||||
|---|---|---|---|---|---|---|---|---|---|
| Fatalities | Injuries | Economic losses | Fatalities | Injuries | Economic losses | Fatalities | Injuries | Economic losses | |
| 1900-1910 | 4,472,477 | 2,549 | 1,373,800 | 5,766 | 2 | 0 | 4,478,243 | 2,551 | 1,373,800 |
| 1911-1920 | 3,334,004 | 2,955 | 600,000 | 10,752 | 9,306 | 2,500 | 3,344,756 | 12,261 | 602,500 |
| 1921-1930 | 8,561,918 | 109,109 | 1,004,230 | 7,139 | 1,596 | 100,000 | 8,569,057 | 110,705 | 1,104,230 |
| 1931-1940 | 4,629,968 | 112,403 | 3,342,000 | 5,579 | 511 | 0 | 4,635,547 | 112,914 | 3,342,000 |
| 1941-1950 | 3,878,897 | 69,329 | 3,136,700 | 11,165 | 2,258 | 6,000 | 3,890,062 | 71,587 | 3,142,700 |
| 1951-1960 | 2,127,944 | 24,642 | 6,090,480 | 10,979 | 6,241 | 218,000 | 2,138,923 | 30,883 | 6,308,480 |
| 1961-1970 | 1,751,347 | 784,522 | 18,633,100 | 6,446 | 5,155 | 159,972 | 1,757,793 | 789,677 | 18,793,072 |
| 1971-1980 | 998,508 | 552,541 | 53,753,225 | 17,244 | 22,809 | 76,193 | 1,015,752 | 575,350 | 53,829,418 |
| 1981-1990 | 796,062 | 317,353 | 183,523,629 | 58,382 | 159,620 | 6,469,293 | 854,444 | 476,973 | 189,992,922 |
| 1991-2000 | 527,413 | 1,588,807 | 701,281,224 | 86,149 | 80,174 | 4,410,769 | 613,562 | 1,668,981 | 705,691,993 |
| 2001-2010 | 839,418 | 3,282,010 | 892,099,162 | 97,166 | 89,617 | 14,746,682 | 936,584 | 3,371,627 | 906,845,844 |
| 2011-2020 | 503,400 | 3,241,477 | 1,706,627,174 | 62,715 | 59,375 | 20,969,701 | 566,115 | 3,300,852 | 1,727,596,875 |
| 2021-2024 | 199,314 | 627,655 | 861,127,190 | 15,132 | 24,593 | 16,750,000 | 214,446 | 652,248 | 877,877,190 |
Notes: fatalities: the total number of deaths; injuries: the total number of injured individuals; economic losses: represented in thousands of US dollars.
Table 10.
Consequences of natural and man-made (technological) disasters by 5-year periods (1900-2024).
Table 10.
Consequences of natural and man-made (technological) disasters by 5-year periods (1900-2024).
| 5-year period |
Natural disasters | Man-made (tech.) disasters | Total | ||||||
|---|---|---|---|---|---|---|---|---|---|
| Fatalities | Injuries | Economic Losses | Fatalities | Injuries | Economic Losses |
Fatalities | Injuries | Economic Losses |
|
| 1900-1905 | 1523244 | 251 | 535000 | 2230 | 2 | 0 | 1525474 | 253 | 535000 |
| 1906-1910 | 2949233 | 2298 | 838800 | 3536 | 0 | 0 | 2952769 | 2298 | 838800 |
| 1911-1915 | 311175 | 2828 | 275000 | 5232 | 20 | 0 | 316407 | 2848 | 275000 |
| 1916-1920 | 3022829 | 127 | 325000 | 5520 | 9286 | 2500 | 3028349 | 9413 | 327500 |
| 1921-1925 | 5065612 | 103900 | 663000 | 6412 | 1500 | 100000 | 5072024 | 105400 | 763000 |
| 1926-1930 | 3496306 | 5209 | 341230 | 727 | 96 | 0 | 3497033 | 5305 | 341230 |
| 1931-1935 | 3772100 | 9045 | 1629000 | 3021 | 324 | 0 | 3775121 | 9369 | 1629000 |
| 1936-1940 | 857868 | 103358 | 1713000 | 2558 | 187 | 0 | 860426 | 103545 | 1713000 |
| 1941-1945 | 3569724 | 48909 | 1325500 | 5208 | 1181 | 0 | 3574932 | 50090 | 1325500 |
| 1946-1950 | 309173 | 20420 | 1811200 | 5957 | 1077 | 6000 | 315130 | 21497 | 1817200 |
| 1951-1955 | 86802 | 11243 | 3775180 | 5377 | 1949 | 178000 | 92179 | 13192 | 3953180 |
| 1956-1960 | 2041142 | 13399 | 2315300 | 5602 | 4292 | 40000 | 2046744 | 17691 | 2355300 |
| 1961-1965 | 124667 | 16119 | 8163881 | 3394 | 2818 | 49759 | 128061 | 18937 | 8213640 |
| 1966-1970 | 1626680 | 768403 | 10469219 | 3052 | 2337 | 110213 | 1629732 | 770740 | 10579432 |
| 1971-1975 | 623353 | 218953 | 15582333 | 6779 | 12990 | 3843 | 630132 | 231943 | 15586176 |
| 1976-1980 | 375155 | 333588 | 38170892 | 10465 | 9819 | 72350 | 385620 | 343407 | 38243242 |
| 1981-1985 | 633887 | 155979 | 84139472 | 17264 | 140392 | 761976 | 651151 | 296371 | 84901448 |
| 1986-1990 | 162175 | 161374 | 99384157 | 41118 | 19228 | 5707317 | 203293 | 180602 | 105091474 |
| 1991-1995 | 299078 | 818151 | 264087752 | 44158 | 32120 | 1363916 | 343236 | 850271 | 265451668 |
| 1996-2000 | 228335 | 770656 | 437193472 | 41991 | 48054 | 3046853 | 270326 | 818710 | 440240325 |
| 2001-2005 | 435658 | 2437898 | 331597225 | 54143 | 54209 | 11607124 | 489801 | 2492107 | 343204349 |
| 2006-2010 | 403760 | 844112 | 560501937 | 43023 | 35408 | 3139558 | 446783 | 879520 | 563641495 |
| 2011-2015 | 418756 | 1087793 | 871742990 | 32710 | 31140 | 20964701 | 451466 | 1118933 | 892707691 |
| 2016-2020 | 84644 | 2153684 | 834884184 | 30005 | 28235 | 5000 | 114649 | 2181919 | 834889184 |
| 2021-2024 | 199314 | 627655 | 861127190 | 15132 | 24593 | 16750000 | 214446 | 652248 | 877877190 |
Notes: fatalities: the total number of deaths; injuries: the total number of injured individuals; economic losses: represented in thousands of US dollars.
Table 11.
Summary of disaster consequences by type, including total counts and percentage contributions (1900-2024).
Table 11.
Summary of disaster consequences by type, including total counts and percentage contributions (1900-2024).
| Disaster Type | Deaths | Injured | Affected | Damage ('000 US$) | ||||
|---|---|---|---|---|---|---|---|---|
| (n) | (%) | (n) | (%) | (n) | (%) | (n) | (%) | |
| Air | 50,689 | 0.154 | 7,620 | 0.068 | 8,846 | 0.0 | 144,100 | 0.003 |
| Animal incident | 12 | 0.0 | 0 | 0.0 | 5 | 0.0 | 0 | 0.0 |
| Chemical spill | 610 | 0.002 | 8,773 | 0.078 | 652,981 | 0.008 | 1,198,954 | 0.027 |
| Collapse (Industrial) | 7,099 | 0.022 | 2,450 | 0.022 | 3,353 | 0.0 | 1,335,000 | 0.03 |
| Collapse (Miscellaneous) | 14,830 | 0.045 | 13,024 | 0.117 | 309,514 | 0.004 | 283,800 | 0.006 |
| Drought | 11,734,272 | 35.54 | 32 | 0.0 | 2,964,996,768 | 34.146 | 257,581,674 | 5.728 |
| Earthquake | 2,407,717 | 7.293 | 2,945,052 | 26.35 | 228,214,673 | 2.628 | 975,785,916 | 21.701 |
| Epidemic | 9,622,343 | 29.14 | 2,836,719 | 25.38 | 50,095,829 | 0.577 | 7 | 0.0 |
| Explosion (Industrial) | 36,814 | 0.112 | 41,850 | 0.374 | 864,341 | 0.01 | 40,421,674 | 0.899 |
| Explosion (Miscellaneous) | 7,624 | 0.023 | 19,231 | 0.172 | 137,527 | 0.002 | 619,100 | 0.014 |
| Extreme temperature | 256,413 | 0.777 | 2,066,936 | 18.49 | 107,678,810 | 1.24 | 69,468,343 | 1.545 |
| Fire (Industrial) | 5,522 | 0.017 | 5,211 | 0.047 | 465,362 | 0.005 | 2,608,005 | 0.058 |
| Fire (Miscellaneous) | 36,590 | 0.111 | 24,022 | 0.215 | 1,368,383 | 0.016 | 3,485,470 | 0.078 |
| Flood | 7,011,404 | 21.23 | 1,398,042 | 12.50 | 3,997,629,671 | 46.039 | 1,007,889,805 | 22.415 |
| Fog | 4,000 | 0.012 | 0 | 0.0 | 0 | 0.0 | 0 | 0.0 |
| Gas leak | 2,906 | 0.009 | 116,280 | 1.04 | 513,932 | 0.006 | 30,000 | 0.001 |
| Glacial lake outburst flood | 439 | 0.001 | 24 | 0.0 | 88,424 | 0.001 | 210,000 | 0.005 |
| Impact | 0 | 0.0 | 1,491 | 0.013 | 301,491 | 0.003 | 33,000 | 0.001 |
| Industrial accident (General) | 5,207 | 0.016 | 1,552 | 0.014 | 135,987 | 0.002 | 9,960,407 | 0.222 |
| Infestation | 0 | 0.0 | 0 | 0.0 | 2,802,200 | 0.032 | 229,200 | 0.005 |
| Mass movement (dry) | 4,486 | 0.014 | 373 | 0.003 | 23,117 | 0.0 | 209,000 | 0.005 |
| Mass movement (wet) | 68,636 | 0.208 | 12,705 | 0.114 | 16,823,502 | 0.194 | 11,347,044 | 0.252 |
| Miscellaneous accident (General) | 14,279 | 0.043 | 40,666 | 0.364 | 1,880,052 | 0.022 | 4,000 | 0.0 |
| Oil spill | 1 | 0.0 | 120 | 0.001 | 29,137 | 0.0 | 30,000 | 0.001 |
| Poisoning | 3,578 | 0.011 | 54,442 | 0.487 | 648,522 | 0.007 | 0 | 0.0 |
| Radiation | 86 | 0.0 | 1,958 | 0.018 | 1,064,201 | 0.012 | 2,800,000 | 0.062 |
| Rail | 28,730 | 0.087 | 61,744 | 0.552 | 109,453 | 0.001 | 903,000 | 0.02 |
| Road | 68,812 | 0.208 | 49,184 | 0.44 | 56,306 | 0.001 | 7,700 | 0.0 |
| Storm | 1,418,647 | 4.297 | 1,411,425 | 12.62 | 1,277,565,968 | 14.713 | 1,967,141,984 | 43.748 |
| Volcanic activity | 86,935 | 0.263 | 26,564 | 0.238 | 10,032,658 | 0.116 | 6,327,912 | 0.141 |
| Water-related | 111,237 | 0.337 | 13,130 | 0.117 | 149,256 | 0.002 | 77,900 | 0.002 |
| Wildfire | 5,366 | 0.016 | 15,989 | 0.143 | 18,531,582 | 0.213 | 136,368,030 | 3.033 |
| Total | 33,015,284 | 100.0 | 11,176,609 | 100.0 | 8,683,181,851 | 100.0 | 4,496,501,025 | 100.0 |
Table 12.
Comprehensive recommendations for disaster risk reduction measures and implementation strategies.
Table 12.
Comprehensive recommendations for disaster risk reduction measures and implementation strategies.
| Recommendation | Description | Short-term | Long-term | National | Local |
|---|---|---|---|---|---|
| Integration of disaster risk reduction | Integrate strategies for disaster risk reduction into the overall national development agenda | ✓ | ↑ | ↑ | ↓ |
| Enhancement of early warning systems | Enhance early warning systems through investments in advanced technology, infrastructure improvements, and comprehensive training programs | ✓ | ✓ | ↑ | ↑ |
| Promotion of climate resilience | Focus on climate resilience by adopting sustainable practices and implementing green infrastructure projects | ✓ | ↑ | ↓ | |
| Strengthening industrial safety | Upgrade safety protocols and strengthen regulatory frameworks governing industrial operations | ✓ | ✓ | ↑ | ↓ |
| Community-based disaster risk management | Empower communities by providing education, training, and opportunities for active involvement in disaster management | ✓ | ✓ | ↓ | ↑ |
| Investing in research and development | Promote research and development to discover innovative solutions for reducing disaster risks on the basis of a better understanding of the interconnections of risks | ✓ | ↑ | ↓ | |
| Regional cooperation and information sharing | Foster international cooperation and improve data sharing mechanisms for more effective disaster preparedness and response | ✓ | ✓ | ↑ | ↓ |
| Adapting infrastructure and urban planning | Construct resilient infrastructure and apply sustainable urban planning methods to reduce disaster impacts | ✓ | ↑ | ↓ | |
| Public awareness and education campaigns | Raise public awareness and improve education about disaster risks and preparedness measures | ✓ | ✓ | ↑ | ↑ |
| Regular assessment and update of plans | Periodically review and revise disaster management plans based on updated data and emerging threats | ✓ | ✓ | ↑ | ↑ |
| Improvement of seismic resilience | Emphasize the construction and retrofitting of buildings to be earthquake-resistant, particularly in vulnerable areas | ✓ | ↑ | ↓ | |
| Flood management and mitigation | Implement effective flood control systems, including dams, levees, and enhanced drainage networks | ✓ | ✓ | ↑ | ↓ |
| Sustainable agriculture practices | Encourage agricultural practices and other methods that reduce vulnerability to droughts and climate-related disasters | ✓ | ↑ | ↓ | |
| Enhancing health systems | Enhance health infrastructure to provide better responses to epidemics and other public health crises | ✓ | ✓ | ↑ | ↓ |
| Technological upgrades for disaster monitoring | Invest in cutting-edge technologies for real-time disaster monitoring and early detection capabilities | ✓ | ✓ | ↑ | ↑ |
| Capacity building for emergency responders | Continuously train and equip emergency responders to increase their efficiency and effectiveness during crises | ✓ | ✓ | ↑ | ↑ |
| Improve urban infrastructure | Design urban infrastructure to be resilient against both natural and man-made (technological) disasters | ✓ | ↑ | ↓ | |
| Implement comprehensive risk assessments | Conduct comprehensive risk assessments to identify vulnerabilities and prioritize mitigation strategies | ✓ | ✓ | ↑ | ↓ |
| Develop cross-sectoral and cross-national DRR strategies | Coordinate disaster risk reduction activities across various sectors, such as healthcare, agriculture, and transportation | ✓ | ✓ | ↑ | ↓ |
| Strengthen legal and institutional frameworks | Strengthen legal and institutional frameworks to support robust disaster risk management practices | ✓ | ✓ | ↑ | ↓ |
| Foster public-private partnerships | Promote public-private partnerships to leverage resources and expertise in disaster risk reduction initiatives | ✓ | ✓ | ↑ | ↑ |
| Grouping disaster mitigation measures | Tailor disaster mitigation measures to specific types of disasters, including floods, earthquakes, and industrial accidents | ✓ | ✓ | ↑ | ↓ |
| Enhance community resilience programs | Develop educational and training programs to enhance community resilience and disaster preparedness | ✓ | ✓ | ↑ | ↑ |
| Improve data collection and analysis | Improve data collection and analysis to gain a deeper understanding of disaster trends and inform policy decisions. Improvement of standardized data collection and analysis | ✓ | ✓ | ↑ | ↓ |
| Increase funding for drr initiatives | Secure consistent funding for disaster risk reduction programs to ensure their long-term success and sustainability | ✓ | ✓ | ↑ | ↑ |
Note: An upward arrow (↑) indicates a focus on national-level implementation; a downward arrow (↓) indicates a focus on local-level implementation; a checkmark (✓) indicates immediate action or short-term implementation.
Disclaimer/Publisher’s Note: The statements, opinions and data contained in all publications are solely those of the individual author(s) and contributor(s) and not of MDPI and/or the editor(s). MDPI and/or the editor(s) disclaim responsibility for any injury to people or property resulting from any ideas, methods, instructions or products referred to in the content. |
© 2024 by the authors. Licensee MDPI, Basel, Switzerland. This article is an open access article distributed under the terms and conditions of the Creative Commons Attribution (CC BY) license (http://creativecommons.org/licenses/by/4.0/).
Copyright: This open access article is published under a Creative Commons CC BY 4.0 license, which permit the free download, distribution, and reuse, provided that the author and preprint are cited in any reuse.


