Preprint
Article

Study on Flood Simulation and Early Warning in the XiHanShui River Basin Based on HEC-HMS Model

Altmetrics

Downloads

96

Views

48

Comments

0

Submitted:

02 August 2024

Posted:

02 August 2024

You are already at the latest version

Alerts
Abstract
The Xihan River basin is located in the southern part of Gansu Province, where flood disasters occur frequently in summer and autumn, which easily pose significant risks to human life. In order to improve the accuracy of flood disaster predictions and early warnings, a flood model suitable for this region was constructed based on the HEC-HMS (Hydrologic Engineering Center's-hydrologic modeling system) model and used to determine the critical areal rainfall for flood disasters. Calibration of this model was performed using data of four flood events from May to October between 2020 and 2021, reserving data of two additional flood events for model validation. Using the calibrated HEC-HMS model, the critical areal rainfall was determined for the Pingluo and Tanjiaba hydrological stations in the basin through the model testing method. The results indicate that: (1) The stable infiltration rate of the XiHanShui River Basin was between 0.06 and 0.10 mm/h, with runoff concentration times primarily varying from 22.5 to 24.1 hours, a direct runoff storage coefficient was 0.2 hours, and a base flow index decay constant seted at 0.03 hours. (2) During the calibration and validation periods, the average peak flow relative error was 7.56%, the average runoff volume relative error was 14.76%, the average peak occurrence time difference was -0.5 hours, and the Nash efficiency coefficient was 0.769. (3) The warning areal rainfall for the Pingluo and Tanjiaba hydrological stations were 108.1mm and 128.5mm, and the guaranteed areal rainfall were 230.8mm and 184.6mm. The HEC-HMS model demonstrated high applicability and accuracy in simulating flood events in the XiHanShui River Basin, providing technical support for hydrological research and operational applications in the region.
Keywords: 
Subject: Environmental and Earth Sciences  -   Atmospheric Science and Meteorology

1. Introduction

Flood disasters, characterized by their frequent occurrence, have always been one of the most severe natural disasters in China. According to incomplete statistics, it is accounted that more than two-thirds of the total flood-related fatalities are attributed to floods in small and medium-sized rivers [1]. Economic losses in China, primarily induced by floods in small and medium rivers, have increased a lot in recent years by the rise in extreme weather events. Frequent extreme precipitation in these river basins has led to severe flood disasters [2]. Therefore, Monitoring, forecasting, and early warning of flood disasters in small and medium rivers have received significant attention from the government and society.
Extensive mechanistic research and model development for flood prediction and early warning in small and medium rivers have been conducted domestically and internationally. Prevailing research on the mechanisms behind the formation of small to medium-sized rivers predominantly focuses on precipitation, soil moisture, soil types, vegetation traits, and topographical features [3,4,5,6,7]. With the development of hydrological theories, efforts have been made globally to develop hydrological models, and a series of hydrological models such as the Liuxihe model, GBHM, Xin’anjiang model, HEC-HMS, HBV, SHE, TOPMODE, and parameter optimization methods have been proposed [8,9,10,11,12,13,14,15], among which distributed and semi-distributed hydrological models are the main research directions. In recent years, owing to the maturation and enhancement of ArcGIS technology, distributed hydrological models have progressively become the predominant research focus [16]. The HEC-HMS distributed hydrological model is one of the HEC series hydrological models developed by the Hydrologic Engineering Center of the US Army Corps of Engineers, primarily used for flood simulation in basins. The HEC-HMS model integrates mainstream runoff calculation methods and allows for the flexible combination of multiple modules such as runoff, production, concentration, and base flow. It can simulate and predict runoff processes under different conditions effectively [17,18,19]. Therefore, the HEC-HMS model has been widely used in flood prediction and early warning research in small and medium river basins both domestically and internationally [20,21,22,23,24,25].
Zema et al. [26]applied the HEC-HMS model in small basins in semi-arid regions to assess the impact of parameter accuracy on results. Sharafati et al. [27] studied the uncertainty of rainfall and HEC-HMS hydrological parameters on flood prediction and found that flood volume is more sensitive to parameter uncertainty. Wijayarathne et al. [28] compared five distributed and semi-distributed hydrological models and found that the HEC-HMS performed well in 1-3 days of runoff simulations, recommending it for actual flood forecasting. Yuan Wenlin [29] compared the critical rainfall determined by HEC-HMS and instantaneous unit hydrograph (IUH) models and found that HEC-HMS has higher accuracy in short-duration warnings. Zhang Jianjun [30], Cheng Xu [31], and Ren Juanhui [32] explored the applicability of the HEC-HMS model in small and medium river basins in China, finding that the HEC-HMS model could better simulate the entire flood process, providing a basis for hydrological forecasting in small and medium river basins without data in China. Zhang Shanshan [33], Zhang Bo [34], and Ma Tianhang [35] simulated the flood events in small and medium river basins in China based on the HEC-HMS model, using the calibrated and validated model to determine the critical rainfall for the corresponding basins. Their research results can be used for flood disaster forecasting and early warning services.
The southern part of Gansu Province, where the Loess Plateau and the Qinghai-Tibet Plateau intersect, is characterized by the highest frequency of flood disasters in small and medium rivers within the province, suffering significant economic losses, high mortality rates, and extensive territorial impact [36]. In recent years, research on flood disasters in small and medium river basins in Gansu has mainly focused on the physical mechanisms of flood occurrence and meteorological risk early warning [37,38]. However, research on flood disaster prediction and early warning combined with hydrological models is relatively scarce, mainly due to the complex geographical factors, difficulty in obtaining basic data, and incomplete research methods in Gansu. With the development and application of hydrological models in flood prediction and early warning, developing proper flood models and early warning indicators suitable for Gansu is a new direction. Consequently, the mountainous XiHanShui River Basin in southern Gansu has been selected as the focal point of this study, which involves constructing an HEC-HMS flood model. This model is then calibrated and validated using observed runoff data to explore its suitability for application within the basin. Based on the calibrated HEC-HMS model, the critical areal rainfalls were determined by using the model testing method, providing technical support for flood disaster prediction and early warning in the XiHanShui River Basin.

2. Study Areal and Data Processing

2.1. Study Areal Introduction

The XiHanShui River, also known as the Xiniu River, is located in the southwestern part of Gansu Province, upstream of the Yangtze River. It is a first-order tributary of the Jialing River in the Yangtze River Basin. The basin area is 10178 km², with a mainstream length of 257.3 km. It originates from the Qishou Mountains in the southern foothills of the northern Qinling Mountains, flows through Li County, Xihe County, Kang County, and Cheng County, enters the territory of Lueyang County in Shanxi Province below the construction village of Tanjiaba Township in Cheng County, and merges into the Jialing River (Figure 1a). The XiHanShui River Basin is located in the southern branch of the western section of the Qinling Mountains, with an overall topography of high in the west and low in the east. The highest elevation in the basin is 2413 m, and the lowest elevation is 591 m (Figure 1b). The topography mainly consists of loess hills and gullies, with some areas featuring rocky mountains. Most of the surface is bare, composed of loess, yellow-brown soil, and weathered brown sandstone, with low vegetation coverage. The northern part of the XiHanShui River Basin has relatively gentle terrain and wide river valleys, most of which are used for agricultural purposes. The central part is characterized by steep terrain, high mountains, deep valleys, and narrow river valleys, which is a debris flow development zone. The southern part has rugged terrain with numerous gullies and relatively good vegetation coverage (Figure 1c). The XiHanShui River Basin is governed by a continental monsoon climate, with the region's precipitation distribution trending towards more rainfall in the south than in the north, and greater on the left bank than on the right. Heavy rain mostly occurs during the flood season (June to September), which is characterized by large rainfall, short duration, and strong disaster-causing potential [39]. The runoff variations in the XiHanShui River Basin generally align with changes in precipitation. The primary source of flooding is attributed to torrential rains during the flood season. Floods rise and fall rapidly, easily causing flood disasters within the basin [40,41].

2.2. Data Sources and Processing

The DEM (Digital Elevation Model) elevation data were obtained from the HydroSHEDS GIS, with a national resolution of 12.5 m provided by NASA (http://www.rivermap.cn/). Utilizing the ArcHydro Tools of ArcGIS software and HEC-GeoHMS module to process the DEM data of the study area into a watershed grid. Through steps including depression filling, flow direction, flow accumulation, river definition, sub-basin delineation, and watershed outlet definition, the watershed grid, river network topology, along with the topographic and river characteristic parameters of the watershed were obtained sequentially. The study area was divided into 58 sub-basins. Each sub-basin was calculated for slope, centroid location, longest flow path, hydraulic parameters, and the setup of hydrological model network elements, ultimately creating a digital basin meeting the requirements of the HEC-HMS model. Land-use data were sourced from the GlobeLand global geographical information public product with a resolution of 30 m (http://www.globallandcover.com/). Soil-type data were obtained from the FAO platform’s WSD data from the world soil database (http://www.fao.org/), with a resolution of 1 km.
Data for this study were collected from May to October between 2020 and 2021. The distribution of hydrological and rainfall monitoring stations in the basin is shown in Figure 1a. Hydrological data included daily runoff observations from two hydrological stations (Pingluo and Tanjiaba) provided by the Gansu Provincial Hydrology Bureau. Precipitation data consisted of hourly precipitation observations from 90 rainfall stations provided and quality-controlled by the Gansu Meteorological Information and Technical Equipment Support Center. Hourly runoff data in the hydrological records were interpolated using the cubic spline method from daily observation data, while precipitation data were processed using the Thiessen polygon method to calculate basin average rainfall.

3. HEC-HMS Model and Methods

3.1. HEC-HMS Model Introduction

Hydrologic Engineering Center-Hydrologic Modeling System (HEC-HMS), developed by the Hydrologic Engineering Center of the US Army Corps of Engineers, was a rainfall-runoff model simulating rainfall-runoff processes in small watersheds through independent modules representing each component of the process [42]. It consists of loss models, direct runoff models, base flow models, and routing models. The HEC-HMS model integrates twelve different loss methods (including SCS Curve Number, Deficit and constant loss, Soil moisture accounting, etc. ), seven different direct runoff methods (including Snyder unit hydrograph, Clark’s unit hydrograph, etc. ), six different base flow methods (including Exponential recession, Linear reservoir, etc. ), six routing methods (including Lag routing, Kinematic wave, etc.) [43].
Based on the hydrological characteristics of the Xihaihe River basin, the following methods were adopted in this study to represent the different hydrological processes: the deficit and constant loss method was used for loss models, the Clark's unit hydrograph method for direct runoff models, the exponential recession method for base flow models, and the lag routing method for routing models. This combination, characterized by its relatively straightforward principles and minimal parameter requirements, is deemed suitable for extensive application in mountainous regions where hydrological and soil data are scarce [19].

3.2. Parameter Calibration Method

The HEC-HMS model provides automatic parameter calibration function [44]. The simplex method, which calculates the objective function value by providing initial parameter values and search steps, gradually replaces suboptimal parameters with better ones and is characterized by fast convergence and high accuracy [31]. The objective function used is the Peak-weighted Root Mean Squared Error (PRMSE), expressed as follows:
P R M S E = 1 n [ i = 1 n Q o i Q s i 2 × ( Q 0 i + Q 0 ¯ 2 × Q 0 ¯ ) ]
where Qo(i) is the observed flow at time i, Qs(i) is the simulated flow at time i, n is the number of time steps, and Q o ¯ is the average observed flow.

3.3. Model Accuracy Evaluation

According to the requirements of the " Standard for Hydrological Information and Hydrological Forecasting" [45], four indices of runoff volume relative error ( R E V ), peak flow relative error ( R E p ), peak occurrence time difference ( T ), and Nash-Sutcliffe efficiency coefficient (NSE) were used as evaluation standards for the model. The NSE reflects the fitting degree between the simulated and observed runoff processes. The calculation methods are as follows:
R E V = Q s Q o Q o × 100 %
R E p = q s q o q o × 100 %
T = T s T o
N S E = 1 i = 1 n Q o i Q s i 2 i = 1 n Q o i Q 0 ¯ 2  
where Q s is the simulated flow, Q o is the observed flow, q s is the simulated peak flow, q o is the observed peak flow, T s is the simulated peak time, and T o is the observed peak time.

3.4. Critical Areal Rainfall Calculation

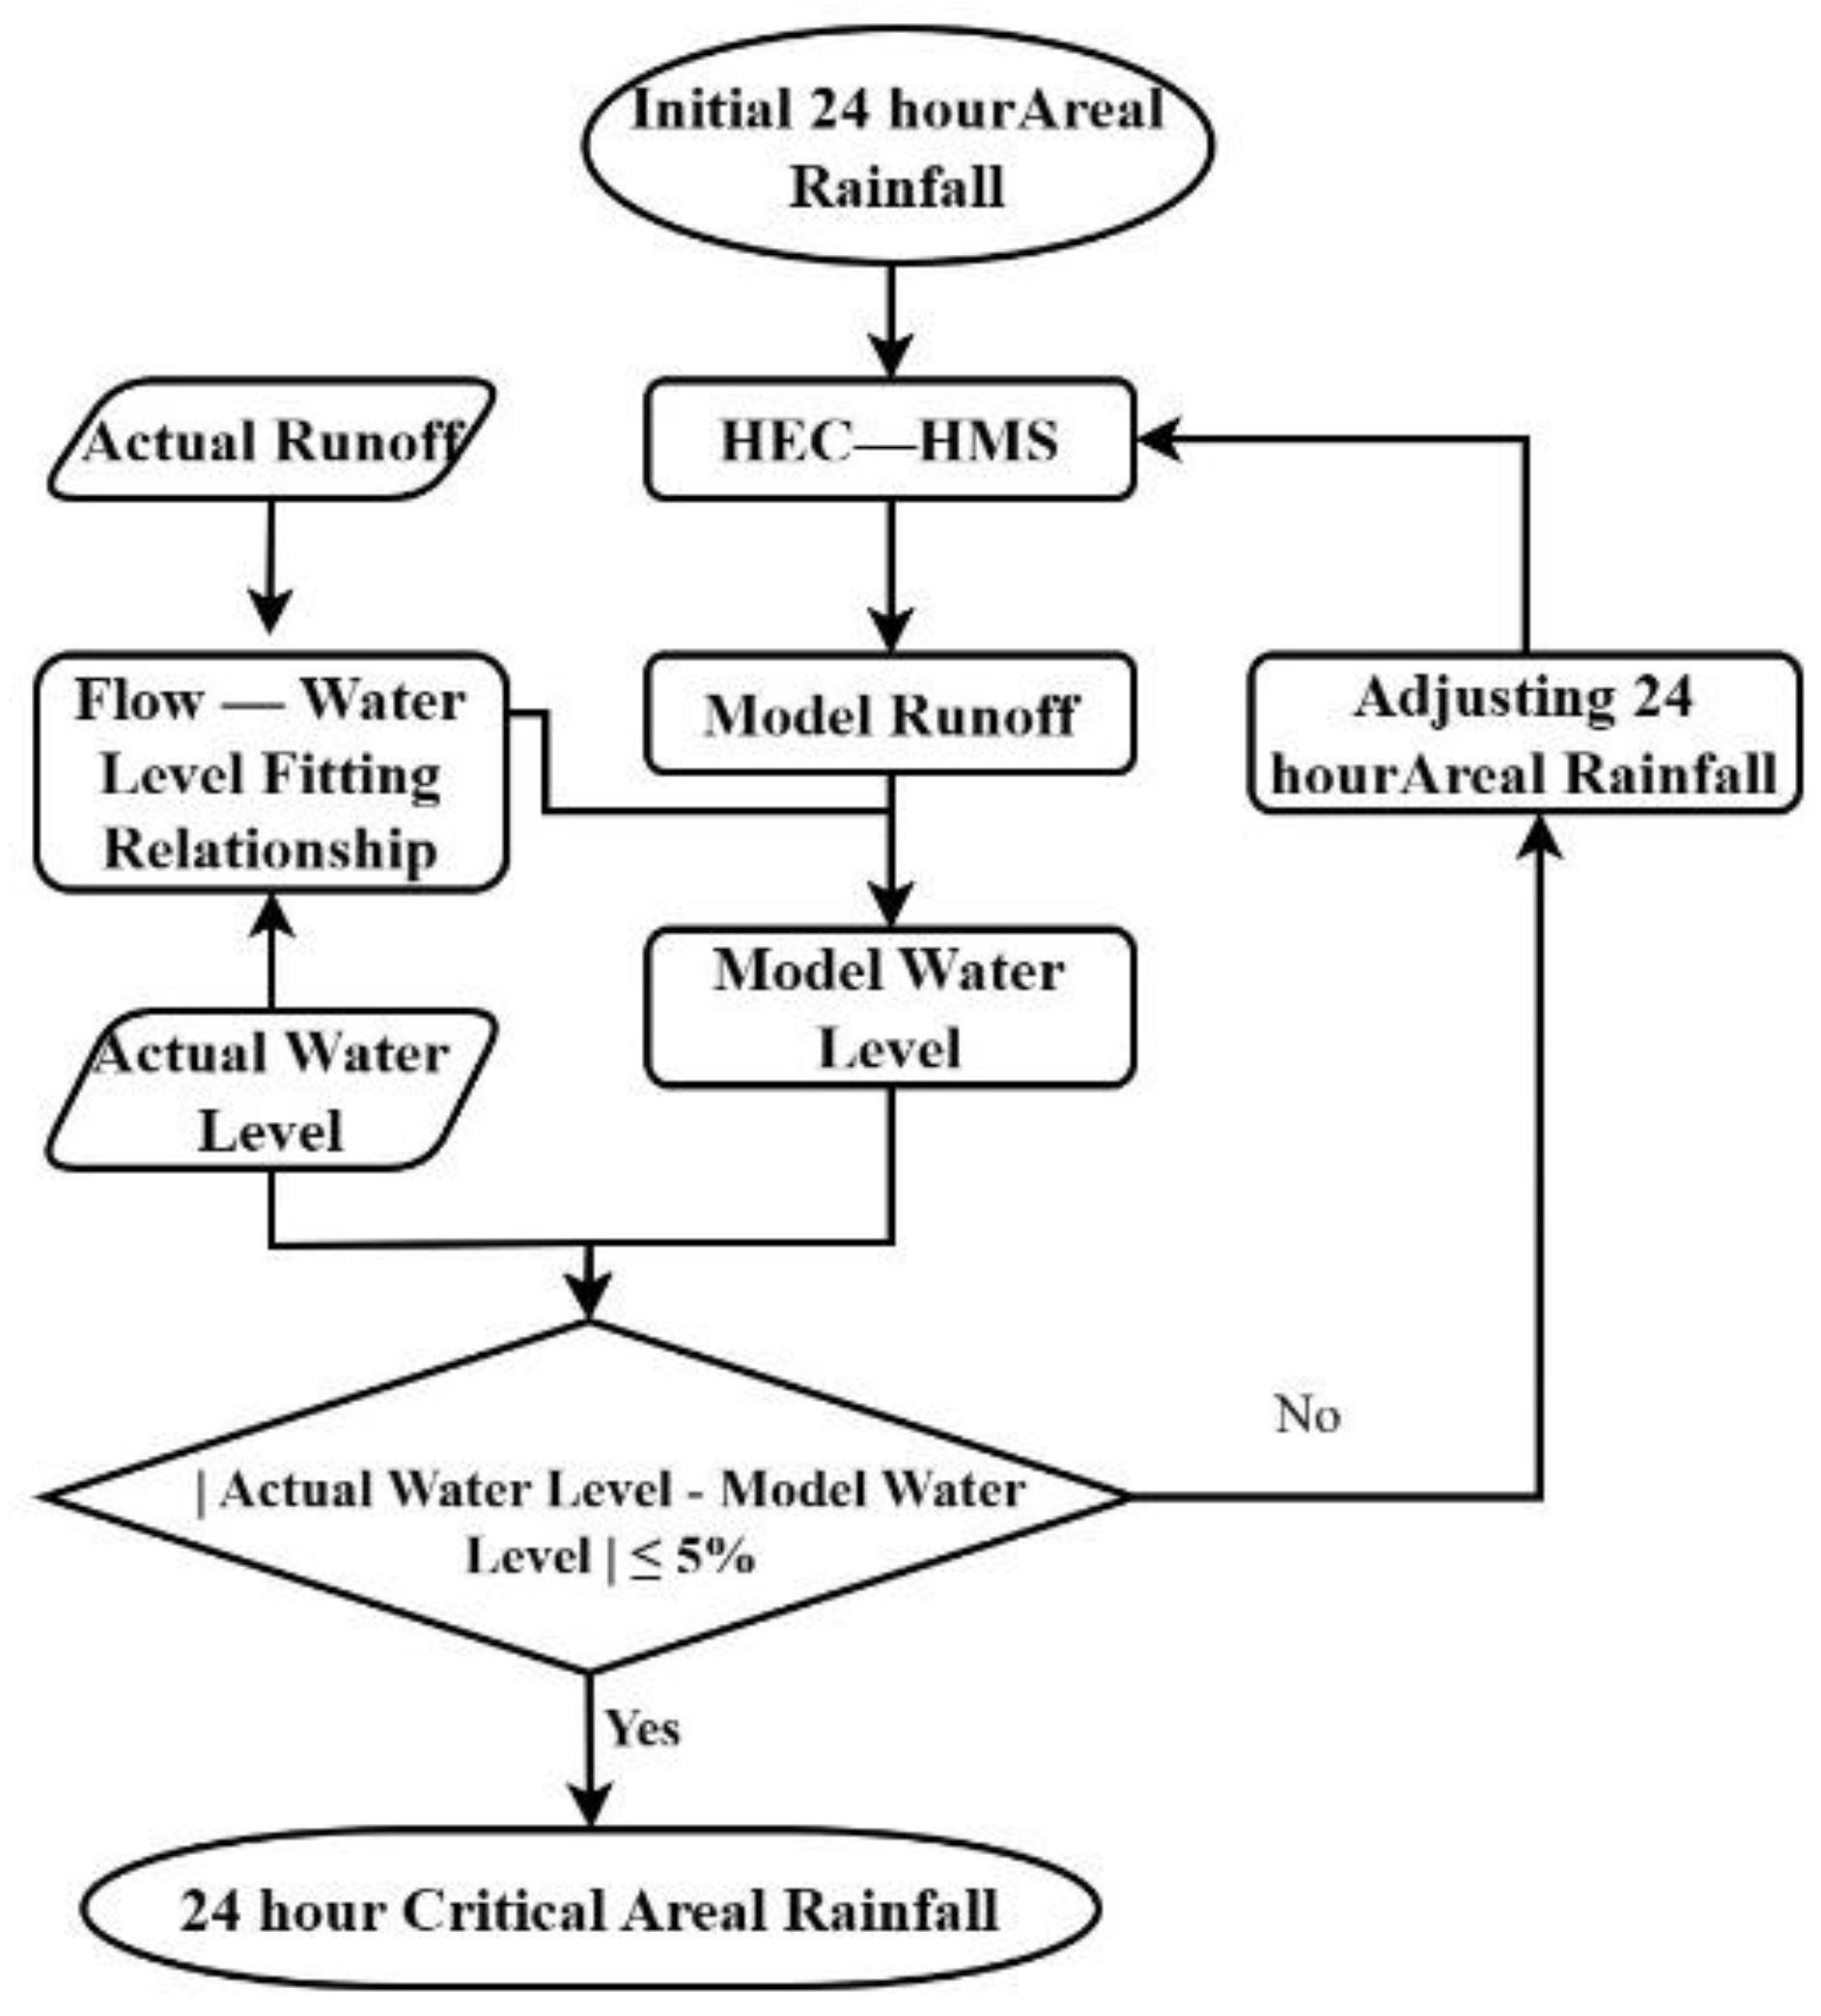
Due to the changes in hydrological characteristics, hydraulic facilities, and underlying surface conditions in the basin, the critical areal rainfall exhibits dynamic variations [46]. This study adopted the calibrated HEC-HMS model to simulate and establish the relationship between areal rainfall and flow. By combining measured data from Pingluo and Tanjiaba hydrological stations, the flow and water level fitting relationship was determined, with flow serving as the linkage to establish the quantitative response relationship among areal rainfall, flow, and water level. Based on critical water levels (warning water level and guaranteed water level), the model testing method was used to determine the areal rainfall corresponding to the critical water level, defined as the critical areal rainfalls (warning areal rainfall and guaranteed areal rainfall). Specifically, assumed values of areal rainfall with 24-hour intervals, were selected as input variables in the HEC-HMS model to conduct the flow simulation and obtain critical flow. If the simulated critical flow significantly differed from the critical flow derived through the water level-flow fitting formula, the areal rainfall value was adjusted until the error between the simulated and critical flows was less than 5%. The input areal rainfall value at this point was the 24-hour critical areal rainfall value. The calculation process is shown in Figure 2.

4. Results and Analysis

4.1. Parameter Calibration Results

The purpose of parameter calibration is to find a set of optimal parameters that maximize the alignment between simulated results and observed values, thereby meeting the requirements for prediction [47]. This study used the manual trial-and-error method [48] and PRMSE as the objective function for model parameter optimization. Using daily runoff observation data from Pingluo and Tanjiaba hydrological stations from May to October between 2020 and 2021, a total of 9 flood events occurred during this period, with the following event numbers: 20200711, 20200724, 20200812, 20200817, 20200823, 20210714, 20210812, 20210919, 20211004. Among these, the flood observation data for the events numbered 20200724, 20210714 and 20210812 were incomplete. Therefore, 4 flood events numbered 20200711, 20200812, 20200817, 20200823 were selected as calibration data, and 2 flood events numbered 20210919, 20211004 were selected as validation data (Table 1).
The violin charts were drawn for the sub-basin area, including impermeable area percentage, and calibrated parameter values in the XiHanShui River basin (Figure 3). The charts depict that 75% of the sub-basin areas were concentrated within 200 km². Within the 95% confidence interval, the impermeable area ratio standed at 5.9%, primarily between 4.9% and 5.5%, with a median of 5.1%. the stable infiltration rate distribution showed little difference, within 95% was 0.4 mm/h, concentrated between 0.06 mm/h and 0.10 mm/h, with a median of 0.08 mm/h; the maximum runoff concentration time was 26.6 hours, concentrated between 22.5 hours and 24.1 hours, with a median of 24.0 hours. Additionally, the impermeable area ratio, stable infiltration rate, and runoff concentration time all followed an unimodal distribution.
In the XiHanShui River Basin, it was observed that the influence of certain calibrated parameter values on simulation outcomes was minimal; even without adjustments to these parameters, the overall simulation and its accuracy remained substantially unaffected. Therefore, for the convenience of calculation and future operational use, these parameters were set to the same values (Table 2), with an initial loss value of 2.0 mm, direct runoff storage coefficient of 0.2 hours, base flow index decay constant of 0.03 hours, channel routing lag time of 0.32 hours, and channel storage coefficient of 0.72 hours.

4.2. Model Evaluation and Analysis

Assuming R E p and R E V within 20% of the observed value is acceptable, and T is within 3 hours, the smaller the absolute values of R E p , R E V , and T , the higher the model simulation accuracy. Then the NSE ranges from negative infinity to 1, with higher values indicating better simulation performance [49]. Table 3 indicates that in four flood events during the calibration period, both R E p and R E V were within 20%, T was within 1 hour, and NSE was above 0.73. The best simulation performance was the flood event numbered 20200711, the highest R E p was the flood event numbered 20200823 at 17.58%, the highest R E V was the flood event numbered 20200812 at 19.07%, and the lowest NSE was the flood event numbered 20200812 at 0.736. So the qualification rate was 100% during the calibration period. In two flood events during the validation period, R E p and R E V were within 20%, T was within 1 hour, and NSE was above 0.74. During the calibration and validation periods, the average R E p was 7.56%, the average R E V was 14.76%, the average T was -0.5 hours, and the NSE was 0.769, indicating that the HEC-HMS model constructed in this study has an ideal flood simulation performance.
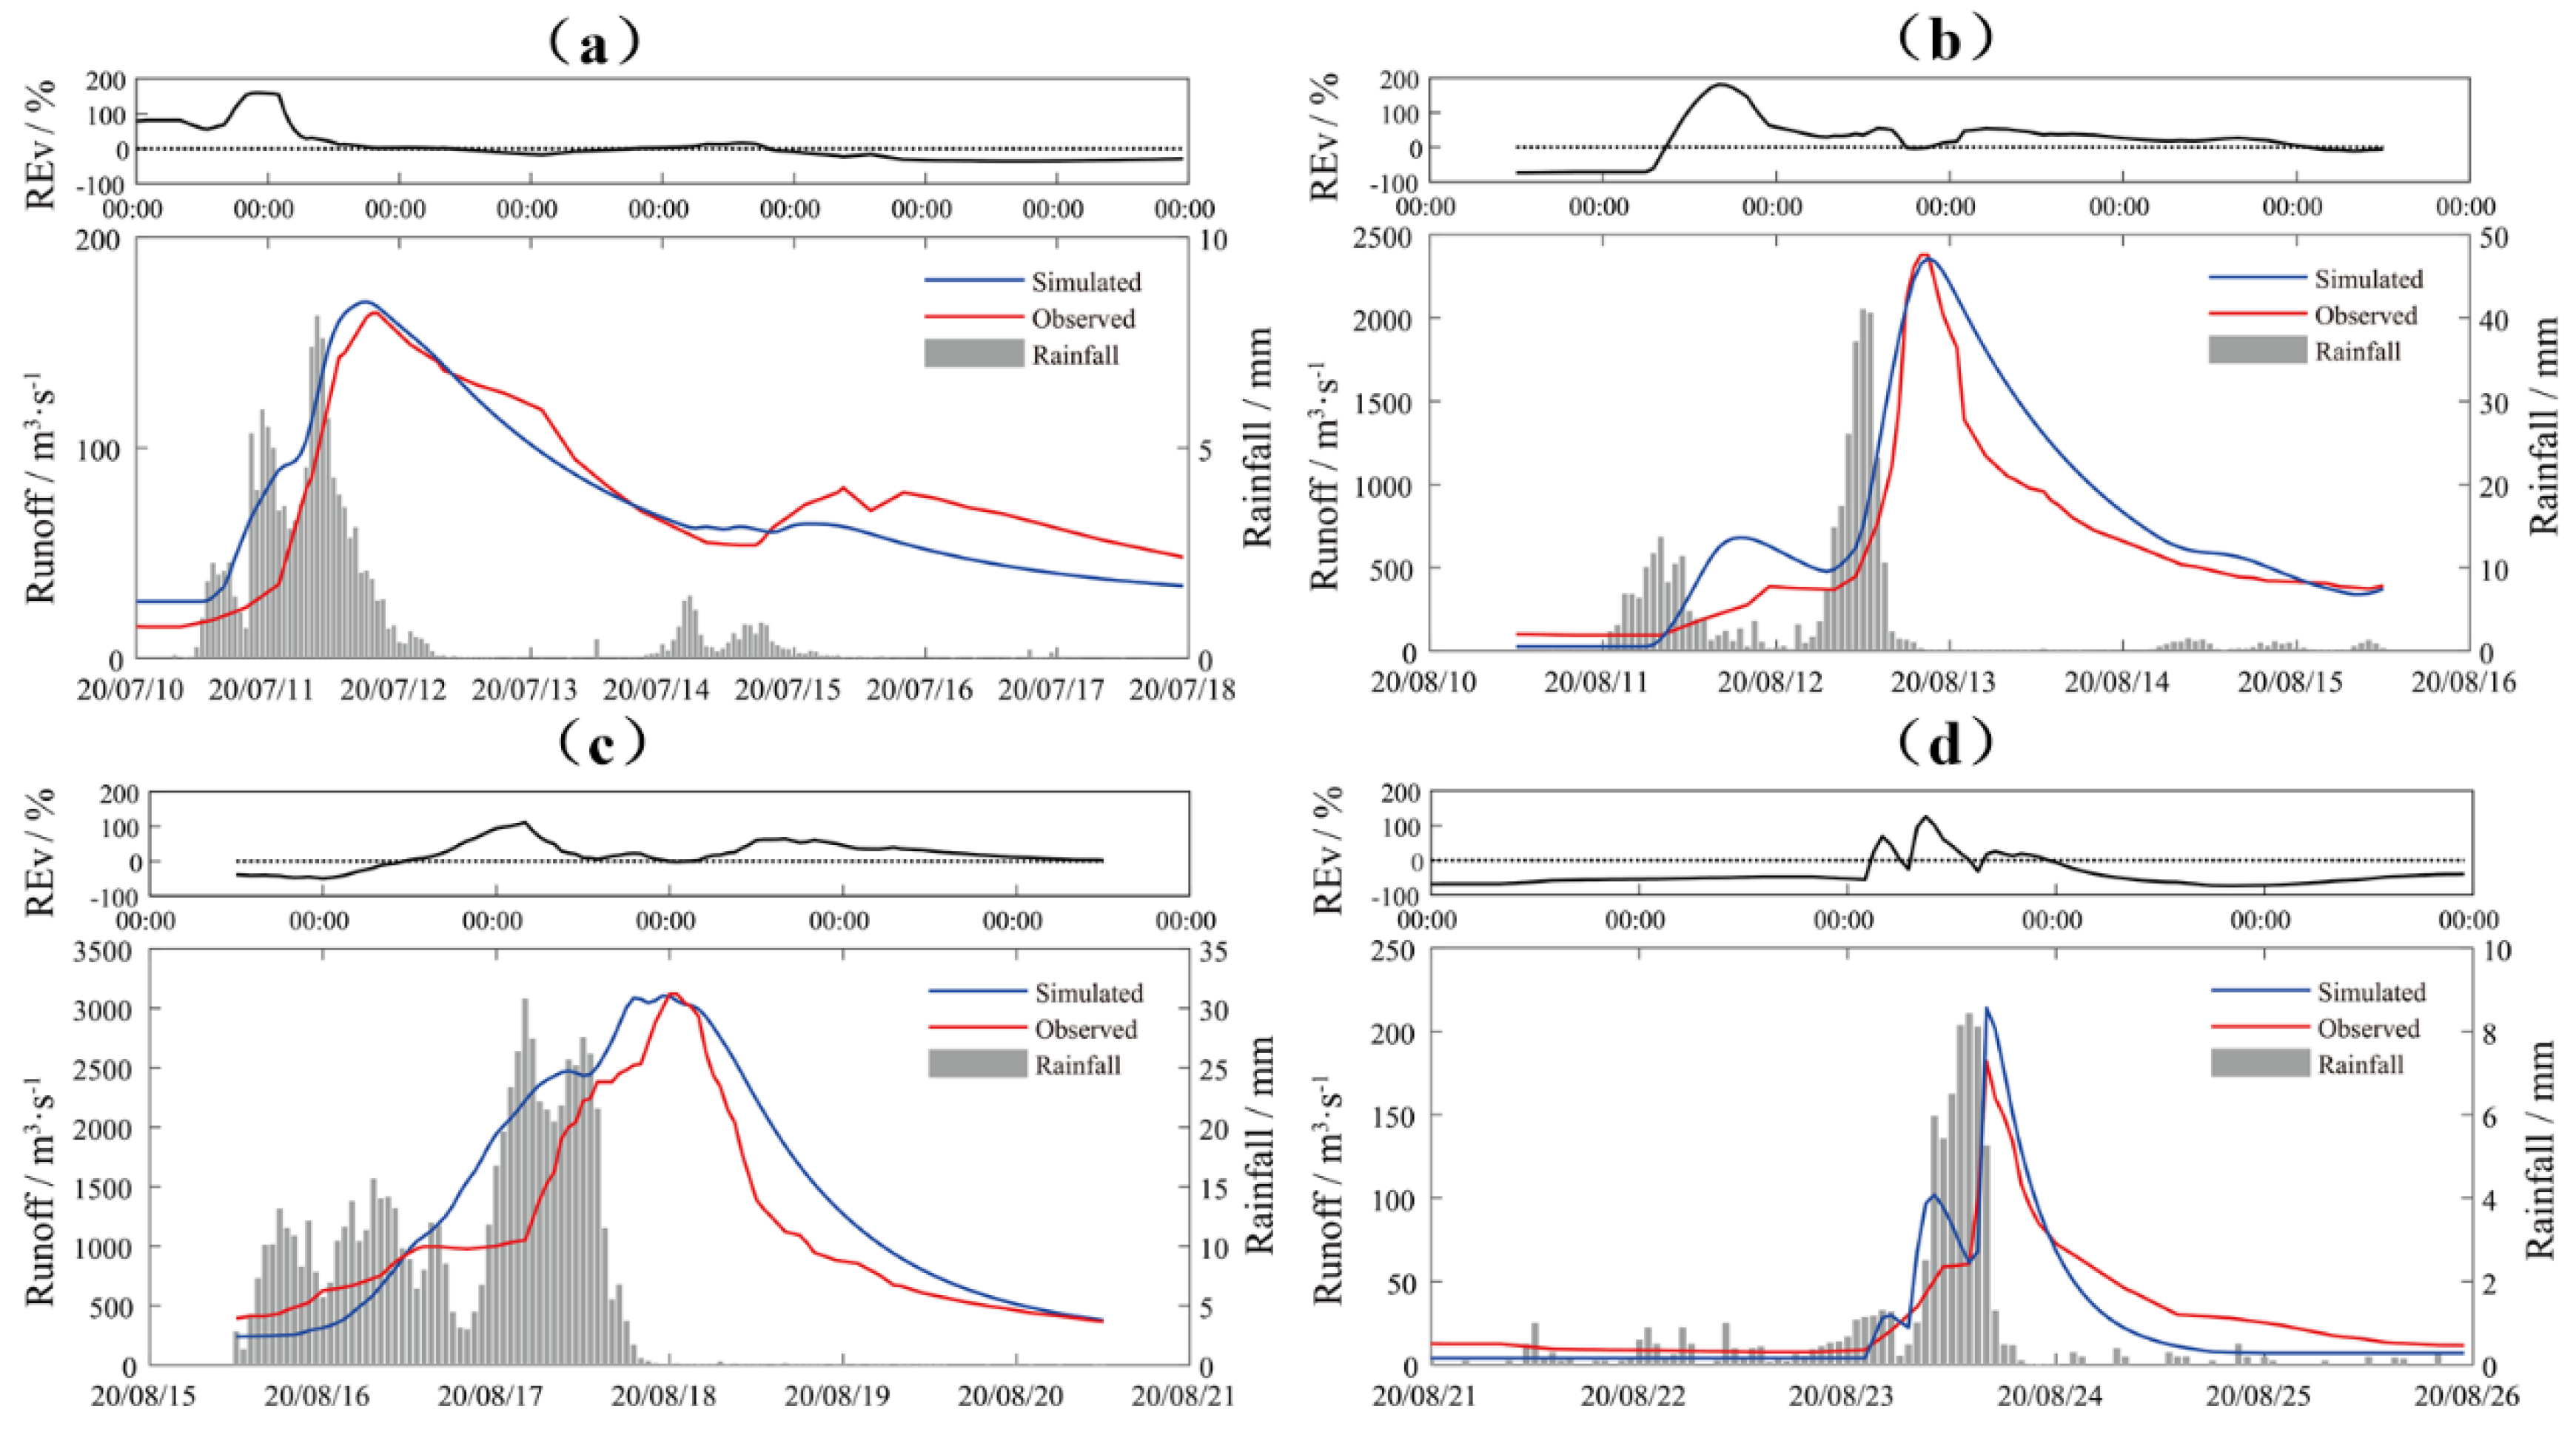
The comparison between observed and simulated flows proves that the model's simulated flood processes closely match the observed trends (Figure 4 and Figure 5). During the calibration period, the model skillfully captured the phenomenon of flood peaks occurring after rainfall cessation during four flood events, thereby effectively simulating the extreme flood peak flows and the timing of their occurrences. However, a larger positive R E V were observed in the time between the onset of rainfall and the flood peak. In two flood events during the validation period, although the model overestimated flood peak values, the overall R E V was better than the calibration period. In the flood event numbered 20210919, the temporal discrepancy between the rainfall and the flood peak was slightly greater compared to other events, which was possibly induced by different antecedent precipitation and soil moisture conditions.
The comprehensive analysis above indicates that, from the perspective of errors, the simulated flood peak flows generally aligned well with the observed values, but the simulated total flood volumes exceeded the observed amounts, and substantial deviations were observed between the process simulation results and the actual measurements in certain areas. Despite these discrepancies, the overall simulation results of the model are in good agreement with the observed flood processes with the requisite accuracy. Therefore, based on the simulation and validation results, the current model accuracy is acceptable and can meet the needs of practical applications.

5. Critical Areal Rainfall Calculation

5.1. Water level-Flow Relationship Fitting

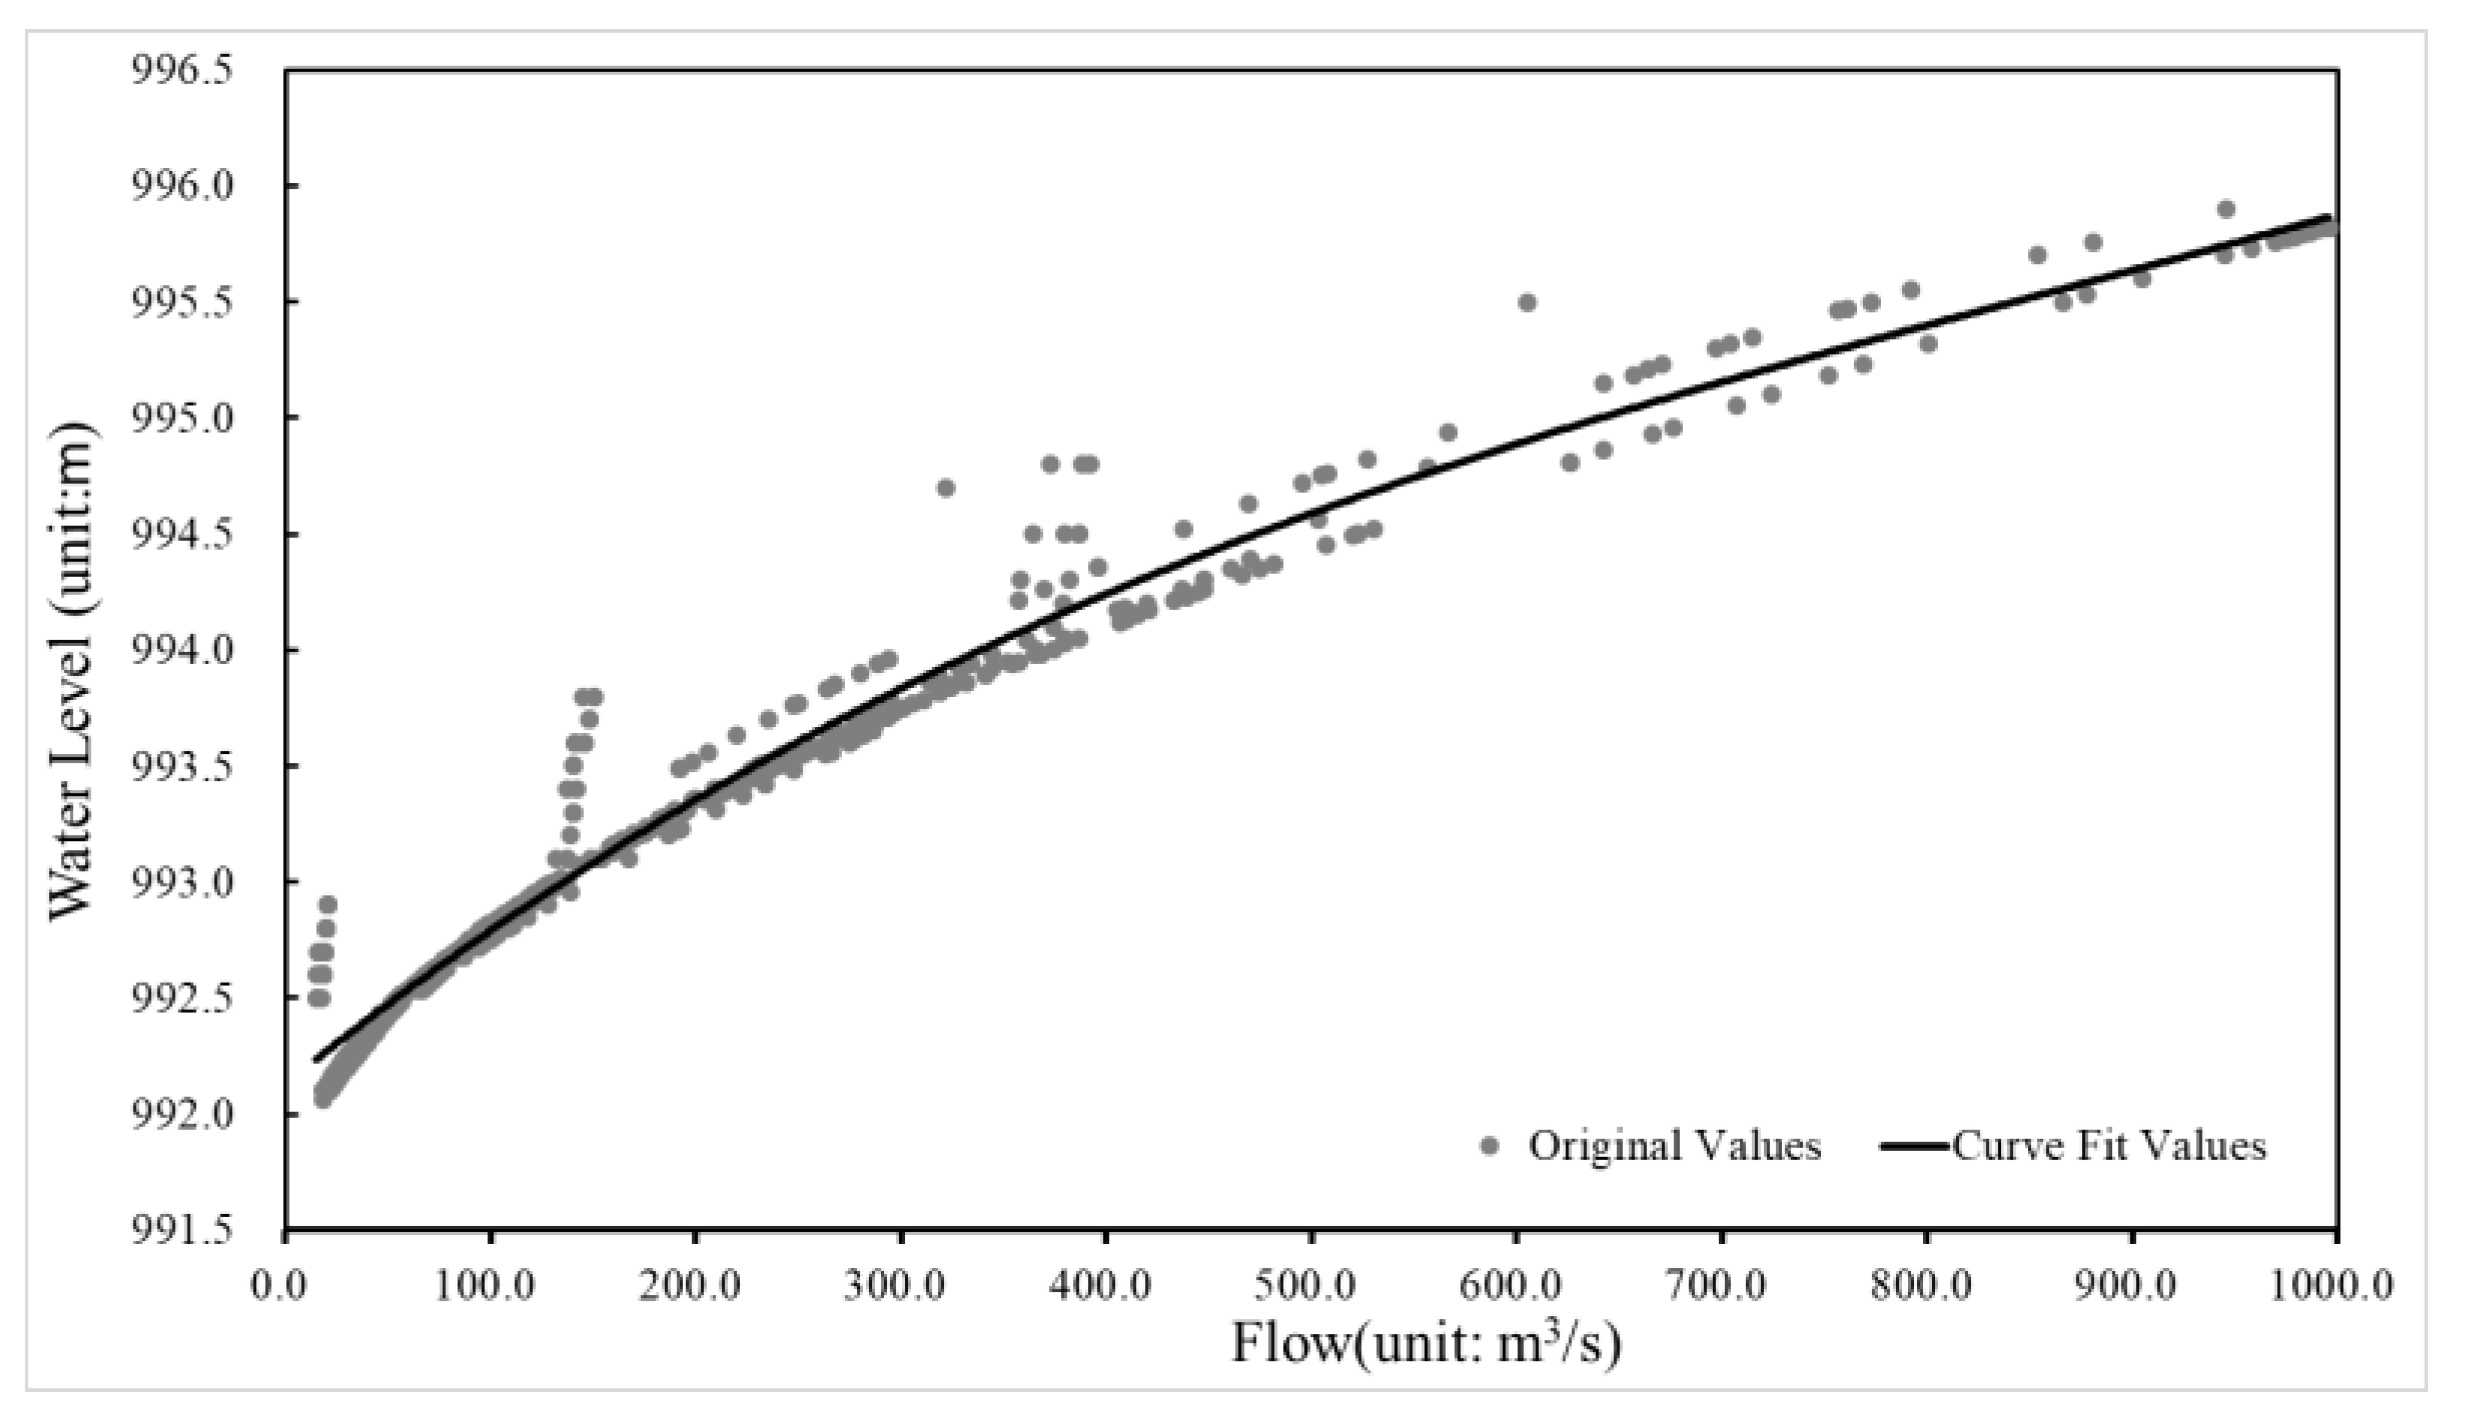
Based on the regression analysis conducted by the observed water level and flow data from the Pingluo and Tanjiaba hydrological stations, it has been found that an exponential model can more effectively encapsulate the relationship between water level and flow. Therefore, an exponential model was used to fit the water level and flow in the XiHanShui River Basin, establishing the water level-flow fitting formula:
y = 2 e 9 x 3 6 e 6 x 2 + 0.0071 x + 992.13
where x is the water level value and y is the flow value. The coefficient of determination (R²) is 0.9627, and the standard error of estimate stands at 0.03, representing a robust significance and fitting effect. Therefore, this fitting formula can be used for quantitative conversion between water level and flow effectively (Figure 6).

5.2. 24 Hour Critical Areal Rainfall

According to the critical areal rainfall calculation method, the 24-hour critical areal rainfall values for the Pingluo and Tanjiaba hydrological stations in the XiHanShui River Basin were determined (Table 4). This table indicates that the warning flow and guaranteed flow of Pingluo hydrological station were 128.2 m³ and 371.9 m³, with corresponding 24-hour warning areal rainfall and guaranteed areal rainfall of 108.1 mm and 230.8 mm. For Tanjiaba hydrological station, the warning flow and guaranteed flow were 1224.5 m³ and 2125.4 m³, with corresponding 24-hour warning areal rainfall and guaranteed areal rainfall of 128.5 mm and 184.6 mm. Based on the warning areal rainfall and guaranteed areal rainfall of Pingluo and Tanjiaba hydrological stations, reasonable early warnings can be provided for the flood events in the XiHanShui River Basin.

6. Conclusion and Discussion

6.1. Conclusion

This study focused on the Xihan River Basin as the research area, employing flood events data from May to October between 2020 and 2021 to calibrate and verify the parameters of the HEC-HMS model. The purpose of this approach is to evaluate the performance of the proposed model at the XiHanShui River Basin and to utilize the model in determining the critical areal rainfall for flood disasters within the basin.The following main conclusions were drawn:
The HEC-HMS model parameters for the XiHanShui River Basin were set as follows: initial loss of 2.0 mm, direct runoff storage coefficient of 0.2 hours, base flow index decay constant of 0.03 hours, channel routing lag time of 0.32 hours, and channel storage coefficient of 0.72 hours. The stable infiltration rate was concentrated between 0.06 mm/h and 0.10 mm/h, with a median of 0.08 mm/h. The runoff concentration time was concentrated between 22.5 hours and 24.1 hours, with a median of 24.0 hours. The impermeable area ratio was concentrated between 4.9% and 5.5%, with a median of 5.1%. Additionally, the impermeable area ratio, stable infiltration rate, and runoff concentration time all followed an unimodal distribution.
The HEC-HMS model was used to simulate the flood events. During the calibration period, REp and REV were within 20%, ∆T was within 1 hour, and NSE was above 0.73. During the validation period, REp and REV were within 20%, ∆T was within 1 hour, and NSE was above 0.74. The average REp was 7.56%, the average REV was 14.76%, the average ∆T was -0.5 hours, and the NSE was 0.769, indicating that the HEC-HMS model has an ideal flood simulation effect for the XiHanShui River Basin.
Using the calibrated HEC-HMS model, the critical areal rainfalls were determined through the model testing method. The 24-hour warning areal rainfall and guaranteed areal rainfall for Pingluo hydrological station were 108.1 mm and 230.8 mm, while for Tanjiaba hydrological station, they were 128.5 mm and 184.6 mm. Based on the warning areal rainfall and guaranteed areal rainfall for Pingluo and Tanjiaba hydrological stations, reasonable early warnings can be provided for the flood events in the XiHanShui River Basin.

6.2. Discussion

Results of this study confirmed the high reliability of the HEC-HMS model for flood simulation in the XiHanShui River Basin. The manual trial-and-error method and PRMSE as the objective function can effectively improve simulation accuracy, although some aspects need further optimization, especially in reducing the relative error of runoff volume. Therefore, future work on flood simulation based on the HEC-HMS model should focus on three aspects:
Optimize the collection and processing of data: Use hydrological data with shorter time steps to better reflect flow process lines. Employ more accurate precipitation measurement techniques, such as radar or satellite-derived precipitation data combined with surface station data, to reduce spatial and temporal errors.
Optimize the Structure and Parameter of Model: Refine the soil moisture model, including dynamic changes in soil moisture content, infiltration rate, and the impact of vegetation changes on soil moisture. Calibrate the model using historical flood event data and validate it with data from different scenarios to improve model accuracy and robustness.
Comprehensive Consideration of Error Sources: Consideration must be given to errors in data and model structure, as well as other potential sources, including measurement inaccuracies and parameter uncertainties.Then attempt to quantify the impact of these errors on model outputs.

Funding

Natural Science Foundation of Gansu (Grant 23JRRA1572), "Flying Clouds" youth top talent(Grant 2425rczx), Gansu Youth Science and Technology Foundation (Grant 23JRRA1332), Key project of meteorological research of Gansu Meteorological Bureau (Grant Zd20284-B-2), Drought meteoro-logical science research Foundation project (Grant IAM202308).

References

  1. Liu, Z.Y.; Yang, D.W.; Hu, J.W. Dynamic critical rainfall-based torrential flood early warning for medium-small rivers. Journal of Beijing Normal University ( Natural Science) 2010, 46, 317–321. (In Chinese) [Google Scholar]
  2. Li, H.X.; Wang, R.M.; Huang, Q.; Xiang, J.Y.; Qin, G.H. Advances on Flood Forecasting of Small-Medium Rivers [J]. Journal of China Hydrology 2020, 40, 16–23. (In Chinese) [Google Scholar]
  3. Schreider, S.Y.; Jakeman, A.J.; Letcher, R.A.; Nathan, R.J.; Beavis, S.G. Detecting changes in streamflow response to changes in non-climatic catchment conditions: farm dam development in the Murray-Darling basin. Australia [J]. Journal of Hydrology 2002, 262, 84–98. [Google Scholar] [CrossRef]
  4. Hu, C.H.; Wang, J.J.; Zhan, F.Z.; Ye, Y. Study on Relationship between Flood and Precipitation Concentration Degree in Time and Space in Medium- and Small-sized River Basins[J]. Journal of China Hydrology 2009, 29, 14–21. (In Chinese) [Google Scholar]
  5. Marchi, L.; Borga, M.; Preciso, E.; Gaume, E. Characterisation of selected extreme flash floods in Europe and implications for flood risk management[J]. Journal of Hydrology 2010, 394, 118–133. [Google Scholar] [CrossRef]
  6. Qian, Q. Hydrologic response in a humid steeo mountainous watershed in the west of China: A case study of Longxihe watershed in Sichuan[D]. Hangzhou:Zhejiang University. 2014. (In Chinese).
  7. Meresa, H. Modelling of river flow in ungauged catchment using remote sensing data: Application of the empirical (SCS-CN), artifcial neural network (ANN) and hydrological model (HEC-HMS). Model Earth Sys Environ 2019, 5, 257–273. [Google Scholar] [CrossRef]
  8. Freeze, R.A.; Harlan, R.L. Blueprint for a physically-based, digitally-simulated hydrologic response model[J]. Journal of Hydrology 1969, 9, 237–258. [Google Scholar] [CrossRef]
  9. McMichael, C.E.; Hope, A.S.; Loaiciga, H.A. Distributed hydrological modelling in California semi-arid shrublands: MIKE SHE model calibration and uncertainty estimation[J]. Journal of Hydrology 2006, 317, 307–324. [Google Scholar] [CrossRef]
  10. Arnold, J.G.; Moriasi, D.N.; Gassman, P.W. SWAT: MODEL USE, CALIBRATION, AND VALIDATION[J]. Transactions of the Asabe 2012, 55, 1345–1352. [Google Scholar] [CrossRef]
  11. Beven, K.J. Rainfall-runoff modeling: the primer [M]. John Wiley & Sons, 2011.
  12. Zhang, Y.Q.; Zhou, X.Y.; Li, H.X. Predicting surface runoff from catchmentto large region [J]. Advances in Meteorology 2015, 1–7. [Google Scholar]
  13. Xu, Z.X. Hydrological Models[M]. Beijing: Science Press, 2017. (In Chinese).
  14. Chen, Y.; Li, J.; Xu, H. Improving flood forecasting capability of physically based distributed hydrological models by parameter optimization. Hydrology and Earth System Sciences 2016, 20, 375–392. [Google Scholar] [CrossRef]
  15. Li, H.; Zhang, Y. Regionalising rainfall-runoff modelling for predicting daily runoff: Comparing gridded spatial proximity and gridded integrated similarity approaches against their lumped counterparts [J]. Journal of Hydrology 2017, 550, 279–293. [Google Scholar] [CrossRef]
  16. Chen, Y.; Ren, Q.; Huang, F.; Xu, H.; Cluckie, I. Liuxihe model and its modeling to river basin flood. Journal of Hydrologic Engineering 2011, 16, 33–50. [Google Scholar] [CrossRef]
  17. Kamali, B.; Mousavi, S.J. , Abbaspour K C. Automatic calibration of HEC-HMS using single-objective and multi-objective PSO algorithms[J]. Hydrological processes 2013, 27, 4028–4042. [Google Scholar]
  18. Yu, W. Nakakita, E. Kim, S.; Yamaguchi, K. Improving the accuracy of flood forecasting with transpositions of ensemble NWP rainfall fields considering orographic effects[J]. Journal of Hydrology 2016, 539, 345–357. [Google Scholar]
  19. Yang, H. Research on design flood of small watershed in semi-arid loess gully region based on HEC-HMS model[D]. Lanzhou: Lanzhou University, 2018. (In Chinese).
  20. Bournaski, E.; Iliev, R.; Kirilov, L. HEC-HMS modelling of rainstorm in a catchment. The mesta case study[J]. Comptes Rendus de L’Academie Bulgare des Sciences 2009, 62, 1141–1146. [Google Scholar]
  21. Olang, L.O.; Fürst, J. Effects of land cover change on flood peak discharges and runoff volumes: model estimates for the Nyando River Basin, Kenya. Hydrological Processes 2011, 25, 80–89. [Google Scholar] [CrossRef]
  22. Wang, N.N.; Tang, C.; Tang, H.X. Conflux Process of Debris flow in Shuida Gully Using HEC-HMS Model[J]. Mountain Research 2015, 03, 318–325. (In Chinese) [Google Scholar]
  23. Feng, S.W. Confluence process of debris flow in Shuidaogou based on HEC-HMS[D]. Nanning: Guangxi University, 2016. (In Chinese).
  24. Gumindoga, W.; Rwasoka, D.T.; Nhapi, I.; Dube, T. Ungauged runoff simulation in Upper Manyame Catchment, Zimbabwe: Application of the HEC-HMS model[J]. Physics and Chemistry of the Earth, Parts A/B/C 2017, 100, 371–382. [Google Scholar] [CrossRef]
  25. Wang, Q.; Xu, Y.; Wang, J.; Lin, Z.X.; Dai, X.Y.; Hu, Z.L. Assessing sub-daily rainstorm variability and its effects on flood processes in the Yangtze River Delta region[J]. Hydrological Sciences Journal/Journal des Sciences Hydrologiques, 2019. [CrossRef]
  26. Zema, D.A.; Labate, A. Martino D, et al. Comparing different infiltration methods of the HEC-HMS model: the case study of the Mésima Torrent (Southern Italy)[J]. Land Degradation Development 2017, 28, 294–308. [Google Scholar]
  27. Sharafati, A.; Khazaei, M.R.; Nashwan, M.S.; Al-Ansari, N.; Yaseen, Z.M.; Shahid, S. Assessing the uncertainty associated with flood features due to variability of rainfall and hydrological parameters[J]. Advances in Civil Engineering 2020, 1–9. [Google Scholar] [CrossRef]
  28. Wijayarathne, D.B.; Coulibaly, P. Identification of hydrological models for operational flood forecasting in St. John's, Newfoundland, Canada[J].Elsevier 2020. [CrossRef]
  29. Yuan, W.L.; Fu, L.; Gao, Q.Y. Research on Rainfall Threshold of Flash Flood Based on HEC-HMS Model [J]. Yellow River 2019, 41, 22–27+31. (in Chinese). [Google Scholar]
  30. Zhang, J.J.; Na, L.; Zhang, B. Applicability of the distributed hydrological model of HEC-HMS in a small watershed of the Loess Plateau area[J]. Journal of Beijing ForestryUniversity 2009, 31, 52–57. (in Chinese). [Google Scholar]
  31. Cheng, X.; Ma, X.; Wang, W.; Xiao, Y.; Liu, X. Application of HEC-HMS Parameter Regionalization in Small Watershed of Hilly Area[J]. Water Resources Management 2021, 35, 1961–1976. [Google Scholar] [CrossRef]
  32. Ren, J.H.; Zheng, X.Q.; Chen, P.; Zhao, X.H.; Chen, Y.P.; Shen, Y. An Investigation into Sub-Basin Rainfall Losses in Different Underlying Surface Conditions Using HEC-HMS: A Case Study of a Loess Hilly Region in Gedong Basin in the Western Shanxi Province of China[J]. Water 2017. [CrossRef]
  33. Zhang, S.; Wang, J.; Xu, Z. The Application of HEC-HMS in Mountain Torrents Simulation of Northern Small Watershed[J]. IOP Conference Series Earth and Environmental Science 2019, 252, 052060. [Google Scholar] [CrossRef]
  34. Zhang, B.; Zhang, S.Y. Simulation of watershed flood critical rainfall value using HEC-HMS Hydrological Model[J]. China Flood & Drought Management, 2021, 31, 49–55. (in Chinese). [Google Scholar]
  35. Ma, T.H.; Ding, R.; Huang, E.; Luo, M.; Zheng, H.W. Research on flood warning of Tongkou River basin based on HEC-HMS model[J]. Water Resources and Hydropower Engineering 2021, 52, 80–89. (in Chinese). [Google Scholar]
  36. Pu, J.Y.; Miao, J.Q.; Yao, X.Y.; Deng, Z.Y.; Liu, W.M. A Study on Characteristics of Distribution of Rainstorm andFlood Disastersin Gansu Province[J]. Journal of Catastrophology 2006, 21, 27–31. (in Chinese). [Google Scholar]
  37. Cheng, Y.; Huang, W.B.; Sha, H.E. Cause of two heavy rainfall causing massive mudslidein Minxian County, Gansu Province[J]. Arid Land Geography 2018, 41, 443–448. (in Chinese). [Google Scholar]
  38. Zhang, J.X.; Huang, W.B.; Li, A.T.; Yang, X.M.; Li, Q.; Bian, H.W. Fine meteorological risk early warning forecast of main geological disasters in Gansu Province[J]. Arid Land Geography 2023, 46, 1443–1452. (in Chinese). [Google Scholar]
  39. Shen, X.D. Variation characteristics and influencing factors of water runoff in the Western Han Dynasty from 1960 to 2020[D]. Lanzhou University, 2022. (in Chinese). [CrossRef]
  40. Miao, W.X.; Lv, Y.B. Investigation and analysis of “20200812” rainstorm flood in Pingluo River Basin [J]. Water Resources and Hydropower Quick Report 2021, 42, 8–11+20. (in Chinese). [Google Scholar] [CrossRef]
  41. Wang, R.C. Analysis of Runoff Evolution Characteristics and Response to Climate Change in the Upper Reaches of the XiHan River[J]. Gansu Water Resources and Hydropower Technology 2022, 58, 7–10+24. (in Chinese). [Google Scholar] [CrossRef]
  42. Yuan, W.; Liu, M.; Wan, F. Calculation of critical rainfall for small-watershed flash floods based on the HEC-HMS hydrological model[J]. Water Resources Management 2019, 33, 2555–2575. [Google Scholar] [CrossRef]
  43. Joo, J.; Kjeldsen, T.; Kim, H.J.; Lee, H. A comparison of two event-based flood models (ReFH-rainfall runoff model and HEC-HMS) at two Korean catchments, Bukil and Jeungpyeong[J]. KSCE Journal of Civil Engineering, 2014. [CrossRef]
  44. Deng, X.; Dong, X.H.; Bo, H.J. Research on Influence of Objective Function on HEC-HMS Model Parameter Calibration[J]. Water Resources and Power 2010, 28, 17–19. (in Chinese). [Google Scholar]
  45. Ministry of Water Resources of the People's Republic of china. GB/T 22482-2008. (https://std.samr.gov.cn/gb/search/gbDetailed?id=71F772D761A6D3A7E05397BE0A0AB82A). 0539.
  46. Zhang, G.C. Rainstorm Flood Forecast and Risk Assessment[M]. Beijing: China Meteorological Press, 2012: 19-33. (in Chinese).
  47. Li, X.X. Application of HEC-HMS hydrological modeling system principle and method[M]. Beijing: China Water Conservancy and Hydropower Press, 2015. (in Chinese).
  48. Yu, Z.B. Principles and Applications of Distributed Hydrological Science in Watersheds [M]. Beijing: Science Press, 2008. (in Chinese).
  49. Liang, R. Application of HEC-HMS in the Beizhangdian Watershed[D]. Taiyuan: Taiyuan University of Technology, 2012. (in Chinese).
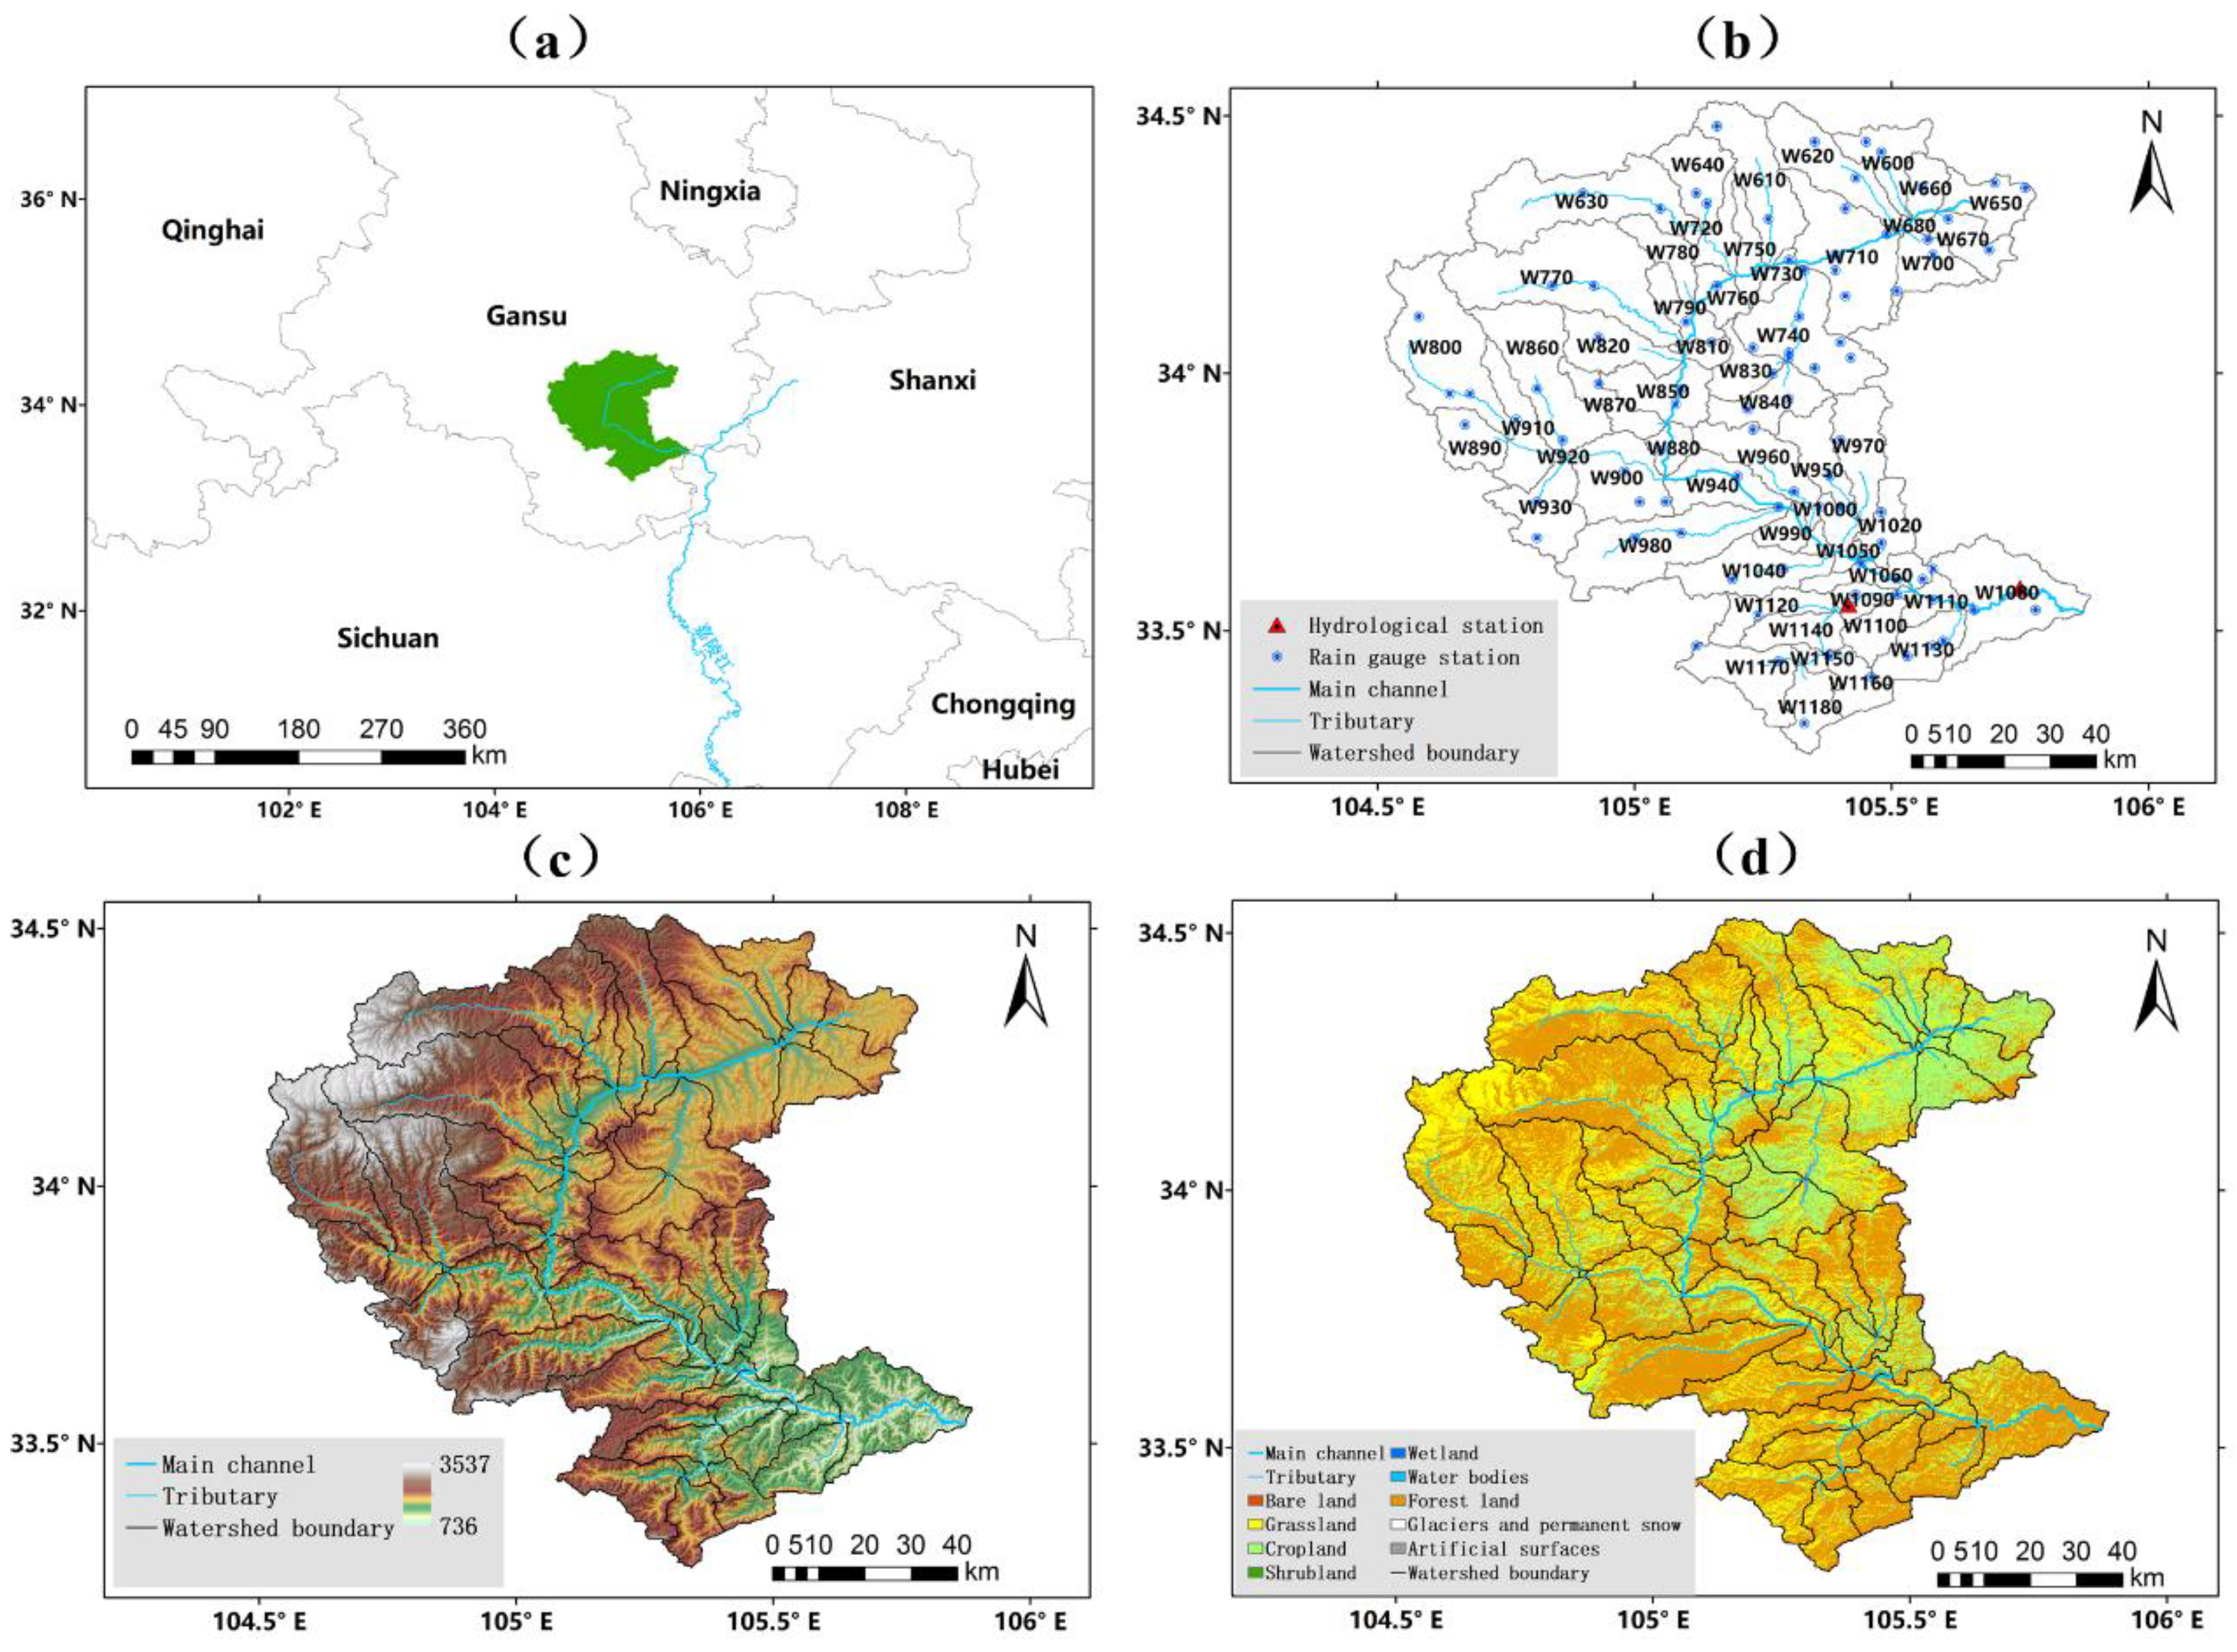
Figure 1. Distribution map of drainage system,hydrologic stations and rainfall stations (a), elevation map (b) and slope map (c) in the Xihanshui River Basin.
Preprints 114143 g001
Figure 2. Calculation Process of Critical Areal Rainfall in the Xihanshui River Basin.
Preprints 114143 g002
Figure 3. Violin Plot of Sub-basin Area, Impermeable Area Percentage, and Calibrated Parameters. (a. Sub-basin area/km²; b. Percentage of impermeable area/%; c. Stable infiltration rate/mm‧h-1; d. Direct runoff concentration time/h).
Preprints 114143 g003
Figure 4. Flood Process During Calibration Period (a. 20200711; b. 20200812; c. 20200817; d. 20200823).
Preprints 114143 g004
Figure 5. Flood Process During Validation Period (a. 20210919; b. 20211004).
Preprints 114143 g005
Figure 6. Flow—Water Level Fitting Relationship Results.
Preprints 114143 g006
Table 1. Flood events information.
Simulation Period Flood Event Number Start-End Time
(YYYYMMDDHHMM)
Basin Average Areal Rainfall (mm) Peak Flow
(m³‧s-1)
Calibration Period 20200711 202007100000―202007172300 3.4 164.0
20200812 202008101200―202008151200 11.2 2380.0
20200817 202008151200―202008201200 15.1 3120.0
20200823 202008210000―202008252300 3.7 182.0
Validation Period 20210919 202109151000―202109290600 5.7 224.2
20211004 202110031500―202110092300 4.1 501.7
Table 2. Values of the Same Parameters in Sub-basin After Parameter Calibration.
Initial   Loss I a /(mm) Direct Runoff Storage Coefficient
K/(h)
Base Flow Index Decay Constant
k/(h)
Channel Routing Lag Time
τ/(h)
Channel Storage Coefficient
R/(h)
2.0 0.2 0.03 0.32 0.72
Table 3. Model Evaluation Results.
Period Flood Event Number R E V /(%) T /(h) N S E
q o /(m³‧s-1 q s /(m³‧s-1 R E p /(%)
Calibration Period 20200711 164.0 169.3 3.23 3.75 -1 0.775
20200812 2380.0 2358.1 -0.92 19.07 1 0.736
20200817 3120.0 3104.8 -0.49 18.72 -1 0.758
20200823 182.0 214.0 17.58 18.10 0 0.771
Validation Period 20210919 224.2 262.7 17.17 15.77 -1 0.826
20211004 501.7 545.9 8.81 13.16 -1 0.748
Average 7.56 14.76 -0.5 0.769
Table 4. Critical Areal Rainfall in XiHanShui River Basin.
Station Name Station ID Warning Stage (m) Guaranteed Stage (m) Warning Flow (m³) Guaranteed Flow (m³) Warning Areal Rainfall (mm) Guaranteed Areal Rainfall (mm)
Pingluo 60705400 1095.1 1097.3 128.2 371.9 108.1 230.8
Tanjiaba 60704800 996.23 997.8 1224.5 2125.4 128.5 184.6
Disclaimer/Publisher’s Note: The statements, opinions and data contained in all publications are solely those of the individual author(s) and contributor(s) and not of MDPI and/or the editor(s). MDPI and/or the editor(s) disclaim responsibility for any injury to people or property resulting from any ideas, methods, instructions or products referred to in the content.
Copyright: This open access article is published under a Creative Commons CC BY 4.0 license, which permit the free download, distribution, and reuse, provided that the author and preprint are cited in any reuse.
Prerpints.org logo

Preprints.org is a free preprint server supported by MDPI in Basel, Switzerland.

Subscribe

© 2024 MDPI (Basel, Switzerland) unless otherwise stated